1. Introduction
An energy mutual fund is a type of mutual fund that invests in companies in the energy sector. This sector includes companies that produce, refine, and distribute energy products like oil, natural gas, and coal. Energy mutual funds can be a good way to invest in the energy sector but are also risky. The price of energy can be volatile, and energy companies are often cyclical, meaning that their profits go up and down with the economy. As a result, energy mutual funds can undergo large swings in value.
The robust performance of the energy sector in 2021, surpassing all other fund sectors with USD 11.4 billion in net asset flows, indicates a prosperous year for energy investors. Global economic reopening post-COVID-19 vaccinations drove heightened energy demand, aiding the recovery of energy stocks.
1 The movement of energy prices often influences the performance of energy stocks, with rising prices typically benefiting the sector and falling prices sometimes diminishing investor interest. However, recent trends have shown substantial volatility within this sector. For instance, during 2021 and 2022, oil prices surged, reaching over USD 120 per barrel in 2022, which appeared to drive the sector’s growth. Yet, in 2023, oil prices remained stagnant or decreased, mirrored by a corresponding plateau, or decline in energy stock performance.
2Considering the pivotal role of energy in economic growth and the projected energy price trends, analyzing energy mutual funds’ performance becomes imperative. These funds offer investors a straightforward means of diversification by indirectly participating in the energy market. With assets under management soaring from USD 5 billion in January 2000 to USD 49 billion in August 2022, understanding these funds’ performance is increasingly crucial for investors seeking opportunities and diversification strategies.
This study focuses on assessing the risk-adjusted performance of energy equity mutual funds from January 2000 to July 2023. The study significantly contributes to the assessment of energy equity mutual funds’ performance over an extensive timeframe, addressing gaps prevalent in prior research. Its primary objective involves evaluating the potential for these funds to provide superior risk-adjusted returns, particularly in light of recent volatility in energy prices. While some studies have explored the performance of mutual funds investing in energy companies, there has been limited research into these funds’ overall long-run performance. Given the recent surge and subsequent decline in energy prices and the resulting volatility, we aim to determine whether investing in energy funds can yield superior risk-adjusted returns.
Furthermore, our study covers a substantial 23-year period, encompassing significant economic events such as the 2008 financial crisis and the COVID-19 pandemic. This extended timeline allows us to analyze performance consistency, including these significant periods and trends over time.
Additionally, drawing inspiration from
Elyasiani et al. (
2022) and acknowledging the pivotal role of fund manager expertise, the study assesses market timing and the security selection skills of fund managers. Understanding managerial influence provides critical insights for potential investors; we acknowledge the impact of fund manager expertise on risk-adjusted performance. For instance, as shown by
Chen et al. (
2000), certain fund types excel in stock selection. Thus, when considering investments in energy sector mutual funds, it is essential to evaluate not just the fund’s holdings and historical performance but also the manager’s ability to make informed investment decisions, including market timing and return prediction. Consequently, we employ performance assessment models to evaluate market timing and security selection skills.
Moreover, this study investigates the performance of energy sector mutual funds across a span that includes tumultuous economic phases, notably the COVID-19 pandemic. The COVID-19 pandemic caused global economic disruptions, leading to widespread lockdowns and a steep decline in economic activity. This resulted in a sharp decrease in energy demand and prices, serving as a stress test for energy equity mutual funds. Studying their performance during this phase reveals their resilience and adaptability in turbulent markets.
Examining their performance during the lockdown period sheds light on their ability to navigate extreme circumstances and manage reduced energy demand and falling prices. It highlights their risk mitigation strategies and portfolio robustness.
As economies began vaccination drives and reopened gradually, there was a resurgence in energy demand and prices, contrasting the previous downturn. Analyzing the funds’ performance during this post-vaccination period is crucial to understand how they capitalized on the rebound. It provides insights into their ability to seize emerging market trends and investment opportunities during economic recoveries. This examination of both downturn and recovery periods helps gauge fund managers’ strategic agility, adaptability to changing market conditions, and ability to optimize returns across varied economic phases. In essence, studying energy equity mutual funds’ performance during COVID-19-induced disruptions and subsequent recovery offers a comprehensive view of their adaptability and potential in dynamic markets, aiding investors’ decision-making.
The study is structured along the following lines:
Section 2 summarizes various studies on energy mutual fund performance and the motivation for the current work.
Section 3 provides insights into the data used.
Section 4 explains various performance evaluation models.
Section 5 presents empirical findings, while
Section 6 concludes the study.
2. Literature Review
Several studies examined energy sector funds alongside broader sector mutual funds.
Khorana and Nelling (
1997) analyzed seven sectors, including finance, during 1987–1992, finding mixed results. While sector funds showed positive risk-adjusted performance against their benchmarks, they did not outperform the overall market, similar to financial sector funds.
Dellva et al. (
2001) studied 35 fidelity sector funds from 1989 to 1998, focusing on stock selection and market timing. Unlike Khorana and Nelling, they found sector funds exhibited stock selection ability against sector-specific benchmarks but not against the S&P 500. Additionally, they reported no significant market timing ability among sector funds. In broader fund performance evaluation,
Carhart (
1997) concluded that mutual fund managers lack skill or informational advantage, with factors like size and momentum explaining returns.
Fama and French (
2015) proposed a five-factor model including market, size, value, profitability, and investment factors.
Treynor and Mazuy (
1966) and
Henriksson and Merton (
1981) measured manager skill in market timing, while
Berk and van Binsbergen (
2015,
2016) argued that skilled managers face challenges in efficient markets, with any skill potentially negated by fees, emphasizing value creation as a more relevant metric in such markets.
Some studies have examined the performance of mutual funds and exchange-traded funds that invest in the energy sector.
Gormus et al. (
2023) conducted a study to assess the volatility and price transmission relationships between the oil market and energy funds. The study found a robust price transmission from energy funds to oil prices and a bidirectional information flow in terms of volatility transmission between the oil market and the funds. The analysis revealed that fund flows, reflective of investor sentiment, interacted with oil in terms of price and volatility varyingly. Additionally, when examining the influence of fund characteristics on price and volatility transmissions, the results indicated discernible differences depending on the direction of the transmission.
Malhotra and Marino (
2023) explored the performance of Energy Exchange-Traded Funds (EETFs) and found that EETFs displayed better absolute performance compared to U.S. equities and global markets. When considering risk-adjusted performance, EETFs slightly outperformed the Standard & Poor’s 500 (S&P 500) Energy Index, as well as U.S. and global equities.
Gormus et al. (
2018) present results that reaffirm the influence of ESG (Environmental, Social, and Governance) characteristics on investor sentiment. Their findings provide additional insights into the nuanced impact of various ESG dimensions. Notably, the social risk score and governance risk score exert distinct influences on investor flows in energy funds compared to the influence of fossil fuel involvement. This divergence underscores the potential of fund ESG metrics, particularly in relation to fossil fuel involvement, to establish connections between financial markets and energy commodity markets, thereby contributing to the financialization of energy markets.
Ibikunle and Steffen (
2017) conducted a comparative analysis of European green, black (fossil energy and natural resource) financial performance, and conventional mutual funds. The study revealed that green mutual funds exhibited a significant underperformance relative to conventional funds. Interestingly, no significant risk-adjusted performance differences were found between green and black mutual funds during the same period.
Saleem and Al-Hares (
2018) assessed the market efficiency of Energy Exchange-Traded Funds (ETFs), examining both renewable and nonrenewable energy ETFs. Employing a GARCH modeling approach to analyze the long-range dependence in ETFs’ volatility, they forecasted a FIGARCH model using daily returns, revealing signs of long-memory dependence within the ETFs. This suggests a weak-form inefficiency. The study also identified an opportunity for investor diversification in both renewable and nonrenewable energy ETFs due to their predictable volatility structure.
Lantushenko et al. (
2022) investigated the performance of Alternative Energy ETFs (A-ETFs) and Traditional Energy ETFs (T-ETFs). Their findings indicated that the increasing risk of climate change contributes to heightened investment flows into A-ETFs. Moreover, A-ETFs exhibited substantially stronger net cash flows than T-ETFs. The study concluded that there is an 8–12% higher increase in net flows per year in A-ETFs compared to T-ETFs with a one-standard-deviation increase in fund return.
Henriques et al. (
2022) evaluated the performance of ETFs in the energy sector using a two-step approach to construct portfolio models. In the first step, they employed a data envelopment analysis (DEA) to select assets with strong financial performance. In the second step, they built interval multi-objective portfolio models using diversified ETFs operating in the U.S. energy sector, aiming to obtain efficient portfolios based on investor preferences. The study concluded that, according to DEA models, ETFs related to nuclear energy were often efficient in portfolios, with natural gas and oil-based ETFs being most frequently found in the efficient portfolios. Notably, the efficient portfolios did not include any ETFs related to renewable energy.
This study is motivated by previous research and holds significance for several reasons. Firstly, the energy sector outperformed other sectors in 2021, attracting significant net asset flows of USD 11.4 billion, as reported by Morningstar Inc. Over the last two years, the S&P 500 Energy Index demonstrated remarkable increases, gaining 65.72% in 2022 and 54.64% in 2021. Given the persistent high demand for energy and predictions of sustained high prices, it becomes crucial to examine the performance of mutual funds in the energy sector.
Secondly, energy funds provide investors with a straightforward means of diversifying their portfolios, allowing them to indirectly participate in the energy market. Therefore, understanding the performance of these funds is essential. We specifically evaluate risk-adjusted performance under diverse market conditions, shedding light on their role in portfolio diversification and risk mitigation.
Additionally, our study explores whether superior risk-adjusted performance can be attributed to a fund manager’s investment strategy, with a focus on their market-timing abilities and return forecasting.
3. Data
To evaluate the performance of energy equity mutual funds, we collected the monthly returns for energy equity mutual funds from January 2000 to July 2023. Data are sourced from Morningstar Direct. We benchmark the performance of energy equity mutual funds against U.S. equities as proxied by the Russell 3000 index and global equities as proxied by the FTSE All World Ex U.S. index. We also benchmarked the energy mutual funds against the energy sector benchmark, the S&P 500 Energy Index. Using various indices as benchmarks for evaluating the risk-adjusted performance of energy equity mutual funds provides a comprehensive view of their performance relative to different market segments. The Russell 3000 index represents a broad market segment of the largest 3000 publicly traded U.S. companies. It serves as a benchmark for overall market performance in the U.S. by encompassing a wide range of industries and sectors. Comparing energy equity mutual funds against this index can demonstrate how these funds perform relative to the broader market, giving investors insight into whether energy-focused investments outperform or underperform the general market trend.
The FTSE All World Ex U.S. index covers global equities excluding U.S. companies, offering a broader international perspective. Using this index as a benchmark helps assess the performance of energy equity mutual funds in comparison to international markets. It is particularly relevant if the funds have a global investment mandate or if investors are seeking exposure to energy sectors outside the U.S.
Focusing specifically on the energy sector within the S&P 500 Energy Index narrows the comparison to companies primarily engaged in the energy industry. Using this benchmark helps to evaluate the performance of energy equity mutual funds against a more direct sector-specific index, offering a closer comparison for investors specifically interested in the energy sector’s performance.
We started with 24 energy equity mutual funds in January 2000, and the number goes to 69 by July 2023. These are all actively managed mutual funds with an average turnover ratio of 160.71% in July 2023. The median turnover ratio is 84%, with a maximum turnover ratio of 1549% and a minimum turnover ratio of 8%. The average expense ratio is 1.49% with a standard deviation of 0.65%. Total assets under management have gone up from USD 4.9 billion in January 2000 to USD 70 billion by December 2022.
Table 1 shows EEMFs’ absolute and relative performance from January 2000 to July 2023 based on their monthly returns.
Based on monthly returns from January 2000 to July 2023, energy equity mutual funds had the highest mean return, followed by the S&P 500 Energy Index, the Russell 3000 Index, and the FTSE All World Ex U.S. Index. Overall, the results suggest that energy equity mutual funds and the S&P 500 Energy Index have delivered higher returns than the Russell 3000 Index and the FTSE All World Ex U.S. Index over the long term. However, they have also been more volatile. The Russell 3000 Index has provided the best risk-adjusted return over the period.
Energy equity mutual funds also had the highest standard deviation, followed by the S&P 500 Energy Index, the Russell 3000 Index, and the FTSE All World Ex U.S. Index. The Russell 3000 Index had the highest average return per unit of risk, followed by energy equity mutual funds, the S&P 500 Energy Index, and the FTSE All World Ex U.S. Index.
During the COVID-19-induced lockdowns, economic activity came to a halt, causing a substantial decline in energy demand. Consequently, the Russell 3000 Index showed the highest average return, followed by the FTSE All World Ex U.S. Index, energy equity mutual funds, and the S&P 500 Energy Index.
Before the onset of vaccinations and during the lockdowns, the Russell 3000 Index boasted the highest average return relative to the risk incurred, followed by the FTSE All World Ex U.S. Index, energy equity mutual funds, and the S&P 500 Energy Index.
The findings indicate that both the Russell 3000 Index and the FTSE All World Ex U.S. Index outperformed energy equity mutual funds and the S&P 500 Energy Index amid the COVID-19 pandemic. This likely stems from the broader sector diversification present in the Russell 3000 Index and the FTSE All World Ex U.S. Index compared to the more focused energy allocation within energy equity mutual funds and the S&P 500 Energy Index.
Over the 2.5-year period from February 2021 to July 2023, the S&P 500 Energy Index showed a strong recovery, delivering the highest average return relative to U.S. and global equities as proxied by the Russell 3000 index and FTSE All World Ex U.S. Index. The energy equity mutual funds also outperformed the Russell 3000 Index, and the FTSE All World Ex U.S. Index.
Despite leading in returns, the S&P 500 Energy Index also displayed the highest standard deviation during this timeframe, followed by energy equity mutual funds, the Russell 3000 Index, and the FTSE All World Ex U.S. Index. Notably, energy equity mutual funds exhibited the most favorable average return per unit of risk compared to the other indices, followed by the S&P 500 Energy Index, the Russell 3000 Index, and the FTSE All World Ex U.S. Index.
4. Model
Utilizing monthly returns spanning from January 2000 to July 2023, we computed the Sharpe ratio (introduced in
Sharpe 1966), Sortino ratio (proposed by
Sortino and Van Der Meer 1991), and Omega ratio (developed by
Keating and Shadwick 2002) for energy sector mutual funds (EEMFs). These ratios were also calculated for benchmark indices, including the Standard & Poor’s 500 Energy Index, the Russell 3000 Index (serving as a proxy for U.S. equities), and the FTSE All World Ex U.S. Index (used as a proxy for global equities). We also generated alphas based on modified Carhart’s multi-factor models to examine whether EEMFs outperformed a benchmark after accounting for risk exposure.
The Sharpe ratio is a commonly used tool for evaluating the performance of an investment portfolio. It measures the return generated by a portfolio over the risk-free rate per unit of volatility (risk). The risk premium is defined as the difference between the portfolio return and the risk-free rate, while the portfolio standard deviation is used to measure the volatility (risk) of the portfolio. The Sharpe ratio provides a way to determine whether an investment is worth the risk, with a higher ratio indicating that the portfolio provides a better return for the risk taken.
The Sortino ratio (1991) is a variation of the Sharpe ratio. It focuses on the concept of “bad” volatility, or downside deviation, rather than overall volatility. The downside deviation is calculated as the standard deviation of negative returns, which measures the risk associated with potential losses. The Sortino ratio is calculated by dividing the portfolio’s excess return over a minimum acceptable return by the downside deviation. A higher Sortino ratio indicates that a portfolio has a higher return for a given level of downside risk. This ratio is useful for investors who are more concerned about minimizing potential losses and preserving capital, as it provides a more accurate measure of risk compared to the Sharpe ratio.
The Omega ratio (
Keating and Shadwick 2002) is a metric used to evaluate the risk–return trade-off of a financial asset. The Omega ratio is calculated as the ratio of weighted gains to weighted losses, to divide the predicted returns into two groups: those that are higher than average and those that are lower. The ratio of positive to negative returns is referred to as the Omega ratio. This indicator provides a way to measure the likelihood of achieving a target return, considering both the magnitude and probability of returns. A higher Omega ratio indicates that a portfolio is more likely to achieve its target return and has a better risk–return trade-off than a portfolio with a lower Omega ratio.
4.1. Multi-Factor Model
Factor models serve as an established analytical framework within investment analysis. They provide a structured methodology to dissect investment returns into constituent elements associated with various underlying risk factors. The meticulous examination of investment returns within a factor model aims primarily to discern the responsiveness of these returns to a spectrum of diverse risk sources. These encompass an extensive range of variables, encompassing market trends, prevailing economic conditions, sector-specific attributes, and other pertinent determinants. Through quantifying the relationship between investment returns and these multifaceted risk factors, factor models stand as a valuable tool for investors and analysts, offering profound insights into the foundational determinants of investment performance.
In the realm of factor modeling, alpha stands as a pivotal concept. It serves as a quantitative gauge for appraising investment performance, transcending the explanatory capacity of established risk factors. When an investment consistently surpasses or falls short of its anticipated returns, considering its exposure to acknowledged risk factors, the unexplained segment of this performance is termed alpha. Alpha encapsulates the value attributed to the proficiency or strategy of the investment manager, surpassing what can be foreseen solely through systematic market or factor-related risks.
The Carhart’s four-factor model, distinct from conventional models like the capital asset pricing model (CAPM) and the Fama–French three-factor model, introduces four distinct factors: the market risk factor, size factor, value factor, and momentum factor. This framework presents a comprehensive structure for appraising investment performance.
The Carhart four-factor model stands as a well-recognized framework employed in evaluating investment portfolios, particularly concerning conventional financial instruments like stocks. This model encompasses size and value factors alongside a momentum factor, as previously mentioned. The relevance of this momentum factor becomes evident in the context of energy mutual funds, where the volatility of energy prices often prompts the use of momentum strategies—purchasing assets that have recently exhibited strong performance.
Additionally, trends and momentum exert significant influence on performance within the energy market, thereby reinforcing the suitability of the Carhart four-factor model in this context. Utilizing such a widely accepted model, especially in juxtaposing the performance of energy mutual funds against traditional investments, renders the results more relatable and understandable for stakeholders well-versed in the principles of traditional finance. This alignment facilitates a clearer comprehension of how energy mutual funds fare concerning established investment norms.
In addition to the traditional factors included in Carhart’s model, we also include a fifth factor to account for the performance of the broader energy market. Incorporating the excess return on the Standard & Poor’s (S&P) 500 Energy Index as a factor in a four-factor model for evaluating mutual funds can provide a more comprehensive and accurate framework for assessing these assets’ risk and return profiles. The S&P 500 Energy Index is a broad-based index that tracks the performance of the 50 largest publicly traded energy companies in the United States. Energy equity mutual funds primarily invest in companies within the energy sector, such as oil, gas, and renewable energy companies. The S&P 500 Energy Index specifically tracks these types of companies, making it a relevant benchmark for evaluating the performance of funds that share a similar focus. Investors often seek risk-adjusted returns, and the S&P 500 Energy Index provides a basis for evaluating whether energy equity mutual funds are generating returns that are commensurate with the level of risk associated with the energy sector. This ensures that the factor model accounts for the full spectrum of the energy sector. Equation (1) shows the five-factor model used in this study.
represents the percentage return of fund i in month t.
stands for the U.S. T-bill rate for month t.
denotes the return on the market portfolio for month t.
pertains to the market risk factor, denoting the surplus return of the overall market and addressing the inherent risk associated with stock market investments.
(Small minus Big). The SMB factor is computed by comparing the average returns of small-cap stocks, representing companies with lower market capitalizations, against large-cap stocks, which consist of larger, established firms. The calculation involves subtracting the average return of the small-cap portfolio from that of the large-cap portfolio over a specified period, signaling a positive SMB value when small-cap stocks outperform larger ones during that timeframe.
(High minus Low). The variable representing the return minus the growth return for month (t) constitutes the realization of the value factor. The High minus Low (HML) factor gauges the historical performance differential between value and growth stocks. Computed as the return of a portfolio of value stocks (those with a low price-to-book ratio) subtracted from the return of a portfolio of growth stocks (those with a high price-to-book ratio), a positive HML value signifies that value stocks have outperformed growth stocks. The rationale behind HML in the Fama–French model is to capture the historical returns of value stocks relative to growth stocks. The model suggests that value stocks tend to outperform growth stocks over some periods, reflecting a historical trend in the market where stocks with lower market prices relative to their fundamental values (value stocks) often demonstrate higher returns compared to stocks with higher market prices relative to their fundamental values (growth stocks).
MOM signifies the momentum factor. Momentum in the four-factor model is a factor that accounts for the historical performance difference between stocks with strong recent performance and those with weak recent performance. The momentum factor reflects the tendency of stocks that have performed well in the recent past to continue outperforming, while those with poor past performance may continue underperforming. Momentum (Mom) represents the difference between the average return of the two highest-performing portfolios from the past and the average return of the two lowest-performing portfolios from the same period.
Mom = 1/2 (Small High + Big High) − 1/2(Small Low + Big Low)
is the S&P 500 Energy Index.
εi,t accounts for an error term.
A positive alpha (α) indicates superior performance relative to the level of risk undertaken by the portfolio manager. This success might stem from adept timing skills, proficiency in selecting securities, or better-than-expected performance of the fund’s owned securities. Conversely, a negative alpha suggests subpar performance in relation to the risk assumed. Such underperformance may be attributed to inadequacies in security selection or unforeseen fluctuations in the prices of the fund’s holdings.
The Small minus Big (SMB) factor, which encapsulates the distinction between returns on small-cap and large-cap stocks, is expected to manifest a positive slope, denoted as βs, for small-company equities, while large-company stocks are anticipated to exhibit a negative slope. A positive estimation of βv signifies an inherent responsiveness to the value factor, whereas a negative estimate signifies a sensitivity to the growth factor. The presence of a positive intercept (α) in the model implies superior performance relative to the three-factor model, while a negative intercept (α) suggests underperformance in comparison to said model.
The momentum factor seeks to capture the tendency where assets that have demonstrated strong recent performance continue to perform well while those with poor recent performance continue to underperform. Typically, this factor relies on the past 6 to 12 months of returns to assess momentum.
4.2. Conditional Factor Models
Numerous studies examine managed funds’ performance using metrics susceptible to bias due to the inherent volatility of risks and risk premiums over time. However,
Ferson and Schadt (
1996) introduced a conditional performance measure that considers shared variation. Their research demonstrated that incorporating lags of public information factors—such as interest rates and dividend yields, known to impact stock returns—results in superior outcomes compared to standard methodologies. These lagged public information factors contain valuable information and predictive power regarding future market movements, enabling more informed evaluations of EEMFs’ performance. These models can compute time-varying alphas (excess returns not explained by the model) and betas (measures of asset sensitivity to market movements). By incorporating time-varying factors or conditions, they can generate estimates of alphas and betas that fluctuate over different periods or market situations.
To estimate the conditional measure of performance, Ferson and Schadt expanded upon the classic Jensen alpha model by incorporating a vector of lagged public information variables. This modification enables the estimation of α, the conditional measure of performance. Instead of relying on unconditional betas, they transformed the fundamental models by utilizing time-varying conditional anticipated returns and betas. These tools are readily available and have demonstrated effectiveness in predicting stock returns.
This approach employs specific instruments, including the three-month Treasury bill rate (TR3M), the term structure slope (SLOPE), representing the difference between the 30-year Treasury bond yield and the three-month Treasury bill yield, the corporate bond market quality spread (QS), represented by the difference between the yield of Moody’s BAA-rated corporate bonds and Moody’s AAA-rated corporate bonds and the dividend yield on the S&P 500. All these instruments lag by one month to capture the necessary temporal dynamics.
In addition, the study by
Inchauspe et al. (
2015) introduced a multi-factor asset pricing model that incorporates time-varying coefficients to investigate the impact of energy prices and stock market indices as factors influencing asset prices. The integration of time-varying coefficients within their multi-factor asset pricing model facilitated the capture of evolving dynamics regarding the influence of energy prices and stock market indices on asset pricing across different time periods.
Equation (2) presents the resulting conditional models, where Z
j,t−1 represents the demeaned value of the unconditional elements. By incorporating these lagged public information variables and employing time-varying conditional measures,
Ferson and Schadt (
1996) provide a more robust and accurate approach to evaluating the performance of managed funds.
4.3. Conditional Carhart Extended Four-Factor Model
4.4. Market Timing and Selectivity
Selectivity refers to an investment manager’s skill in picking stocks that will provide the projected returns in the future. Market timing, on the other hand, refers to an investment manager’s ability to adjust their portfolio holdings to anticipate changes in the asset portfolio or market price movement in general. Mutual fund market timing and selectivity have already been investigated
Treynor and Mazuy (
1966),
Kon and Jen (
1978),
Henriksson and Merton (
1981), and
Lee and Rahman (
1990). Previous research found that mutual fund managers had only minimal performance in market timing and selectivity. To account for market timing and selectivity,
Treynor and Mazuy (
1966) included a quadratic term to the capital asset pricing model (CAPM).
Treynor and Mazuy (
1966) introduced a quadratic term in another CAPM-based model that has become a standard for gauging timing skill to address managers’ abilities to foresee market swings.
Treynor and Mazuy (
1966),
Kon and Jen (
1978),
Henriksson and Merton (
1981), and
Lee and Rahman (
1990) found that mutual fund managers are only moderately successful in terms of market timing and selectivity. We used
Treynor and Mazuy’s (
1966) model to look at market timing and selectivity. The basic model was designed by
Treynor and Mazuy (
1966). This model adds a quadratic component to the CAPM or the market model to represent market timing and selectivity. The formula is as follows:
The coefficient β2 reveals if the manager can properly anticipate market performance by assessing whether the relation between the portfolio return and the market return is non-linear. A β2 that is both positive and significant implies superior market timing abilities. A negative and significant β2 suggests poor market timing. If β2 is not more than 0, the manager lacks market timing abilities. Similarly, αs denotes selectivity.
4.5. Conditional Market Timing and Selectivity
To further assess the security selection and marketing timing skills of portfolio managers, we evaluate the performance of energy mutual funds, and we construct conditional marketing and selectivity models to identify market timing and selectivity based on publicly available information. Following
Ferson and Schadt (
1996), Equation (4) shows the conditional market timing and selectivity of these funds.
5. Empirical Results
5.1. Correlation Analysis
We begin our empirical analysis by examining the correlation between the monthly returns of energy equity mutual funds, the S&P 500 Energy Index, the Russell 3000 Index, and the FTSE All World Ex U.S. Index.
Table 2 summarizes the results.
Table 2 shows the correlation between the monthly returns of energy equity mutual funds, the S&P 500 Energy Index, the Russell 3000 Index, and the FTSE All World Ex U.S. Index for three different time periods: January 2000 to July 2023, February 2020 to January 2021, and February 2021 to July 2023.
Table 2 demonstrates that the monthly returns of energy equity mutual funds exhibit a close alignment with the monthly returns of the S&P 500 Energy Index, displaying a correlation coefficient of 0.91 across the period from January 2000 to July 2023. Notably, the correlation between the monthly returns of these mutual funds and the S&P Energy Index surged to 0.99 during the period of COVID-19-induced lockdowns and preceding the commencement of vaccinations. Subsequently, in the post-vaccine rollout phase, this correlation declined to 0.70, although it remains notably high.
Comparatively, the correlation of energy equity mutual funds with the Russell 3000 Index and the FTSE All World Ex U.S. Index is relatively lower, ranging between 0.69 and 0.73. Despite the lower correlation, these findings imply that energy equity mutual funds exhibit a positive and relatively strong alignment with these broader market indices, albeit not as closely as observed with the S&P 500 Energy Index.
From a portfolio viewpoint, the high correlation between energy equity mutual funds and the S&P 500 Energy Index means that these two investments can provide similar levels of diversification benefits. This is because they tend to move up and down together, so owning both investments in a portfolio would not significantly reduce the portfolio’s overall risk.
Conversely, the relatively lower correlation of energy equity mutual funds with the Russell 3000 Index and the FTSE All World Ex U.S. Index suggests the potential for added diversification advantages. While these investments exhibit a directional alignment with the broader market, their movements are not as closely intertwined.
For instance, an investor concerned about the risks associated with energy stocks could strategically mitigate overall portfolio risk by diversifying across a combination of energy equity mutual funds, the Russell 3000 Index, and the FTSE All World Ex U.S. Index. Such a strategy enables the investor to capture potential gains from the energy sector while concurrently tempering exposure to the downside risks associated with energy stocks. This diversification approach offers the opportunity to balance potential upsides with the mitigation of sector-specific vulnerabilities within the portfolio.
Before the onset of COVID-19 vaccinations, energy equity mutual funds exhibited a notably high correlation of 0.93 with both U.S. and global equities, indicating a closely synchronized movement in their monthly returns. However, subsequent to the commencement of vaccinations, the correlation between energy mutual funds and both U.S. and global equities experienced a significant decline. Presently, the correlation between energy mutual funds and the Russell 3000 Index stands at 0.57, while the correlation with the FTSE All World Ex U.S. Index rests at 0.61.
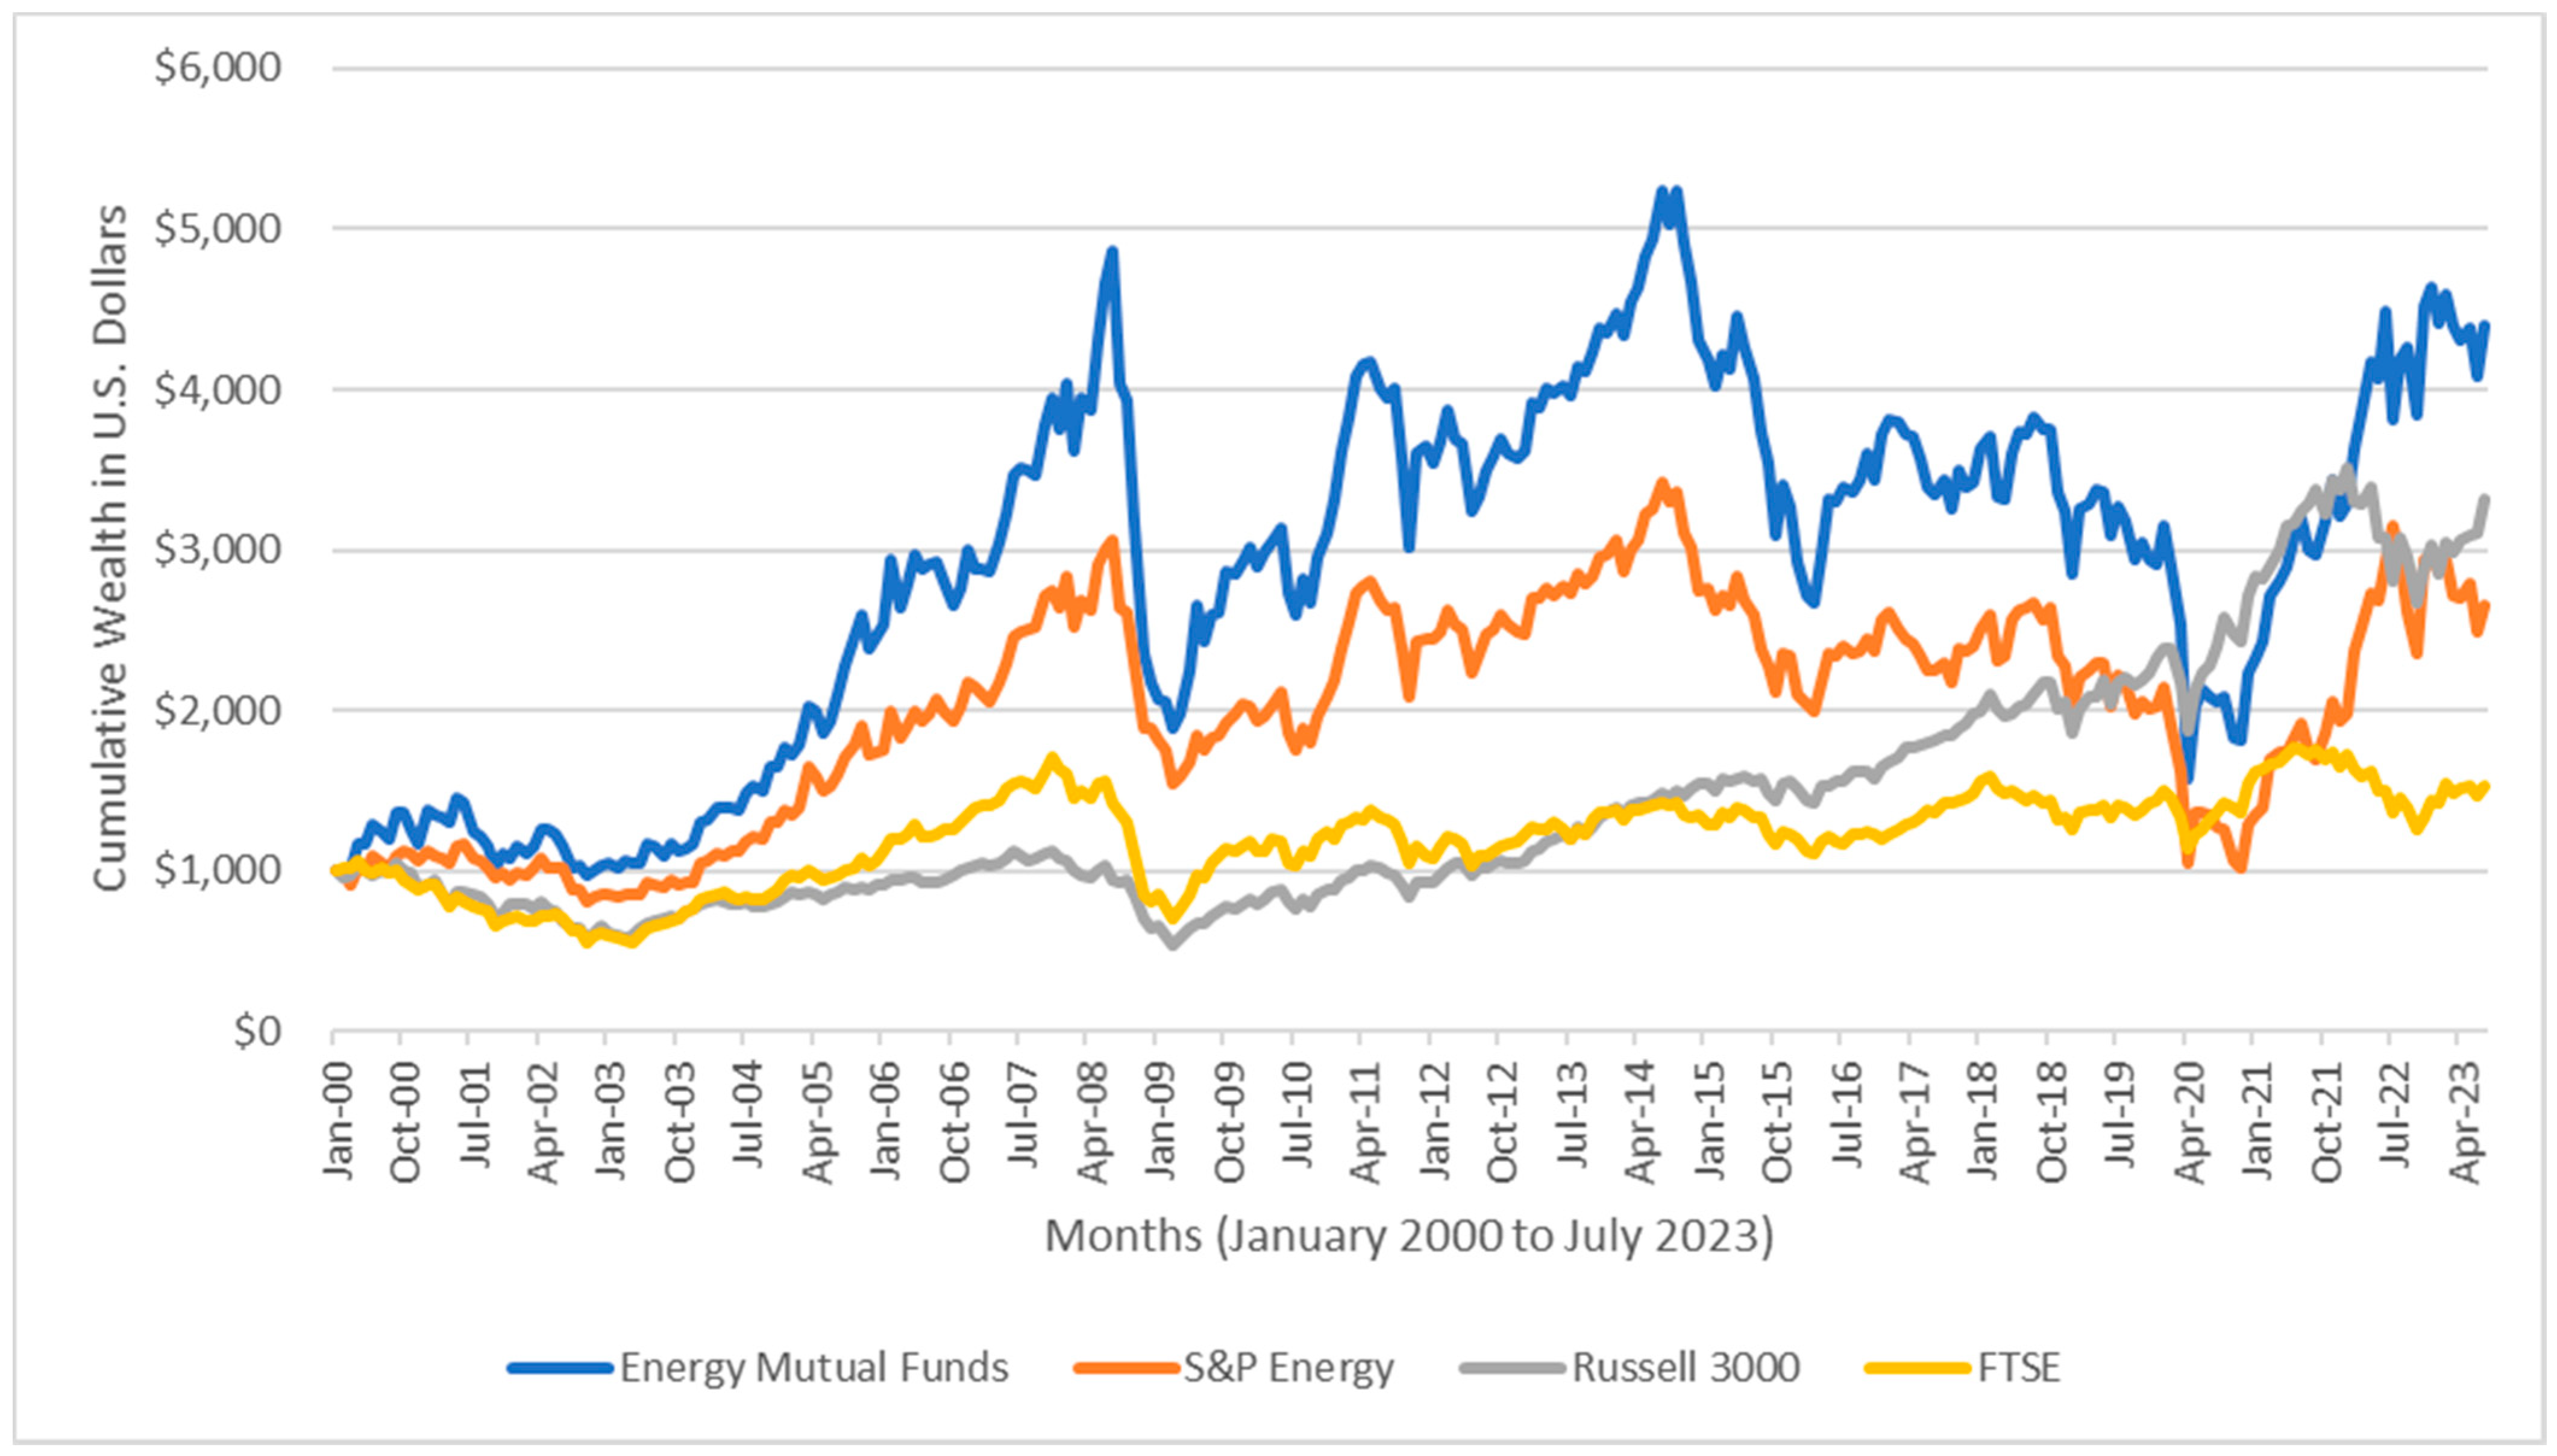
5.2. Cumulative Wealth Index
We also developed a Cumulative Wealth Index (CWI) for each category. The CWI evaluates the return on a USD 1000 investment in each category at the start of January 2000, assuming dividend reinvestment. Additionally, we computed a CWI for each benchmark index mentioned in
Figure 1 to assess the cumulative impact of returns over time based on an initial investment.
Figure 1 presents a summary of the CWI constructed for each category.
If an individual had invested USD 1000 in energy equity mutual funds back in January 2000, their investment would have witnessed impressive growth, reaching USD 4396 by the conclusion of July 2023. In contrast, a USD 1000 investment in the S&P 500 Energy Index during the same period would have yielded a total wealth of USD 2655.
When we compare these figures to alternative investment choices, the differences become even more apparent. For instance, allocating USD 1000 to the Russell 3000 index in January 2000 would have resulted in a relatively modest accumulation of USD 3319 by July 2023. Meanwhile, an investment of USD 1000 in the FTSE All World Ex U.S. index over the same timeframe would have grown to just USD 1538.
In absolute terms, energy equity mutual funds have clearly outperformed all other indexes in generating cumulative wealth from January 2000 to July 2023.
5.3. Analysis of Sharpe, Sortino, and Omega Ratios
Table 3 provides a summary of the risk-adjusted performance of energy equity mutual funds, as well as several benchmark indices, using three different risk-adjusted performance metrics: the Sharpe ratio, Sortino ratio, and Omega ratio. The analysis is based on monthly returns from January 2000 to July 2023 and is divided into three distinct time periods: January 2000 to July 2023, COVID-19-induced lockdowns to the first vaccination period (February 2020 to January 2021), and February 2021 to July 2023 (post-COVID-19 vaccination rollout period).
Based on monthly returns from January 2000 to July 2023, energy equity mutual funds outperformed the benchmark indices in terms of the Sharpe, Sortino, and Omega ratios. This suggests that, on a risk-adjusted basis, these funds provided higher returns for the level of risk taken compared to the benchmark indices.
During this challenging period of COVID-19-induced lockdowns and uncertainty, energy equity mutual funds had negative Sharpe and Sortino ratios, indicating poor risk-adjusted performance. The Omega ratio was below 1, suggesting a downside risk. In contrast, the benchmark indices, especially the Russell 3000 Index, performed better on a risk-adjusted basis.
In the post-COVID-19 vaccination rollout period, energy equity mutual funds significantly improved their risk-adjusted performance, with higher positive Sharpe, Sortino, and Omega ratios. These metrics suggest that these funds provided better returns for the level of risk taken compared to the benchmark indices during this period.
Results show that energy equity mutual funds had varying performance compared to benchmark indices over different time periods, with notable improvements after the COVID-19-induced challenges.
5.4. Empirical Analysis of Multi-Factor Model
Table 4 summarizes the regression results of a multi-factor assets pricing model (modified Carhart’s multi-factor model).
Table 4 shows that the alpha for energy mutual funds is positive at 0.08, but it is not statistically significant.
The findings presented in
Table 4 reveal that a substantial portion of the variations in the performance of energy equity mutual funds can be elucidated through the multi-factor (modified and extended Carhart four-factor) models. During the period from January 2000 to July 2023, the average adjusted R-squared (R
2) value for this regression is approximately 0.85. This high explanatory power is consistent with the argument made by
Klement (
2015), suggesting that the notable factor exposures to equity-market-related elements may reflect other systematic factor exposures inherent to these funds, which in turn are influenced by developments in the equity market.
Energy equity mutual funds show both statistically and economically significant connections to the broader stock market, as indicated by the positive coefficients linked to excess market returns. Despite attempts to minimize systematic variation associated with the stock market, these funds typically display stock market betas ranging from 0.34 to 0.86, signaling a notable correlation with the stock market. Consequently, despite their nomenclature, these funds are not impervious to the fluctuations and dynamics of the stock market.
While their returns may not perfectly align with the stock market, they still exhibit substantial exposure to its movements. Although this exposure can contribute to risk mitigation, it also implies that these funds cannot completely evade the volatility of the stock market. The observed high factor exposures to equity-market-related factors in energy equity mutual funds further suggest that these funds are not solely focused on energy sector performance. Instead, they demonstrate other systematic factor exposures influenced by broader equity market developments.
The significant correlation between energy equity mutual funds and the stock market, evident in their stock market beta, implies that these funds are influenced by overall market trends. Investors should recognize that, despite providing some diversification benefits, these funds are not entirely insulated from stock market volatility.
Given the strong correlation of 0.90 between the monthly returns of energy equity mutual funds and the S&P 500 Energy Index, it is unsurprising that the excess returns of the S&P 500 Energy Index hold substantial statistical significance in explaining the excess returns of energy mutual funds. The coefficient associated with the S&P 500 Energy Index ranges from 0.25 to 0.81, further underscoring its statistical significance in this context.
Furthermore, the coefficient on SMB (Small minus Big) is positive when we analyze monthly excess returns from January 2000 to July 2023 as well as the monthly returns for the sub-periods of February 2020 to January 2021 and February 2021 to July 2023, but the coefficient is statistically significant only for the full sample period of January 2000 to July 2023. A positive coefficient suggests that, on average, smaller-cap stocks (SMB) tend to outperform larger-cap stocks.
Similarly, the coefficient on HML is positive for the full sample as well as for the sub-periods, but it is statistically significant for the post-vaccination period of February 2021 to July 2023. A positive coefficient implies that, on average, value stocks have outperformed growth stocks. The momentum coefficient is positive and ranges between 0.02 for the full sample period to 0.07 during the COVID-19-induced lockdowns to 0.22 during the post-vaccination period, but they are not statistically significant.
We then compared the alpha generated by energy mutual funds with the alpha delivered by benchmark indexes.
Table 5 summarizes the results.
Table 5 shows the net monthly alpha values for energy equity mutual funds, the Russell 3000 Index, and the FTSE All World Ex U.S. Index over different time periods, specifically from January 2000 to July 2023. It also highlights periods of interest during the COVID-19 pandemic and post-pandemic vaccination rollout. As shown in
Table 5, based on monthly returns from January 2000 to July 2023, net monthly alphas for U.S. as well as global equities were negative, but the negative alpha for U.S. equities is statistically significant. On the other hand, energy equity mutual funds delivered a positive although statistically not significant alpha.
During the COVID-19-induced lockdowns when the economic activity around the globe came to a standstill, energy equity mutual funds generated a positive net monthly alpha of 0.68 (statistically not significant at the 1% level). The Russell 3000 Index also underperformed with a net monthly alpha of −0.25 (statistically significant at the 10% level). The FTSE All World Ex U.S. Index had a net monthly alpha of −0.73, but it was not statistically significant. Following the COVID-19 vaccination rollout, energy equity mutual funds showed potential outperformance with a positive net monthly alpha of 0.75. The Russell 3000 Index had a net monthly alpha of 0.03. The FTSE All World Ex U.S. Index had a net monthly alpha of 0.84. None of the alphas are statistically significant.
Despite the observed outperformance of energy equity mutual funds during the post-vaccination period, it is critical to emphasize that this apparent improvement lacks statistical significance. This means that the observed differences in performance may have occurred by chance rather than being a reliable indicator of actual, meaningful outperformance.
Table 6 summarizes the results of the conditional multi-factor model to evaluate the performance of energy equity mutual funds.
The conditional factor model results show that energy equity mutual funds generated positive alphas that range from 0.15 (January 2000 to July 2023) to −5.80 during COVID-19-induced lockdowns and before the rollout of the vaccine to 1.17 during the post vaccine roll-out period, but none of the alphas are statistically significant.
We then evaluated the market timing and security skills of portfolio managers using
Treynor and Mazuy’s (
1966) model. The results are summarized in
Table 7.
Table 7 delineates the analysis conducted on monthly returns spanning from January 2000 to July 2023, indicating the performance of energy equity mutual fund portfolio managers in security selection and market timing. The findings unveil limited capabilities among managers in security selection, as denoted by a non-significant positive alpha. Concurrently, a certain proficiency in market timing is discerned, supported by a non-significant positive β
2 coefficient, according to
Treynor and Mazuy’s (
1966) model.
Moreover, our study explores the performance of energy equity mutual funds concerning market timing and stock selection across two distinct periods: the initial phase, encompassing the onset of COVID-19 lockdowns to the early vaccination phase (February 2020 to January 2021), and the subsequent period post-vaccination rollout (February 2021 to July 2023). Employing
Treynor and Mazuy’s (
1966) model, during the initial phase, the alpha representing risk-adjusted returns was negative but lacked statistical significance. Similarly, the β
2 coefficient linked to market timing exhibited a negative trend without statistical significance. In the subsequent phase, the alpha displayed a positive but statistically insignificant trend, while the β
2 coefficient, although positive, remained statistically non-significant.
Our investigation expanded to include publicly available information, persistently assessing the market timing and security selection skills of portfolio managers. Notably, our results remained unchanged even with this augmentation.
Table 8 offers a concise summary, encapsulating the outcomes derived from conditional market timing and security selection models.
When integrating public information into the
Treynor and Mazuy (
1966) model, it becomes apparent that energy equity mutual fund portfolio managers showcased notable security selection skills in the post-vaccination phase, denoted by a slightly significant positive alpha. On the other hand, the β
2 coefficient remained negative although statistically not significant. These findings suggest that while managers displayed some proficiency in selecting securities after the vaccination phase, their ability to time the market amidst the pandemic’s uncertainties remained limited before widespread vaccination initiatives.
6. Summary and Conclusions
This study explored the role of energy mutual funds as pivotal investment tools within the dynamic energy sector. An array of financial metrics, including the Sharpe ratio, Sortino ratio, Omega ratio, and a comprehensive multi-factor model, underwent rigorous analysis to assess the performance of these funds. The examination spanned diverse timeframes, notably encompassing the disruptive period of the COVID-19 pandemic, emphasizing comparative evaluations of energy equity mutual funds against benchmark indices. Furthermore, the study scrutinized the market timing and security selection abilities of portfolio managers, alongside investigating the influence of publicly available information.
The findings underscore the significance of energy mutual funds as a means of gaining exposure to the energy sector, albeit amid inherent risks stemming from the volatility of energy prices and the cyclical nature inherent in energy companies. Notably, the adapted multi-factor asset pricing model unveils a substantial correlation between the monthly returns of energy equity mutual funds and the broader stock market, elucidating distinct factors beyond the traditional scope of the energy sector.
Throughout historical periods, the study consistently observed the outperformance of energy equity mutual funds compared to benchmark indices, presenting a compelling argument for long-term investment strategies. However, amid the turbulence of the COVID-19 pandemic, these funds encountered challenges, displaying suboptimal risk-adjusted performance, albeit with indications of potential post-vaccination improvements.
The assessment of portfolio managers’ capabilities reveals a proficiency in security selection but nuances in market timing, as evidenced by the Treynor and Mazuy model. Even with the incorporation of lagged public information factors, the evaluation of energy equity mutual funds’ performance remains steadfast, reaffirming the significance of security selection in these investment vehicles.
Investors interested in gaining exposure to the energy sector might consider energy equity mutual funds as a feasible choice. Nevertheless, grasping the inherent risks, particularly associated with energy price volatility and cyclicality, becomes imperative. The sustained superior performance of these funds in comparison to benchmark indices across historical periods constitutes an argument favoring the adoption of long-term investment strategies.


