Article

Non-Performing Loans and Net Interest Margin in the MENA Region: Linear and Non-Linear Analyses

by
Khalil Alnabulsi
1,*,
Emira Kozarević
2 and
Abdelaziz Hakimi
3
1
Doctoral School of Regional- and Business Administration Sciences, Széchenyi István University, 9026 Győr, Hungary
2
Faculty of Economics, University of Tuzla, 75000 Tuzla, Bosnia and Herzegovina
3
V.P.N.C Lab, Faculty of Law, Economics and Management, University of Jendouba, Jendouba 8100, Tunisia
*
Author to whom correspondence should be addressed.
Int. J. Financial Stud. 2023, 11(2), 64; https://doi.org/10.3390/ijfs11020064
Submission received: 19 December 2022 / Revised: 12 April 2023 / Accepted: 19 April 2023 / Published: 25 April 2023

Abstract

:
This paper analyzes the linear and non-linear relationship between non-performing loans and bank profitability measured by the Net Interest Margin for a sample of 74 Middle Eastern and North African banks over the period of 2005–2020. We used the System Generalized Method of Moments (SGMM) as a linear approach and the Panel Smooth Transition Regression (PSTR) model as a non-linear approach. The empirical results of the SGMM approach indicated that the ratio of NPLs negatively affects bank profitability. The findings of the non-linear relationship based on the PSTR model confirmed the existence of a threshold effect. We found that below the threshold of 4.42%, the effect of NPLs is negative but not significant, while after surpassing this threshold, the effect becomes negative and significant. As for bank specifics, we revealed that bank size is positively and significantly associated with bank profitability. For industry factors, we found that more bank concentration decreases bank profitability. Regarding the financial environment, we concluded that the global financial crisis exerted a negative impact on bank profitability. Moreover, we revealed a positive and significant impact of GDP on bank profitability as well as a negative impact of inflation on bank profitability. This study has some limitations regarding the social, economic, and financial differences of the whole sample, which includes banks from the Middle East and others from North Africa. Hence, decomposing the whole sample into two sub-samples could improve the results of this paper.

1. Introduction

The banking sectors in the Middle Eastern and North African (MENA henceforth) countries have gone through a fundamental transformation in the past 30 years. Foreign-owned banks have begun to increasingly dominate the MENA banking market. At the same time, financial systems in MENA countries have remained bank-dominated, and banks have become the main source of external financing for the private sector.
Bank profitability and bank stability are the most important targets of bankers and policymakers, particularly in some emerging economies where the stability of the whole economy is nearly dependent on the stability of the banking sector. A well-functioning banking sector is essential for sustainable growth and development in this political and economic part of the world (Olson and Zoubi 2011). Currently, many banks can utilize social media to access and share information with stakeholders at a minimum cost to improve bank performance (Ballouk et al. 2022). According to the financial intermediation theory, banking institutions play an intermediary role between savers and borrowers in the economy. Moreover, Yüksel et al. (2018) proved the vital role of banks as a catalyst for economic growth. According to Boubaker et al. (2022b), the global banking sector must maintain and improve its efficiency during difficult times.
Banks face multiple and complex risks. One of the most serious bank risks is credit risk. Non-performing loans (NPLs henceforth) are considered financial pollution and exert harmful effects on the level of bank profitability and bank stability. Increasing the level of NPLs poses a great risk to banks, the financial system, and the economy as a whole. Additionally, an increase in loan loss provision is also considered a significant determinant of credit risk (Kolapo et al. 2012). Moreover, the credit risk that might arise by increasing the level of NPLs on the bank’s balance sheet reveals the occurrence of the banking crisis (Goswami 2022). The difficulties that borrowers might face due to the unwillingness to pay back their loans led to a progressive deterioration in credit quality and, thus, a significant increase in credit risk (Orlando and Pelosi 2020).
To the best of our knowledge, banking literature on the NPLs–profitability relationship is abundant. Several empirical studies concluded that the high-level ratio of NPLs significantly affects the level of bank profitability (Flamini et al. 2009; Messai and Jouini 2013; Ozurumba 2016; Apergis 2014). A significant part of the literature supports the negative relationship between NPLs and bank profitability (Manz 2019; Kjosevski et al. 2019; Panta 2018). NPLs represent a major challenge for the banking sector, as they reduce the profitability of banks and prevent them from lending to businesses and individuals. Nevertheless, less abundant studies support the negative association or the absence of a significant effect (Lata 2014).
When reviewing the literature on this topic, we noted that most of the prior studies are based on linear approaches using OLS regression, fixed effect models, random effect models, and dynamic panel data models (Vithessonthi 2016; Tölö and Virén 2021; Kumar et al. 2020). Only a few empirical studies are focused on the possible non-linear relationship (Bolarinwa et al. 2021; Merhbene 2021). Although the banking literature on the NPLs–profitability relationship (linear relationship) is well documented, most prior works supported the negative association. However, studies on the level at which the NPL ratio can affect bank profitability are less abundant. To date, no study has investigated both the linear and non-linear relationship between NPLs and bank profitability.
This paper aims to explore the effect of NPLs on bank profitability using a sample of MENA banks over the period from 2005 to 2020. The first step consists of checking the effect of NPLs on bank profitability using the system generalized method of moments (SGMM henceforth) approach. The second step refers to defining an optimal threshold for NPLs using the panel smooth transition regression (PSTR henceforth) model developed by González et al. (2005). The MENA region can be considered an appropriate case study for several reasons. The financial system of this region is a bank-centric financial system, despite the numerous reforms undertaken to establish a market-based financial system. Banks still play a dominant role in financing economic activities. They continue to collect their resources in the form of deposits and grant credit to their clients. However, these traditional activities carry risks that can destabilize banks. Consequently, the government budget deficit in the MENA region expanded to 10.1% of the region’s GDP in 2020, compared to 3.8% in 2009 (IMF 2021).
North African banks operate in a highly concentrated banking sector market with a low level of profitability and a high level of NPLs, but they continue to show strong resilience. For example, in 2016, the level of NPLs in Algeria increased to 11.4% due to the fall in hydrocarbon prices, resulting in deterioration for public-sector enterprises. In Tunisia, the level of NPLs is still high, with around 50% of NPLs concerned with the industrial and tourism sectors. However, some North African countries made improvements in the provisioning of credit risk. For example, the loan loss provision rate in Egypt was close to 100% (Azzabi et al. 2018). The banking sector in the MENA region comprises two categories of banks, conventional and Islamic banks. Islamic banks dominate in GCC countries, while most banks in North African countries are conventional. The banking sector in GCC countries is more stable and developed. Thus, the levels of NPLs in GCC countries are lower than in North African countries (Hakimi et al. 2020).
Since there are a few studies that investigated the NPLs–profitability non-linear relationship, this paper comes to fill this gap. Firstly, it investigates the effect of NPLs on bank profitability. Secondly, it defines the optimal threshold of NPLs that affects bank profitability in the MENA region.
This paper contributes to the existing literature in several ways. First, to the best of our knowledge, this is the first paper that simultaneously investigates the linear and non-linear relationship between NPLs and bank profitability in the MENA region. Prior studies have focused on a linear relationship using either the OLS method or GMM regression. In the current study, we investigate both linear and non-linear relationships between NPLs and profitability. Furthermore, defining an optimal threshold of NPLs that affect bank profitability will be very useful for policymakers and bankers to develop appropriate strategies to hedge and manage credit risk. Second, it focuses on a region where banks still play a dominant role in financing economic activities. Additionally, the financial system of this region is a bank-centric financial system, and banks in some countries operate in a highly concentrated baking sector market with a low level of profitability and a high level of NPLs. Hence, defining the threshold of NPLs that might affect bank profitability could be of great importance for banks and policymakers to improve their decision-making and manage their credit risks.
The remainder of this paper is structured as follows: The literature review is given in Section 2. Section 3 describes the sample and the empirical strategy. Section 4 discusses the empirical findings, while Section 5 concludes and addresses some policy recommendations.

2. Literature Review and Hypotheses Development

There are some early investigations of the determinants of bank profitability (Short 1979; Bourke 1989; Molyneux and Thornton 1992). The existing literature provides the key determinants of profitability, which can be categorized into internal and external determinants. The internal determinants comprise return on assets (ROA) and return on equity (ROE), depending on the bank specifics, such as bank size, liquidity risk, credit risk, capital adequacy, and non-interest income. However, the external determinants of profitability are macroeconomic factors, such as the inflation rate, GDP, and money supply, as well as the financial environment, such as the global financial crisis. Many scholars have established evidence from both developed and developing countries (Onofrei et al. 2018; Mirzaei et al. 2013). Firm-level, industry-level, and macroeconomic determinants have been considered in prior studies as the main determinants of bank performance (Pasiouras and Kosmidou 2007; Natsir et al. 2019; Beck et al. 2015). Based on previous literature, bank size, capitalization, NPLs, growth of deposits, and efficiency are the major variables (Bolarinwa et al. 2019; Garcia and Guerreiro 2016; Dietrich and Wanzenried 2011). One of the important factors in banking literature is NPL, which is widely used as one of the determinants of bank profitability. While most of the empirical studies on the NPLs–profitability relationship focused on linear approaches (Akter and Roy 2017; Serrano 2021; Thornton and Di Tommaso 2021; Ugoani 2016; Rosenkranz and Lee 2019), a few studies investigated the possible non-linear relationship (Alqahtani et al. 2022; Neves et al. 2020; Kusi et al. 2020). Boubaker et al. (2022a) examined the role of bank affiliation in bank efficiency using a fuzzy approach, including bank NPLs as one of the relevant control variables that might affect bank stability.

2.1. The Linear Relationship between NPLs and Bank Profitability

NPLs represent a standard measure for the quality of assets and can be used to mark the onset of a banking crisis (Reinhart and Rogoff 2011). The higher level of NPLs adversely affects provisioning for doubtful debts and written-off loans that will distress bank profitability. Moreover, NPLs affect banks’ profitability by decreasing revenues and eroding retained earnings (Kithinji 2010).
The extant literature found a negative effect of NPLs on bank profitability (Altunbas et al. 2000; Fan and Shaffer 2004; Girardone et al. 2004). These findings support the hypothesis proposed by Berger and DeYoung (1997) that efficient banks are better at managing their credit risk. In European countries, there is extensive literature regarding NPLs and bank profitability. For example, in the Republic of North Macedonia, Kjosevski et al. (2019) found a negative relationship between NPLs and profitability and confirmed the empirical results of Louzis et al. (2012). Similarly, Athanasoglou et al. (2005) used a dynamic panel data model to examine the impact of credit risk on the profitability of Greek banks. The results revealed a negative and significant impact of credit risk on a bank’s profitability. Çollaku and Aliu (2021) studied the impact of NPLs on banks’ profitability in Kosovo over the period 2010–2019 by using multiple linear regression. The results showed that the effect of NPLs on profitability is significant and negative. Godlewski (2005) used ROA as a performance indicator to study the impact of NPLs on bank profitability in Spain and found that there is a negative relationship between ROA and NPLs. Louzis et al. (2012) formulated the bad management hypothesis, demonstrating the negative relation between a bank’s profitability and NPLs.
In the USA, Ghosh (2015) studied 50 banks over the period of 1984–2013 and confirmed the negative impact of NPLs on the level of banks’ profitability. In Asia, Swandewi and Purnawati (2021) examined the impact of NPLs on ROA and the capital adequacy ratios for 24 Indonesian banks. The authors found that both ROA and the capital adequacy ratio have a significant and negative relationship with NPLs. Moreover, Kaaya and Pastory (2013) investigated the relationship between credit risk and bank performance (measured by ROA) and found a negative relationship. Banker et al. (2010), by using a panel dataset for 14 Korean commercial banks, found that NPLs have a negative impact on bank profitability. Vinh (2017) examined the impact of NPLs on the profitability of 34 Vietnamese commercial banks; the results suggested that NPLs exert a negative effect on banks’ profitability. Recently, Naili and Lahrichi (2022) examined the determinants of NPLs for 53 banks in the MENA region over the period of 2000–2019 and found that bank performance is more sensitive to an increase in NPLs. The results confirm the bad management hypothesis, which suggests that low profitability indicates poor management skills concerning lending strategies. Thus, increasing their risk exposure which may be achieved, at the expense of higher future NPLs. Foos et al. (2010) described credit growth in their study as the most critical driver of bank profitability and found a negative correlation between credit growth and both interest income and risk-adjusted interest income. Concerning NPLs, the expectation is that higher NPLs are associated with lower bank profitability because, when loan losses materialize, banks will lose the interest income associated with the loan category. Based on the prior literature we propose the hypotheses as follows:
H1. 
A higher level of NPLs is associated with a lower level of bank profitability.

2.2. The Non-Linear Relationship between NPLs and Bank Profitability

While prior studies on the NPLs–profitability nexus were dedicated to the bank performance, many studies examined the relationship between NPLs and profitability in emerging markets based on a linear approach (Albulescu 2015; Laryea et al. 2016; Kumar et al. 2018; Kohlscheen et al. 2018; Koju et al. 2018), but only a few examined the non-linear relationship. For instance, Bolarinwa et al. (2021) examined the threshold effect on NPLs–profitability within the Nigerian banking sector using a dynamic panel threshold adopted by Seo et al. (2019). Their findings showed that there is a threshold for NPLs of 3.5% and 5% for ROA and ROE, respectively. Rahbar and Soufiani (2021) used the PSTR model to test the impact of bank-specific factors on NPLs for 10 Iranian banks. The sample banks were categorized as bad banks if the interest spread was below 1% and good banks if the interest spread exceeded 1%. Pop et al. (2018) used a non-linear PSTR model to investigate the level of liquidity risk that affects the level of the NPL ratio in seven emerging European countries. They determined the threshold for liquidity of 94.98% for both low-liquid banks and high-liquid banks. Ben Ali et al. (2020) documented the effect of corruption on the occurrence of a banking crisis by using a threshold regression approach. The results reveal that corruption negatively affects the banks’ lending through excessive risk rather than through their profitability. Elekdag et al. (2020) explored the determinants of profitability across large Euro-area banks by using an approach based on conditional probability distributions. Interestingly, they found that the most reliable determinant of bank profitability is real GDP growth and NPLs. As explained by the scenario with higher growth and lower NPLs, the joint materialization of higher growth and lower NPLs reduces the probability of ROE falling below 8% more than these shocks reflecting nonlinear interaction. The theoretical framework of the non-linear relationship between NPLs and bank profitability is based on the study of Seo et al. (2019), which found that the relationship between NPLs and bank profitability is non-linear, and they defined an optimal threshold. Therefore, we propose hypothesis 2 as follows:
H2. 
There is a threshold effect in the NPLs–profitability relationship.

3. Data and Empirical Strategy

In this section, we provide information about the construction of the sample used in this study and describe the empirical strategy we followed.

3.1. The Sample

To investigate the effect of the NPLs on the profitability of banks, we used a sample of conventional banks in the MENA region observed during the period of 2005–2020. Initially, the sample covered 123 banks. Due to the problem of continuity of data for the same variables, especially the NPLs ratio, some banks were excluded and the final sample was made up of 74 banks. The number of banks by country is given in Table 1.
In this study, bank profitability is measured by the net interest margin (NIM). We have used the NIM to measure the profitability of the MENA banks for the following reason. Banks activities in this region, especially in North Africa, are based on traditional activities (collection of deposits and grant of credit). Hence, the profitability of these banks is based on the interest income proxied by the interest margin (interest revenue (credit) − interest expenses (deposit)). In some cases, NPLs lead to a loss of the principal of credit and the interest; hence, we used the NIM instead of the ROA and ROE. Several prior studies have used the NIM as a measure of bank profitability (Hakimi and Zaghdoudi 2017; Hakimi and Boukaira 2020; Ben Naceur and Goaied 2008). The ratio of NPLs is used as a proxy for credit risk (Castro 2013; Dimitrios et al. 2016; Fainstein and Novikov 2011). To explain a change in the level of bank profitability, we introduce four groups of variables in the econometric model. Liquidity risk (LTD), bank size (BS), and capital adequacy ratio (CAR) refer to the main bank specifics (Maudos and Solís 2009; Cruz-García et al. 2019). Bank concentration (CONC) is included in the model as a proxy for industry specifics. The international financial environment is represented by the global financial crisis (CRISIS). The growth rate of GDP (GDPG), inflation rate (INF), and unemployment rate (UNEM) are introduced to control the macroeconomic conditions (Islam and Nishiyama 2016; López-Espinosa et al. 2011). Furthermore, we consider the variable of control of corruption (CCOR) as a proxy for the institutional quality in this region (Ben Naceur and Omran 2011). Accounting and financial variables are collected from the annual reports of each bank, i.e., the Refinitiv Eikon database. Country-level data that reflect industry specifics and macroeconomic conditions are collected from the World Bank Indicators Database.

3.2. Empirical Strategy and Model Specification

To study the effect of NPLs on the profitability of MENA banks, we followed an empirical strategy based on two steps. In the first one, we used the two-stage SGMM to investigate the NPLs–profitability relationship. This method deals with the problem of endogeneity and provides robust and more efficient results (Zhou 2014; Teixeira and Queirós 2016; Danisman and Tarazi 2020; Hakimi et al. 2020).
Since previous studies on the NPLs–profitability relationship were limited to a linear approach (Laryea et al. 2016; Panta 2018; Kosmidou 2008; Flamini et al. 2009), in the second step, we define the threshold of NPLs that affect bank profitability. For that reason, we perform a non-linear approach that uses the PSTR model developed by González et al. (2005). The PSTR model is considered an extension of the panel threshold model (PTR) of Hansen (1999). It allows defining an optimal threshold for the transition variable and makes it possible to discuss the results within at least two regimes—below and above this threshold. The econometric model to be tested is given in Equation (1):
N I M i , t = β 0 + β 1 N I M i , t 1 + β 2 N P L s i , t + β 3 L T D i , t + β 4 B S i , t + β 5 C A R i , t + β 6 C O N C i , t + β 7 C R I S I S t + β 8 G D P G i , t + β 9 I N F i , t + β 10 U N E M i , t + β 11 C C O R i , t + ε i , t
All variable definitions are given in Table 2.

3.3. Summary Statistics and Correlation Matrix

This sub-section gives summary statistics regarding the data used in this study and checks for the multicollinearity problem between independent variables. Table 3 summarizes the descriptive statistics for all variables.
The statistics displayed in Table 3 indicate that the mean value of the NIM is 2.78%, with a maximum of 48% and a minimum value of −2.95%. The average mean of NPLs is 8.1%, with a maximum value of 58.13% and a minimum value of 0.01%.
As bank specifics, the loans-to-deposits ratio (LTD), a proxy of liquidity risk, records an average ratio of 81.92%, with a maximum value of 215.32%. The mean value of bank size is 9.84, with a minimum value of 5.05 and a maximum value of 18.08. Banks in the MENA region registered an average capital adequacy ratio of 14.97%, with a maximum level of 40.35% and 1.25% as a minimum value. Based on these statistics, we can conclude that banks in the MENA region on average are well capitalized, except for some banks that recorded low and negative capital ratios.
Concerning the macroeconomic environment, the highest growth rate is 26.17%, against −21.46% as the weakest rate. The average value of the inflation rate is 3.83%, with a maximum value of 84.86% and a minimum value of −4.86%. Statistics indicate that the mean value of unemployment in the selected MENA countries is 7.63%, with a maximum rate of 18.5% and a minimum rate of 5.45%. These statistics point to an unstable macroeconomic environment in this region during the observed period of 2005–2020.
The correlation between all independent variables is given in Table 4. From this table, we can note that this correlation is very weak among all independent variables included in the econometric model. Thus, we confirm that there is no significant problem with multicollinearity.

4. Empirical Findings

As explained in the empirical strategy, firstly, this paper investigates the effect of NPLs on bank profitability using the SGMM approach. Secondly, it explores the non-linear relationship between the two variables to define the threshold of NPLs that affects the profitability of banks in the MENA region. Hence, we discuss the empirical results of the SGMM approach in the first sub-section, while the second sub-section discusses the results of the PSTR model.

4.1. Findings of the SGMM Regression

The empirical findings of the SGMM regression are displayed in Table 5. The diagnostic tests of Sargan and serial correlation tests do not reject the null hypothesis of the validity of over-identifying restrictions and the absence of correlation. Both the p-values of the Sargan test and the AR (2) test of Arellano and Bond were greater than 5% (Arellano and Bond 1991).
Results displayed in Table 5 indicate that the lagged variable of bank performance is positively and significantly correlated to the dependent variable. This result implies that bank profitability in the present year is positively dependent on the level of profitability in the previous year.
The findings indicate that the level of NPLs significantly decreases bank profitability in the MENA region. An increase of 1 percentage point in NPLs decreases bank profitability by 0.028 percentage points. Since interest income from bank assets is an important component of banks’ net income, poor asset quality adversely affects bank profitability. Hence, we accept hypothesis H1. This result is in line with Makri et al. (2014), Khan et al. (2020), and Gulati et al. (2019). Moreover, bank size is found to be positively and significantly associated with the net interest margin. A 1 percentage point increase in the bank size leads to an increase in bank profitability by 0.29 percentage points. This result indicates that large banks can generate a high NIM through bank diversification. This finding confirms the results of Gupta and Mahakud (2020) and Nguyen et al. (2020).
The coefficient of bank concentration is negative and significant. An increase of 1 percentage point in bank concentration decreases the level of bank profitability by 0.009 percentage points. In other words, a more concentrated banking section is less profitable. The efficient-structure hypothesis suggests that higher concentration does not necessarily imply market power. These results are in line with both (Berger 1995; Ben Naceur 2003; Grubišić et al. 2022; Le and Ngo 2020).
Table 5 shows that the effect of the global financial crisis on bank profitability is negative and significant at the level of 1%. The global financial crisis had a negative impact on banks’ business environment, which points to the fact that it developed from a subprime crisis to a financial crisis in the banking system all over the world, including the region investigated in this research. This result is convergent with the findings of Horobet et al. (2021) and Ozgur and Gorus (2016).
The effect of the macroeconomic conditions is not spurious. We found that GDP growth exerts a positive and significant effect, while the inflation rate significantly decreases the bank’s net interest margin. A 1 percentage point increase in the growth rate of GDP increases the net interest margin by 0.028, while an increase of 1 percentage point in the inflation rate decreases bank profitability by 0.02 percentage point. Rapid economic growth increases bank profitability. Therefore, bank profitability can support economic growth by enhancing financial stability (Demirgüç-Kunt and Huizinga 1999; Claeys and Schoors 2007; Klein and Weill 2022). However, the effect of the inflation rate on profitability depends on whether it can be anticipated or not. Moreover, if the inflation rate is an unanticipated change in the interest rate, then it should be a negative relationship (Noman et al. 2015; Ariyadasa et al. 2017).

4.2. Findings of the PSTR Regression

In this sub-section, we discuss the results of the non-linear relationship between NPLs and bank profitability. Firstly, we start with the results of the pre-tests, such as the test of linearity, the number of regimes, and the threshold value. Secondly, we discuss the results of the PSTR model.

4.2.1. The Pre-Tests of the PSTR Approach

Before testing the PSTR model, the non-linearity hypothesis should be confirmed. If this condition is confirmed, then we test the number of regimes of the transition variable and define the threshold value. The results of these three tests are given in Table 6, Table 7 and Table 8.
Table 6 shows that the null hypothesis is rejected at the 1% level for the three tests: Lagrange Multiplier (Wald test), Lagrange Multiplier (F-test), and the Likelihood-ratio test (LR). The statistics of the three tests confirm the non-linearity between credit risk (NPLs) and bank performance (NIM) in the MENA countries. Hence, hypothesis H2 is accepted. Once the non-linearity hypothesis is checked, the second step consists of testing the number of regimes. The results for the number of regimes are given in Table 7.
The test of the number of the regime is used to check if the PSTR model has one function of transition (m = 1) (null hypothesis) or if it has at least two functions of transition (m = 2) (alternative hypothesis). From Table 7, we note that both the hypothesis without a threshold (r = 0) and the hypothesis with at least two thresholds (r = 2) are rejected at the 1% significance level for the two tests. Hence, we reject the null hypothesis, and we admit that there exist at least two functions of transition and that the model has one threshold.
The third step consists of defining the optimal threshold of the transition variable (NPLs) that can affect the dependent variable (NIM). The results of the threshold value are given in Table 8.
From Table 8, we note that the threshold of NPLs that affects bank performance (NIM) in the MENA region is 4.42%. Regarding descriptive statistics, this threshold is lower than the mean value of 8.10%. Therefore, banks in MENA countries are invited to well manage their credit risk and reduce the level of NPLs.

4.2.2. Results of the PSTR Approach

The results of the PSTR model are given in Table 9. The findings of the PSTR estimation indicate that below the threshold of 4.42%, the effect of NPLs is negative but insignificant. However, on surpassing this threshold, the effect of the NPLs ratio becomes negative and significant. To attain optimal profitability without a stability trade-off, it is recommended for banks operating in the MENA region to reach a ratio of NPLs below the threshold of 4.42%.
Similar to the results of the SGMM approach, the findings of the PSTR model indicate that the coefficient of bank size is positive and significant. This means that large banks are more profitable. Increasing bank size can increase profitability by allowing banks to realize economies of scale. Moreover, increasing banks’ assets can reduce risk by diversifying operations across regions. Thus, lower risk can promote profitability by reducing losses. This result confirms the work of Alhassan et al. (2014) and Louzis et al. (2012).
Figure 1 shows both linear and non-linear relationships between NPLs and bank profitability based on the defined threshold of 4.42%.
We also found that bank concentration significantly decreases bank profitability. An increase of 1 percentage point in bank concentration decreases the NIM by 0.023 percentage points. This result means that concentration is less beneficial in terms of profitability in our sample than in that of the competition. It also indicates that higher concentration leads to lower profitability due to the monopolistic position of banks in this region. This finding is in line with Tan and Floros (2012), Yao et al. (2018), and Osuagwu (2014).
Results of the PSTR model confirm the positive effect of GDP growth on bank profitability. The coefficient of the GDPG is positive and significant at the level of 5%. An increase of 1 percentage point in the GDPG increases the NIM by 0.008 percentage points. Higher economic efficiency can be associated with economic growth, thus leading to better profitability. This is following the well-documented literature on the association between GDP growth and bank profitability (Neely and Wheelock 1997; Bikker and Hu 2002; Dietrich and Wanzenried 2011; Al-Harbi 2019). However, we find that the inflation rate is without any significant effect.
Concerning the effect of the unemployment rate, findings of the PSTR model also indicate that the coefficient of this variable is negative and significant at the 1% level. An increase of 1 percentage point in the unemployment rate decreases the NIM by 0.11 percentage points. A higher unemployment rate can increase the aggregate credit risk faced by banks and their risk aversion. Moreover, unemployment can worsen business conditions, and thus the probability of borrower default due to economic instability and uncertainty will erode bank income. Our findings are in line with Angori et al. (2019) and López-Espinosa et al. (2011).

5. Concluding Remarks and Policy Recommendations

This study aims to investigate both linear and non-linear relationships between NPLs and bank profitability across the MENA region. The study uses a sample of 74 banks located in 11 MENA countries over the 2005–2020 period, with an empirical strategy based on the SGMM regression and PSTR model.
Overall, the empirical findings of SGMM regression reveal that the level of NPLs is significantly and negatively associated with bank profitability. Regarding the effect of bank size, we found a positive and significant relationship with bank profitability. Moreover, for industry specifications, we found that the effect of the bank concentration in the MENA countries is negative and significant. Regarding the effect of the macroeconomic and financial environment, we found that the effect of the global financial crisis is negative and significant. Not surprisingly, the relationship between GDP and bank profitability is positive and significant, while the inflation rate exerts a negative impact on bank profitability.
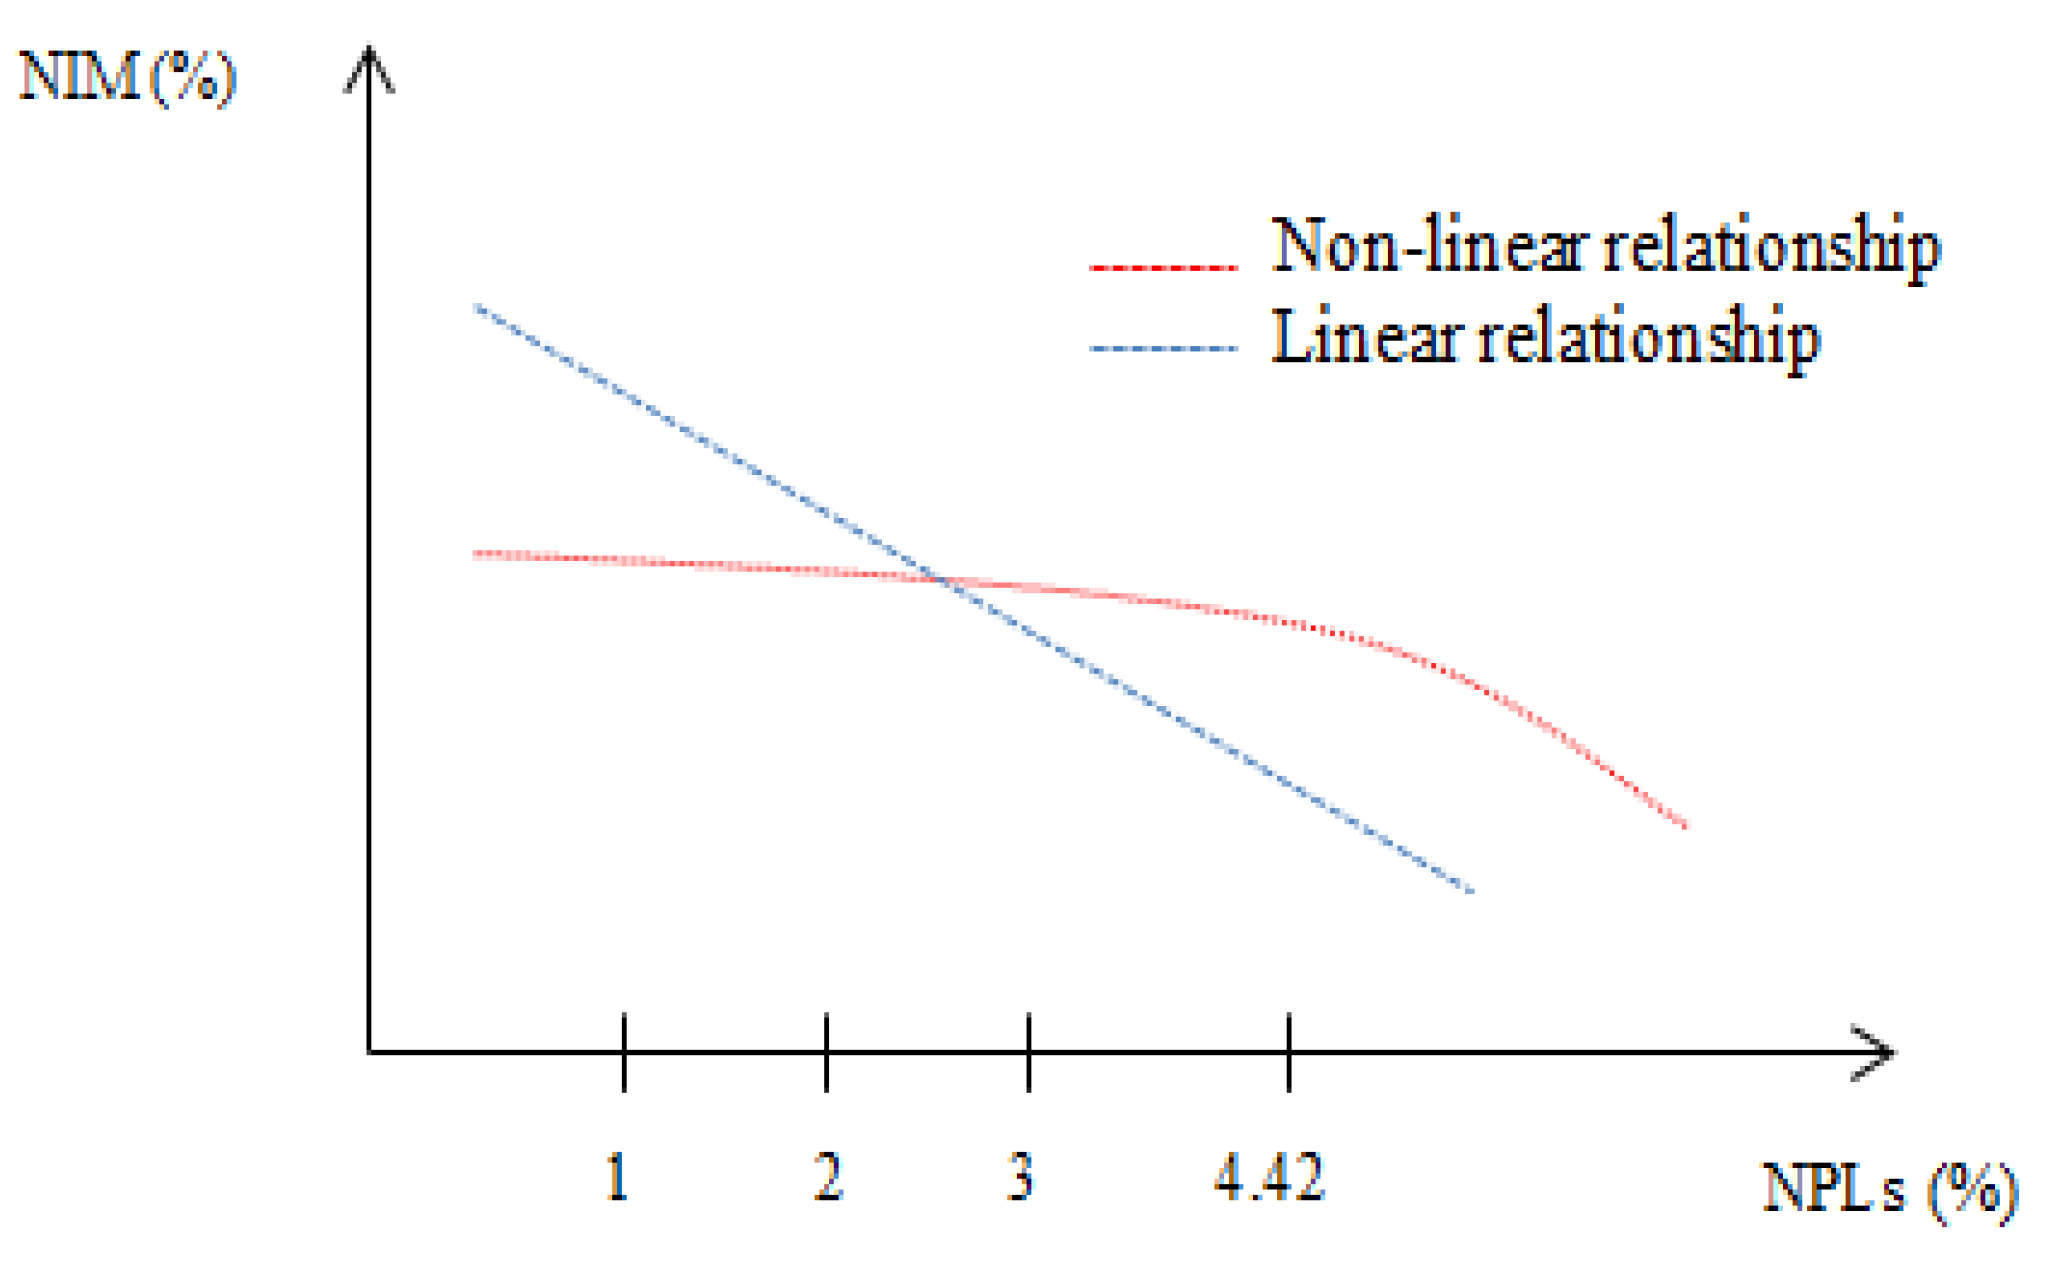
The empirical findings of a non-linear relationship based on the PSTR model confirm the existence of a threshold effect. We found that below the threshold of 4.42%, the effect of NPLs is negative but insignificant, while on surpassing this threshold, the effect becomes negative and significant. Like the SGMM results, we found that the effect of bank size is positive and significant, while bank concentration decreases bank profitability. For the effect of macroeconomic conditions, only GDP growth exerts a significant effect. The inflation rate was found to be without any significant impact.
The findings of this research have substantial implications. Firstly, by identifying these thresholds, policymakers and bankers will address appropriate interventions to adjust their credit policies. To improve their profitability, banks in this region are invited to maintain their ratios of NPLs below the defined threshold of 4.42%. Secondly, economic and fiscal policies should be directed toward creating an environment that will empower economic growth. Hence, the main factors that increase NPLs are liquidity risk and bank size as internal factors and GDP growth, inflation, and unemployment as external factors. Therefore, the regulators should pay more attention to stabilizing macroeconomic conditions. Finally, central banks are also invited to monitor banks in this region, especially large banks with high liquidity risk.
This study has some limitations regarding the regression of the whole sample, which includes banks from the Middle East and North Africa. There are several social, economic, and financial differences between the two groups of countries. In addition, to measure bank profitability, this study used the NIM. While NIM is a common measure of financial performance, especially for banks that make money from the spread between loans and deposits, it does not capture the impact on profitability from provisions to loan-loss reserves.
In future research, decomposing the whole sample into two sub-samples could improve the results of this paper. We check whether the threshold of NPLs affecting bank profitability differs across the two groups of countries or whether it remains equal to 4.42% for both banks in the Middle East and North Africa. Additionally, instead of the NIM, we will use broader measures of profitability such as ROE and ROA that seem more appropriate measures of profitability given the research questions.

Author Contributions

Conceptualization, K.A.; methodology, K.A. and E.K.; software, A.H.; validation, E.K.; formal analysis, K.A. and E.K.; investigation, K.A.; resources, K.A.; data curation, A.H.; writing—original draft preparation, K.A.; writing—review and editing, E.K.; visualization, A.H.; supervision, E.K.; project administration, E.K.; All authors have read and agreed to the published version of the manuscript.

Funding

This research received no external funding.

Institutional Review Board Statement

Not applicable.

Informed Consent Statement

Not applicable.

Data Availability Statement

Not applicable.

Conflicts of Interest

The authors declare no conflict of interest.

References

  1. Akter, Rozina, and Jewel Kumar Roy. 2017. The impacts of non-performing loan on profitability: An empirical study on banking sector of Dhaka stock exchange. International Journal of Economics and Finance 9: 126–32. [Google Scholar] [CrossRef]
  2. Albulescu, Claudiu Tiberiu. 2015. Banks’ profitability and financial soundness indicators: A macro-level investigation in emerging countries. Procedia Economics and Finance 23: 203–9. [Google Scholar] [CrossRef]
  3. Al-Harbi, Ahmad. 2019. The determinants of conventional banks profitability in developing and underdeveloped OIC countries. Journal of Economics, Finance and Administrative Science 24: 4–28. [Google Scholar] [CrossRef]
  4. Alhassan, Abdul Latif, Charles Andoh, and Anthony Kyereboah-Coleman. 2014. Asset quality in a crisis period: An empirical examination of Ghanaian banks. Review of Development Finance 4: 50–62. [Google Scholar] [CrossRef]
  5. Alqahtani, Faisal, Besma Hamdi, and Michael Skully. 2022. Nonlinear linkages between bank asset quality and profitability: Evidence from dynamic and quantile approaches using a global sample. International Journal of Managerial Finance 18: 425–44. [Google Scholar] [CrossRef]
  6. Altunbas, Yener, Ming-Hau Liu, Philip Molyneux, and Rama Seth. 2000. Efficiency and risk in Japanese banking. Journal of Banking & Finance 24: 1605–28. [Google Scholar] [CrossRef]
  7. Angori, Gabriele, David Aristei, and Manuela Gallo. 2019. Determinants of banks’ net interest margin: Evidence from the Euro area during the crisis and post-crisis period. Sustainability 11: 3785. [Google Scholar] [CrossRef]
  8. Apergis, Nicholas. 2014. The long-term role of non-traditional banking in profitability and risk profiles: Evidence from a panel of US banking institutions. Journal of International Money and Finance 45: 61–73. [Google Scholar] [CrossRef]
  9. Arellano, Manuel, and Stephen Bond. 1991. Some tests of specification for panel data: Monte Carlo evidence and an application to employment equations. The Review of Economic Studies 58: 277–97. [Google Scholar] [CrossRef]
  10. Ariyadasa, Chatura, Eliyathamby Antony Selvanathan, M. A. B. Siddique, and Saroja Selvanathan. 2017. On the profitability of commercial banks: The Sri Lankan case. Applied Economics 49: 2106–16. [Google Scholar] [CrossRef]
  11. Athanasoglou, Panayiotis P., Ioannis Asimakopoulos, and Evaggelia Georgiou. 2005. The effect of merger and acquisition announcement on Greek bank stock returns. Economic Bulletin 24: 27–44. [Google Scholar]
  12. Azzabi, Samia, Jad Benhamdane, and Andreas Kappeler. 2018. Banking Sectors in North Africa: Improving Slowly but Noticeably. In Banking in Africa: Delivering on Financial Inclusion, Supporting Financial Stability. Edited by English Unit, French Unit, Production Management Unit, Nathalie Glison and Gabriela Donini. Luxembourg: Europea Investemtn Bank. Available online: https://www.eib.org/en/publications/economic-report-banking-in-africa-delivering-on-financial-inclusion-supporting-financial-stability (accessed on 10 December 2022).
  13. Ballouk, Houssein, Sami Ben Jabeur, Sabri Boubaker, and Salma Mefteh-Wali. 2022. The effect of social media on bank performance: An fsQCA approach. Electronic Commerce Research, 1–19. [Google Scholar] [CrossRef]
  14. Banker, Rajiv D., Hsihui Chang, and Seok-Young Lee. 2010. Differential impact of Korean banking system reforms on bank productivity. Journal of Banking & Finance 34: 1450–60. [Google Scholar] [CrossRef]
  15. Beck, Roland, Petr Jakubik, and Anamaria Piloiu. 2015. Key determinants of non-performing loans: New evidence from a global sample. Open Economies Review 26: 525–50. [Google Scholar] [CrossRef]
  16. Ben Ali, Sami, Fredj Fhima, and Ridha Nouira. 2020. How does corruption undermine banking stability? A threshold nonlinear framework. Journal of Behavioral and Experimental Finance 2020: 100365. [Google Scholar] [CrossRef]
  17. Ben Naceur, Samy. 2003. The Determinants of the Tunisian Banking Industry Profitability: Panel Evidence. Universite Libre de Tunis Working Papers 10. Tunis: Universite Libre de Tunis. [Google Scholar]
  18. Ben Naceur, Sami, and Mohamed Goaied. 2008. The determinants of commercial bank interest margin and profitability: Evidence from Tunisia. Frontiers in Finance and Economics 5: 106–30. [Google Scholar] [CrossRef]
  19. Ben Naceur, Sami, and Mohammed Omran. 2011. The effects of bank regulations, competition, and financial reforms on banks’ performance. Emerging Markets Review 12: 1–20. [Google Scholar] [CrossRef]
  20. Berger, Allen N. 1995. The profit-structure relationship in banking--tests of market-power and efficient-structure hypotheses. Journal of Money, Credit and Banking 27: 404–31. [Google Scholar] [CrossRef]
  21. Berger, Allen N., and Robert DeYoung. 1997. Problem loans and cost efficiency in commercial banks. Journal of Banking & Finance 21: 849–70. [Google Scholar] [CrossRef]
  22. Bikker, Jacob A., and Haixia Hu. 2002. Cyclical patterns in profits, provisioning and lending of banks and procyclicality of the new Basel capital requirements. PSL Quarterly Review 55: 221. [Google Scholar]
  23. Bolarinwa, Segun Thompson, Olufemi Bodunde Obembe, and Clement Olaniyi. 2019. Re-examining the determinants of bank profitability in Nigeria. Journal of Economic Studies 46: 633–51. [Google Scholar] [CrossRef]
  24. Bolarinwa, Segun Thompson, Richard Olaolu Olayeni, and Xuan Vinh Vo. 2021. Is there a nonlinear relationship between nonperforming loans and bank profitability? Evidence from dynamic panel threshold. Managerial and Decision Economics 42: 649–61. [Google Scholar] [CrossRef]
  25. Boubaker, Sabri, Duc Trung Do, Helmi Hammami, and Kim Cuong Ly. 2022a. The role of bank affiliation in bank efficiency: A fuzzy multi-objective data envelopment analysis approach. Annals of Operations Research, 1–29. [Google Scholar] [CrossRef]
  26. Boubaker, Sabri, Tu D. Q. Le, and Thanh Ngo. 2022b. Managing bank performance under COVID-19: A novel inverse DEA efficiency approach. International Transactions in Operational Research. [Google Scholar] [CrossRef]
  27. Bourke, Philip. 1989. Concentration and other determinants of bank profitability in Europe, North America and Australia. Journal of Banking & Finance 13: 65–79. [Google Scholar] [CrossRef]
  28. Castro, Vítor. 2013. Macroeconomic determinants of the credit risk in the banking system: The case of the GIPSI. Economic Modelling 31: 672–83. [Google Scholar] [CrossRef]
  29. Claeys, Sophie, and Koen Schoors. 2007. Bank supervision Russian style: Evidence of conflicts between micro-and macro-prudential concerns. Journal of Comparative Economics 35: 630–57. [Google Scholar] [CrossRef]
  30. Çollaku, Besmir, and Muhamet Aliu. 2021. Impact of Non-Performing Loans on Bank’s Profitability: Empirical Evidence from Commercial Banks in Kosovo. Journal of Accounting, Finance and Auditing Studies 7: 226–42. [Google Scholar] [CrossRef]
  31. Cruz-García, Paula, Juan Fernandez de Guevara, and Joaquín Maudos. 2019. Determinants of bank’s interest margin in the aftermath of the crisis: The effect of interest rates and the yield curve slope. Empirical Economics 56: 341–65. [Google Scholar] [CrossRef]
  32. Danisman, Ozturk Danisman, and Amine Tarazi. 2020. Financial inclusion and bank stability: Evidence from Europe. The European Journal of Finance 26: 1842–55. [Google Scholar] [CrossRef]
  33. Demirgüç-Kunt, Ash, and Harry Huizinga. 1999. Determinants of commercial bank interest margins and profitability: Some international evidence. The World Bank Economic Review 13: 379–408. [Google Scholar] [CrossRef]
  34. Dietrich, Andreas, and Gabrielle Wanzenried. 2011. Determinants of bank profitability before and during the crisis: Evidence from Switzerland. Journal of International Financial Markets, Institutions and Money 21: 307–27. [Google Scholar] [CrossRef]
  35. Dimitrios, Anastasiou, Louri Helen, and Tsionas Mike. 2016. Determinants of non-performing loans: Evidence from Euro-area countries. Finance Research Letters 18: 116–19. [Google Scholar] [CrossRef]
  36. Elekdag, Selim, Sheheryar Malik, and Srobona Mitra. 2020. Breaking the bank? A probabilistic assessment of Euro area bank profitability. Journal of Banking & Finance 120: 105949. [Google Scholar] [CrossRef]
  37. Fainstein, Grigori, and Igor Novikov. 2011. The comparative analysis of credit risk determinants in the banking sector of the Baltic States. Review of Economics & Finance 1: 20–45. [Google Scholar]
  38. Fan, Linbo, and Sherrill Shaffer. 2004. Efficiency versus risk in large domestic US banks. Managerial Finance 30: 1–19. [Google Scholar] [CrossRef]
  39. Flamini, Valentina, Calvin A. McDonald, and Liliana B. Schumacher. 2009. The Determinants of Commercial Bank Profitability in Sub-Saharan Africa. IMF Working Paper No. 09/15. Available online: https://ssrn.com/abstract=1356442 (accessed on 8 December 2022).
  40. Foos, Daniel, Lars Norden, and Martin Weber. 2010. Loan growth and riskiness of banks. Journal of Banking & Finance 34: 2929–40. [Google Scholar] [CrossRef]
  41. Garcia, Maria Teresa Medeiros, and João Pedro Silva Martins Guerreiro. 2016. Internal and external determinants of banks’ profitability: The Portuguese case. Journal of Economic Studies 43: 90–107. [Google Scholar] [CrossRef]
  42. Ghosh, Amit. 2015. Banking-industry specific and regional economic determinants of non-performing loans: Evidence from US states. Journal of Financial Stability 20: 93–104. [Google Scholar] [CrossRef]
  43. Girardone, Claudia, Philip Molyneux, and Edward P. M. Gardener. 2004. Analysing the determinants of bank efficiency: The case of Italian banks. Applied Economics 36: 215–27. [Google Scholar] [CrossRef]
  44. Godlewski, Christophe J. 2005. Bank capital and credit risk taking in emerging market economies. Journal of banking Regulation 6: 128–45. [Google Scholar] [CrossRef]
  45. González, A., Timo Teräsvirta, and Dick van Dijk. 2005. Panel Smooth Transition Regression Model. SSE/EFI Working Paper Series in Economics and Finance No 604, Stockholm School of Economics. Available online: https://EconPapers.repec.org/RePEc:hhs:hastef:0604 (accessed on 8 December 2022).
  46. Goswami, Anju. 2022. Does credit risk persist in the Indian banking industry? Recent evidence. Asian Journal of Economics and Banking 6: 178–97. [Google Scholar] [CrossRef]
  47. Grubišić, Zoran, Sandra Kamenković, and Tijana Kaličanin. 2022. Market Power and Bank Profitability: Evidence from Montenegro and Serbia. Journal of Central Banking Theory and Practice 11: 5–22. [Google Scholar] [CrossRef]
  48. Gulati, Rachita, Anju Goswami, and Sunil Kumar. 2019. What drives credit risk in the Indian banking industry? An empirical investigation. Economic Systems 43: 42–62. [Google Scholar] [CrossRef]
  49. Gupta, Neeraj, and Jitendra Mahakud. 2020. Ownership, bank size, capitalization, and bank performance: Evidence from India. Cogent Economics & Finance 8: 1808282. [Google Scholar] [CrossRef]
  50. Hakimi, Abdelaziz, and S. A. Boukaira. 2020. On the relationship between operational risk and Tunisian banks performance: Does the interaction between the other risks matter? Business and Economics Research Journal 11: 107–18. [Google Scholar] [CrossRef]
  51. Hakimi, Abdelaziz, and Khemais Zaghdoudi. 2017. Liquidity risk and bank performance: An empirical test for Tunisian banks. Business and Economic Research 7: 46–57. [Google Scholar] [CrossRef]
  52. Hakimi, Abdelaziz, Rim Boussaada, and Majdi Karmani. 2020. Is the relationship between corruption, government stability and non-performing loans non-linear? A threshold analysis for the MENA region. International Journal of Finance & Economics 27: 4383–98. [Google Scholar] [CrossRef]
  53. Hansen, Bruce E. 1999. Threshold effects in non-dynamic panels: Estimation, testing, and inference. Journal of econometrics 93: 345–68. [Google Scholar] [CrossRef]
  54. Horobet, Alexandra, Magdalena Radulescu, Lucian Belascu, and Sandra Maria Dita. 2021. Determinants of bank profitability in CEE countries: Evidence from GMM panel data estimates. Journal of Risk and Financial Management 14: 307. [Google Scholar] [CrossRef]
  55. IMF. 2021. Regional Economic Outlook Update: Middle East and Central Asia. Arising from the Pandemic: Building Forward Better. Washington, DC: International Monetary Fund. Available online: https://www.imf.org/en/Publications/REO/MECA/Issues/2021/04/11/regional-economic-outlook-middle-east-central-asia (accessed on 13 December 2022).
  56. Islam, Md Shahidul, and Shin-Ichi Nishiyama. 2016. The determinants of bank net interest margins: A panel evidence from South Asian countries. Research in International Business and Finance 37: 501–14. [Google Scholar] [CrossRef]
  57. Kaaya, Indiael, and Dickson Pastory. 2013. Credit Risk and Commercial Banks Performance in Tanzania: A Panel Data Analysis. Research Journal of Finance and Accounting 4: 55–63. [Google Scholar]
  58. Khan, Muhammad Asif, Asima Siddique, and Zahid Sarwar. 2020. Determinants of non-performing loans in the banking sector in developing state. Asian Journal of Accounting Research 5: 135–45. [Google Scholar] [CrossRef]
  59. Kithinji, Angela M. 2010. Credit Risk Management and Profitability of Commercial Banks in Kenya. Nairobi: School of Business, University of Nairobi. [Google Scholar]
  60. Kjosevski, Jordan, Mihail Petkovski, and Elena Naumovska. 2019. Bank-specific and macroeconomic determinants of non-performing loans in the Republic of Macedonia: Comparative analysis of enterprise and household NPLs. Economic Research-Ekonomska Istrazivanja 32: 1185–203. [Google Scholar] [CrossRef]
  61. Klein, Paul-Olivier, and Laurent Weill. 2022. Bank profitability and economic growth. The Quarterly Review of Economics and Finance 84: 183–99. [Google Scholar] [CrossRef]
  62. Kohlscheen, Emanuel, Andrés Murcia Pabón, and Julieta Contreras. 2018. Determinants of Bank Profitability in Emerging Markets. BIS Working Paper No. 686. Available online: https://ssrn.com/abstract=3098196 (accessed on 13 December 2022).
  63. Koju, Laxmi, Ram Koju, and Shouyang Wang. 2018. Does banking management affect credit risk? Evidence from the Indian banking system. International Journal of Financial Studies 6: 67. [Google Scholar] [CrossRef]
  64. Kolapo, T. Funso, R. Kolade Ayeni, and M. Ojo Oke. 2012. Credit Risk and Commercial Banks’ Performance in Nigeria: A Panel Model Approach. Australian Journal of Business and Management Research 2: 31. [Google Scholar]
  65. Kosmidou, Kyriaki. 2008. The determinants of banks’ profits in Greece during the period of EU financial integration. Managerial Finance 34: 146–59. [Google Scholar] [CrossRef]
  66. Kumar, Ronald Ravinesh, Peter Josef Stauvermann, Arvind Patel, and Selvin Sanil Prasad. 2018. Determinants of non-performing loans in banking sector in small developing island states: A study of Fiji. Accounting Research Journal 31: 192–213. [Google Scholar] [CrossRef]
  67. Kumar, Vijay, Sanjeev Acharya, and Ly Th Ho. 2020. Does monetary policy influence the profitability of banks in New Zealand? International Journal of Financial Studies 8: 35. [Google Scholar] [CrossRef]
  68. Kusi, Baah Aye, Lydia Adzobu, Alex Kwame Abasi, and Kwadjo Ansah-Adu. 2020. Sectoral Loan Portfolio Concentration and Bank Stability: Evidence from an Emerging Economy. Journal of Emerging Market Finance 19: 66–99. [Google Scholar] [CrossRef]
  69. Laryea, Esther, Matthew Ntow-Gyamfi, and Angela Azumah Alu. 2016. Nonperforming loans and bank profitability: Evidence from an emerging market. African Journal of Economic and Management Studies 7: 462–81. [Google Scholar] [CrossRef]
  70. Lata, Rabeya S. 2014. Non-performing loan and its impact on profitability of state-owned commercial banks in Bangladesh: An empirical study. Paper presented at the 11th Asian Business Research Conference, Dhaka, Bangladesh, December 26–27; pp. 26–27. [Google Scholar]
  71. Le, Tu D. Q., and Thanh Ngo. 2020. The determinants of bank profitability: A cross-country analysis. Central Bank Review 20: 65–73. [Google Scholar] [CrossRef]
  72. López-Espinosa, Germán, Antonio Moreno, and Fernando Peréz de Gracia. 2011. Banks’ net interest margin in the 2000s: A macro-accounting international perspective. Journal of International Money and Finance 30: 1214–33. [Google Scholar] [CrossRef]
  73. Louzis, Dimitrios P., Angelos T. Vouldis, and Vasilios L. Metaxas. 2012. Macroeconomic and bank-specific determinants of non-performing loans in Greece: A comparative study of mortgage, business and consumer loan portfolios. Journal of Banking & Finance 36: 1012–27. [Google Scholar] [CrossRef]
  74. Makri, Vasiliki, Athanasios Tsagkanos, and Athanasios Bellas. 2014. Determinants of non-performing loans: The case of Eurozone. Panoeconomicus 61: 193–206. [Google Scholar] [CrossRef]
  75. Manz, Florian. 2019. Determinants of non-performing loans: What do we know? A systematic review and avenues for future research. Management Review Quarterly 69: 351–89. [Google Scholar] [CrossRef]
  76. Maudos, Joaquin, and Liliana Solís. 2009. The determinants of net interest income in the Mexican banking system: An integrated model. Journal of Banking & Finance 33: 1920–31. [Google Scholar] [CrossRef]
  77. Merhbene, Dorsaf Elbir. 2021. The Relationship between Non-Performing Loans, Banking System Stability and Economic Activity: The Case of Tunisia (No. 03-2021). Graduate Institute of International and Development Studies Working Paper. Available online: http://hdl.handle.net/10419/238094 (accessed on 10 December 2022).
  78. Messai, Ahlem Selma, and Fathi Jouini. 2013. Micro and macro determinants of non-performing loans. International Journal of Economics and Financial Issues 3: 852–60. Available online: https://dergipark.org.tr/en/pub/ijefi/issue/31960/351961?publisher=http-www-cag-edu-tr-ilhan-ozturk (accessed on 5 December 2022).
  79. Mirzaei, Ali, Tomoe Moore, and Guy Liu. 2013. Does market structure matter on banks’ profitability and stability? Emerging vs. advanced economies. Journal of Banking & Finance 37: 2920–37. [Google Scholar] [CrossRef]
  80. Molyneux, Philip, and John Thornton. 1992. Determinants of European bank profitability: A note. Journal of banking & Finance 16: 1173–78. [Google Scholar] [CrossRef]
  81. Naili, Maryem, and Younes Lahrichi. 2022. The determinants of banks’ credit risk: Review of the literature and future research agenda. International Journal of Finance & Economics 27: 334–60. [Google Scholar] [CrossRef]
  82. Natsir, Muhammad, Wahyoe Soedarmono, Wahdi Salasi April Yudhi, Irwan Trinugroho, and Ari Warokka. 2019. Foreign penetration, competition, and credit risk in banking. Borsa Istanbul Review 19: 249–57. [Google Scholar] [CrossRef]
  83. Neely, Michelle Clark, and David C. Wheelock. 1997. Why does bank performance vary across states? Federal Reserve Bank of St. Louis Review 79: 27–40. [Google Scholar]
  84. Neves, Maria Elisabete, Catarina Proença, and António Dias. 2020. Bank profitability and efficiency in Portugal and Spain: A non-linearity approach. Journal of Risk and Financial Management 13: 284. [Google Scholar] [CrossRef]
  85. Nguyen, Thai Vu Hong, Tra Thi Thu Pham, and Canh Phuc Nguyen. 2020. Excess Liquidity and Net interest Margins: Evidence from Vietnamese Banks. Journal of Economics and Business 110: 105893. [Google Scholar] [CrossRef]
  86. Noman, Abu Hanifa Md, Mustafa Manir Chowdhury, Najneen Jahan Chowdhury, Mohammad Jonaed Kabir, and Sajeda Pervin. 2015. The effect of bank specific and macroeconomic determinants of banking profitability: A study on Bangladesh. International Journal of Business and Management 10: 287. [Google Scholar] [CrossRef]
  87. Olson, Dennis, and Taisier A. Zoubi. 2011. Efficiency and bank profitability in MENA countries. Emerging Markets Review 12: 94–110. [Google Scholar] [CrossRef]
  88. Onofrei, Mihaela, Ionel Bostan, Angela Roma, and Bogdan-Narcis Firtescu. 2018. The Determinants of Commercial Bank Profitability in CEE Countries. Romanian Statistical Review 2: 33–46. [Google Scholar]
  89. Orlando, Giuseppe, and Roberta Pelosi. 2020. Non-performing loans for Italian companies: When time matters. an empirical research on estimating probability to default and loss given default. International Journal of Financial Studies 8: 68. [Google Scholar] [CrossRef]
  90. Osuagwu, Eze Simpson. 2014. Determinants of bank profitability in Nigeria. International Journal of Economics and Finance 6: 12. [Google Scholar] [CrossRef]
  91. Ozgur, Onder, and Muhammed Sehid Gorus. 2016. Determinants of deposit bank profitability: Evidence from Turkey. Journal of Applied Economics and Business Research 6: 218–31. [Google Scholar]
  92. Ozurumba, Benedict Anayochukwu. 2016. Impact of Non-Performing Loans on the Performance of Selected Commercial Banks in Nigeria. Research Journal of Finance and Accounting 7: 95–109. Available online: http://www.iiste.org/Journals/index.php/RJFA/article/viewFile/32749/33640 (accessed on 3 December 2022).
  93. Panta, Bishop. 2018. Non-performing loans and bank profitability: Study of joint venture banks in Nepal. International Journal of Sciences: Basic and Applied Research (IJSBAR) 42: 151–65. Available online: https://ssrn.com/abstract=3304961 (accessed on 20 November 2022).
  94. Pasiouras, Fotios, and Kyriaki Kosmidou. 2007. Factors influencing the profitability of domestic and foreign commercial banks in the European Union. Research in International Business and Finance 21: 222–37. [Google Scholar] [CrossRef]
  95. Pop, Ionuț Daniel, Cosmin Octavian Cepoi, and Dan Gabriel Anghel. 2018. Liquidity-threshold effect in non-performing loans. Finance Research Letters 27: 124–28. [Google Scholar] [CrossRef]
  96. Rahbar, Farhad, and Mohsen Behzadi Soufiani. 2021. The Impact of Macroeconomic and Banking Variables on Non-Performing Loans in Oil Cycles: Evidence from Iran. Journal of Money and Economy 16: 135–64. Available online: http://jme.mbri.ac.ir/article-1-538-en.html (accessed on 28 November 2022). [CrossRef]
  97. Reinhart, Carmen M., and Kenneth S. Rogoff. 2011. From financial crash to debt crisis. American Economic Review 101: 1676–706. [Google Scholar] [CrossRef]
  98. Rosenkranz, Peter, and Junkyu Lee. 2019. Nonperforming Loans in Asia: Determinants and Macrofinancial Linkages. ADB Economics Working Paper Series 574; Central Jakarta: Asian Development Bank. [Google Scholar] [CrossRef]
  99. Seo, Myung Hwan, Sueyoul Kim, and Young-Joo Kim. 2019. Estimation of dynamic panel threshold model using Stata. Stata Journal 19: 685–97. [Google Scholar] [CrossRef]
  100. Serrano, Antonio Sánchez. 2021. The impact of non-performing loans on bank lending in Europe: An empirical analysis. The North American Journal of Economics and Finance 2020: 101312. [Google Scholar] [CrossRef]
  101. Short, Brock K. 1979. The relation between commercial bank profit rates and banking concentration in Canada, Western Europe, and Japan. Journal of Banking & Finance 3: 209–19. [Google Scholar] [CrossRef]
  102. Swandewi, Ni Kadek Mareti, and Ni Ketut Purnawati. 2021. Capital Adequacy Ratio Mediates the Effect of Non-Performing Loan on Returns on Assets in Public Commercial Banks. American Journal of Humanities and Social Sciences Research (AJHSSR) 5: 651–56. [Google Scholar]
  103. Tan, Yong, and Christos Floros. 2012. Bank profitability and inflation: The case of China. Journal of Economic Studies 39: 675–96. [Google Scholar] [CrossRef]
  104. Teixeira, Aurora A. C., and Anabela S. S. Queirós. 2016. Economic growth, human capital and structural change: A dynamic panel data analysis. Research Policy 45: 1636–48. [Google Scholar] [CrossRef]
  105. Thornton, John, and Caterina Di Tommaso. 2021. The effect of non-performing loans on credit expansion: Do capital and profitability matter? Evidence from European banks. International Journal of Finance & Economics 26: 4822–39. [Google Scholar] [CrossRef]
  106. Tölö, Eero, and Matti Virén. 2021. How much do non-performing loans hinder loan growth in Europe? European Economic Review 136: 103773. [Google Scholar] [CrossRef]
  107. Ugoani, John. 2016. Nonperforming loans portfolio and its effect on bank profitability in Nigeria. Independent Journal of Management & Production 7: 2. [Google Scholar] [CrossRef]
  108. Vinh, Nguyen Thi Hong. 2017. The impact of non-performing loans on bank profitability and lending behavior: Evidence from Vietnam. Journal of Economic Development 24: 27–44. [Google Scholar] [CrossRef]
  109. Vithessonthi, Chaiporn. 2016. Deflation, bank credit growth, and non-performing loans: Evidence from Japan. International Review of Financial Analysis 45: 295–305. [Google Scholar] [CrossRef]
  110. Yao, Hongxing, Muhammad Haris, and Gulzara Tariq. 2018. Profitability determinants of financial institutions: Evidence from banks in Pakistan. International Journal of Financial Studies 6: 53. [Google Scholar] [CrossRef]
  111. Yüksel, Serhat, Shahriyar Mukhtarov, Elvin Mammadov, and Mustafa Özsarı. 2018. Determinants of Profitability in the Banking Sector: An Analysis of Post-Soviet Countries. Economies 6: 41. [Google Scholar] [CrossRef]
  112. Zhou, Kaiguo. 2014. The effect of income diversification on bank risk: Evidence from China. Emerging Markets Finance and Trade 50: 201–13. [Google Scholar] [CrossRef]
Figure 1. Linear and non-linear relationship between NPLs and bank profitability.
Ijfs 11 00064 g001
Table 1. Number of banks by country.
Middle East and North Africa
CountriesNumber of Banks
Bahrain4
Jordan13
Kuwait5
Lebanon4
Oman4
Qatar4
Saudi Arabia8
United Arab Emirates14
Egypt4
Morocco4
Tunisia10
Number of banks74
Table 2. Variables, definitions, and measurement.
VariablesDefinitionsMeasurement
Dependent variables (NIM)
NIMNet interest margin ratioNet interest income/total assets (%)
Bank specifics
NPLsNon-performing loansBank non-performing loans to gross loans (%)
BSBank sizeNatural logarithm of total assets
CARCapital adequacy ratioBank capital to total assets (%)
LTDLiquidity riskLoans to deposits ratio (%)
Industry specifics
CONCBank concentrationAssets of the three largest banks as a share of total banking assets (%)
Financial environment and macroeconomic conditions and institutional quality
CRISISThe Global Financial Crisis of 2008The dummy variable takes 0 before the crisis of 2008 and 1 after
GDPGThe growth rate of GDPThe annual growth rate of GDP (%)
INFThe inflation rateConsumer price index (%)
UNEMUnemployment rate Total unemployment rate (%)
CCORThe control of corruptionThe score of the World Bank ranges between −2.5 and 2.5
Table 3. Descriptive statistics.
VariableMeanStd. Dev.Min.Max.
NIM2.782.77−2.9548.00
NPLs8.107.600.0158.13
LTD81.9227.621.43215.32
BS9.842.605.0418.08
CAR14.975.091.2540.35
CONC68.8519.1440.21100.00
CRISIS0.810.390.001.00
GDPG3.254.39−21.4626.17
INF3.836.24−4.8684.86
UNEM7.635.450.1118.50
CCOR0.180.58−1.141.56
Table 4. Correlation matrix.
NPLsLTDBSCARCONCGDPGINFUNEMCCOR
NPLs1.0000
LTD0.2012 *1.0000
0.0000
BS−0.2606 *−0.3108 *1.0000
0.00000.0000
CAR−0.2165 *−0.2327 *−0.01681.0000
0.00000.00000.3690
CONC−0.0440−0.1100 *−0.2007 *0.0720 *1.0000
0.22840.00070.00000.0146
GDPG−0.0568−0.0604−0.0866 *0.02330.01021.0000
0.12080.06370.00330.43070.4287
INF0.1579 *−0.1887 *0.0856 *−0.0928 *0.1158 *−0.1087 *1.0000
0.00000.00000.00460.00210.00010.0003
UNEM0.2711 *0.0575−0.3204 *−0.2395 *−0.1103 *−0.1434 *0.0977 *1.0000
0.00000.07730.00000.00000.00020.00000.0012
CCOR−0.1858 *0.2317 *−0.2042 *0.2631 *0.0690 *0.1523 *−0.2633 *−0.4814 *1.0000
0.00000.00000.00000.00000.01920.00000.00000.0000
***, ** and * indicate the level of significance at 1%, 5%, and 10%, respectively.
Table 5. Results of the SGMM regression.
NIMCoef.Std. Errs.Zp > z
NIM (−1)0.2450.0574.3100.000 ***
NPLs−0.0280.006−4.6100.000 ***
LTD0.0060.0015.3300.000 ***
BS0.2980.0446.7300.000 ***
CAR0.0140.0091.5100.131
CONC−0.0090.001−10.0800.000 ***
CRISIS−0.9120.132−6.9000.000 ***
GDPG0.0280.0064.7400.000 ***
INF−0.0200.007−2.8100.005 ***
UNEM0.0160.0131.2300.217
CCOR−0.1910.209−0.9200.360
_cons−0.9350.354−2.6400.008 ***
AR (1) −1.610
Prob > z 0.107
AR (2) 0.528
Prob > z 0.597
Sargan test 22.122
Prob > chi2 0.985
Obs 924
***, ** and * indicate the level of significance at 1%, 5%, and 10%, respectively.
Table 6. Test of linearity.
Transition VariablesNPLs → NIM
TestsStatisticsp-Value
Lagrange Multiplier Wald Test29.4510.000 ***
Lagrange Multiplier F-Test2.7880.000 ***
Likelihood-ratio Test31.4030.000 ***
*** Indicates the level of significance at 1%.
Table 7. Test of the number of regimes.
Transition VariablesNPLs → NIM
HypothesesTestsStatisticsp-Value
(1) H0: r = 0; H1: r = 1LRT35.0800.003 ***
F3.1680.000 ***
(2) H0: r = 1; H1: r = 2LRT59.9720.001 ***
F3.6650.000 ***
*** Indicates the level of significance at 1%.
Table 8. Results of threshold values.
NPLs → NIM
γ 0.200
4.42%
AIC−1.134
BIC−0.846
Table 9. Results of the PSTR regression.
VariableCoeffStd ErrorT-StatSignif
LTD0.0190.0044.3270.000 ***
BS0.3240.1941.6720.096 *
CAR0.0020.0370.0500.960
CONC−0.0230.008−3.0560.003 ***
CRISIS−3.5660.522−6.8380.000 ***
GDPG0.0800.0332.4030.017 **
INF0.0330.0440.7460.457
UNEM−0.1100.039−2.8360.005 ***
CCOR0.2740.4360.6290.530
NPLs < 4.42%−0.0960.088−1.0890.277
NPLs > 4.42%−0.1770.064−2.7600.006 ***
Y0.200
C4.42%
AIC−1.134
BIC−0.846
Obs926
***, ** and * indicate the level of significance at 1%, 5%, and 10%, respectively.
Disclaimer/Publisher’s Note: The statements, opinions and data contained in all publications are solely those of the individual author(s) and contributor(s) and not of MDPI and/or the editor(s). MDPI and/or the editor(s) disclaim responsibility for any injury to people or property resulting from any ideas, methods, instructions or products referred to in the content.

