Article

Overreaction in a Frontier Market: Evidence from the Ho Chi Minh Stock Exchange

1
School of Economics, Can Tho University, Can Tho 94115, Vietnam
2
RELLIS Campus, Texas A&M University, Bryan, TX 77807, USA
*
Author to whom correspondence should be addressed.
Int. J. Financial Stud. 2023, 11(2), 58; https://doi.org/10.3390/ijfs11020058
Submission received: 14 February 2023 / Revised: 13 March 2023 / Accepted: 22 March 2023 / Published: 29 March 2023

Abstract

:
The purpose of the study is to investigate the overreaction hypothesis in relation to the Ho Chi Minh Stock Exchange (HOSE). The data used in this study consist of a monthly price series of 392 stocks traded on the HOSE, covering the period starting on 5 January 2004 through to 30 June 2021. The findings derived from the tests examining the differences in excess returns across the winner and loser portfolios confirm that the overreaction phenomenon exists in the HOSE. More specifically, following the creations of the portfolios, the loser portfolio outperformed the winner portfolio by 1.80% and 2.17% in the second and third month, respectively. In addition, the differences in cumulative abnormal returns between the loser and winner portfolios were significantly positive for almost all tracking periods. These findings support the hypothesis that the Vietnam stock market is inefficient in its weak form. Based on these results, we suggest that investors can earn abnormal returns by using contrarian trading strategies in the Vietnam stock market.
Keywords:
overreaction; HOSE

1. Introduction

For decades, anomalies in stock returns have been extensively studied and documented in the financial literature. Regarding such anomalies, the overreaction effect has been considered as one of the most important patterns, and it has been found in many studies that concern both developed and emerging stock markets (De Bondt and Thaler 1985; Howe 1986; Chopra et al. 1992; Otchere and Chan 2003; Wang et al. 2004; Ma et al. 2005; Lobe and Rieks 2011; Musnadi et al. 2018; Lerskullawat and Ungphakorn 2019). The stock market overreaction hypothesis posits that extreme price movements in a stock are followed by a subsequent reversal in the opposite direction (De Bondt and Thaler 1985). If the overreaction hypothesis is correct, investors can earn excess returns by employing contrarian strategies; thus, empirical studies focusing on stock market overreaction provide important insights and implications for market practitioners and academics alike.
Established on 28 July 2000, the Ho Chi Minh Stock Exchange (HOSE) was the first and largest stock exchange in Vietnam. Although the Vietnamese market is currently experiencing rapid growth, at the first trading session, only two stocks were traded; these stocks had a total market capitalization of 444,000 million Vietnam Dong (VND) (about USD 19.37 million) (Nguyen and Truong 2020). Initially, the growth in the number of listed companies on the exchange was slow. In fact, at the end of 2001, only 10 companies listed their stocks on the market. Despite this slow initial growth, over the last two decades, the HOSE has experienced rapid growth as more companies went public. By the end of 2020, a total of 392 joint-stock companies, with a total market capitalization of USD 178.04 billion, were listed on the exchange. According to the MSCI (Morgan Stanley Capital International) 2020 annual market classification, the HOSE is a member of the frontier markets group.
Although the overreaction hypothesis has been extensively investigated and applied to both developed and emerging stock markets (De Bondt and Thaler 1985; Chopra et al. 1992; Chang et al. 1995; Otchere and Chan 2003; Wang et al. 2004; Ma et al. 2005; Tripathi and Aggarwal 2009; Lobe and Rieks 2011; Piccoli et al. 2017; Musnadi et al. 2018; Lerskullawat and Ungphakorn 2019), to our knowledge, no study on this anomaly has been conducted on frontier stock markets. To address this research gap in the financial literature, this study tests the hypothesis of overreaction by applying it to the HOSE, a frontier market. The HOSE provides fertile ground for a unique investigation of the overreaction effect due to the fact that the market has been characterized by small individual investors (who dominate the market) and a low level of information transparency (Nguyen et al. 2022; Truong et al. 2022). These characteristics could make the market more inefficient; therefore, it is expected that the overreaction effect is more pronounced on the HOSE.
Based on the empirical literature and characteristics of the market, we hypothesized that the overreaction effect is present in the HOSE. This hypothesis was tested by using a monthly price series of 392 stocks during the period from 5 January 2004 to 30 June 2021. Using the same method as De Bondt and Thaler (1985), it was found that the overreaction effect exists in the HOSE and investors can earn abnormal returns by using contrarian trading strategies. The remainder of this paper is organized as follows: Section 2 reviews the empirical literature. Section 3 describes the data used in the study, as well as the research methodology. Section 4 discusses the empirical results. Finally, Section 5 concludes the study.

2. Literature Review

Over the last four decades, the overreaction hypothesis has been examined and extensively tested in relation to most market categories, including developed and emerging stock markets. The majority of these studies investigate the long-term overreaction effect in the U.S. market. The first empirical analysis that provided evidence for stock market overreaction was conducted by De Bondt and Thaler (1985). Using the New York Stock Exchange’s common stock monthly returns for the period January 1926 to December 1982, they created two portfolios, which they called “winner” and “loser” portfolios; portfolios were categorized in accordance with the excess returns of all the stocks in their sample. They tracked these portfolios over a three-year period. Their analysis found that loser portfolios significantly outperformed winner portfolios by 24.6%. In a subsequent study, De Bondt and Thaler (1987) also found systematic stock price reversals in the U.S. market. They also found that the stock price overreaction they documented was not attributable to the size or risk of the portfolio.
Another study concerning U.S. stock market overreaction was conducted by Howe (1986). In Howe’s analysis, the Center for Research in Security Prices CRSP database’s weekly returns were calculated for the period 1963–1981. The findings reveal that stocks which provided “good news” (determined as such by their large positive returns) significantly underperformed across the overall market over a 50-week period after the event; however, stocks which provided unanticipated “bad news” (determined as such by their large negative returns) significantly outperformed other stocks across the market over the subsequent 20-week period. The differences in cumulative average returns between stocks with “bad news” versus stocks with “good news” were positive for the entire tracking period.
Subsequent research focusing on the U.S. stock market by Brown and Harlow (1988), Chopra et al. (1992), and Ma et al. (2005) also provide substantial support for the overreaction hypothesis. In another study focusing on stock price overreaction, Zarowin (1990) re-examined the evidence that was reported by De Bondt and Thaler (1985, 1987). The author found a significantly positive difference in abnormal returns between the loser and winner portfolios that were invested in the U.S. stock market. Contrary to the findings of De Bondt and Thaler (1987), the author argues that this result was due to the size of the portfolios; loser portfolios are smaller than winner portfolios, and thus, the returns were not the result of investor overreaction. Similar evidence is given by Clare and Thomas (1995) who investigated the market overreaction hypothesis for the U.K. using monthly stock returns data over the period from 1955 to 1990. Further, Baytas and Cakici (1999) investigated the overreaction hypothesis for seven developed stock markets (the U.S., Canadian, the U.K., Japanese, German, French and Italian stock markets) using stock returns for the period between 1982 and 1991. As a result, they found empirical evidence to support the hypothesis of overreaction for all markets, except the U.S. Moreover, Lobe and Rieks (2011) examined the short-term overreaction for the Frankfurt stock exchange. They also found evidence to conclude that the overreaction phenomenon exists on the Frankfurt stock exchange. In addition, the authors conclude that investors earn minimal abnormal returns on this anomaly due to transaction costs and unpredictable market sentiment. Furthermore, Piccoli et al. (2017) observed individual U.S. stocks’ response to extreme market events. They reported that stocks tend to overreact following both positive and negative event disclosure.
Recently, the long-term overreaction effect has also been detected in emerging stock markets. Da Costa (1994) investigated the overreaction for the Brazilian stock market during a period from 1970 to 1989. Using both the market-adjusted and CAPM-adjusted models, the author reports that the prior loser portfolio significantly outperforms the market by 17.63% while the prior winner portfolio underperforms the market by 20.25% for the 24-month period following the formation of portfolios. In addition, Wu (2011) tested the hypotheses of short-term momentum and overreaction for the Chinese stock markets. The findings of this study support the hypothesis of overreaction for the Chinese stock markets. However, the short-term momentum effect is not present in the market. Moreover, Musnadi et al. (2018) tested the hypotheses of overreaction and underreaction at sectoral levels for the Indonesian stock market. The results of the t-test indicate that the overreaction phenomenon is present for the winner portfolio in all sectoral stock indices. For the loser portfolio, the underreaction hypothesis is not rejected for seven out of nine studied sectoral indices. Similarly, Lerskullawat and Ungphakorn (2019) investigated stock market overreaction in Thailand. Using a sample of 438 companies covering the period from 1990 to 2016, the authors found that the overreaction phenomenon is present on the Thai stock market. In a recent study, Ho et al. (2022) determined the effect of information disclosure ratings on continuing overreaction in the Shenzhen Stock Exchange. This study documented that a higher information disclosure rating is associated with greater continuing overreaction.
Similarly, the short-term overreaction effect has also been documented in the literature. Bowman and Iverson (1998) tested for the presence of short-run overreaction in the New Zealand stock market by employing weekly return data for the period from 1967 to 1986. The main findings of the study indicate that the hypothesis of short-run overreaction cannot be rejected for the New Zealand stock market. Specifically, the abnormal returns of prior loser and winner stocks in the week after the portfolio formation are 2.4% and −1.5%, respectively. Similarly, Boubaker et al. (2015) tested the hypothesis of short-term overreaction to specific events for the Egyptian stock exchange. They found that the short-term overreaction is present in the Egyptian stock exchange. In another study, Otchere and Chan (2003) examined the short-run overreaction for the Hong Kong stock market using daily return data over the period from March 1996 to June 1998. In general, the empirical evidence obtained from this study indicates that overreaction is present in the Hong Kong stock market. Specifically, price reversals of winners and losers are more pronounced in the period of the pre-financial crisis in Asia than in the crisis period. However, after accounting for transaction costs, the authors found that investors cannot earn abnormal returns based on a contrarian trading strategy. Furthermore, Wang et al. (2004) documented a significant short-run overreaction effect for the Chinese stock market by using weekly return data of 301 individual stocks for the period from August 1994 to July 2000. They found significant evidence of short-run overreaction for the Chinese stock market. Specifically, for the whole sample of 301, the prior loser portfolio significantly outperformed the market by 0.55% while the prior winner portfolio significantly underperformed the market by 0.52% in the consecutive week after the portfolio formation.
Other studies investigated the relationship between the overreaction effect and contrarian investment strategies. Lo and MacKinlay (1990) researched possible causes of overreaction profits using CRSP database weekly returns for 551 stocks for the period starting July 1962 through December 1987. The study’s results reveal that stock returns often have positive cross-autocorrelation, which provides support that a contrarian trading strategy may provide abnormal returns to investors even if no stock overreaction is observed. The authors contend that the presence of stock price overreaction and its effect on the success of contrarian strategies is small compared to the more substantial lead and lag relationship across stock returns.
In line with Lo and MacKinlay (1990), Jegadeesh and Titman (1995) examined overreaction, delayed reaction, and contrarian strategies for the U.S. markets for the period 1963 through to 1990. The authors found that stock prices overreact to firm-specific events, but tend to underreact to systematic market factors. However, contradicting Lo and MacKinlay (1990), Jegadeesh and Titman (1995) documented that the majority of abnormal returns from contrarian strategies is obtained from stock price overreaction while only a minor part of the excess return is from the lead–lag relationship across stock returns.
In addition, Chang et al. (1995) investigated short-run abnormal returns by using contrarian investment strategies for Japanese stocks listed on the Tokyo Stock Exchange. Using monthly stock returns during the period from 1975 to 1991, the findings from this study indicate that investors can earn abnormal returns in the short-term by using a contrarian strategy. In addition, the authors also conclude that short-term contrarian profits are not fully explained by firm size and return seasonality. Moreover, Antoniou et al. (2005) investigated the presence of contrarian profits and sources of such profits for the Athens Stock Exchange (ASE) by employing weekly price data for all stocks listed on the ASE over the period from January 1990 to August 2000. The results of this study are similar to those of Jegadeesh and Titman (1995) on the U.S. stock market. Specifically, the authors documented the presence of contrarian profits in the ASE for both cases: without and with risk and market frictions adjustment. Furthermore, they reported that the contribution of stock price overreaction to firm specific information to such profits is larger than the delayed reaction to the common factors. Furthermore, Tripathi and Aggarwal (2009) tested the overreaction hypothesis for the Indian stock market. Using the monthly prices of 500 stocks during the period from March 1996 to March 2007 and the methodology proposed by De Bondt and Thaler (1985), they found that the overreaction effect is present in the Indian stock market. In addition, the authors confirmed that investors can earn abnormal returns by using a contrarian investment strategy.
Contrary to most empirical studies mentioned above, Jegadeesh and Titman (1993) reported evidence against the hypothesis of stock price overreaction. Specifically, they found that the winners over the past 6 months outperformed the losers by one % per month over the following 6 to 12 months. Similarly, using a comprehensive sample of stocks listed on the New York Stock Exchange (NYSE) and the American Exchange (AMEX) from 1963 to 1985, Davidson and Dutia (1989) documented that prior winners continue to be winners and losers keep on losing for at least one year. In other words, the stock prices have a delayed reaction to information.
In summary, the overreaction effect for both long-term and short-term investment horizons has been detected in many markets, including developed and emerging ones. In addition, abnormal returns to contrarian investment strategies are also found for some stock markets. Moreover, some evidence of the delayed reaction in stock prices is documented in the literature. On the basis of this survey, the hypothesis of this study is that the stock price overreaction is present in the HOSE, the biggest stock exchange in Vietnam. This hypothesis is tested by applying the method proposed by De Bondt and Thaler (1985).

3. Data and Methodology

3.1. Data

The data used in this study include the monthly series of the Vietnam market index (VN-Index) and the monthly price series of all stocks listed on the HOSE. The data were obtained from the website of the HOSE (www.hsx.vn, accessed on 15 July 2021). The HOSE was launched on 28 July 2000 with only two firms listed. At the beginning period, the growth of the number of listed companies was slow. In fact, by the end of 2003, only 22 companies were listed on the HOSE. Therefore, to have sufficient stocks to form portfolios, this study employed the data for the period from 5 January 2004 to 30 June 2021. Based on the primary data, a natural logarithmic transformation was performed to generate a time series of continuously compounded returns. Specifically, monthly market and stock returns were computed by the following equation:
R t = L o g ( P t ) L o g ( P t 1 )
where,
R t : Market/stock returns of month t ;
P t : Market index/stock prices at the end of month t ;
P t 1 : Market index/stock prices at the end of month t 1 .
It is important to note that the number of companies listed on the HOSE continuously increased during the studied period. The summary statistics of the studied stocks during the period from 2004 to 2021 are presented in Table 1.
Figure 1 illustrates that the number of listed companies on the HOSE continuously increased during the period of interest from 2004 to 2021. Particularly, the most dramatic growth in listed firms occurred for the period of 2004–2012 with growth slowing substantially after that period with an increase from 301 to 392. Similarly, Figure 2 shows that the average capitalization of the companies also improves from 2004 to 2021. Specifically, it increased in the period between 2004 and 2017, but stalled in 2008 because of the global financial crisis. Then, the average capitalization of listed companies continued growing from 2011 to 2021, reaching a peak of VND 13,101.7 billion in 2021. Lastly, there were fluctuating changes in the average monthly trading volume of stocks. There was the same pattern with the changes in the average capitalization of the companies in the first ten years. The last pattern was a decrease from 2014 to 2018 and a significant recovery during the COVID-19 term, reaching a peak at VND 1116.3 billion in 2021 (see Figure 3). In general, the HOSE dramatically grew over eighteen years, as measured by increases in the average monthly trading volume of stocks, the number of listed companies, and the average capitalization.

3.2. Research Methodology

This study employed the methodology used by De Bondt and Thaler (1985), and Wang et al. (2004) to examine the overreaction hypothesis in the HOSE. For this methodology, first, abnormal returns were calculated for each stock by employing the market-adjusted model, as follows:
A R i , t = R i , t R m , t
where A R i , t is stock i ’s abnormal return for month t ; R i , t is stock i ’s actual return for month t ; and the market return for month t is represented by R m , t .
Once abnormal returns were calculated for each stock, they were ranked from highest to lowest and placed into “winner” and “loser” portfolios where the ten stocks with highest abnormal returns were placed into the winner portfolio, and the ten stocks with the lowest abnormal returns were assigned to the loser portfolio. Then, the winner and loser portfolios were followed for a subsequent 6 months. For each month following the formation of the winner and loser portfolios, mean abnormal returns were calculated for both the winner and loser portfolios using the following equation:
A R p , t = 1 10 i = 1 10 A R i , t
where A R p , t is the mean abnormal return for each portfolio ( p = W for the winner and p = L for the loser portfolio) at month t .
Following this, the average cumulative abnormal returns (ACAR) were then obtained for each tracking period using the equation:
A C A R p , t = 1 n 1 = 1 n A R p , t
where A C A R p , t is the average cumulative abnormal returns for the winner and loser portfolio’s portfolio ( p = W for the winner and p = L for the loser portfolio) for month t and n is the tracking period ( n = 1, 2, 3, 4, 5, 6). Lastly, tests of the overreaction hypothesis were conducted using the difference of average cumulative abnormal returns across the winner and loser portfolios, as shown in the equation below:
A C A R D , t = A C A R L , t A C A R W , t
Significant positive or negative values for A C A R D , t provide evidence that stock market overreaction or underreaction is present.

4. Empirical Results

4.1. Descriptive Statistics of the Portfolios for the Tracking Periods

The descriptive statistics of returns of the winner and loser portfolios for the tracking periods are summarized in Table 2 and Table 3, respectively. The number of observations, 30, for each period is the number of non-overlapping time periods from 5 January 2004 to 30 June 2021, each with seven months, consisting of one month for the portfolio formation and six months for the tracking portfolios. Each portfolio consists of 10 stocks from which the mean return is calculated. The minimum, mean, and maximum are the lowest, average, and highest mean returns of the 10 stock portfolios for a given month from the 30 non-overlapping periods. The standard deviation is calculated from the mean of the 30 and 10 stock portfolios for a given month.
The summary statistics for the loser portfolio presented in Table 3 show a large negative mean return for the observation month of 11.78%. Like the consistent positive return results in the observation month of the winner portfolio in Table 1, all of the returns in the observation month are negative for the loser portfolio. However, unlike the results for the winner portfolio in Table 2, in the case of the loser portfolio, the tracking month results were mixed with a slightly negative overall mean return of −0.21%. This indicates that, overall, the initial market reaction for the loser portfolio was held for the tracking months with a slight continuation of the negative market reaction.

4.2. Results of Overreaction Tests

Research results for the tests of overreaction are provided in Table 4 and Table 5. Table 4 reports differences across mean abnormal returns for winner and loser portfolios in the tracking months following the creation of the portfolios while the disparities in mean cumulative abnormal returns for each tracking month for these portfolios are summarized in Table 5.
Table 4 shows that the winner portfolio outperforms the market portfolio by a sizable 10.17%, whereas on the other hand, the loser portfolio trails the market portfolio by 11.78% during the formation month. As the overreaction hypothesis predicts, the winner portfolio average abnormal returns are negative for the tracking month. However, the price reversals of the losers only occur for months T + 2 and T + 3. The mean abnormal return differences across winner and loser portfolios ( A R L A R W ) in tracking months T + 2 and T + 3 are 1.80% and 2.17%, with both being significant at the 5% level. These results provide evidence that the overreaction phenomenon exists in the HOSE. These findings are in line with previous empirical findings of Chopra et al. (1992), Bowman and Iverson (1998), Otchere and Chan (2003), Wang et al. (2004), Lobe and Rieks (2011), Boubaker et al. (2015), Musnadi et al. (2018), and Lerskullawat and Ungphakorn (2019).
It is important to stress that the Vietnam stock market has been dominated by small individual investors who may lack in experience and in-depth knowledge about stock investments (Truong et al. 2021). Another characteristic of the market is a lack of information transparency (Truong et al. 2022). These characteristics of the market could lead to systematic mistakes by irrational investors in responding to new information that can be explained by the theory of biased self-attribution proposed by Daniel et al. (1998). In other words, the overreaction effect in the HOSE can be explained by the characteristics of the market that are in line with the theory of biased self-attribution.
In addition, current institutional transaction costs for trading on the HOSE are approximately 0.20%, consisting of 0.15% in brokerage commissions and 0.05% in fees to execute each trade. Based on this evidence, it is proposed that investors can earn abnormal returns by using contrarian trading strategies (selling the winners, buying the losers, and holding for two to three months). It is noted that the short-run abnormal returns by using contrarian investment strategies are also confirmed in previous studies of Lo and MacKinlay (1990), Jegadeesh and Titman (1995), Chang et al. (1995), Antoniou et al. (2005), and Tripathi and Aggarwal (2009).
Additionally, the findings comparing mean cumulative abnormal returns between the winner and loser portfolios for each tracking period, which are presented in Table 5, provide support that the overreaction phenomenon is predominant during the test periods. That is, the differences in mean cumulative abnormal returns across the loser and winner portfolios (ACARD) in all test periods are positive and statistically significantly different from zero at the 5% and 10% levels, except for the first two tracking periods. It is also found that the ACARD mostly decrease over the test periods.

5. Conclusions

This study tested the overreaction hypothesis of the HOSE. Consistent with research conducted by De Bondt and Thaler (1985), Chopra et al. (1992), Otchere and Chan (2003), Wang et al. (2004), Lobe and Rieks (2011), Musnadi et al. (2018), and Lerskullawat and Ungphakorn (2019), the results obtained from tests of the differences in abnormal returns between winner and loser portfolios provide solid support for the existence of an overreaction effect for the HOSE. Particularly, this analysis observed that the loser portfolio outperforms the winner portfolio by a significant 1.80% and 2.17% in the tracking months T + 2 and T + 3. Furthermore, differences in cumulative abnormal returns across the winner and loser portfolios are positive and significant for the last four test periods.
These findings also support the hypothesis that the Vietnam stock market is not efficient in the weak form. Based on the results, it is suggested that investors can earn abnormal returns by using contrarian trading strategies in the Vietnam stock market. A lack of weak form efficiency has clear implications for market participants. More timely and greater informational transparency is needed for companies especially around key events that may drive market overreaction. Possible policy implications include regulatory oversight of material corporate announcements including the timing of announcements as well as possible trading curbs surrounding material announcements.
Although this study provides some important insights for our understanding of the overreaction hypothesis in the HOSE, a frontier stock market, it still has limitations that can be addressed in future empirical analyses. First, through covering most of the available data for the HOSE, the length of the time period of the sample is relatively short. Further research using a longer observation period may provide more unambiguous conclusions regarding the overreaction hypothesis for the Vietnam stock market. Second, the return reversals found in this study can be caused by the size of the winners and losers. However, this issue has not been taken into account in this study. This limitation could be an interesting topic that awaits further research for the HOSE.

Author Contributions

Conceptualization, L.D.T.; methodology, L.D.T. and G.N.C.; software, G.N.C. and N.T.D.; validation, L.D.T. and H.S.F.; formal analysis, L.D.T. and H.S.F.; investigation, G.N.C. and N.T.D.; resources, G.N.C.; data curation, L.D.T.; writing—original draft preparation, L.D.T. and G.N.C.; writing—review and editing, L.D.T., H.S.F. and N.T.D.; visualization, H.S.F.; supervision, L.D.T.; project administration, L.D.T. All authors have read and agreed to the published version of the manuscript.

Funding

This research received no external funding.

Institutional Review Board Statement

Not applicable.

Informed Consent Statement

Not applicable.

Data Availability Statement

The data that support the findings of this research are available from the corresponding author upon request.

Conflicts of Interest

The authors declare no conflict of interest.

References

  1. Antoniou, Antonios, Emilios C. Galariotis, and Spyros I. Spyrou. 2005. Contrarian profits and the overreaction hypothesis: The case of the Athens stock exchange. European Financial Management 11: 71–98. [Google Scholar] [CrossRef]
  2. Baytas, Ahmet, and Nusret Cakici. 1999. Do market overreaction: International evidence. Journal of Banking and Finance 23: 1121–44. [Google Scholar] [CrossRef]
  3. Boubaker, Sabri, Hisham Farag, and Duc Khuong Nguyen. 2015. Short-term overreaction to specific events: Evidence from an emerging market. Research in International Business and Finance 35: 153–65. [Google Scholar] [CrossRef]
  4. Bowman, Robert G., and David Iverson. 1998. Short-run overreaction in the New Zealand stock market. Pacific-Basin Finance Journal 6: 475–91. [Google Scholar] [CrossRef]
  5. Brown, Keith C., and W. Van Harlow. 1988. Market overreaction: Magnitude and intensity. Journal of Portfolio Management 14: 6–13. [Google Scholar] [CrossRef]
  6. Chang, Rosita P., Dennis W. McLeavey, and S. Ghon Rhee. 1995. Short-term abnormal returns of the contrarian strategy in the Japanese stock market. Journal of Business Finance & Accounting 22: 1035–48. [Google Scholar] [CrossRef]
  7. Chopra, Navin, Josef Lakonishok, and Jay R. Ritter. 1992. Measuring abnormal performance: Do stocks overreact? Journal of Financial Economics 31: 235–68. [Google Scholar] [CrossRef]
  8. Clare, Andrew, and Stephen Thomas. 1995. The overreaction hypothesis and the UK stock market. Journal of Business Finance & Accounting 22: 961–73. [Google Scholar] [CrossRef]
  9. Da Costa, Newton C. A. 1994. Overreaction in the Brazilian stock market. Journal of Banking and Finance 18: 633–42. [Google Scholar] [CrossRef]
  10. Daniel, Kent, David Hirshleifer, and Avanidhar Subrahmanyam. 1998. Investor psychology and security market under-and overreactions. The Journal of Finance 53: 1839–85. [Google Scholar] [CrossRef] [Green Version]
  11. Davidson, Wallace N., III, and Dipa Dutia. 1989. A note on the behavior of security returns: A test of stock market overreaction and efficiency. The Journal of Financial Research 12: 245–52. [Google Scholar] [CrossRef]
  12. De Bondt, Werner F. M., and Richard Thaler. 1985. Does the stock market overreact? Journal of Finance 40: 793–805. [Google Scholar] [CrossRef]
  13. De Bondt, Werner F. M., and Richard Thaler. 1987. Further evidence on investor overreaction and stock market seasonality. Journal of Finance 42: 557–81. [Google Scholar] [CrossRef]
  14. Ho, Kung-Cheng, Lu Yang, and Sijia Luo. 2022. Information disclosure ratings and continuing overreaction: Evidence from the Chinese capital market. Journal of Business Research 140: 638–56. [Google Scholar] [CrossRef]
  15. Howe, John S. 1986. Evidence on Stock Market Overreaction. Financial Analysis Journal 42: 74–77. [Google Scholar] [CrossRef]
  16. Jegadeesh, Narasimhan, and Sheridan Titman. 1993. Returns to buying winners and selling losers: Implications for stock market efficiency. The Journal of Finance 48: 65–91. [Google Scholar] [CrossRef]
  17. Jegadeesh, Narasimhan, and Sheridan Titman. 1995. Overreaction, delayed reaction, and contrarian profits. Review of Financial Studies 8: 973–93. [Google Scholar] [CrossRef]
  18. Lerskullawat, Polwat, and Teerapan Ungphakorn. 2019. Does overreaction still exist in Thailand? Kasetsart Journal of Social Sciences 40: 689–94. [Google Scholar] [CrossRef]
  19. Lo, Andrew W., and A. Craig MacKinlay. 1990. When are contrarian profits due to stock market overreaction? Review of Financial Studies 3: 175–205. [Google Scholar] [CrossRef] [Green Version]
  20. Lobe, Sebastian, and Johannes Rieks. 2011. Short-term market overreaction on the Frankfurt stock exchange. The Quarterly Review of Economics and Finance 51: 113–23. [Google Scholar] [CrossRef]
  21. Ma, Yulong, Alex P. Tang, and Tanweer Hasan. 2005. The stock price overreaction effect: Evidence on Nasdaq stocks. Quarterly Journal of Business & Economics 44: 113–27. [Google Scholar]
  22. Musnadi, Said, Faisal, and M. Sabhri Abd. Majid. 2018. Overreaction and underreaction anomalies in the Indonesian stock market: A sectoral analysis. International Journal of Ethics and Systems 34: 442–57. [Google Scholar] [CrossRef]
  23. Nguyen, Anh Thi Kim, and Loc Dong Truong. 2020. The impact of index future introduction on spot market returns and trading volume: Evidence from Ho Chi Minh Stock Exchange. Journal of Asian Finance, Economics and Business 7: 51–59. [Google Scholar] [CrossRef]
  24. Nguyen, Thi Kim Anh, Dong Loc Truong, and H. Swint Friday. 2022. Expiration-day effects of index futures in a frontier market: The case of Ho Chi Minh Stock Exchange. International Journal of Financial Studies 10: 3. [Google Scholar] [CrossRef]
  25. Otchere, Isaac, and Jonathan Chan. 2003. Short-term overreaction in the Hong Kong stock market: Can a contrarian trading strategy beat the market? Journal of Behavioral Finance 4: 157–71. [Google Scholar] [CrossRef]
  26. Piccoli, Pedro, Mo Chaudhury, Alceu Souza, and Wesley Vieira da Silva. 2017. Stock overreaction to extreme market events. The North American Journal of Economics and Finance 41: 97–111. [Google Scholar] [CrossRef]
  27. Tripathi, Vanita, and Shalini Aggarwal. 2009. The overreaction effect in the Indian stock market. Asian Journal of Business and Accounting 2: 93–114. [Google Scholar]
  28. Truong, Loc Dong, Anh Thi Kim Nguyen, and Dut Van Vo. 2021. Index future trading and spot market volatility in frontier markets: Evidence from Ho Chi Minh Stock Exchange. Asia-Pacific Financial Markets 28: 353–66. [Google Scholar] [CrossRef]
  29. Truong, Loc Dong, Thai Xuan Le, and H. Swint Friday. 2022. The influence of information transparency and disclosure on the value of listed companies: Evidence from Vietnam. Journal of Risk and Financial Management 15: 345. [Google Scholar] [CrossRef]
  30. Wang, J., B. M. Burton, and D. M. Power. 2004. Analysis of the overreaction effect in the Chinese stock market. Applied Economics Letters 11: 437–42. [Google Scholar] [CrossRef]
  31. Wu, Yangru. 2011. Momentum trading, mean reversal and overreaction in Chinese stock market. Review of Quantitative Finance and Accounting 37: 301–23. [Google Scholar] [CrossRef]
  32. Zarowin, Paul. 1990. Size, seasonality, and stock market overreaction. Journal of Financial and Quantitative Analysis 25: 113–25. [Google Scholar] [CrossRef]
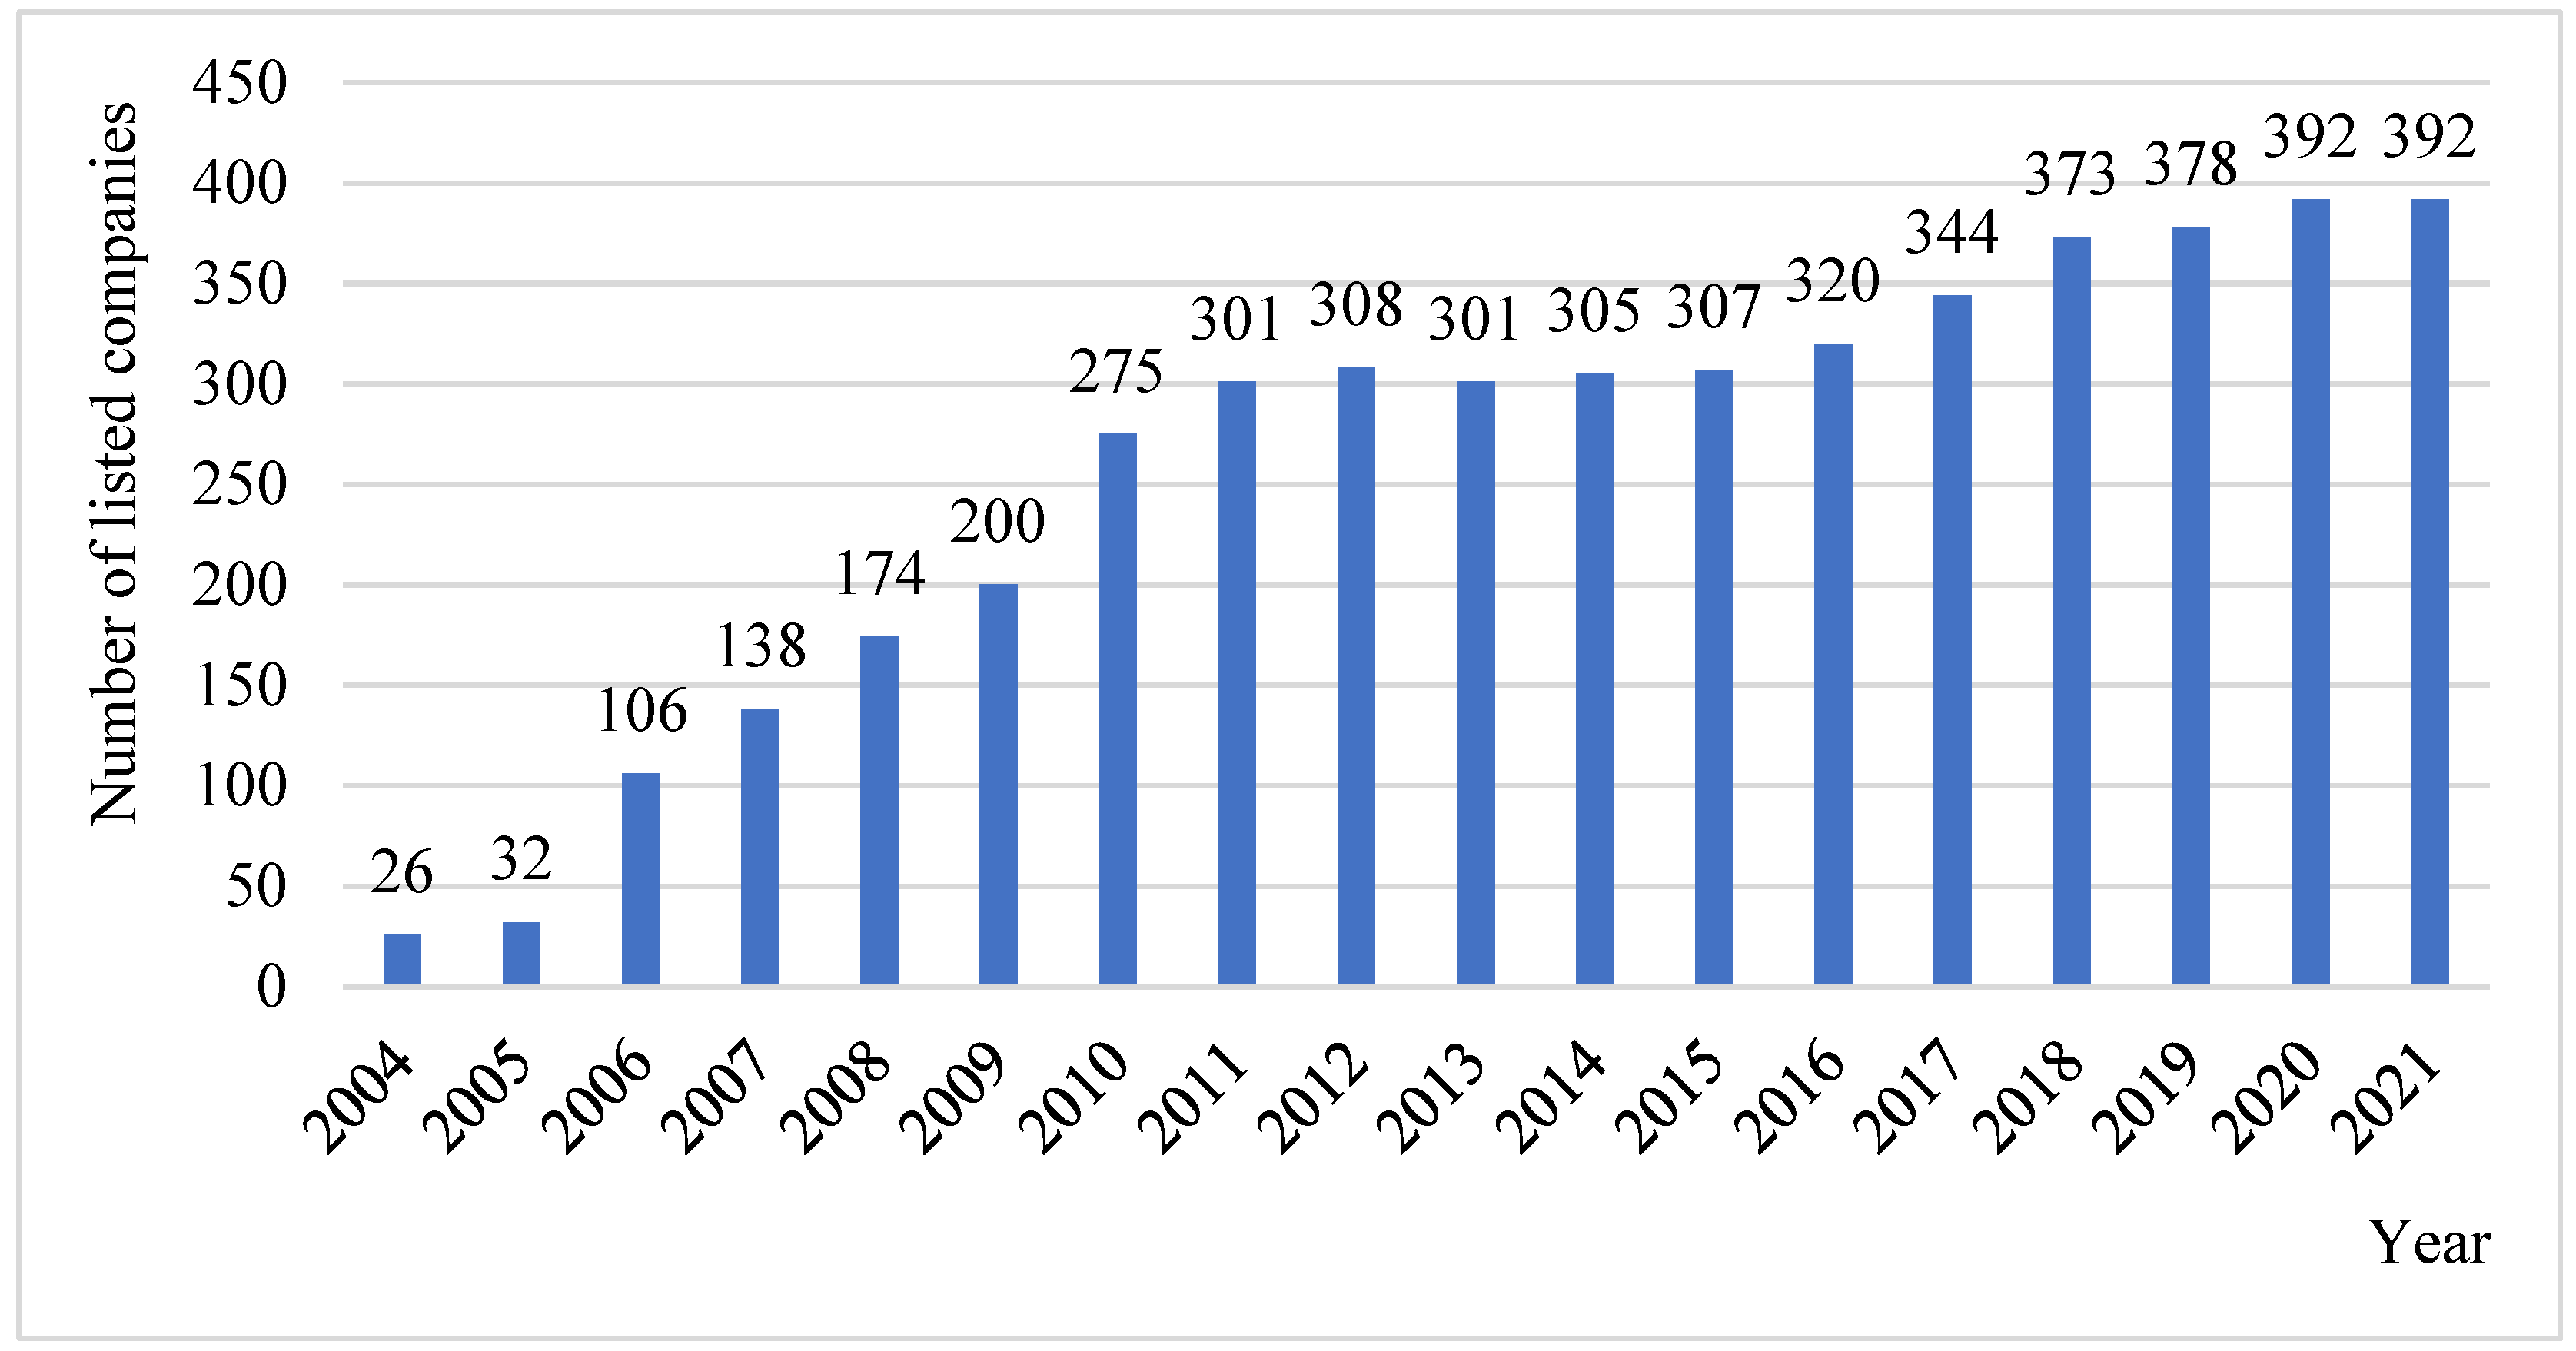
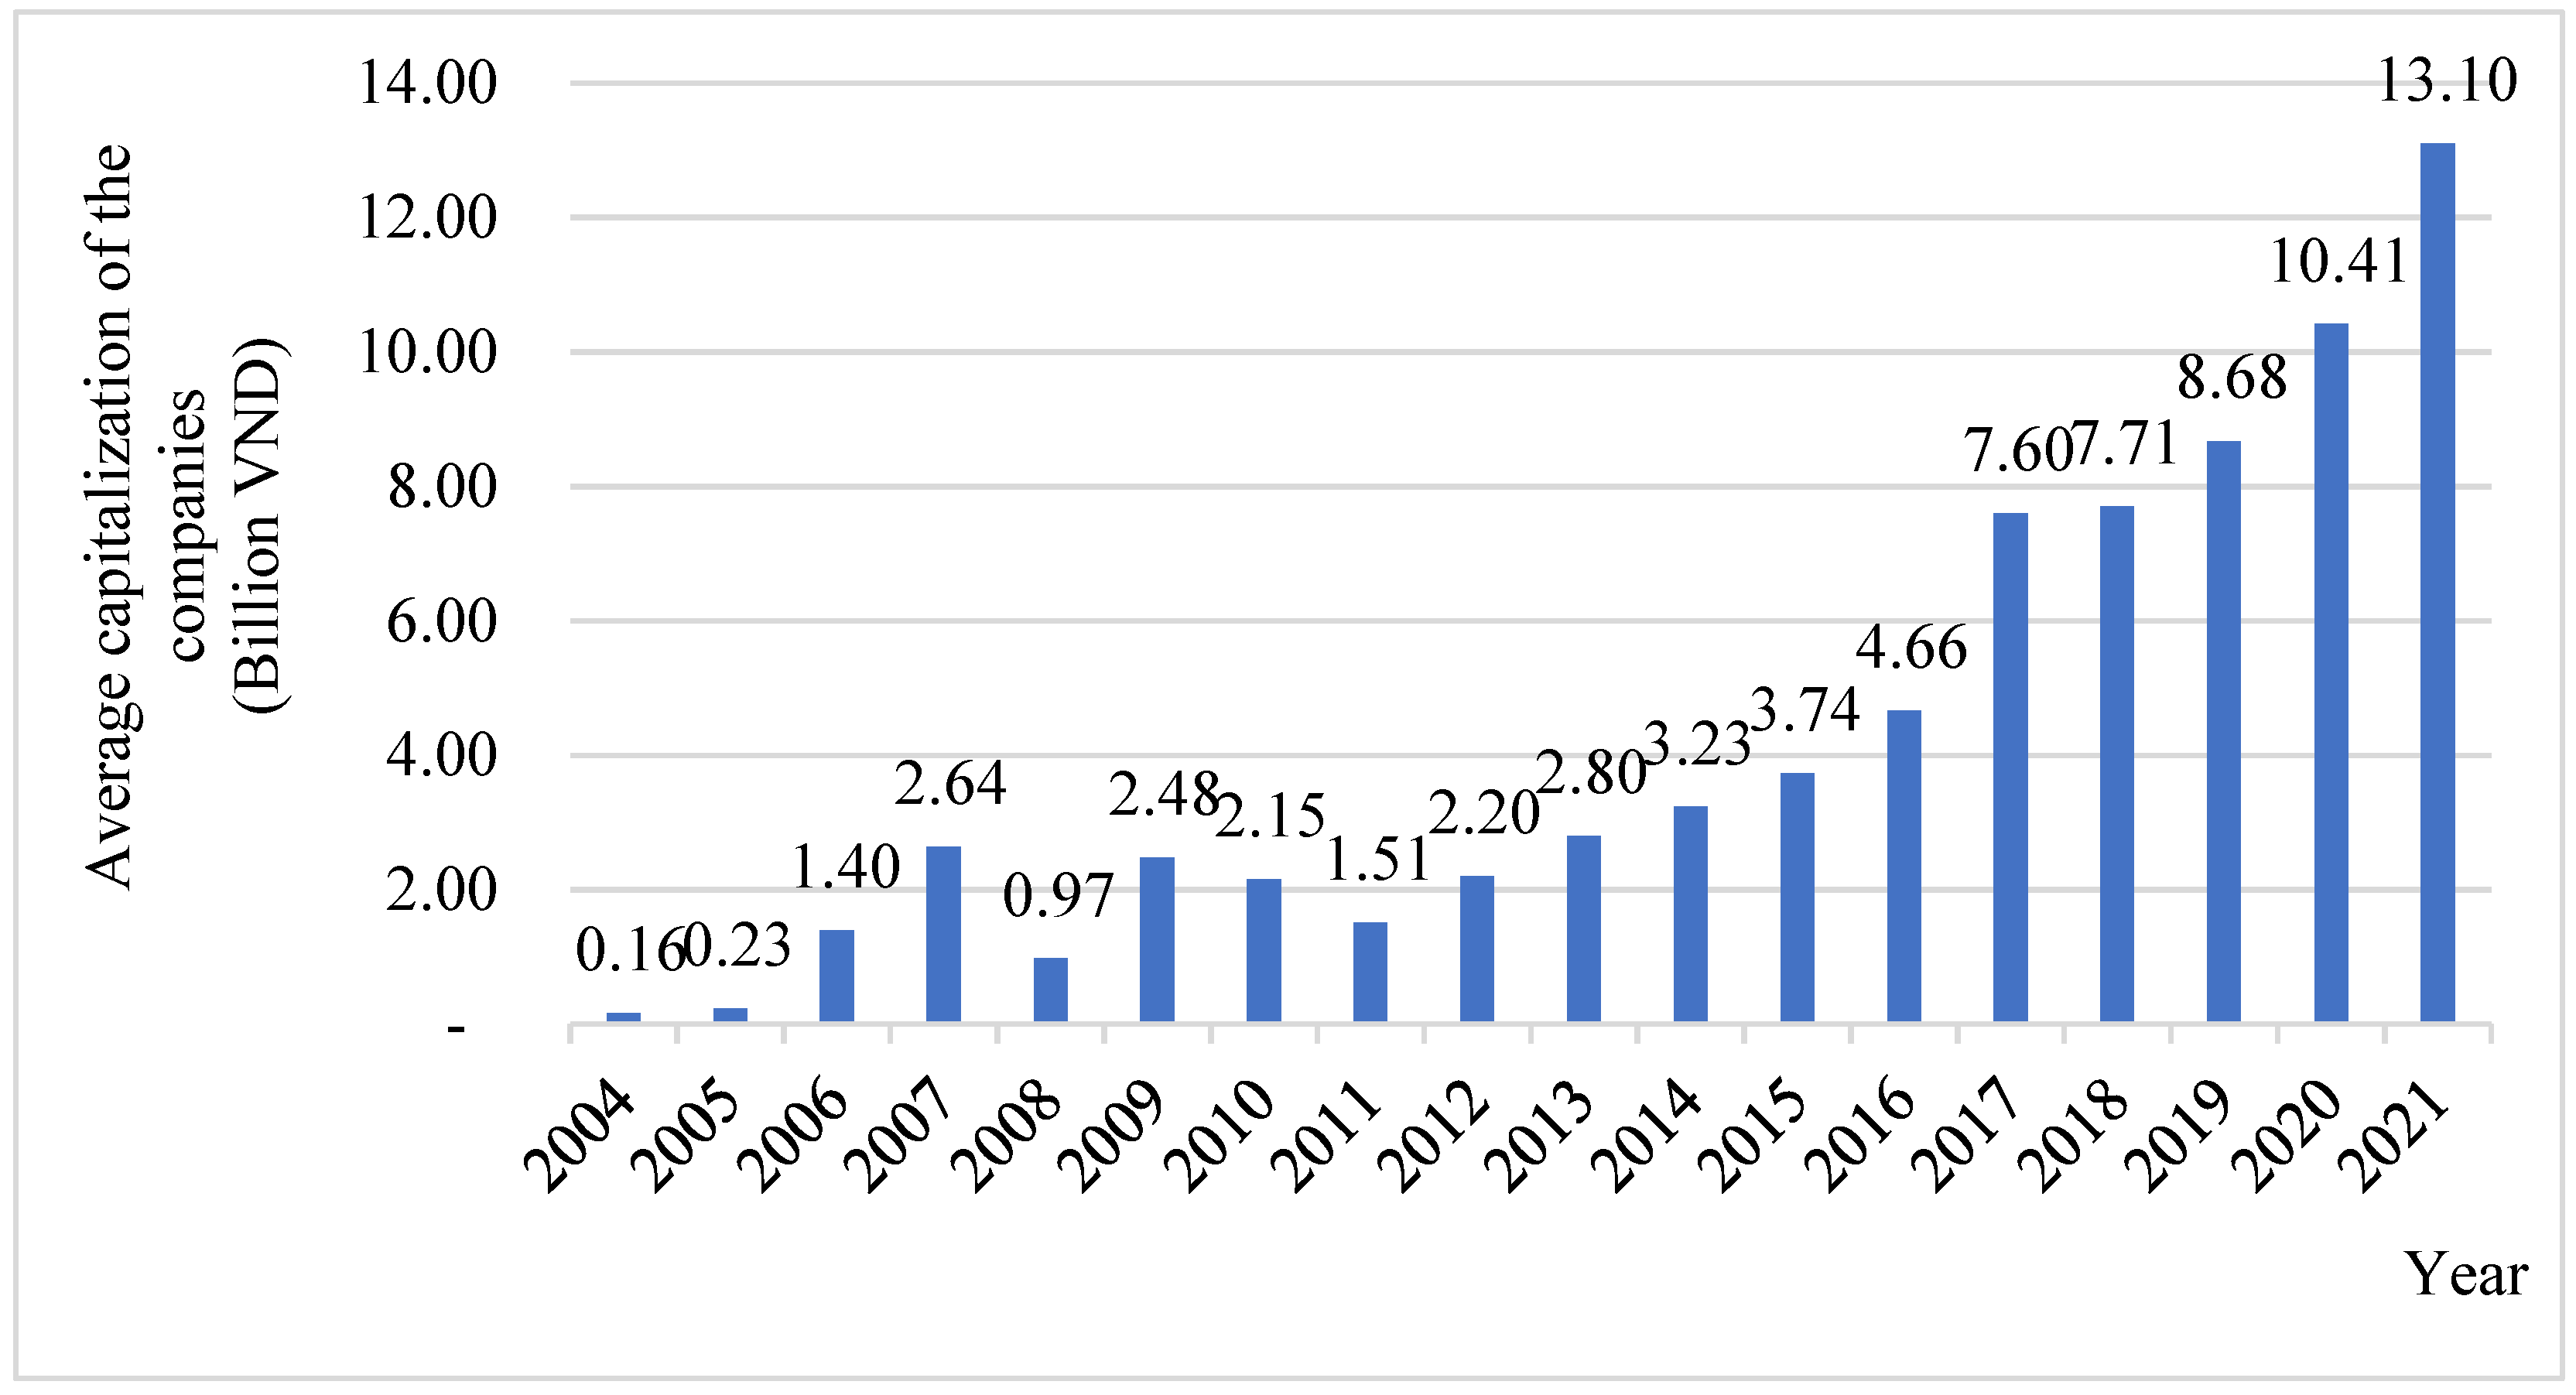
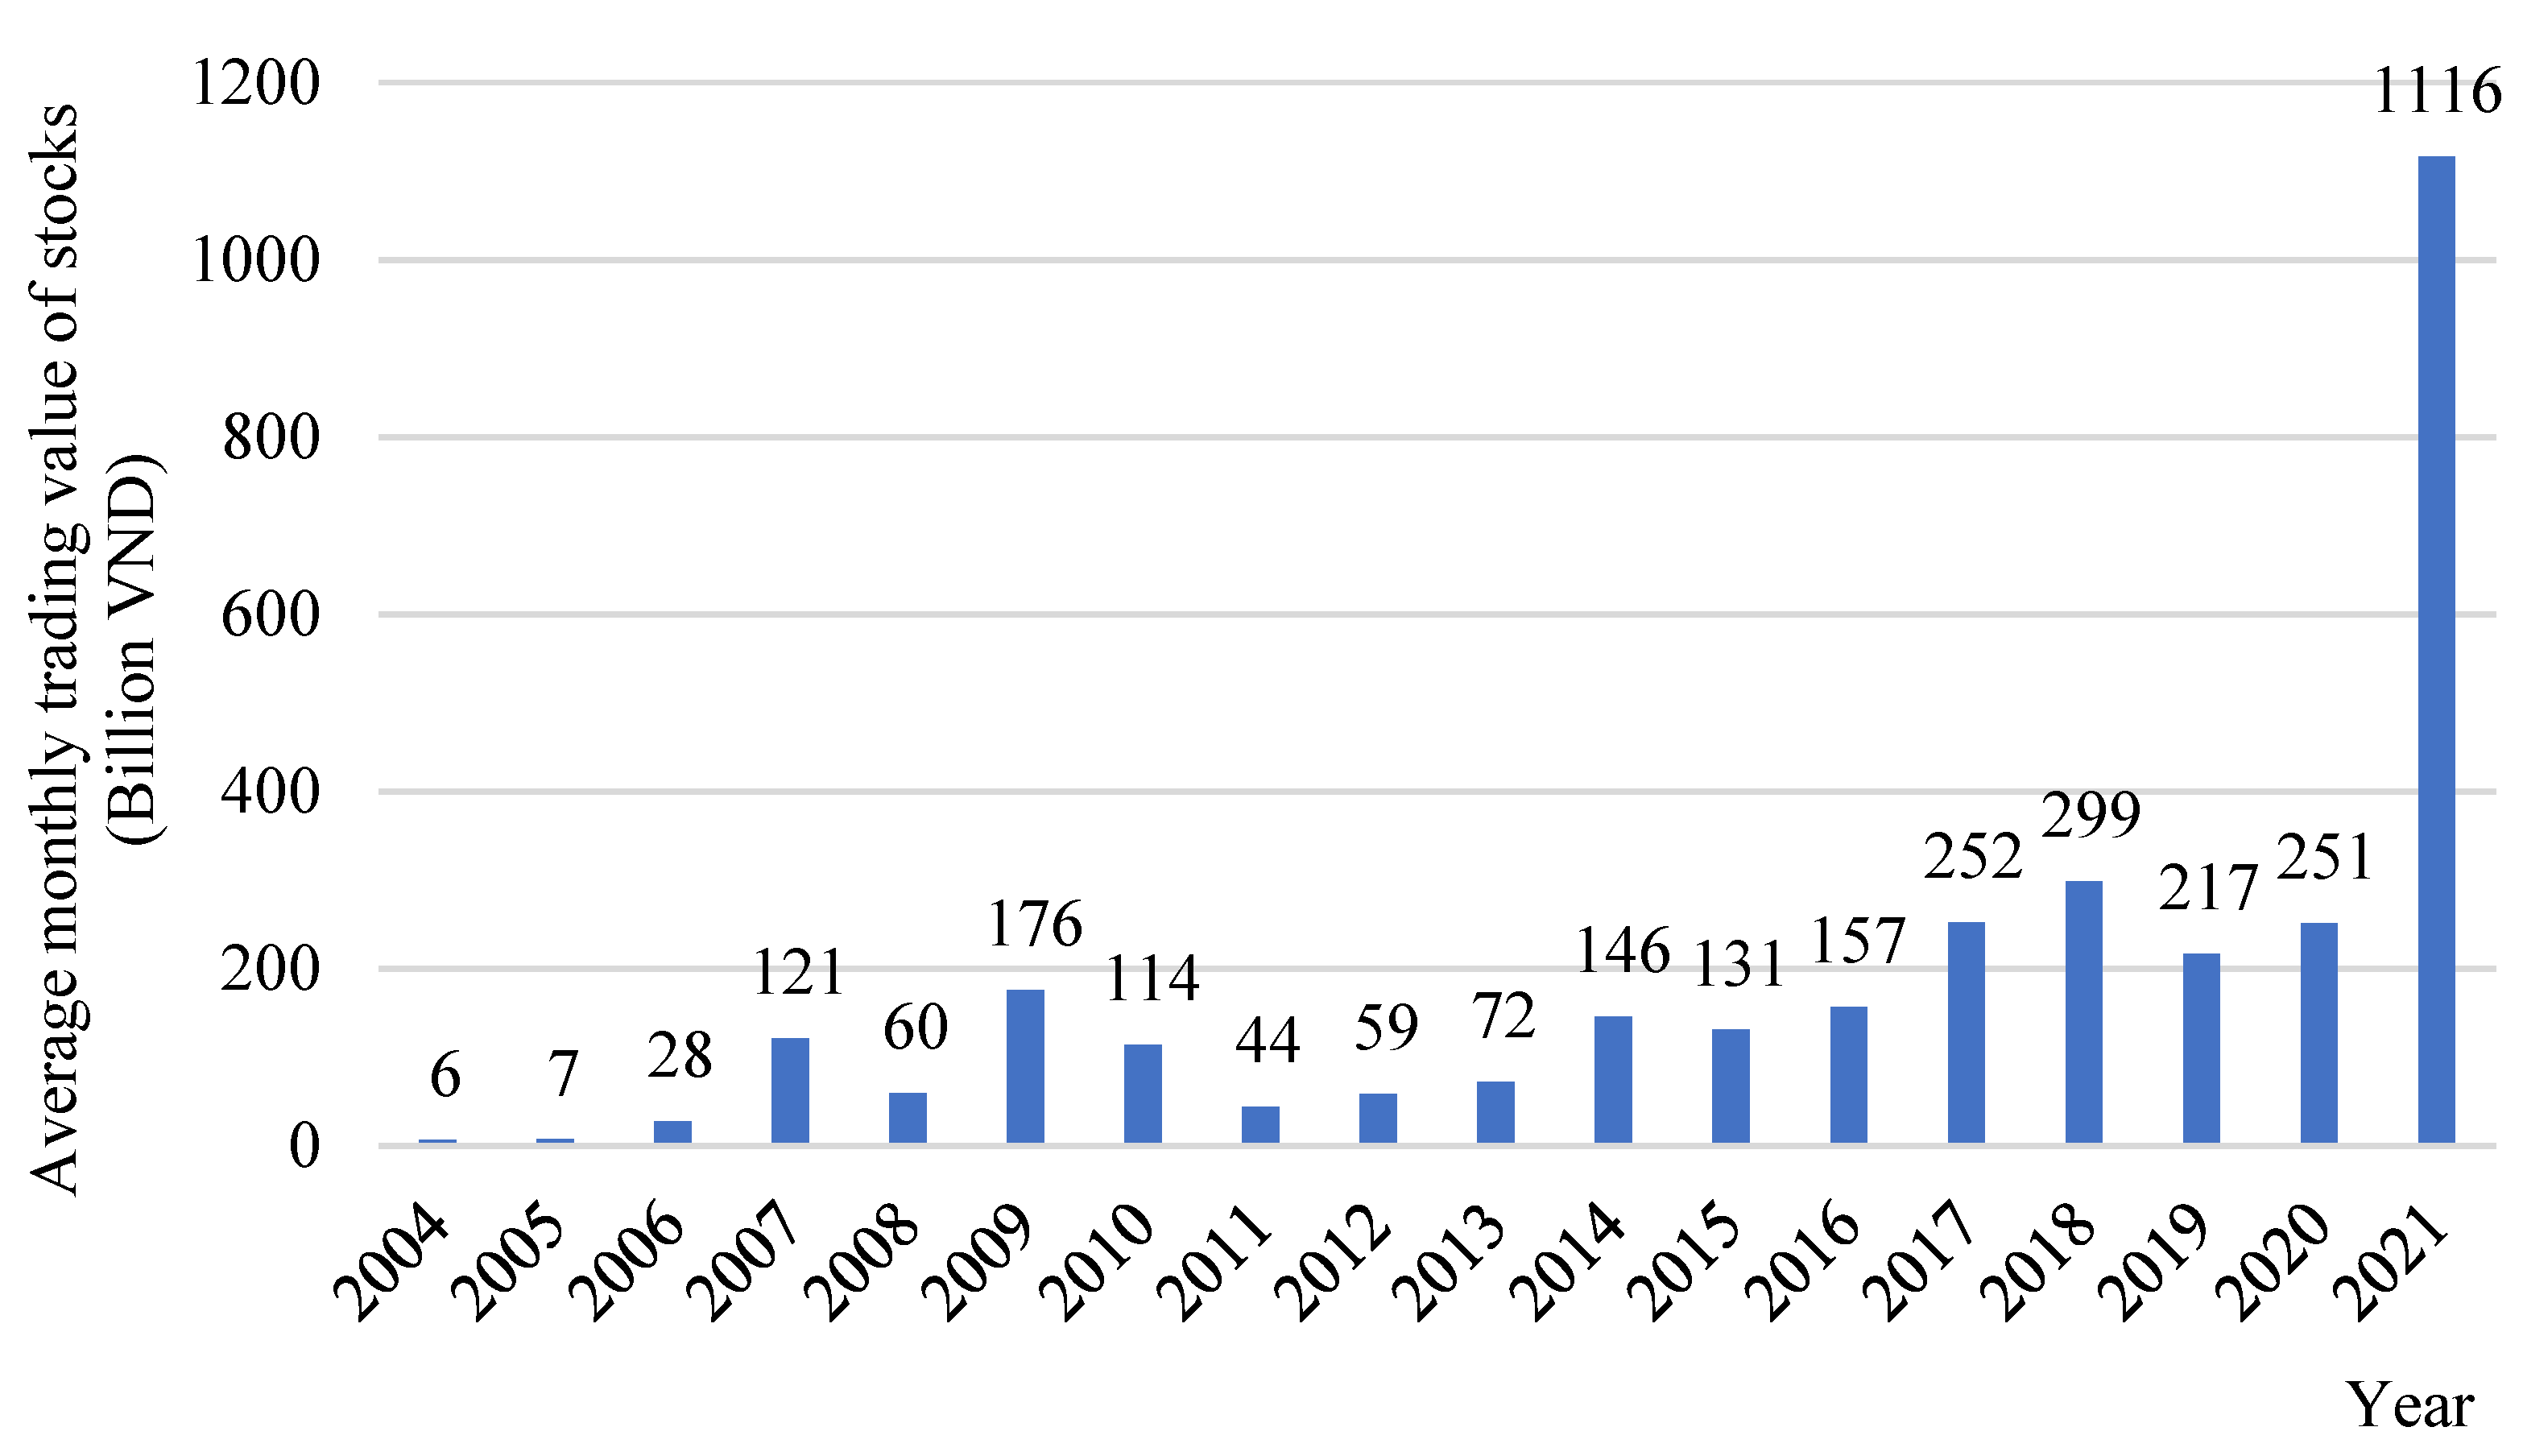
Figure 1. Number of listed companies. Source: annual reports of the HOSE.
Ijfs 11 00058 g001
Figure 2. Average capitalization of the companies. Source: annual reports of the HOSE.
Ijfs 11 00058 g002
Figure 3. Average monthly trading value of stocks. Source: annual reports of the HOSE.
Ijfs 11 00058 g003
Table 1. Summary statistics of the selected stocks during the period 2004–2021.
YearNumber of Listed CompaniesAverage Capitalization of the Companies
(VND Billion)
Average Monthly Trading Value of Stocks
(VND Billion)
200426163.06.3
200532230.97.2
20061061395.927.9
20071382640.8121.2
2008174973.359.7
20092002475.5176.0
20102752150.3114.1
20113011507.644.1
20123082202.658.7
20133012797.772.3
20143053230.4145.6
20153073735.9130.8
20163204661.8156.8
20173447599.3252.2
20183737709.2298.8
20193788676.2216.5
202039210,410.1251.4
202139213,101.71116.3
Source: Annual reports of the HOSE.
Table 2. Summary statistics of the winner portfolio.
Tracking PeriodsObservationsMinimumMeanMaximumRangeStandard Deviation
F (T0)300.01080.10170.22310.21230.0550
T + 130−0.0657−0.00400.07170.13740.0331
T + 230−0.0796−0.00710.08110.16070.0334
T + 330−0.1201−0.01110.03010.15020.0309
T + 430−0.0559−0.00970.06970.12560.0276
T + 530−0.0551−0.01120.03550.09060.0257
T + 630−0.0878−0.00850.04540.13320.0314
Note: F is the formation (observation) month.
Table 3. Summary statistics of the loser portfolio.
Tracking PeriodsObservationsMinimumMeanMaximumRangeStandard Deviation
F (T0)30−0.1931−0.1178−0.02180.17130.0467
T + 130−0.0590−0.01340.06590.12490.0240
T + 230−0.03830.01090.08390.12220.0341
T + 330−0.07210.01060.07530.14740.0379
T + 430−0.0979−0.00730.07800.17590.0339
T + 530−0.0961−0.00870.02830.12440.0241
T + 630−0.0980−0.00440.07350.17150.0356
Note: F is the formation (observation) month.
Table 4. Differences in the mean abnormal returns between winner and loser portfolios following the formation of the portfolios.
MonthObservationsWinnerLoserLoser-Winner (ARLARW)
ARWARLARDt-Statistics
F300.1017−0.1178−0.2195−16.66 ***
T + 130−0.0040−0.0134−0.0094−1.25
T + 230−0.00710.01090.01802.06 **
T + 330−0.01110.01060.02172.43 **
T + 430−0.0097−0.00730.00240.30
T + 530−0.0112−0.00870.00250.39
T + 630−0.0085−0.00440.00410.47
F is the formation (observation) month. ***, ** and * indicate significance at 1%, 5% and 10% levels, respectively.
Table 5. The differences in mean cumulative abnormal returns between the winner and loser portfolios.
MonthObservationsWinnerLoserLoser-Winner (ARLARW)
ARWARLARDt-Statistics
F300.1017−0.1178−0.2195−16.66 ***
T + 130−0.0040−0.0134−0.0094−1.25
T + 230−0.0056−0.00120.00440.96
T + 330−0.00740.00270.01012.41 **
T + 430−0.00800.00020.00822.32 **
T + 530−0.0086−0.00160.00702.09 **
T + 630−0.0086−0.00210.00652.00 *
F is the formation (observation) month. ***, ** and * indicate significance at 1%, 5% and 10% levels, respectively.
Disclaimer/Publisher’s Note: The statements, opinions and data contained in all publications are solely those of the individual author(s) and contributor(s) and not of MDPI and/or the editor(s). MDPI and/or the editor(s) disclaim responsibility for any injury to people or property resulting from any ideas, methods, instructions or products referred to in the content.

