Article

Conciseness, Financial Disclosure, and Market Reaction: A Textual Analysis of Annual Reports in Listed Chinese Companies

Department of Accounting, Philadelphia University, Jarash Road, 20 KM, Amman 19392, Jordan
*
Author to whom correspondence should be addressed.
Int. J. Financial Stud. 2022, 10(4), 104; https://doi.org/10.3390/ijfs10040104
Submission received: 8 October 2022 / Revised: 1 November 2022 / Accepted: 3 November 2022 / Published: 9 November 2022

Abstract

:
The purpose of this study was to examine the relationship between the conciseness and complexity of financial disclosures and market reactions, using the annual reports of Chinese-listed B-share companies over the period 2006–2018. We employed a set of statistical methods that were derived from other fields, such as computational and event studies, in order to derive the English annual reports of Chinese-listed companies, as well as to obtain other key financial indicators from the CSMAR database. Markets react significantly to increased report length, which means that managers that present poor returns with manipulated financial reports could be hiding poor returns. Additionally, the findings of this study are robust to additional tests that use alternative proxies. Furthermore, the results of this paper reinforce the hypothesis that the readability of financial reports affects financial market response. The results indicate that more complex financial reports are correlated with lower current returns, and negatively affect the expectations of future returns. For the purposes of avoiding the effects of the coronavirus pandemic on the results, we utilized data up to 2018. In light of this circumstance, we recommend that future research be conducted that compares results from before and after the coronavirus pandemic. The findings of our study have important implications for regulators, managers, and investors. Investors should obtain relevant information through annual reports; therefore, the importance of style is less relevant. Managers should be encouraged to write their annual reports more concisely. This study concluded that these reports are significant outputs of firms, and are widely read by investors. The study also provides empirical evidence of market reactions that are associated with readability and earnings, as well as with surprise earnings; thus, the complexity of annual reports provided by a variety of investors, using computational and event analysis, should be reduced.

1. Introduction

Research has indicated that annual reports play an important role in the current system of information disclosure, and have significant economic consequences (Ball and Brown 1968). Studies on the readability of annual reports have been conducted since the 1950s (Pashalian and Crissy 1950). It is a topic of debate in many studies, and scholars have explored the linguistic features that influence text readability. In recent years, the readability and conciseness of annual reports have received increasing attention from scholars worldwide (Cheung 2014; Luo et al. 2018; Xu et al. 2019; Loughran and McDonald 2016; Bonsall et al. 2017; Liu and Liu 2021; Dalwai et al. 2021; Li 2008; Alduais 2022). Investors and listed companies rely on financial reporting for communication. Annual reports are the most important way for stakeholders to obtain information (Subramanian et al. 1993; Loughran and McDonald 2009; Bloomfield 2008; Li 2008). The language of the annual report affects the stock market’s efficiency, in terms of all the information it provides (du Toit 2017; Xu et al. 2019). Potential investors and other stakeholders in the market require accurate and transparent information, in order to make informed decisions (Chakraborty and Bhattacharjee 2020; Li 2008; Li and Zhang 2015; Soepriyanto et al. 2021). According to You and Zhang (2009), an investor’s negative response is statistically significant, if the company provides a longer annual report. They focused on the length of the report, as well as stock price movements, 12 months after filing. Lawrence (2013), Miller (2010), and also pointed out that smaller investors preferred commercial stocks to those that provided more readable reports.
In external reporting, the readability and conciseness of financial data are becoming more crucial for users (Clatworthy and Jones 2001; Lawrence 2013), as the amount of data that must be included in the financial statements about the company’s financial position and activity has increased. The importance of financial statement readability is emphasized by this reverse causation, which is emphasized despite the regulated environment in which listed corporations operate (Hassan et al. 2019). China is considered to be one of the main markets around the world, and it has many users that are interested in financial reports, including various stakeholders and shareholders (Sun et al. 2022). Thus, the results of a company’s activities and transactions should be effectively reported in its financial reports (Zheng and Sheng 2017). The Chinese market has a high percentage of unprofessional, inexperienced retail investors, who are likely affected by the readability of corporate financial statements (Zeng et al. 2012; Xu et al. 2019).
This study was motivated by the importance of the textual components of financial disclosures, as well as their richness and diversity. In addition, it was driven by China’s rapid economic growth over the past two decades, which has been disproportionately faster than the rest of the world. Since the international financial markets have become globalized, a large amount of information is ambiguous as a result of these standards. Furthermore, this study was motivated by the China Securities Regulatory Commission’s (CSRC) initiative to simplify foreign disclosure and regulations, which will make it easier for ordinary investors and monitors to comprehend corporate disclosures.
In China, the capital market has developed rapidly, which has been the main driver of economic development, with more than three decades of market-oriented reforms (Zeng et al. 2010). In order to improve economic development and social progress, China is currently seeking to disclose adequate information about firms’ positions and activities (Li 2008; Anh-Tuan et al. 2022). Previous research closely examined the impact of companies’ financial operations on financial report readability (Hrasky et al. 2009). A lack of practical data on the textual complexity of business report narratives in an emerging market is what spurred us to conduct this study in the Chinese context (Zeng et al. 2012). Our study’s testing of the relationship of readability and financial disclosure with market reaction is, thus, one of its contributions.
Recent research has examined whether textual patterns can be used in financial statements to detect fraud. For example, (Goel et al. 2010; Goel and Gangolly 2012; Humpherys et al. 2011; and Purda and Skillicorn 2015), showed that managers tend to use deceptive language when committing fraud. Compared with outside investors, managers have an information advantage in business environments. Tan et al. (2014), showed that sophisticated investors can see positive disclosures. In contrast, managers are more likely to have greater flexibility in making narrative disclosures more complex and, therefore, less readable when committing fraud. Lo et al. (2017), found that there was a negative association between the readability of annual reporting and earnings management, as more readable financial statements reduced the informational asymmetry between managers and users (Lee 2012). According to previous research, poor readability of corporate reports increases agency costs (Luo et al. 2018), as well as capital costs (Ezat 2019).
The efficient operation of stock markets depends on how data are communicated among the various users of the financial data (S. Li et al. 2014). Some companies disclose information, as required by guidelines and standards. By improving the readability of the data enterprises disclose to different users, enterprises can reduce their costs of capital, improve transparency, build investor trust, and improve stock marketability (Kristandl and Bontis 2007). Compared with mature capital markets in other countries, the Chinese market has several distinct characteristics.
This study aimed to determine the degree of readability of a company’s annual report, for if an annual report’s information on a company exceeds the comprehension of the target audience, the management’s communicative intention is directly affected, or communication effects are weakened. This research is also driven by the intuitional characteristics of China’s “governance system”, which offer an appealing opportunity to investigate relationships between annual report readability and a company’s financial performance. This institutional element offers an attractive framework to examine the confounding relationship of readability and financial disclosure with market reaction. Furthermore, we expanded the scope of the investigation into the relationship between the readability of annual reports and market reactions, by focusing on the financial reporting environment and financial readability. We then examined the relationship between financial readability and the trading volume, as influenced by investors’ reactions. Simply put, we tried to answer the following questions: What is the market reaction inside the Chinese market to annual reports’ readability? Under what conditions can investors find particularly useful texts?
This study is valuable to theory and practice, because it examines the investor response to the readability and complexity of annual financial reports in China’s stock market, through the proxy variables of market reaction, predicting returns, trading value, and volume. The Fog index and length of the annual report are both effective methods for determining whether target readers can understand the narrative report (Li 2008; Loughran and McDonald 2014a; Xu et al. 2019; Bonsall and Miller 2017; Hsieh et al. 2016; Ertugrul et al. 2017; Courtis and Hassan 2002). Our study has implications for investors, managers, and regulators. In order to efficiently provide investors with useful information, an annual report should provide investors with relevant information. In order to reduce the length and complexity of annual reports, managers should be encouraged to write them more concisely. Managers should pay attention to the conciseness of annual reports, because clearly written and concise documents are more likely to be read, thus affecting investors and the market in general.
Moreover, this study contributes directly to the growing body of research on reporting complexity, and complements several large bodies of research that demonstrate the benefits of having more informative disclosures (Botosan 1997; Francis et al. 2002; Lang and Lundholm 1996; Rjiba et al. 2021) and trading volume reactions to information releases (Li and Ramesh 2009). Furthermore, Merkley et al. (2015) found that the trading behavior of investors differs in response to different types of information events (Shanthikumar 2003). One of the most significant implications of our study stems from how to promote and support investors’ knowledge of development paths through effective methods. Therefore, it is recommended that we raise the issue of how to strengthen and provide support to investors through monitoring the legal infrastructure of the relevant authorities, in order to improve this capacity.
The remainder of this paper is organized as follows: the main hypotheses are presented in Section 2; Section 3 introduces the data and the methodology used; Section 4 reports the empirical analysis results; Section 5 concludes the paper.

2. Literature Review and Hypothesis Development

China has a large sector of individual investors who constitute a large part of the overall securities market. Currently, participating directly in the financial market through trading is the most popular option. The Chinese stock market comprises a high proportion of retail investors who are not professional, lack experience, and are likely to be influenced by the readability of company reports (Xu et al. 2019; Sun et al. 2022). Studying the trading behavior of individual investors is a meaningful way to indicate the effectiveness of the securities market. Compared with Western markets, China’s financial market is less mature. Annual reports increase the asymmetric information between managers and external investors, thereby increasing the risks and costs of participation. For example, readability may decrease when managers communicate more details about complex operations, but a detailed disclosure may provide investors with a better understanding of their main business complexity. Chakraborty and Bhattacharjee (2020); Lang (2015); Loughran and McDonald (2014b); and Dey and Lim (2015), concluded that financial disclosures are difficult to comprehend.
Text-based information is likely to include stock price factors. For example, the annual reports of perfect companies include many management discussions on financial statements. As most financial statements are historical, texts in annual corporate reports may contain forward-looking information. Therefore, information resulting from the text part of the annual reports of companies can contain additional information on the performance of companies in the future.
According to psychology, agency, and economic theories, managers have an incentive to hide information (Rutherford 2003; Brennan et al. 2009; Rutherford 2018; Hesarzadeh et al. 2020; Alduais 2022). Managers have incentives to distort bad news by using complicated language and unnecessarily long sentences (Rutherford 2003; de Souza et al. 2019; Dyer et al. 2016; Hesarzadeh et al. 2020; Smaili et al. 2022). Many studies have found that complex financial disclosures increase the cost of information disclosure by investors, and this effect is particularly significant for small investors (Grossman and Stiglitz 1980; Bloomfield 2002). Miller (2010) evaluated the complexity of annual firm reports in four ways, two of which were based on the length of disclosure, while the other two were based on disclosure readability. The complexity of annual reports is negatively correlated with the volume of transactions, i.e., the more complex the annual report, the lower the volume of transactions. Furthermore, complex textual reporting hinders investors’ ability to process and interpret annual reports, thus increasing the risk of information disclosure, and resulting in an increase in equity financing costs (Rjiba et al. 2021). This phenomenon is reflected in the impact of the complexity of annual reports on small investors. Loughran and McDonald (2011) determined that the readability of annual reports positively correlates with the volume of small investors’ transactions. They not only implemented commonly used computational linguistics readability measurement methods, such as the Fog index and Kincaid Flesch readability, they also adopted SEC in “a Plain English Handbook” in the examples provide, in order to establish their own readability measurement method. Courtis and Hassan (2002) also used the readability theory to study a company’s annual report. Scholars of accounting circles in various countries, especially Western accounting scholars, have never ceased their research on annual report readability in narrative reports (Courtis 2004; Jones and Shoemaker 1994).
Evidence regarding the effects of readability can be found in the literature (Hwang and Kim 2017). Additionally, while it is interesting to note that readability affects firm outcome variables such as corporate performance (Alduais 2022; Rutherford 2003; Subramanian et al. 1993; Hassan et al. 2019; Dalwai et al. 2021), subsequent stock price (Cotra and Jacobson 2014), forecast dispersion (Kothari et al. 2009), stock liquidity (Boubaker et al. 2019), and trading volume (De Franco et al. 2015; Brochet et al. 2016; Miller 2010), we are ultimately interested in finding out how readability affects stock returns, and whether having less readable annual reports diminishes continuing future stock returns.
H1a. 
The length and complexity of annual reports negatively affect stock returns.
Text-based information is likely to include factors that are related to stock prices. For example, the annual report of perfect companies includes many pages of management discussions to the financial statements. Since most financial statements are historical, texts in annual corporate reports may contain forward-looking information. Therefore, the information resulting from the text part of annual reports of companies can contain additional information on the performance of companies in the future. We assumed that the length and complexity of annual reports are negatively associated with future returns, and generate a market response.
H1b. 
The length and complexity of annual reports are predicted to negatively affect future returns.
According to a recent study on investor responses to accounting narratives (Riley et al. 2014), investors are influenced by various aspects of corporate reporting, when making investment decisions (Gonidakis et al. 2020). Tan et al. (2014) studied the interaction between investors’ financial literacy and the readability of financial disclosures, in order to determine how these aspects affect who makes decisions on the basis of disclosures. They found that interest is not consistent; positive intonation and low readability are combined, resulting in investors with low financial literacy and an optimistic attitude toward the company. However, when the financial literacy of higher investors faces the same portfolio, investors will not be satisfied by the company’s financial disclosure of improper, or even exaggerated, positive tones.
Recent research has looked at whether textual patterns can be used in financial statements to detect fraud. For example, Goel and Gangolly (2012); Goel et al. (2010); Gul et al. (2010); Humpherys et al. (2011); Purda and Skillicorn (2015), showed that managers tend to use deceptive language when committing fraud, which can facilitate its detection. Although this is an important field of research, one of the limitations of the analysis of specific linguistic patterns is that managers are constrained in their ability to hide weak operational performance with optimistic narrative disclosure. In fact, Tan et al. (2014) showed that sophisticated investors can see through positive disclosure. By contrast, managers are more likely to have greater flexibility in making narrative disclosures more complex and, therefore, less readable when committing fraud. In fact, Lo et al. (2017) showed that there is a negative correlation between financial statement readability and earnings management, probably because more readable financial statements reduce information asymmetry between managers and users (Lee 2012); furthermore, according to past research, managers are more likely to be fraudulent. When the financial statement readability is low, the probability of fraud is already negatively correlated with financial statement readability. This evidence is consistent with our expectations.
H2a. 
Investors react more strongly to annual report text when it is more readable.
An examination of the impact of financial report complexity on small and large investors is of great benefit to the many parties that are interested in reporting clarity and the ability to classify investors (Miller 2010). In this respect, directors are more likely to be free to write annual report texts than numbers, because they are subject to GAAP. Researchers found that investors respond to both the length and the readability of annual reports (Loughran and McDonald 2011; Miller 2010; Rennekamp 2012; You and Zhang 2009). Therefore, investors need to understand management behavior and strategic intentions, in order to fully understand the effects of published disclosure. The strength of market efficiency tests can be improved if the strategic nature of published disclosures can be exploited (Li 2008). Annual report readability, as an internal factor, affects investors’ feelings about a company’s annual report authenticity, the degree of confidence in the company, and investors’ desire to satisfy (Li 2008).
The readability of annual reports also affects the efficiency of the stock market in all the information that they provide. You and Zhang (2009) recognized that an investor’s negative response is statistically significant, if the company provides a longer annual report. In the group of companies that provided shorter annual data, this relationship was not statistically significant. However, You and Zhang (2009) only focused on the length of the report and stock price movements in the 12 months after the filing. Lawrence (2013), and Miller (2010), also pointed out that smaller investors prefer commercial stocks to those who provide more readable reports. A study conducted by Lawrence (2013) indicated that investors are more likely to hold stocks of firms that issue clear and concise financial reports.
H2b. 
Investors react more strongly to annual report text when it is written more firmly and concisely.

3. Research Methodology

In our research, we used a combination of data processing methods. Firstly, financial indicators were extracted from the CSMAR database. Annual reports were downloaded from the CNINFO website1 for all B-share listed companies from 2006 to 2018. For this purpose, we made some adjustments to the financial reports, changed the format of the files, and then extracted words from the text using some of the codes used in language software such as Python. Computer-aided textual analysis is an ongoing development in accounting and finance that involves analyzing large volumes of text, in order to reveal the linguistic features of a document (Clarkson et al. 2020; Al-Shaer et al. 2022; Loughran and McDonald 2014b). After modifying the documents and converting the PDF files to text files, the next step was to convert the qualitative data into quantitative data, in order to facilitate statistical analysis. Secondly, a computational method using Python data analysis was used to convert text into numbers, in order to facilitate the analysis process. Lastly, we analyzed multiple regressions for a set of models that were related to our study, using STATA software and Excel. Our study was empirical, in a sense that we used the event study of cumulative abnormal returns (CAR) and cumulative trade volume values. We also used the returns indicator to study future returns as the dependent variable.

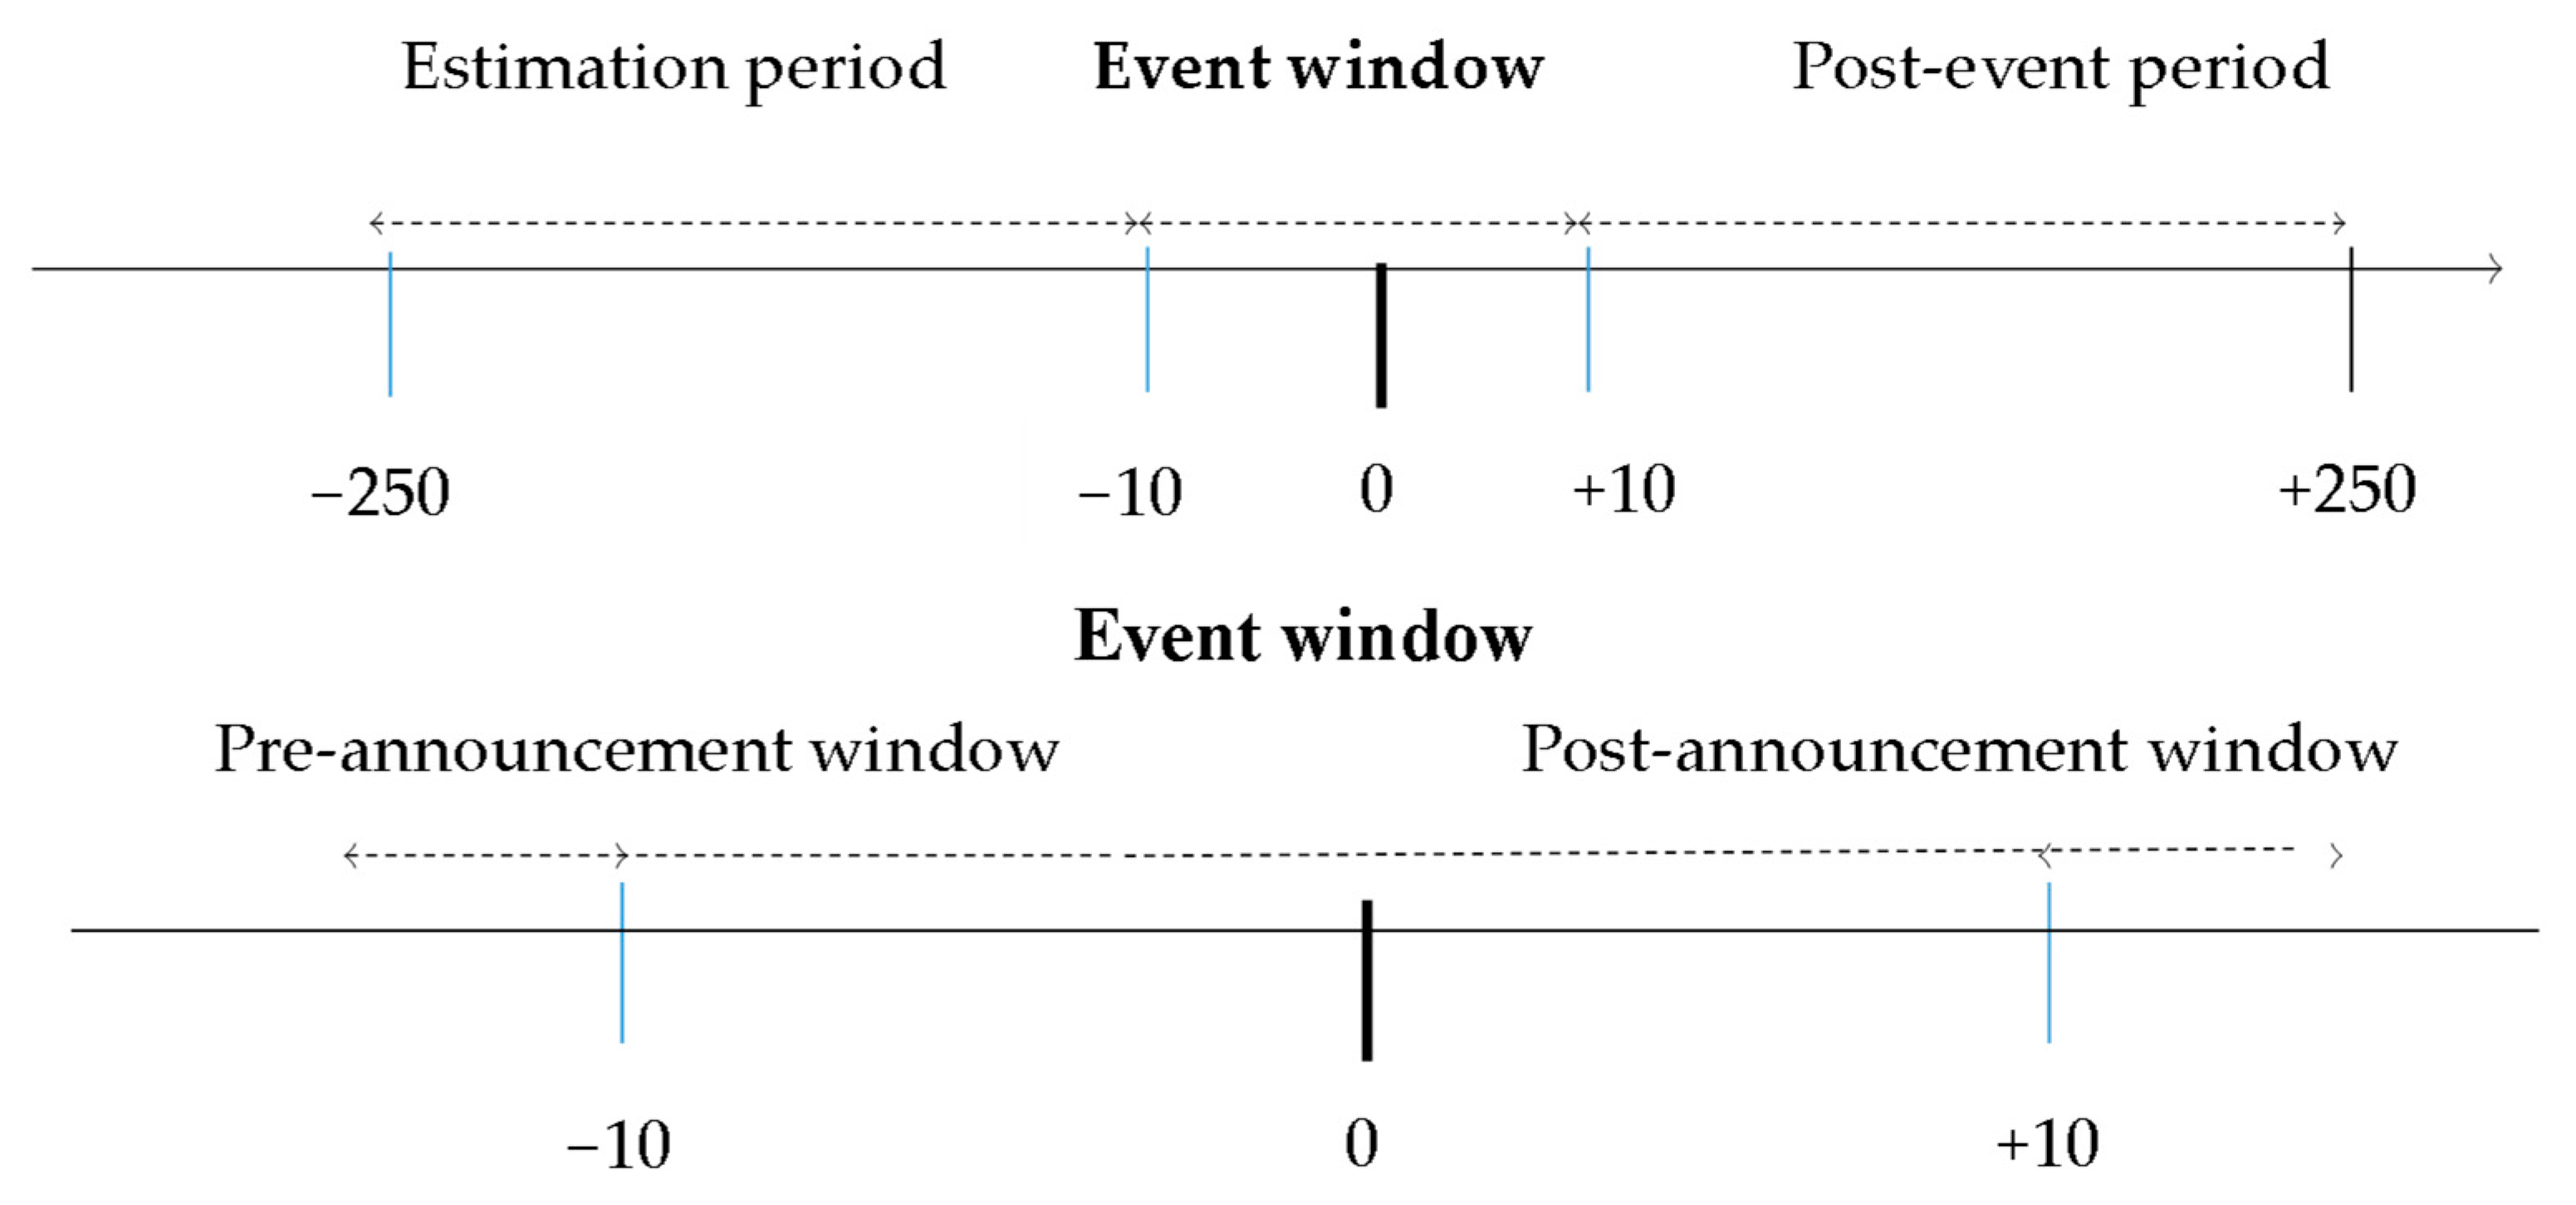
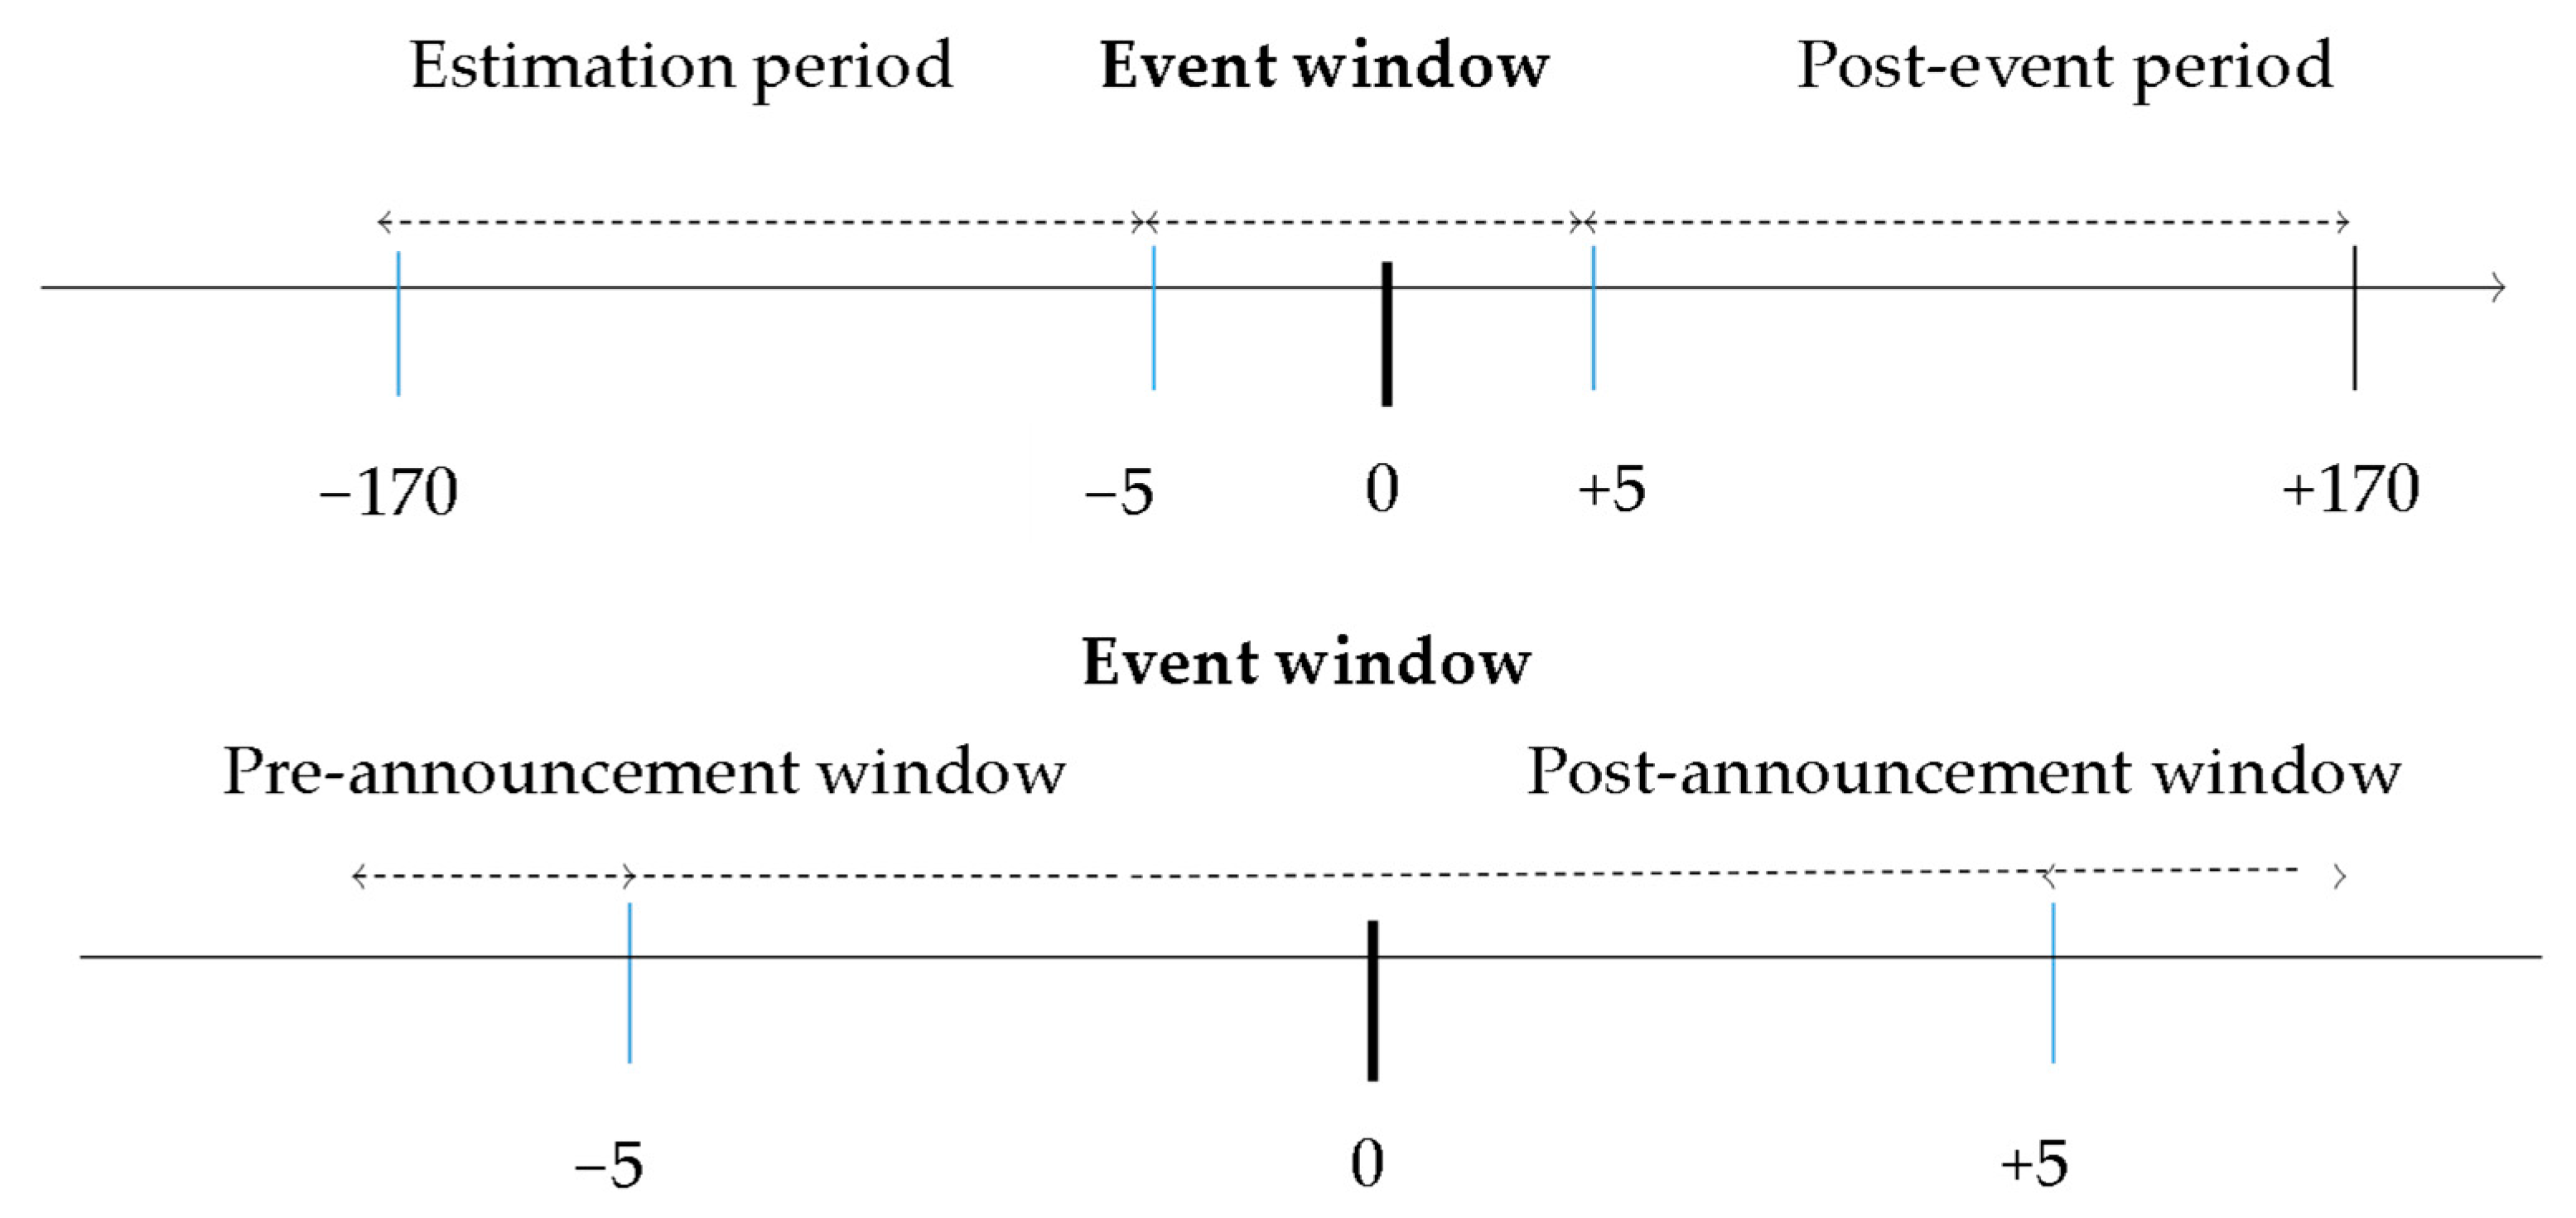
3.1. Sample Selection and Data Sources

This study used CSMAR’s available database of listed Chinese companies (Shenzhen); the sample included all CSMAR firm years between 2006 and 2018, representing a sample of listed Chinese companies. Moreover, we collected and obtained annual reports as PDF files. This process differed from that used in other studies, which processed data in HTML/XML formats (Li 2008). In order to derive readability measures, we first extracted the content of the reports. Extracting text from PDF files is difficult, and requires sophisticated processing, which may introduce errors. The process was organized as a pipeline of four modules: text extractor “PDF2Text” converter, text “cleaner”, relevant section extractor, and readability measure calculator. The PDF files were initially converted into text files. The Fog index and annual report length were calculated using publicly available Python libraries. In order to ensure the successful extraction of most financial reports during the data collection process, companies that provided two different formats of the same financial report had both reports extracted. The best version was manually selected. Manual checks were conducted, in order to ensure accuracy and consistency when deleting financial reports during the complete extraction process. We obtained a sample size of 268 firm years between 2006 and 2018. Regarding methodology, this research was an empirical study that was based on multivariate regression and econometric models. Statistical analysis was implemented to test the research hypothesis, using STATA software (StataCorp 2013, College Station, TX, USA) and Excel spreadsheet of Microsoft365.

3.2. Variables

Bloomfield (2002); Grossman and Stiglitz (1980); and Hirshleifer and Teoh (2003), measured readability according to the phenomenon that small- and medium-sized investors are more reluctant toward, or less capable of information extraction, from a less readable financial statement. However, the length of text may not be the best way to measure readability, because content written in concise English is usually shorter; moreover, it is difficult to ascertain whether investors are reacting to the readability, or to the reduced length of disclosure (Rennekamp 2012). Other studies used readability calculation numbers based on sentence length and syllable-based indicators, such as the Fog index or Flesch readability score (Lehavy et al. 2011; Loughran and McDonald 2011). Moreover, a new readability measurement method was realized by manipulating the wording of the selection and arrangement of choice, in order to provide the SEC “Plain Handbook” based on English (Cui 2016). On the basis of the given tutorial examples for writing a concise financial disclosure, researchers can determine whether the writing of a financial disclosure is valid, whereby a “high readability” version is more concise and easier to understand than a “low readability” version (Tan et al. 2015). However, this method is only applicable to experimental research (Biddle et al. 2009).

3.2.1. Dependent Variable

The primary problem of market reaction in research is the determination of the measurement index of information efficiency. In the stock market, no index can be used directly, and only alternative variables can be chosen. Collins et al. (1994) proposed a measure of stock information’s ability to reflect the earnings information of the stock in the future, i.e., with the annual return rate of the current stock as the dependent variable. Our study used the returns variable to study market reactions and the change in returns (∆returnst+n), where ∆returnst+n is the dependent variable, and reflects the changes in future returns (Returnst+1 − Returnst+2). Returns is defined as CSMAR’s annual return without cash dividends being reinvested, in order to determine whether market responses to future returns will follow any future movements. Furthermore, accumulated abnormal returns (CAR) were used to study the events surrounding the report, as adopted by Xu et al. (2019); Collins and Kothari (1989); and Lee (2012). The CAR was computed as a function of the abnormal returns accumulated during the event window. In addition, we used trade volume as an indicator of investor reactions. Our study used windows of ±10 days, ±5 days, and ±1 days around the event date as the event window. The CAR was measured as the difference between actual and predicted returns on the same day.
Consequently, researchers can study an event’s cumulative impact, because the effects may extend over several days. Fama et al. (1969) introduced event studies as a valuable method to study how stock prices respond to information. According to this theory, stock prices reflect the present value of future cash flows that are anticipated from a firm’s assets, including its current and future profit potential. Studies have focused on stock returns within a short window around events, assuming that the stock market integrates new information immediately and rationally. The advantage of using a short-term window is that the daily expected return is close to zero; therefore, the model for expected returns does not have a significant effect on abnormal returns (Fama 1998).

3.2.2. Independent Variable

The readability of annual reports can be measured in several ways, but no single method has been approved. As part of this study, we presented one commonly used readability measure. The independent variable was readability, measured using the Fog index. Prior studies have used the Fog index, including Lawrence (2013); Lehavy et al. (2011); Li (2008); Hwang and Kim (2017); and Alduais (2022). Following Loughran and McDonald (2014b); Bloomfield (2008); Luo et al. (2018); Li (2008); You and Zhang (2009); and Lawrence (2013), we adopted the length of English annual reports of Chinese-listed companies as a proxy for the complexity of the annual report. The length of the reports was based on the number of words in the reports. According to this view, longer reports exhibit lower readability because they contain more detailed information, forcing investors to spend more time and money on processing. The supposition presented here contrasts with the argument presented by Hwang and Kim (2017), in which they proposed that companies with complex operations are likely to provide more detailed explanations in their documentation, which might translate into longer documents and, possibly, longer sentences with more “complex” words. In research related to readability, the Fog index, introduced by Gunning (1952), has become increasingly popular. According to previous studies, the Fog index is the most commonly used measurement (Loughran and McDonald 2014b; Li 2008; Allini et al. 2017; Alm El-Din et al. 2022). Hooghiemstra et al. (2017) recommended aggregating both the Fog index and the length of the document into one composite measure of readability, using principal component analysis (PCA).
The Fog index (FI) is expressed in Equation (2). Complex words are measured as words with three syllables or more. A higher score on the Fog index indicates greater difficulty in reading the article.
Fog Index = (words per sentence + percent of complex words) × 0.4.
The number of words in each article, and the number of sentences in each article, are the common factors for measuring readability in English of an annual report (Cazier and Pfeiffer 2016; Lehavy et al. 2011; Loughran and McDonald 2011; Miller 2010; You and Zhang 2009), but serious differences in the nature of language render it difficult to choose the appropriate model for measuring text. It is certain that, compared to providing information negatively, providing information in a positive manner leads to more appropriate assessments (Levin et al. 1998). At a basic level, positive and negative language have a significant impact on how information is handled. The language also affects how information is understood.
The lengths of words (Equation (4)) are another measure of readability. The length of a report is the natural logarithm of the number of words in it. The natural logarithm was used instead of the raw numbers of words, in order to account for deviations in word count across companies, and some extreme values (Cheung 2014; Li 2008).
Length = Log (no. of words).
Readability measures are easy to adopt; they are reliable, valid, and objective, as shown in (Jones and Shoemaker 1994). Although Loughran and McDonald (2014a) disagreed with the use of the Fog index to evaluate financial documents, this study took the view, along with many other recent studies, that the Fog index is a suitable measure of financial disclosures (Lehavy et al. 2011; Miller 2010).

3.2.3. Control Variable

Following previous studies (Jiang et al. 2011; Li 2010; Loughran and McDonald 2014b; Lo et al. 2017; de Souza et al. 2019; Sun et al. 2022), we controlled a set of factors that may be systematically related to market and investor reaction.

3.3. Empirical Models

Our multivariate regression model examined the factors that determine the conciseness and complexity of annual reports. All of our regressions included year- and industry-fixed effects.
CAR[−10,10] = β0 + β1FI + β2FI × ROE + β3Length + β4Length × ROE
        + β5ROEit + β6BIG4it + β7lossit + β8NIDit + β9SIZEit
    + β10Growthit + β11BTMit + β12Volatilityit
      + Industry fixed effects + Year fixed effects + εit,
where CAR[−10,10] is the cumulative abnormal daily return of firm year, and readability is scaled by the factors of the Fog index and report length. Thus, a higher readability value represents better readability. The expectation is that readability will increase stock returns.
∆Returnt+n = β0 + β1FI + β2FI × ROE + β3Length + β4Length × ROE
      + β5ROEit + β6BIG4it + β7lossit + β8NIDit + β9SIZEit
 + β10Growthit + β11BTMit + β12Volatilityit
     + Industry fixed effects + Year fixed effects +εit,
where ∆Earningst+n is the dependent variable, and reflects the changes in future returns (Returnst+1 − Returnst+2). Returnit is the annual return of the firm year.
CAATV[−5,5] = β0 + β1FI + β2FI × SUPR + β3Length + β4Length × SUPR
           + β5SUPRit + β6ROEit + β7BIG4it + β8lossit + β9NIDit + β10SIZEit
+ β11Growthit + β12BTMit + β13Volatilityit
    + Industry fixed effects + Year fixed effects + εit,
The dependent variable was CAATV[−5,5], which is the cumulative abnormal of the annual trading volume.

4. Empirical Results and Discussion

4.1. Descriptive Statistics

Table 1 presents the summary statistics of the sample. The mean Fog index of the annual report was 14.30. According to the standard interpretation of the index, annual financial reports in this sample were classified as “difficult” to read. For US data (Li 2008), the mean of the Fog index of the notes was 18.96; this meant that, on average, financial reports in the US were classified as unreadable. It appears that the mean annual reports in China were easier to read than those in the US. Our findings show the same results; the FI was 14.30, which was even lower than that reported by Li (2008).
Table 2 presents Pearson’s correlation coefficients for the multivariate variables. In some cases, the Pearson correlation between length and CAR, size and CAATV, and size and growth, for example, exceeded 0.5, suggesting a potential collinearity issue. In addition, we examined the effects of the linear relationship by calculating the variance inflation factor (VIF) for each variable. Accordingly, multicollinearity was not observed. All of the associations were fairly low, which suggested that interlaced linearity was not likely a concern.

4.2. The Effect of Readability on Cumulative Abnormal Returns (Testing H1a)

Table 3 presents the results, using 21-day ([−10, +10], see Figure 1) abnormal returns around the annual report announcement date as the dependent variable. Column 1 shows a significantly negative coefficient for the interaction between the FI of annual reports and earnings (FI × ROE coefficient = −0.979 **).
Our results are in line with H1a, whereby lower readability (higher Fog index) was correlated with lower stock returns, as a consequence of the difficulty in understanding many concepts of reports. Furthermore, as shown in Column 2, the length of the report interaction with earnings (length × ROE) had a negative and significant impact on CAR at −1.061 *, indicating that as the length of the report increased, the CAR decreased. Thus, greater report conciseness is linked to greater confidence, and increased returns for the company, thus supporting H1a, that greater complexity and length of reports are negatively associated with stock returns.

4.3. The Effect of Length and Fog Index on Future Stock Returns (Testing H1b)

As the stock market may underreact to textual information found in annual reports (Li 2006), we tested the impact of the readability of financial reports on future returns. Table 4 shows that the Length × ROE of reports and FI × ROE both negatively affected future returns, as shown in Columns 1–6, indicating that, in the case of increased Fog index or report length (which leads to low readability), there are lower returns in the future. Our findings indicate that investors may have difficulty understanding annual reports, and may be unwilling to invest in the future, resulting in a lack of current and future returns. In line with H2b, the regression analysis revealed a significant negative correlation between the Fog index and future stock returns.

4.4. Effect of Length and Fog Index on Trading Volume (Testing H2a and H2b)

Table 5 reports the results of further regression analyses, using an 11-day ([−5, +5], see Figure 2) abnormal trading volume around the earnings announcement date as the dependent variable, and earnings surprise (SURP) as an alternative variable to interact with readability variable measures (Xu et al. 2019).
The findings indicate a significantly negative coefficient for the interaction of FI with SURP (coefficient = −24.55 **) at the 5% level. This result indicates that CAATV[−5, +5] decreased when there was an earnings surprise, and the annual report was longer.
The results support H2a, that investors react more strongly to the annual report text when it is more readable.
As shown in Table 5, an increase in the interaction of FI with the SURP of the report led to a decrease in trading volume (coefficient = −24.55), and the effect remained significantly negative. The results support H2b, that investors react more strongly to the annual report text when it is written more firmly and concisely. However, the results are also consistent with the finding that conciseness provides greater clarity and, therefore, has less impact on investors (Xu et al. 2019).

4.5. Robustness: Two-Stage Least Squares (2SLS) Regression Analysis

A variable metric error and the absence of an important variable in the model will generate endogenous problems, increase the probability of stochastic disturbances, and erode research validity. The purpose of this section was to mitigate endogeneity through the use of instrumental variables. We tested the method for robustness, in order to ensure the validity of our conclusions. It was difficult to include all of the factors that influence annual reports in the aforementioned model, due to the complexity of the reports. The missing variables represented a significant factor that contributed to the endogeneity problems within this study. It is possible for management to use a disclosure strategy that retains a good readability, leading to endogenous self-selection. Consequently, this paper used the instrumental variable method to assess robustness, constituting the annual readability–location score that belonged to the same prefecture-level city, and the readability–industry score that belonged to the same industry. Due to the competitive environment, political environment, and social environment of similar enterprises, they are relatively close to one another. As a result, enterprises operating in the same industry or region have the same average performance that is influenced by the performance of each individual enterprise; however, average performance was not influenced by the investment decisions of the individual enterprises. This variable can be used as an instrumental variable for the performance of endogenous explanatory variables, since it is exogenous to an enterprise.
Table 6 shows the first-stage regression summary statistics. The purpose of this test was to determine whether both instruments are jointly significant. A p-value of 0.000 indicates that they were jointly significant, thus strengthening the instruments. For instruments to be considered sufficiently strong, an F-statistic > 10 is generally required. Furthermore, 2SLS may produce standard errors that are too small if the instruments are weak.
The factors that influence readability can also affect the market response during the annual report window; hence, it may be necessary to use an instrumental variable (IV) approach to account for the endogenous effects of readability. However, it is difficult to find instruments that are highly correlated with unexpected readability, and not associated with stock returns. For example, changes in the determinants of annual report readability are poor instruments for the length and Fog index. Larcker and Rusticus (2010) suggested that if the instruments are only weakly associated with the endogenous variable, 2SLS estimation can result in more questionable coefficient estimates than OLS estimation. For this purpose, we conducted a two-stage multiple regression test. In the first stage, we tested the OLS of the relationship between IV and the Fog index. In the second stage, we tested whether there was a change in the results that may have been affected by the proposed IV, represented by the Fog_location and Fog_industry variables (Ertugrul et al. 2017). In addition, we decided to shorten the earnings announcement window CAR[−1,+1], see Figure 3. Because, in terms of investor attention, a large body of research has shown that stock markets react immediately to relevant announcements during short-window events (Hirshleifer and Teoh 2003). This suggests that some investors pay immediate attention to relevant announcements. As a result of this short event window, endogeneity concerns that are related to correlated variables are mitigated (Hsieh et al. 2016).
As shown in Table 7, the OLS test produced a significant positive relationship between the IV and the Fog index. After predicting the Fog index, the results were still significantly negative for CAR[−1,+1]. We can find that the coefficient of the Fog index that was predicted with the interaction remained negative and significant (FI × ROE_P coefficient = −0.219).

5. Discussion

According to the results of testing the research hypotheses, some evidence of continued earnings and market participants’ reactions to the Chinese stock market can be derived. As with the previous literature, this paper’s empirical results indicated a low level of continued profitability in the Chinese stock markets when readability was low, and moreover, when the complexity and length of the financial report increased. The study examined whether investors reacted properly to financial reporting information and its components. The results indicated that investors failed to use the information of the continuation of profits. They usually underestimated the importance of this information. Investors focused too much on the details that they considered to be an aid to them, due to lacking knowledge of financial and accounting terminology related to this field whenever readability decreased; this led to a low level of stock return. This finding is consistent with our prediction that the market reacts positively to more readable reports, which agrees with Gong et al. (2016).
This result is inconsistent with previous studies (Li 2006, 2008) where no significant association was found between readability and the length of annual reports or future stock returns (Li 2008). Our findings reported the effect of readability on stock returns; the length of the annual financial report contributed to low returns, and to a low level of continued returns in the future. Recent accounting research has supported the idea that deliberate confusion about bad news can be a useful strategy for managers, and consistent evidence has been found that investors are less responsive to less readable disclosures (Koonce et al. 2016; Lawrence 2013; Miller 2010; Rennekamp 2012; Tan et al. 2015; You and Zhang 2009).
As a result, managers may have different intentions; on the one hand, they can make it simple, clear, and understandable when they want to share good news with investors and beneficiaries, whereas they may prefer to communicate in a confusing, complex, and less understandable manner when they seek to delay the incorporation of bad news into stock prices (Li 2008). This can lead to negative future returns. Following these arguments, the readability of annual reports reflects the extent to which managers attempt to manipulate reports, and can be used by market participants and intermediaries to assess management intentions in making investment decisions (Chakraborty and Bhattacharjee 2020; Li 2008; Li and Zhang 2015; Soepriyanto et al. 2021).
On the other hand, as in stock returns, the length of the report negatively affects the volume of trading, i.e., increasing length of the report decreases the volume of trading. Our findings indicate that the positivity that is inherent in the qualitative parts of the annual reports has a statistically significant relationship with returns and trading volume. This result is not consistent with Miller (2008), who reported that there was no relationship among readability, trading volume, and consensus. The trading volume is lower when reports contain a greater proportion of difficult words. We found evidence of the impact of the report on the behavior of commercial investors. Furthermore, there was significant evidence that showed investors are affected by longer reports; the results indicated that the length coefficient was negative. According to these results, poor readability of annual reports results in investors’ failure to respond in time to the information, resulting in a smaller market response when the annual report is disclosed, which is also consistent with Lee (2012) and Xu et al. (2019).
Many studies have shown that complex languages do not encourage individual investors’ circulation, due to their increased information processing costs (De Franco et al. 2015; Lawrence 2013; Miller 2010). We agree with the evidence that trading volumes are lower when the Fog index is higher, which may lead to less readable annual reports (De Franco et al. 2015). In both columns, there was significant evidence that revealed less readable reports impacted investors’ trading volumes, with some variation in the impact ratio depending on the control variables. This also supports the notion that a higher readability of an annual report results in investors being more willing to trade information. This evidence is consistent with the increase in the cost of processing large investors when reports are less readable, attracting those who continue to buy more shares on the basis of information disclosed in financial reports, which appear simpler for them to understand.
The results in Table 5 contrast with the results of Miller (2010) and You and Zhang (2009), as our findings confirmed that the report’s length negatively affected and was associated with a lower total volume of trade. Our findings are consistent with previous empirical evidence on annual report readability (Lee 2012; Lehavy et al. 2011; Li 2008; Lo et al. 2017; Xu et al. 2019; Luo et al. 2018; Koonce et al. 2016; Asay et al. 2018; Moreno and Jones 2021; Kong et al. 2021). According to the results, we conclude that these indices are in line with the theoretical prediction of management’s motivation to contribute to readability, and consequently interfere with investors’ understanding of information.
According to the evidence presented in this paper, it is clear that disclosures and reporting of the most complex accounting information may be very costly for some investors. Specifically, there is evidence that more complex disclosures and reporting are associated with reduced trading activity and reduced investment capacity from investors, but these have little impact on major investors. Through the analyses, similar results were found that showed more complex reports led to less abnormal trades, which appears to be driven by the complexity of the company’s relative reports, as well as by deviations in reporting complexity over time; these results are inconsistent with those of Miller (2008), who found that there was no evidence of a relationship among readability, trading volume, and consensus. Additional analyses revealed that the effects of reading and length appear to be alternatives, with longer reports dominating the readability of reports when analyzing both complexity metrics simultaneously.

6. Conclusions

Our analysis of stock returns and trade volume, at the time annual reports are released, used an event study design to explore the implications of report readability on the market and investors’ reactions. Textual analysis research has been conducted in the accounting field for several years. Most of the existing literature has focused on disclosure length and the Fog index as proxies for the readability of annual reports (Loughran and McDonald 2014b; Bloomfield 2008; Luo et al. 2018; Li 2008; You and Zhang 2009; Lawrence 2013; Allini et al. 2017). It was critical to take special care in this study, in order to determine how the market would respond. In addition, market reactions have been a critical topic (Davis and Tama-Sweet 2012; Lennox and Park 2006). In the regression analysis, we found that, after controlling for other variables, longer annual reports accumulated significantly higher abnormal return volatility. This relationship does not appear to be a simple artefact of firm complexity. The less material that investors have to recap in order to obtain relevant information from company managers, the better they are able to predict post-relevant events. Furthermore, this study reinforced the hypothesis that the readability of financial reports affects financial market response. The results indicated that more complex annual reports are correlated with lower current returns, and negatively affect the expectation of future returns. These results are inconsistent with Li (2006), who found that there was no clear evidence of a statistical relationship between the readability of financial reports and future stock returns. We found that the Fog index increased the difficulty of predicting future returns, and correlated with a low level of current returns. In addition, we examined the effects of readability on trade volume, in order to explain investors’ responses. We found that trading volume was negatively impacted by annual complex reports, due to investors’ inability to deal with more complicated reports.
This study contributes to the literature on market efficiency, by investigating whether the stock market reflects the information that is reported in annual reports. In addition to contributing to the literature on accounting and finance report readability, this study provides empirical evidence that market reactions are associated with readability via a reduction in earnings uncertainty. Furthermore, our study contributes to the literature on annual reports, showing that these reports are significant outputs from firms, and are widely read by a wide range of investors. These findings have implications for practitioners, regulators, and users. Firstly, it highlights the difficulties that are faced by practitioners, especially managers and accountants, when drafting an understandable disclosure that should comply with updated regulatory expectations. As such, it seems appropriate to reconsider the methodology that is employed to prepare notes for companies’ financial statements. This study has crucial implications for regulators. Certainly, there is a strong need to introduce rules and recommendations, in order to guide accountants in producing concise reports.
Secondly, it becomes apparent that the textual features of corporate reports are important when it comes to explaining cross-sectional variations in company outcomes. We further extend the growing literature by investigating the readability of financial disclosures (e.g., Lawrence 2013; Lee 2012; Lehavy et al. 2011; Li 2008, 2010; Loughran and McDonald 2009, 2014a; Lundholm et al. 2014; Miller 2010; You and Zhang 2009; Alduais 2022; Ertugrul et al. 2017; Moreno and Jones 2021; Asay et al. 2018; Sun et al. 2022; Li et al. 2022). Furthermore, in addition to directly contributing to the emerging literature on reporting complexity, this study complements a large body of research that demonstrated the benefits of more informative disclosures (Botosan 1997; Francis et al. 2002; Lang and Lundholm 1996), trading volume reactions to information releases (Li and Ramesh 2009), and the differential trading behavior of investors in response to different information events (Merkley et al. 2015; Shanthikumar 2003). One of the important implications of our study derives from our findings on how to promote and support investors’ knowledge of development paths that stem from effective methods. Therefore, we propose raising the issue of how to strengthen and support investors in terms of how to develop and improve this capacity, through a monitoring of the legal infrastructure of the competent authorities.
Additionally, this research can provide users with implications for how to interpret the information in financial statements. Lastly, managers should be encouraged to write their annual reports more concisely. In summary, concise and well-written documents are more likely to be read, and the information from annual reports is more likely to influence potential investors and market reactions. As the coronavirus pandemic affected the disclosures and results of many companies, future studies should compare the conciseness of annual reports before and after the pandemic. Furthermore, we recommend utilizing additional readability measures.

Author Contributions

Conceptualization, F.A.; Data curation, F.A.; Formal analysis, F.A.; Funding acquisition, F.A., N.A.A., A.S. and A.M.; Investigation, F.A. and N.A.A.; Methodology, F.A., N.A.A., A.S. and A.M.; Project administration, F.A.; Resources, F.A.; Software, F.A.; Supervision, F.A.; Validation, F.A. and N.A.A.; Visualization, F.A.; Writing—original draft, F.A., N.A.A., A.S. and A.M.; Writing—review & editing, F.A., N.A.A., A.S. and A.M. All authors have read and agreed to the published version of the manuscript.

Funding

This research received no external funding.

Informed Consent Statement

Not applicable.

Data Availability Statement

The data presented in this study are available on request from the first author.

Acknowledgments

The publication of this research has been supported by the Deanship of Scientific Research and Graduate Studies at Philadelphia University, Jordan.

Conflicts of Interest

The authors declare no conflict of interest.

Note

1
The listed annual reports of companises came from the following website: http://www.cninfo.com.cn/ (accessed on 12 April 2022).

References

  1. Alduais, Fahd. 2022. Textual Analysis of the Annual Report and Corporate Performance: Evidence from China. Journal of Financial Reporting and Accounting. ahead-of-print. [Google Scholar] [CrossRef]
  2. Allini, Alessandra, Luca Ferri, Marco Maffei, and Annamaria Zampella. 2017. From Accountability to Readability in the Public Sector: Evidence from Italian Universities. International Journal of Business and Management 12: 27. [Google Scholar] [CrossRef] [Green Version]
  3. Alm El-Din, Mai Mohammed, Atef Mohammed El-Awam, Farid Moharram Ibrahim, and Ahmed Hassanein. 2022. Voluntary Disclosure and Complexity of Reporting in Egypt: The Roles of Profitability and Earnings Management. Journal of Applied Accounting Research 23: 480–508. [Google Scholar] [CrossRef]
  4. Al-Shaer, Habiba, Khaldoon Albitar, and Khaled Hussainey. 2022. Creating Sustainability Reports That Matter: An Investigation of Factors behind the Narratives. Journal of Applied Accounting Research 23: 738–63. [Google Scholar] [CrossRef]
  5. Anh-Tuan, Le, Nguyen Thi Huyen-Tram, Nguyen Xuan-Hung, and Nguyen Vuong Thanh-Long. 2022. Disclosure of Environmental Accounting Information at Business Enterprises in the Hotel Sector: Case Study in Vietnam. GeoJournal of Tourism and Geosites 42: 700. [Google Scholar] [CrossRef]
  6. Asay, H. Scott, Robert Libby, and Kristina Rennekamp. 2018. Firm Performance, Reporting Goals, and Language Choices in Narrative Disclosures. Journal of Accounting and Economics 65: 380–98. [Google Scholar] [CrossRef]
  7. Ball, Ray, and Philip Brown. 1968. An Empirical Evaluation of Accounting Income Numbers. Journal of Accounting Research 6: 159. [Google Scholar] [CrossRef] [Green Version]
  8. Biddle, Gary C., Gilles Hilary, and Rodrigo S. Verdi. 2009. How Does Financial Reporting Quality Relate to Investment Efficiency? Journal of Accounting and Economics 48: 112–31. [Google Scholar] [CrossRef]
  9. Bloomfield, Robert J. 2002. The ‘Incomplete Revelation Hypothesis’ and Financial Reporting. Accounting Horizons 16: 233–43. [Google Scholar] [CrossRef]
  10. Bloomfield, Robert J. 2008. Discussion of ‘Annual Report Readability, Current Earnings, and Earnings Persistence’. Journal of Accounting and Economics 45: 248–52. [Google Scholar] [CrossRef]
  11. Bonsall, Samuel B., and Brian P. Miller. 2017. The Impact of Narrative Disclosure Readability on Bond Ratings and the Cost of Debt. Review of Accounting Studies 22: 608–43. [Google Scholar] [CrossRef]
  12. Bonsall, Samuel B., Andrew J. Leone, Brian P. Miller, and Kristina Rennekamp. 2017. A Plain English Measure of Financial Reporting Readability. Journal of Accounting and Economics 63: 329–57. [Google Scholar] [CrossRef]
  13. Botosan, Christine A. 1997. Disclosure Level and the Cost of Equity Capital. The Accounting Review 72: 323–49. [Google Scholar] [CrossRef]
  14. Boubaker, Sabri, Dimitrios Gounopoulos, and Hatem Rjiba. 2019. Annual Report Readability and Stock Liquidity. Financial Markets, Institutions and Instruments 28: 159–86. [Google Scholar] [CrossRef]
  15. Brennan, Niamh M., Encarna Guillamon-Saorin, and Aileen Pierce. 2009. Impression Management: Developing and Illustrating a Scheme of Analysis for Narrative Disclosures—A Methodological Note. Accounting, Auditing and Accountability Journal 22: 789–832. [Google Scholar] [CrossRef]
  16. Brochet, François, Patricia Naranjo, and Gwen Yu. 2016. The Capital Market Consequences of Language Barriers in the Conference Calls of Non-U.S. Firms. The Accounting Review 91: 1023–49. [Google Scholar] [CrossRef]
  17. Cazier, Richard A., and Ray J. Pfeiffer. 2016. Why Are 10-K Filings So Long? Accounting Horizons 30: 1–21. [Google Scholar] [CrossRef]
  18. Chakraborty, Bijitaswa, and Titas Bhattacharjee. 2020. A Review on Textual Analysis of Corporate Disclosure According to the Evolution of Different Automated Methods. Journal of Financial Reporting and Accounting 18: 757–77. [Google Scholar] [CrossRef]
  19. Cheung, Esther Wai Yin. 2014. Readability of Financial Reports and IFRS Adoption in Australia. Ph.D. thesis, Macquarie University, Sydney, Australia. Available online: http://hdl.handle.net/1959.14/1059107 (accessed on 15 May 2022).
  20. Clarkson, Peter M., Jordan Ponn, Gordon D. Richardson, Frank Rudzicz, Albert Tsang, and Jingjing Wang. 2020. A Textual Analysis of US Corporate Social Responsibility Reports. Abacus 56: 3–34. [Google Scholar] [CrossRef]
  21. Clatworthy, Mark, and Michael John Jones. 2001. The Effect of Thematic Structure on the Variability of Annual Report Readability. Accounting, Auditing & Accountability Journal 14: 311–26. [Google Scholar] [CrossRef]
  22. Collins, Daniel W., and S. P. Kothari. 1989. An Analysis of Intertemporal and Cross-Sectional Determinants of Earnings Response Coefficients. Journal of Accounting and Economics 11: 143–81. Available online: http://www.sciencedirect.com/science/article/pii/0165410189900049 (accessed on 15 May 2022). [CrossRef]
  23. Collins, Daniel W., Sagar P. Kothari, Jay Shanken, and Richard G. Sloan. 1994. Lack of Timeliness and Noise as Explanations for the Low Contemporaneuos Return-Earnings Association. Journal of Accounting and Economics 18: 289–324. [Google Scholar] [CrossRef]
  24. Cotra, Marko, and Fredrik Jacobson. 2014. The Effects of Annual Report Readability on Subsequent Stock Price Volatility. Bachelor thesis, Gothenburg University, Gothenburg, Sweden. [Google Scholar]
  25. Courtis, John K. 2004. Corporate Report Obfuscation: Artefact or Phenomenon? British Accounting Review 36: 291–312. [Google Scholar] [CrossRef]
  26. Courtis, John K., and Salleh Hassan. 2002. Reading Ease of Bilingual Annual Reports. Journal of Business Communication 39: 394–413. [Google Scholar] [CrossRef]
  27. Cui, Xiao. 2016. Calisthenics with Words: The Effect of Readability and Investor Sophistication on Investors’ Performance Judgment. International Journal of Financial Studies 4: 1. [Google Scholar] [CrossRef] [Green Version]
  28. Dalwai, Tamanna, Gopalakrishnan Chinnasamy, and Syeeda Shafiya Mohammadi. 2021. Annual Report Readability, Agency Costs, Firm Performance: An Investigation of Oman’s Financial Sector. Journal of Accounting in Emerging Economies 11: 247–77. [Google Scholar] [CrossRef]
  29. Davis, Angela K., and Isho Tama-Sweet. 2012. Managers’ Use of Language Across Alternative Disclosure Outlets: Earnings Press Releases versus MD&A. Contemporary Accounting Research 29: 804–37. [Google Scholar] [CrossRef]
  30. De Franco, Gus, Ole-Kristian Hope, Dushyantkumar Vyas, and Yibin Zhou. 2015. Analyst Report Readability. Contemporary Accounting Research 32: 76–104. [Google Scholar] [CrossRef]
  31. de Souza, João Antônio Salvador, Jean Carlo Rissatti, Suliani Rover, and José Alonso Borba. 2019. The Linguistic Complexities of Narrative Accounting Disclosure on Financial Statements: An Analysis Based on Readability Characteristics. Research in International Business and Finance 48: 59–74. [Google Scholar] [CrossRef]
  32. Dey, R. Mithu, and Lucy Lim. 2015. Accrual Reliability, Earnings Persistence, and Stock Prices: Revisited. American Journal of Business 30: 22–48. [Google Scholar] [CrossRef]
  33. du Toit, Elda. 2017. The Readability of Integrated Reports. Meditari Accountancy Research 25: 629–53. [Google Scholar] [CrossRef] [Green Version]
  34. Dyer, Travis, Mark Lang, and Lorien Stice-Lawrence. 2016. Do Managers Really Guide through the Fog? On the Challenges in Assessing the Causes of Voluntary Disclosure. Journal of Accounting and Economics 62: 270–76. [Google Scholar] [CrossRef]
  35. Ertugrul, Mine, Jin Lei, Jiaping Qiu, and Chi Wan. 2017. Annual Report Readability, Tone Ambiguity, and the Cost of Borrowing. Journal of Financial and Quantitative Analysis 52: 811–36. [Google Scholar] [CrossRef] [Green Version]
  36. Ezat, Amr Nazieh. 2019. The Impact of Earnings Quality on the Association between Readability and Cost of Capital: Evidence from Egypt. Journal of Accounting in Emerging Economies 9: 366–85. [Google Scholar] [CrossRef]
  37. Fama, Eugene F. 1998. Market Efficiency, Long-Term Returns, and Behavioral Finance. Journal of Financial Economics 49: 283–306. [Google Scholar] [CrossRef]
  38. Fama, Eugene F., Lawrence Fisher, Michael Jensen, and Richard Roll. 1969. The Adjustment of Stock Prices to New Information. International Economic Review 10: 1–21. [Google Scholar] [CrossRef]
  39. Francis, Jennifer, Ryan Lafond, and Katherine Schipper. 2002. The Market Pricing of Earnings Quality. Journal of Accounting and Economics 39: 295–327. [Google Scholar] [CrossRef]
  40. Goel, Sunita, and Jagdish Gangolly. 2012. Beyond the Numbers: Mining the Annual Reports for Hidden Cues Indicative of Financial Statement Fraud. Intelligent Systems in Accounting, Finance and Management 19: 75–89. [Google Scholar] [CrossRef]
  41. Goel, Sunita, Jagdish Gangolly, Sue R. Faerman, and Ozlem Uzuner. 2010. Can Linguistic Predictors Detect Fraudulent Financial Filings? Journal of Emerging Technologies in Accounting 7: 25–46. [Google Scholar] [CrossRef] [Green Version]
  42. Gong, Minggen, Yifei Lu, and Jing Yao. 2016. Annual Report Opacity and Stock Returns: Evidence from China. SSRN Electronic Journal. [Google Scholar] [CrossRef]
  43. Gonidakis, Fragiskos K., Andreas G. Koutoupis, Anastasios D. Tsamis, and Maria Eleni K. Agoraki. 2020. Risk Disclosure in Listed Greek Companies: The Effects of the Financial Crisis. Accounting Research Journal 33: 615–33. [Google Scholar] [CrossRef]
  44. Grossman, Sanford J., and Joseph E. Stiglitz. 1980. On the Impossibility of Informationally Efficient Markets. The American Economic Review 70: 393–408. Available online: http://www.jstor.org/stable/1805228 (accessed on 15 May 2022).
  45. Gul, Ferdinand A., Jeong-Bon Kim, and Annie A. Qiu. 2010. Ownership Concentration, Foreign Shareholding, Audit Quality, and Stock Price Synchronicity: Evidence from China. Journal of Financial Economics 95: 425–42. Available online: https://www.sciencedirect.com/science/article/pii/S0304405X09002359 (accessed on 15 May 2022). [CrossRef]
  46. Gunning, Robert. 1952. The Technique of Clear Writing. New York: McGraw-Hill. [Google Scholar]
  47. Hassan, Mostafa Kamal, Bassam Abu Abbas, and Samy Nathan Garas. 2019. Readability, Governance and Performance: A Test of the Obfuscation Hypothesis in Qatari Listed Firms. Corporate Governance (Bingley) 19: 270–98. [Google Scholar] [CrossRef]
  48. Hesarzadeh, Reza, Ameneh Bazrafshan, and Javad Rajabalizadeh. 2020. Financial Reporting Readability: Managerial Choices versus Firm Fundamentals. Spanish Journal of Finance and Accounting/Revista Española de Financiación y Contabilidad 49: 452–82. [Google Scholar] [CrossRef]
  49. Hirshleifer, David, and Siew Hong Teoh. 2003. Limited Attention, Information Disclosure, and Financial Reporting. Journal of Accounting and Economics 36: 337–86. [Google Scholar] [CrossRef]
  50. Hooghiemstra, Reggy, Yu Flora Kuang, and Bo Qin. 2017. Does Obfuscating Excessive CEO Pay Work? The Influence of Remuneration Report Readability on Say-on-Pay Votes. Accounting and Business Research 47: 695–729. [Google Scholar] [CrossRef]
  51. Hrasky, Sue, Clare Mason, and Debbie Wills. 2009. The Textual Complexity of Annual Report Narratives: A Comparison of High- and Low-Performance Companies. New Zealand Journal of Applied Business Research 7: 31–45. [Google Scholar]
  52. Hsieh, Chia Chun, Kai Wai Hui, and Yao Zhang. 2016. Analyst Report Readability and Stock Returns. Journal of Business Finance and Accounting 43: 98–130. [Google Scholar] [CrossRef]
  53. Humpherys, Sean L., Kevin C. Moffitt, Mary B. Burns, Judee K. Burgoon, and William F. Felix. 2011. Identification of Fraudulent Financial Statements Using Linguistic Credibility Analysis. Decision Support Systems 50: 585–94. [Google Scholar] [CrossRef]
  54. Hwang, Byoung Hyoun, and Hugh Hoikwang Kim. 2017. It Pays to Write Well. Journal of Financial Economics 124: 373–94. [Google Scholar] [CrossRef]
  55. Jiang, Haiyan, Ahsan Habib, and Baiding Hu. 2011. Ownership Concentration, Voluntary Disclosures and Information Asymmetry in New Zealand. British Accounting Review 43: 39–53. [Google Scholar] [CrossRef]
  56. Jones, Michael John, and Paul A. Shoemaker. 1994. Accounting Narratives: A Review of Empirical Studies of Content and Readability. Journal of Accounting Literature 13: 142. Available online: https://search.proquest.com/openview/e6a9b341cb35264bfa683df5eb62f131/1?pq-origsite=gscholar&cbl=31366 (accessed on 15 May 2022).
  57. Kong, Dongmin, Lu Shi, and Fan Zhang. 2021. Explain or Conceal? Causal Language Intensity in Annual Report and Stock Price Crash Risk. Economic Modelling 94: 715–25. [Google Scholar] [CrossRef]
  58. Koonce, Lisa, Zheng Leitter, and Brian J. White. 2016. The Effect of a Cautionary Notice on Investorss Reactions to More and Less Readable Disclosures. SSRN Electronic Journal. [Google Scholar] [CrossRef]
  59. Kothari, Sabino P., Xu Li, and James E. Short. 2009. The Effect of Disclosures by Management, Analysts, and Business Press on Cost of Capital, Return Volatility, and Analyst Forecasts: A Study Using Content Analysis. Accounting Review 84: 1639–70. [Google Scholar] [CrossRef]
  60. Kristandl, Gerhard, and Nick Bontis. 2007. The Impact of Voluntary Disclosure on Cost of Equity Capital Estimates in a Temporal Setting. Journal of Intellectual Capital 8: 577–94. [Google Scholar] [CrossRef]
  61. Lang, Mark H., and Russell J. Lundholm. 1996. Corporate Disclosure Policy and Analyst Behavior. The Accounting Review 71: 467–92. [Google Scholar] [CrossRef]
  62. Lang, Mark. 2015. Textual Analysis and International Financial Reporting: Large Sample Evidence. Journal of Accounting and Economics 60: 110–35. [Google Scholar] [CrossRef]
  63. Larcker, David F., and Tjomme O. Rusticus. 2010. On the Use of Instrumental Variables in Accounting Research. Journal of Accounting and Economics 49: 186–205. Available online: https://www.sciencedirect.com/science/article/pii/S0165410109000718 (accessed on 15 May 2022). [CrossRef]
  64. Lawrence, Alastair. 2013. Individual Investors and Financial Disclosure. Journal of Accounting and Economics 56: 130–47. [Google Scholar] [CrossRef] [Green Version]
  65. Lee, Yen Jung. 2012. The Effect of Quarterly Report Readability on Information Efficiency of Stock Priceś. Contemporary Accounting Research 29: 1137–70. [Google Scholar] [CrossRef]
  66. Lehavy, Reuven, Feng Li, and Kenneth Merkley. 2011. The Effect of Annual Report Readability on Analyst Following and the Properties of Their Earnings Forecasts. Accounting Review 86: 1087–115. [Google Scholar] [CrossRef] [Green Version]
  67. Lennox, Clive S., and Chul W. Park. 2006. The Informativeness of Earnings and Management’s Issuance of Earnings Forecasts. Journal of Accounting and Economics 42: 439–58. [Google Scholar] [CrossRef]
  68. Levin, Irwin P., Sandra L. Schneider, and Gary J. Gaeth. 1998. All Frames Are Not Created Equal: A Typology and Critical Analysis of Framing Effects. Organizational Behavior and Human Decision Processes 76: 149–88. [Google Scholar] [CrossRef] [PubMed] [Green Version]
  69. Li, Edward Xuejun, and K. Ramesh. 2009. Market Reaction Surrounding the Filing of Periodic SEC Reports. The Accounting Review 84: 1171–208. [Google Scholar] [CrossRef]
  70. Li, Feng. 2006. Annual Report Readability, Earnings, and Stock Returns. Working Paper, No. 1028. Ann Arbor, MI, USA: Stephen M. Ross School of Business. [Google Scholar]
  71. Li, Feng. 2008. Annual Report Readability, Current Earnings, and Earnings Persistence. Journal of Accounting and Economics 45: 221–47. [Google Scholar] [CrossRef]
  72. Li, Feng. 2010. Textual Analysis of Corporate Disclosures: A Survey of the Literature. Journal of Accounting Literature 29: 143–65. Available online: http://search.proquest.com/docview/1356647367?pq-origsite=gscholar (accessed on 15 May 2022).
  73. Li, Shaomin, Seung Ho Park, and Rosey Shuji Bao. 2014. How Much Can We Trust the Financial Report?Earnings Management in Emerging Economies. International Journal of Emerging Markets 9: 33–53. [Google Scholar] [CrossRef]
  74. Li, Yinghua, and Liandong Zhang. 2015. Short Selling Pressure, Stock Price Behavior, and Management Forecast Precision: Evidence from a Natural Experiment. Journal of Accounting Research 53: 79–117. [Google Scholar] [CrossRef] [Green Version]
  75. Li, Zhongtian, Jing Jia, and Larelle J. Chapple. 2022. Textual Characteristics of Corporate Sustainability Disclosure and Corporate Sustainability Performance: Evidence from Australia. Meditari Accountancy Research. [Google Scholar] [CrossRef]
  76. Liu, Ming, and Zhefeng Liu. 2021. Does Annual Report Readability Explain the Accrual Anomaly? Asian Review of Accounting 29: 307–31. [Google Scholar] [CrossRef]
  77. Lo, Kin, Felipe Ramos, and Rafael Rogo. 2017. Earnings Management and Annual Report Readability. Journal of Accounting and Economics 63: 1–25. [Google Scholar] [CrossRef] [Green Version]
  78. Loughran, Tim, and Bill McDonald. 2009. Plain English, Readability, and 10-K Filings. Unpublished Working Paper-Notre Dame. Available online: https://www.researchgate.net/publication/228458241_Plain_English_Readability_and_10-K_Filings (accessed on 15 May 2022).
  79. Loughran, Tim, and Bill McDonald. 2011. When Is a Liability Not a Liability? Textual Analysis, Dictionaries, and 10-Ks. Journal of Finance 66: 35–65. [Google Scholar] [CrossRef]
  80. Loughran, Tim, and Bill McDonald. 2014a. Measuring Readability in Financial Disclosures. Journal of Finance 69: 1643–71. [Google Scholar] [CrossRef]
  81. Loughran, Tim, and Bill McDonald. 2014b. Regulatioin and Financial Disclosure: The Impact of Plain English. Journal of Regulatory Economics 45: 94–113. [Google Scholar] [CrossRef]
  82. Loughran, Tim, and Bill McDonald. 2016. Textual Analysis in Accounting and Finance: A Survey. Journal of Accounting Research 54: 1187–1230. [Google Scholar] [CrossRef]
  83. Lundholm, Russell J., Rafael Rogo, and Jenny Li Zhang. 2014. Restoring the Tower of Babel: How Foreign Firms Communicate with U.S. Investors. Accounting Review 89: 1453–85. [Google Scholar] [CrossRef] [Green Version]
  84. Luo, Jin hui, Xue Li, and Huayang Chen. 2018. Annual Report Readability and Corporate Agency Costs. China Journal of Accounting Research 11: 187–212. [Google Scholar] [CrossRef]
  85. Merkley, Ken, Holly Skaife, Tyler Thomas, and Jim Wahlen. 2015. The Structure of Voluntary Disclosure Narratives: Evidence from Conference Calls Kristian D. Allee. Journal of Accounting Research 53: 241–47. [Google Scholar]
  86. Miller, Brian P. 2010. The Effects of Reporting Complexity on Small and Large Investor Trading. The Accounting Review 85: 2107–43. [Google Scholar] [CrossRef]
  87. Miller, Brian Paul. 2008. Data Overload and Investor Trading. The Pennsylvania State University. Available online: https://etda.libraries.psu.edu/catalog/9196 (accessed on 15 May 2022).
  88. Moreno, Alonso, and Michael John Jones. 2021. Impression Management in Corporate Annual Reports during the Global Financial Crisis. European Management Journal 40: 503–17. [Google Scholar] [CrossRef]
  89. Pashalian, Siroon, and William J. E. Crissy. 1950. How Readable Are Corporate Annual Reports? Journal of Applied Psychology 34: 244–48. [Google Scholar] [CrossRef] [PubMed]
  90. Purda, Lynnette, and David Skillicorn. 2015. Accounting Variables, Deception, and a Bag of Words: Assessing the Tools of Fraud Detection. Contemporary Accounting Research 32: 1193–223. [Google Scholar] [CrossRef]
  91. Rennekamp, Kristina. 2012. Processing Fluency and Investors’ Reactions to Disclosure Readability. Journal of Accounting Research 50: 1319–54. [Google Scholar] [CrossRef]
  92. Riley, Tracey J., Gün R. Semin, and Alex C. Yen. 2014. Patterns of Language Use in Accounting Narratives and Their Impact on Investment-Related Judgments and Decisions. Behavioral Research in Accounting 26: 59–84. [Google Scholar] [CrossRef]
  93. Rjiba, Hatem, Samir Saadi, Sabri Boubaker, and Xiaoya (Sara) Ding. 2021. Annual Report Readability and the Cost of Equity Capital. Journal of Corporate Finance 67: 101902. [Google Scholar] [CrossRef]
  94. Rutherford, Brian A. 2003. Obfuscation, Textual Complexity and the Role of Regulated Narrative Accounting Disclosure in Corporate Governance. Journal of Management and Governance 7: 187–210. [Google Scholar] [CrossRef]
  95. Rutherford, Brian A. 2018. Narrating the Narrative Turn in Narrative Accounting Research: Scholarly Knowledge Development or Flat Science? Meditari Accountancy Research 26: 13–43. [Google Scholar] [CrossRef]
  96. Shanthikumar, Devin M. 2003. Small Trader Reactions to Consecutive Earnings Surprises. SSRN Electronic Journal. [Google Scholar] [CrossRef]
  97. Smaili, Nadia, Anne Marie Gosselin, and Julien Le Maux. 2022. Corporate Financial Disclosures and the Importance of Readability. Journal of Business Strategy. ahead-of-print. [Google Scholar] [CrossRef]
  98. Soepriyanto, Gatot, Sienny Tjokroaminoto, and Arfian Erma Zudana. 2021. Annual Report Readability and Accounting Irregularities: Evidence from Public Listed Companies in Indonesia. Journal of Financial Reporting and Accounting 19: 793–818. [Google Scholar] [CrossRef]
  99. StataCorp. 2013. Stata Statistical Software: Release 13. Available online: https://www.stata.com/support/faqs/resources/citing-software-documentation-faqs/ (accessed on 15 May 2022).
  100. Subramanian, Ram, Robert G. Insley, and Rodney D. Blackwell. 1993. Performance and Readability: A Comparison of Annual Reports of Profitable and Unprofitable Corporations. Journal of Business Communication 30: 49–61. [Google Scholar] [CrossRef]
  101. Sun, Yanqi, Jenny Jing Wang, and Kevin Tairan Huang. 2022. Does IFRS and GRI Adoption Impact the Understandability of Corporate Reports by Chinese Listed Companies? Accounting and Finance 62: 2879–904. [Google Scholar] [CrossRef]
  102. Tan, Hun Tong, Elaine Ying Wang, and Bo Zhou. 2014. When the Use of Positive Language Backfires: The Joint Effect of Tone, Readability, and Investor Sophistication on Earnings Judgments. Journal of Accounting Research 52: 273–302. [Google Scholar] [CrossRef]
  103. Tan, Hun Tong, Elaine Ying Wang, and Bo Zhou. 2015. How Does Readability Influence Investors’ Judgments? Consistency of Benchmark Performance Matters. Accounting Review 90: 371–93. [Google Scholar] [CrossRef] [Green Version]
  104. Xu, Wei, Zhenye Yao, and Donghua Chen. 2019. Chinese Annual Report Readability: Measurement and Test. China Journal of Accounting Studies 7: 407–37. [Google Scholar] [CrossRef]
  105. You, Haifeng, and Xiao-Jun Zhang. 2009. Financial Reporting Complexity and Investor Underreaction to 10-K Information. Review of Accounting Studies 14: 559–86. [Google Scholar] [CrossRef]
  106. Zeng, S. X., X. D. Xu, H. T. Yin, and C. M. Tam. 2012. Factors That Drive Chinese Listed Companies in Voluntary Disclosure of Environmental Information. Journal of Business Ethics 109: 309–21. [Google Scholar] [CrossRef]
  107. Zeng, S. X., X. D. Xu, Z. Y. Dong, and Vivian W. Y. Tam. 2010. Towards Corporate Environmental Information Disclosure: An Empirical Study in China. Journal of Cleaner Production 18: 1142–48. [Google Scholar] [CrossRef]
  108. Zheng, Jiajia, and Pengfei Sheng. 2017. The Impact of Foreign Direct Investment (FDI) on the Environment: Market Perspectives and Evidence from China. Economies 5: 8. [Google Scholar] [CrossRef]
Figure 1. Event study window for cumulative abnormal return.
Ijfs 10 00104 g001
Figure 2. Event study window for cumulative abnormal trading volume.
Ijfs 10 00104 g002
Figure 3. Event study window for cumulative abnormal returns (robustness analysis).
Ijfs 10 00104 g003
Table 1. Descriptive statistics of readability and CAR.
VariableNMeanSDp50p25p75MinMax
CAR[−10,+10]2680.006310.1920.00161−0.06530.0807−1.0120.839
CAATV[−5,+5]107−0.002110.06730.00487−0.02380.0336−0.4510.140
FI26814.301.99913.7312.7215.9010.9619.03
Length26810.640.54410.7410.1811.058.64511.69
ROE2680.09870.09810.07430.03690.128−0.03920.730
Return2680.2980.8280.120−0.2290.575−0.7646.098
BIG42680.3170.46600101
Loss2680.7840.41311101
NID2683.4100.850333.50026
Size26821.841.34921.6921.0022.7416.8625.82
Growth26819.232.73819.2417.6921.2711.1823.77
Table 2. Correlation analysis.
1234567891011
Length1.000
FI−0.415 **1.000
ROE0.106 *0.113 *1.000
Return0.078−0.0610.152 **1.000
CAR0.569 **−0.283 **0.0520.238 **1.000
CAATV0.493 **−0.0460.461 **0.298 **0.606 **1.000
BIG4−0.649 **0.542 **−0.029−0.072−0.490 **−0.320 **1.000
loss0.0660.0010.613 **0.0070.0520.274 **0.0231.000
NID0.196 **0.107 *0.129 **0.0160.277 **0.343 **0.0250.0761.000
Size0.463 **−0.0070.346 **0.0200.572 **0.787 **−0.176 **0.315 **0.474 **1.000
Growth0.153 **−0.096 *0.288 **−0.0150.238 **0.400 **0.0020.313 **0.247 **0.627 **1.000
Note: CAR is calculated as cumulative abnormal returns = the total number of daily share returns. CAATV is the cumulative trade volume = the total number of shares traded daily. Return = the 12-month returns, annual return without cash dividend reinvested. Length = log of the total words in the annual report. Fog index (FI) = (words per sentence + percentage of complex words) × 0.4. Size = log of the total assets at the end of the previous fiscal year. Growth = log of operating revenue. The loss = net profit, which takes the value of 1 if a firm reports profits, and 0 otherwise. Big4 = a dummy variable equal to 1 if the external auditor is a Big4, and 0 otherwise. Independent director (NID) = the number of independent directors. Standard errors are in parentheses; ** p < 0.05, * p < 0.1.
Table 3. Readability and cumulative abnormal returns.
(1)(2)
VariablesCAR[−10,+10]CAR[−10,+10]
FI0.112
(0.124)
FI × ROE−0.979 **
(0.494)
Length −0.339
(0.967)
Length × ROE −1.061 *
(0.566)
ROE−1.06 × 10⁻⁵−6.38 × 10⁻⁵
(0.000785)(0.000783)
BIG40.005490.00738
(0.0298)(0.0298)
Loss−0.0276−0.0270
(0.0340)(0.0341)
NID0.451 **0.330 **
(0.207)(0.167)
Size0.0418 *0.0427 *
(0.0234)(0.0234)
Growth−0.0166−0.0162
(0.0156)(0.0156)
Constant−2.2063.271
(1.951)(10.80)
Observations268268
R-squared0.0460.044
Industry FEYesYes
Year FEYesYes
Note: CAR is calculated as cumulative abnormal returns = the total number of daily share returns. Length = log of the total words in the annual report. Fog index (FI) = (words per sentence + percentage of complex words) × 0.4. Size = log of the total assets at the end of the previous fiscal year. Growth = log of operating revenue. The loss = net profit, which takes the value of 1 if a firm reports profits, and 0 otherwise. Big4 = a dummy variable equal to 1 if the external auditor is a Big4, and 0 otherwise. Independent director (NID) = the number of independent directors. Standard errors are in parentheses; ** p < 0.05, * p < 0.1.
Table 4. Readability and future returns.
(1)(2)(3)(4)(5)(6)
Variable∆Returnt+1∆Returnt+2∆Returnt+3∆Returnt+1∆Returnt+2∆Returnt+3
FI0.02340.03510.117
(0.0374)(0.0560)(0.187)
FI × ROE−0.117 ***−0.175 ***−0.584 ***
(0.0447)(0.0671)(0.224)
Length 0.02590.03890.130
(0.108)(0.162)(0.540)
Length × ROE −0.0228 *−0.0342 *−0.114 *
(0.0129)(0.0193)(0.0644)
ROE−0.930 ***−1.395 ***−4.652 ***0.729 *1.093 *3.643 *
(0.357)(0.535)(1.783)(0.412)(0.617)(2.058)
BIG4−0.00162−0.00243−0.008090.003300.004950.0165
(0.0105)(0.0158)(0.0526)(0.0114)(0.0171)(0.0572)
Loss−0.0117−0.0175−0.0583−0.0178−0.0267−0.0889
(0.0121)(0.0181)(0.0603)(0.0121)(0.0182)(0.0607)
NID0.005930.008890.02960.008170.01230.0409
(0.0136)(0.0204)(0.0681)(0.0137)(0.0206)(0.0686)
Size0.0178 **0.0266 **0.0888 **0.0169 **0.0253 **0.0844 **
(0.00698)(0.0105)(0.0349)(0.00717)(0.0107)(0.0358)
Growth−0.00617−0.00925−0.0308−0.00554−0.00831−0.0277
(0.00492)(0.00739)(0.0246)(0.00500)(0.00750)(0.0250)
Constant−0.333 *−0.499 *−1.663 *−0.335−0.503−1.676
(0.177)(0.265)(0.884)(0.286)(0.429)(1.429)
Observations359359359359359359
R-squared0.0700.1770.0890.4380.1030.085
Industry FEYesYesYesYesYesYes
Year FEYesYesYesYesYesYes
Note: ∆ Returnst+n = returns in the next 3 years: Returnt+1, Returnt+2, and Returnt+3. Length = log of the total words in the annual report. Fog index (FI) = (words per sentence + percentage of complex words) × 0.4. Size = log of the total assets at the end of the previous fiscal year. Growth = log of operating revenue. The loss = net profit, which takes the value of 1 if a firm reports profits, and 0 otherwise. Big4 = a dummy variable equal to 1 if the external auditor is a Big4, and 0 otherwise. Independent director (NID) = the number of independent directors. Standard errors are in parentheses; *** p < 0.01, ** p < 0.05, * p < 0.1.
Table 5. Effect of readability on cumulative abnormal trade volume.
(1)(2)
VariableCAATV[−5,+5]CAATV[−5,+5]
FI0.236 *
(0.128)
FI × SURP−24.55 **
(10.46)
Length 4.650
(14.09)
Length × SURP −0.0208 ***
(0.0080)
SUPR0.07105−0.02594
(0.384)(0.720)
ROE0.00405−0.00776
(0.184)(0.202)
BIG40.932 **0.552
(0.442)(0.472)
Loss1.263 *1.381
(0.719)(0.852)
NID−0.259−0.459
(0.296)(0.335)
Size0.2700.0965
(0.175)(0.181)
Growth0.0009590.000292
(0.000598)(0.000555)
Constant−10.3640.39
(7.519)(135.7)
Observations5959
R-squared0.2550.146
Industry FEYesYes
Year FEYesYes
Note: CAATV is the cumulative trade volume = the total number of shares traded daily. Fog index (FI) = (words per sentence + percentage of complex words) × 0.4. SURP = EPS − forecasted EPS. Length = log of the total words in the annual report. Size = log of the total assets at the end of the previous fiscal year. Growth = log of operating revenue. The loss = net profit, which takes the value of 1 if a firm reports profits, and 0 otherwise. Big4 = a dummy variable equal to 1 if the external auditor is a Big4, and 0 otherwise. Independent director (NID) = the number of independent directors. Standard errors are in parentheses; *** p < 0.01, ** p < 0.05, * p < 0.1.
Table 6. First-stage regression summary statistics.
VariablesShea Partial R2Partial R2Robust
F (30,226)
Prob > F
FI_industry0.10710.32633.430.000
FI_location0.38900.40154.170.000
Note: Under-identification test (Kleibergen–Paap rk LM statistic): 26.52.
Table 7. Instrumental variable regression test results of readability and CAR.
12
First Stage (OLS)Second Stage (2SLS)
VariableFICAR[−1,+1]
FI_industry0.343 ***
(0.0573)
FI_location0.188 ***
(0.0534)
FI_P −0.00464
(0.0236)
FI × ROE_P −0.219 *
(0.116)
ROE−0.04000.581 *
(0.0669)(0.310)
BIG41.877 ***0.0158 ***
(0.203)(0.00497)
Loss0.003730.00887 *
(0.222)(0.00453)
NID−0.004240.0172 ***
(0.262)(0.00535)
Size−0.0637−0.00270
(0.166)(0.00324)
Growth0.03890.00356 *
(0.100)(0.00205)
Constant11.45 ***−0.0975
(3.876)(0.0954)
Observations267269
R-squared0.5250.176
Industry FEYesYes
Year FEYesYes
Note: CAR is calculated as cumulative abnormal returns = the total number of daily share returns. Fog index (FI) = (words per sentence + percentage of complex words) × 0.4. Length = log of the total number of words in the reports. FI_industry, FI_location, length_industry, and length_location are instrumental variables. FI_p is the prediction of the Fog index variable, and length_p is the prediction of the length of the annual report. Size = log of total assets at the end of the previous fiscal year. Growth = log of operating revenue. The loss = net profit, which takes the value of 1 if a firm reports profits, and 0 otherwise. Big4 = a dummy variable equal to 1 if the external auditor is a Big4, and 0 otherwise. Independent director (NID) = the number of independent directors. Standard errors are in parentheses; *** p < 0.01, * p < 0.1.
Publisher’s Note: MDPI stays neutral with regard to jurisdictional claims in published maps and institutional affiliations.

