Article

Using Numbers Creates Value for Health Professionals: A Quantitative Study of Pain Management in Palliative Care

1
Palliative care and ASIH, Primary Health Care Skåne, 291 89 Kristianstad, Sweden
2
Sahlgrenska Academy, Institute of Health and Care Sciences, University of Gothenburg, 405 30 Gothenburg, Sweden
*
Author to whom correspondence should be addressed.
Pharmacy 2014, 2(3), 205-221; https://doi.org/10.3390/pharmacy2030205
Submission received: 30 December 2013 / Revised: 23 June 2014 / Accepted: 16 July 2014 / Published: 22 July 2014

Abstract

:
Improvement methodology is based on processes to achieve quality and safety in health care in order to improve patient care, especially in management. The aim of this study was to identify differences regarding the method of estimating pain within palliative care in north-eastern Sweden. The study comprised three different data collections—questions from 22 staff members who worked in palliative care, data from the Swedish Palliative Registry, and patients’ medical records. Data were analyzed using a quantitative approach to measure the proportion of differences and similarities in everyday pain management. The two categories “Documentation of Pain Management” and “Pain Management Activities” were identified and illustrated how repeated pain management measurements contributed to a clearer view of pain management activities. The use of numbers instead of words contributed to a better, clearer, and more unified documentation of pain ratings. Use of validated rating tools regarding patients last week of life increased from 47%–100%. This study may inspire better routines to estimate pain and quantify no pain in palliative care. Evidence-based measurement tools from the patient’s perspective, can improve pain management.

1. Introduction

In palliative care, pain is a common symptom. However, few studies have examined the staff’s use of evidence-based measurement tools for estimating pain.
It is important to provide high-quality care for the population. Hence, health systems must be economically sustainable, in line with good clinical practice, and developed in consultation with the patient [1,2,3]. Evidence-based care is based on three approaches: patient needs and desires, staff skills and experience, and recent evidence in this research field [4,5,6,7,8]. Clinical research and guidelines can be difficult for the staff to absorb due to lack of time, interest, motivation, knowledge, or inability to change ingrained patterns [4,6,7,9,10]. The difference between evidence-based care in theory and practice is known as espoused theory and theory-in-use, i.e., how individuals within an organization act and relate to established procedures and policies [11]. Double-loop learning is a reflective way to learn about the values, standards, and policies of a unit, and is related to espoused theory and theory-in-use [5,11,12,13].
Improvement efforts are based on processes to achieve quality and safety in health care and improve patient care [1,14]. Previous research highlights the importance of searching for variety by making use of data that measure and monitor performance in health care processes. The visualization of pain and pain management through measurements could increase employee participation and understanding of improvement work [5,7,14,15,16]. By highlighting what needs to be improved and how these improvements can be achieved in a planning process, improvement ideas can be tested and visualized on a small scale through the PDSA cycle: Plan, Do, Study, and Act [14]. Studies show that the PDSA methodology increases adherence to evidence-based practice that improve quality of care and patient safety [2,17,18,19,20,21].
Staff’s motivation for learning is imperative to continuous improvements in patient care [5,16,21,22,23,24]. The Model for Understanding Success in Quality, MUSIQ [24], highlights the importance of motivation due to leadership. Other significant factors for improvement work are the values and norms of the care teams, that is, how they develop, relate to, and communicate with patients and each other. The quality of operations is secured by offering staff systematic and continuous training. Hence, health care management and leadership are important influencing factors for patient safety and high-quality care [5,16,25,26,27,28,29,30]. The staff need an effective learning environment, well-functioning communication, and competent leadership to develop a learning organization that promotes high-quality care [27,31].
In palliative care, pain is a common symptom which could be described in four dimensions: physical, mental, social, and existential. It is also somatic, visceral, or neuropathic in nature [16]. Pain is a subjective experience, which is why optimal selection of pain management requires a detailed analysis and flexible use of methods and skills from an interdisciplinary team [32,33,34]. There is also need for a care system that can identify, initiate, and monitor treatment to achieve optimal pain management [35]. Pain assessment includes the use of different measurement scales to estimate pain, from 0 (no pain) to 10 (worst pain). The Numerical Rating Scale (NRS) and Visual Analogue Scale (VAS) are two examples of rating scales [36]. For persons with a cognitive weakness or listlessness, the Face, Leg, Activity, Cry, Consolability (FLACC) tool for assessing pain could be used [37]. The Verbal Rating Scale (VRS) is another measurement tool that uses words instead of numbers to express pain. Furthermore, the Edmonton Symptom Assessment System (ESAS) measures patient experiences of pain, fatigue, nausea, depression, anxiety, sleepiness/drowsiness, appetite, well-being, and shortness of breath [38]. It is crucial to use evidence-based guidelines to offer optimal pain management and improve pain management work. Therefore, the aim of this study was to identify differences regarding method of estimation of pain within palliative care in north-eastern Sweden.

2. Experimental Section

2.1. Design

Quantitative research uses statistical and quantifiable results to describe an objective reality about pain measurement to improve pain management routines. Quantitative methods include the systematical collecting of empirical and quantifiable data to be measured and summarized to make generalizations about pain management in palliative care [39].

2.2. Setting

An improvement project ran from September 2012 to April 2013 and included two teams in one health care district in north-eastern Sweden with 177,000 inhabitants. The aim of the improvement effort and quality parameter for the health district was that 80% of all patients should complete a pain assessment, using a validated pain measurement instrument, during their last week of life. The health care district decided to only use evidence-based rating tools.
Sweden has a system of national quality registries that contain data on, for example, patients’ problems/diagnoses, treatments/interventions, and outcomes. Quality registries are professionalized and provide researchers with the possibilities to track achievements in the health care sector. Furthermore, most of the registries are disease or care specific [40,41]. The Swedish Palliative Registry reported that 19% (ranged between 9% and 35%) of the registered patients underwent pain assessment during their last week. The health care district in this study demonstrated limited use (12% of the audited records) of self-report instruments for pain estimation [42].
Multi-disciplinary teams perform palliative care, approximately 125 employees work in this health care district, divided into nine teams allocated in two areas. The teams include physicians, physiotherapists, occupational therapists, nurses, dieticians, social workers, service staff, medical secretaries, and managers. The sample of this study includes two teams, 22 staff members who work with palliative care in patients’ own homes (Table 1).
The improvement project started with a group meeting where a cause-effect diagram was one activity (Figure 1) and the improvement project used different improvement methods (Table 2).
Table 1. Description of the informants.
ProfessionNumbers (Team South)Numbers (team North)
Physician22
Physiotherapist11
Occupational therapist0.5 (shared between the two teams)0.5 (shared between the two teams)
Social worker0.5 (shared between the two teams)0.5 (shared between the two teams)
Nurse68
Total1012
Figure 1. Cause-effect diagram/fishbone diagram.
Pharmacy 02 00205 g001
Table 2. Methods and measurements used for improvement work.
  • Cause-effect diagram/fishbone diagram (Figure 1)
  • Risk and vulnerability; opportunities and threats
  • Dialogue and reflections using double-loop learning, espoused theory and theory-in-use
  • Reminders in everyday care
  • Measure variation in everyday work performance
  • PDSA cycle
  • Visualization of the results of measurements
  • Funnel model for evaluation of pain management [43]
  • Proportion of patient pain ratings with the Swedish Palliative Registry as baseline
  • Formulation of nine questions concerning pain management as baseline and control
  • Review of documentation of pain management in medical records [14]

2.3. Data Collection

The team members formulated nine questions regarding staff’s daily work with pain management in palliative care, and answered them for 14 days. These questions were the baseline for the improvement effort and were formulated through dialogue and discussion in the team during meetings concerning the on-going improvement project in order to make a status report. The questions were: (1a) Number of patients who were asked about their pain; (1b) Number of patients who reported pain; (2) Number of pain ratings using the ESAS, FLACC, NRS, VRS; (3) Number of pain assessments; (4) Number of patients monitored for pain; (5) Number of pain treatment adjustments; (6) Number of patients who received pain management; (7) Number of patients scoring >4 on the ESAS; (8a) Number of patients whose pain was discussed at team meetings; (8b) Number of pain ratings discussed at team meetings; (9) Number of patients with a pain management plan. Team members used a dash to schedule their work into the aforementioned nine items during the following three periods of 16 days: T1 13–28 September 2012; T2 29 September–14 October 2012; and T3 15–30 January 2013. The results were discussed in relation to the pain management. These discussions clarified the need for Nolan’s PDSA model [14] to perform small-scale improvement work based on the following questions:
  • What do we want toaccomplish? Goals?
  • How will we knowthat achange isanimprovement? Measurements?
  • What changes can lead toimprovements in accordance with the ideas?
Plan: The two teams use documentation for both pain and painlessness based on the VRS.
Do: Search for documentation of pain management in medical records and the Swedish Palliative Registry.
Study: Dialogue about the review of medical records.
Act: Continue the documentation of pain and painlessness by using the VRS; follow-ups in team meetings.
In addition, a sample of data from patients’ medical records due to questions 20–21 from the Swedish Palliative Registry’s [41] death questionnaire were collected. These data had been extracted by validated pain measurement instruments during the last week of patients’ life. The patients were followed from January 2011 until July 2013. Exclusion criteria were patients in hospice or residential care within the health district.
A total of 46 patients from team South and 62 patients from team North were included during the period. All patient visits—165 for team North and 153 for team South—were examined. Of these patient visits, 32 (team North) and 26 (team South) had no documentation regarding pain. Hence, a total of 143 patient visits were included in the study. Reviews included patient's medical record data regarding care events in the health care district. Once a month, death questionnaire statistics were obtained from the Swedish Palliative Register [41] for item 20 (number of patients pain free, in pain, and with intense pain during their last week of life) and item 21 (number of patient assessed for pain last week of life with a pain assessment instrument). Furthermore, medical record data were collected regarding pain or analgesia, patients’ perception of pain intensity, pain management, and the occurrence/frequency of pain assessments.

2.4. Data Analysis

The chosen quantitative approach involved measurement and quantification of the numbers [39,44]. Descriptive statistics (Microsoft Excel) were used for analysis of nine questions regarding differences and similarities in everyday pain management work. Results were presented in proportion (%). The documentation of pain management was analyzed by reviewing medical records using the VRS. Data from the Swedish Palliative Registry [41], questions 20 and 21, were analyzed using a statistical process control chart called the P-chart [45]. The number of pain estimations performed by validated instruments was compared to the number of registered death questionnaires referring to patients’ last week of life. Data analyses focused on similarities and differences during the improvement project, and are presented in tables and bar charts in the results.

2.5. Ethical Considerations

Ethical approval and permission for the study was obtained from the health care district managers. No ethical approval was needed when staff was included in data collection [46]. No information about individual patients was obtained from participants. A medical record survey was included in the improvement project in accordance with Swedish law [47]. Due to the medical record review, ethical approval was sought from the local ethical board at the university. No ethical approval was needed since the improvement project and research paper (master thesis) followed the Swedish rules and guidelines for research in the Humanities and Social Sciences [46]. Respect for the individual was a main concern during the study. All participants were informed about voluntary participation and consented to participate in the study knowing their right to withdraw at any time, and that their answers would be kept confidential. Respect for the participants’ integrity and autonomy was thereby shown. Thus, ethical guidelines for human and social research were followed throughout the study [46,47].

3. Results and Discussion

3.1. Results

The results are presented in two parts: “Documentation of Pain Management” and “Pain Management Activities”.

3.1.1. Documentation of Pain Management

The results highlighted similarities and differences in the teams’ documentation of pain in palliative care and pain management. The numbers in brackets (Table 3) refer to the number of times a patient was asked about pain. There was an increase in number of patient pain ratings between the first (T1), second (T2), and third (T3) time period. The increase in documentation of pain—i.e., pain assessments and pain analyses—was mainly noted for team North (Table 3). Results also show that documentation was conducted for patients who scored four (4) or above on the ESAS-scale. In addition, health professionals documented freedom of pain without using numeric pain scales, using words instead of numbers as 0.
Table 3. Pain management for teamNorth and South.
Pain managementNorth T1%South%NorthT2%South%NorthT3%South%
Number of patients with pain7(41)177(39)1819(24)7911(28)392(28)727(53)51
Number of pain assessments12(41) 2914(39)3617(24)7111(28)3923(28)8228(53)53
Estimated pain > 41(41)25(39)135(24)213(28)115(28)185(53)9
Number of pain analyses2(41)53(39)88(24)332(28)73(28)112(53)4
Results from pain management using the FLACC, ESAS, NRS and the VRS. Refers to 16-day periods T1 (13–28 September 2012), T2 (29 September–14 October 2012), and T3 (15–30 January 2013).
The figure below (Figure 2) shows a change in documentation regarding the decision that all activities regarding pain assessments should be documented—including freedom of pain. The results demonstrate that team North performed a higher degree of documentation of freedom of pain than team South, especially during the periods 5, 7, and 11. The results showed increased use of tools when the team documented painlessness. Moreover, the documentation of estimation of pain without using valued numbers is illustrated in the upper part of the bars, and documentation using pain assessment tools (numbers) is presented by the lower part of the bars (Figure 2). Team North is represented by green bars and team South by blue.
Figure 2. Documentation of pain management with or without pain assessment tools.
Pharmacy 02 00205 g002
Both an increase and decrease in the use of pain assessment instruments were reported in the medical records from both teams. Compared results from periods 1 and 2 to periods 8, 9, and 12 displayed a decline in documentation of pain estimates for Team North. Team South had a decline in number of pain estimations during periods 6 and 8. The audit of medical records regarding pain intensity (0–10) showed that patient estimations of pain using evidence-based measurement tools had increased during the improvement project. Results showed an increasing number of patients rating zero since freedom of pain had never been documented before. Hence, the results demonstrated that “painlessness” or “light pain” (VAS 1–3) were more frequently reported (69% out of all performed pain estimations) than “moderate” or “severe pain” (Table 4 and Table 5).
The review of medical records showed that there was an increased frequency in pain management and activities for patients concerning pain relief. When pain assessments were not performed, the written documentation for pain was comprehensive in comparison to the brief texts on analgesia.
Table 4. Number of pain estimations in medical records from October 2012 to April 2013.
Pain EstimationNumber of Pain EstimatesPercentage of Total Number of Pain Estimates (%)
022440%
1356%
25510%
37113%
4428%
5407%
6234%
7295%
8295%
951%
1081%
Total561100%
Estimation 0 stands for “pain relief” in contrast to 10 which means “worst pain”.
Table 5. Number of patients with documented pain in medical records from October 2012 to April 2013.
14 daysNumber of Patients with Documentation of PainPercentage of Total Number of Patients with Documentation of Pain (%)
10–23 October 2012 10/14 patients (North) 71
12/16 patients (South) 75
24 October–6 November 201216/20 patients (North) 80
9/14 patients (South)64
7–20 November 201218/21 patients (North)86
10/12 patients (South)83
21 November–4 December 2012 11/14 patients (North)78
9/12 patients (South) 75
5–18 December 201210/14 patients (North) 71
9/12 patients (South)75
19 December 2012–1 January 201310/12 patients (North) 83
11/12 patients (South)92
2–15 January 2013 13/15 patients (North)87
16/16 patients (South)100
31 January–13 February 2013 7/11 patients (North)64
10/11 patients (South)91
14–27 February 2013 8/11 patients (North)73
13/13 patients (South)100
28 February–13 March 2013 11/12 patients (North) 92
13/15 patients (South) 87
14–27 March 2013 10/12 patients (North)83
10/12 patients (South) 83
28 March–10 April 20139/9 patients (North)100
6/8 patients (South) 75

3.1.2. Pain Management Activities

Medical records reported of direct activities—such as drug treatment options or other methods of treatment—due to fewer pain assessments. The results illustrated how patients rated their pain by using pain assessment instruments such as the NRS, FLACC, VAS, VRS and the ESAS. The study showed that the project led to increased activity in palliative care (no difference between teams). Assessment tools and numbers were used instead of words which improve quality of pain assessment. The results showed increased pain relief. The Figure 3a illustrates the proportion of pain-estimations using assessment instruments, and Figure 3b presents the proportion of patients who were pain free in their last week of life compiled by month. The chart presents an average in percentage of patients’ pain estimations during five different time periods (separate months). All of the last 14 points are over the p-bar and present a shift, as an increased proportion of the patients had pain assessments in their last week of life.
The results highlighted the adequacy of the quality goals of the health district, that 80% of all pain management should be performed by validated pain assessment instruments. The review of the death surveys showed that 100% of the patients were assessed for pain in their last week of life during the time period December 2012 to May 2013. However, an error occurred during the manual processing by the health district, which is why the results showed 87% and 67% instead of 100%. The proportion of patients assessed in their last week of life with validated pain assessment instruments remained at 100% (Figure 3a,b).
Figure 3. (a) P Chart. Percentage of Patients assessed for pain in last week of life (compiled by month) The Swedish Palliative Registry, question number 21 [41]; (b) P Chart. Proportion of patients with complete pain relief/no pain in last week of life (compiled by month) The Swedish Palliative Registry, question number 20 [41].
Pharmacy 02 00205 g003

3.2. Discussion

The aim of the study, to identify differences regarding the method of estimation of pain within palliative care in north-eastern Sweden, was achieved. The results of the study showed an increased use of evidence-based assessment tools: a systematic pain management routine had been developed and implemented in the health care district. A systemized documentation system helped staff improve palliative care, as did visualization and awareness of pain management. Furthermore, the number of pain estimations increased when staff documented variation of pain, from “painlessness” to “worst possible pain”, in numbers instead of words; especially when number zero (“no pain”) was used. The documentation in numbers was easy to find and read in the medical records, and provided a clear, systematic way for documenting pain ratings. By rating patients’ experienced pain with evidence-based assessment tools on a scale from 0–10 (“no pain” to “worst possible pain”) instead of using words, a clear and systematic documentation system was developed. Furthermore, pain management routines also facilitated for uniform documentation in patients’ medical records; which is in line with earlier pain research [4,5,6,7,8]. The conclusions of this paper could be described as learning outcomes through quality improvement in daily work (Table 6).
Table 6. .Key factorsfrom the currentstudy.
  • Individual’s/team’s awareness and understanding of clinical practice
  • Regular feedback—including verbal feedback—and follow-up on work methods and results throughout surveys
  • Increased understanding of the significance of items, policies, evidence-based guidelines through double-loop learning facilitate for employee participation [5,11,12,13]
  • Dialogue and reflection about collaborative learning
  • Do not blame: see every result as a possibility for improvement
  • Reflect and share experiences with teams
  • Positive working environment
  • Understanding the value of evidence-based practices
  • Using a sense of coherence (SOC) including comprehensibility, manageability, and meaningfulness [48]
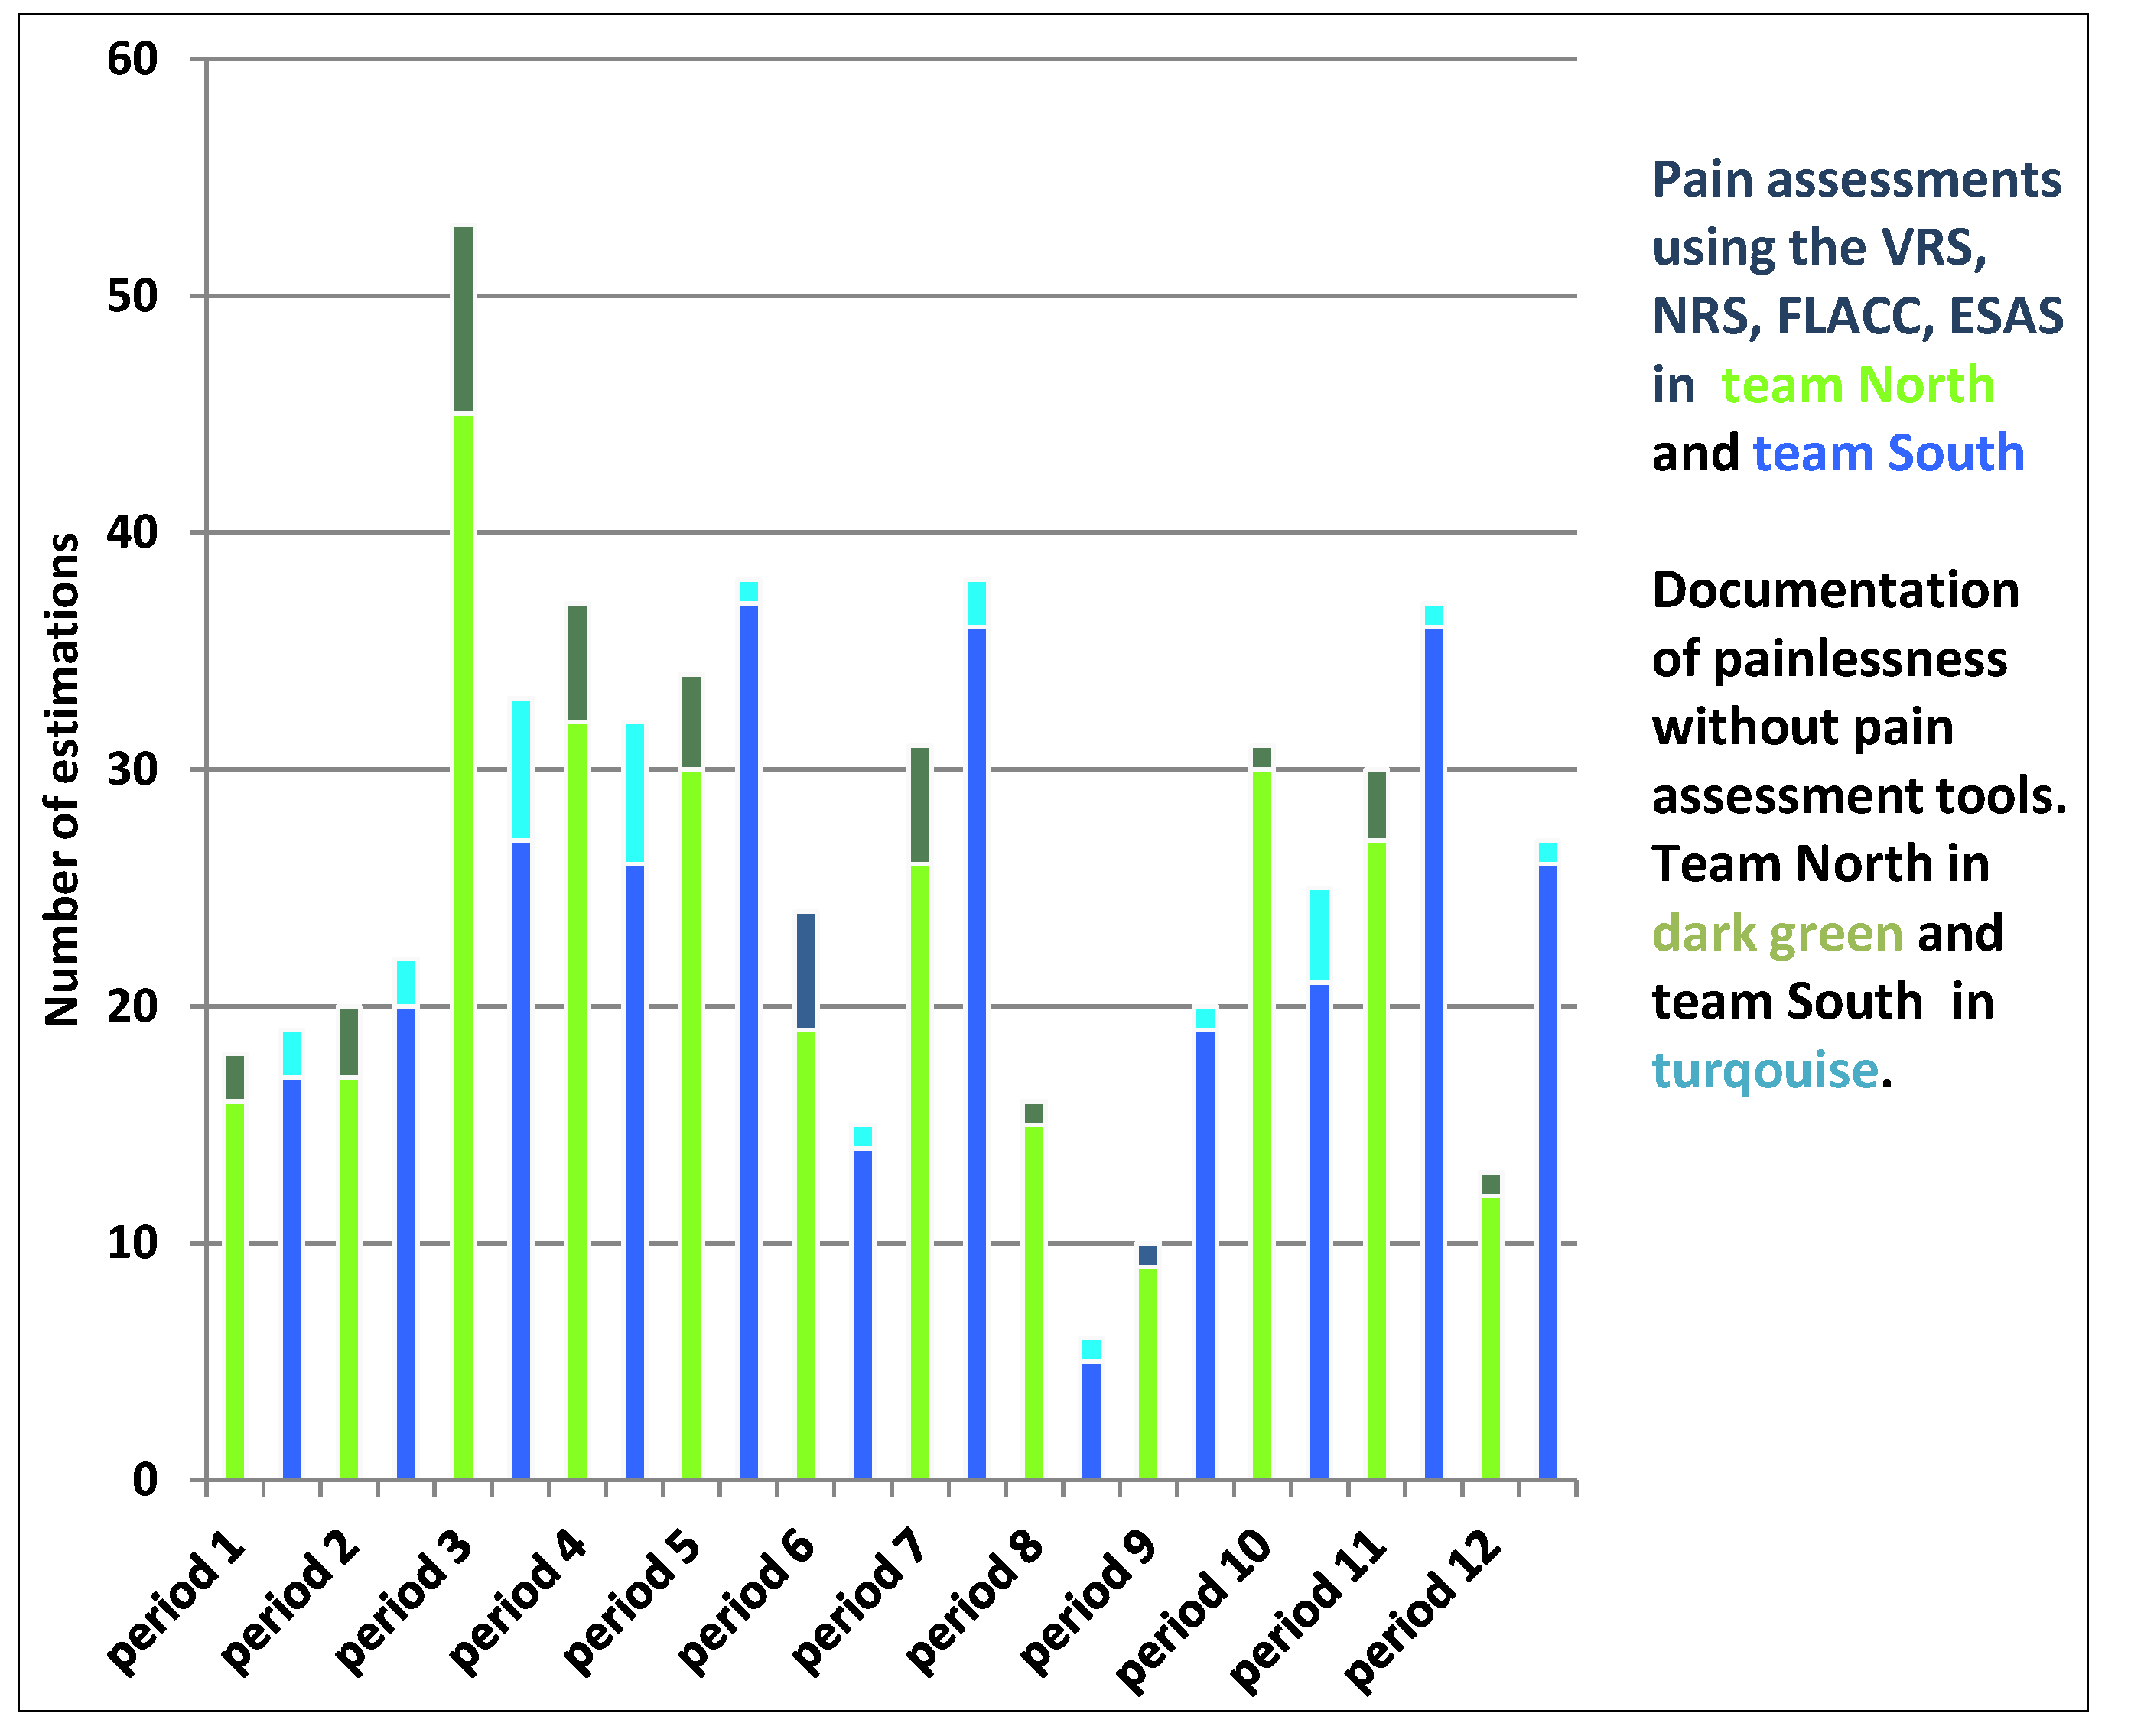
The results displayed some variability in the documentation of pain management, which could depend on difficulties to understand the value of documenting. However, the study showed an increased frequency of pain estimations including patients experiencing painlessness. The increase in pain management actions was also due to follow-up pain assessments for lower pain intensity estimations. In previous research, palliative care staff argued that the use of numbers clearly indicated patients’ need for pain management compared to documentation by words [49]. Pain management research stresses that chronic pain is a problematic area since pain is a personal experience. Hence, staff has to work with person-centered care to achieve high-quality care [50,51].
Moreover, patients’ experiences and knowledge about pain assessment tools are changing, which is a key point in person-centered care [52]. Therefore, it is significant to involve the teams around the patients in the decision-making process by using evidence-based assessment tools to help all actors develop high-quality pain management within palliative care. This is in line with research by Politi et al. [53] who stress the importance of interaction due to the impact that physicians’ communication of uncertainty has on both patients’ involvement in decisions and their satisfaction with health care decisions. Results showed that pain estimations performed by patients was the best way to handle pain management. Since evidence-based guidelines for pain management improve quality in palliative care, the staff has an obligation to improve the process of informed consent for patients.
Furthermore, the meaning of pain estimation for patients who experienced freedom of pain was a value in itself in this study. The change of method of estimate pain, using evidence-based tools for pain management benefited patient outcome due to increased pain assessments. However, there is a risk of misconception regarding documentation by numbers due to the nature of pain. As other researchers point out [32,33,34], numbers are not enough; documentation needs to be complemented with pain localization, character of pain, etc. to understand and provide optimal treatment.
The study showed an increased level of pain documentation (100%) even after the project ended. However, an increased awareness and understanding of patients’ pain experiences is not transferable to the estimation itself, which is why validated pain assessment instruments are crucial. The results displayed some variation in the teams concerning pain documentation, which could be explained by lack of equipment—such as a laptop—for documenting pain management when the staff visited patients in their homes [49]. Palliative care research [54] stresses the need for health information technology (HIT) and technical equipment such as adequate software, as well as for technical, analytical, and statistical support to facilitate for quality assessments and quality improvements. Furthermore, researchers highlight key factors such as engagement and involvement from stakeholders at all levels in the organization to draw attention to local needs. However, the lack of a laptop or other technical equipment for documentation affects work efficiency. In addition, the staff also needs to learn from others’ experiences to improve the quality of care [55].
Another positive change was the awareness of the importance of objectively documenting all forms of patient estimations of pain during. The increased documentation of pain management using all patients’ pain assessments (from “painless” to “worst pain”) resulted in a majority of patient estimations being made visible for the staff. The contradictions that initially existed in the improvement work where that there were few notes in the medical records regarding patients’ experiences of intensity of pain. The staff’s experience of the pain was documented—not the patients’. Hence, the staff need feedback on work [29,30] and one way is by visualizing patients’ pain intensity. Improvement work can help reduce financial costs by using resources in a systematic way based on clinical guidelines that are grounded in research [35,36,37,38]. The quality of care could increase by examining key factors for palliative care processes, such as the pain management procedure. The staff’s pain management skills increased, which results in satisfaction and efficiency at work. Research shows that pain diagram patterns also help facilitate various diagnoses within rheumatology, but more research on pain patterns is needed [56,57]. In addition, research stresses the significance of self-reporting pain assessment tools as a first step toward effective and individualized treatments [57], and as a way to systematize pain management work.
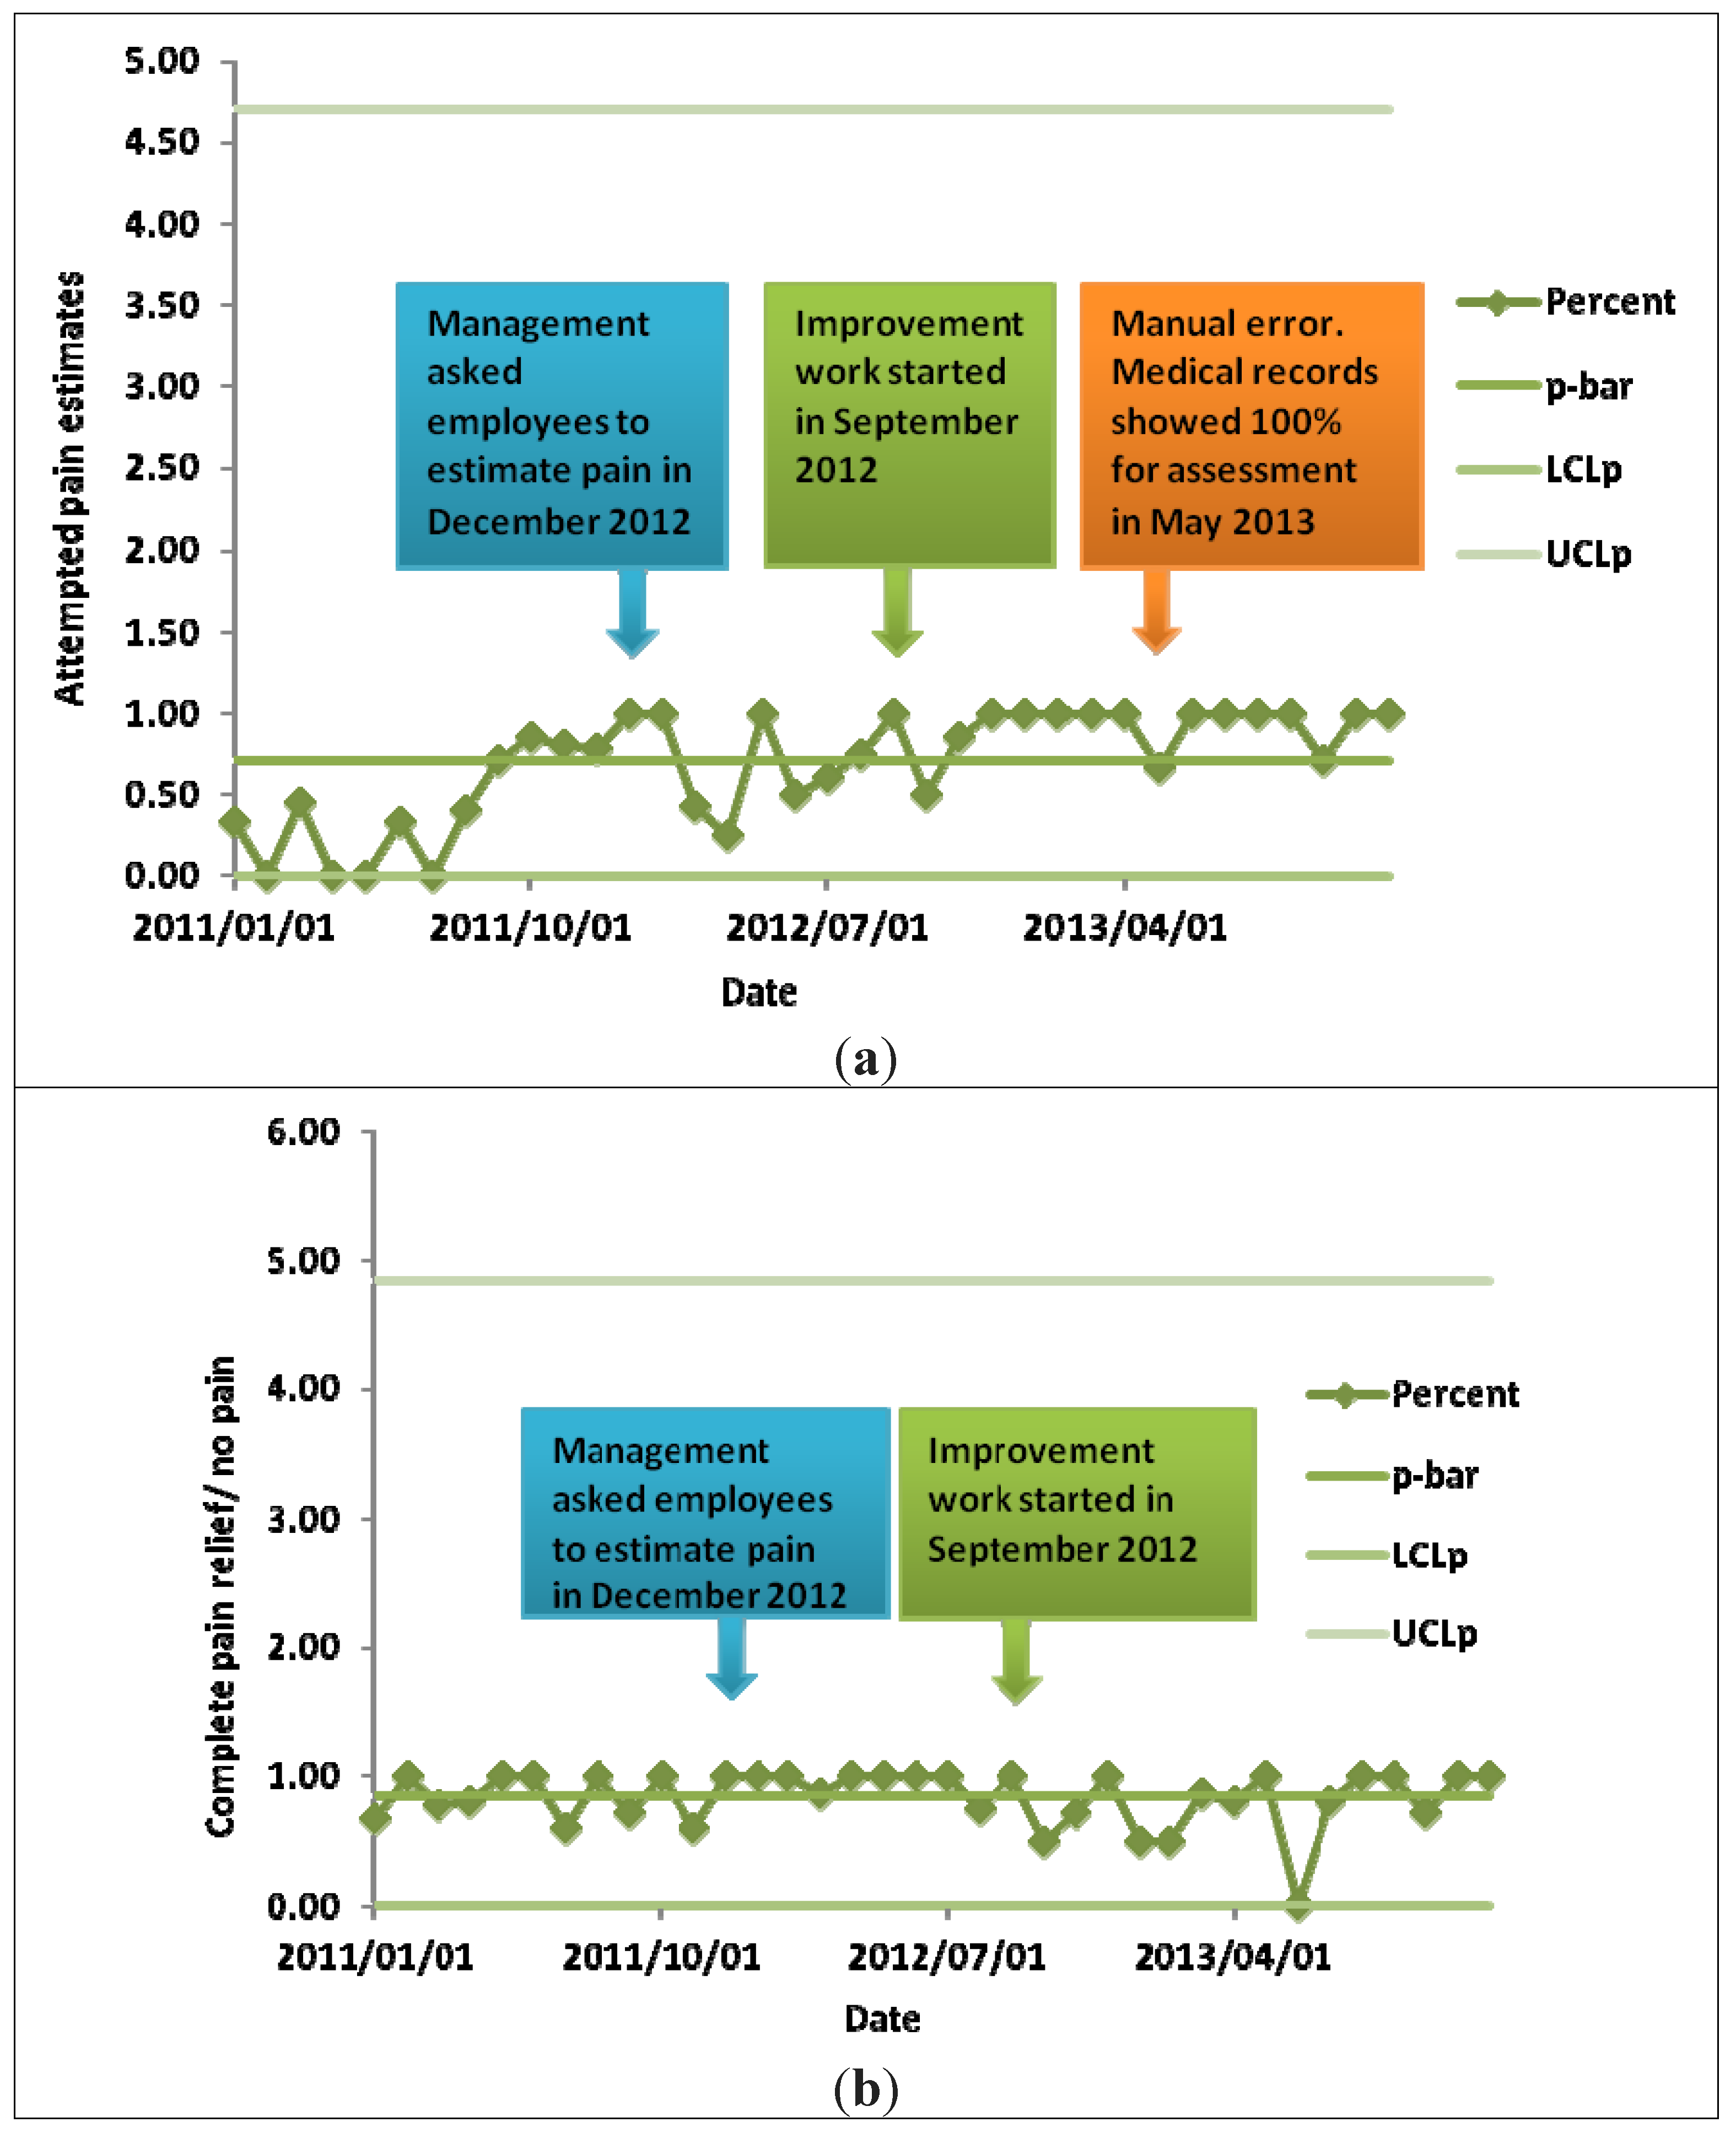
An interesting observation from the Swedish Palliative Registry [41] was that 100% pain relief last week in life was reported for seven out of eight months. One issue to be addressed is what the results about patient pain relief would have been if pain assessments had not been performed. One hypothesis is that the staff would have responded based on their perceptions of patients’ pain.
An error occurred when the mortality surveys were manually uploaded to the Swedish Palliative Registry [41]. The error resulted in an output of 67%–87% instead of 100% and illustrated the challenge for health care to handle errors in different systems to minimize mistakes concerning patient security [57]. Research [1,4,5,6,7,8,10] shows that the manual handling of activities in health systems contributes to increased mistakes with risks for patient security. The number of errors could be minimized by using mobile solutions that provide access to data as well as send data directly to the patient’s medical record for registration. Furthermore, patient empowerment could be achieved when patients can access their medical records through e-health from home and, hence, actively partake in their pain management. Researchers [58,59] highlight that there are challenges and opportunities associated with the use of new technologies and e-health applications. They advocate caution concerning the use of technological innovations and highlight that such innovations should be driven by users’ (patients’ and staff’s) needs instead of business people. Another perspective is the challenge of electronic systems in pain management. Here, further investigations, policies, and guidance are needed to investigate the monitoring and storage of data. Age-related differences concerning staff skills and use of technical solutions, as well as funding, working conditions, etc., also need to be considered. Even though e-health offers opportunities for patients concerning pain management, the staff and managers must handle it with care [49,50,51,52].
In Sweden, 93% of the population has access to the Internet [60]. Therefore, it is important to increase people’s awareness of reliable and trustworthy information on the Internet [61]. A platform for e-health is being developed to coordinate the development of safe and effective health and social care. To improve health care, there is need for a national e-health infrastructure focusing on promoting public involvement and providing support for professionals and decision-makers [62,63]. Health professionals could help patients navigate through the abundance of pain information by posting evidence-based information on the Web.

3.3. Limitations

The limitations of this study are that only two teams in one health care district were included. However, the study ran for over six months and used different data collections that were systematically analyzed. Also, the mix of data; questions constructed by the staff, reviews of patients’ medical records, and death surveys, contributes to generalization [14,40,41,43,44,45]. The validity of the study could be described by the systematic approach by which differences and similarities in pain management were analyzed using evidence-based pain assessment tools. Due to the limitations of this study, further studies are needed to develop knowledge about routines for local pain management in palliative care based on evidence-based care; especially from the patient’s perspective.

4. Conclusions

The success factor was the use of evidence-based tools for staff working with pain management. The visualization of repeated pain management measurements contributed to a clearer view of pain management activities—including the measuring of painlessness. Using numbers instead of words contributed to a unified documentation and provided staff with an overview of the pain management work. The use of objective numbers for patients’ experienced pain made it possible for team members to develop a uniform and systematic documentation system in the medical records. Moreover, it was important to develop organizational structures based on uniform routines and local guidelines to increase the quality of pain management in palliative care. Another key point was that structured pain management helped staff members visualize their palliative care work, which gave them a kind of feedback.
This study may inspire developing better routines for pain management in palliative care by establishing a uniform and systematized care practice based on evidence-based measurement tools that continuously enhance pain management from a patient perspective. Health professionals could develop high quality care by asking the patients about their pain and apply evidence-based practices to patient care. The systematic documentation of all pain assessments—based on repeated assessments and consistency in measurements from “painless” to “worst pain”—and the guidelines within the research area of pain contribute to transparency and clarity in pain management work. For future research, it is of interest to develop knowledge about how evidence-based pain management can contribute to pain relief from the patient’s perspective.

Author Contributions

Study design: Anna Unné, Kristina Rosengren; data collection: Anna Unné; data analysis: Anna Unné, Kristina Rosengren; manuscript preparation: Kristina Rosengren.

Conflicts of Interest

The authors declare no conflict of interest.

References

  1. Batalden, P.; Davidoff, F. What is “quality improvement” and how can it transform healthcare? Qual. Saf. Health Care 2007, 16, 2–3. [Google Scholar] [CrossRef]
  2. Larsen, D. Using real time patient feedback to introduce safety changes. Nurs. Manag. 2011, 18, 27–31. [Google Scholar] [CrossRef]
  3. National Board of Health and Welfare. Nationellt. kunskapsstöd för god palliativ vård i livets slutskede. Vägledning, rekommendationer och indikatorer, Stöd. för styrning och ledning; National Board of Health and Welfare: Stockholm, Sweden, 2013. (In Swedish) [Google Scholar]
  4. Hilarius, D.L.; Kloeg, P.H.; van der Wall, E.; Komen, M.; Gundy, M.C.; Aaronson, N.K. Cancer-related fatigue: Clinical practice versus practice guidelines. Support. Care Cancer 2011, 19, 531–538. [Google Scholar] [CrossRef]
  5. Crites, G.E.; McNamara, M.C.; Akl, E.A.; Richardson, W.S.; Umscheid, C.A.; Nishikawa, J. Evidence in the learning organisation. Health Res. Policy Syst. 2009, 7, 1–13. [Google Scholar] [CrossRef]
  6. Grol, R.; Grimshaw, J. From best evidence to best practice: Effective implementation of change in patients’ care. Lancet 2003, 36, 1225–1230. [Google Scholar] [CrossRef]
  7. Håkonsen, G.; Strelec, P.; Campbell, D.; Hudson, S.; Loennechen, T. Adherence to Medication Guideline Criteria in Cancer Pain Management. J. Pain Symp. Manag. 2008, 37, 1006–1018. [Google Scholar]
  8. National Board of Health and Welfare. Nationellt. vårdprogram för palliativ vård; National Board of Health and Welfare: Stockholm, Sweden, 2012. (In Swedish) [Google Scholar]
  9. Batalden, P. The leader’s work in the improvement of healthcare. Qual. Saf. Health Care 2010, 19, 367–368. [Google Scholar]
  10. Lugtenberg, M.; Burgers, J.S.; Besters, C.F.; Han, D.; Westert, G.P. Perceived barriers to guideline adherence: A survey among general practitioners. BMC Fam. Pract. 2011, 12, 1–9. [Google Scholar]
  11. Argyris, C.; Schön, D. Theory in Practice: Increasing Professional Effectiveness; Jossey-Bass: San-Francisco, CA, USA, 1974. [Google Scholar]
  12. Argyris, C.; Schön, D. Organizational Learning: A Theory of Action Perspective; Addison-Wesley: New York, NY, USA, 1995. [Google Scholar]
  13. Garcia-Morales, V.J.; Verdú-Jover, A.; Lloréns, F.J. The influence of CEO perceptions on the level of organizational learning: Single-loop and double-loop learning. Int. J. Manpower 2009, 30, 567–590. [Google Scholar] [CrossRef]
  14. Langley, G.J.; Moen, R.D.; Nolan, K.M.; Nolan, T.W.; Norman, C.L.; Provost, L.P. The Improvement Guide. In A Practical Approach to Enhancing Organizational Performance; Jossey-Bass: San Francisco, CA, USA, 2009. [Google Scholar]
  15. Bradely, E.H.; Holmboe, E.S.; Mattera, S.A.; Roumanis, S.A.; Radford, M.J.; Krumholz, H.M. Data feedback efforts in quality improvement: Lessons learned from US hospitals. Qual. Saf. Health Care 2004, 13, 26–31. [Google Scholar]
  16. Preheim, G.J.; Armstrong, G.E.; Barton, A.J. The New Fundamentals in Nursing: Introducing Beginning Quality and Safety Education for Nurses’ Competencies. J. Nurs. Educ. 2009, 48, 694–697. [Google Scholar] [CrossRef]
  17. Gilbert, J.E.; Howell, D.; King, S.; Sawka, C.; Hughes, E.; Angus, H.; Dudgeon, D. Quality Improvement in Cancer Symptom Assessment and Control: The Provincial Palliative Care Integration Project (PPCIP). J. Pain Symp. Manag. 2012, 43, 663–678. [Google Scholar] [CrossRef]
  18. Rushmer, R.; Voigt, D. MEASURE IT, IMPROVE IT: The Safer Patients Initiative and quality improvement in subcutaneous insulin therapy for hospital in-patients. Diabet. Med. 2008, 25, 960–967. [Google Scholar] [CrossRef]
  19. Thakkar, K.; Gilchrist, M.; Dickinson, E.; Benn, J.; Franklin, B.D.; Jacklin, A. A quality improvement program to increase compliance with an anti-infective prescribing policy. J. Antimicrob. Chemother. 2011, 66, 1916–1920. [Google Scholar] [CrossRef]
  20. Van Tiel, F.H.; Elenbaas, T.W.; Voskuilen, B.M.; Herczeg, J.; Verheggen, F.W.; Mochtar, B.; Stobberingh, E.E. Plan-do-study-act cycles as an instrument for improvement of compliance after cardiothoracic surgery. J. Hosp. Infect. 2006, 62, 64–70. [Google Scholar]
  21. Nelson, E.; Godfrey, M.; Batalden, P.; Berry, S.A.; Bothe, A.E.; McKinley, K.E.; Melin, C.N.; Muethin, S.E.; Moore, G.; Wasson, J.H.; et al. Clinical Microsystem, Part 1. The Building Blocks of Health Systems. Joint Comm. J. Qual. Patient Saf. 2008, 34, 367–378. [Google Scholar]
  22. Rosengren, K.; Kullén Engström, A.; Axelsson, L. The staff’s experience of structural changes in the health and medical service in western Sweden. J. Nurs. Manag. 1999, 7, 289–298. [Google Scholar]
  23. Kullén Engström, A.; Rosengren, K.; Hallberg, L. Balancing involvement: Employees’ experiences of merging hospitals in Sweden. J. Adv. Nurs. 2002, 38, 11–18. [Google Scholar] [CrossRef]
  24. Kaplan, H.C.; Provost, L.P.; Froehle, C.M.; Margolis, P.A. The Model for Understanding Success in Quality (MUSIQ): Building a theory of context in healthcare quality improvement. BMJ Qual. Saf. 2012, 21, 13–20. [Google Scholar] [CrossRef]
  25. Clarke, J.R.; Lerner, J.C.; Marella, W. The Role for Leaders of Health Care Organizations in Patient Safety. Am. J. Med. Qual. 2007, 22, 311–318. [Google Scholar] [CrossRef]
  26. Arnold, J.; Randall, R. Work Psychology: Understanding Human Behavior in the Workplace; Pearson Education Limited: Essex, UK, 2010. [Google Scholar]
  27. Decuyper, S.; Dochy, F.; van den Bossche, P. Grasping the dynamic complexity of team learning: An integrative model for effective team learning in organisations. Educ. Res. Rev. 2010, 5, 111–113. [Google Scholar]
  28. Porter, M.E. Value in Health Care. Appendix 1. Value in Health Care. N. Engl. J. Med. 2010, 363, 2477–2481. [Google Scholar] [CrossRef]
  29. Rosengren, K.; Athlin, E.; Segesten, K. Presence and availability: Staff conceptions of nursing leadership on an intensive care unit. J. Nurs. Manag. 2007, 15, 522–529. [Google Scholar] [CrossRef]
  30. Rosengren, K.; Höglund, P.; Hedberg, B. Quality register: A tool for patient advantages—From a caring perspective. J. Nurs. Manag. 2012, 20, 196–205. [Google Scholar] [CrossRef]
  31. Senge, P. The Fifth Discipline: The art and Practice of the Learning Organization; Currency Doubleday: London, UK, 2006. [Google Scholar]
  32. International Association for Study of Pain (IASP). Classification of Chronic Pain: Descriptions of Chronic Pain Syndromes and Definitions of Pain Terms/Prepared by the Task Force on Taxonomy of the International Association for the Study of Pain; IASP Press: Seattle, DC, USA, 1994; pp. 209–214. [Google Scholar]
  33. Patrick, D.L.; Ferketich, S.L.; Frame, P.S.; Harris, J.J.; Hendricks, C.B.; Levin, B. National Institutes of Health State-of-the-Science Conference Statement: Symptom management in cancer: Pain, depression, and fatigue, 15–17 July 2002. J. Nat. Cancer Inst. Monogr. 2004, 32, 9–16. [Google Scholar]
  34. Raphael, J.; Ahmedzai, S.; Hester, J.; Urch, C.; Barrie, J.; Williams, J. Cancer pain: Part 1: Pathophysiology; oncological, pharmacological, and psychological treatments: A perspective from the British Pain Society endorsed by the UK Association of Palliative Medicine and the Royal College of General Practitioners. Pain Med. 2010, 11, 742–764. [Google Scholar]
  35. Chang, V.T.; Sorger, B.; Rosenfeld, K.E.; Lorenz, K.A.; Bailey, A.F.; Pharm, T.B.; Weinberger, L.; Montagnini, M. Pain and palliative medicine. J. Rehabil. Res. Dev. 2007, 44, 279–294. [Google Scholar] [CrossRef]
  36. Melzack, R.; Katz, J. Pain measurement in persons in pain. In Textbook of Pain; Wall, P.D., Melzack, R., Eds.; Churchill Livingstone: London, UK, 1999; pp. 1341–1352. [Google Scholar]
  37. Voepel-Lewis, T.; Merkel, S.; Tait, A.R.; Trzcinka, A.; Malviya, S. The reliability and validity of the Face, Legs, Activity, Cry, Consolability observational tool as a measure of pain in children with cognitive impairment. Anasth. Analg. 2002, 95, 1224–1229. [Google Scholar]
  38. Bruera, E.; Khuen, N.; Miller, M.J.; Selmser, P.; Macmillan, K. The Edmonton Symptom Assessment System (ESAS). A simple method for the assessment of palliative care patients. J. Palliat. Care 1991, 7, 6–9. [Google Scholar]
  39. Polit, D.; Beck, C.T. Nursing Research: Generating and Assessing Evidence for Nursing Practice; Wolters Kluwer Health/Lippincott Williams & Wilkins cop.: Philadelphia, PA, USA, 2012. [Google Scholar]
  40. Eriksson, M.; Appelros, P.; Norrving, B.; Tere’nt, A.; Stegmayr, B. Assessment of functional outcome in a national quality register for acute stroke: Can simple self-reported items be transformed into the modified ranking scale? Stroke 38, 1384–1386. [Google Scholar]
  41. Swedish Palliative Registry. Svenska. Palliativregistret. Available online: http://palliativ.se/?page_id=99/ (accessed on 15 April 2014).
  42. Nilsson, K. Dokumentation. av symtom i avancerad palliativ vård. En journalgranskningsstudie. Thesis Master i Nursing, Department for Health and Society, University College of Kristianstad, Kristianstad, Sweden, 2012. [Google Scholar]
  43. Thor, J.; Herrlin, B.; Wittlöv, K.; Övretvieit, J.; Brommels, M. Evolution and outcomes of a quality improvement program. Int. J. Health Care 2010, 23, 312–327. [Google Scholar]
  44. Bryman, A. Social Research Methods; Oxford University Press: Oxford, UK, 2008. [Google Scholar]
  45. Carey, R.G. Improving Healthcare with Control Charts Basic and Advanced SPC Methods and Case Studies; American Society for Quality (ASQ): Milwaukee, WI, USA, 2003. [Google Scholar]
  46. Codex. Rules & Guidelines for Research. The Humanities and Social Sciences. Available online: http://www.codex.vr.se/en/forskninghumsam.shtml/ (accessed on 15 April 2014).
  47. Swedish Code of Statutes. Hälso-och sjukvårdslagen. 1982:763. Available online: http://www.socialstyrelsen.se/regelverk/lagarochforordningar (accessed on 10 June 2014). (In Swedish)
  48. Antonovsky, A. The Salutogenic Model as a theory to guide Health Promotion. Health Promot. Int. 1996, 11, 11–18. [Google Scholar]
  49. Unné, A.; Rosengren, K. Staffs Experience of Pain Management—An Improvement in Palliative Care. Pharmacy 2013, 1, 119–136. [Google Scholar]
  50. Baszanger, I. Inventing Pain Medicine: From the Laboratory to the Clinic; Rutgers University Press: London, UK, 1998. [Google Scholar]
  51. Baszanger, I. Deciphering chronic pain. Sociol. Health Illn. 1992, 14, 181–215. [Google Scholar]
  52. Ekman, I.; Wolf, A.; Olsson, L.-E.; Taft, C.; Dudas, K.; Schaufelberger, M.; Swedberg, K. Effects of person-centered care in patients with chronic heart failure: The PCC-HF study. Eur. Heart J. 2012, 33, 1112–1119. [Google Scholar]
  53. Politi, M.; Clark, M.; Ombao, H.; Dizon, D.; Elwyn, G. Communicating uncertainty can lead to less decision satisfaction: a necessary cost of involving patients in shared decision making? Health Expect. 2011, 14, 84–91. [Google Scholar]
  54. Abernethy, A.; Wheeler, J.; Bull, J. Development of a Health Information Technology-Based Data System in Community-Based Hospice and Palliative Care. Am. J. Prev. Med. 2011, 40, S217–S224. [Google Scholar] [CrossRef]
  55. Bull, J.H.; Whitten, E.; Morris, J.; Hooper, R.N.; Wheeler, J.; Kamal, A.; Abernethy, A.P. Demonstration of a Sustainable Community-Based Model of Care across the Palliative Care Continuum. J. Pain Symtom. Manag. 2012, 44, 797–806. [Google Scholar] [CrossRef]
  56. Caines, A.; Samadi, N.; Ouimet, G.; Thompson, A.; Pope, J. The sensitivity and specificity of pain diagrams in rheumatic disease referrals. Rheumatology 2012, 51, 1093–1098. [Google Scholar] [CrossRef]
  57. Ripamonti, C.I. Pain management. Ann. Oncol. 2012, 23, x294–x301. [Google Scholar]
  58. Keogh, E.; Rosser, B.; Eccleston, C. e-Health and chronic pain management: Current status and developments. Pain 2010, 151, 18–21. [Google Scholar]
  59. Wantland, D.J.; Portillo, C.J.; Holzemer, W.L.; Slaughter, R.; McGhee, E.M. The effectiveness of Web-based vs. non-Web-based interventions: A meta-analysis of behavioral change outcomes. J. Med. Internet Res. 2004, 6, e40. [Google Scholar]
  60. SCB. Privatpersoners. användning av datorer och internet 2011. Available online: http://www.scb.se/statistik/_publikationer/LE0108_2011A02_BR_IT01BR1201.pdf (accessed on 18 March 2014). (In Swedish)
  61. Ullrich, P.F.; Vaccaro, A.R. Patient education on the internet: Opportunities and pitfalls. Spine 2002, 27, E185–E188. [Google Scholar] [CrossRef]
  62. Center för eHälsa i samverkan. Handlingsplan 2012–2018. Landsting, regioners och kommuners samarbetet inom eHälsoområdet. Available online: http://www.cehis.se/en (accessed on 30 December 2013).
  63. Swedish eHealth Agency (2014). Available online: http://www.ehalsomyndigheten.se/Om-oss-/Uppdrag-och-verksamhet/Other-languages1/Swedish-eHealth-Agency/ (accessed on 20 January 2014).

