
Understanding Color Associations and Their Effects on Expectations of Drugs’ Efficacies


Abstract
:1. Introduction
2. Experiment 1
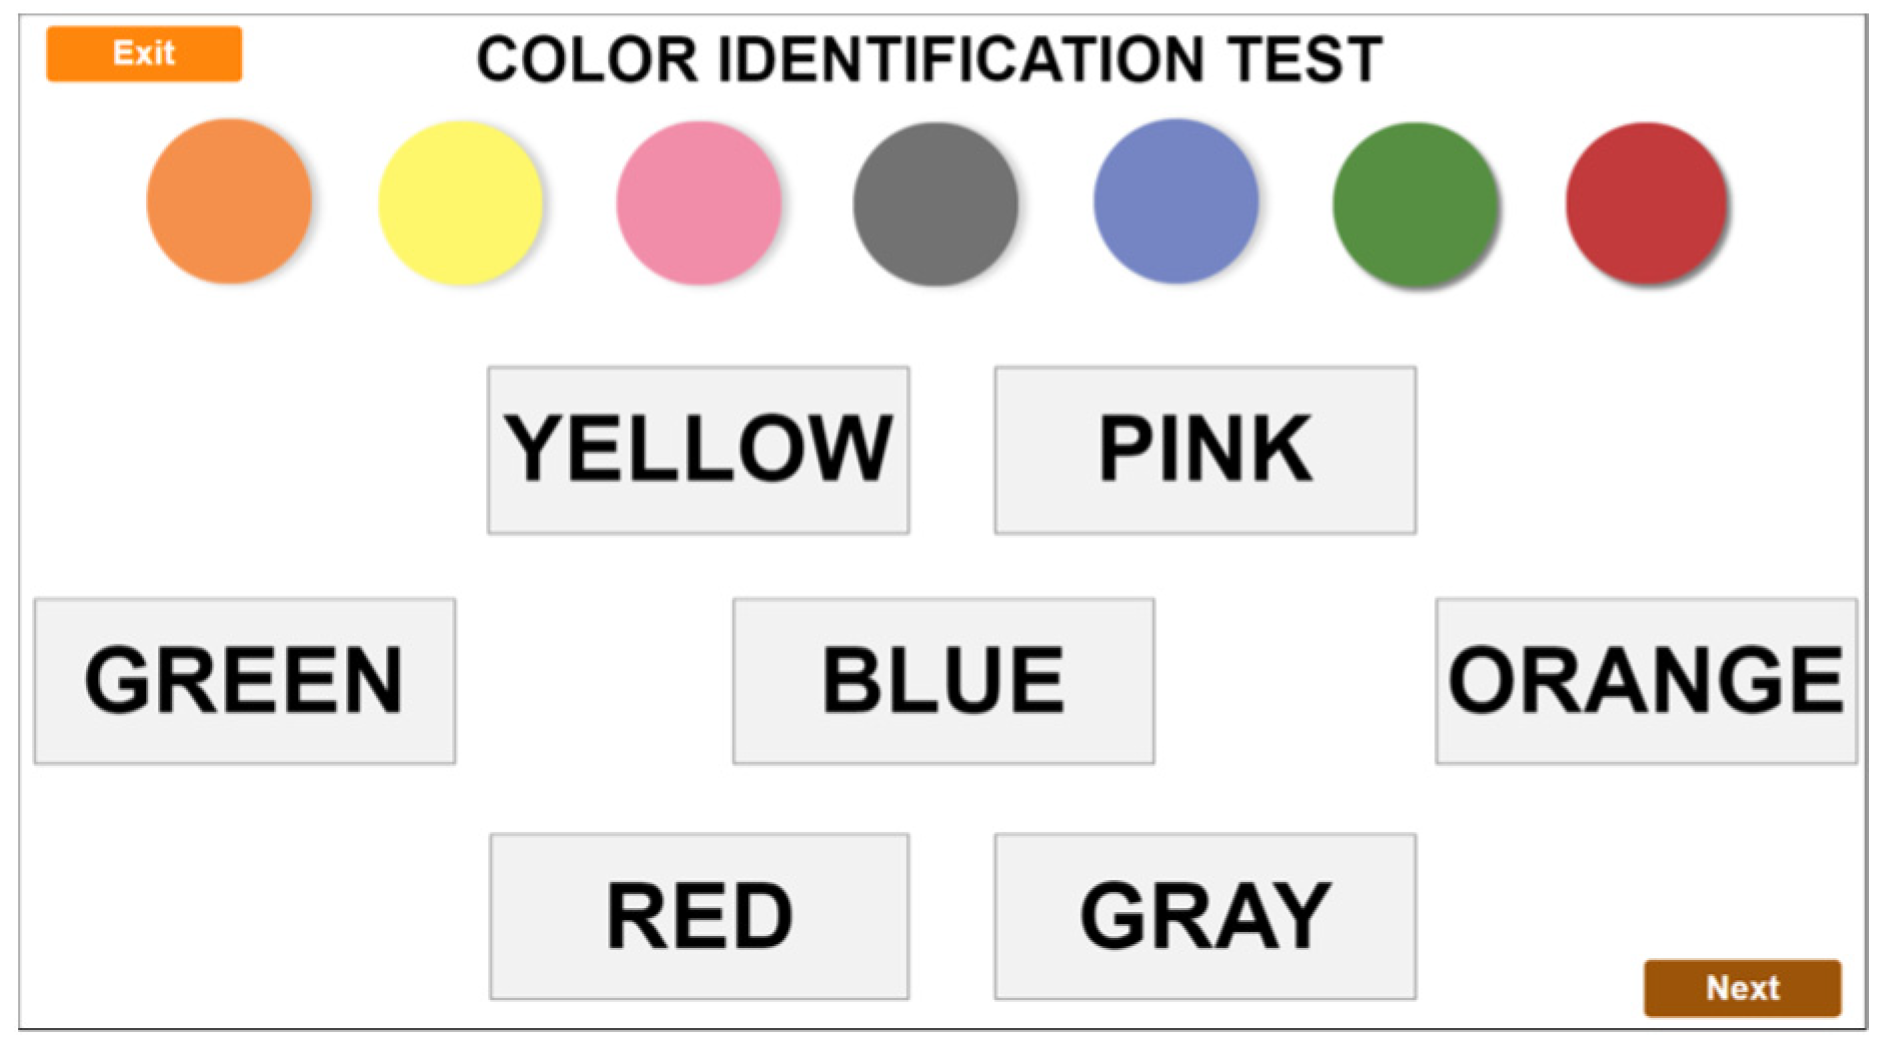
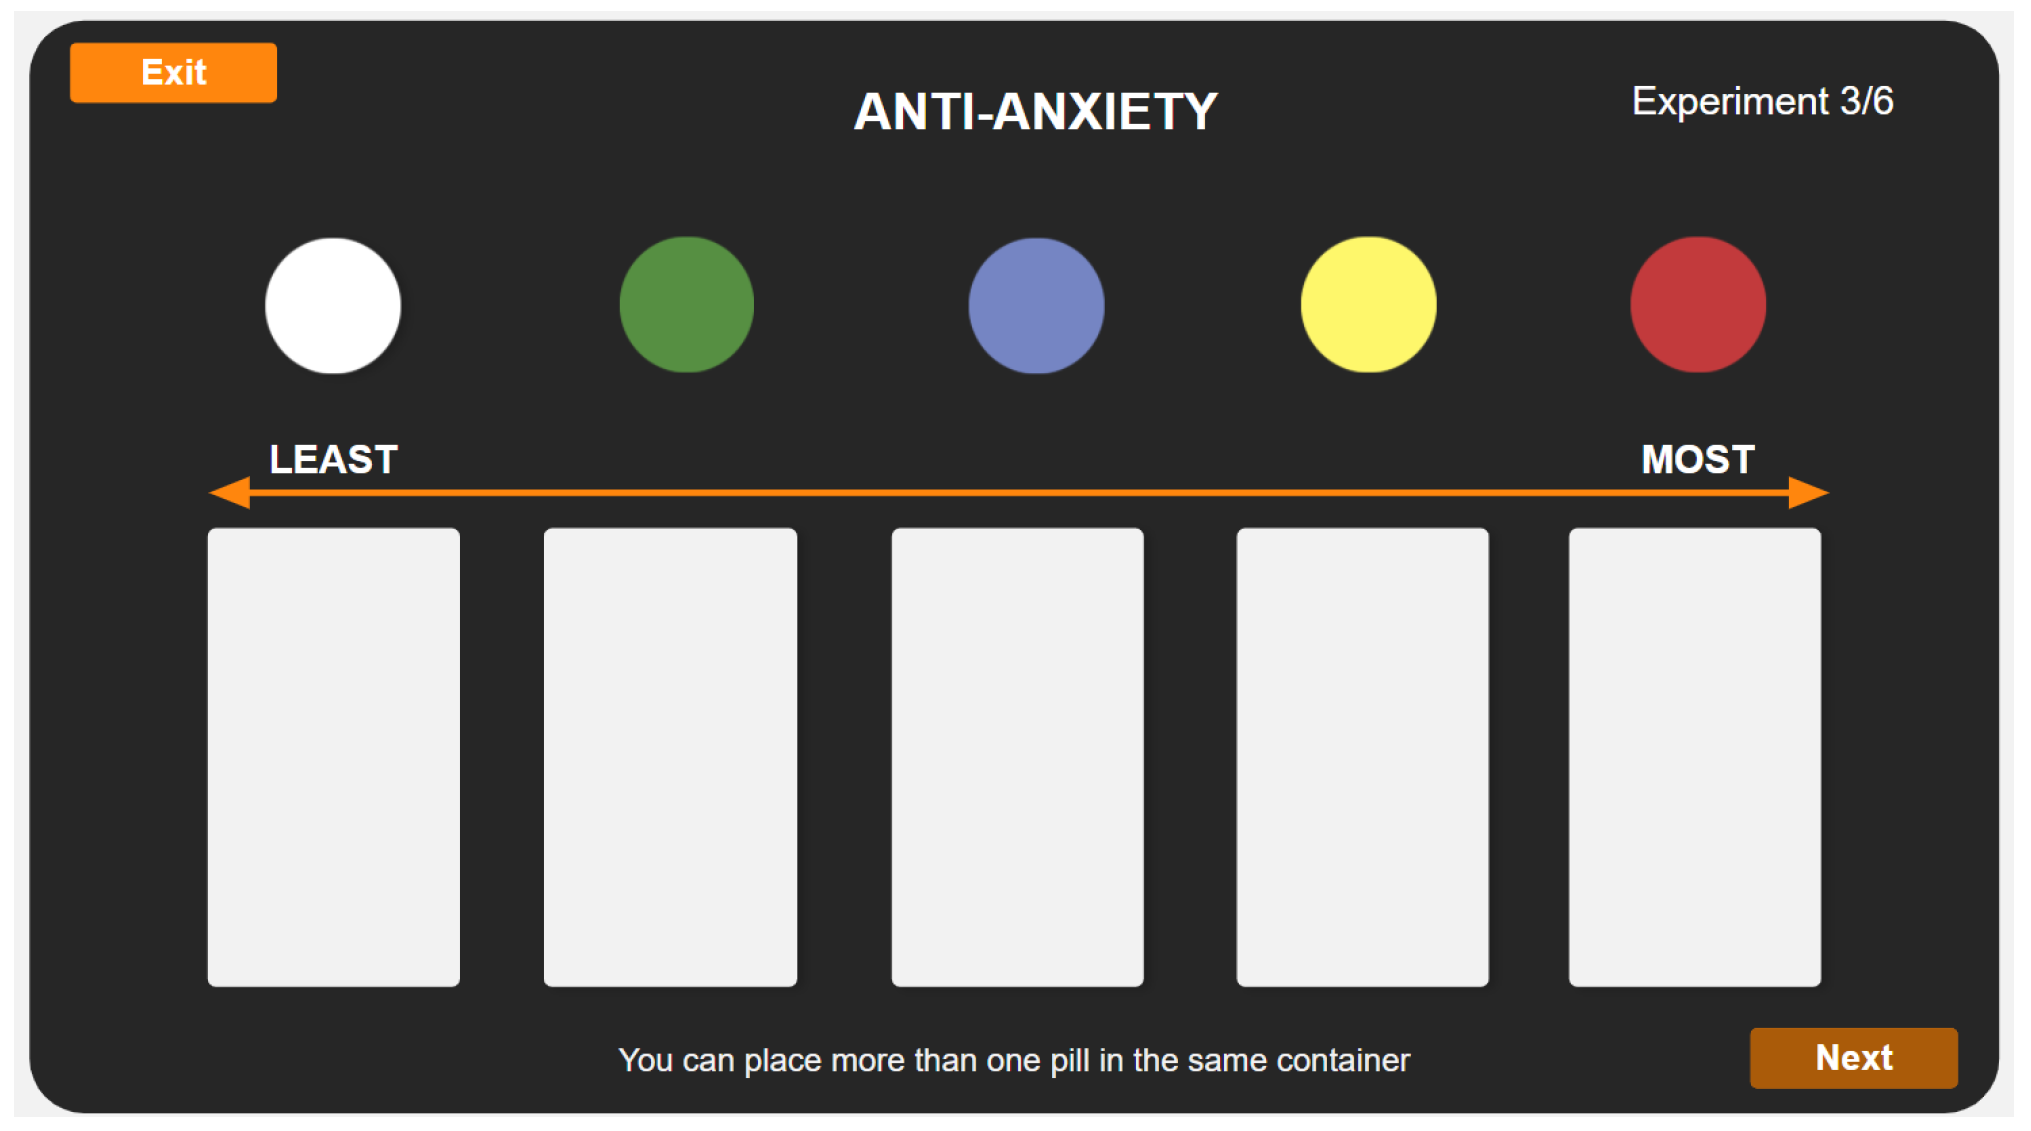
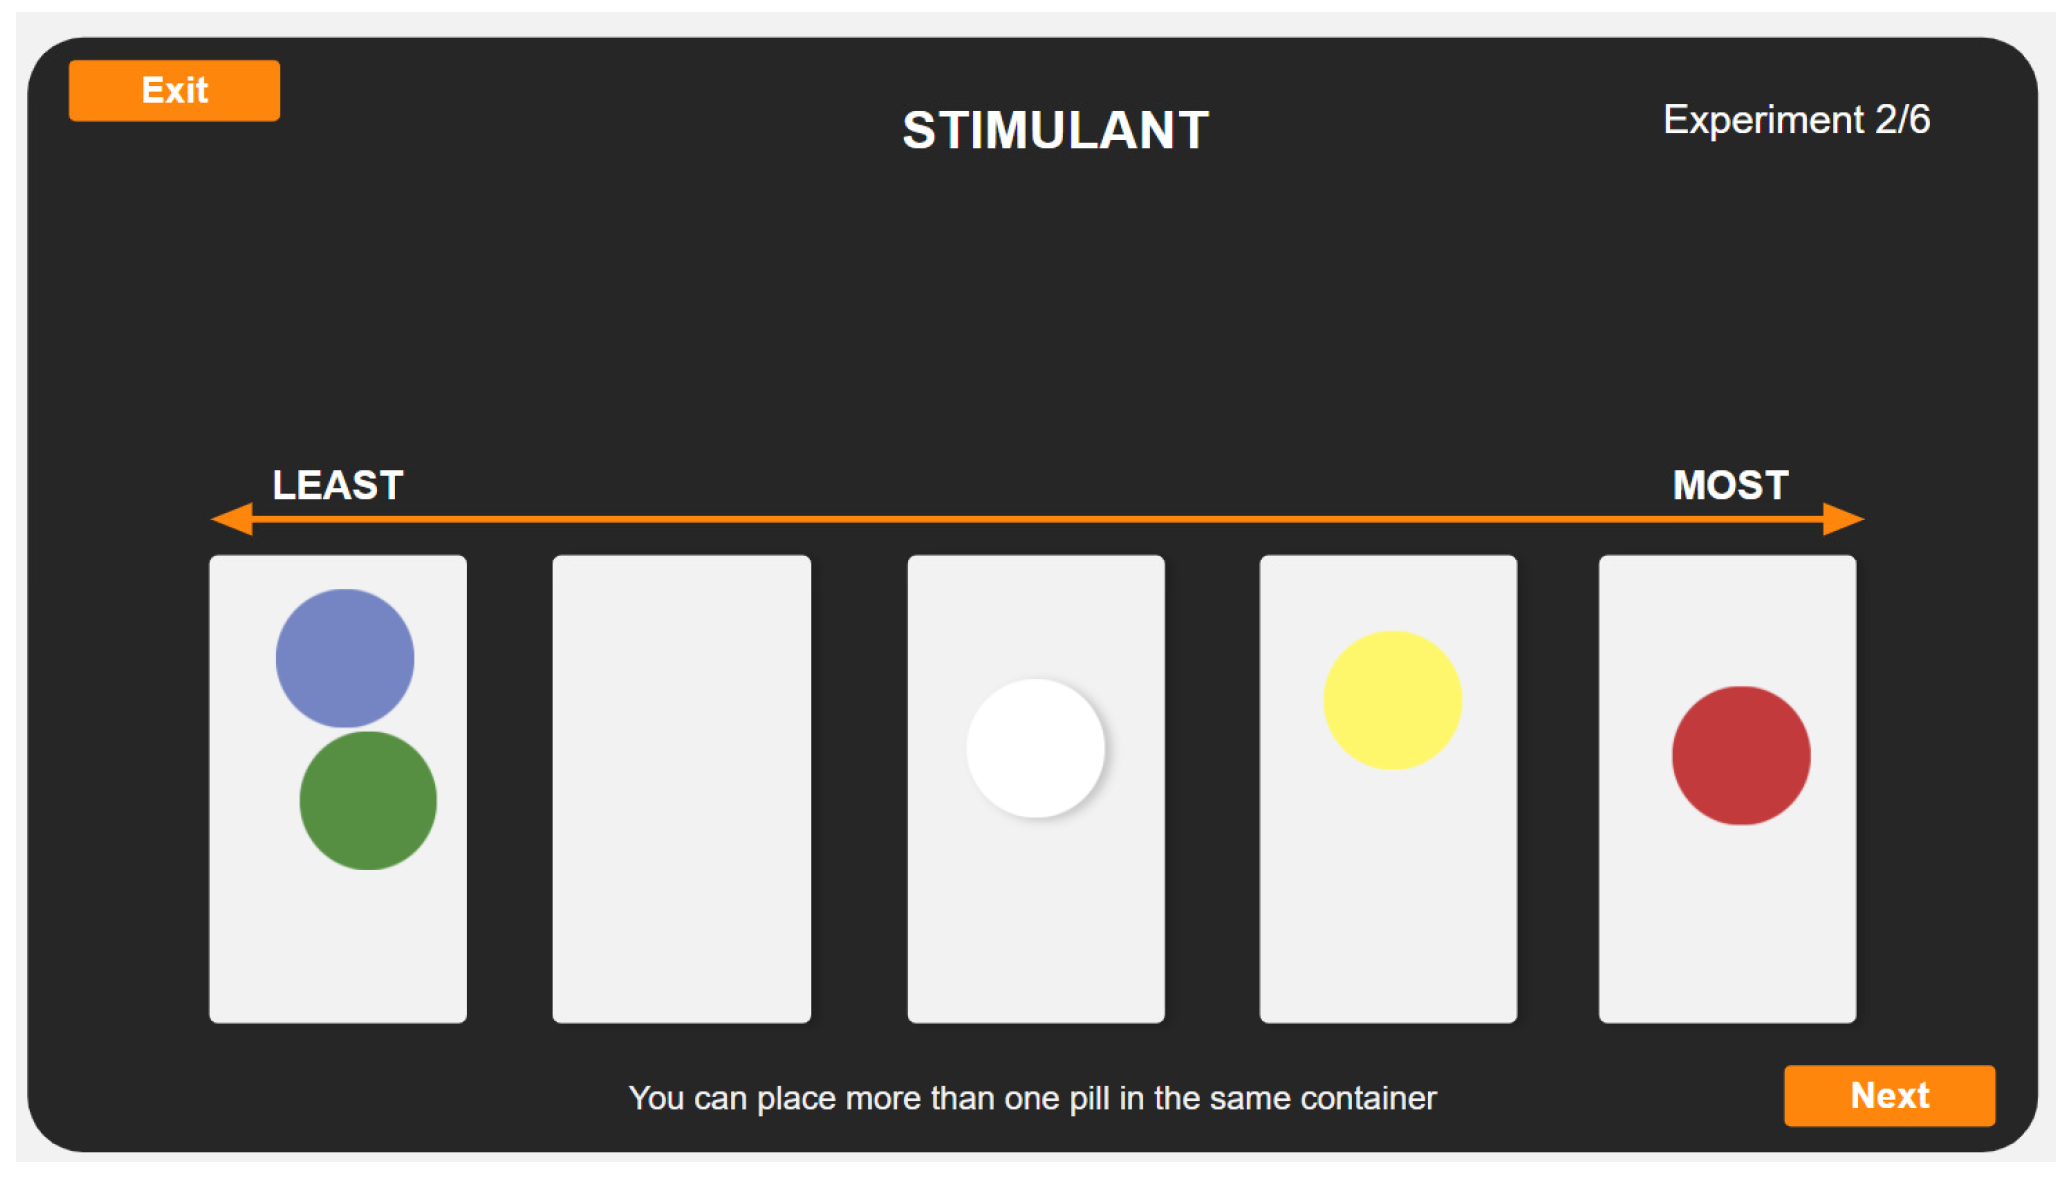
2.1. Method
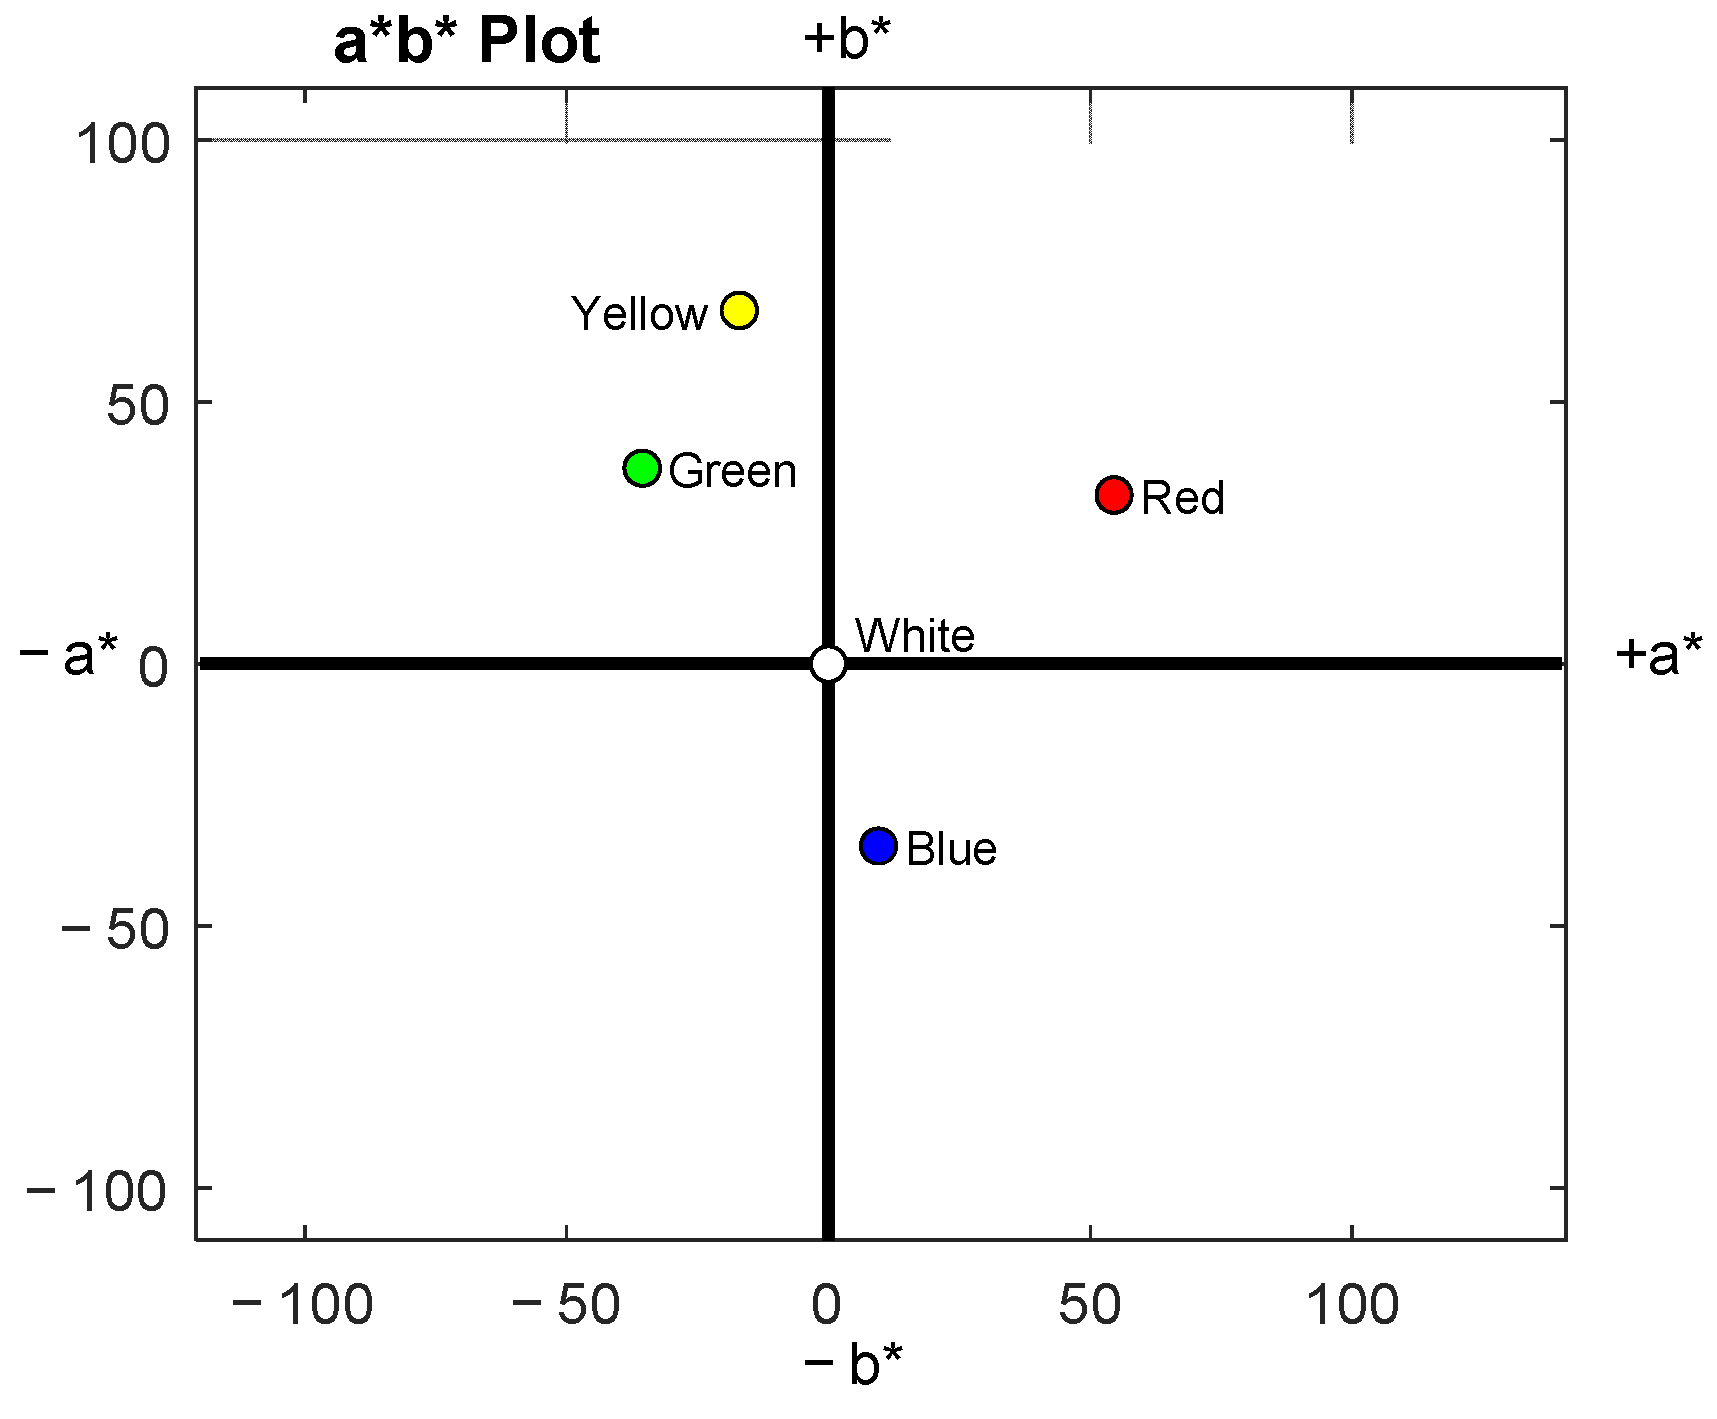
Color Stimuli
2.2. Results
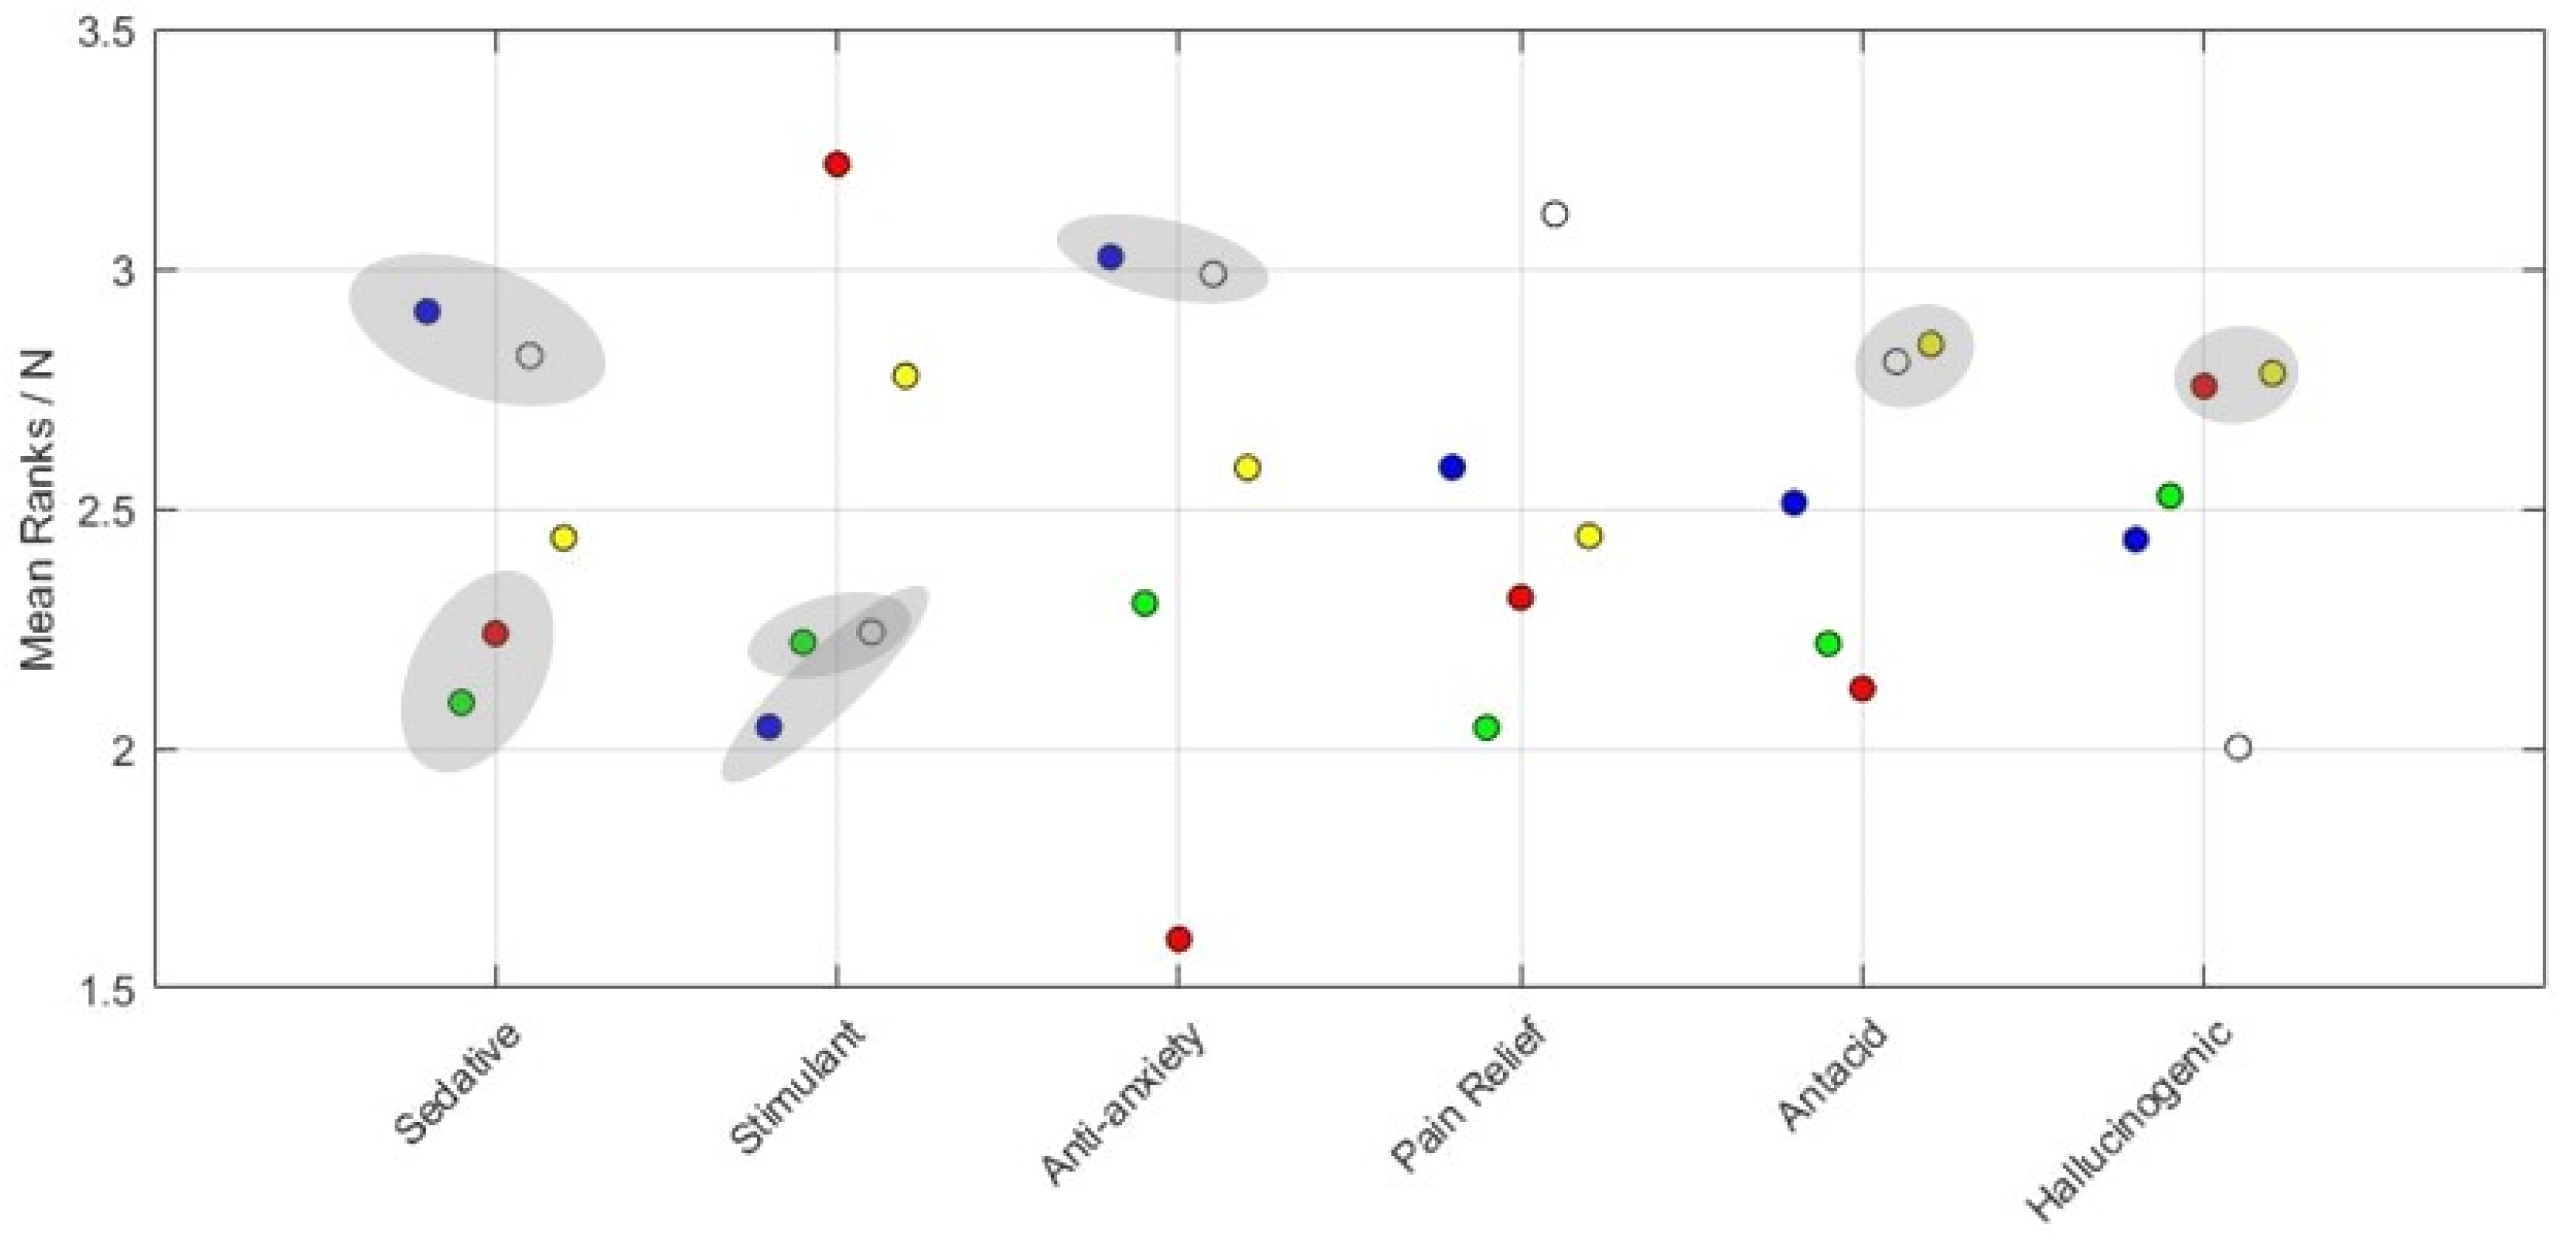
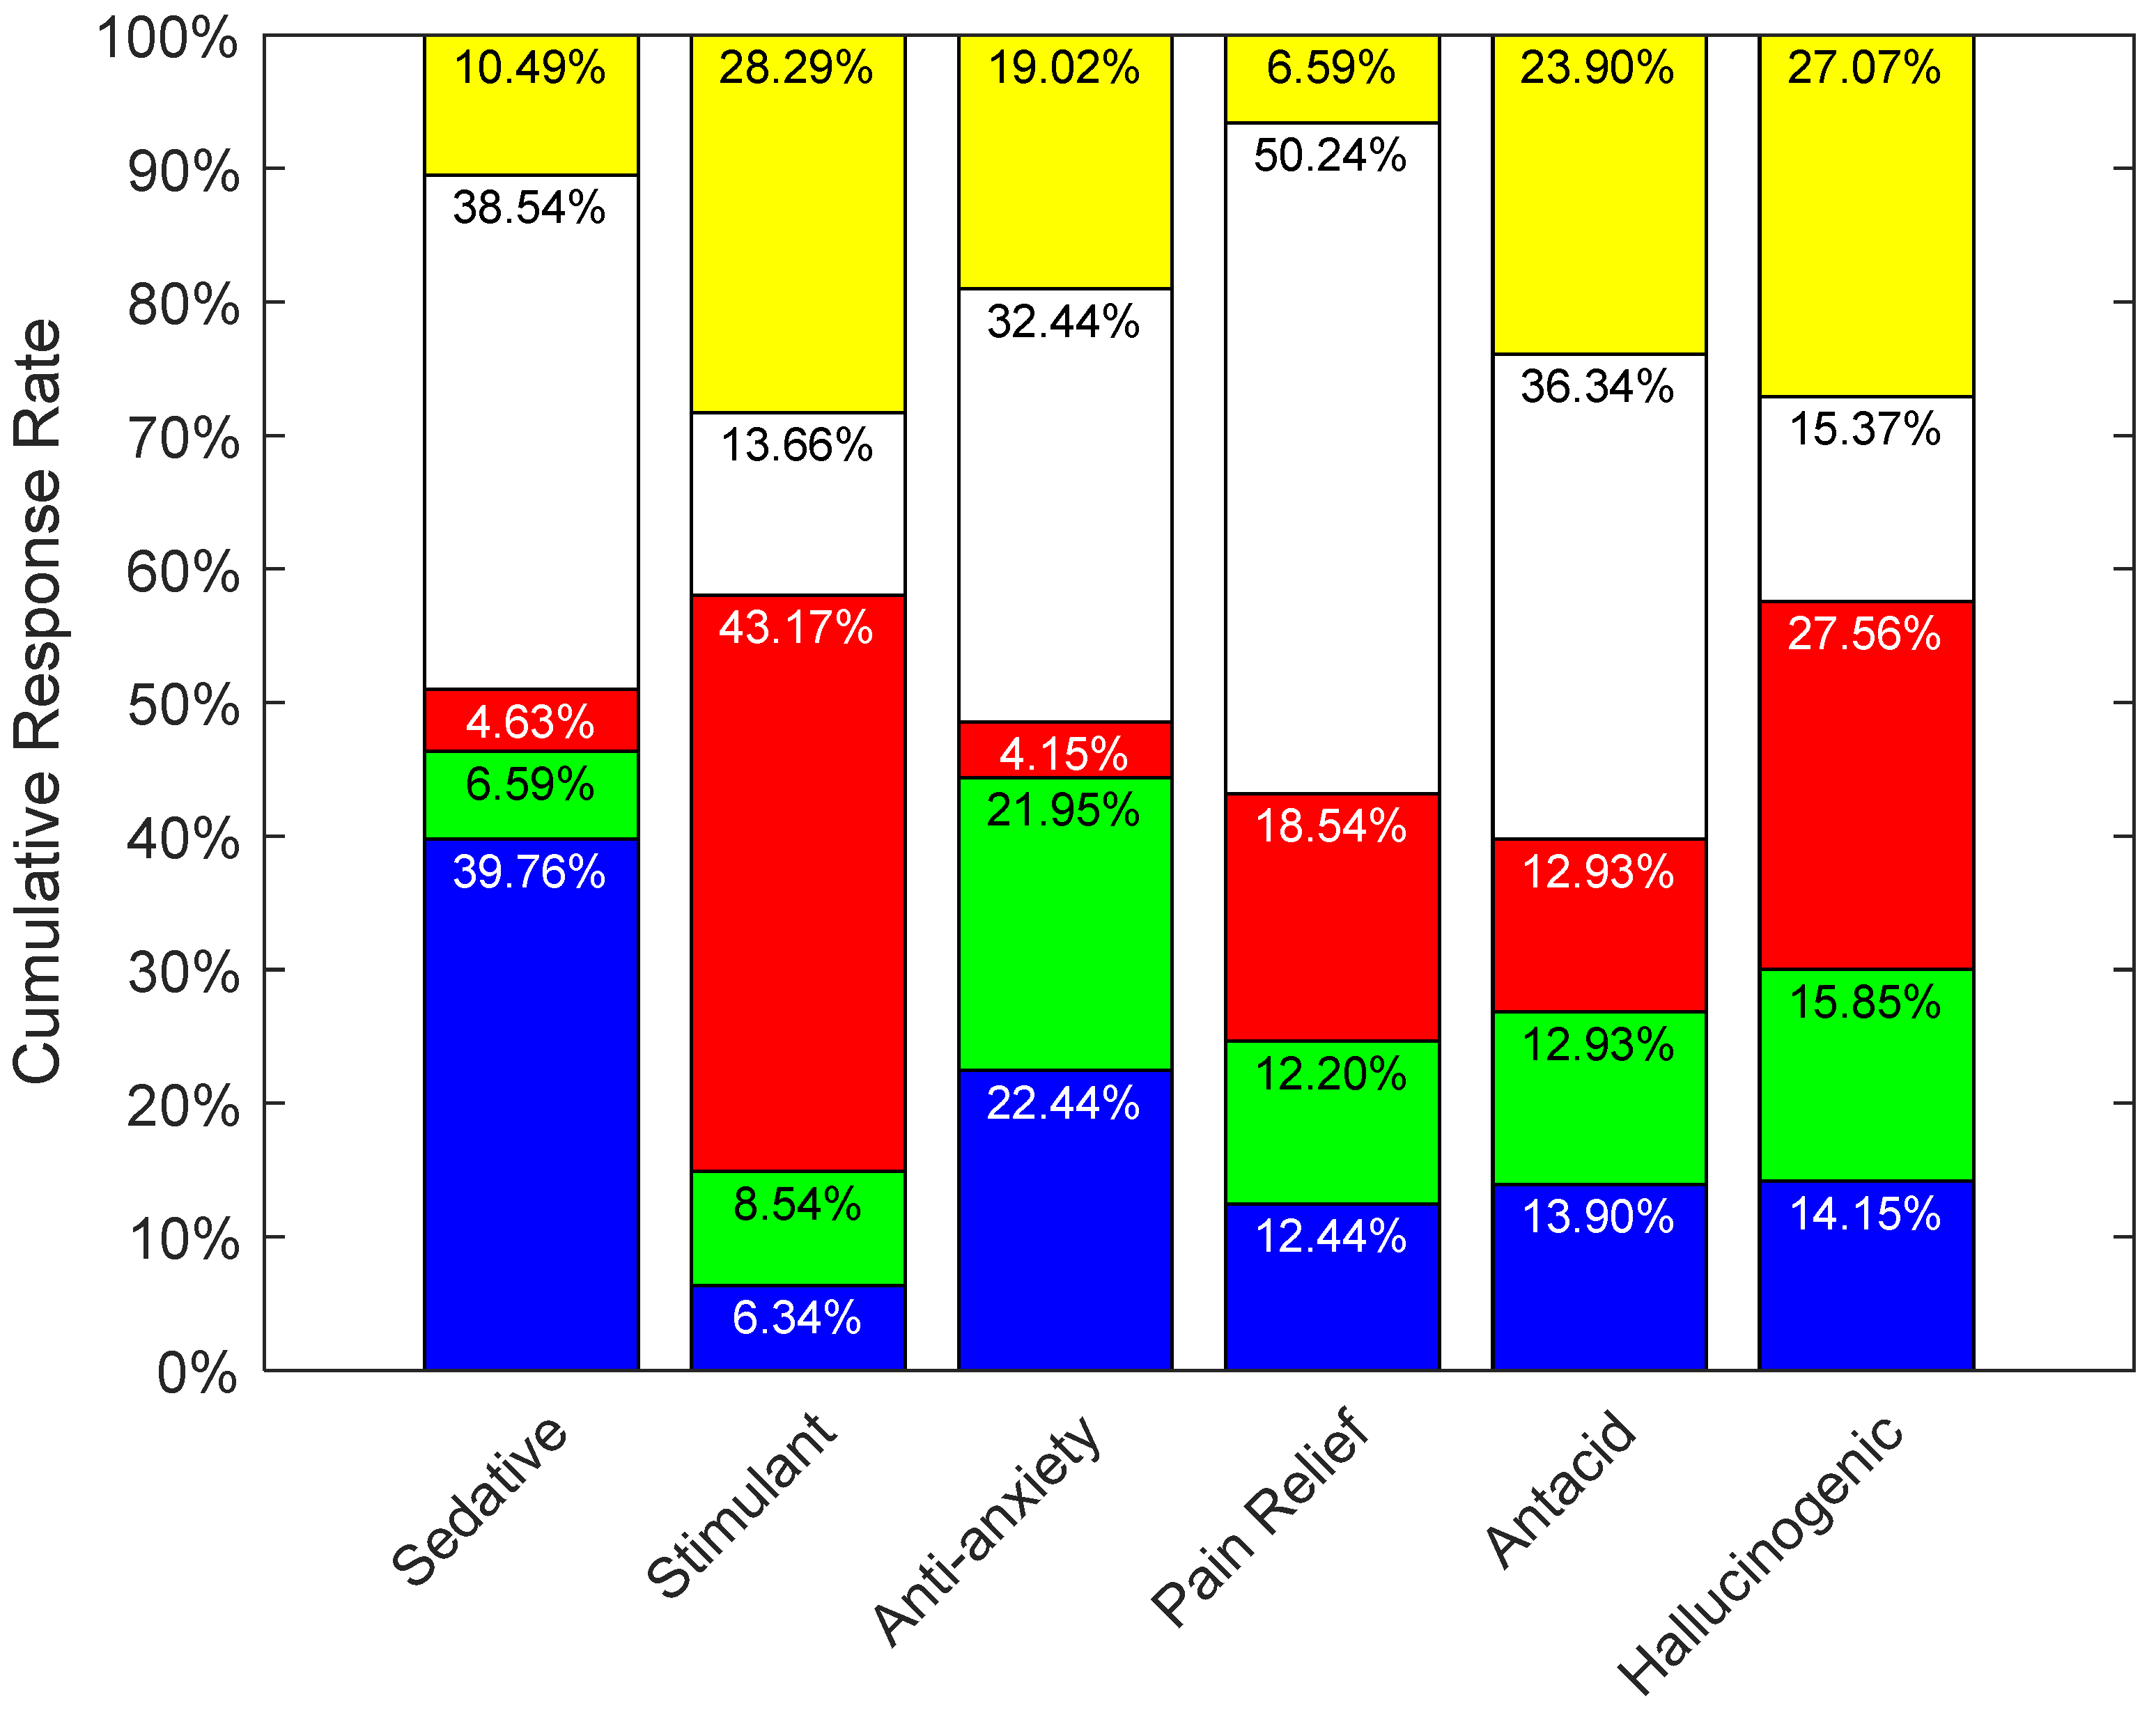
2.2.1. Overall Effect of Color by Efficacy
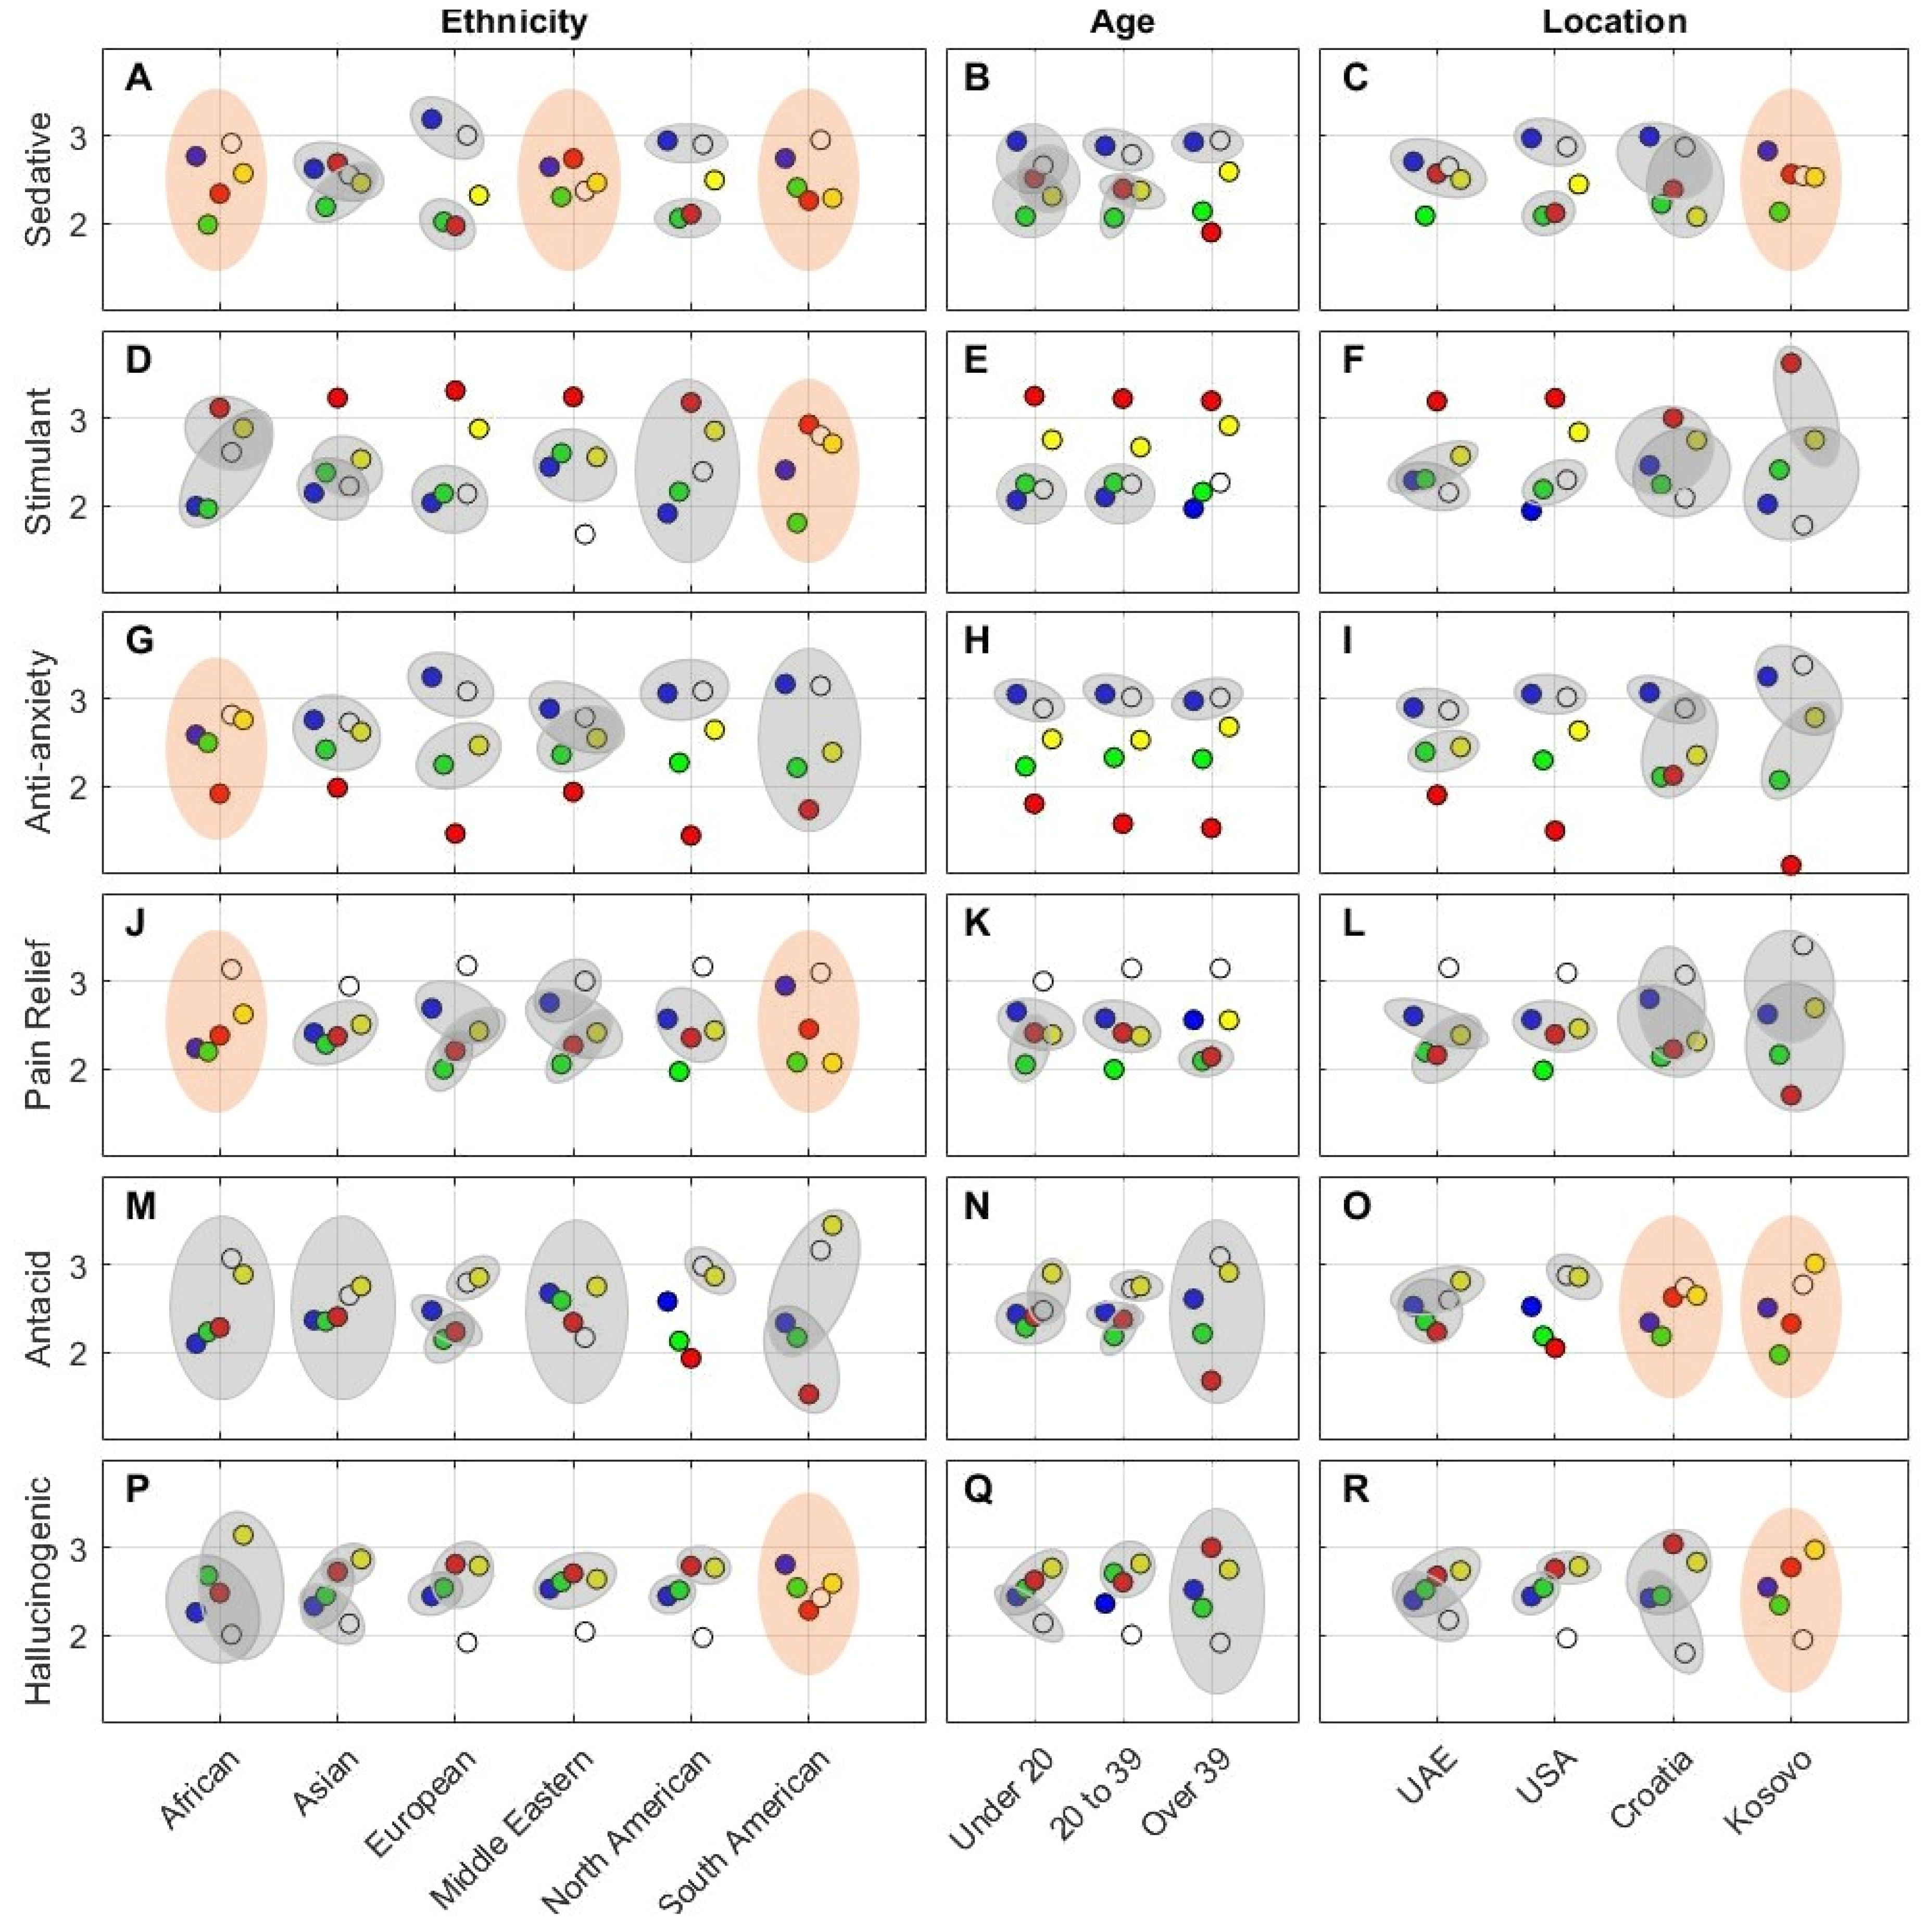
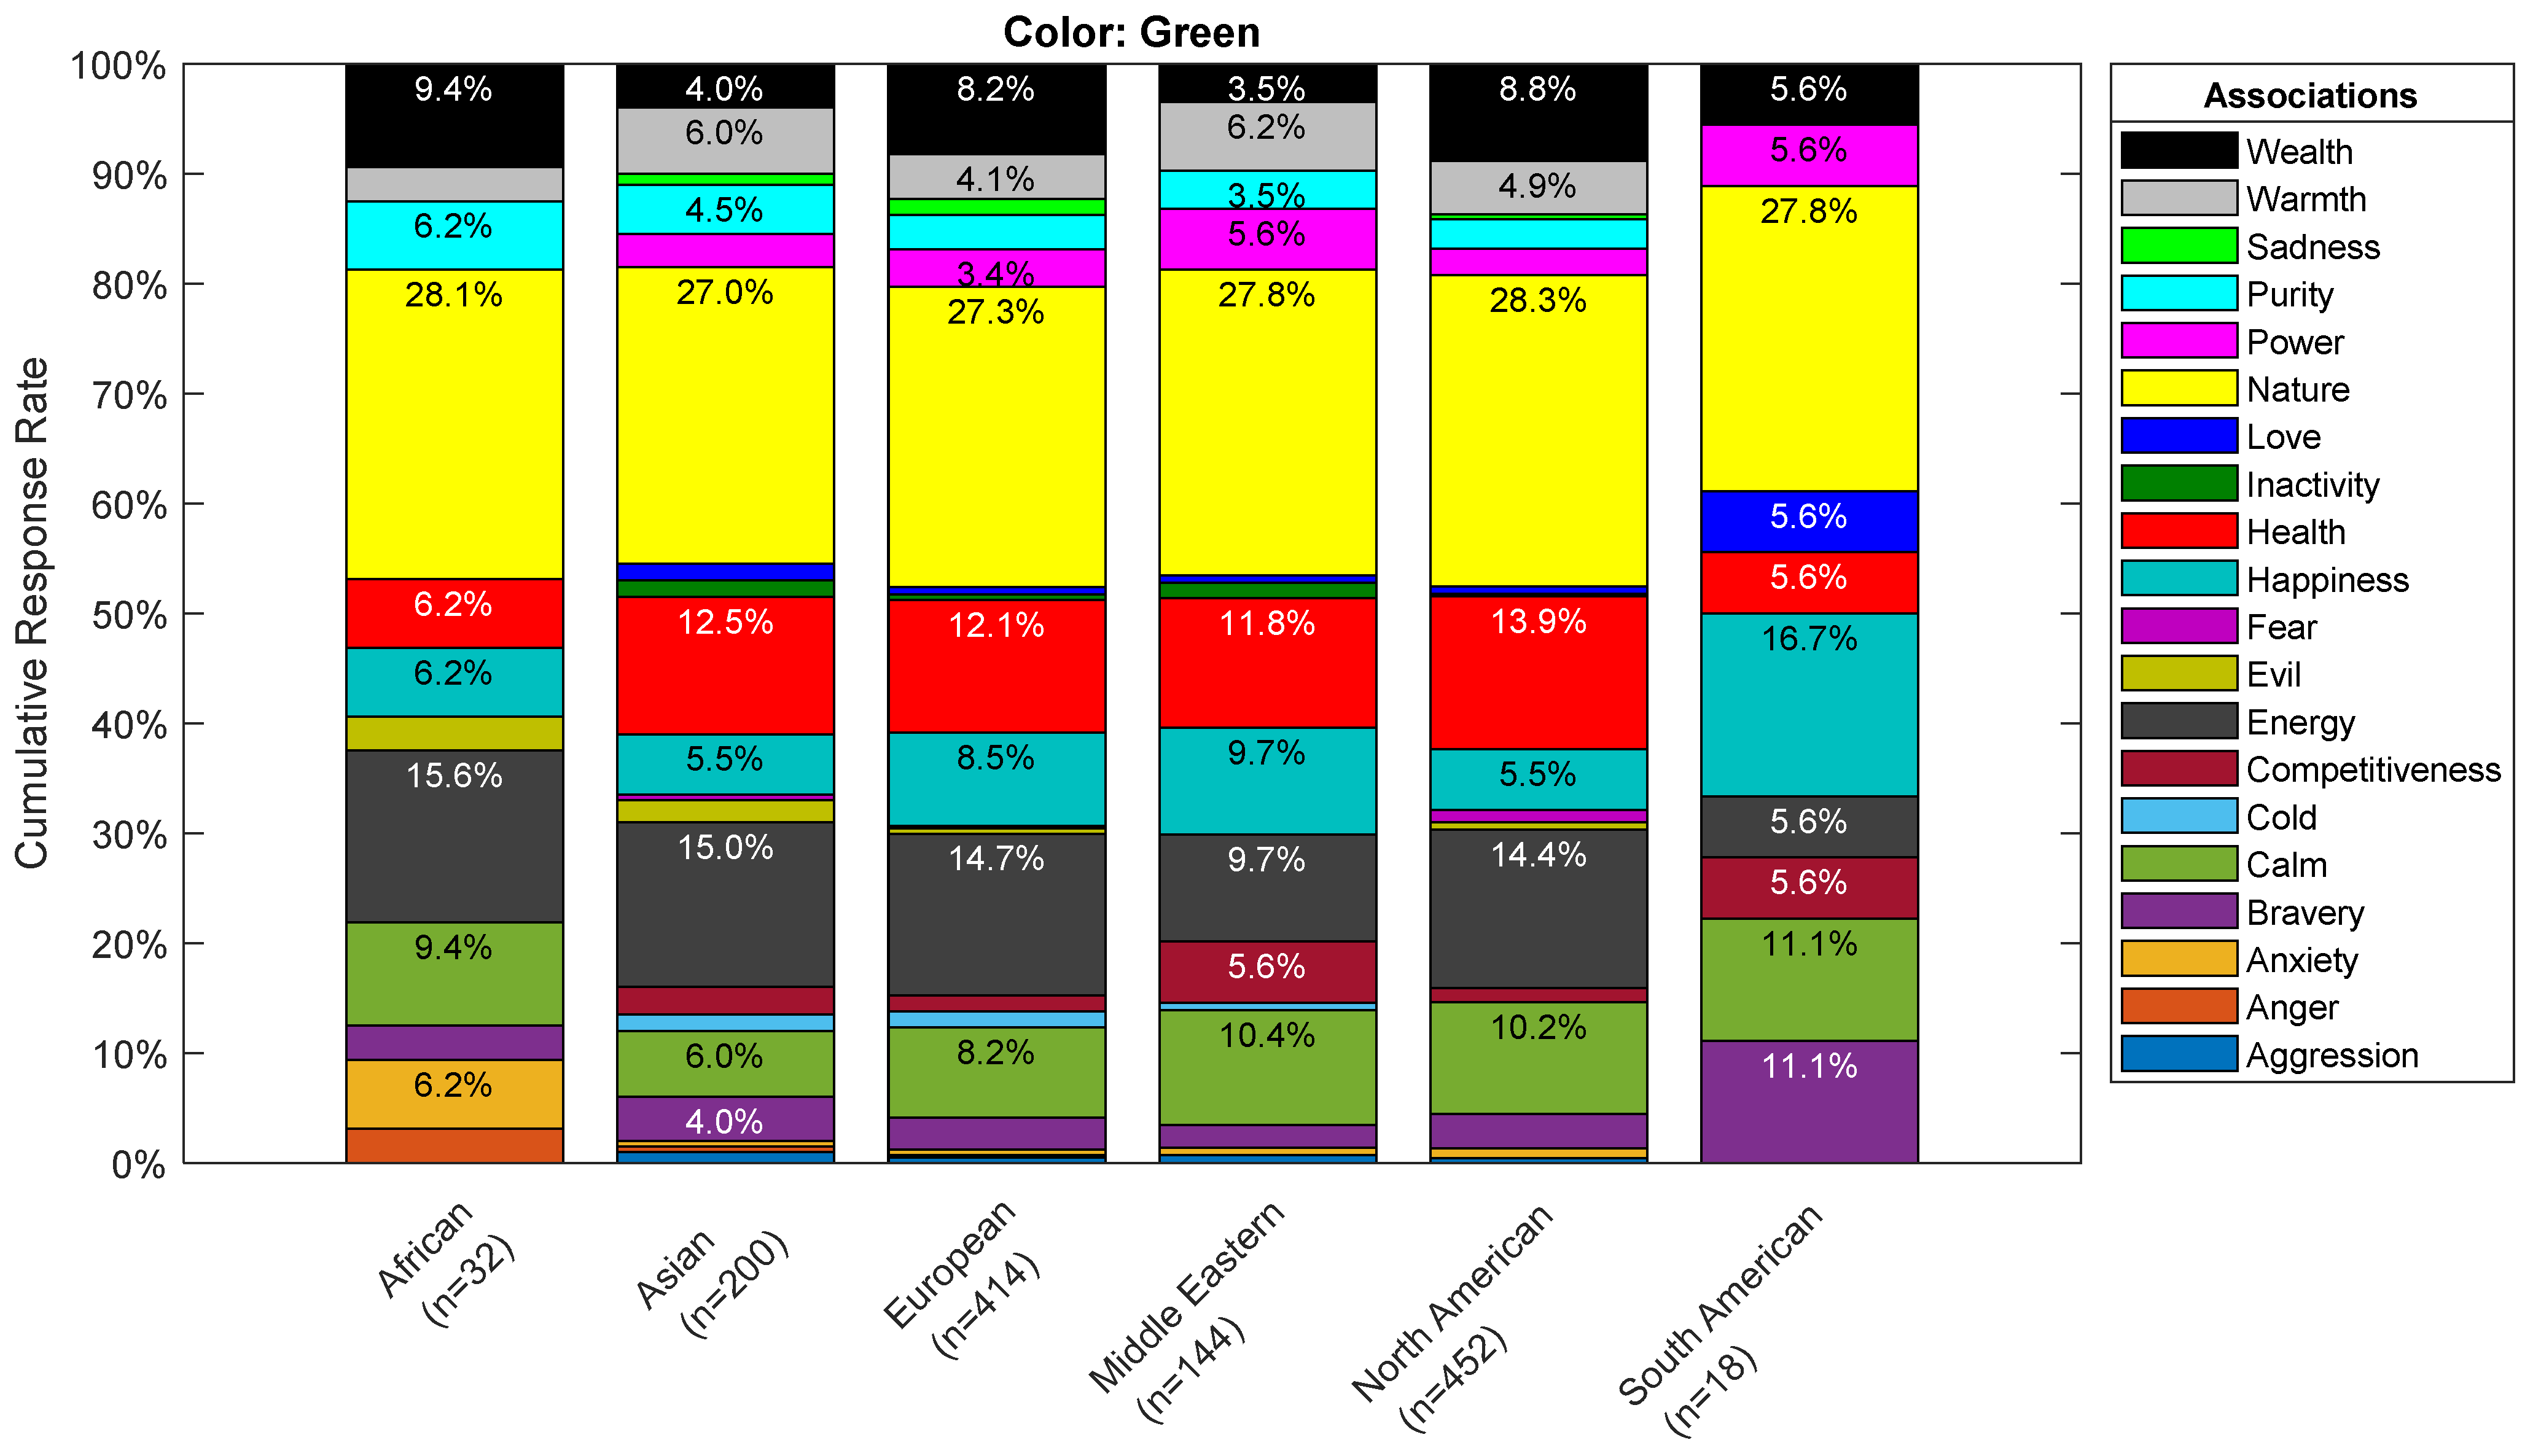
2.2.2. Effect of Color and Ethnicity
2.2.3. Effect of Color and Age
2.2.4. Effect of Color and Location

| Sedative | Stimulant | Anti-Anxiety | Pain Relief | Antacid | Hallucinogenic | |||||||
|---|---|---|---|---|---|---|---|---|---|---|---|---|
| Location | X2 | p | X2 | p | X2 | p | X2 | p | X2 | p | X2 | p |
| UAE | 23.2 | 0.0001 | 67.67 | <0.001 | 64.92 | <0.001 | 64.96 | <0.001 | 19.48 | 0.0006 | 19.96 | 0.0005 |
| USA | 222.82 | <0.001 | 358.77 | <0.001 | 540.66 | <0.001 | 209.82 | <0.001 | 189.46 | <0.001 | 143.64 | 0.0000 |
| Croatia | 16.19 | 0.0028 | 13.76 | 0.0081 | 19.76 | <0.001 | 16.47 | 0.0024 | 5.53 | 0.2372 | 22.65 | 0.0001 |
| Kosovo | 3.21 | 0.523 | 27.05 | <0.001 | 46.24 | <0.001 | 21.13 | 0.0003 | 8.24 | 0.0831 | 8.15 | 0.0862 |

2.3. Discussion
3. Experiment 2
3.1. Method
3.2. Results
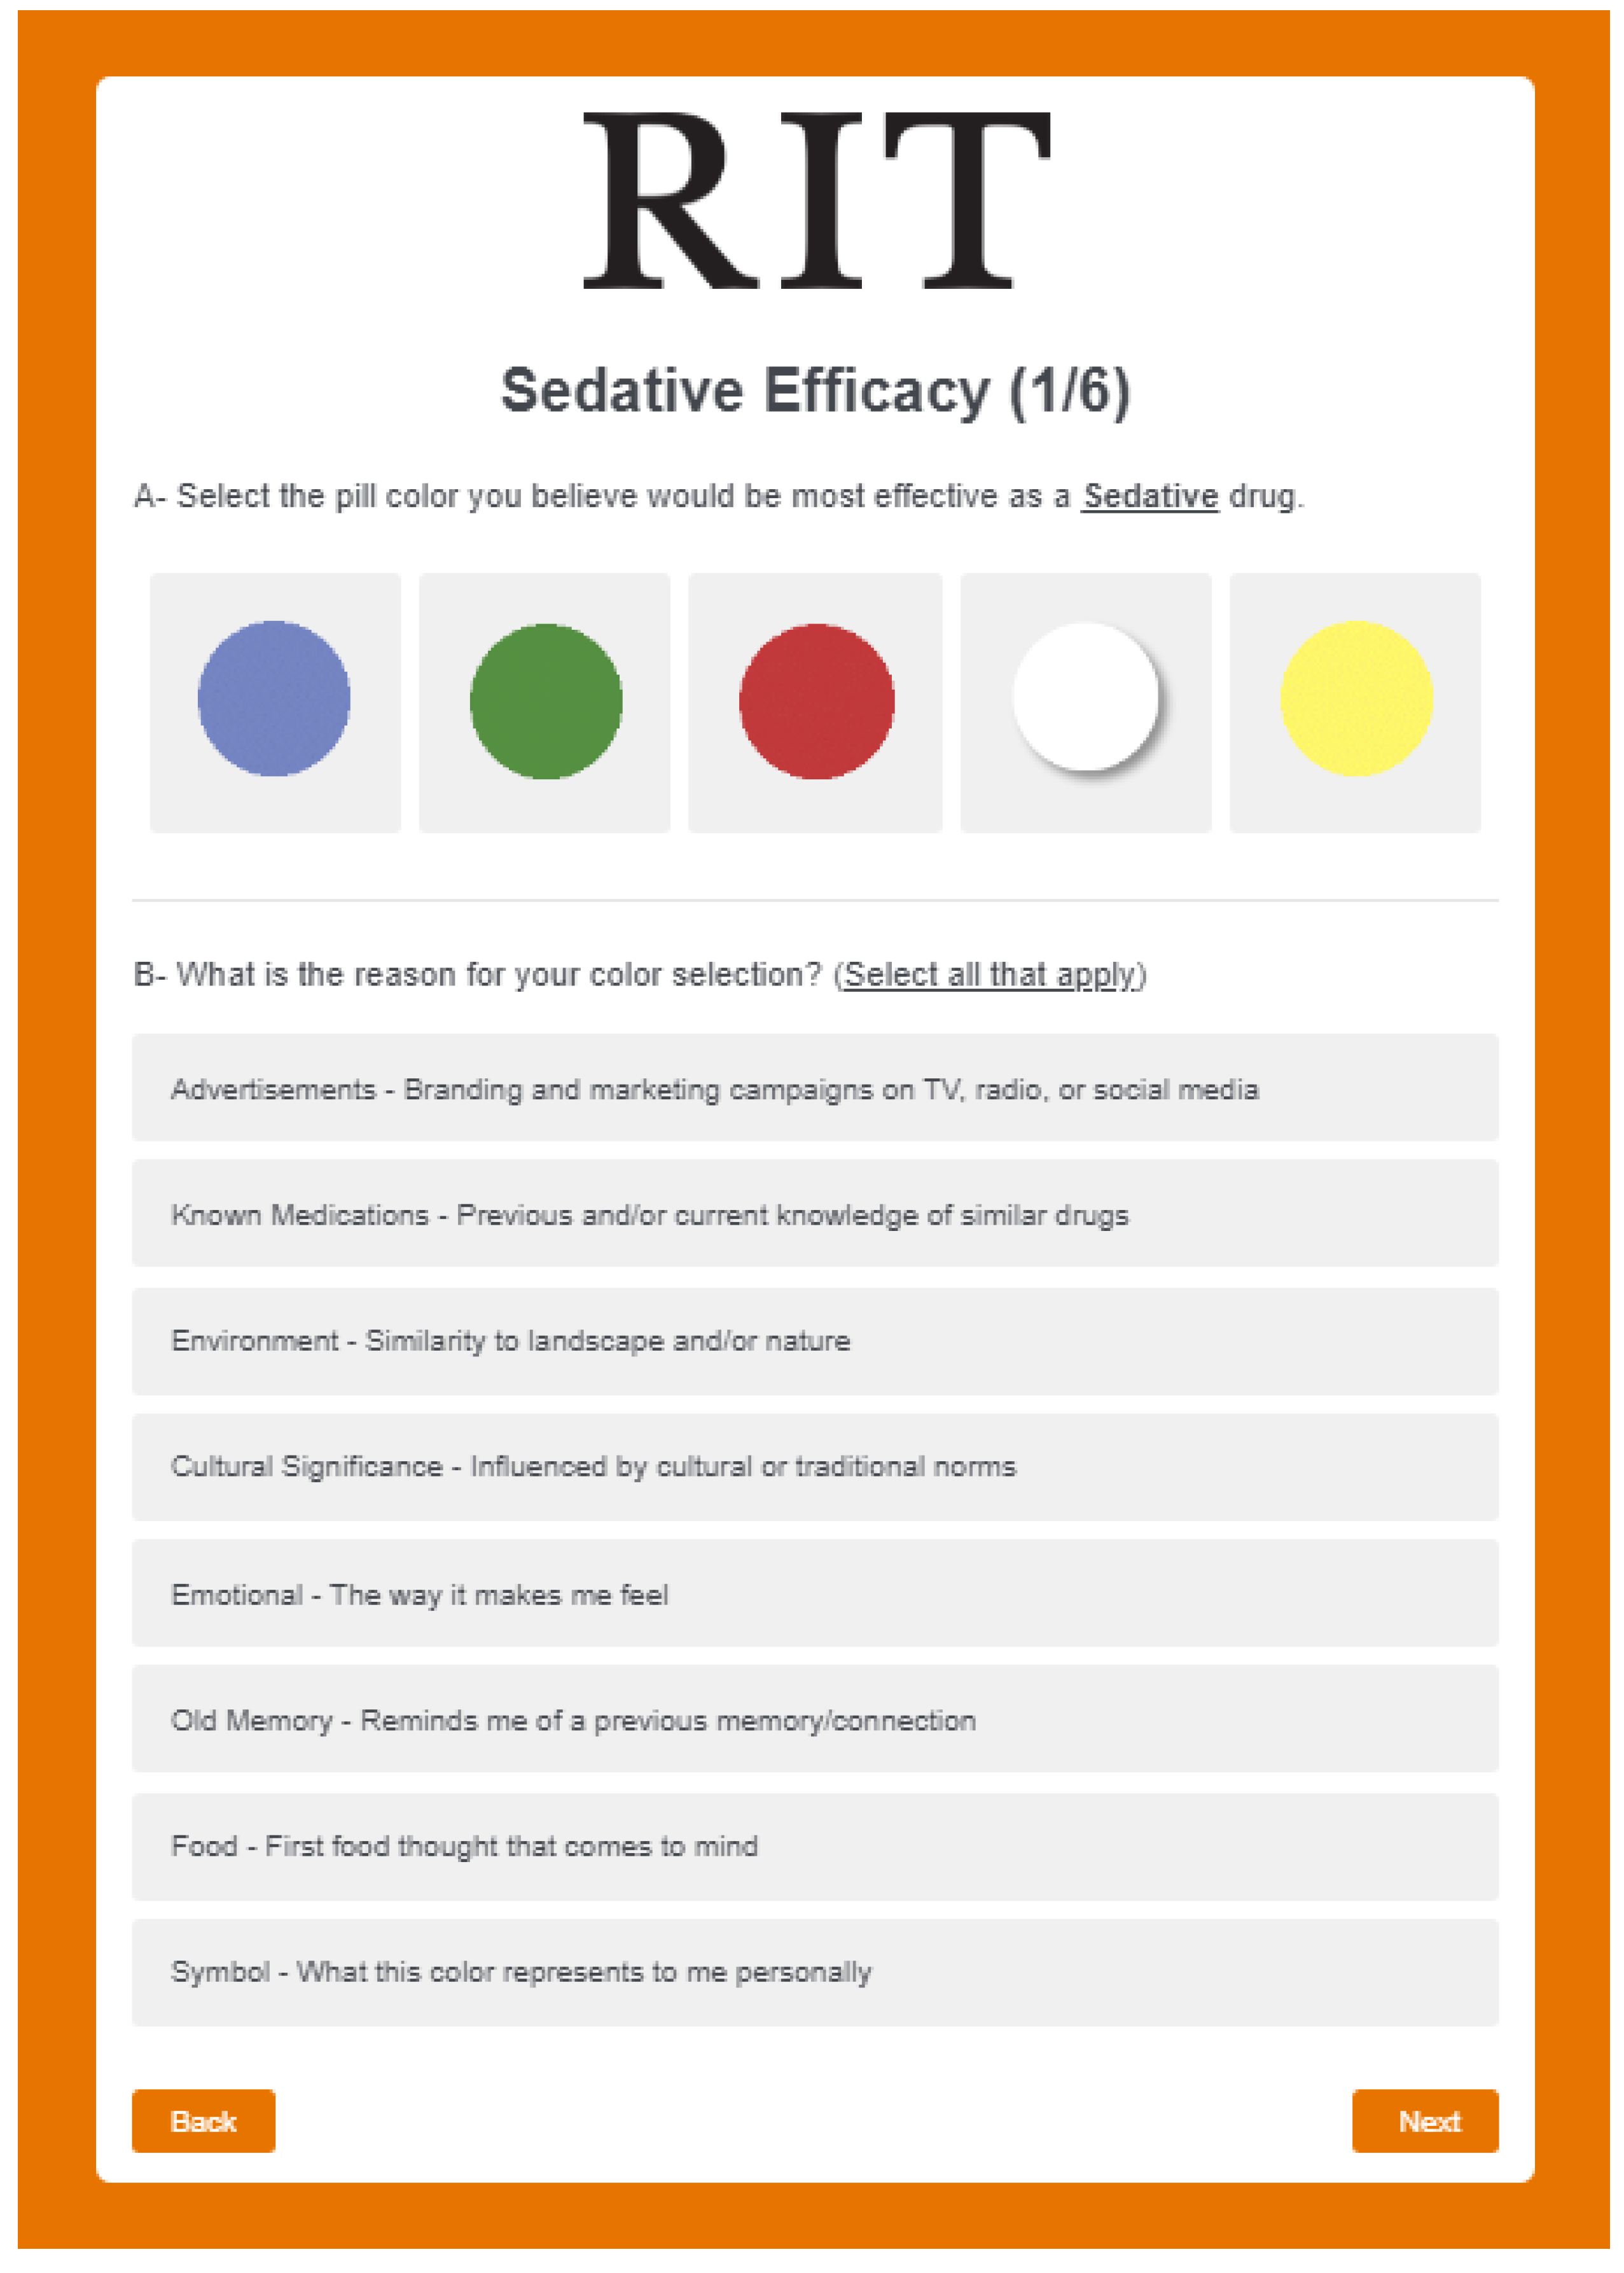
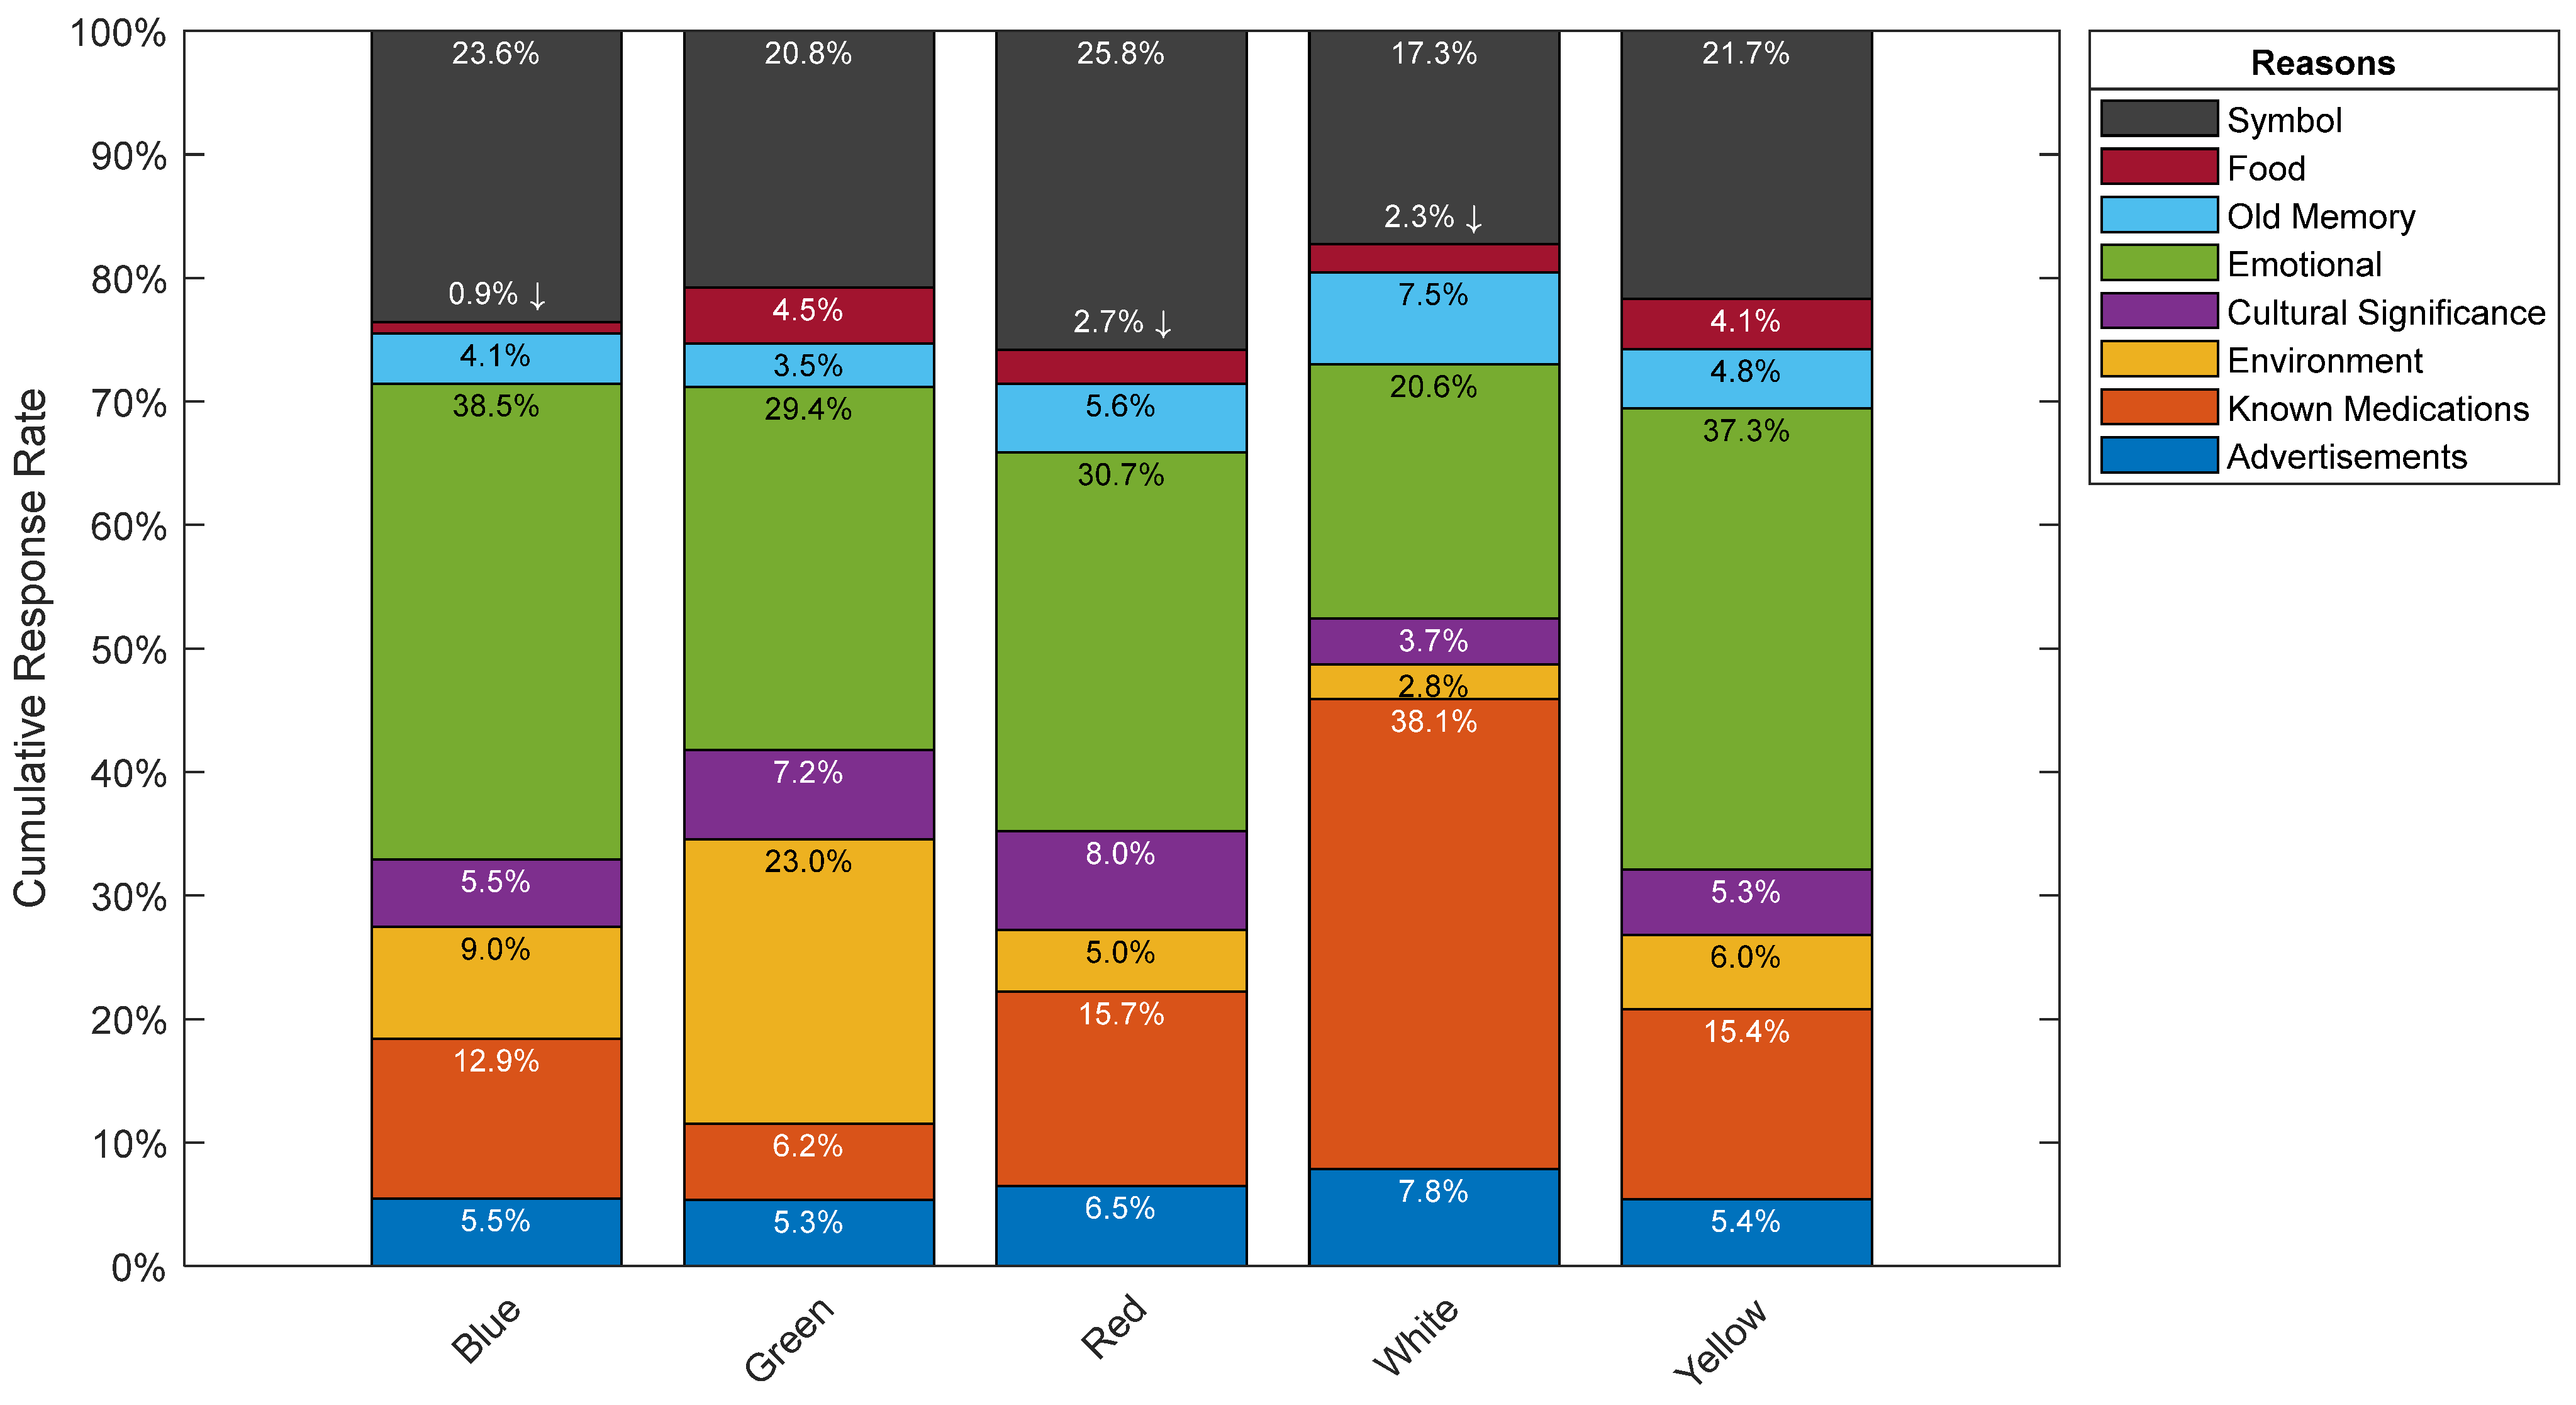
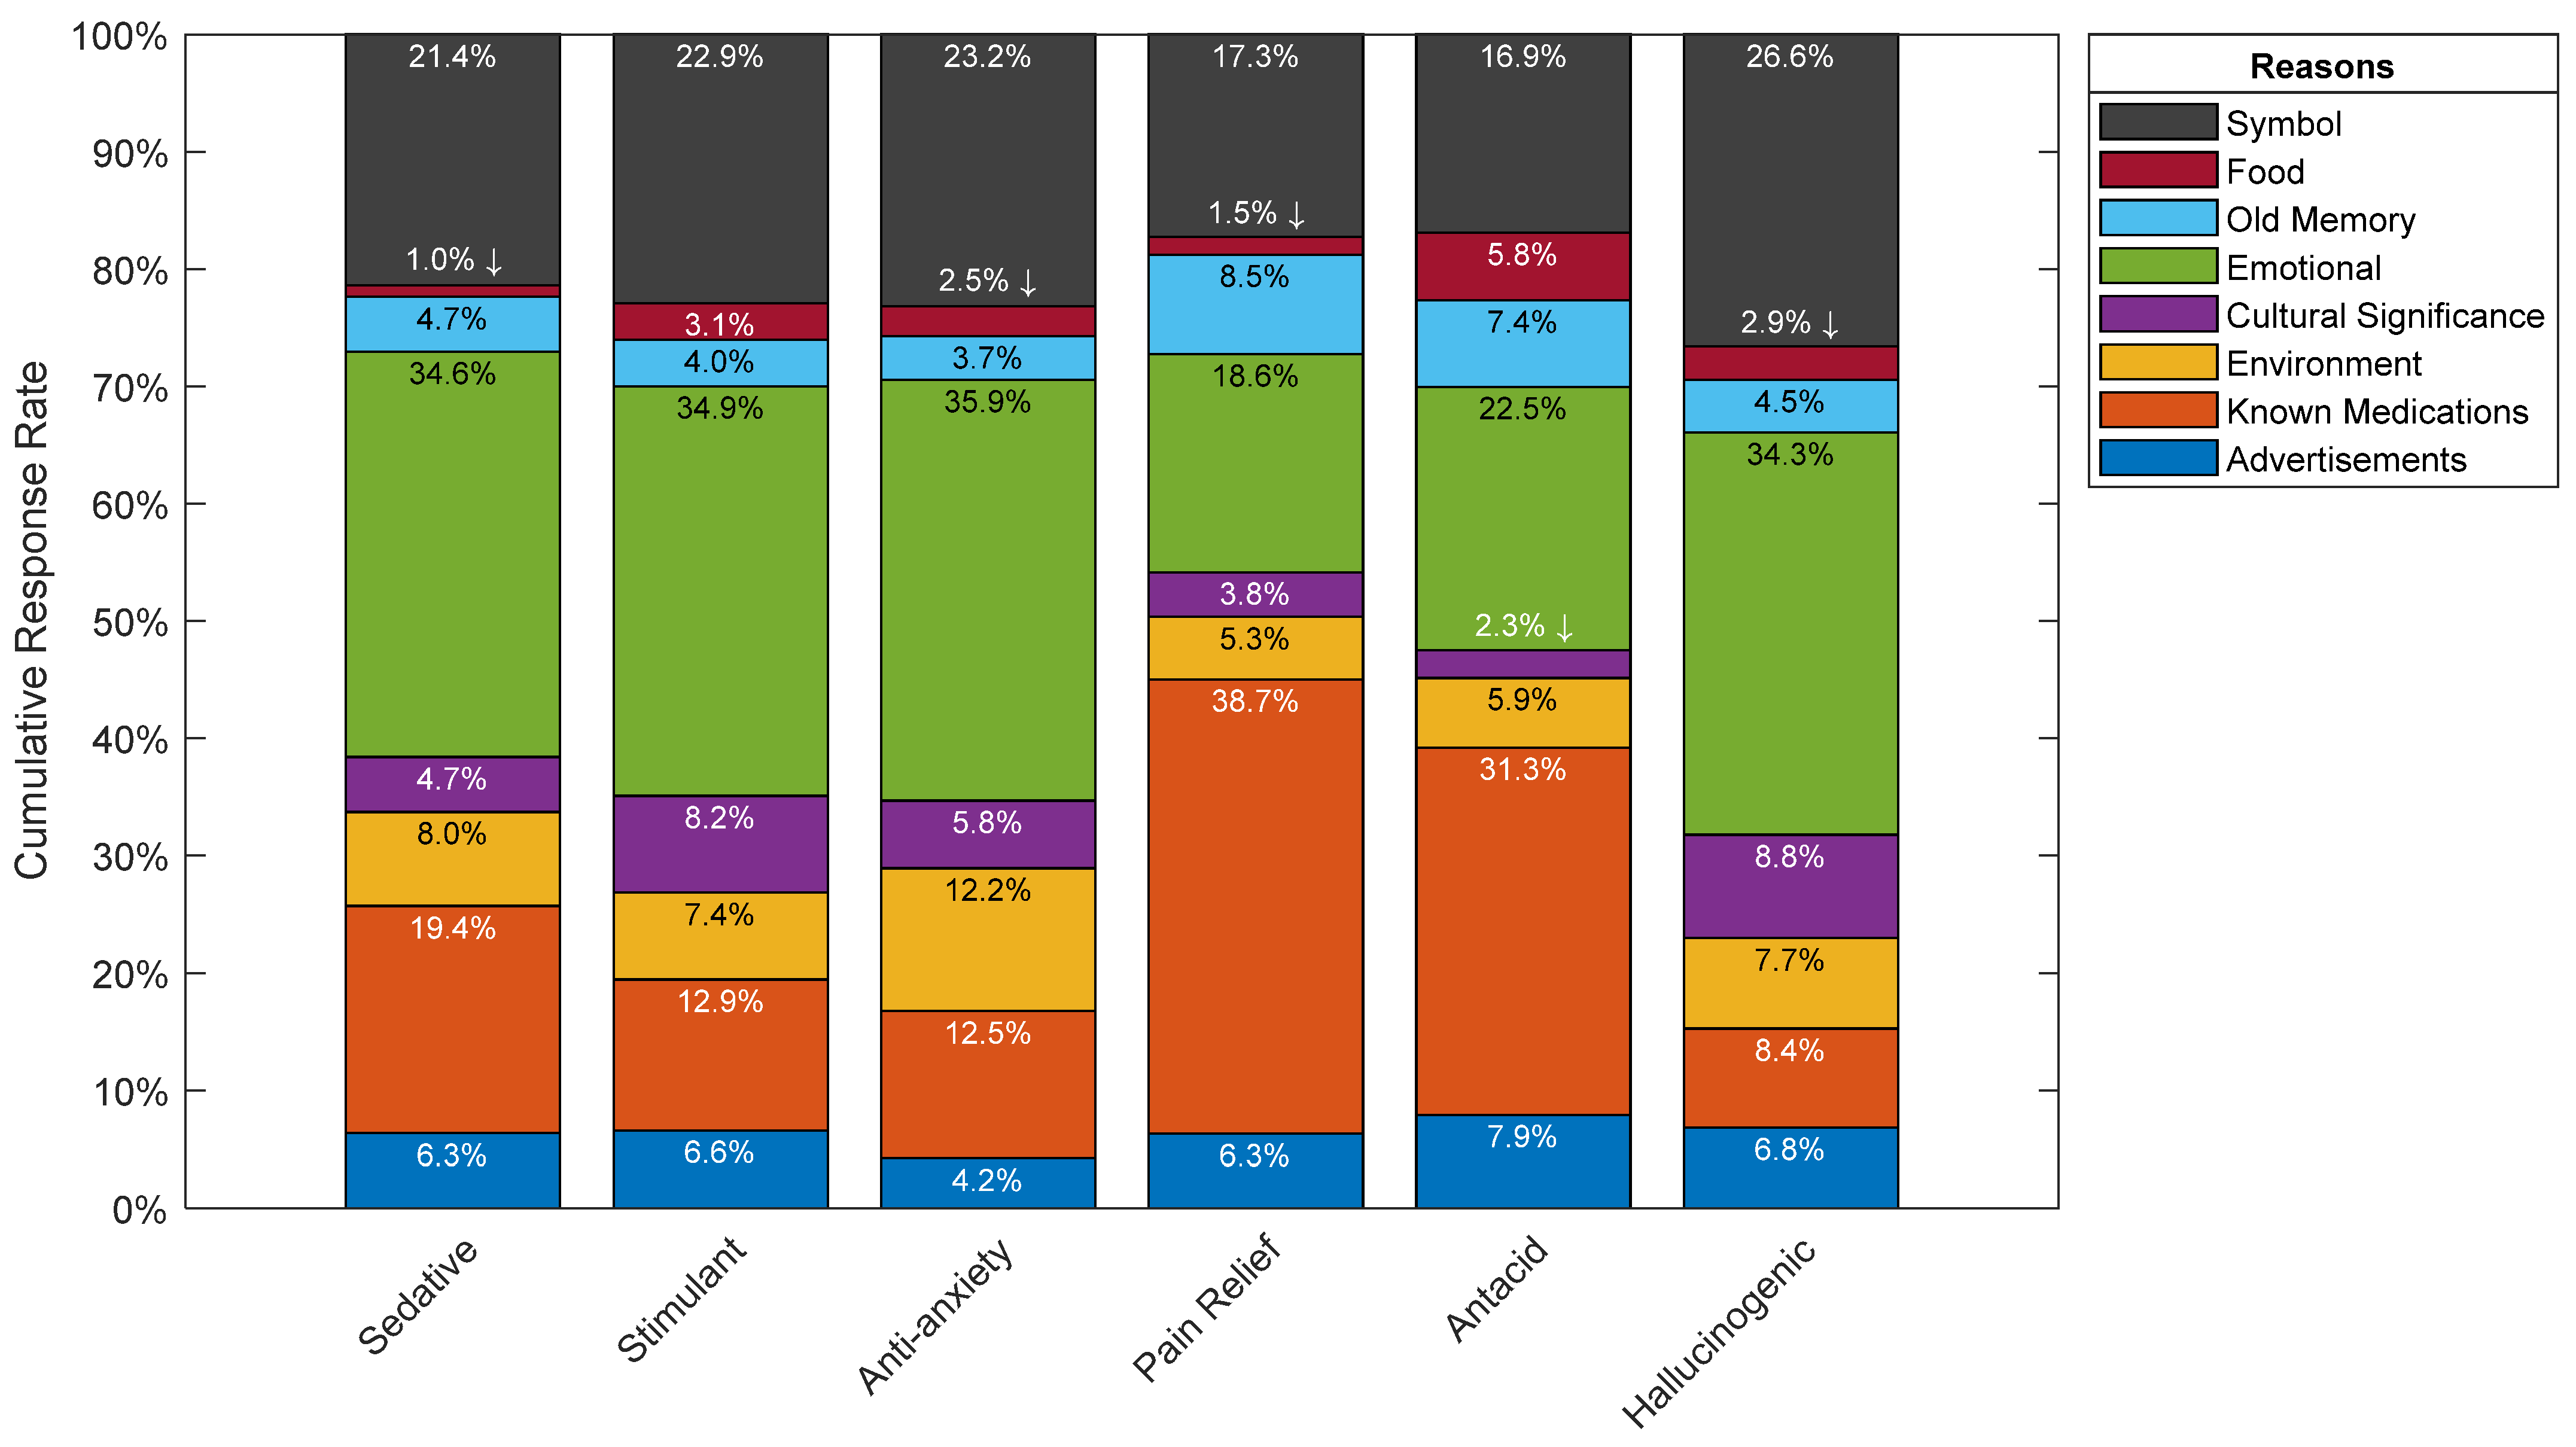
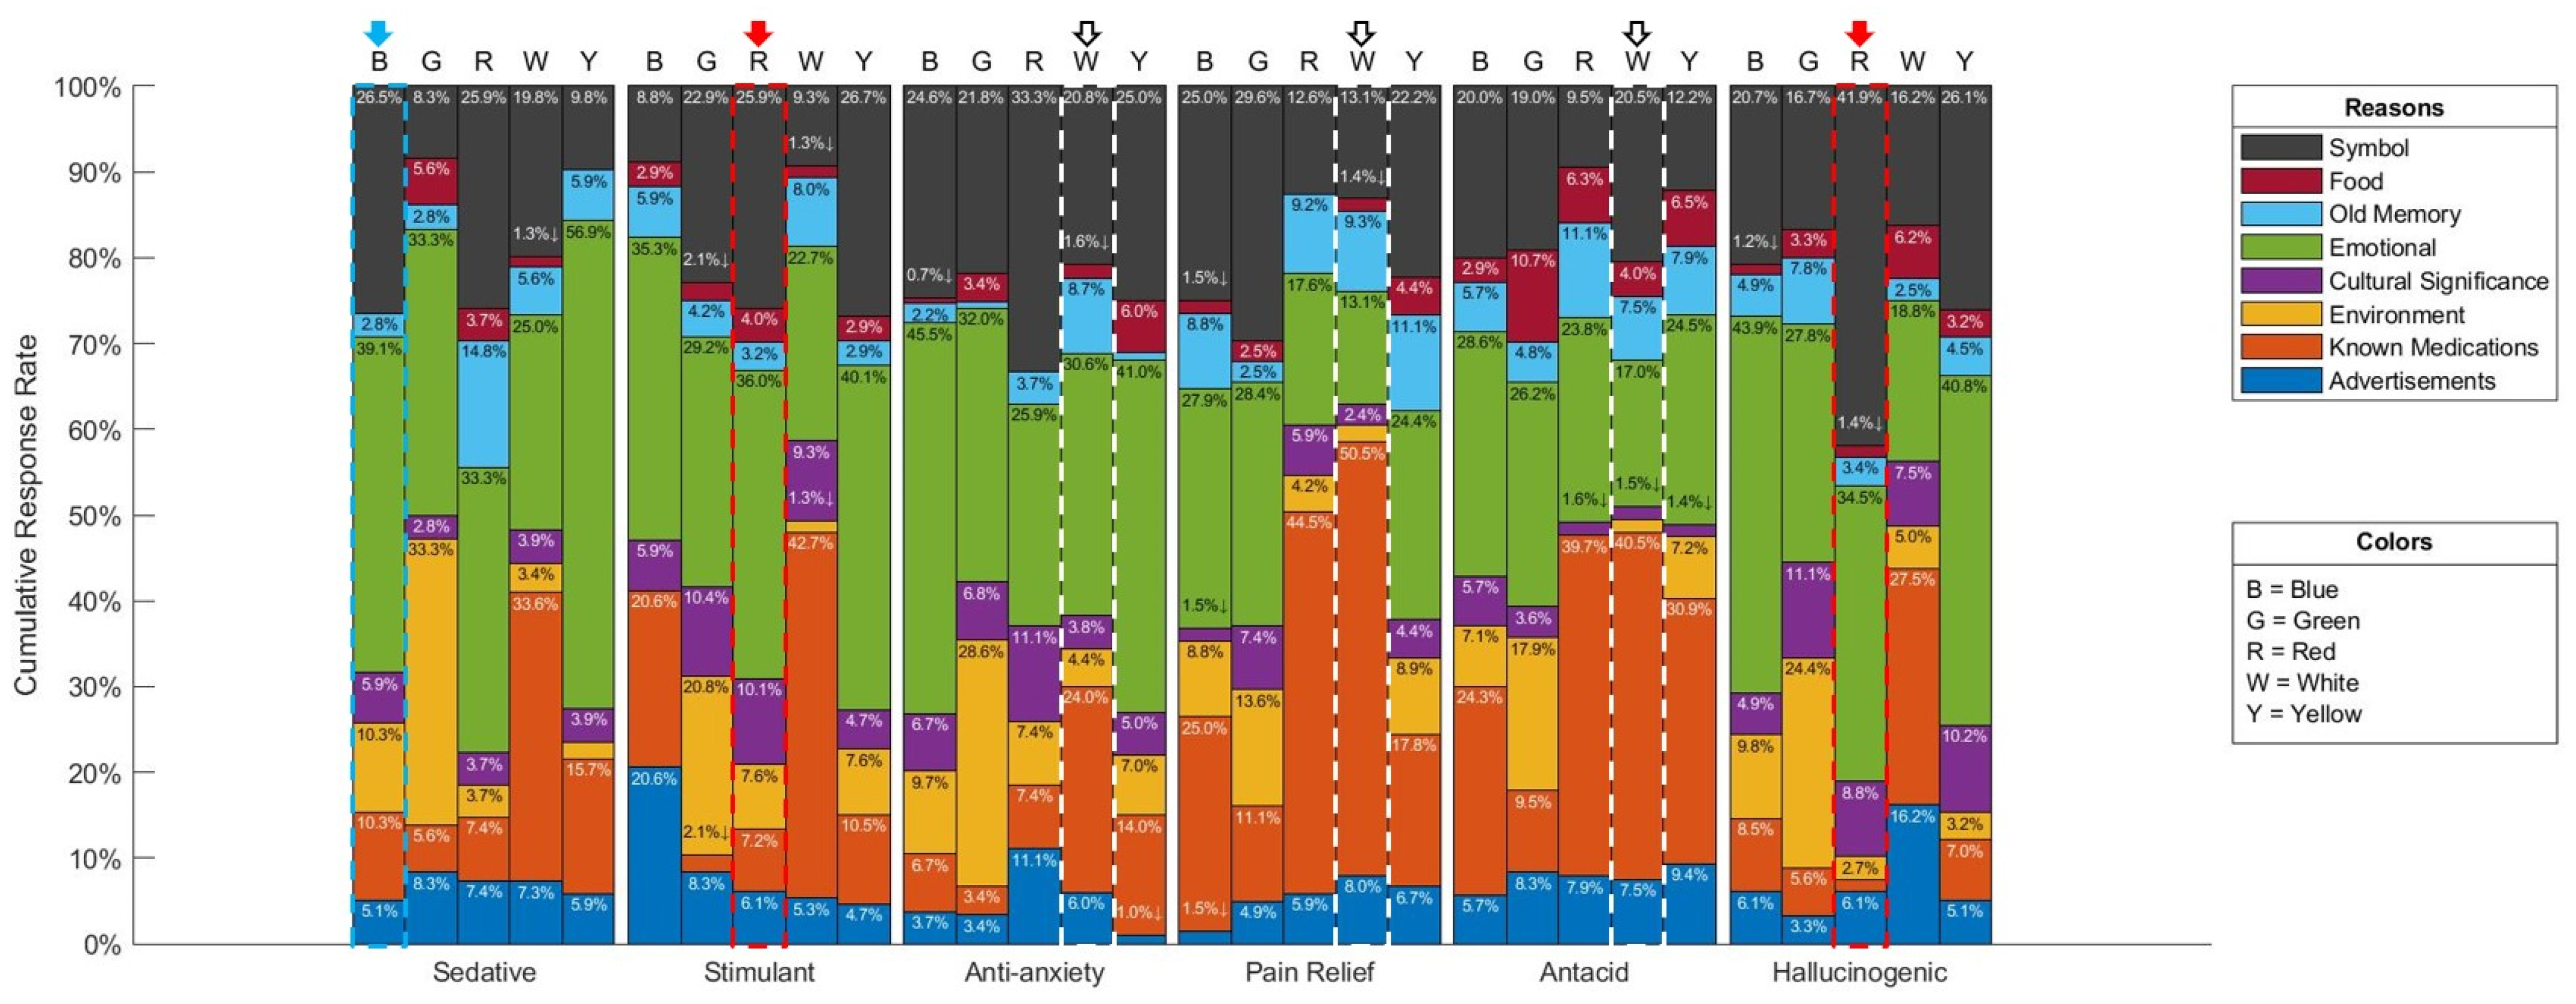
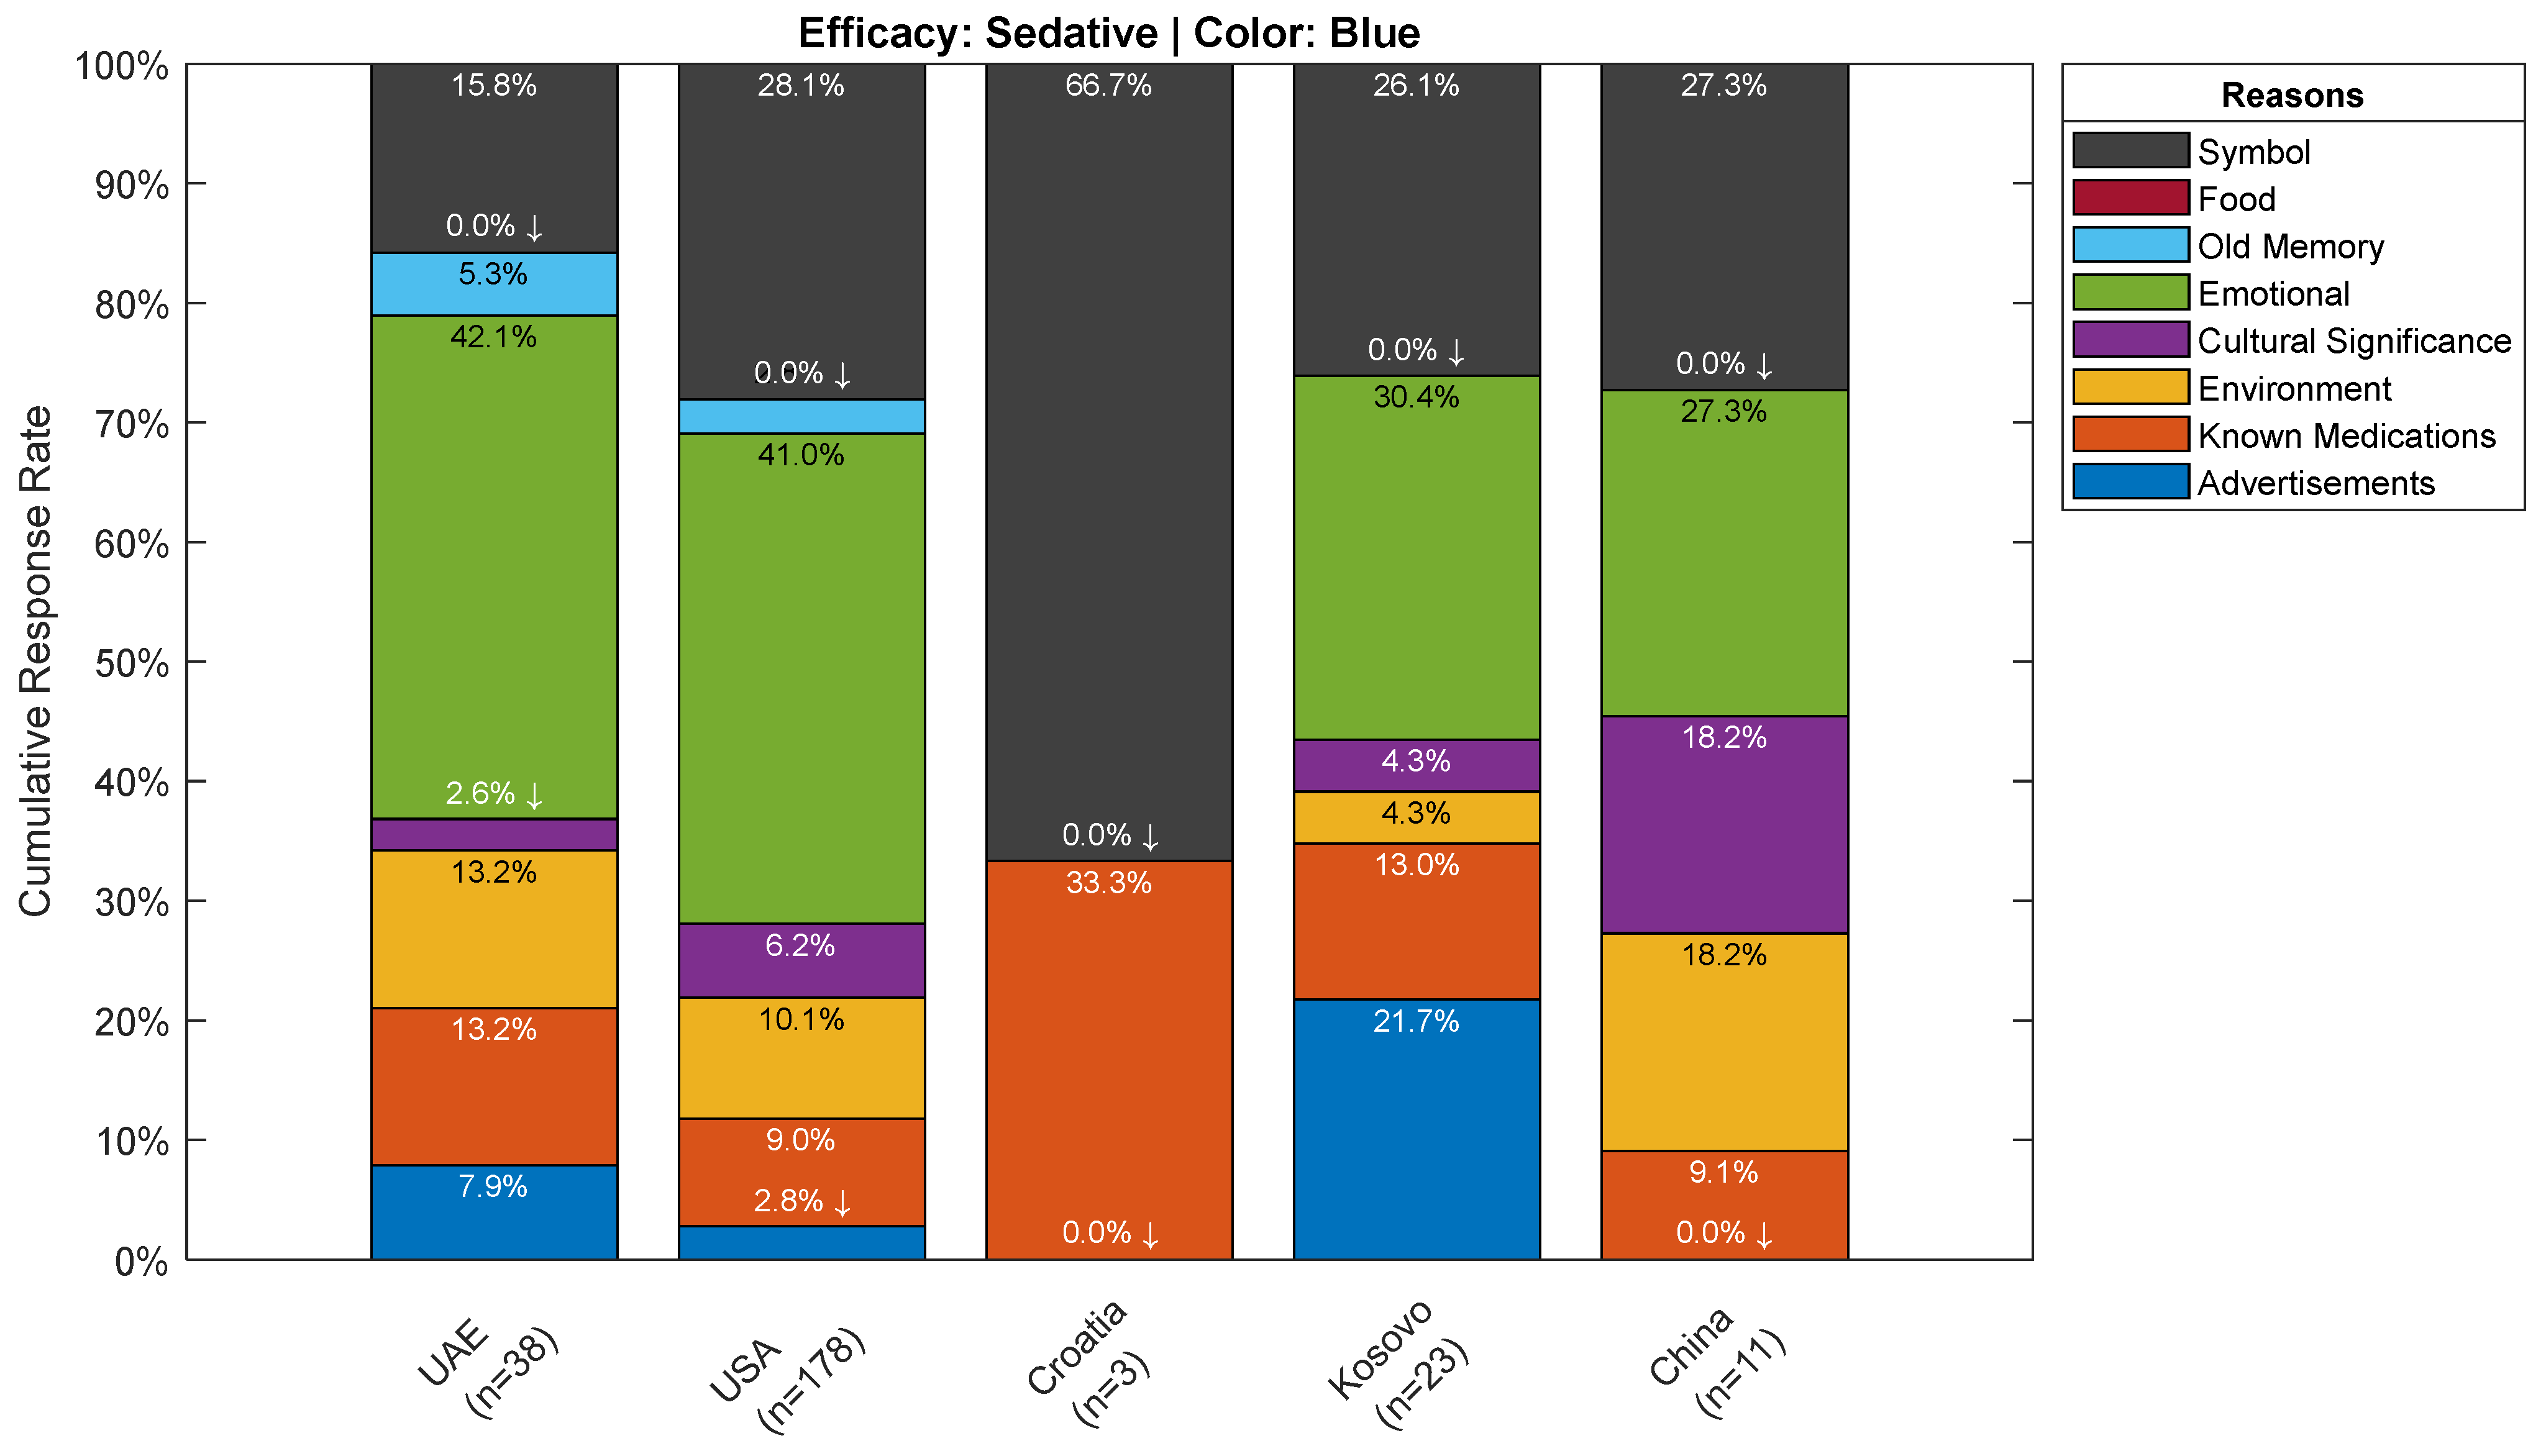
3.2.1. Part 2A: Reasoning
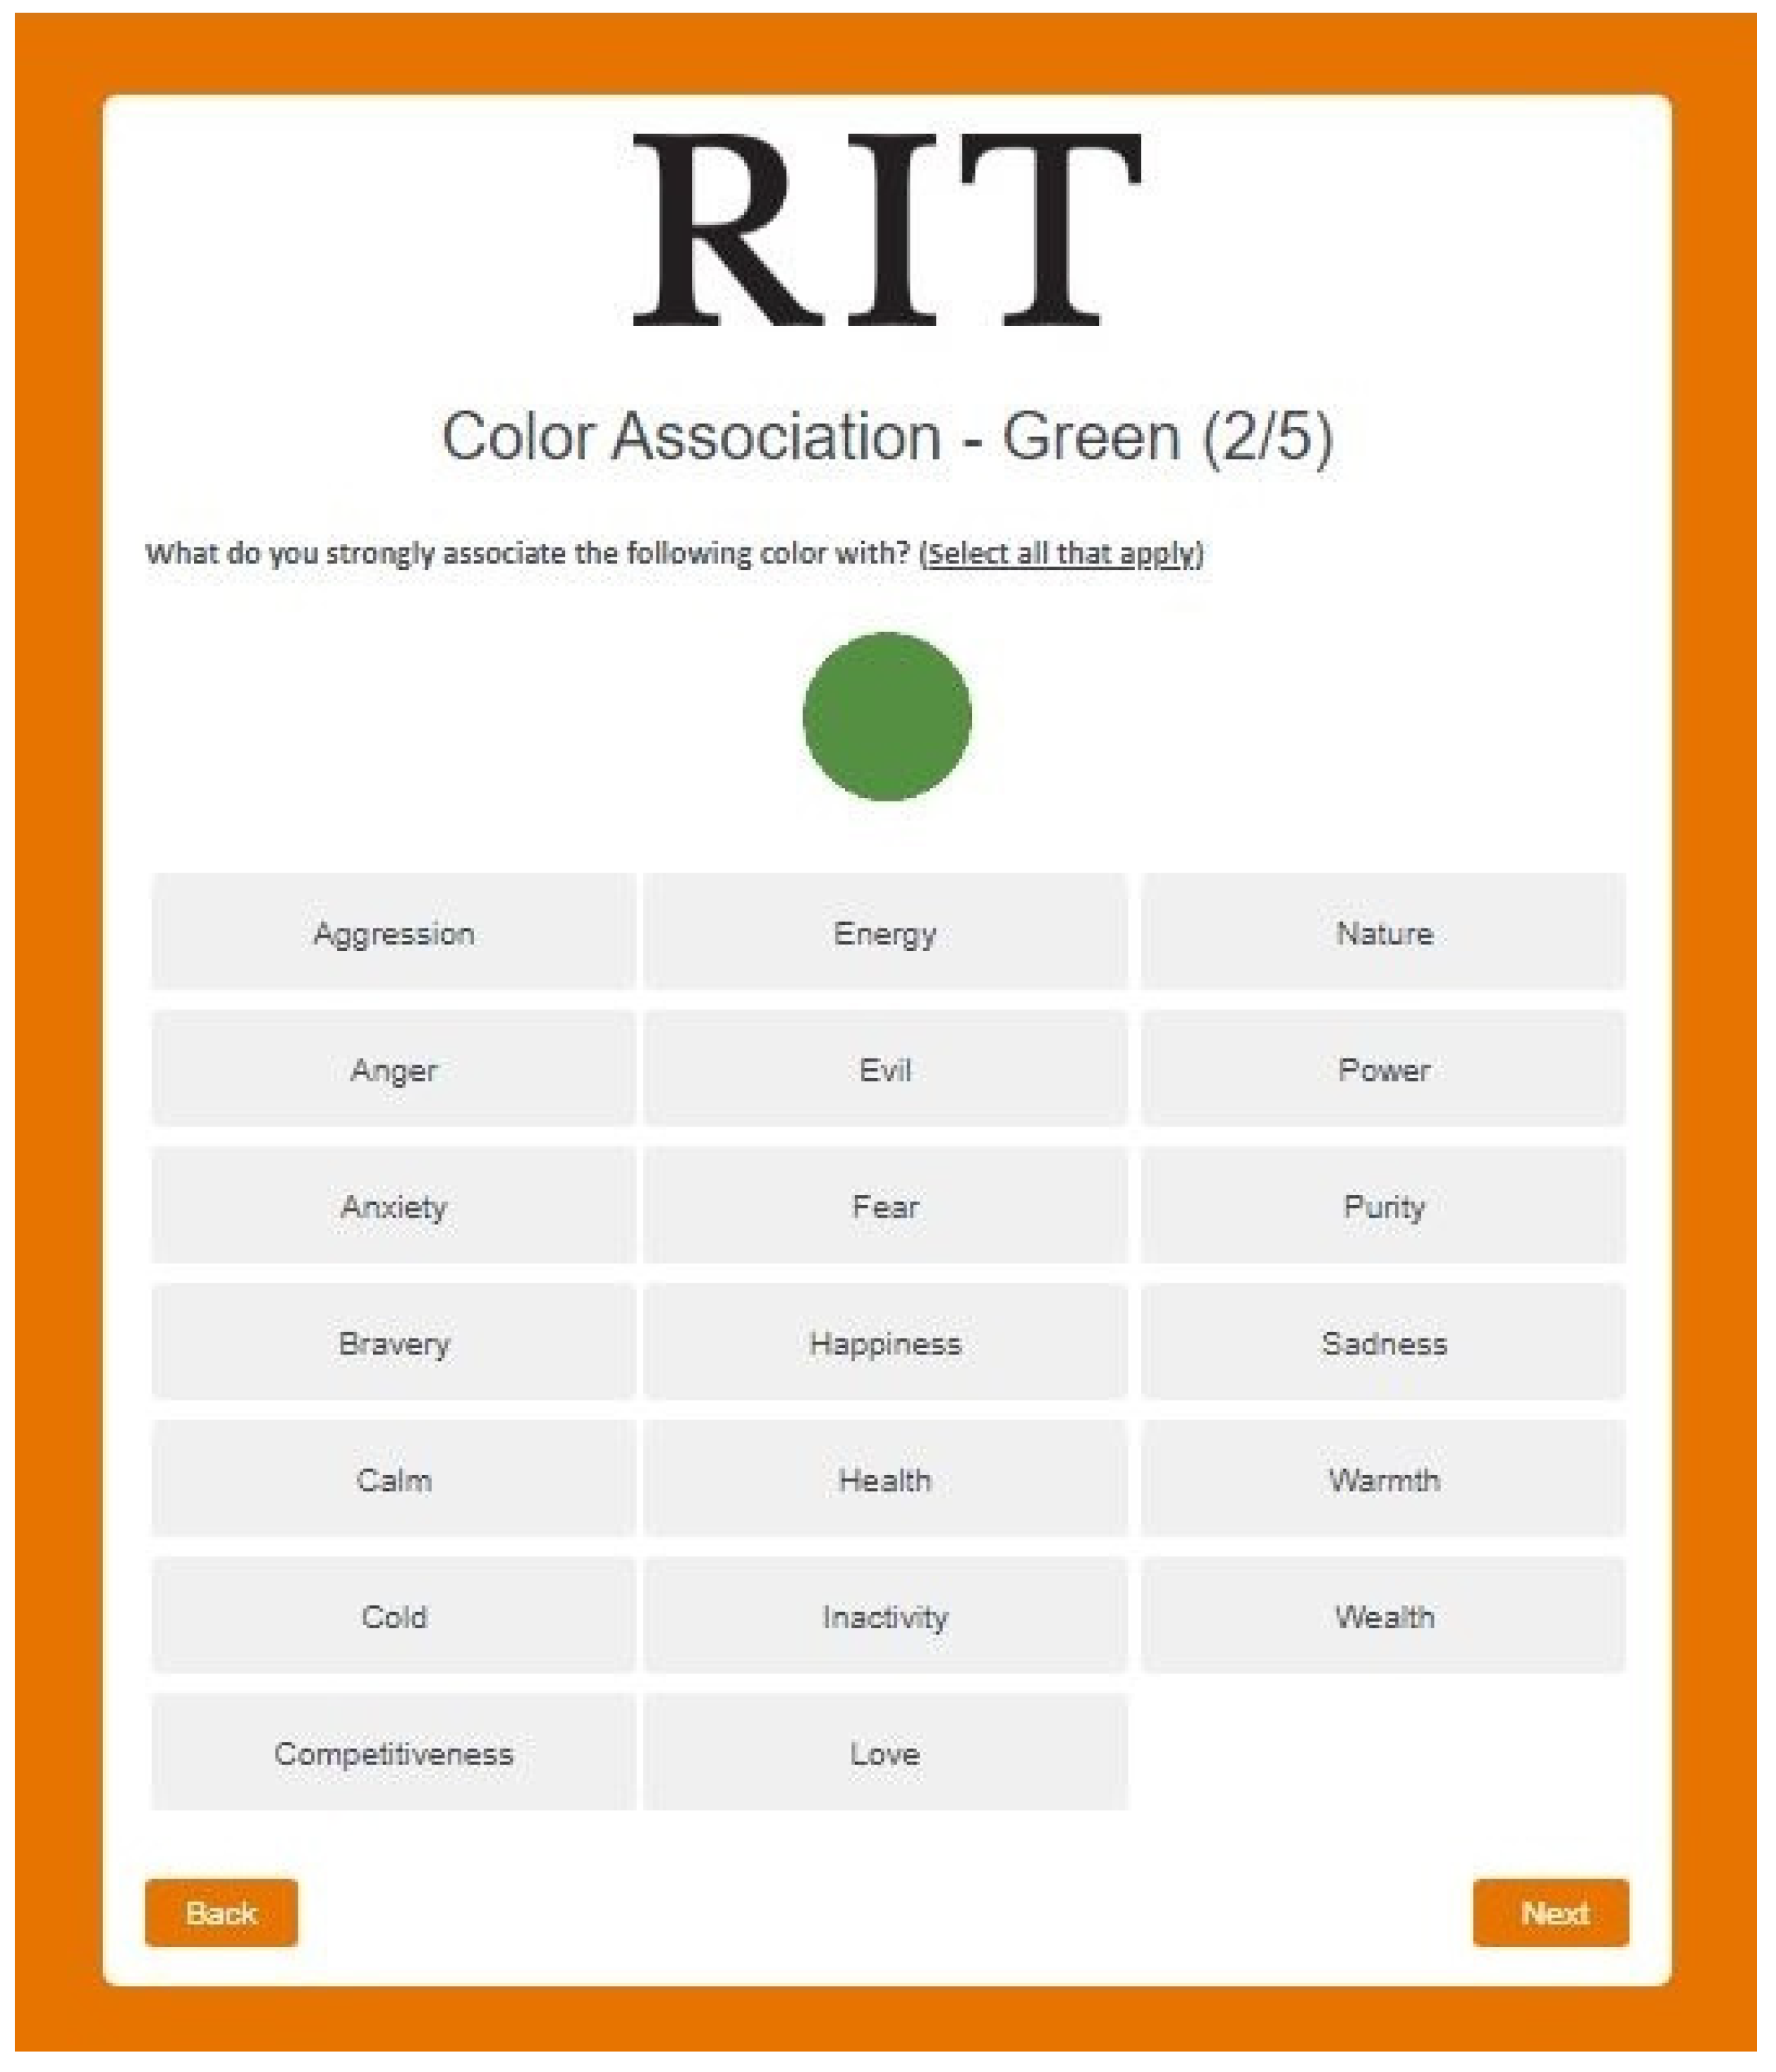
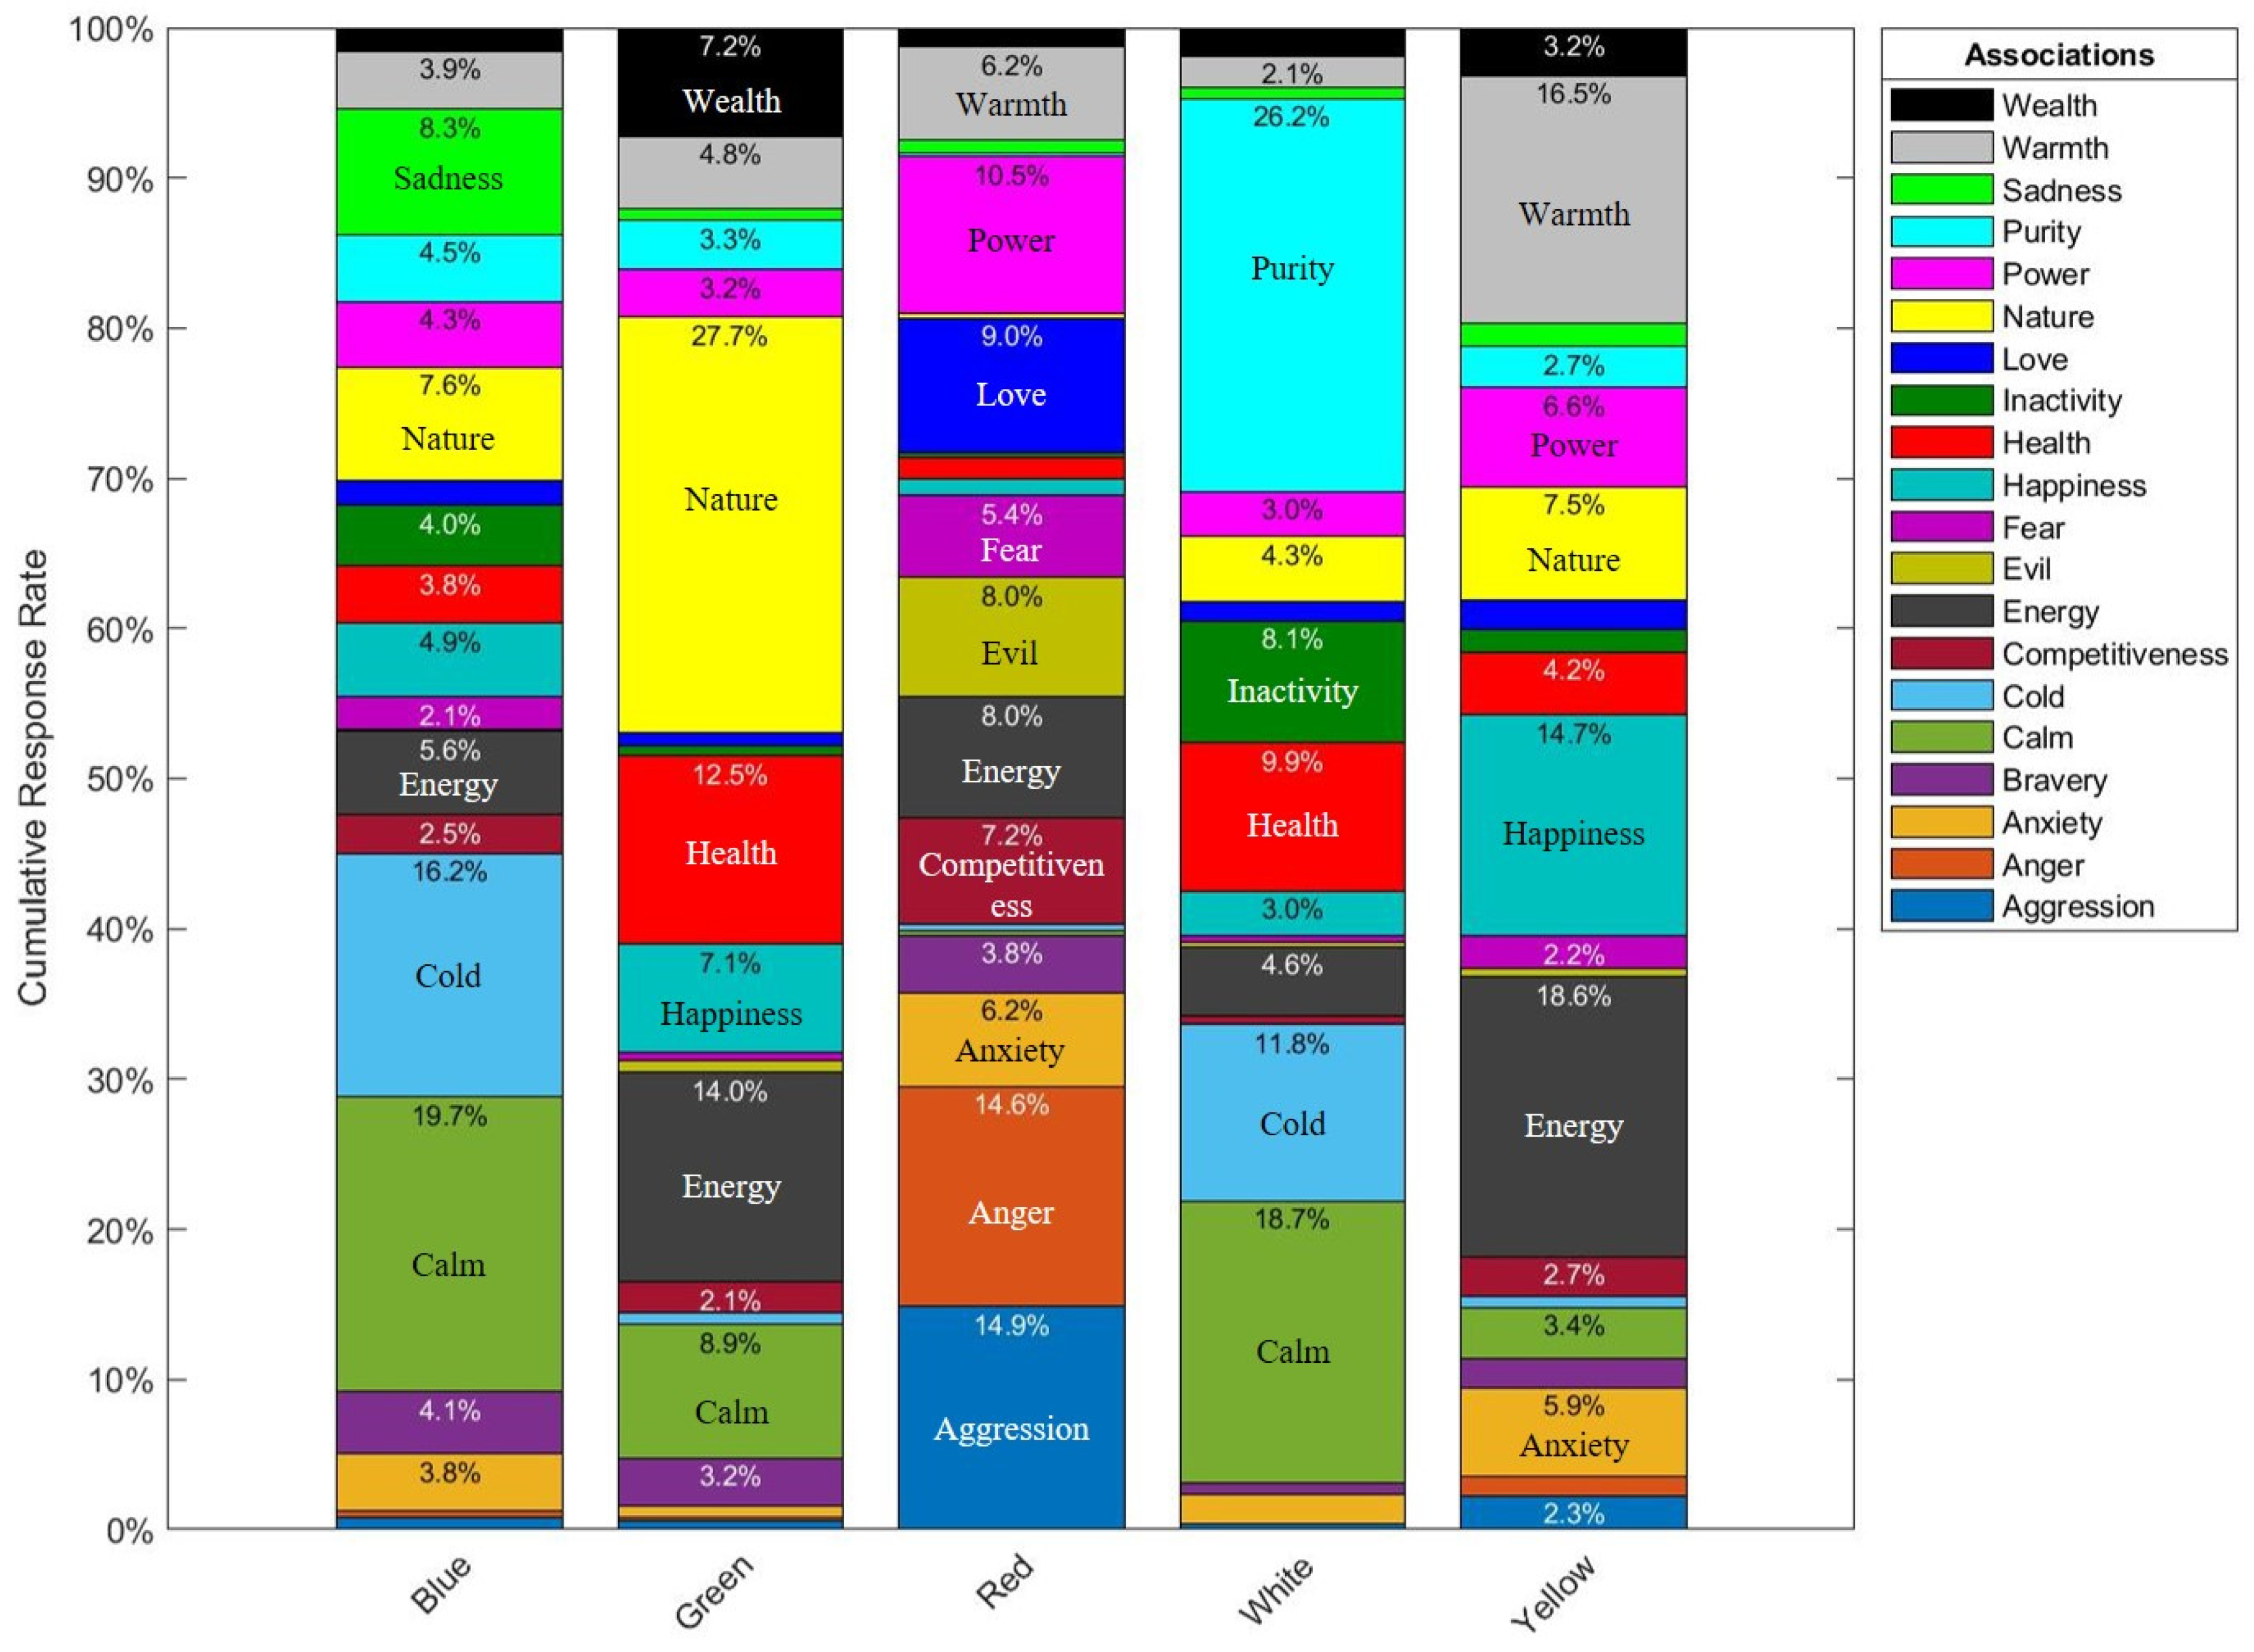
3.2.2. Part 2B: Color Association
3.3. Discussion
4. Summary
Author Contributions
Funding
Institutional Review Board Statement
Informed Consent Statement
Data Availability Statement
Acknowledgments
Conflicts of Interest
Appendix A
| Sedative | Stimulant | |||||||||||||||||||||||
|---|---|---|---|---|---|---|---|---|---|---|---|---|---|---|---|---|---|---|---|---|---|---|---|---|
| African | Asian | European | Middle Eastern | North American | South American | African | Asian | European | Middle Eastern | North American | South American | |||||||||||||
| Color 1/Color 2 | p | d | p | d | p | d | p | d | p | d | p | d | p | d | p | d | p | d | p | d | p | d | p | d |
| Blue/Green | - | - | 0.003 | S | <0.001 | L | - | - | <0.001 | M | - | - | 0.954 | VS | 0.106 | VS | 0.355 | VS | 0.371 | VS | 0.002 | S | - | - |
| Blue/Red | - | - | 0.568 | VS | <0.001 | L | - | - | <0.001 | M | - | - | 0.003 | M | <0.001 | M | <0.001 | L | <0.001 | M | <0.001 | L | - | - |
| Blue/White | - | - | 0.824 | VS | 0.501 | VS | - | - | 0.938 | VS | - | - | 0.106 | S | 0.865 | NI | 0.746 | VS | <0.001 | M | <0.001 | S | - | - |
| Blue/Yellow | - | - | 0.265 | VS | <0.001 | M | - | - | <0.001 | S | - | - | 0.011 | M | 0.005 | S | <0.001 | M | 0.639 | VS | <0.001 | M | - | - |
| Green/Red | - | - | 0.005 | S | 0.078 | VS | - | - | 0.449 | VS | - | - | 0.001 | L | <0.001 | M | <0.001 | L | <0.001 | S | <0.001 | M | - | - |
| Green/White | - | - | 0.056 | S | <0.001 | M | - | - | <0.001 | M | - | - | 0.096 | S | 0.249 | VS | 0.633 | VS | <0.001 | M | 0.046 | VS | - | - |
| Green/Yellow | - | - | 0.059 | S | 0.005 | S | - | - | <0.001 | S | - | - | 0.007 | M | 0.297 | VS | <0.001 | M | 0.627 | VS | <0.001 | M | - | - |
| Red/White | - | - | 0.436 | VS | <0.001 | M | - | - | <0.001 | M | - | - | 0.195 | S | <0.001 | M | <0.001 | L | <0.001 | L | <0.001 | M | - | - |
| Red/Yellow | - | - | 0.146 | VS | <0.001 | S | - | - | <0.001 | S | - | - | 0.412 | VS | <0.001 | S | <0.001 | S | <0.001 | S | <0.001 | VS | - | - |
| White/Yellow | - | - | 0.528 | VS | <0.001 | S | - | - | <0.001 | S | - | - | 0.492 | VS | 0.056 | S | <0.001 | M | <0.001 | M | <0.001 | S | - | - |
| Anti-Anxiety | Pain Relief | |||||||||||||||||||||||
| African | Asian | European | Middle Eastern | North American | South American | African | Asian | European | Middle Eastern | North American | South American | |||||||||||||
| Color 1/Color 2 | p | d | p | d | p | d | p | d | p | d | p | d | p | d | p | d | p | d | p | d | p | d | p | d |
| Blue/Green | - | - | 0.026 | S | <0.001 | L | 0.003 | S | <0.001 | M | 0.052 | M | - | - | 0.372 | VS | 0.000 | M | 0.000 | M | 0.000 | S | - | - |
| Blue/Red | - | - | <0.001 | M | <0.001 | VL | <0.001 | M | <0.001 | VL | 0.013 | L | - | - | 0.766 | VS | 0.000 | S | 0.030 | S | 0.033 | VS | - | - |
| Blue/White | - | - | 0.949 | VS | 0.405 | VS | 0.952 | VS | 0.550 | NI | 0.968 | NI | - | - | 0.001 | S | 0.000 | S | 0.074 | VS | 0.000 | S | - | - |
| Blue/Yellow | - | - | 0.313 | VS | <0.001 | M | 0.069 | S | <0.001 | S | 0.074 | M | - | - | 0.526 | VS | 0.027 | VS | 0.040 | S | 0.149 | VS | - | - |
| Green/Red | - | - | 0.002 | S | <0.001 | M | 0.006 | S | <0.001 | M | 0.252 | S | - | - | 0.706 | VS | 0.471 | VS | 0.620 | VS | 0.005 | S | - | - |
| Green/White | - | - | 0.050 | VS | <0.001 | M | 0.025 | S | <0.001 | M | 0.056 | M | - | - | 0.000 | S | 0.000 | L | 0.000 | M | 0.000 | L | - | - |
| Green/Yellow | - | - | 0.128 | VS | 0.057 | VS | 0.324 | VS | <0.001 | S | 0.709 | VS | - | - | 0.128 | VS | 0.000 | S | 0.026 | S | 0.000 | S | - | - |
| Red/White | - | - | <0.001 | S | <0.001 | VL | <0.001 | M | <0.001 | VL | 0.008 | L | - | - | 0.001 | S | 0.000 | M | 0.002 | S | 0.000 | M | - | - |
| Red/Yellow | - | - | <0.001 | S | <0.001 | L | 0.001 | S | <0.001 | L | 0.128 | M | - | - | 0.410 | VS | 0.048 | S | 0.350 | VS | 0.301 | VS | - | - |
| White/Yellow | - | - | 0.340 | VS | <0.001 | S | 0.184 | VS | <0.001 | S | 0.126 | M | - | - | 0.003 | S | 0.000 | M | 0.001 | S | 0.000 | S | - | - |
| Antacid | Hallucinogenic | |||||||||||||||||||||||
| African | Asian | European | Middle Eastern | North American | South American | African | Asian | European | Middle Eastern | North American | South American | |||||||||||||
| Color 1/Color 2 | p | d | p | d | p | d | p | d | p | d | p | d | p | d | p | d | p | d | p | d | p | d | p | d |
| Blue/Green | 0.560 | VS | 0.895 | VS | 0.006 | S | 0.704 | VS | <0.001 | S | 0.698 | VS | 0.215 | S | 0.520 | VS | 0.453 | VS | 0.682 | VS | 0.484 | VS | 0.574 | VS |
| Blue/Red | 0.703 | VS | 0.919 | NI | 0.047 | S | 0.092 | S | <0.001 | M | 0.051 | M | 0.502 | VS | 0.013 | S | 0.003 | S | 0.335 | VS | <0.001 | S | 0.305 | S |
| Blue/White | 0.011 | M | 0.120 | VS | 0.009 | VS | 0.009 | S | <0.001 | S | 0.074 | M | 0.229 | S | 0.085 | VS | <0.001 | S | 0.007 | S | <0.001 | S | 0.497 | S |
| Blue/Yellow | 0.028 | M | 0.007 | S | 0.002 | S | 0.619 | VS | 0.001 | S | 0.012 | L | 0.005 | M | <0.001 | S | 0.004 | S | 0.479 | VS | <0.001 | S | 0.698 | VS |
| Green/Red | 0.861 | NI | 0.845 | VS | 0.876 | VS | 0.231 | VS | 0.002 | VS | 0.117 | M | 0.553 | VS | 0.099 | VS | 0.028 | VS | 0.599 | VS | 0.003 | VS | 0.575 | S |
| Green/White | 0.019 | M | 0.093 | VS | <0.001 | S | 0.035 | S | <0.001 | M | 0.042 | M | 0.096 | S | 0.024 | S | <0.001 | S | 0.004 | S | <0.001 | S | 0.847 | VS |
| Green/Yellow | 0.049 | S | 0.009 | S | <0.001 | M | 0.402 | VS | <0.001 | M | 0.006 | L | 0.222 | S | 0.006 | S | 0.041 | VS | 0.852 | VS | 0.007 | VS | 0.954 | NI |
| Red/White | 0.033 | M | 0.171 | VS | <0.001 | S | 0.435 | VS | <0.001 | M | 0.002 | VL | 0.154 | S | 0.001 | S | <0.001 | M | 0.003 | S | <0.001 | M | 0.831 | VS |
| Red/Yellow | 0.100 | S | 0.047 | S | <0.001 | S | 0.059 | S | <0.001 | M | <0.001 | VL | 0.049 | M | 0.527 | VS | 0.685 | VS | 0.591 | VS | 0.632 | NI | 0.575 | S |
| White/Yellow | 0.519 | VS | 0.805 | VS | 0.893 | VS | 0.005 | S | 0.098 | VS | 0.659 | S | 0.006 | L | <0.001 | M | <0.001 | M | 0.003 | S | <0.001 | M | 0.742 | VS |
| Sedative | Stimulant | Anti-Anxiety | ||||||||||||||||
|---|---|---|---|---|---|---|---|---|---|---|---|---|---|---|---|---|---|---|
| Under 20 | 20 to 39 | Over 39 | Under 20 | 20 to 39 | Over 39 | Under 20 | 20 to 39 | Over 39 | ||||||||||
| Color 1/Color 2 | p | d | p | d | p | d | p | d | p | d | p | d | p | d | p | d | p | d |
| Blue/Green | <0.001 | M | <0.001 | M | <0.001 | M | 0.120 | VS | 0.052 | VS | 0.035 | VS | <0.001 | M | <0.001 | M | <0.001 | M |
| Blue/Red | 0.011 | S | <0.001 | S | <0.001 | M | <0.001 | L | <0.001 | M | <0.001 | L | <0.001 | L | <0.001 | L | <0.001 | L |
| Blue/White | 0.124 | S | 0.751 | VS | 0.461 | NI | 0.834 | VS | 0.364 | VS | 0.039 | VS | 0.407 | VS | 0.865 | VS | 0.484 | VS |
| Blue/Yellow | <0.001 | S | <0.001 | S | <0.001 | S | <0.001 | M | <0.001 | S | <0.001 | M | <0.001 | S | <0.001 | S | 0.001 | S |
| Green/Red | 0.010 | S | 0.021 | S | <0.001 | S | <0.001 | M | <0.001 | M | <0.001 | M | <0.001 | S | <0.001 | M | <0.001 | M |
| Green/White | <0.001 | S | <0.001 | M | <0.001 | M | 0.324 | VS | 0.601 | VS | 0.615 | VS | <0.001 | S | <0.001 | S | <0.001 | S |
| Green/Yellow | 0.050 | VS | <0.001 | S | <0.001 | S | <0.001 | S | <0.001 | S | <0.001 | M | 0.014 | S | 0.017 | VS | <0.001 | S |
| Red/White | 0.481 | VS | 0.002 | S | <0.001 | M | <0.001 | M | <0.001 | M | <0.001 | M | <0.001 | M | <0.001 | L | <0.001 | L |
| Red/Yellow | 0.242 | VS | 0.786 | VS | <0.001 | M | <0.001 | S | <0.001 | S | <0.001 | VS | <0.001 | M | <0.001 | M | <0.001 | L |
| White/Yellow | 0.010 | S | <0.001 | S | <0.001 | S | <0.001 | S | <0.001 | S | <0.001 | M | 0.004 | S | <0.001 | S | <0.001 | S |
| Pain Relief | Antacid | Hallucinogenic | ||||||||||||||||
| Under 20 | 20 to 39 | Over 39 | Under 20 | 20 to 39 | Over 39 | Under 20 | 20 to 39 | Over 39 | ||||||||||
| Color 1/Color 2 | p | d | p | d | p | d | p | d | p | d | p | d | p | d | p | d | p | d |
| Blue/Green | <0.001 | S | <0.001 | S | <0.001 | S | 0.224 | VS | 0.003 | S | <0.001 | S | 0.537 | VS | <0.001 | S | 0.032 | VS |
| Blue/Red | 0.112 | S | 0.136 | VS | <0.001 | S | 0.743 | VS | 0.320 | VS | <0.001 | M | 0.186 | VS | 0.012 | VS | <0.001 | S |
| Blue/White | 0.004 | S | <0.001 | S | <0.001 | S | 0.787 | VS | 0.008 | VS | <0.001 | S | 0.016 | S | <0.001 | S | <0.001 | S |
| Blue/Yellow | 0.042 | VS | 0.023 | VS | 0.993 | VS | <0.001 | S | 0.002 | S | 0.002 | S | 0.013 | S | <0.001 | S | 0.021 | VS |
| Green/Red | 0.041 | S | 0.001 | S | 0.676 | NI | 0.511 | VS | 0.128 | VS | <0.001 | S | 0.480 | VS | 0.313 | VS | <0.001 | S |
| Green/White | <0.001 | M | <0.001 | L | <0.001 | M | 0.239 | VS | <0.001 | S | <0.001 | M | 0.005 | S | <0.001 | M | <0.001 | S |
| Green/Yellow | 0.003 | S | <0.001 | S | <0.001 | S | <0.001 | S | <0.001 | S | <0.001 | M | 0.083 | VS | 0.335 | VS | <0.001 | S |
| Red/White | <0.001 | S | <0.001 | S | <0.001 | M | 0.696 | VS | 0.001 | S | <0.001 | L | 0.001 | S | <0.001 | S | <0.001 | M |
| Red/Yellow | 0.966 | VS | 0.832 | VS | <0.001 | S | 0.001 | S | <0.001 | S | <0.001 | L | 0.368 | VS | 0.045 | VS | 0.006 | VS |
| White/Yellow | <0.001 | S | <0.001 | M | <0.001 | S | 0.008 | S | 0.998 | VS | 0.012 | VS | <0.001 | S | <0.001 | M | <0.001 | M |
| Sedative | Stimulant | Anti-Anxiety | ||||||||||||||||||||||
|---|---|---|---|---|---|---|---|---|---|---|---|---|---|---|---|---|---|---|---|---|---|---|---|---|
| UAE | USA | Croatia | Kosovo | UAE | USA | Croatia | Kosovo | UAE | USA | Croatia | Kosovo | |||||||||||||
| Color 1/Color 2 | p | d | p | d | p | d | p | d | p | d | p | d | p | d | p | d | p | d | p | d | p | d | p | d |
| Blue/Green | <0.001 | S | <0.001 | M | 0.002 | M | - | - | 0.927 | VS | <0.001 | S | 0.381 | VS | 0.271 | S | <0.001 | S | <0.001 | M | <0.001 | L | 0.001 | L |
| Blue/Red | 0.388 | VS | <0.001 | M | 0.064 | S | - | - | <0.001 | M | <0.001 | L | 0.043 | S | <0.001 | VL | <0.001 | M | <0.001 | VL | 0.002 | M | <0.001 | H |
| Blue/White | 0.868 | VS | 0.614 | VS | 0.929 | VS | - | - | 0.163 | VS | <0.001 | S | 0.122 | S | 0.256 | S | 0.891 | VS | 0.930 | VS | 0.948 | VS | 0.509 | VS |
| Blue/Yellow | 0.143 | VS | <0.001 | S | <0.001 | M | - | - | 0.041 | S | <0.001 | M | 0.217 | S | 0.035 | M | 0.001 | S | <0.001 | S | 0.004 | M | 0.163 | S |
| Green/Red | 0.002 | S | 0.222 | VS | 0.851 | VS | - | - | <0.001 | M | <0.001 | M | 0.009 | M | 0.001 | L | <0.001 | S | <0.001 | M | 0.761 | VS | 0.002 | L |
| Green/White | <0.001 | S | <0.001 | M | 0.017 | S | - | - | 0.119 | VS | 0.394 | VS | 0.458 | VS | 0.073 | S | <0.001 | S | <0.001 | M | 0.011 | M | 0.001 | L |
| Green/Yellow | 0.001 | S | <0.001 | S | 0.520 | VS | - | - | 0.048 | S | <0.001 | M | 0.047 | S | 0.348 | S | 0.615 | VS | <0.001 | S | 0.307 | S | 0.051 | M |
| Red/White | 0.735 | VS | <0.001 | S | 0.218 | S | - | - | <0.001 | M | <0.001 | M | 0.005 | M | <0.001 | VL | <0.001 | M | <0.001 | L | 0.020 | S | <0.001 | H |
| Red/Yellow | 0.586 | VS | <0.001 | S | 0.510 | VS | - | - | <0.001 | S | <0.001 | S | 0.188 | VS | 0.007 | M | <0.001 | S | <0.001 | L | 0.305 | VS | <0.001 | VL |
| White/Yellow | 0.205 | VS | <0.001 | S | 0.007 | M | - | - | 0.002 | S | <0.001 | S | 0.021 | S | 0.012 | M | 0.001 | S | <0.001 | S | 0.050 | S | 0.071 | S |
| Pain Relief | Antacid | Hallucinogenic | ||||||||||||||||||||||
| UAE | USA | Croatia | Kosovo | UAE | USA | Croatia | Kosovo | UAE | USA | Croatia | Kosovo | |||||||||||||
| Color 1/Color 2 | p | d | p | d | p | d | p | d | p | d | p | d | p | d | p | d | p | d | p | d | p | d | p | d |
| Blue/Green | 0.001 | S | <0.001 | S | 0.017 | S | 0.174 | S | 0.196 | VS | <0.001 | S | - | - | - | - | 0.456 | VS | 0.184 | VS | 0.997 | NI | - | - |
| Blue/Red | 0.002 | S | 0.034 | VS | 0.053 | S | 0.010 | M | 0.022 | S | <0.001 | S | - | - | - | - | 0.043 | VS | <0.001 | VS | 0.017 | S | - | - |
| Blue/White | <0.001 | S | <0.001 | S | 0.277 | VS | 0.014 | M | 0.607 | VS | <0.001 | S | - | - | - | - | 0.055 | VS | <0.001 | S | 0.011 | S | - | - |
| Blue/Yellow | 0.089 | VS | 0.150 | VS | 0.065 | S | 0.820 | VS | 0.022 | S | <0.001 | S | - | - | - | - | 0.008 | S | <0.001 | S | 0.094 | S | - | - |
| Green/Red | 0.457 | VS | <0.001 | S | 0.969 | VS | 0.129 | S | 0.274 | VS | 0.004 | VS | - | - | - | - | 0.285 | VS | 0.003 | VS | 0.042 | S | - | - |
| Green/White | <0.001 | M | <0.001 | M | 0.001 | M | 0.002 | L | 0.110 | VS | <0.001 | S | - | - | - | - | 0.010 | S | <0.001 | S | 0.025 | S | - | - |
| Green/Yellow | 0.094 | VS | <0.001 | S | 0.403 | VS | 0.112 | S | 0.001 | S | <0.001 | M | - | - | - | - | 0.110 | VS | 0.001 | VS | 0.201 | S | - | - |
| Red/White | <0.001 | M | <0.001 | S | 0.007 | M | <0.001 | L | 0.018 | S | <0.001 | M | - | - | - | - | 0.001 | S | <0.001 | M | <0.001 | L | - | - |
| Red/Yellow | 0.060 | VS | 0.355 | VS | 0.607 | VS | 0.006 | L | <0.001 | S | <0.001 | M | - | - | - | - | 0.816 | VS | 0.969 | VS | 0.455 | VS | - | - |
| White/Yellow | <0.001 | M | <0.001 | S | 0.003 | M | 0.018 | S | 0.194 | VS | 0.355 | VS | - | - | - | - | <0.001 | S | <0.001 | M | <0.001 | M | - | - |
References
- Ou, L.-C.; Luo, M.; Woodcock, A.; Wright, A. A study of colour emotion and colour preference. Part III: Colour preference modeling. Color Res. Appl. 2004, 29, 381–389. [Google Scholar] [CrossRef]
- Güneş, E.; Olguntürk, N. Color-emotion associations in interiors. Color Res. Appl. 2020, 45, 129–141. [Google Scholar] [CrossRef]
- Kramer, R.; Prior, J. Colour associations in children and adults. Q. J. Exp. Psychol. 2019, 72, 1977–1983. [Google Scholar] [CrossRef] [PubMed]
- Ou, L.C.; Luo, M.R.; Sun, P.L.; Hu, N.C.; Chen, H.S. Age effects on colour emotion, preference, and harmony. Color Res. Appl. 2012, 37, 92–105. [Google Scholar] [CrossRef]
- Jonauskaite, D.; Parraga, C.A.; Quiblier, M.; Mohr, C. Feeling Blue or Seeing Red? Similar Patterns of Emotion Associations With Colour Patches and Colour Terms. i-Perception 2020, 11, 2041669520902484. [Google Scholar] [CrossRef] [Green Version]
- Torres, A.; Serra, J.; Llopis, J.; Delcampo, A. Color Preference Cool Versus Warm in Nursing Homes Depends on the Expected Activity for Interior Spaces. Front. Archit. Res. 2020, 9, 739–750. [Google Scholar] [CrossRef]
- Lenahan, J.; Mc Carthy, D.; Davis, T.; Curtis, L.; Serper, M.; Wolf, M. A Drug by Any Other Name: Patients’ Ability to Identify Medication Regimens and Its Association with Adherence and Health Outcomes. J. Health Commun. 2013, 18 (Suppl. 1), 31–39. [Google Scholar] [CrossRef]
- Leslie, A. Ethics and practice of placebo therapy. Am. J. Med. 1954, 16, 854–862. [Google Scholar] [CrossRef]
- Lasagna, L.; Laties, V.; Dohan, J.L. Further studies on the pharmacology of placebo administration. J. Clin. Investig. 1958, 37, 533–537. [Google Scholar] [CrossRef]
- Schapira, K.; Mc Clelland, H.; Griffiths, N.; Newell, D. Study on the Effects of Tablet Colour in the Treatment of Anxiety States. Br. Med. J. 1970, 2, 446–449. [Google Scholar] [CrossRef] [Green Version]
- Blackwell, B.; Bloomfield, S.; Buncher, C. Demonstration to medical students of placebo responses and non-drug factors. Lancet 1972, 1, 1279–1282. [Google Scholar] [CrossRef]
- Bhugra, D.; Ventriglio, A. Do cultures influence placebo response? Acta Psychiatr. Scand. 2015, 132, 227–230. [Google Scholar] [CrossRef] [PubMed] [Green Version]
- Craen, A.; Roos, P.; De Vries, L.; Kleijnen, J. Effect of colour of drugs: Systematic review of perceived effect of drugs and of their effectiveness. Br. Med. J. 1996, 313, 1624–1626. [Google Scholar] [CrossRef] [PubMed] [Green Version]
- Wan, X.; Woods, A.; Velasco, A.S.-M.; Spence, C. Assessing the expectations associated with pharmaceutical pill colour and shape. Food Qual. Prefer. 2015, 45, 171–182. [Google Scholar] [CrossRef]
- Amawi, R.; Murdoch, M. Effects of pill colors on human perception and expectation of drugs’ efficacy. Color Res. Appl. 2022. [Google Scholar] [CrossRef]
- Sawilowsky, S. New Effect Size Rules of Thumb. J. Mod. Appl. Stat. Methods 2009, 8, 597–599. [Google Scholar] [CrossRef]
- Kwallek, N.; Lewis, C.M.; Robbins, A.S. Effects of Office Interior Color on Workers’ Mood and Productivity. Percept. Mot. Ski. 1988, 66, 123–128. [Google Scholar] [CrossRef]
- Mahnke, F.; Mahnke, R. Color and Light in Man-Made Environments; Van Nostrand Reinhold: New York, NY, USA, 1993. [Google Scholar]
- Hemphill, M. A Note on Adults’ Color–Emotion Associations. J. Genet. Psychol. 1996, 157, 275–280. [Google Scholar] [CrossRef]
- Ballast, D. Interior Design Reference Manual; Professional Publications: Belmont, CA, USA, 2002. [Google Scholar]
- Küller, R.; Mikellides, B.; Janssens, J. Color, arousal, and performance—A comparison of three experiments. Color Res. Appl. 2009, 34, 141–152. [Google Scholar] [CrossRef]
- Elliot, A.; Maier, M. Color psychology: Effects of perceiving color on psychological functioning in humans. Annu. Rev. Psychol. 2014, 65, 95–120. [Google Scholar] [CrossRef]
- Tao, D.; Wang, T.; Wang, T. Effects of color on expectations of drug effects: A cross-gender cross-cultural study. Color Res. Appl. 2017, 42, 124–130. [Google Scholar] [CrossRef]
- Tao, D.; Wang, T.; Wang, T.; Qu, X. Influence of drug colour on perceived drug effects and efficacy. Ergonomics 2018, 61, 284–294. [Google Scholar] [CrossRef] [PubMed]
- L-Ayash, A.A.; Kane, R.; Smith, D.; Green-Armytage, P. The influence of color on student emotion, heart rate, and performance in learning environments. Color Res. Appl. 2016, 41, 196–205. [Google Scholar] [CrossRef]
- Chen, Y.; Yang, J.; Pan, Q.; Vazirian, M.; Westland, S. A method for exploring word-colour associations. Color Res. Appl. 2020, 45, 85–94. [Google Scholar] [CrossRef]
- Tham, D.; Sowden, P.; Grandison, A.; Franklin, A.; Lee, A.; Ng, M.; Park, J.; Pang, W.; Zhao, J. A systematic investigation of conceptual color associations. J. Exp. Psychol. Gen. 2020, 149, 1311–1332. [Google Scholar] [CrossRef] [PubMed] [Green Version]
- Yu, L.; Westland, S.; Chen, Y.; Li, Z. Colour associations and consumer product-colour purchase decisions. Color Res. Appl. 2021, 46, 1119–1127. [Google Scholar] [CrossRef]
- Demir, Ü. Investigation of color-emotion associations of the university students. Color Res. Appl. 2020, 45, 871–884. [Google Scholar] [CrossRef]
- Re, D.; Whitehead, R.; Xiao, D.; Perrett, D. Oxygenated-blood colour change thresholds for perceived facial redness, health, and attractiveness. PLoS ONE 2011, 6, e17859. [Google Scholar] [CrossRef] [Green Version]
- Stephen, I.; Oldham, F.; Perrett, D.; Barton, R. Redness Enhances Perceived Aggression, Dominance and Attractiveness in Men’s Faces. Evol. Psychol. 2012, 10, 562–572. [Google Scholar] [CrossRef]
- Wiedemann, D.; Burt, D.; Hill, R.; Barton, R. Red clothing increases perceived dominance, aggression and anger. Biol. Lett. 2015, 11, 20150166. [Google Scholar] [CrossRef]
- Hanada, M. Correspondence analysis of color–Emotion associations. Color Res. Appl. 2018, 43, 224–237. [Google Scholar] [CrossRef] [Green Version]
- Jones, B.; Hahn, A.; Fisher, C.; Wincenciak, J.; Kandrik, M.; Roberts, S.C.; Little, A.; DeBruinea, L. Facial coloration tracks changes in women’s estradiol. Psychoneuroendocrinology 2015, 56, 29–34. [Google Scholar] [CrossRef] [PubMed]
- Na, C.; Tanaka, K.; Matsuyoshi, D.; Watanabe, K. Cross preferences for colors and shapes. Color Res. Appl. 2016, 41, 188–195. [Google Scholar]


| Age | Gender | Ethnicity | Education Level | Pill Usage Frequency |
|---|---|---|---|---|
| Under 20 | Female | African | Below University Level | Rarely |
| 20–39 | Male | Asian | Undergraduate | Moderately |
| 40–60 | European | Graduate | Daily | |
| Over 60 | Middle-Eastern | |||
| North American | ||||
| South American |
| Color | R | G | B | X | Y | Z | L* | a* | b* | C*ab | hab |
|---|---|---|---|---|---|---|---|---|---|---|---|
| Blue | 116 | 133 | 195 | 130 | 125 | 283 | 58 | 10 | −35 | 36 | 285° |
| Green | 85 | 143 | 65 | 76 | 115 | 43 | 56 | −36 | 37 | 52 | 134° |
| Red | 193 | 58 | 60 | 114 | 68 | 24 | 44 | 55 | 32 | 63 | 31° |
| White | 255 | 255 | 255 | 464 | 486 | 538 | 100 | 0 | 0 | 0 | 0° |
| Yellow | 255 | 247 | 107 | 394 | 454 | 139 | 97 | −17 | 68 | 70 | 104° |
| Demographics | Number of Responses | |
|---|---|---|
| Location | UAE | 339 |
| USA | 538 | |
| Croatia | 51 | |
| Kosovo | 26 | |
| Gender | Male | 387 |
| Female | 564 | |
| Prefer not to say 1 | 7 | |
| Age Group 2 | Under 20 | 200 |
| 20 to 39 | 412 | |
| Over 39 | 342 | |
| Pill Usage Frequency | Rarely | 439 |
| Moderately | 98 | |
| Daily | 415 | |
| Prefer not to say 1 | 2 | |
| Ethnicity | African | 32 |
| Asian | 150 | |
| European | 243 | |
| Middle Eastern | 100 | |
| North American | 411 | |
| South American | 18 | |
| Educational Level 2 | Below University Level | 94 |
| Undergraduate | 469 | |
| Graduate | 391 |
| Sedative | Stimulant | Anti-Anxiety | Pain Relief | Antacid | Hallucinogenic | |||||||
|---|---|---|---|---|---|---|---|---|---|---|---|---|
| Color 1/Color 2 | p | d | p | d | p | d | p | d | p | d | p | d |
| Blue/Green | <0.001 | M | 0.001 | VS | <0.001 | M | <0.001 | S | <0.001 | S | 0.154 | VS |
| Blue/Red | <0.001 | S | <0.001 | L | <0.001 | L | <0.001 | S | <0.001 | S | <0.001 | S |
| Blue/White | 0.649 | VS | 0.050 | VS | 0.873 | VS | <0.001 | S | <0.001 | VS | <0.001 | S |
| Blue/Yellow | <0.001 | S | <0.001 | M | <0.001 | S | 0.016 | VS | <0.001 | S | <0.001 | S |
| Green/Red | 0.593 | VS | <0.001 | M | <0.001 | M | 0.006 | VS | 0.014 | VS | <0.001 | VS |
| Green/White | <0.001 | S | 0.642 | VS | <0.001 | S | <0.001 | M | <0.001 | S | <0.001 | S |
| Green/Yellow | <0.001 | S | <0.001 | S | <0.001 | S | <0.001 | S | <0.001 | S | <0.001 | S |
| Red/White | <0.001 | S | <0.001 | M | <0.001 | L | <0.001 | M | <0.001 | S | <0.001 | M |
| Red/Yellow | <0.001 | VS | <0.001 | S | <0.001 | L | 0.024 | VS | <0.001 | M | 0.958 | VS |
| White/Yellow | <0.001 | S | <0.001 | S | <0.001 | S | <0.001 | S | 0.852 | VS | <0.001 | M |
| Sedative | Stimulant | Anti-Anxiety | Pain Relief | Antacid | Hallucinogenic | |||||||
|---|---|---|---|---|---|---|---|---|---|---|---|---|
| Ethnicity | X2 | p | X2 | p | X2 | p | X2 | p | X2 | p | X2 | p |
| African | 7.99 | 0.092 | 16.65 | 0.0023 | 7.92 | 0.0947 | 9.23 | 0.0556 | 11.6 | 0.0206 | 11.51 | 0.0214 |
| Asian | 11.3 | 0.0234 | 55.95 | <0.001 | 30.35 | <0.001 | 20.23 | 0.0005 | 9.93 | 0.0417 | 25.98 | <0.001 |
| European | 146.62 | <0.001 | 148.5 | <0.001 | 236.41 | <0.001 | 97.31 | <0.001 | 47.39 | <0.001 | 61.15 | <0.001 |
| Middle Eastern | 6.56 | 0.1608 | 61.17 | <0.001 | 27.72 | <0.001 | 28.31 | <0.001 | 11.39 | 0.0225 | 13.96 | 0.0074 |
| North American | 142.23 | <0.001 | 213.37 | <0.001 | 375.51 | <0.001 | 152.13 | <0.001 | 168.84 | <0.001 | 87.9 | <0.001 |
| South American | 2.93 | 0.5699 | 6.4 | 0.1713 | 12.2 | 0.0159 | 7.82 | 0.0983 | 20.53 | 0.0004 | 1.21 | 0.8771 |
| Sedative | Stimulant | Anti-Anxiety | Pain Relief | Antacid | Hallucinogenic | |||||||
|---|---|---|---|---|---|---|---|---|---|---|---|---|
| Age Bracket | X2 | p | X2 | p | X2 | p | X2 | p | X2 | p | X2 | p |
| Under 20 | 41.76 | <0.001 | 96.15 | <0.001 | 99.71 | <0.001 | 49.09 | <0.001 | 21.7 | 0.0002 | 22 | 0.0002 |
| 20 to 39 | 89.51 | <0.001 | 167.19 | <0.001 | 294.09 | <0.001 | 140.95 | <0.001 | 46.02 | <0.001 | 84.43 | <0.001 |
| Over 39 | 146 | <0.001 | 184.27 | <0.001 | 249.62 | <0.001 | 119.18 | <0.001 | 214.22 | <0.001 | 114.02 | <0.001 |
| Advertisements—Branding and marketing campaigns on TV, radio, or social media |
| Known Medications—Previous and/or current knowledge of similar drugs |
| Environment—Similarity to landscape and/or nature |
| Cultural Significance—Influenced by cultural or traditional norms |
| Emotional—The way it makes me feel |
| Old Memory—Reminds me of a previous memory/connection |
| Food—First food thought that comes to mind |
| Symbol—What this color represents to me personally |
| Demographics | Number of Responses | |
|---|---|---|
| Location | UAE | 109 |
| USA | 232 | |
| Croatia | 18 | |
| Kosovo | 35 | |
| China | 16 | |
| Gender | Males | 170 |
| Females | 240 | |
| Age Group | Under 20 | 73 |
| 20 to 39 | 164 | |
| 40 to 60 | 117 | |
| Over 60 | 56 | |
| Pill Usage Frequency | Rarely | 182 |
| Moderately | 59 | |
| Daily | 169 | |
| Ethnicity | African | 14 |
| Asian | 69 | |
| European | 131 | |
| Middle Eastern | 48 | |
| North American | 143 | |
| South American | 5 | |
| Educational Level | Below University Level | 23 |
| Undergraduate | 175 | |
| Graduate | 212 |
Publisher’s Note: MDPI stays neutral with regard to jurisdictional claims in published maps and institutional affiliations. |
© 2022 by the authors. Licensee MDPI, Basel, Switzerland. This article is an open access article distributed under the terms and conditions of the Creative Commons Attribution (CC BY) license (https://creativecommons.org/licenses/by/4.0/).
Share and Cite
Amawi, R.M.; Murdoch, M.J. Understanding Color Associations and Their Effects on Expectations of Drugs’ Efficacies. Pharmacy 2022, 10, 82. https://doi.org/10.3390/pharmacy10040082
Amawi RM, Murdoch MJ. Understanding Color Associations and Their Effects on Expectations of Drugs’ Efficacies. Pharmacy. 2022; 10(4):82. https://doi.org/10.3390/pharmacy10040082
Chicago/Turabian StyleAmawi, Rema M., and Michael J. Murdoch. 2022. "Understanding Color Associations and Their Effects on Expectations of Drugs’ Efficacies" Pharmacy 10, no. 4: 82. https://doi.org/10.3390/pharmacy10040082