
Cognitive Load Increases Spoken and Gestural Hesitation Frequency

Abstract
:1. Introduction
1.1. Pauses and Hesitations
1.2. Hesitations and Gesture
1.3. Speech and Pausing under Different Levels of Cognitive Load
1.4. Aims of This Study
- Game situations with higher cognitive load will elicit more spoken and gestural hesitations than those with lower cognitive load.
- Given the tight coupling of gesture with speech (cf., Section 1.2 and Wagner et al. 2014), we predict that gestural hesitations will mostly co-occur with spoken hesitations (see Section 2.3.3 for limitations on annotations). Moreover, we predict that spoken and gestural hesitations in synchrony will show form-related similarity. For instance, when speech goes into a halt, so will gesture, resulting in more gestural hesitations in the form of gestural pauses (i.e., holds, cf., Section 2.3.3).
2. Materials and Methods
2.1. The Game
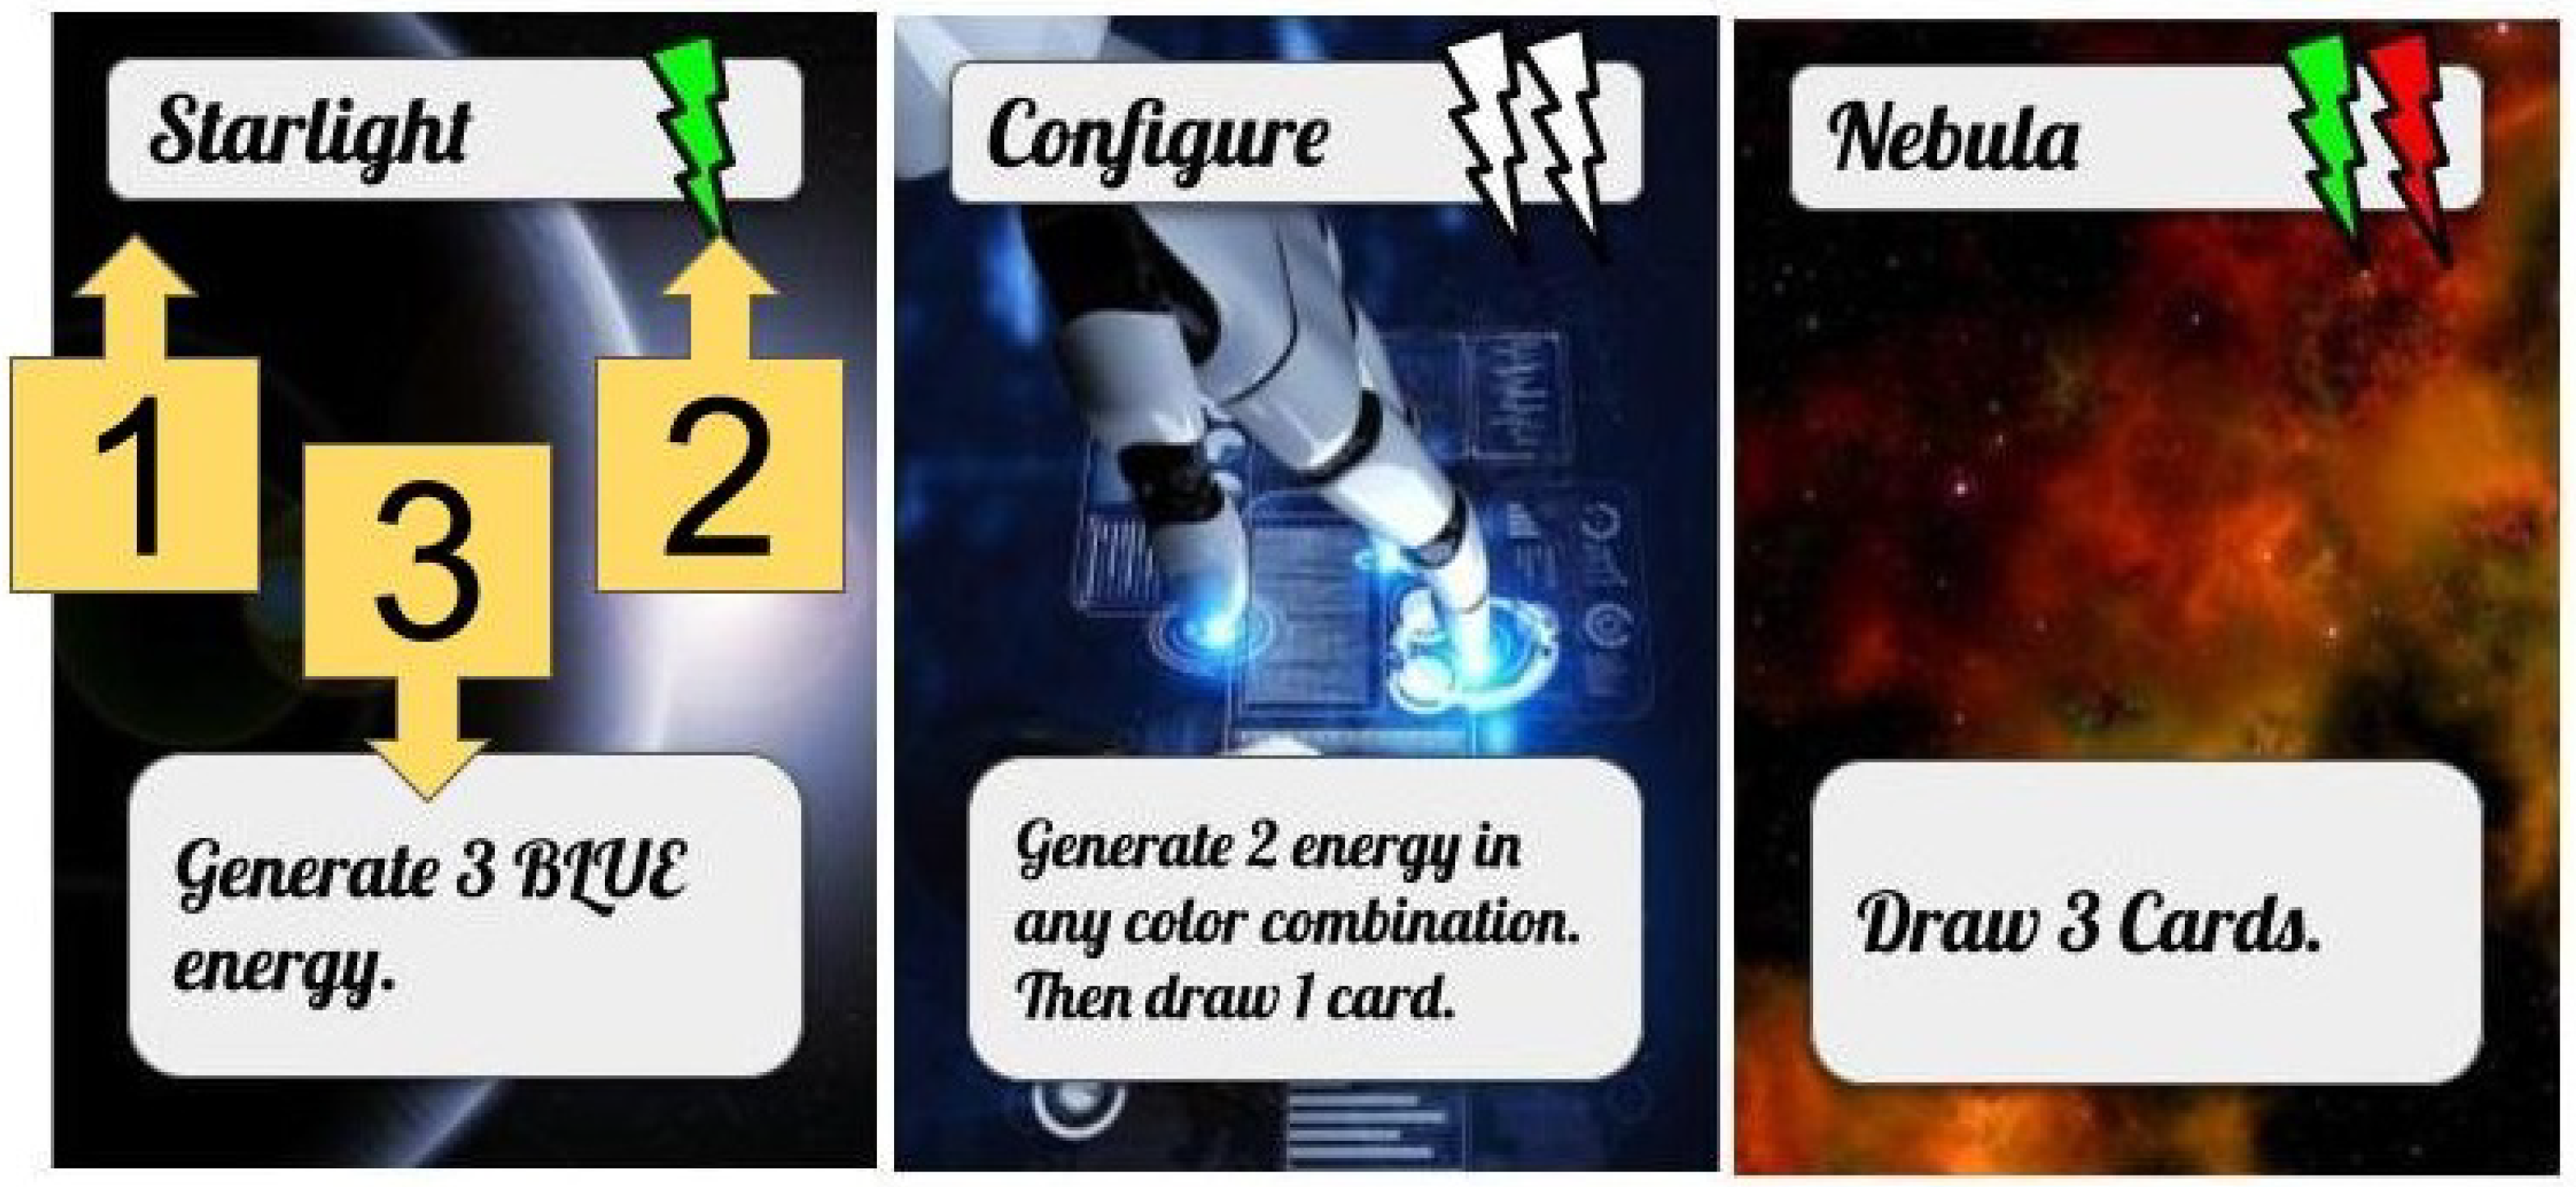
2.1.1. Cards
2.1.2. Card Complexity
2.1.3. Board Layout and Game Moves
2.2. Participants
2.2.1. Recruitment and Payment
2.2.2. Instructions
2.2.3. Training, Learning, Fatigue
2.2.4. Technical Setup
2.3. Annotation
2.3.1. Hesitation and Pause Annotation
- Silences (SIL): Mark any interval as silence if it is devoid of speech and if you perceive this interval as hesitant when listening to the utterance(s) around it.
- Fillers (FIL): Mark any interval as filler if you perceive this hesitation to be vocalized. Fillers usually consist of a central vowel only (uh, er), or of a central vowel + nasal (uhm, erm), or in rarer cases of a nasal only (mmm).
- Lengthenings (LEN): Mark any interval as lengthening if you perceive a given segment as vocalized with markedly slower speech rate than the surrounding segments, and if you perceive this segment as hesitant in the context of the surrounding utterance. The interval should span the entire word that contains the lengthening, and a colon is to be used to mark the segment where the lengthening is, e.g., then: if the final nasal in that word is lengthened.
2.3.2. Complexity Annotation
2.3.3. Gesture Annotation
- Cancellation: G-phases can be canceled halfway through their execution, which leads to the cancellation of gesture to be re-planned or restarted. Jerks always lead to cancellations, but cancellations do not necessitate a jerky gesture.
- Pause: Pauses in the execution of a gesture are classified as gestural hesitation. There is a natural overlap of these with hold phases which are essentially pauses in the movement of the hand. There are plenty of holds with fairly short durations occurring in many gestures (esp. after the stroke, 3–4 frames in length). The annotators were tasked to filter these out and only annotate a pause if there was a perceptually salient one that can be considered as a time-gaining strategy.
- Slow down: The execution of G-phases can appear to be slowed down (relative to the other G-phases in their environment), which is a strategy for planning/re-consideration.
- Stall: A player can perform stalling movements often through manipulation of game objects. For instance, the player can move a game card left to right on the table, a move not related to the game, while preparing for their next move.
- Metaphors: It is possible to have metaphoric gestures signaling hesitation/uncertainty. In our context, these are also not necessary for playing the game and are different from game-related gestures in terms of their form (McNeill 1992). For instance, they might occur as circular motions of the hand or palms-up hands shaking left to right to indicate uncertainty while saying “I don’t know” as the player is thinking aloud.
2.3.4. Annotator Agreement
2.4. Analysis
3. Results
3.1. Spoken Hesitations
3.1.1. Phenomena
3.1.2. Effects of Cognitive Load on Spoken Pausing Behavior
3.2. Gestural Hesitation
3.2.1. Phenomena
3.2.2. Effects of Cognitive Load on Gestural Hesitation
4. Discussion
Author Contributions
Funding
Institutional Review Board Statement
Informed Consent Statement
Data Availability Statement
Acknowledgments
Conflicts of Interest
References
- Aboudan, Rima, and Geoffrey Beattie. 1996. Cross-cultural similarities in gestures: The deep relationship between gestures and speech which transcends language barriers. Semiotica 111: 269–94. [Google Scholar] [CrossRef]
- Allwood, Jens, Elisabeth Ahlsén, Johan Lund, and Johanna Sundqvist. 2005. Multimodality in own communication management. Paper presented at the Second Nordic Conference on Multimodal Communication, Göteborg, Sweden, April 7–8; pp. 1–20. [Google Scholar]
- Allwood, Jens, Joakim Nivre, and Elisabeth Ahlsén. 1990. Speech management—on the non-written life of speech. Nordic Journal of Linguistics 13: 3–48. [Google Scholar] [CrossRef] [Green Version]
- Anderson, Anne H., Miles Bader, Ellen Gurman Bard, Elizabeth Boyle, Gwyneth Doherty, Simon Garrod, Stephen Isard, Jacqueline Kowtko, Jan McAllister, Jim Miller, and et al. 1991. The hcrc map task corpus. Language and Speech 34: 351–66. [Google Scholar] [CrossRef]
- Arnold, Jennifer E., Carla L. Hudson Kam, and Michael K. Tanenhaus. 2007. If you say thee uh you are describing something hard: The on-line attribution of disfluency during reference comprehension. Journal of Experimental Psychology: Learning, Memory, and Cognition 33: 914. [Google Scholar] [CrossRef] [PubMed] [Green Version]
- Bates, Douglas, Martin Mächler, Ben Bolker, and Steve Walker. 2015. Fitting linear mixed-effects models using lme4. Journal of Statistical Software 67: 1–48. [Google Scholar] [CrossRef]
- Bavelas, Janet, Nicole Chovil, Douglas A. Lawrie, and Allan Wade. 1992. Interactive gestures. Discourse Processes 15: 469–89. [Google Scholar] [CrossRef]
- Belz, Malte. 2021. Die Phonetik von äh und ähm: Akustische Variation von Füllpartikeln im Deutschen. Berlin and Heidelberg: Springer. [Google Scholar]
- Belz, Malte, and Uwe D. Reichel. 2015. Pitch characteristics of filled pauses in spontaneous speech. Paper presented at the 2015: Disfluency in Spontaneous Speech, Edinburgh, Scotland, August 8–9. [Google Scholar]
- Belz, Malte, and Jürgen Trouvain. 2019. Are ‘silent’pauses always silent? Paper presented at the 19th International Congress of Phonetic Sciences (ICPhS). Melbourne, Australia, August 5–9. [Google Scholar]
- Betz, Simon. 2020. Hesitations in Spoken Dialogue Systems. Ph.D. thesis, Universität Bielefeld, Bielefeld, Germany. [Google Scholar] [CrossRef]
- Betz, Simon, Birte Carlmeyer, Petra Wagner, and Britta Wrede. 2018. Interactive hesitation synthesis: Modelling and evaluation. Multimodal Technologies and Interaction 2: 9. [Google Scholar] [CrossRef] [Green Version]
- Betz, Simon, Jana Voße, Sina Zarrieß, and Petra Wagner. 2017. Increasing recall of lengthening detection via semi-automatic classification. Paper presented at the 18th Annual Conference of the International Speech Communication Association (Interspeech 2017), Stockholm, Sweden, August 20–24; pp. 1084–88. [Google Scholar]
- Betz, Simon, Petra Wagner, and Jana Vosse. 2016. Deriving a strategy for synthesizing lengthening disfluencies based on spontaneous conversational speech data. In Tagungsband Der 12. Tagung Phonetik Und Phonologie Im Deutschsprachigen Raum. Munich: Ludwig Maximilian University of Munich, pp. 19–23. [Google Scholar]
- Betz, Simon, Sina Zarrieß, and Petra Wagner. 2017. Synthesized lengthening of function words—The fuzzy boundary between fluency and disfluency. In Proceedings of the International Conference Fluency and Disfluency. Edited by Liesbeth Degand. Stockholm: Royal Institute of Technology (KTH), pp. 15–19. [Google Scholar]
- Betz, Simon, Sina Zarrieß, Éva Székely, and Petra Wagner. 2019. The greennn tree—Lengthening position influences uncertainty perception. Paper presented at the 20th Annual Conference of the International Speech Communication Association: Crossroads of Speech and Language, INTERSPEECH 2019, Graz, Austria, September 15; pp. 3990–94. [Google Scholar]
- Boersma, Paul, and David Weenink. 2014. Praat: Doing Phonetics by Computer [Computer Program]. Available online: http://www.praat.org/ (accessed on 7 July 2022).
- Brugman, Hennie, and Albert Russel. 2004. Annotating Multimedia/ Multi-modal resources with ELAN. Paper presented at the LREC 2004, Fourth International Conference on Language Resources and Evaluation, Nijmegen, The Netherlands, May 26–28; Available online: https://archive.mpi.nl/tla/elan (accessed on 7 July 2022).
- Butterworth, Brian, and Geoffrey Beattie. 1978. Gesture and silence as indicators of planning in speech. In Recent Advances in the Psychology of Language: Formal and Experimental Approaches. Edited by R. N. Campbell and P. Smith. New York: Plenum, pp. 347–60. [Google Scholar]
- Campione, Estelle, and Jean Véronis. 2002. A large-scale multilingual study of silent pause duration. Paper presented at the Speech Prosody 2002, International Conference, Aix-en-Provence, France, April 11–13; pp. 199–202. [Google Scholar]
- Chafe, Wallace. 1980. Some reasons for hesitating. In Temporal Variables in Speech: Studies in Honour of Frieda Goldman-Eisler. Berlin: Walter de Gruyter, pp. 169–80. [Google Scholar]
- Churchill, Alex, Stella Biderman, and Austin Herrick. 2019. Magic: The gathering is turing complete. arXiv arXiv:1904.09828. [Google Scholar]
- Clark, Herbert H. 1996. Using Language. Cambridge: Cambridge University Press. [Google Scholar]
- Cook, Susan Wagner, Zachary Mitchell, and Susan Goldin-Meadow. 2008. Gesturing makes learning last. Cognition 106: 1047–58. [Google Scholar] [CrossRef] [Green Version]
- Dahl, Kimberly L., and Cara E. Stepp. 2021. Changes in relative fundamental frequency under increased cognitive load in individuals with healthy voices. Journal of Speech, Language, and Hearing Research 64: 1189–96. [Google Scholar] [CrossRef]
- De Ruiter, Jan Peter. 2000. The production of gesture and speech. Language and Gesture 2: 284–311. [Google Scholar]
- Eklund, Robert. 2004. Disfluency in Swedish Human–Human and Human–Machine Travel Booking Dialogues. Ph.D. thesis, Linköping University Electronic Press, Linköping, Sweden. [Google Scholar]
- Fischer, Kerstin, Oliver Niebuhr, Eszter Novák-Tót, and Lars C. Jensen. 2017. Strahlt die negative Reputation von Häsitationsmarkern auf ihre Sprecher aus? Paper presented at the 43rd Annual Meeting of the German Acoustical Society (DAGA), Kiel, Germany, March 6–9; pp. 1450–53. [Google Scholar]
- Fox Tree, Jean E. 1995. The effects of false starts and repetitions on the processing of subsequent words in spontaneous speech. Journal of Memory and Language 34: 709–38. [Google Scholar] [CrossRef]
- Goldin-Meadow, Susan. 1999. The role of gesture in communication and thinking. Trends in Cognitive Sciences 3: 419–29. [Google Scholar] [CrossRef] [PubMed]
- Goldin-Meadow, Susan, Howard Nusbaum, Spencer D. Kelly, and Susan Wagner. 2001. Explaining math: Gesturing lightens the load. Psychological Science 12: 516–22. [Google Scholar] [CrossRef] [PubMed]
- Goldman-Eisler, Frieda. 1967. Sequential temporal patterns and cognitive processes in speech. Language and Speech 10: 122–32. [Google Scholar] [CrossRef] [PubMed]
- Graziano, Maria, and Marianne Gullberg. 2018. When speech stops, gesture stops: Evidence from developmental and crosslinguistic comparisons. Frontiers in Psychology 9: 879. [Google Scholar] [CrossRef]
- Graziano, Maria, Elena Nicoladis, and Paula Marentette. 2020. How referential gestures align with speech: Evidence from monolingual and bilingual speakers. Language Learning 70: 266–304. [Google Scholar] [CrossRef]
- Hough, Julian, Ye Tian, Laura de Ruiter, Simon Betz, David Schlangen, and Jonathan Ginzburg. 2016. DUEL: A Multi-lingual Multimodal Dialogue Corpus for Disfluency, Exclamations and Laughter. Paper presented at the 10th edition of the Language Resources and Evaluation Conference, Portoroz, Slovenia, May 23–28; pp. 1784–88. [Google Scholar]
- Jabeen, Farhat, and Simon Betz. 2022. Hesitations in Urdu/Hindi: Distribution and Properties of Fillers & Silences. Interspeech 2022: 4491–5. [Google Scholar] [CrossRef]
- Karpiński, Maciej, Ewa Jarmołowicz-Nowikow, and Zofia Malisz. 2009. Aspects of gestural and prosodic structure of multimodal utterances in Polish task-oriented dialogues. Speech and Language Technology 11: 113–22. [Google Scholar]
- Kendon, Adam. 2004. Gesture: Visible Action as Utterance. Cambridge: Cambridge University Press. [Google Scholar]
- Kisler, Thomas, Uwe Reichel, and Florian Schiel. 2017. Multilingual processing of speech via web services. Computer Speech & Language 45: 326–47. [Google Scholar] [CrossRef] [Green Version]
- Kita, Sotaro. 2000. How representational gestures help speaking. Language and Gesture 1: 162–185. [Google Scholar]
- Kita, Sotaro, and Asli Özyürek. 2003. What does cross-linguistic variation in semantic coordination of speech and gesture reveal?: Evidence for an interface representation of spatial thinking and speaking. Journal of Memory and Language 48: 16–32. [Google Scholar] [CrossRef]
- Kita, Sotaro, Ingeborg van Gijn, and Harry van der Hulst. 1997. Movement phases in signs and co-speech gestures, and their transcription by human coders. In International Gesture Workshop. Berlin and Heidelberg: Springer, pp. 23–35. [Google Scholar]
- Kosmala, Loulou, Maria Candea, and Aliyah Morgenstern. 2019. Synchronization of (dis) fluent speech and gesture: A multimodal approach to (dis) fluency. Paper presented at the 6th Gesture and Speech in Interaction Conference, Paderborn, Germany, September 11–13. [Google Scholar]
- Kuznetsova, Alexandra, Per B. Brockhoff, and Rune H. B. Christensen. 2017. lmerTest package: Tests in linear mixed effects models. Journal of Statistical Software 82: 1–26. [Google Scholar] [CrossRef] [Green Version]
- Landis, J. Richard, and Gary G. Koch. 1977. The measurement of observer agreement for categorical data. Biometrics 33: 159–74. [Google Scholar] [CrossRef] [Green Version]
- Levelt, William J. M. 1989. Speaking: From Intention to Articulation. Cambridge: MIT Press. [Google Scholar]
- Lickley, Robin J. 2001. Dialogue moves and disfluency rates. Paper presented at the ISCA Tutorial and Research Workshop (ITRW) on Disfluency in Spontaneous Speech, Scotland, UK, August 29–31. [Google Scholar]
- Lively, Scott E., David B. Pisoni, W. Van Summers, and Robert H. Bernacki. 1993. Effects of cognitive workload on speech production: Acoustic analyses and perceptual consequences. The Journal of the Acoustical Society of America 93: 2962–73. [Google Scholar] [CrossRef]
- Loehr, Daniel P. 2004. Gesture and Intonation. Ph.D. thesis, Georgetown University, Washington, DC, USA. [Google Scholar]
- McNeill, David. 1992. Hand and Mind: What Gestures Reveal about Thought. Chicago: University of Chicago Press. [Google Scholar]
- McNeill, D. 2005. Gesture and Thought. Chicago: University of Chicago Press. [Google Scholar]
- Montacié, Claude, and Marie-José Caraty. 2014. High-level speech event analysis for cognitive load classification. Interspeech 2014: 731–5. [Google Scholar] [CrossRef]
- Moon, A. Jung, Chris A. C. Parker, Elizabeth A. Croft, and H. F. Machiel Van der Loos. 2011. Did you see it hesitate?-empirically grounded design of hesitation trajectories for collaborative robots. Paper presented at the 2011 IEEE/RSJ International Conference on Intelligent Robots and Systems, San Francisco, CA, USA, September 25–30; pp. 1994–99. [Google Scholar]
- Morrel-Samuels, Palmer, and Robert M. Krauss. 1992. Word familiarity predicts temporal asynchrony of hand gestures and speech. Journal of Experimental Psychology: Learning, Memory, and Cognition 18: 615. [Google Scholar] [CrossRef]
- Novack, Miriam A., and Susan Goldin-Meadow. 2017. Gesture as representational action: A paper about function. Psychonomic Bulletin & Review 24: 652–65. [Google Scholar]
- Pouw, Wim, and James A. Dixon. 2019. Entrainment and modulation of gesture–speech synchrony under delayed auditory feedback. Cognitive Science 43: e12721. [Google Scholar] [CrossRef] [PubMed] [Green Version]
- R Core Team. 2015. R: A Language and Environment for Statistical Computing. Vienna: R Foundation for Statistical Computing. [Google Scholar]
- Schuller, Björn, Stefan Steidl, Anton Batliner, Julien Epps, Florian Eyben, Fabien Ringeval, Erik Marchi, and Yue Zhang. 2014. The INTERSPEECH 2014 computational paralinguistics challenge: Cognitive and physical load. Interspeech 2014: 427–31. [Google Scholar] [CrossRef]
- Schweitzer, Antje, and Natalie Lewandowski. 2013. Convergence of articulation rate in spontaneous speech. Paper presented at the 14th Annual Conference of the International Speech Communication Association (Interspeech 2013), Lyon, France, August 25–29; pp. 525–29. [Google Scholar]
- Seyfeddinipur, Mandana. 2006. Disfluency: Interrupting Speech and Gesture. Ph.D. thesis, Radboud University Nijmegen, Nijmegen, The Netherlands. [Google Scholar]
- Shriberg, Elizabeth Ellen. 1994. Preliminaries to a Theory of Speech Disfluencies. Ph.D. thesis, University of California, San Diego, CA, USA. [Google Scholar]
- Sweller, John, and Paul Chandler. 1991. Evidence for cognitive load theory. Cognition and Instruction 8: 351–62. [Google Scholar] [CrossRef]
- Trouvain, Jürgen, and Raphael Werner. 2022. A phonetic view on annotating speech pauses and pause-internal phonetic particles. In Transkription und Annotation Gesprochener Sprache und Multimodaler Interaktion: Konzepte, Probleme, Lösungen. Tubingen: Narr Francke Attempto Verlag, vol. 55. [Google Scholar]
- Türk, Olcay. 2020. Gesture, Prosody and Information Structure Synchronisation in Turkish. Ph.D. thesis, Victoria University of Wellington, Wellington, New Zealand. [Google Scholar]
- Vukovic, Maria, Vidhyasaharan Sethu, Jessica Parker, Lawrence Cavedon, Margaret Lech, and John Thangarajah. 2019. Estimating cognitive load from speech gathered in a complex real-life training exercise. International Journal of Human-Computer Studies 124: 116–33. [Google Scholar] [CrossRef]
- Wagner, Petra, Zofia Malisz, and Stefan Kopp. 2014. Gesture and speech in interaction: An overview. Speech Communication 57: 209–232. [Google Scholar] [CrossRef]
- Wagner, Petra, Jürgen Trouvain, and Frank Zimmerer. 2015. In defense of stylistic diversity in speech research. Journal of Phonetics 48: 1–12. [Google Scholar] [CrossRef]
- Yap, Tet Fei, Julien Epps, Eliathamby Ambikairajah, and Eric H. C. Choi. 2011. Formant frequencies under cognitive load: Effects and classification. EURASIP Journal on Advances in Signal Processing 2011. [Google Scholar] [CrossRef] [Green Version]
- Yin, Bo, and Fang Chen. 2007. Towards automatic cognitive load measurement from speech analysis. In Human-Computer Interaction. Interaction Design and Usability. Edited by Julie A. Jacko. Berlin and Heidelberg: Springer, pp. 1011–20. [Google Scholar]


| Cost | Effect | Complexity | Amount |
|---|---|---|---|
| one colored resource | generate three resources of one other particular color | 0 | 6 |
| two different colored resources | draw three cards | 0 | 6 |
| zero | generate one resource of any color * | 1 | 3 |
| one resource of any color | generate one resource of any color, then draw a card | 2 | 4 |
| two resources in any combination of colors | generate two resources in any combination of colors, then draw a card | 4 | 4 |
| Hesitations | N | % | Corpus Specifics | |
|---|---|---|---|---|
| Silence | 901 | 54.7 | Words in corpus | 8141 |
| Lengthening | 498 | 30.2 | Corpus duration | 110 min |
| Filler | 249 | 15.1 | Words affected by hesitation | 20.2% |
| total | 1648 | Hesitations per minute | 14.9 |
| Sum Sq | Mean Sq | NumDF | DenDF | F Value | Pr(>F) | |
|---|---|---|---|---|---|---|
| Complexity | 1888.843 | 629.614 | 3.000 | 1627.960 | 111.671 | 0.000 |
| Move number | 539.412 | 539.412 | 1.000 | 1627.495 | 95.672 | 0.000 |
| Log move duration | 3264.814 | 3264.814 | 1.000 | 1621.792 | 579.058 | 0.000 |
| Log hesitation duration | 25.118 | 25.118 | 1.000 | 1632.857 | 4.455 | 0.035 |
| Hesitation type | 49.076 | 24.538 | 2.000 | 1627.519 | 4.352 | 0.013 |
| a. Spoken Hesitations | ||
| N | % | |
| Silence | 558 | 56.1 |
| Lengthening | 283 | 28.4 |
| Filler | 154 | 15.5 |
| Total | 995 | |
| b. G-Phases | ||
| N | % | |
| Stroke | 1258 | 42 |
| Prep | 733 | 24.5 |
| Hold | 601 | 20.1 |
| Ret | 369 | 12.3 |
| Jerk | 34 | 1.1 |
| Total | 2995 | |
| c. Gestural Hesitations | ||
| N | % | |
| Pause | 283 | 32.7 |
| Slow | 187 | 21.6 |
| Stall | 173 | 20 |
| Cancel | 166 | 19.2 |
| Meta | 56 | 6.5 |
| Total | 865 | |
| Cancel | Lengthen | Meta | Pause | Stall | n | |
|---|---|---|---|---|---|---|
| Filler | 10% | 15% | 11.7% | 56.7% | 6.7% | 60 |
| Lengthening | 14.7% | 31.3% | 2.7% | 43.3% | 8% | 150 |
| Silence | 16.6% | 24.6% | 4.7% | 44.8% | 9.2% | 337 |
| Sum Sq | Mean Sq | NumDF | DenDF | F Value | Pr(>F) | |
|---|---|---|---|---|---|---|
| Complexity | 2569.155 | 856.385 | 3.000 | 1495.482 | 76.901 | <0.001 |
| Log move duration | 6139.755 | 6139.755 | 1.000 | 1437.191 | 551.331 | <0.001 |
| G-phase type | 119.927 | 29.982 | 4.000 | 1491.984 | 2.692 | 0.030 |
| Move number | 166.836 | 166.836 | 1.000 | 1498.862 | 14.981 | <0.001 |
Disclaimer/Publisher’s Note: The statements, opinions and data contained in all publications are solely those of the individual author(s) and contributor(s) and not of MDPI and/or the editor(s). MDPI and/or the editor(s) disclaim responsibility for any injury to people or property resulting from any ideas, methods, instructions or products referred to in the content. |
© 2023 by the authors. Licensee MDPI, Basel, Switzerland. This article is an open access article distributed under the terms and conditions of the Creative Commons Attribution (CC BY) license (https://creativecommons.org/licenses/by/4.0/).
Share and Cite
Betz, S.; Bryhadyr, N.; Türk, O.; Wagner, P. Cognitive Load Increases Spoken and Gestural Hesitation Frequency. Languages 2023, 8, 71. https://doi.org/10.3390/languages8010071
Betz S, Bryhadyr N, Türk O, Wagner P. Cognitive Load Increases Spoken and Gestural Hesitation Frequency. Languages. 2023; 8(1):71. https://doi.org/10.3390/languages8010071
Chicago/Turabian StyleBetz, Simon, Nataliya Bryhadyr, Olcay Türk, and Petra Wagner. 2023. "Cognitive Load Increases Spoken and Gestural Hesitation Frequency" Languages 8, no. 1: 71. https://doi.org/10.3390/languages8010071