
Pause Length and Differences in Cognitive State Attribution in Native and Non-Native Speakers

Abstract
:1. Introduction
Turn 1 A: Why don’t you come up and see me some // times.
Turn 2 B: I would like to1.
- Delays, e.g., insertion sequences;
- Prefaces, e.g., markers or announcers of dispreferreds, such as “Uh” and “Well”;
- Politeness markers, e.g., appreciation markers and apologies;
- Hesitations, e.g., self-editing;
- Accounts: carefully formulated explanations for why the (dispreferred) act is being performed (Levinson 1983, pp. 334–35).
Turn 1 A: Uh if you’d care to come and visit me a little while this morning I’ll give you a cup of coffee.
Turn 2 B: [pause] Hehh ((DELAY)) well ((ANNOUNCER)) that’s awfully sweet of you ((APPRECIATION)), I don’t think I can make it this morning. ((DECLINATION)) I’m running an ad in the paper and I have to stay near the phone ((REASON)).
2. Methods
2.1. Experimental Conditions and Procedure
2.2. Participants and Setting
2.3. Stimulus Material
2.4. Analyses
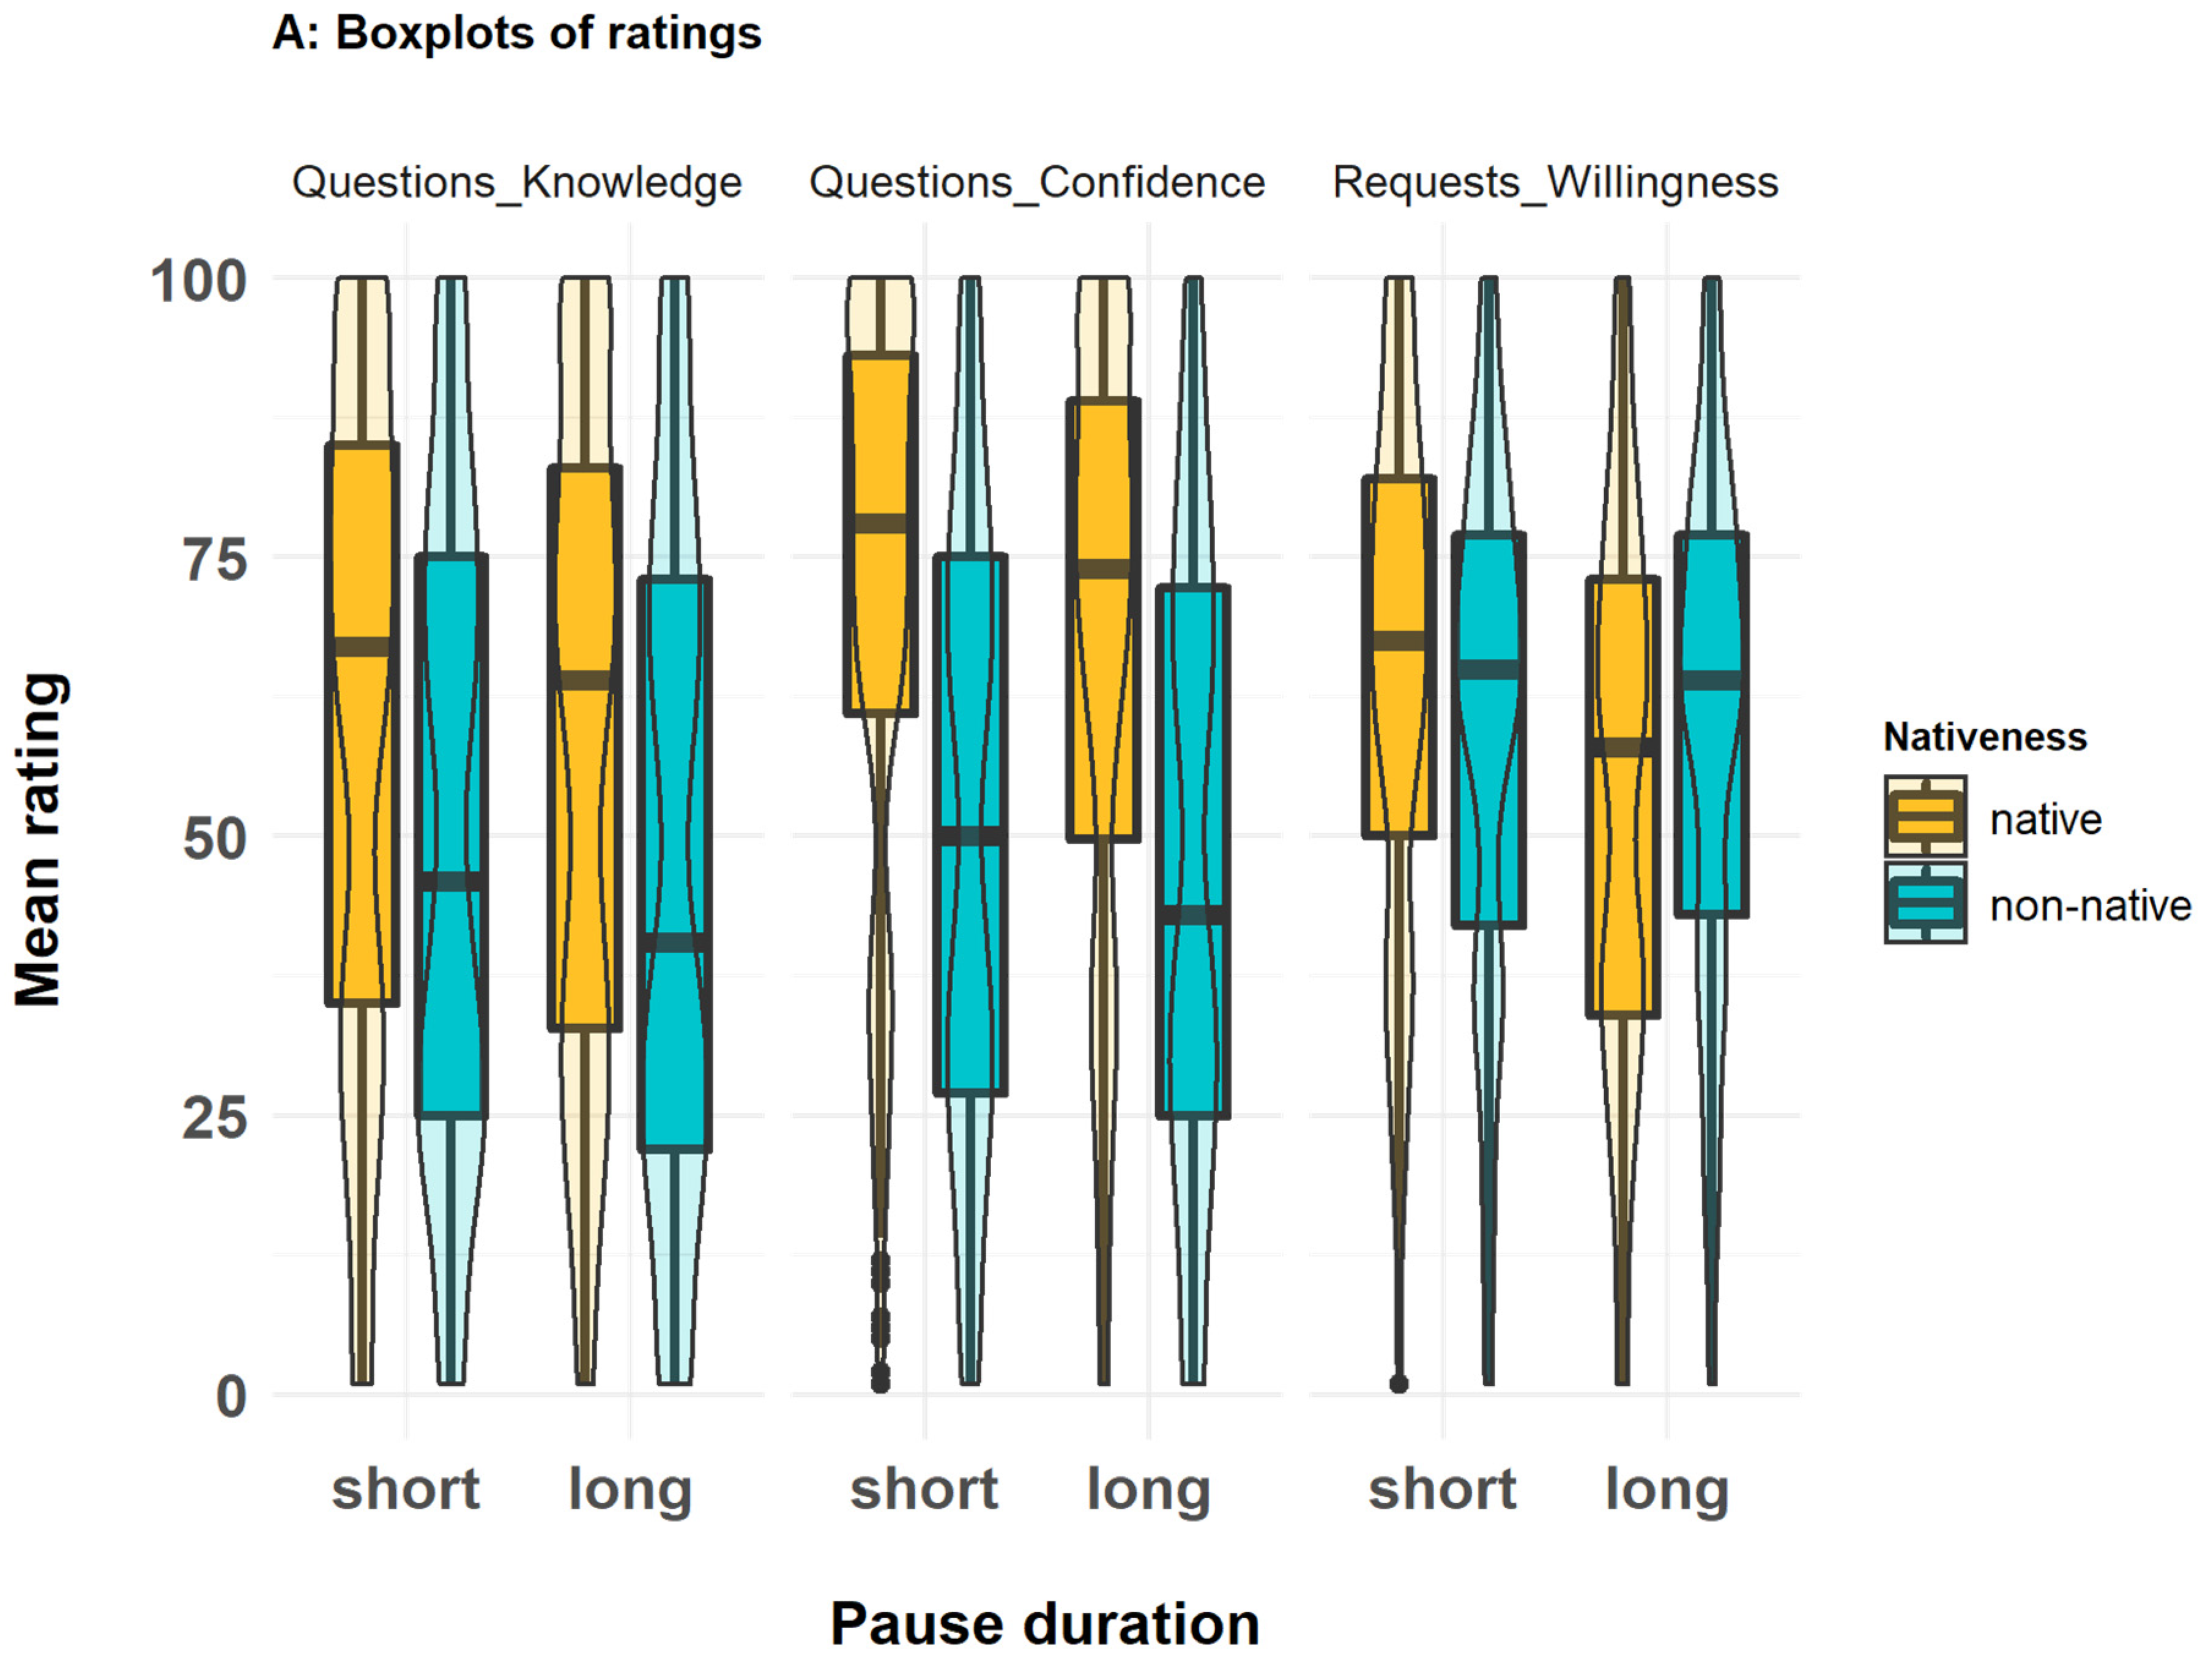
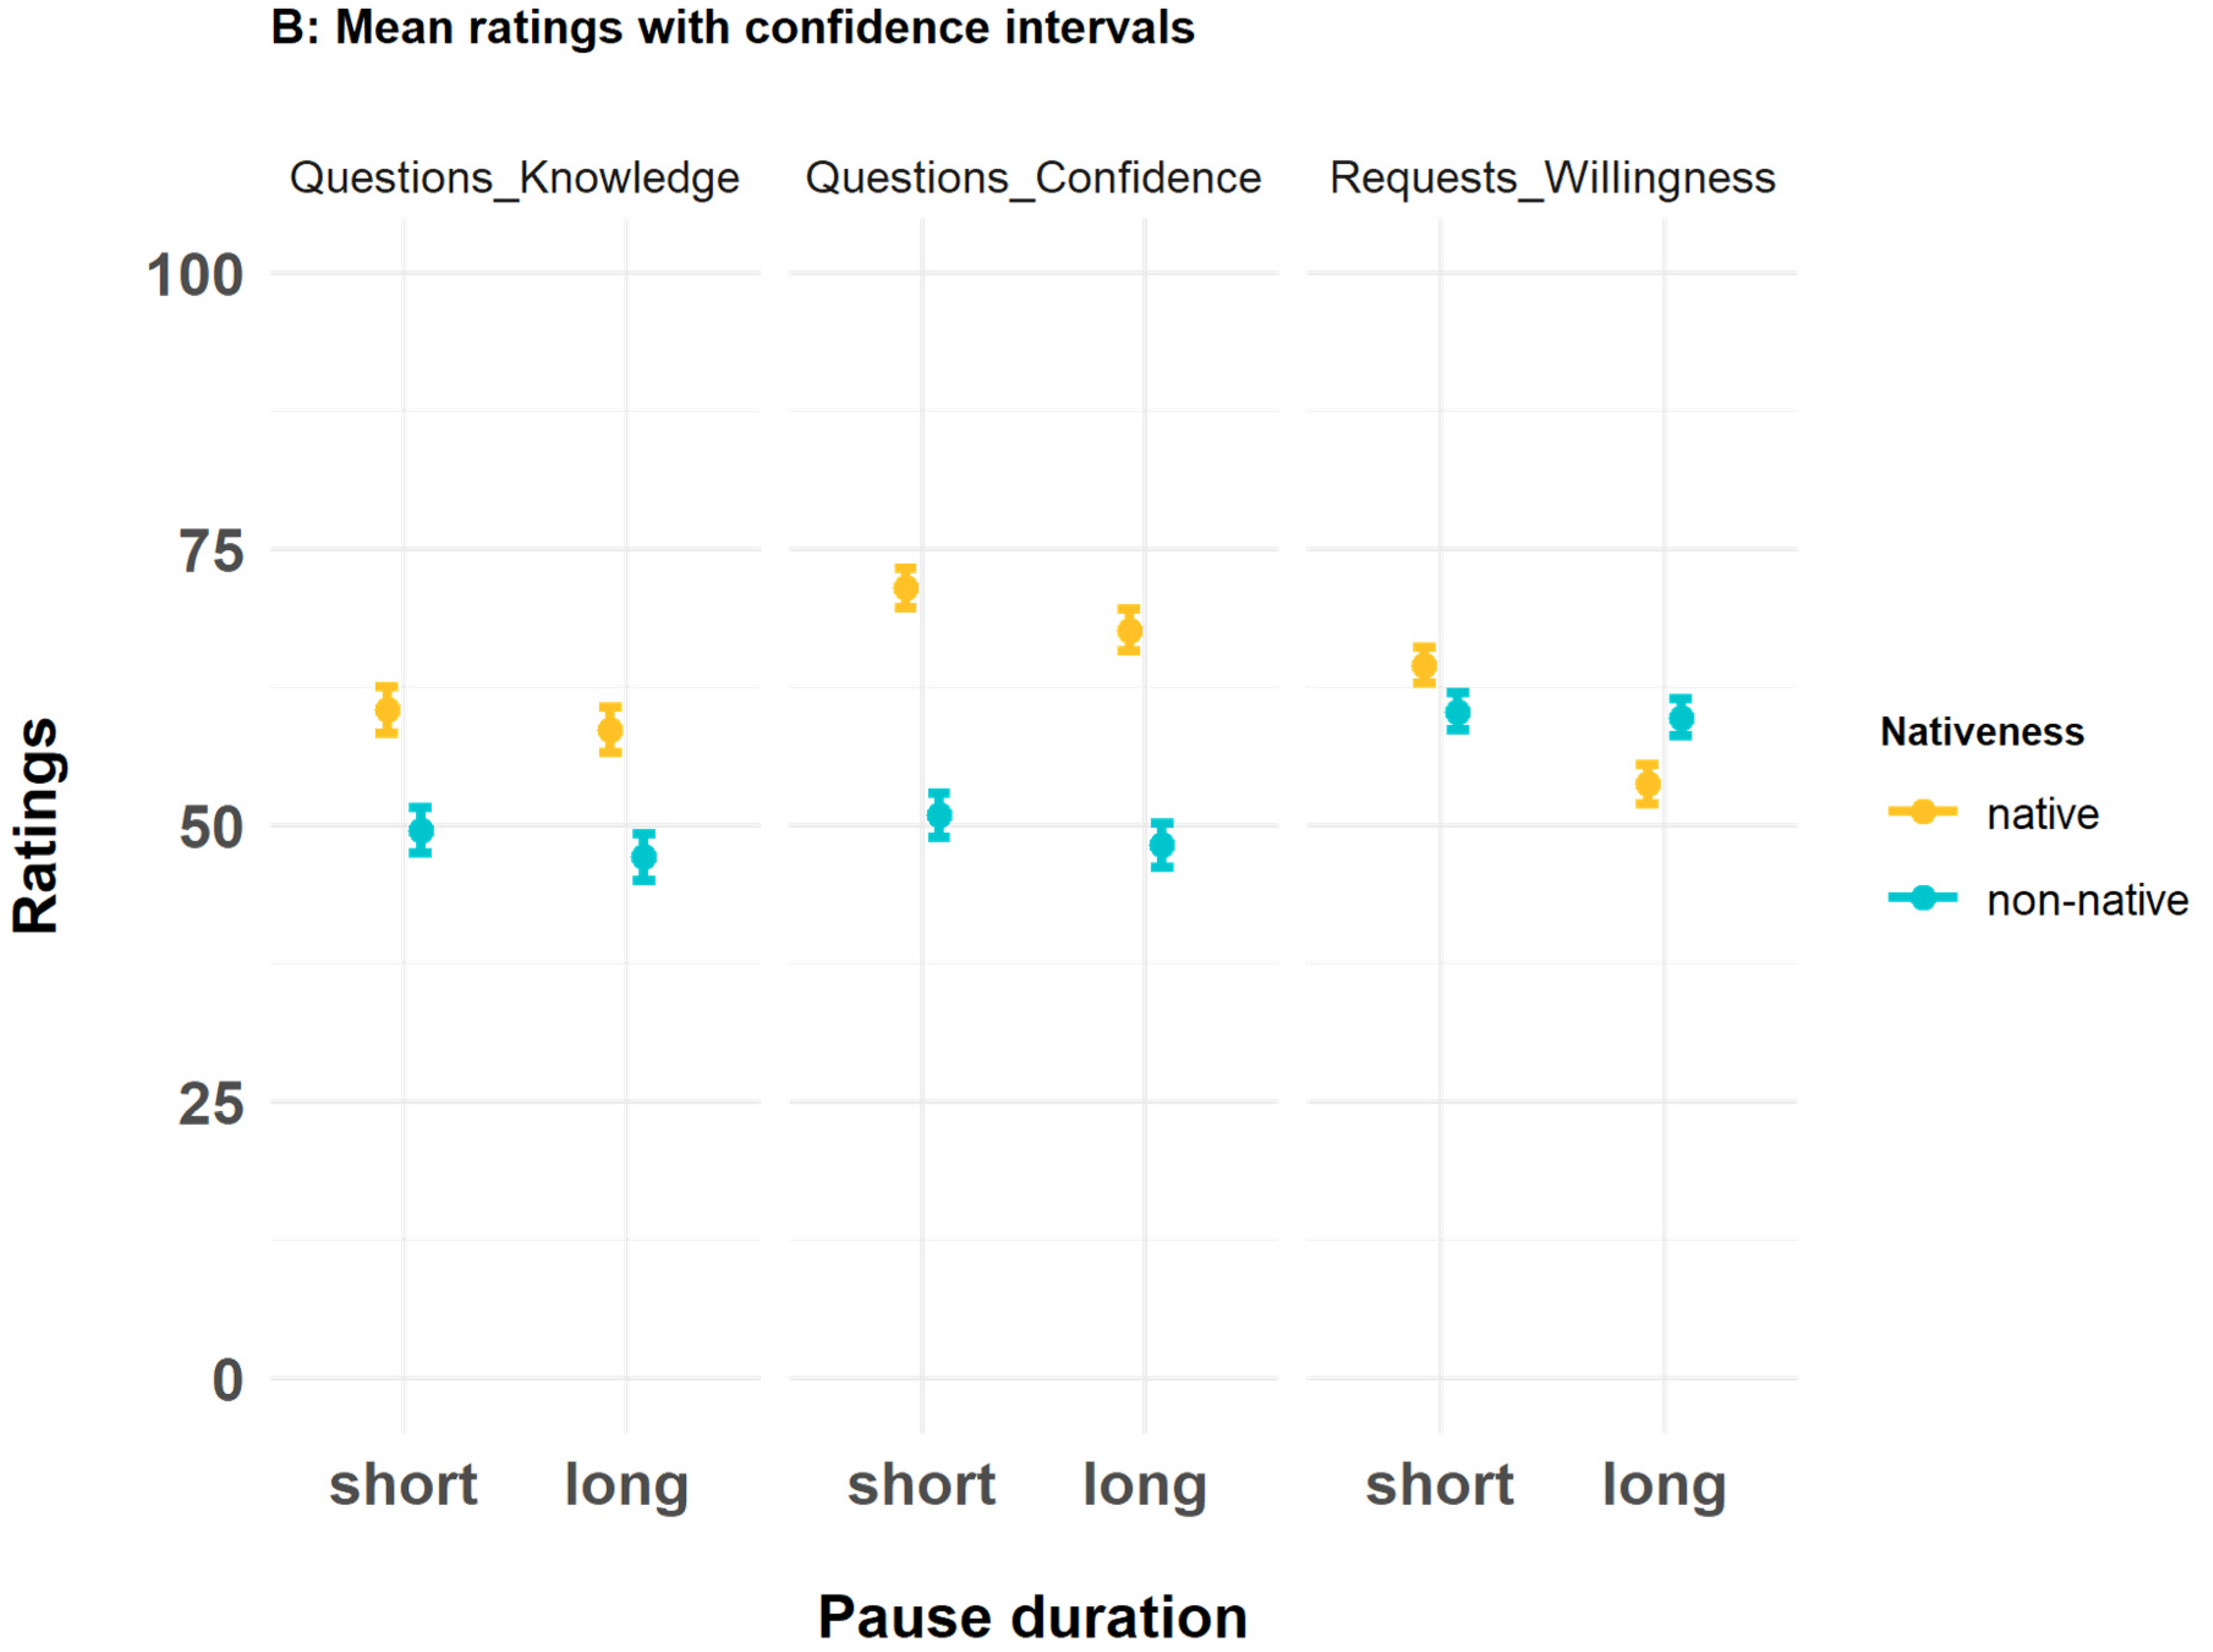
3. Results
3.1. Rating Data: Pre-Registered Analyses
3.1.1. Perceived Knowledge
3.1.2. Perceived Confidence
3.1.3. Perceived Willingness to Grant Requests
3.2. Questionnaire Data: Exploratory Analyses
4. Discussion
5. Conclusions
Author Contributions
Funding
Institutional Review Board Statement
Informed Consent Statement
Data Availability Statement
Acknowledgments
Conflicts of Interest
Appendix A. Mini-Conversations

| 1 | Q: What was invented before: the cigarette lighter or matches? A: I think that the cigarette lighter was invented before. P: Co wymyślono wcześniej: zapalniczkę czy zapałki? O: Myślę, że zapalniczka została wynaleziona wcześniej. |
| 2 | Q: What’s faster: a sneeze traveling out of your mouth or a leopard running at full speed? A: I think a sneeze is faster than a leopard. P: Co jest szybsze: kichnięcie przez usta czy lampart biegnący z pełną prędkością? O: Myślę, że kichnięcie jest szybsze niż lampart. |
| 3 | Q: For how much money was the most expensive coin in the world sold? For 1.5 million dollars or for 7 million dollars? A: I think it was sold for 7 million dollars. P: Za ile pieniędzy sprzedano najdroższą monetę na świecie? Za półtora miliona dolarów czy za siedem milionów dolarów? O: Myślę, że najdroższą monetę sprzedano za siedem milionów dolarów. |
| 4 | Q: Which of the two animals can’t stick out their tongues: crocodiles or dolphins? A: I think crocodiles can’t stick out their tongues. P: Które z tych dwóch zwierząt nie potrafi wystawić języka: krokodyl czy delfin? O: Myślę, że krokodyl nie potrafi wystawić języka. |
| 5 | Q: Which animal can’t jump unless its tail is touching the ground: a kangaroo or a cat? A: I think it’s a kangaroo. P: Które z tych dwóch zwierząt potrafi skoczyć jedynie, kiedy jego ogon dotyka ziemi: kangur czy kot? O: Myślę, że kangur. |
| 6 | Q: For how long can polar bears swim without taking a rest: for about 30 km or 100 km? A: I think polar bears can swim for 100 km. P: Jak daleko niedźwiedzie polarne mogą pływać bez odpoczynku: około trzydzieści kilometrów czy sto kilometrów? O: Myślę, że niedźwiedzie polarne potrafią przepłynąć 100 km bez odpoczynku. |
| 7 | Q: How high can a flea jump: 120 times or 350 times its body length? A: I think a flea can jump 350 times its body length. P: Jak wysoko może skoczyć pchła: na stu dwudziesto-krotność lub trzystu pięćdziesięciu-krotność długości swojego ciała? O: Myślę, że pchła może skoczyć na trzystu pięćdziesięciu-krotność długości swojego ciała. |
| 8 | Q: Which animals have striped skin: zebras or tigers? A: I think tigers have striped skin. P: Które z tych dwóch zwierząt ma prążkowaną skórę: zebry czy tygrysy? O: Myślę, że tygrysy mają prążkowaną skórę. |
| 9 | Q: What is bigger: an ostrich’s eye or its brain? A: I think it’s the ostrich’s eye. P: Co jest większe: oko strusia czy jego mózg? O: Myślę, że oko strusia jest większe. |
| 10 | Q: How many eyelids do camels have to protect them from the sand: one or three? A: I think they have three eyelids. P: Ile powiek mają wielbłądy, żeby chronić się przed piaskiem: jedną czy trzy? O: Myślę, że mają trzy powieki. |
| 11 | Q: Which planet has no seasons because it does not tilt as it goes around the Sun: Venus or Mars? A: I think Venus doesn’t have seasons. P: Na której z tych dwóch planet nie ma pór roku, ponieważ nie przechyla się ona krążąc wokół Słońca: na Wenus czy na Marsie? O: Myślę, że na Wenus nie ma pór roku. |
| 12 | Q: Which animal can go longer without water: a camel or a giraffe? A: I think a giraffe can go longer. P: Które z tych dwóch zwierząt może dłużej wytrzymać bez wody: wielbłąd czy żyrafa? O: Myślę, że żyrafa może dłużej wytrzymać. |
| 13 | Q: Which animal’s heart can pump more blood in one minute: a giraffe’s or an elephant’s? A: I think it’s the heart of the giraffe. P: Serce, którego z tych zwierząt może przepompować więcej krwi w ciągu jednej minuty: żyrafy czy słonia? O: Myślę, że serce żyrafy. |
| 14 | Q: Which animal has the hardest teeth: a sea snail or a beaver? A: I think it’s the teeth of the sea snail. P: Jakie zwierze ma twardsze zęby: ślimak morski czy bóbr? O: Myślę, że ślimak morski. |
| 15 | Q: What percent of the total mass of the solar system does the sun have? 93.5 percent or 99.8 percent? A: I think the sun has 99.8 percent of the mass. P: Ile procent całej masy Układu Słonecznego to masa Słońca?-dziewięćdziesiąt trzy i pięć dziesiątych procenta czy dziewięćdziesiąt dziewięć i osiem dziesiątych procenta? O: Myślę, że masa Słońca to dziewięćdziesiąt dziewięć i osiem dziesiątych procenta. |
| 16 | Q: Does the sun shrink or expand five feet every hour? A: I think the Sun shrinks five feet every hour. P: Czy słońce kurczy się czy się rozszerza o półtora metra co godzinę? O: Myślę, że Słońce kurczy się o półtora metra co godzinę. |
| 17 | Q: Which are the only animals that are born with horns: giraffes or chameleons? A: I think it’s giraffes. P: Które z tych dwóch zwierząt rodzi się z rogami: żyrafa czy kameleon? O: Myślę, że żyrafa. |
| 18 | Q: The two hemispheres of a dolphin’s brain work independently in alternating “shifts”. After which time do they change: after 30 minutes or after 8 hours? A: I think it’s after 8 hours. P: Dwie półkule mózgu delfina pracują niezależnie w naprzemiennych “rundach”. Po jakim czasie następują te rundy: po trzydziestu minutach czy po ośmiu godzinach? O: Myślę, że po ośmiu godzinach. |
| 19 | Q: When was the can opener invented: half a year or 48 years after the invention of the can? A: I think it was after 48 years. P: Kiedy wynaleziono otwieracz do puszek: pół roku czy czterdzieści osiem lat po wynalezieniu puszki? O: Myślę, że po czterdziestu ośmiu latach. |
| 20 | Q: How long was the longest wedding veil: longer than 21 or than 63 football fields? A: I think the longest wedding veil was longer than 63 football fields. P: Jak długi był najdłuższy welon ślubny: dłuższy niż dwadzieścia jeden boisk piłkarskich czy sześćdziesiąt trzy boiska piłkarskie? O: Myślę, że najdłuższy welon był dłuższy niż sześćdziesiąt trzy boiska piłkarskie. |
| 21 | Q: How many different viruses does the ocean contain: almost 200,000 or almost 1,000,000? A: I think the oceans contain almost 200,000 different kinds of viruses. P: Ile różnych rodzajów wirusów znajduje się w oceanach: prawie dwieście tysięcy czy prawie milion? O: Myślę, że oceany zawierają prawie dwieście tysięcy różnych rodzajów wirusów. |
| 22 | Q: How many different dog breeds are there: more than 200 or more than 600? A: I think that there are around 200 different breeds of dogs. P: Ile jest ras psów: ponad dwieście czy ponad sześćset? O: Myślę, że istnieje około dwustu ras psów. |
| 23 | Q: Where was the first public library in the world: in Vienna or in Peterborough? A: I think it was in Peterborough. P: Gdzie otwarto pierwszą bibliotekę publiczną na świecie: w Wiedniu czy w Peterborough? O: Myślę, że w Peterborough. |
| 24 | Q: How many babies are globally born every second: around 5 or around 15? A: I think it’s around 5 babies. P: Ile dzieci rodzi się na świecie co sekundę: około pięciu czy około piętnastu? O: Myślę, że około pięciu dzieci. |
| 25 | Q: Which of the two planets spins in the opposite direction of the earth: Saturn or Uranus? A: I think it’s Uranus. P: Która z tych dwóch planet obraca się w przeciwnym kierunku do Ziemi: Saturn czy Uran? O: Myślę, że Uran. |
| 26 | Q: How many grapes go into one bottle of wine: around 500 or around 1000? A: I think it’s around 500. P: Ile winogron potrzeba, żeby uzyskać jedną butelkę wina: około pięciuset czy około tysiąca? O: Myślę, że około pięciuset. |
| 27 | Q: Where is the original designer behind the game “Tetris” from: from Norway or from the Soviet Union? A: I think the original designer behind the game “Tetris” is from Norway. P: Skąd pochodzi twórca gry „Tetris”: z Norwegii czy ze Związku Radzieckiego? O: Myślę, że twórca gry „Tetris” pochodzi z Norwegii. |
| 28 | Q: How many feathers are on an eagle: approximately 7000 or 19,000 feathers? A: I think that there are approximately 7000 feathers on an eagle. P: Ile piór ma orzeł: około siedmiu tysięcy czy dziewiętnastu tysięcy? O: Myślę, że orzeł ma około siedmiu tysięcy piór. |
| 29 | Q: What kind of light are most birds’ eyes most sensitive to: visible light or ultraviolet light? A: I think it’s ultraviolet light. P: Na jaki rodzaj światła najbardziej wrażliwe są oczy większości ptaków: na światło widzialne czy światło ultrafioletowe? O: Myślę, że na światło ultrafioletowe. |
| 30 | Q: The skin of which sex of mature blue sharks is more than twice as thick as the skin of the opposite sex: males or females? A: I think it’s the skin of females. P: Skóra której płci dojrzałych rekinów błękitnych jest ponad dwukrotnie grubsza od skóry płci przeciwnej: samców czy samic? O: Myślę, że skóra samic. |
| 31 | Q: How long can large crocodiles survive without food: for over a week or for over a year? A: I think large crocodiles can live without food for a year. P: Jak długo duże krokodyle mogą przetrwać bez jedzenia: ponad tydzień czy ponad rok? O: Myślę, że duże krokodyle mogą przetrwać bez jedzenia przez rok. |
| 32 | Q: What were the first vegetables to be grown in space: potatoes or lettuce? A: I think potatoes were the first vegetables to be grown in space. P: Jakie były pierwsze warzywa wyhodowane w kosmosie: ziemniaki czy sałata? O: Myślę, że ziemniaki były pierwszymi warzywami wyhodowanymi w kosmosie. |
| 1 | R: I am starting to get really tired. Could you make me a black coffee? A: Okay, I can make you black coffee. P: Zaczynam czuć zmęczenie. Czy możesz mi zrobić czarną kawę? O: Dobrze, mogę zrobić Ci czarną kawę. |
| 2 | R: I need a rest. Can you move your bags so that I can sit here? A: Okay, I can move my bags over there. P: Muszę odsapnąć. Czy możesz wziąć te siatki, żebym mógł tutaj usiąść? O. Dobrze, mogę zabrać stąd swoje siatki. |
| 3 | R: I can’t find my way out of the building. Can you walk me to the exit? A: Okay, I can show you where the exit is. P: Nie wiem, jak wyjść z budynku. Czy możesz odprowadzić mnie do wyjścia? O: Dobrze, mogę Cię odprowadzić do wyjścia. |
| 4 | R: I have some more questions that I’d like to ask her. Can you give me her phone number? A: Okay, I can look for her number and give it to you. P: Jest jeszcze kilka rzeczy, o które chciałbym ją spytać. Czy możesz mi dać jej numer? O: Dobrze, mogę poszukać jej numeru i Ci go dać. |
| 5 | R: It’s really hot in here. Can you open the window? A: Okay, I can open the window to get some fresh air. P: Tutaj jest bardzo gorąco. Czy możesz otworzyć okno? O: Dobrze, mogę wpuścić trochę świeżego powietrza. |
| 6 | R: I’m really hungry. Can you make me pancakes? A: Okay, I can make pancakes for you. P: Jestem naprawdę głodny. Czy możesz zrobić mi naleśniki? O: Dobrze, mogę zrobić Ci naleśniki. |
| 7 | R: I don’t have enough money to buy our tickets. Can you pay me in advance? A: Okay, I can withdraw the money to pay you in advance. P: Nie starczy mi pieniędzy, żeby zapłacić za nasze bilety. Czy możesz mi zapłacić z góry? O: Dobrze, mogę wypłacić pieniądze i zapłacić Ci z góry. |
| 8 | R: It’s Dad’s birthday next week. Can you get something for him? A: Okay, I can get some flowers for him. P: Urodziny taty są w przyszłym tygodniu. Czy możesz coś kupić na prezent dla niego? O: Dobrze, mogę kupić mu kwiaty. |
| 9 | R: This is so much work. Can you come over and help me with these papers? A: Okay, I can stop by and help. P: Mam naprawdę dużo do zrobienia. Czy możesz wpaść i pomóc z tymi papierami? O: Dobrze, mogę wpaść i Ci pomóc. |
| 10 | R: I would like to drop him off at his parents’ house. Can you check the address for me? A: Okay, I can check and jot it down for you. P: Chciałbym go podrzucić do domu jego rodziców. Czy możesz sprawdzić jaki to adres? O: Dobrze, mogę sprawdzić i Ci go zapisać. |
| 11 | R: I haven’t had lunch yet. Can you get me something to eat? A: Okay, I can get you something from the cafeteria. P: Nie jadłem jeszcze lunchu. Czy możesz kupić coś do jedzenia? O: Dobrze, mogę przynieść Ci coś z baru. |
| 12 | R: The oven is already preheated. Can you help me peel the potatoes? A: Okay, I can help you peel them. P: Piekarnik jest rozgrzany. Czy możesz mi pomóc obrać ziemniaki? O: Dobrze, mogę pomóc Ci je obrać. |
| 13 | R: This is so complicated. Can you help me fill in this tax report? A: Okay, I can have a look and help you. P: To jest naprawdę skomplikowane. Czy możesz mi pomóc wypełnić to zeznanie podatkowe? O: Dobrze, mogę na nie spojrzeć i ci pomóc. |
| 14 | R: This is so much work. Can you help me with a few more things? A: Okay, I can help you with some of your tasks. P: Mam naprawdę dużo pracy. Czy możesz pomóc mi z kilkoma rzeczami? O: Dobrze, mogę Ci trochę pomóc. |
| 15 | R: We ran out of sugar. Can you get some so that we can make the cake? A: Okay, I can go to the supermarket to get it. P: Nie ma cukru. Czy możesz go kupić, żebyśmy mogli zrobić ciasto? O: Dobrze, mogę pójść do sklepu po cukier. |
| 16 | R: We need one more person to be there early. Can you come at ten? A: Okay, I can already come at ten. P: Jeszcze jedna osoba musi pojawić się tam wcześnie. Czy możesz przyjść na dziesiątą? O: Dobrze, mogę przyjść już na dziesiątą. |
| 17 | R: I’m not sure who will be there at the meeting tomorrow. Can you ask people and find out? A: Okay, I can send out an email. P: Nie wiem kto będzie jutro na spotkaniu. Czy możesz dowiedzieć się kto się wybiera? O: Dobrze, mogę wysłać maila do ludzi. |
| 18 | R: I just called the copy shop and the flyers are ready. Can you give me a ride over there? A: Okay, I can give you a ride. P: Właśnie rozmawiałem z punktem ksero i ulotki są już gotowe. Czy możesz mnie tam podwieźć? O: Dobrze, mogę Cię podwieźć. |
| 19 | R: I wanna go to my yoga class but I cannot find my yoga mat. Can I borrow yours? A: Okay, you can borrow my yoga mat. P: Idę na jogę i nie mogę znaleźć maty. Czy możesz pożyczyć Twoją? O: Dobrze, mogę pożyczyć ci moją matę. |
| 20 | R: My new computer is ready for pick-up. Can you come with me and help me carry it? A: Okay, I can come with you. P: Mój nowy komputer można już odebrać. Czy możesz pójść ze mną i pomóc mi go przenieść? O: Dobrze, mogę Ci pomóc z komputerem. |
| 21 | R: I forgot to bring cash. Can you lend me some money? A: Okay, I can lend you 100 zl. P: Zapomniałem pieniędzy. Czy możesz mi trochę pożyczyć? O: Dobrze, mogę pożyczyć Ci 100 złotych. |
| 22 | R: Our bathroom is so dirty and we will have guests tomorrow. Can you clean it? A: Okay, I can clean it before they come. P: Nasza łazienka jest naprawdę brudna, a jutro mamy gości. Czy możesz ją posprzątać? O: Dobrze, mogę posprzątać łazienkę. |
| 23 | R: I don’t know how to assemble this shelf. Can you help me do it? A: Okay, I can help you with the shelf. P: Nie wiem jak złożyć tę półkę. Czy możesz mi pomóc? O: Dobrze, mogę pomóc ci z tą półką. |
| 24 | R: I don’t have any tools to fix it. Can you lend me your hammer? A: Okay, you can have my hammer. P: Nie mam żadnych narzędzi, żeby to naprawić. Czy możesz pożyczyć mi młotek? O: Dobrze, mogę pożyczyć Ci młotek. |
| 25 | R: Mum needs some help in the garden. Can you mow the lawn? A: Okay, I can cut the grass. P: Trzeba pomóc mamie w ogrodzie. Czy możesz skosić trawnik? O: Dobrze, mogę skosić trawę. |
| 26 | R: The washing machine is done. Can you unload it? A: Okay, I can hang the clothes. P: Pralka skończyła. Czy możesz ją wyładować? O: Dobrze, mogę rozwiesić pranie. |
| 27 | R: We will make some important decisions. Can you take notes during the meeting? A: Okay, I can take notes of the most important things. P: Musimy podjąć kilka ważnych decyzji. Czy możesz robić notatki podczas spotkania? O: Dobrze, mogę notować najważniejsze rzeczy. |
| 28 | R: I don’t know if our guests will find their way. Can you await them at the gate? A: Okay, I will wait for them and show them their way. P: Nie wiem czy nasi goście tutaj trafią. Czy możesz poczekać na nich przy bramie? O: Dobrze, poczekam na nich i pokaże im drogę. |
| 29 | R: One of the light bulbs is broken. Can you change it? A: Okay, I can change the light bulb. P: Jedna żarówka się przepaliła. Czy możesz ją zmienić? O: Dobrze, mogę zmienić tę żarówkę. |
| 30 | R: I still need to finish some things. Can you walk the dog alone today? A: Okay, I can go for a walk with him. P: Mam jeszcze kilka rzeczy do zrobienia. Czy możesz dziś wyprowadzić psa? O: Dobrze, mogę z nim pójść na spacer. |
| 31 | R: I won’t have time to go to the travel agency with you. Can you book the flight for both of us? A: Okay, I can get our tickets. P: Nie będę miał czasu pójść z Tobą do biura podróży. Czy możesz zarezerwować lot dla nas obojga? O: Dobrze, mogę zarezerwować dla nas bilety. |
| 32 | R: My wifi hotspot doesn’t seem to work. Can you check the departure time for me? A: Okay, I can check it for you. P: Moje wifi nie działa. Czy możesz sprawdzić, kiedy jest odjazd? O: Dobrze, mogę to dla Ciebie sprawdzić. |
| 1 | // indicates that “times” and “I would like to” are delivered in an overlap. |
References
- Ackerman, Rakefet, and Hagar Zalmanov. 2012. The persistence of the fluency–confidence association in problem solving. Psychonomic Bulletin and Review 19: 1187–92. [Google Scholar] [CrossRef] [PubMed]
- Alim, H. Samy, John R. Rickford, and Arnetha F. Ball, eds. 2016. Raciolinguistics: How Language Shapes Our Ideas about Race. Oxford: Oxford University Press. [Google Scholar]
- Atkinson, J. Maxwell, and Paul Drew. 1979. Order in Court: The Organization of Verbal Interaction in Juridical Settings. London: Macmillan. [Google Scholar]
- Baayen, R. Harald. 2008. Analyzing Linguistic Data. Cambridge: Cambridge University Press. [Google Scholar]
- Barr, Dale J., Roger Levy, Christoph Scheepers, and Harry J. Tily. 2013. Random Effects Structure for Confirmatory Hypothesis Testing: Keep It Maximal. Journal of Memory and Language 68: 255–78. [Google Scholar] [CrossRef] [PubMed] [Green Version]
- Bartón, Kamil. 2018. MuMIn: Multi-Model Inference. R Package Version 1.42.1. Available online: https://cran.r-project.org/package=MuMIn (accessed on 2 January 2023).
- Bates, Douglas, Martin Mächler, Benjamin M. Bolker, and Steven C. Walker. 2015. Fitting Linear Mixed-Effects Models Using Lme4. Journal of Statistical Software 67: 1–48. [Google Scholar] [CrossRef]
- Boduch-Grabka, Katarzyna, and Shiri Lev-Ari. 2021. Exposing Individuals to Foreign Accent Increases their Trust in What Nonnative Speakers Say. Cognitive Science 45: e13064. [Google Scholar] [CrossRef]
- Boersma, Paul, and David Weenink. 2022. Praat: Doing Phonetics by Computer (Version 6.2.19). Available online: http://www.praat.org/ (accessed on 2 January 2023).
- Bosker, Hans Rutger, Hugo Quené, Ted Sanders, and Nivja H. De Jong. 2014. The perception of fluency in native and nonnative speech. Language Learning 64: 579–614. [Google Scholar] [CrossRef] [Green Version]
- Brennan, Susan E., and Maurice Williams. 1995. The Feeling of Another′s Knowing: Prosody and Filled Pauses as Cues to Listeners about the Metacognitive States of Speakers. Journal of Memory and Language 34: 383–98. [Google Scholar] [CrossRef]
- CBOS (Centrum Badania Opinii Publicznej). 2020. Tożsamość narodowa i postrzeganie praw mniejszości narodowych i etnicznych. Warszawa: Fundacja Centrum Badania Opinii Społecznej. [Google Scholar]
- Cenoz, Jasone. 2000. Pauses and hesitation phenomena in second language production. ITL: Review of Applied Linguistics 127: 53–69. [Google Scholar] [CrossRef]
- Chafe, Wallace L. 1980. Some reasons for hesitating. In Temporal Variables in Speech 86. Edited by Hans W. Dechert and Manfred Raupach. New York: De Gruyter Mouton. [Google Scholar]
- Cohen, Jacob. 1992. A Power Primer. Psychological Bulletin 112: 155–59. [Google Scholar] [CrossRef]
- Çokal, Derya, Vitor Zimmerer, Douglas Turkington, Nicol Ferrier, Rosemary Varley, Stuart Watson, and Wolfram Hinzen. 2019. Disturbing the rhythm of thought: Speech pausing patterns in schizophrenia, with and without formal thought disorder. PLoS ONE 14: e0217404. [Google Scholar] [CrossRef]
- Coupland, Nikolas, and Hywel Bishop. 2007. Ideologised values for British accents 1. Journal of Sociolinguistics 11: 74–93. [Google Scholar] [CrossRef]
- Davis, Norman. 2003. God’s Playground A History of Poland: Volume II: 1795 to the Present. Oxford: Oxford University Press. [Google Scholar]
- De Jong, Nivja H. 2016. Predicting pauses in L1 and L2 speech: The effects of utterance boundaries and word frequency. International Review of Applied Linguistics in Language Teaching 54: 113–32. [Google Scholar] [CrossRef]
- De Ruiter, Jan-Peter, Holger Mitterer, and Nick J. Enfield. 2006. Projecting the end of a Speaker’s Turn: A Cognitive Cornerstone of Conversation. Language 82: 515–35. [Google Scholar] [CrossRef]
- Dingemanse, Mark, and Andreas Liesenfeld. 2022. From text to talk: Harnessing conversational corpora for humane and diversity-aware language technology. In Proceedings of the 60th Annual Meeting of the Association for Computational Linguistics 1 (Long Papers). Dublin: Association for Computational Linguistics, pp. 5614–33. [Google Scholar]
- Dobrow, Julia R., and Calvin L. Gidney. 1998. The good, the bad, and the foreign: The use of dialect in children’s animated television. The Annals of the American Academy of Political and Social Science 557: 105–19. [Google Scholar] [CrossRef]
- Dobson, Annette J. 2002. An Introduction to Generalized Linear Models. Boca Raton: Chapman and Hall. [Google Scholar]
- Duez, Danielle. 1982. Silent and non-silent pauses in three speech styles. Language and Speech 25: 11–28. [Google Scholar] [CrossRef]
- Feng, Ruiling. 2022. Cognitive Factors Influencing Utterance Fluency in L2 Dialogues: Monadic and Non-monadic Perspectives. Frontiers in Psychology 13: 926367. [Google Scholar] [CrossRef]
- Field, Andy, Jeremy Miles, and Zoë Field. 2012. Discovering Statistics Using R. Los Angeles: SAGE. [Google Scholar] [CrossRef]
- Finger, Holger, Caspar Goeke, Dorena Diekamp, Kai Standvoß, and Peter König. 2017. LabVanced: A unified JavaScript framework for online studies. In International Conference on Computational Social Science (Cologne). Cologne: University of Osnabrück, pp. 1–3. [Google Scholar]
- Fletcher, Janet. 2010. The Prosody of Speech: Timing and Rhythm. In The Handbook of Phonetic Sciences. Edited by William J. Hardcastle, John Laver and Fiona E. Gibbon. New Jersey: Wiley-Blackwell, pp. 521–602. [Google Scholar]
- Fox Tree, Jean E. 2002. Interpreting pauses and ums at turn exchanges. Discourse Processes 34: 37–55. [Google Scholar] [CrossRef]
- Fuertes, Jairo N., William H. Gottdiener, Helena Martin, Tracey C. Gilbert, and Howard Giles. 2012. A meta-analysis of the effects of speakers’ accents on interpersonal evaluations. European Journal of Social Psychology 42: 120–33. [Google Scholar] [CrossRef]
- Gleitman, Lila R., David January, Rebecca Nappa, and John C. Trueswell. 2007. On the give and take between event apprehension and utterance formulation. Journal of Memory and Language 57: 544–69. [Google Scholar] [CrossRef] [Green Version]
- Gluszek, Agata, and John F. Dovidio. 2010. Speaking with a nonnative accent: Perceptions of bias, communication difficulties, and belonging in the United States. Journal of Language and Social Psychology 29: 224–34. [Google Scholar] [CrossRef]
- Goupil, Louise, Emmanuel Ponsot, Daniel Richardson, Gabriel Reyes, and Jean-Julien Aucouturier. 2021. Listeners’ perceptions of the certainty and honesty of a speaker are associated with a common prosodic signature. Nature Communications 12: 1–17. [Google Scholar] [CrossRef] [PubMed]
- Griffin, Zenzi M., and Kathryn Bock. 2000. What the eyes say about speaking. Psychological Science 11: 274–79. [Google Scholar] [CrossRef] [PubMed] [Green Version]
- Guyer, Joshua J., Leandre R. Fabrigar, and Thomas I. Vaughan-Johnston. 2019. Speech rate, intonation, and pitch: Investigating the bias and cue effects of vocal confidence on persuasion. Personality and Social Psychology Bulletin 45: 389–405. [Google Scholar] [CrossRef]
- Hanzlíková, Dagmar, and Radek Skarnitzl. 2017. Credibility of native and non-native speakers of English revisited: Do non-native listeners feel the same? Research in Language 15: 285–98. [Google Scholar] [CrossRef] [Green Version]
- Heldner, Mattias, and Jens Edlund. 2010. Pauses, gaps and overlaps in conversations. Journal of Phonetics 38: 555–68. [Google Scholar] [CrossRef]
- Heritage, John. 1984. Garfinkel and Ethnomethodology. Cambridge: Polity Press. [Google Scholar]
- Hui, Bronson, and Aline Godfroid. 2021. Testing the role of processing speed and automaticity in second language listening. Applied Psycholinguistics 42: 1089–115. [Google Scholar] [CrossRef]
- Igras-Cybulska, Magdalena, Bartosz Ziółko, Piotr Żelasko, and Marcin Witkowski. 2016. Structure of pauses in speech in the context of speaker verification and classification of speech type. EURASIP Journal on Audio, Speech, and Music Processing 18: 1–16. [Google Scholar] [CrossRef] [Green Version]
- Jiang, Xiaoming, and Marc D. Pell. 2017. The sound of confidence and doubt. Speech Communication 88: 106–26. [Google Scholar] [CrossRef]
- Kahng, Jimin. 2018. The effect of pause location on perceived fluency. Applied Psycholinguistics 39: 569–91. [Google Scholar] [CrossRef]
- Kendrick, Kobin H., and Francisco Torreira. 2015. The timing and construction of preference: A quantitative study. Discourse Processes 52: 255–89. [Google Scholar] [CrossRef]
- Kuznetsova, Alexandra, Per B. Brockhoff, and Rune H. B. Christensen. 2017. lmerTest Package: Tests in Linear Mixed Effects Models. Journal of Statistical Software 82: 1–26. [Google Scholar] [CrossRef] [Green Version]
- Lev-Ari, Shiri, and Boaz Keysar. 2010. Why don’t we believe non-native speakers? The influence of accent on credibility. Journal of Experimental Social Psychology 46: 1093–96. [Google Scholar] [CrossRef] [Green Version]
- Levelt, Willem. M. 1999. Producing spoken language: A blueprint of the speaker. In The Neurocognition of Language. Edited by Colin M. Brown and Peter Hagoort. Oxford: Oxford Press, pp. 83–122. [Google Scholar]
- Levinson, Stephen C. 1983. Pragmatics. Cambridge: Cambridge University Press. [Google Scholar]
- Levinson, Stephen C. 2016. Turn-taking in Human Communication–Origins and Implications for Language Processing. Trends in Cognitive Sciences 20: 6–14. [Google Scholar] [CrossRef] [PubMed] [Green Version]
- Levinson, Stephen C., and Francisco Torreira. 2015. Timing in turn-taking and its implications for processing models of language. Frontiers in Psychology 6: 731. [Google Scholar] [CrossRef] [Green Version]
- Linck, Jared A., Peter Osthus, Joel T. Koeth, and Michael F. Bunting. 2014. Working memory and second language comprehension and production: A meta-analysis. Psychonomic Bulletin & Review 21: 861–83. [Google Scholar]
- Lippi-Green, Rosina. 2012. English with an Accent: Language, Ideology, and Discrimination in the United States. London: Routledge. [Google Scholar]
- Lundholm-Fors, Kristina. 2015. Production and Perception of Pauses in Speech. Ph.D. dissertation, University of Gothenburg, Gothenburg, Sweden. [Google Scholar]
- Matzinger, Theresa, Nikolaus Ritt, and W. Tecumseh Fitch. 2020. Non-native speaker pause patterns closely correspond to those of native speakers at different speech rates. PLoS ONE 15: e0230710. [Google Scholar] [CrossRef] [PubMed] [Green Version]
- McGlone, Matthew S., and Jessica Tofighbakhsh. 2000. Birds of a feather flock conjointly (?): Rhyme as reason in aphorisms. Psychological Science 11: 424–28. [Google Scholar] [CrossRef]
- Nakagawa, Shinichi, and Holger Schielzeth. 2013. A general and simple method for obtaining R2 from generalized linear mixed-effects models. Methods in Ecology and Evolution 4: 133–42. [Google Scholar] [CrossRef]
- Nakane, Ikuko. 2007. Silence in Intercultural Communication. Amsterdam: John Benjamins. [Google Scholar]
- O’Connell, Daniel C., and Sabine Kowal. 1983. Pausology. In Computers in Language Research 2. Edited by Walter A. Sedelow and Sally Yeates Sedelow. New York: De Gruyter Mouton. [Google Scholar]
- Peltonen, Pauliina. 2017. Temporal fluency and problem-solving in interaction: An exploratory study of fluency resources in L2 dialogue. System 70: 1–13. [Google Scholar] [CrossRef]
- Peterson, Elizabeth. 2019. Making Sense of Bad English. London: Taylor and Francis. [Google Scholar]
- Pomerantz, Anita. 1984. Agreeing and Disagreeing with Assessments: Some Features of Preferred and Dispreferred Turn Shapes. In Structures of Social Action. Studies in Conversation Analysis. Edited by J. Maxwell Atkinson and John Heritage. Cambridge: Cambridge University Press, pp. 57–101. [Google Scholar]
- Pomerantz, A., and J. Heritage. 2013. Preference. In The Handbook of Conversation Analysis. Edited by Tanya Stivers and Jack Sidnell. Malden: Wiley-Blackwell, pp. 210–29. [Google Scholar]
- R Development Core Team. 2018. R: A Language and Environment for Statistical Computing. Vienna: R Foundation for Statistical Computing. [Google Scholar]
- Ramjattan, Vijay A. 2022. Accenting racism in labour migration. Annual Review of Applied Linguistics 42: 87–92. [Google Scholar] [CrossRef]
- Raupach, Manfred. 1980. Temporal variables in first and second language speech and perception of fluency. In Temporal Variables in Speech: Studies in Honour of Frieda Goldman-Eisler. Edited by Hans W. Dechert and Manfred Raupach. New York: De Gruyter Mouton, pp. 263–70. [Google Scholar]
- Reber, Rolf, and Norbert Schwarz. 1999. Effects of perceptual fluency on judgments of truth. Consciousness and Cognition 8: 338–42. [Google Scholar] [CrossRef]
- Roberts, Felicia, and Alexander L. Francis. 2013. Identifying a temporal threshold of tolerance for silent gaps after requests. The Journal of the Acoustical Society of America 133: EL471–EL477. [Google Scholar] [CrossRef] [PubMed] [Green Version]
- Roberts, Felicia, Piera Margutti, and Shoji Takano. 2011. Judgments concerning the valence of inter-turn silence across speakers of American English, Italian, and Japanese. Discourse Processes 48: 331–54. [Google Scholar] [CrossRef]
- Roessel, Janin, Christiane Schoel, and Dagmar Stahlberg. 2020. Modern notions of accent-ism: Findings, conceptualizations, and implications for interventions and research on nonnative accents. Journal of Language and Social Psychology 39: 87–111. [Google Scholar] [CrossRef]
- Rosa, Jonathan, and Nelson Flores. 2017. Unsettling race and language: Toward a raciolinguistic perspective. Language in Society 46: 621–47. [Google Scholar] [CrossRef] [Green Version]
- Sacks, Harvey. 1992. Lectures on Conversations. Oxford: Blackwell, vols. I and II. [Google Scholar]
- Sacks, Harvey, and Emmanuel Schegloff. 1973. Opening up Closings. Semiotica 7: 289–327. [Google Scholar]
- Schegloff, Emmanuel A. 2007. Sequence Organization in Interaction: A Primer in Conversation Analysis I. Cambridge: Cambridge University Press, vol. 1. [Google Scholar]
- Schielzeth, Holger, and Wolfgang Forstmeier. 2009. Conclusions beyond support: Overconfident estimates in Mixed Models. Behavioral Ecology 20: 416–20. [Google Scholar] [CrossRef]
- Stivers, Tanya. 2010. An overview of the question–response system in American English conversation. Journal of Pragmatics 42: 2772–81. [Google Scholar] [CrossRef]
- Stivers, Tanya, Nicholas J. Enfield, Penelope Brown, Christina Englert, Makoto Hayashi, Trine Heinemann, Gertie Hoymann, Federico Rossano, Jan Peter de Ruiter, Kyung-Eun Yoon, and et al. 2009. Universals and cultural variation in turn-taking in conversation. Proceedings of the National Academy of Sciences 106: 10587–92. [Google Scholar] [CrossRef] [Green Version]
- Suzuki, Shungo, Judit Kormos, and Takumi Uchihara. 2021. The relationship between utterance and perceived fluency: A meta-analysis of correlational studies. The Modern Language Journal 105: 435–63. [Google Scholar] [CrossRef]
- Tavakoli, Parvaneh. 2011. Pausing patterns: Differences between L2 learners and native speakers. ELT Journal 65: 71–79. [Google Scholar] [CrossRef]
- Timming, Andrew R. 2017. The effect of foreign accent on employability: A study of the aural dimensions of aesthetic labour in customer-facing and non-customer-facing jobs. Work, Employment and Society 31: 409–28. [Google Scholar] [CrossRef]
- Trouvain, Jürgen, Camille Fauth, and Bernd Möbius. 2016. Breath and Non-breath Pauses in Fluent and Disfluent Phases of German and French L1 and L2 Read Speech. Speech Prosody (SP8) 31: 31–35. [Google Scholar]
- Trzeciakowska, Julia. 2020. Non-Native English Speakers’ Attitudes Towards Polish-Accented English. Theoria et Historia Scientiarum 17: 77–94. [Google Scholar] [CrossRef]
- Tsalikis, John, Oscar W. DeShields Jr., and Michael S. LaTour. 1991. The role of accent on the credibility and effectiveness of the salesperson. Journal of Personal Selling and Sales Management 11: 31–41. [Google Scholar]
- Van Os, Marjolein, Nivja H. De Jong, and Hans Rutger Bosker. 2020. Fluency in dialogue: Turn-taking behavior shapes perceived fluency in native and nonnative speech. Language Learning 70: 1183–217. [Google Scholar] [CrossRef]
- Walker, Michael B., and Carmelina Trimboli. 1982. Smooth transitions in conversational interactions. The Journal of Social Psychology 117: 305–6. [Google Scholar] [CrossRef]
- Wardęga, Joanna. 2017. Chińczycy w Polsce–niewidoczna mniejszość. Studia Migracyjne-Przegląd Polonijny 2: 121–41. [Google Scholar]
- Wootton, Anthony J. 1981. The Management of Grantings and Rejections by Parents in Request Sequences. Semiotica 37: 59–90. [Google Scholar] [CrossRef]


| Estimate | SE | p | |
|---|---|---|---|
| Full model | |||
| Intercept | 60.38 | 2.66 | |
| PauseDuration_Long | −1.75 | 1.35 | 0.20 |
| Nativeness_Nonnative | −10.83 | 3.47 | 0.01 |
| PauseDuration_Long:Nativeness_Nonnative | −0.67 | 1.91 | 0.73 |
| Reduced model excluding the interaction effect | |||
| Intercept | 60.55 | 2.61 | |
| PauseDuration_Long | −2.08 | 0.96 | 0.03 |
| Nativeness_Nonnative | −11.16 | 3.33 | 0.01 |
| Estimate | SE | p | |
|---|---|---|---|
| Full model | |||
| Intercept | 71.46 | 3.08 | |
| PauseDuration_Long | −3.82 | 1.25 | 0.002 |
| Nativeness_Nonnative | −20.54 | 4.29 | 0.002 |
| PauseDuration_Long:Nativeness_Nonnative | 1.10 | 1.77 | 0.534 |
| Reduced model excluding the interaction effect | |||
| Intercept | 71.18 | 3.04 | |
| PauseDuration_Long | −3.27 | 0.88 | <0.001 |
| Nativeness_Nonnative | −19.99 | 4.19 | 0.002 |
| Full Model | Estimate | SE | p |
|---|---|---|---|
| Intercept | 64.47 | 3.43 | |
| PauseDuration_Long | −10.75 | 1.03 | <0.001 |
| Nativeness_Nonnative | −4.19 | 4.67 | 0.399 |
| PauseDuration_Long:Nativeness_Nonnative | 10.23 | 1.45 | <0.001 |
| Percentage of Participants | |
|---|---|
| Noticed differences in pause duration | 65.0 |
| Reported that pause duration influenced their knowledge and confidence ratings | 53.0 |
| Reported that pause duration influenced their willingness ratings | 44.0 |
| Reported that the speakers’ accent influenced their overall ratings | 53.0 |
| Reported that other factors influenced their ratings | 50.0 |
Disclaimer/Publisher’s Note: The statements, opinions and data contained in all publications are solely those of the individual author(s) and contributor(s) and not of MDPI and/or the editor(s). MDPI and/or the editor(s) disclaim responsibility for any injury to people or property resulting from any ideas, methods, instructions or products referred to in the content. |
© 2023 by the authors. Licensee MDPI, Basel, Switzerland. This article is an open access article distributed under the terms and conditions of the Creative Commons Attribution (CC BY) license (https://creativecommons.org/licenses/by/4.0/).
Share and Cite
Matzinger, T.; Pleyer, M.; Żywiczyński, P. Pause Length and Differences in Cognitive State Attribution in Native and Non-Native Speakers. Languages 2023, 8, 26. https://doi.org/10.3390/languages8010026
Matzinger T, Pleyer M, Żywiczyński P. Pause Length and Differences in Cognitive State Attribution in Native and Non-Native Speakers. Languages. 2023; 8(1):26. https://doi.org/10.3390/languages8010026
Chicago/Turabian StyleMatzinger, Theresa, Michael Pleyer, and Przemysław Żywiczyński. 2023. "Pause Length and Differences in Cognitive State Attribution in Native and Non-Native Speakers" Languages 8, no. 1: 26. https://doi.org/10.3390/languages8010026