Article

Linguistic Diversity, Multilingualism, and Cognitive Skills: A Study of Disadvantaged Children in India

1
Theoretical and Applied Linguistics Section, Faculty of Modern and Medieval Languages & Linguistics, University of Cambridge, Cambridge CB3 9DA, UK
2
Department of Linguistics, University of Konstanz, Konstanz 78457, Germany
3
School of Psychology & Clinical Language Sciences, University of Reading, Reading RG6 6AL, UK
4
Department of Neurology, National Institute of Mental health and Neuro Sciences (NIMHANS), Bengaluru, Karnataka 560029, India
5
School of Social Sciences, Jawaharlal Nehru University, New Delhi, Delhi 110067, India
*
Author to whom correspondence should be addressed.
Languages 2020, 5(1), 10; https://doi.org/10.3390/languages5010010
Submission received: 16 February 2020 / Revised: 6 March 2020 / Accepted: 12 March 2020 / Published: 16 March 2020

Abstract

:
Multilingualism and linguistic diversity are the norm in India. Although studies have shown a relation between bilingualism and cognitive gains, linguistic diversity has so far been ignored as a potential factor affecting cognitive skills. This study aims to fill this gap by examining how cognitive skills—as measured by the n-back and Raven’s Colored Progressive Matrices tasks—are affected by multilingualism and/or sociolinguistic diversity in a large cohort of socioeconomically disadvantaged primary school children in two urban sites of India: Delhi and Hyderabad. We present a questionnaire estimating sociolinguistic diversity and show that this measure assesses a distinct construct, as compared to a child’s multilingualism. Children were classified as growing up monolingually or bilingually, depending on whether they grew up with one or more languages in the home. Regarding cognitive performance, bilinguals were found to outperform monolinguals on the n-back task, as well as on the Raven’s task. In addition, a socially and linguistically diverse environment seems to enhance cognitive performance for children who are not multilingual themselves. Finally, several contextual factors such as city were found to influence cognitive performance. Overall, this shows that cognitive tasks are subject to contextual effects and that bilingualism and linguistic diversity can enhance cognitive performance of children in disadvantaged contexts.

1. Introduction

Language and cognitive development interact in numerous ways from birth onwards. In monolingual learners, early cognitive skills are necessary for vocabulary development (e.g., Clark 2004), while language abilities are similarly important for the development of cognitive skills such as theory of mind (De Villiers 2007) and verbal reasoning (Gentner and Loewenstein 2002). In bilingualism, much recent research has focused on the impact of dual language development and use on cognition, revealing conflicting or null results across studies (Engel de Abreu et al. 2012; Sanchez-Azanza et al. 2017; Paap et al. 2017). However, research on multilingualism and cognitive effects is sparse, possibly due to the assumption that multilingualism is cumulative bilingualism, in the sense that more languages entail more switching costs and, by extension, have similar effects on cognition in the multilingual speaker. Since bilingualism and multilingualism are forms of language experiences, it is essential to evaluate how these experiences affect an individual’s linguistic and cognitive profile. In research on child bilingualism, there has been considerable progress in how to measure language experience, understood as quantity and quality of input and output in each of the child’s languages (Byers-Heinlein et al. 2019; Bedore et al. 2012; Unsworth 2013). In these measures, quantifying and qualifying language practices at home and the school, depending on the child’s age, are of primary importance. Assuming multilingualism to be an extension of bilingualism, we would expect that the same measures (adding one or two languages to the questions included), should suffice to profile the multilingual speaker and understand possible effects on their linguistic and cognitive skills. Despite the soundness of this assumption, some considerations have been left unexplored. First, linguistic diversity at the societal level may or may not translate as multilingualism at the individual level. For instance, a child may be surrounded by speakers of different languages, but may not be proficient enough to use most or any of these languages themself. ‘Knowledge’ in this case, is mostly awareness of diversity, while the actual linguistic, receptive, or productive skills of the individual may vary along a continuum from zero to full ability. Non-western multilingual societies such as India present a case in point: The language experience of an Indian child cannot ignore contextual linguistic diversity as instantiated in the community, the school, and the home environment to which the child is exposed. Linguistic diversity can play as an important role as language input for the child growing up in a multilingual society—and crucially, shapes the child’s understanding of the role of language(s) in the socio-cultural context, their sensitivity to sociolinguistic variation, and the precocious development of metalinguistic skills (Ochs and Schieffelin 2008; Mohanty 2019). Although studies have shown that proficiency in each of the bilingual’s languages is crucial for cognitive gains, especially in the domain of metalanguage (Pattanaik 2004; Pattanaik and Mohanty 1984; Bialystok 2013), contextual linguistic diversity has so far been ignored as a potential factor affecting cognitive skills in the individual. This study aims to fill this gap by examining how cognitive skills are affected by multilingualism and/or sociolinguistic diversity in a large cohort of socioeconomically disadvantaged primary school children in two urban sites of India, Delhi, and Hyderabad.

1.1. The Indian Context

Multilingualism in India is the norm, as is linguistic diversity, with close to one thousand indigenous languages belonging to four major language families. Of these, the Indo-Aryan and Dravidian families include the languages spoken by 95% of the population (1971, Census data reported in Vasanta et al. 2010). According to the People’s Linguistic Survey of India (http://www.peopleslinguisticsurvey.org/) launched by Devy in 2010, there are 780 different languages in India, many of which are endangered1. Most recently, Ethnologue suggests the number of different languages is lower, and stands at 462 (Simons and Fennig 2018). This linguistic diversity has been a major consideration by state and central governments in relation to education and national policies, as well as in relation to the role of English as a language of power. English is strongly supported by state policies, especially in cases where conflicts between different language groups are resolved through a commonly accepted choice of English as the medium of instruction (Mohanty et al. 2009; Mohanty 2019). Parents and teachers acknowledge and support the role of English, with parental preferences being particularly strong for English-medium instruction curricula. This multilingual diversity presents both opportunities and challenges to the education system, given the huge population and frequently limited resources.
In urban areas such as in New Delhi and Hyderabad where this study was conducted, the percentage of minority speakers is overall smaller than in rural areas such as Bihar, where the number of minority speakers is over 50%, speaking 48 different mother-tongues (1971 census data, Bihar). However, urban slums—where 17% of urban citizens in India live—include a large number of internal migrants who may speak other mother-tongues, or varieties of the regional language. Urban slums are settlements with inadequate access to safe water, sanitation and infrastructure, poor structural quality of housing, overcrowding, and insecure residential status. School attendance rates for children living in Delhi slums is around 54%, compared to attendance ratios in Delhi schools overall, which was 90% in 2004 (Tsujita 2009). As reported in the same study, around 73% of slum children attending Std I in Delhi schools are over-aged, for reasons related to school capacity and administrative issues increasing structural inequalities and affecting education quality. Over-aged children bring challenges and benefits to the classroom though (Alcott and Rose 2017).
A key factor affecting learning outcomes is social class. More specifically, socio-economic status (SES) is one of the crucial factors influencing children’s cognitive performance (Brito and Noble 2014; Ghosh et al. 2015; Burneo-Garcés et al. 2019), and children of low SES are more likely to underperform than children from more affluent middle-class families. Although middle class children in India are more likely to attend private schools, as pointed out by the ASER 2016 report (Pratham 2017), the differences between children’s performance in government schools and private schools cannot necessarily be attributed to differences in the effectiveness of these two school types, because they may also be due to the interplay of a wide range of other variables, including SES (Alcott and Rose 2017). There are several indicators of SES, such as parental education, income, occupation, facilities at home and in the neighborhood, sanitation, as well as nutritional and psychological wellbeing (Hackman et al. 2010; Brito and Noble 2014; Roy et al. 2018). Children from low-SES backgrounds often suffer from lack of nutrition, poor housing facilities, and lack of parental care and cognitive stimulation at home (Petrou and Kupek 2010; Walker et al. 2011). This, in turn, is associated with poor learning outcomes in children in terms of school skills, language (see Pace et al. 2017 for a review), and cognitive development (Alcott and Rose 2017; Cunha and Heckman 2008; Fernald et al. 2012; Hackman and Farah 2009; Kelly et al. 2011; Noble et al. 2005; Paxson and Schady 2007). For example, it has been found that children (aged 8–11) from high/middle SES performed better than low-SES children on language, memory, and executive function tasks—namely, working memory, cognitive flexibility, and inhibition (Aran-Filippetti and Richaud de Minzi 2012; Arán-Filippetti 2013). Similar results were obtained by a study in Ecuador, where 7 to 11-year-old middle-SES children outperformed low-SES children on memory, language, and executive function tasks (Burneo-Garcés et al. 2019). Since poor performance of children from low-SES backgrounds has been attributed to low parental education and lack of parental stimulation (Hamadani et al. 2014; Petrou and Kupek 2010; Walker et al. 2011), the relationship between SES and cognitive development may be especially relevant for children from developing countries (Ursache and Noble 2016).
In the western context, it is well-established that there is a disparity in children’s learning outcomes due to differences in SES (Carneiro and Heckman 2002, 2003; Noble et al. 2005; Jerrim and Vignoles 2013). This is also evident in middle-income developing countries such as India and Pakistan. Aslam et al. (2019) examined the influence of SES on learning outcomes in 1683 children aged 8–12 years studying in government schools in Pakistan. They used an index of household assets as a measure of SES, which was comprised of questions relating to whether their house had a table, chair, radio, stove, mobile phone, color television, bicycle, motorbike, car, fridge, or water facility in the house, as well as the construction material used to build their house. The results indicate that SES was a significant predictor for improved performance in literacy, but not numeracy in an academic year. In the Indian context, more than 50% of children in Grade 5 are unable to read a Grade 2 text (Pratham 2014), and the learning outcomes in schools are lagging by 2 grades (Bhattacharjea et al. 2011). There is a disparity in access to primary school education in India, with children from middle- and high-income homes opting for private schools, and children from low-income families opting for government schools (Agrawal 2014; Alcott and Rose 2015; Pratham 2017). There are differences between government and private schools which contribute to the disparity in learning, but it is important to consider other factors, such as SES, which may also negatively influence learning outcomes. Children of low SES usually tend to enroll in government schools which have very little funding; these children also do not receive enough parental support at home. Their exposure to print is almost absent—or restricted only to marketplaces (Tsimpli et al. 2019). Therefore, there is an urgent need to understand the factors affecting learning outcomes in children coming from disadvantaged backgrounds.
One of the aspects that may positively influence the learning outcomes of low-SES children in India is multilingualism, as India provides a strong multilingual societal context. Numerous studies have examined the potential advantage of bi- or multilinguals over monolinguals when it comes to cognitive performance (see Bialystok 2009, for an overview). Executive functioning, in particular, seems to be enhanced in bilinguals (e.g., Bialystok et al. 2004; Bialystok 2009; Costa et al. 2008; Soveri et al. 2011a), although effects are not always replicated (Colzato et al. 2008; Costa et al. 2009; Paap and Greenberg 2013). It has been suggested that these inconsistencies in research outcome may depend on external factors, such as the population under investigation (Hansen et al. 2016). Therefore, it is unknown if multilingual children in India from low-SES backgrounds also experience the cognitive advantages associated with multilingualism in other contexts. In addition, it is unknown whether the linguistically diverse environment in which children in India grow up provides any cognitive advantages independent of the multilingualism of a child.

1.2. Multilingualism and Cognition

To investigate the potential cognitive advantages of multilingual children in India, the children’s cognitive skills in our study were assessed with both the Raven’s Coloured Progressive Matrices task and the n-back task. Raven’s Coloured Progressive Matrices (Raven et al. 2008) is a frequently used measure of general, or fluid intelligence. We were specifically interested in whether linguistic diversity and multilingualism were related to a child’s fluid intelligence. The task is frequently used with children (e.g., Belacchi et al. 2010; Cotton et al. 2005; Torregrossa et al. 2019; Weichbold and Herka 2003; Weyandt and Willis 1994) from as early as age 4 (Raven 2012). Although similar tests have traditionally been considered as culture-independent (Cattell 1940; Cattell and Cattell 1963), a cross-cultural meta-analysis of Raven’s Progressive Matrices (three types, Advanced, Colored, and Standard Progressive Matrices, Raven 1938, 1956) showed that performance of the task can be influenced by “country-level indicators of educational permeation”, as well as number of years of education (Brouwers et al. 2009, p. 330). Thus, it seems that fluid intelligence—or at least performance on the Raven’s task—is subject to contextual effects. Nevertheless, the relation between multilingualism and performance on the Raven’s task remains unclear. Jarvis et al. (1995) found no relationship between degree of bilingualism and Raven’s scores in adults. Research from Bialystok’s lab reports no difference between monolinguals’ and bilinguals’ Raven’s scores in children (Bialystok and Shapero 2005) or younger or older adults (Bialystok et al. 2004). In contrast, Diaz (1985) found a positive correlation between degree of bilingualism and Raven’s scores in low-proficiency kindergarten-age bilingual children (but not in high-proficiency children). Other studies have also found evidence of bilingual children outperforming monolinguals on the Raven’s task (Mohanty and Das 1987; Peal and Lambert 1962).
In addition to the Raven’s task, the n-back task was also administered. The n-back task (Kirchner 1958; Mackworth 1959; Moore and Ross 1963) is a common measure of working memory that has frequently been used with school-aged children (e.g., Ciesielski et al. 2006; López-Vicente et al. 2016; Scudder et al. 2014; Vuontela et al. 2003), children with developmental disorders (Epstein et al. 2011; López-Vicente et al. 2016), and children with traumatic brain injury (Levin et al. 2002). As the task involves updating of task-relevant information through executive functioning (Cohen et al. 1997; Miyake et al. 2000), it may be expected to be influenced by bilingualism. Little has been reported about potential cultural or contextual effects on the n-back, but neither frequency of language switches in everyday life, nor age of acquisition in the second language (L2) (Soveri et al. 2011b), nor bilingualism in general (Moradzadeh et al. 2015; Yow and Li 2015) seem to influence n-back performance in adults, although effects of bilingualism have been found in high-conflict versions of the tasks (Teubner-Rhodes et al. 2016). In contrast, positive effects of bilingualism on n-back performance have been found in children, but only for younger children around age 7 and 8 in L2-immersion schools (Hansen et al. 2016).
Generally, it is quite well-documented that SES has a negative influence on learning outcomes across the globe. It is also generally assumed that bilingualism has a positive influence on certain aspects of cognition, specifically in the non-verbal domain. However, there is a dearth of studies in the Indian context that capture the effects of sociolinguistic diversity and multilingualism on cognitive performance in children from low-SES backgrounds. Therefore, the current study focuses on examining the influence of linguistic diversity, multilingualism, and SES on a large sample of primary school children from government schools in India. The participating children in our study are from low-SES homes, living in slum or non-slum areas, and are all disadvantaged and deprived with respect to housing facilities, lack of parental education/stimulation at home, water facilities, lack of additional literacy support, etc., and are studying in government schools. Although all the children are from underprivileged contexts, there is still some amount of variability in their SES, as well as variability in their multilingualism and linguistic diversity in their daily context. To capture this, we developed questionnaires, each containing a series of questions addressing different aspects of multilingualism, linguistic diversity, and SES. Using the outcomes of these questionnaires as proxies, we investigate the relationship between linguistic diversity, multilingualism, and cognitive skills in disadvantaged children in India. Specifically, we formulated the following research questions:
  • How can we quantify the distinction between multilingualism in the individual and the linguistically and culturally diverse environment of children in Indian primary government schools?
  • Is there a relationship between bilingualism and/or sociolinguistic diversity and cognitive skills?
  • To what extent do socio-economic status, medium of instruction, and other demographic variables correlate with cognitive skills?
Our hypothesis with regard to question 2 was that bilingualism and linguistic diversity will influence cognitive performance. Although a certain degree of correlation between the two constructs is expected, we assume that in a multilingual, highly linguistically diverse country such as India, the constructs may be distinguished and hence, contribute independently to children’s cognitive profiles. Regarding SES, following several studies showing a link between SES and cognitive development, we expect differences among participants that are related to variation in SES, despite the overall disadvantaged background of our cohort. Finally, again following studies indicating that fluid intelligence can be affected by contextual factors, we hypothesize that differences in medium of instruction across schools in the two urban sites may be found.

2. Materials and Methods

2.1. Participants

694 children from the Indian cities of Delhi and Hyderabad participated in the study during school hours. All children attended Year 4 (Standard 4) in Government primary schools. The schools had either the regional language (Hindi or Telugu) or English as an official medium of instruction, and were in either slum or non-slum areas of the city. Formal written consent was obtained from the principal or head teacher of all 28 participating schools, as well as the children participating in the study. The study was conducted in accordance with the Declaration of Helsinki, the ESRC’s Framework for Research Ethics (ESRC 2010), and the guidelines of the Indian Council for Medical Research (ICMR 2006). The protocol was approved by the Ethics Committee of the University of Cambridge (RG83665), the Ethics Committees of Jawaharlal Nehru University, and the National Institute of Mental Health and Neurosciences.
Children were classified as growing up monolingually or bilingually, depending on whether they were growing up with one or more languages in the home. Children with any reading difficulty based on reports from the teachers were excluded from the study. Seven children who performed below chance level (scored below zero; see Scoring section) on the n-back task were excluded because they did not display an understanding of the task. A demographic overview of the remaining children is presented in Table 1.

2.2. Methods

The children completed a number of experimental cognitive tasks and questionnaires. The tasks were administered by research assistants from India who were proficient in both the regional language (Hindi/Telugu) and English. The cognitive tasks consisted of the Raven’s Coloured Progressive Matrices (henceforth Raven’s task; Raven et al. 2008) as a measure of general intelligence, and a 2-back task (a variant of the n-back task; Kirchner 1958) as a measure of working memory. The questionnaires consisted of questions about linguistic diversity, bilingualism, and SES.
The Raven’s task (Raven et al. 2008) is a non-verbal task that consists of 36 multiple-choice exercises in which the participant is asked to identify one of six possible pieces that matches with a given pattern. The task is of increasing difficulty. It was presented to children as pictures on a laptop, and children were asked to identify the correct piece by either pointing to it or reporting its number. The Raven’s task is widely used as a measure of general/fluid intelligence. The fact that it is non-verbal makes it an appropriate task for our sample population of (often multilingual) children; a standardized version has been developed for the Indian population (Raven’s Educational CPM/CVS (India); Raven 2012).
The 2-back task (Kirchner 1958) is a task that requires participants to monitor a sequence of characters (we used digits rather than letters), and determine whether the presented digit matches the digit that was presented 2 digits back. The task was presented to children on a laptop using PsychoPy (Peirce 2007). If the currently presented digit was indeed identical to the digit that was presented 2 digits back, the child should have responded with a key press (key ‘J’). If the presented digit did not match the digit that was presented 2 digits back, the child should not have pressed a key. Digits were presented on the screen for 500 ms each and were separated by a blank slide that was displayed for 2500 ms. The task consisted of 60 digits in total, of which 20 matched the digit that was presented 2 digits back (hits), which should have been responded to with a key press, and 40 did not match the digit that was presented 2 digits back (false alarms). The 2-back task is widely accepted as a measure of working memory required to store each digit temporarily, the updating of working memory when removing digits that are no longer relevant, and the inhibition of irrelevant digits (e.g., Morris and Jones 1990; Miyake et al. 2000).
The child questionnaires were adapted from previous studies with bilinguals by Kaltsa et al. (2019) and Rothou and Tsimpli (2017). Regarding bi/multilingualism, children were asked which languages were spoken at home by their parents, siblings, or other relatives and best friends—and in which languages they use to respond. Importantly, these questions relate to the number of different languages used by the child, and to the child, in the home/private environment, and not in the school environment. In addition, social and sociolinguistic diversity was investigated. This part of the questionnaire asked the child for the number of different individuals with whom they had regular interactions within the context of school, family, or the community (e.g., the marketplace). For each of these interactions, the children were asked to report the gender and age of the person with whom they interacted and the language(s) the child knew this person spoke. Although some overlap with the measure of monolingualism or bilingualism at home was expected, the sociolinguistic diversity questions provided information additional to the language(s) the child used at home. Note that the different languages the child reported in the sociolinguistic diversity questionnaire needed not be languages that the child spoke, but languages that the individuals interacting with the child had, of which the child was aware.
The socio-economic status of the children was investigated through a child questionnaire specially developed for this population of Indian children that had an exclusive section on home activities and parents’ work. It included questions about their parents’ income, number of rooms in the child’s home, number of gadgets at home (gadgets being a TV and phone, but also a fridge, cooler, fan etc.), whether they have a drinking water tap in their home or water had to be collected from outside the house, whether they did chores at home, and whether they spent any time doing homework. We obtained information about parent’s occupation in the same questionnaire, but there was low variability (around 4 out of 5 working mothers were working as maids and fathers were working as laborers).

2.3. Scoring

The Raven’s task was scored based on the raw scores, i.e., the number of correct answers that a child gave for the 36 questions in total. Although the standard scores were developed from the Indian population (Raven 2012), they are based on children from upper-middle class families that attend English-medium (often private) schools, thus may not be representative of our sample of low-SES children. Therefore, we performed all analyses relating to the Raven’s task with the raw scores, with lower scores reflecting poorer performance.
For the 2-back task, a composite score (A’ or A-prime, first introduced by Pollack and Norman 1964) was calculated based on participants’ hit rates and false-alarm rates (according to the A scores in Zhang and Mueller 2005). This is a common way to measure non-parametric sensitivity in detection tasks such as the 2-back task. A higher A’ score indicates that a participant was better able to perform the task in general, with fewer misses and wrong key presses; an A’ score above zero means that the participant was able to discriminate hits from false alarms and thus able to perform the task properly (above chance).
Regarding bilingualism, children were categorized as bi/multilingual if they had more than one language in their home environment. No additional distinctions were made based on the number of additional languages. Importantly, this measure does not provide information about the fluency of a child in the second language or the amount of exposure to it. It does presuppose, however, that the child could speak and understand these home languages.
Sociolinguistic diversity was calculated as a composite score based on the child questionnaire section. Specifically, the three sections that the questionnaire included with regard to the age, gender and language profile of the individuals with whom the child interacted regularly in school, within the family, and in the community (e.g., the market place) were each was graded as follows:
  • 1 point if the conversational partner was of the same gender vs. 2 points if the partner was of a different gender;
  • 1 point if the conversational partner was of the same age, 2 points if the conversational partner was of a different age, and 3 points if there were conversational partners of both the same and a different age;
  • 1 point if the interactions were in the same language as the child’s home language vs. 2 points if the interactions were in a different language.
If there was no conversational partner mentioned in a certain section, children would not receive any points. The children could thus receive a minimum of 0 points and a maximum of 7 points for each section, making a total maximum score of 21 points, with a higher score reflecting more sociolinguistic diversity.
The children’s socio-economic status score was calculated as a composite score from the different questions on the questionnaire. Specifically, the children received:
  • 1 point for income when only one parent worked vs. 2 points when both parents worked;
  • 1 point when their house had 1 room vs. 2 points when their house had two or more rooms;
  • 1 point when they had 1 gadget at home, 2 points when they had 2 gadgets at home, and 3 points when they had 3 or more gadgets at home;
  • 1 point when they had tap water in the house vs. 0 points when they did not;
  • 1 point when they did no chores at home vs. 0 points when they did;
  • 1 point when they did homework after going back home vs. 0 point when they did not;
This added up to a total score between 3 and 10 points, reflecting a range of socio-economic statuses, with a higher score reflecting a higher status. Recall however, that all children in our study are of low SES.

2.4. Analysis

The internal consistency of our questionnaires for sociolinguistic diversity and SES was calculated as Cronbach’s α using the ‘psych’ package in R (Revelle 2019). The influence of these measures on performance on the cognitive tasks was examined with linear models in R. Since we are interested in influence of sociolinguistic diversity, bilingualism, and SES on cognitive skills, the two cognitive tasks (Raven’s and 2-back) were taken as dependent variables in the analyses, and all additional variables (bilingualism in the home, sociolinguistic diversity score, SES score, age, gender, city, medium of instruction, and school site) were taken as independent variables. All variables with multiple levels (as opposed to numerical variables) were coded using effect coding. Models were constructed testing the influence of specific independent variables on the cognitive skills, based on the research questions. The models containing demographic variables were simplified in terms of removing independent variables when model comparisons revealed that these variables did not significantly improve the model fit. For post-hoc analyses, the data set was split into monolinguals at home and bilinguals at home, as well as into children from Delhi and children from Hyderabad. The relative effect sizes of significant main effects were calculated using Cohen’s (‘effsize’ package in R; Torchiano 2019). In addition, the relationship between the different dependent variables (i.e., the possible correlation between Raven’s and 2-back) and between the different independent variables (e.g., the possible correlation between SES score and sociolinguistic diversity score) in the form of correlation matrices were computed with the same software.

3. Results

The results are discussed by research question below.

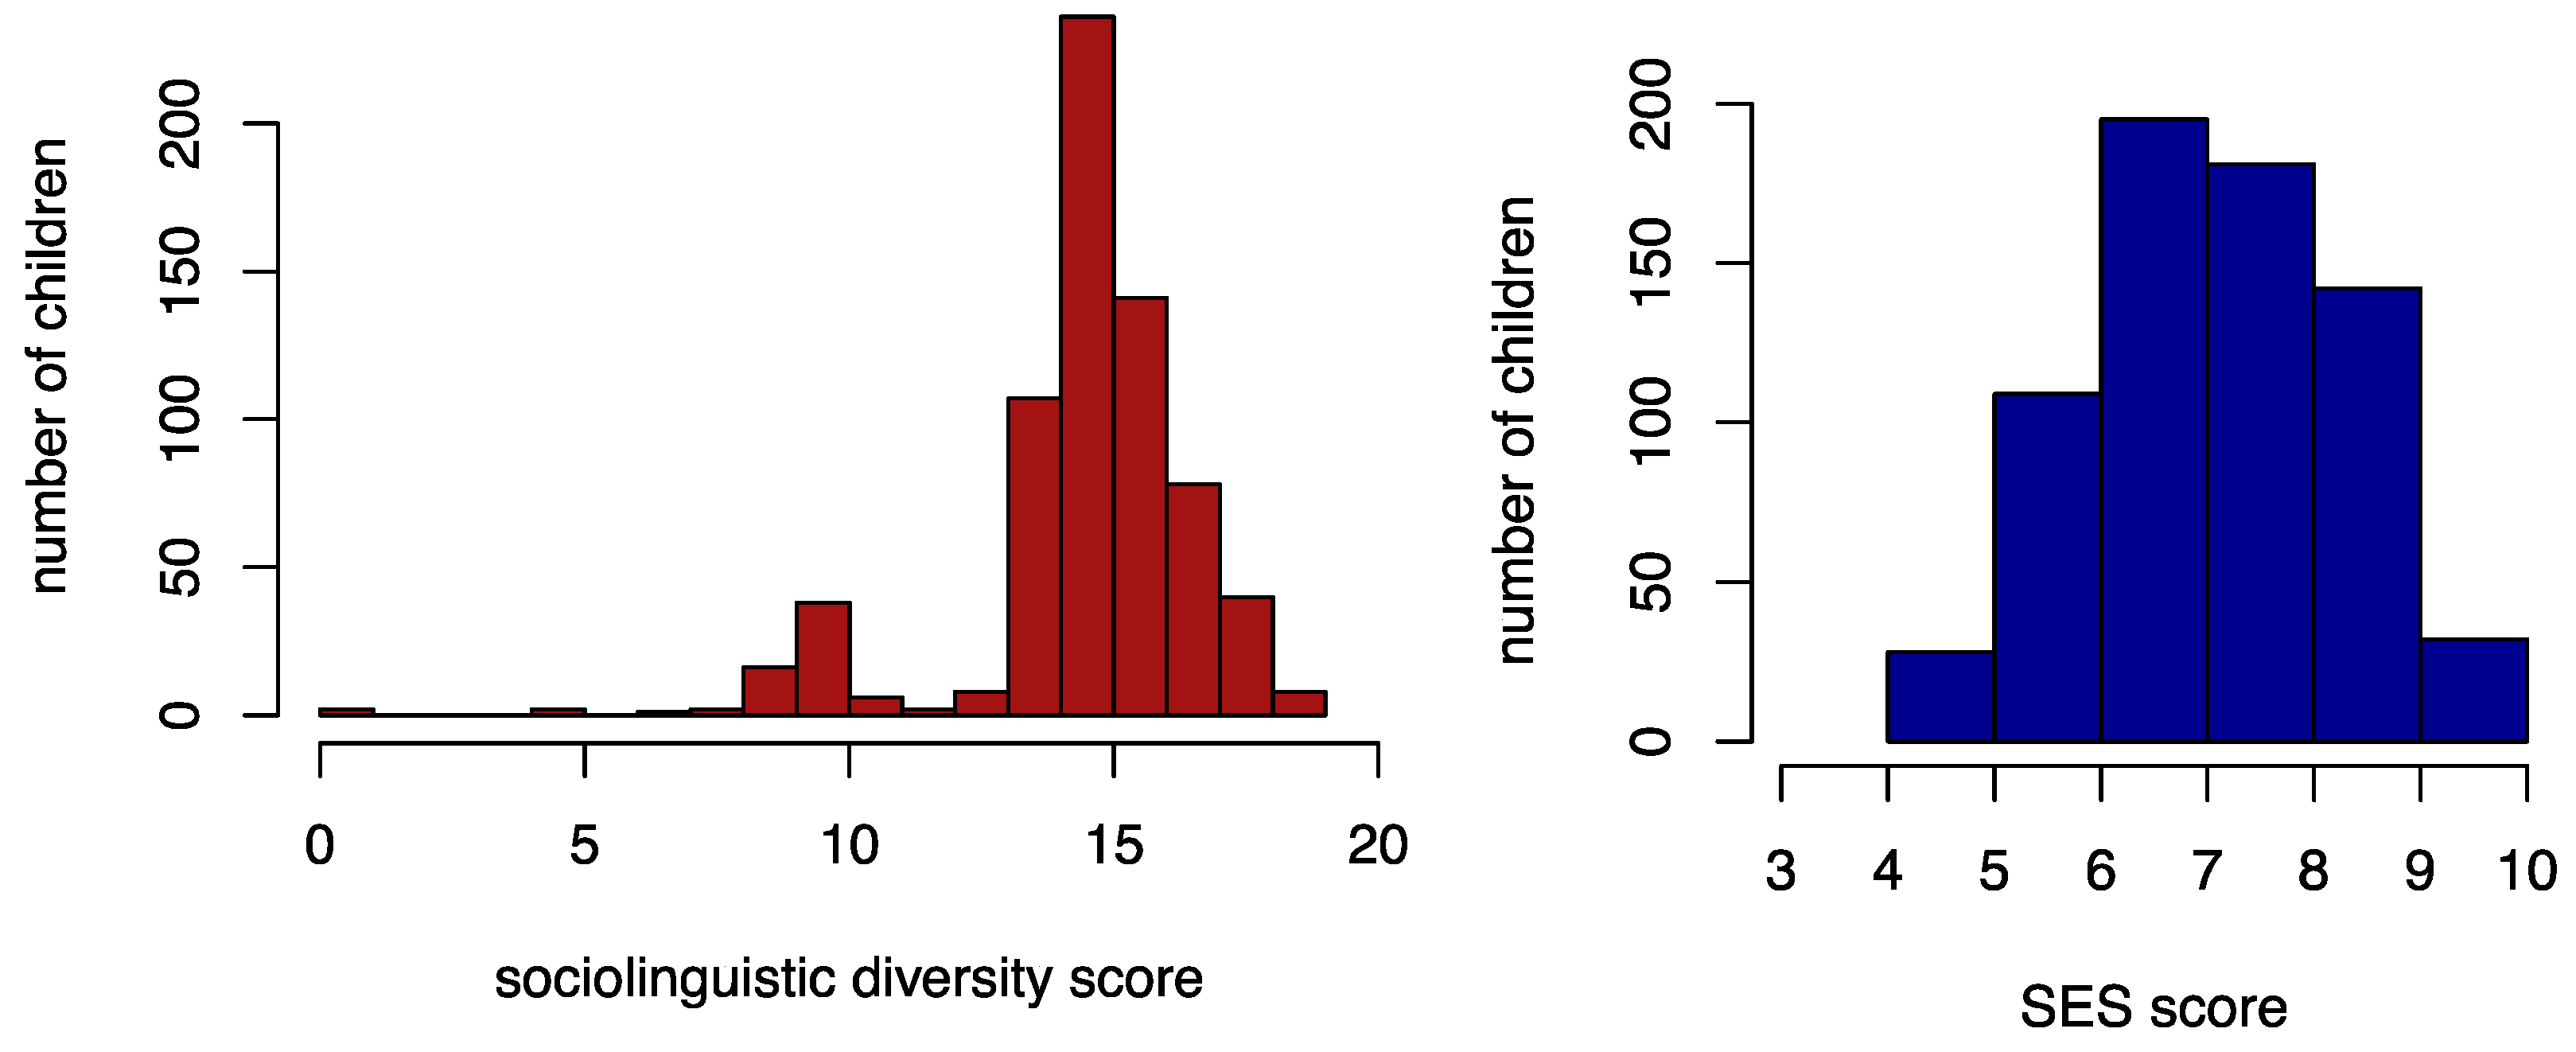
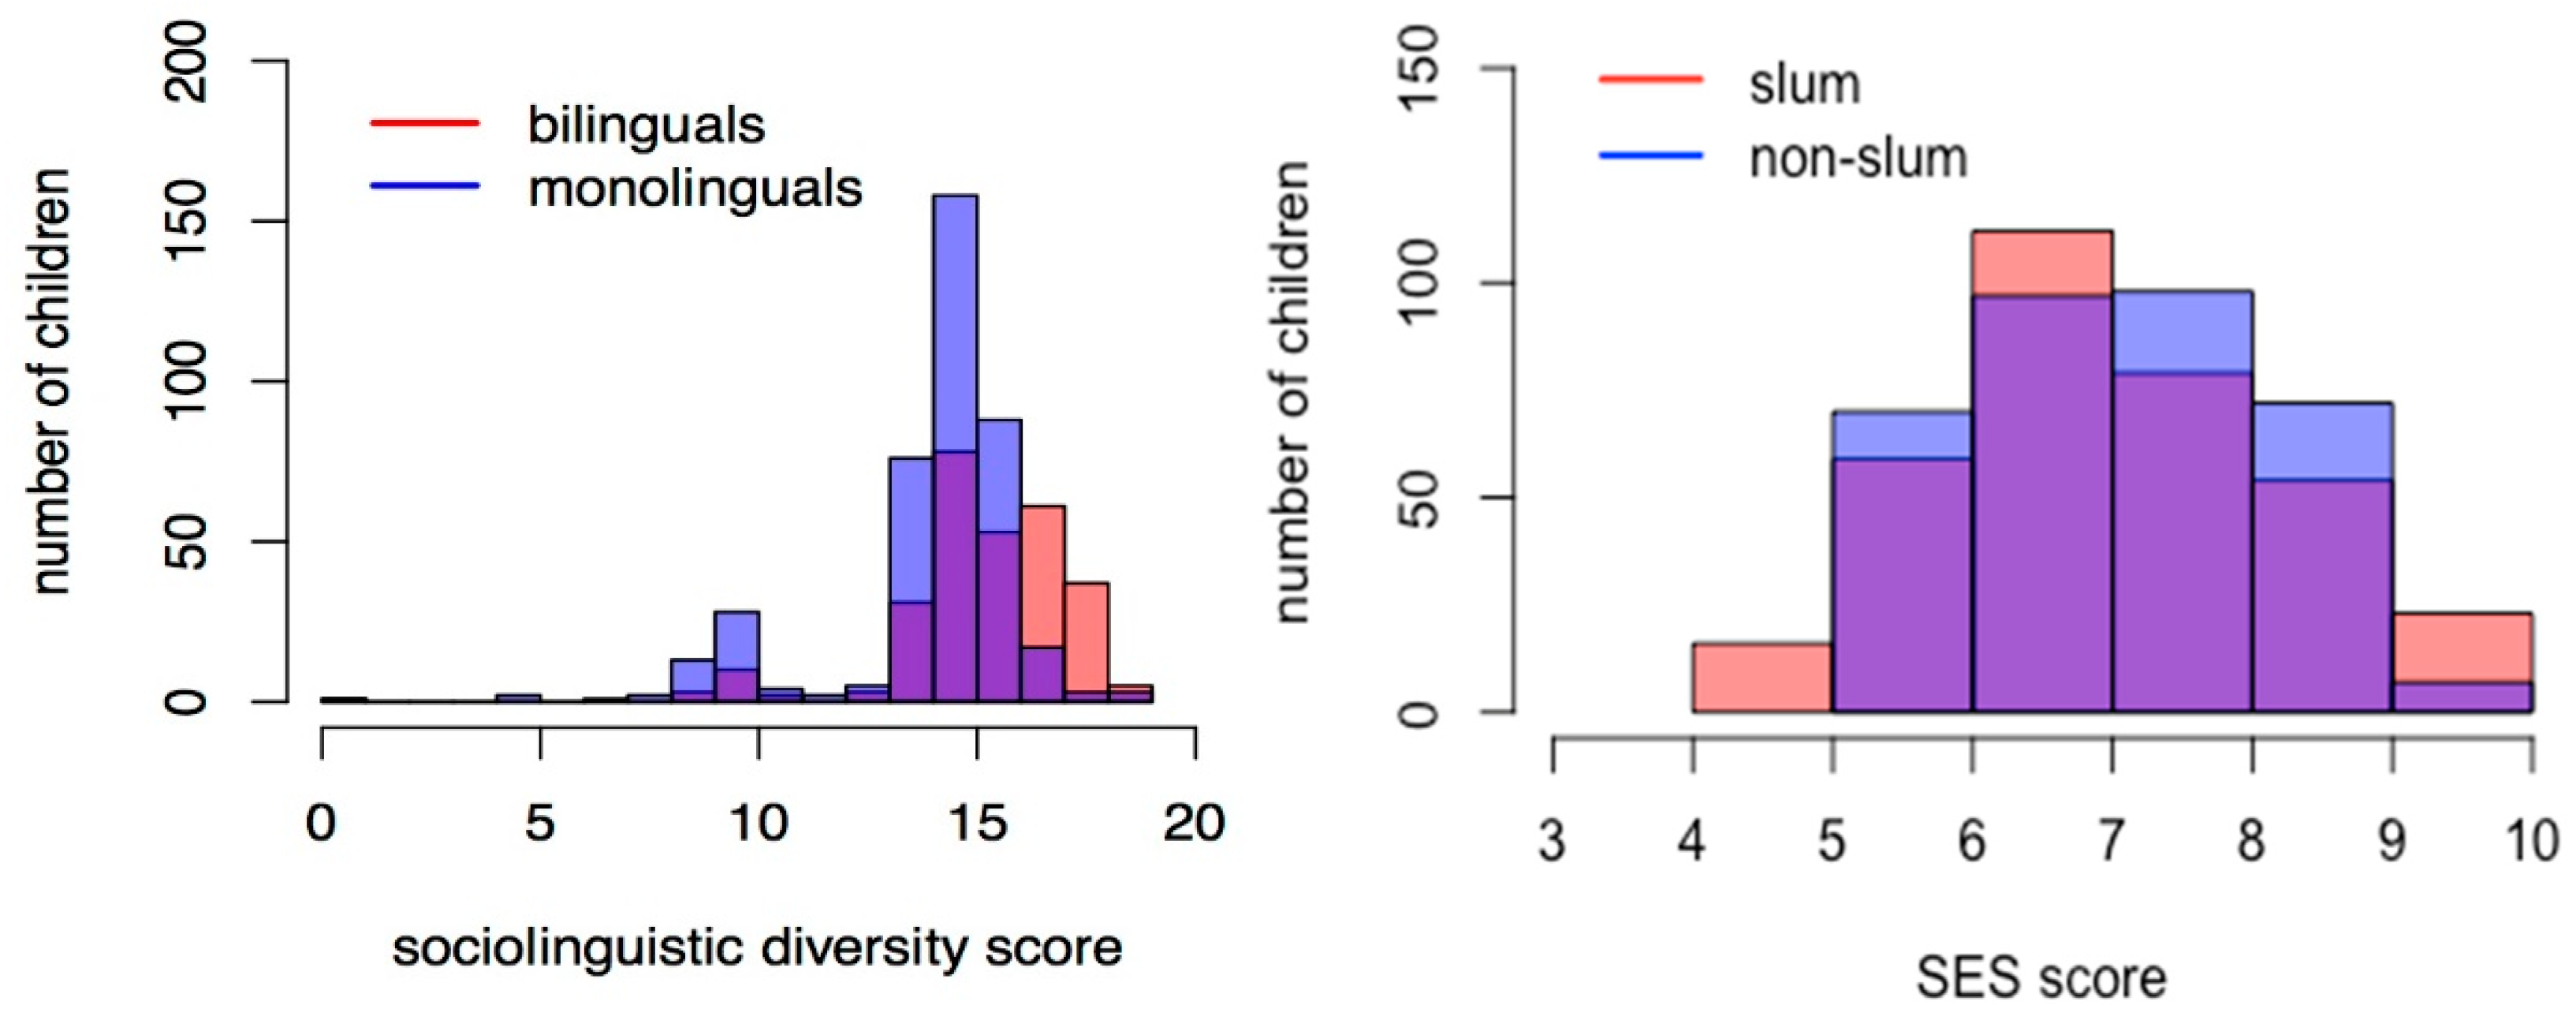
3.1. How Can We Quantify the Distinction between Multilingualism in the Individual and the Linguistically and Culturally Diverse Environment of Children in Government Primary Schools in India?

The scores of the children on the different tasks and questionnaires are listed in Table 2. The children’s scores on bilingualism, on sociolinguistic diversity, and on SES are discussed in more detail in this section. Approximately 41% of the children in the study were bilingual or multilingual, based on the presence of more than one language in their home environment. The distribution of the children’s scores on sociolinguistic diversity and SES are presented in Figure 1. These graphs show that for both measures, the children show a distribution over the higher ranges of the scores, with most children having a sociolinguistic diversity score between 9 and 19, and most children having an SES score between 6 and 10. The reliability of the sociolinguistic diversity questionnaire, reflected in Cronbach’s α, is 0.68, which is considered an acceptable level of reliability and internal consistency between the different questions that make up the total score (Streiner 2003; Ursachi et al. 2015). The same calculation of reliability for the SES questions rendered a Cronbach’s α of 0.32, indicating low internal consistency. The results also show that this cannot be resolved by removing one specific question, and thus indicate that the questions may be tapping into different aspects of SES. The children from the two different cities (Delhi vs. Hyderabad) show similar mean scores and a similar distribution of scores of sociolinguistic diversity, but show different distributions of SES, with Hyderabad scoring higher than Delhi (see Table 2 and Appendix A).
When examining the overlap between the measures obtained from our questionnaires compared to the more traditional, binary measures of bilingualism in the home (yes/no) and school site (slum/non-slum) in Figure 2, it can be seen that these binary measures have difficulties capturing the diversity displayed by the sample of children. More specifically, although one might expect children from bilingual homes to have higher sociolinguistic diversity scores than those from monolingual homes, there was considerable overlap in sociolinguistic diversity scores between the two groups, as shown by the area shaded in purple. Likewise, one might expect children from schools in slum areas to have lower SES scores than children from schools in non-slum areas, but again there was a very large overlap between the two groups. Thus, the measures of sociolinguistic diversity and SES seemed to assess different social, cultural, and/or linguistic aspects than these binary categorizations—reflecting the linguistically and culturally diverse environment of these children.
In addition, we examined whether the scores on the different cognitive tasks correlate with each other, and whether the scores on the questionnaires correlate with each other. The results are presented in Figure 3. We found a significant negative correlation between Raven’ score and SES score (r = −0.17, p < 0.001), indicating that children with higher SES had lower Raven’ scores, reflecting more interactions in different languages. An additional positive correlation was found between children’s scores on the 2-back task and their scores on the Raven’s task (r = 0.27, p < 0.001), indicating that performance on the two cognitive tasks was related.

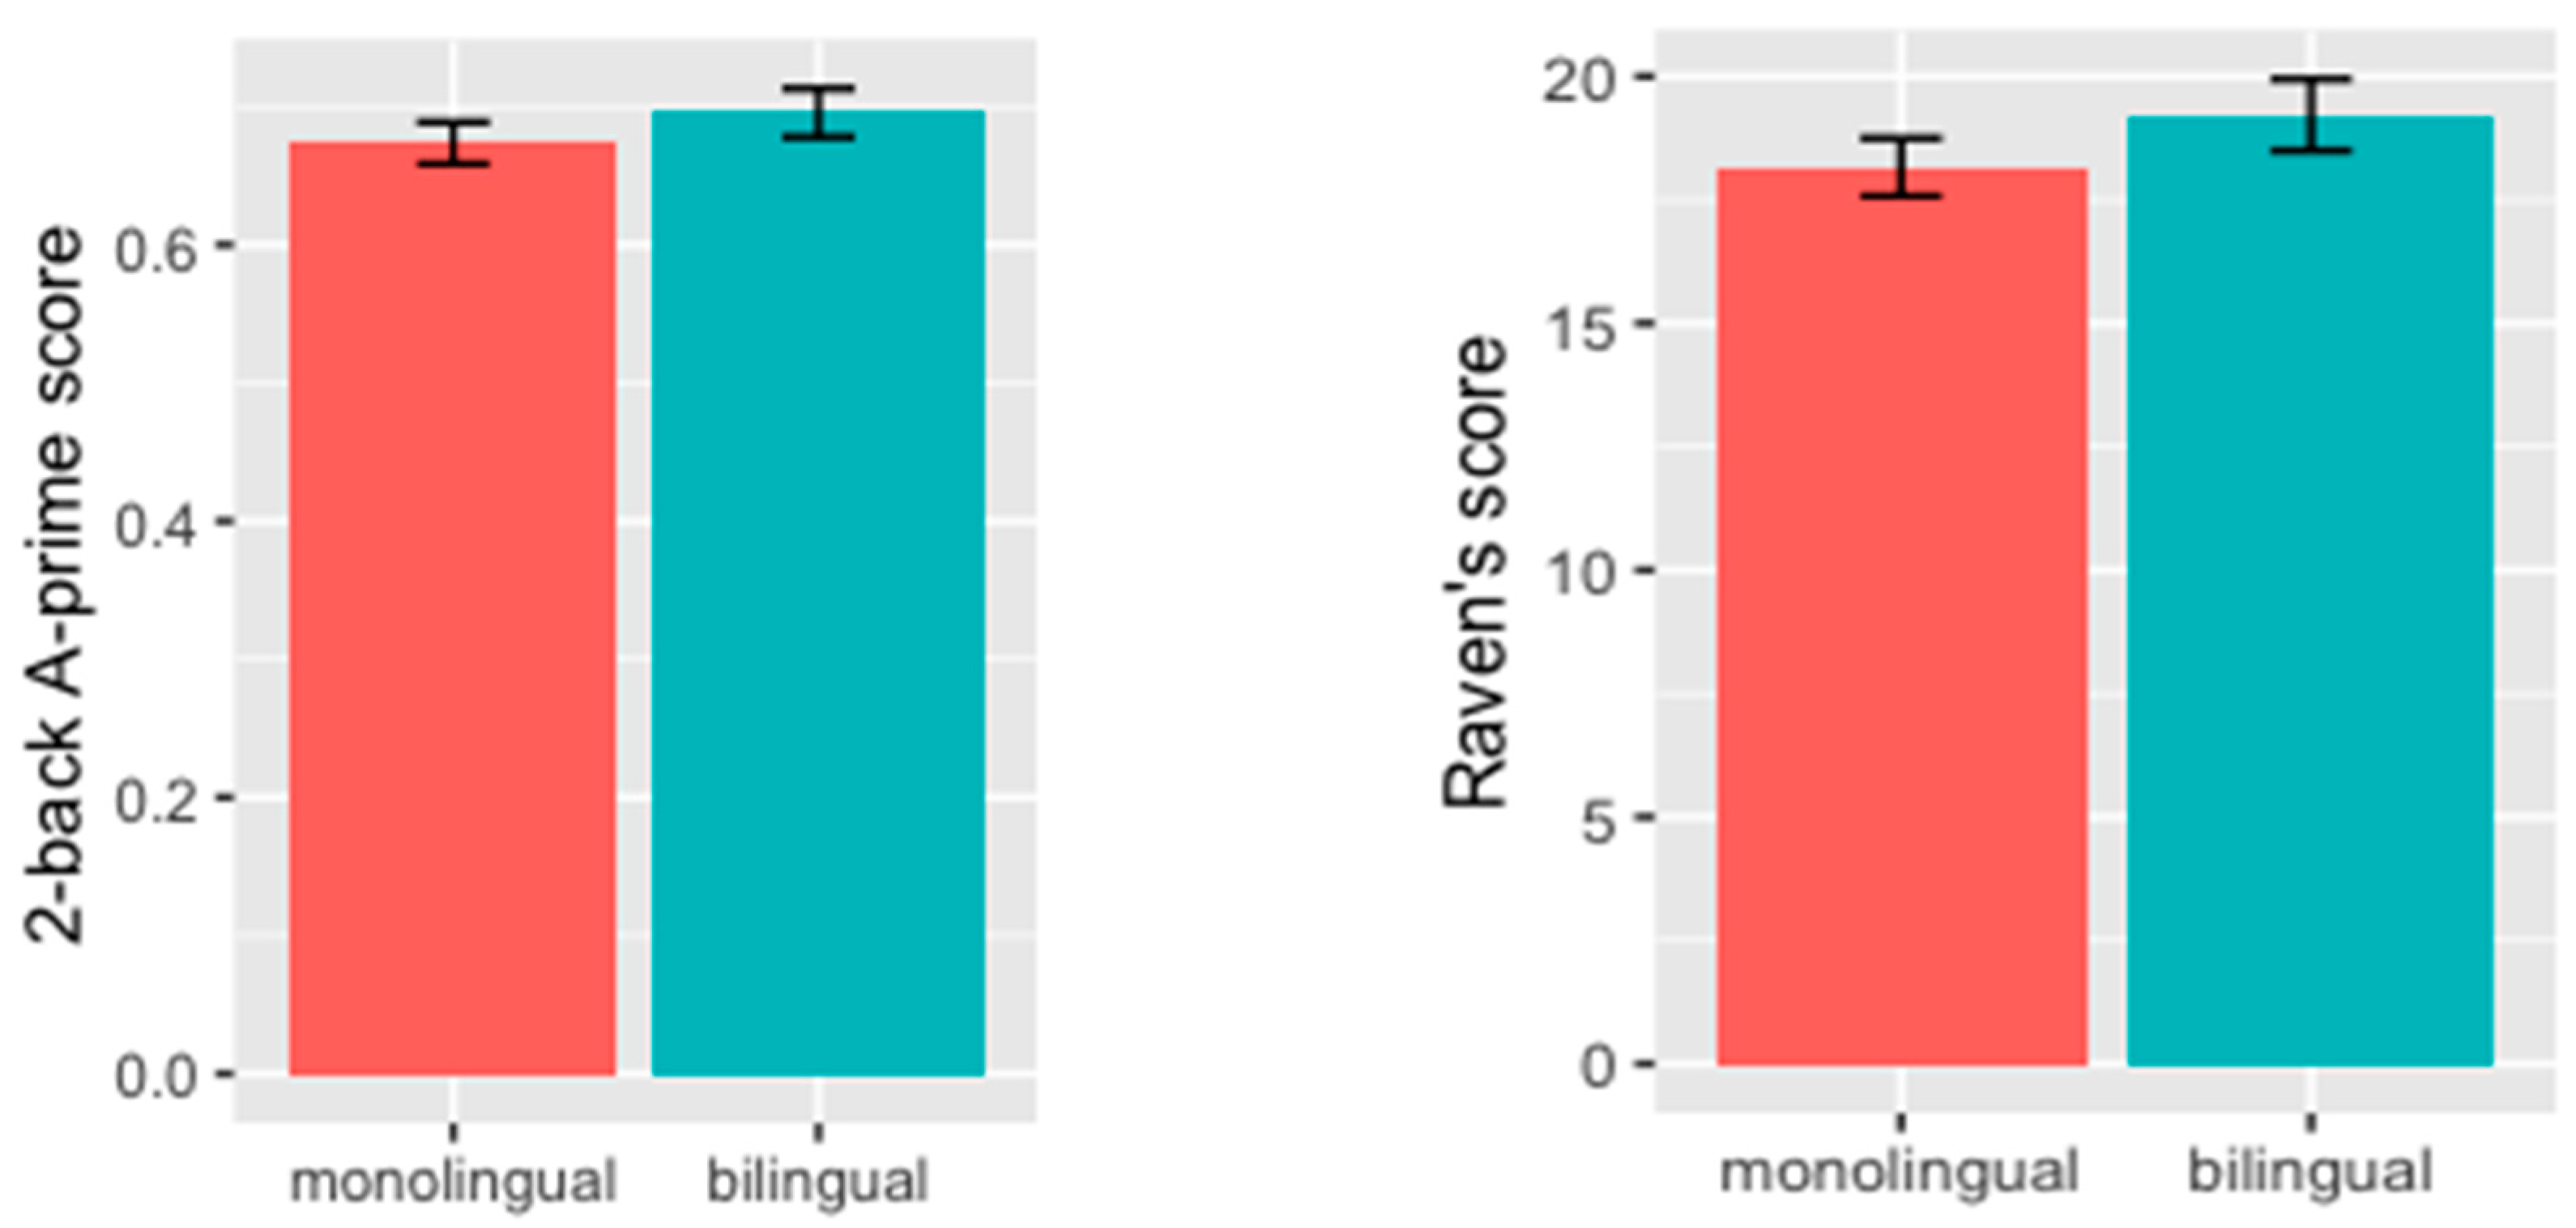
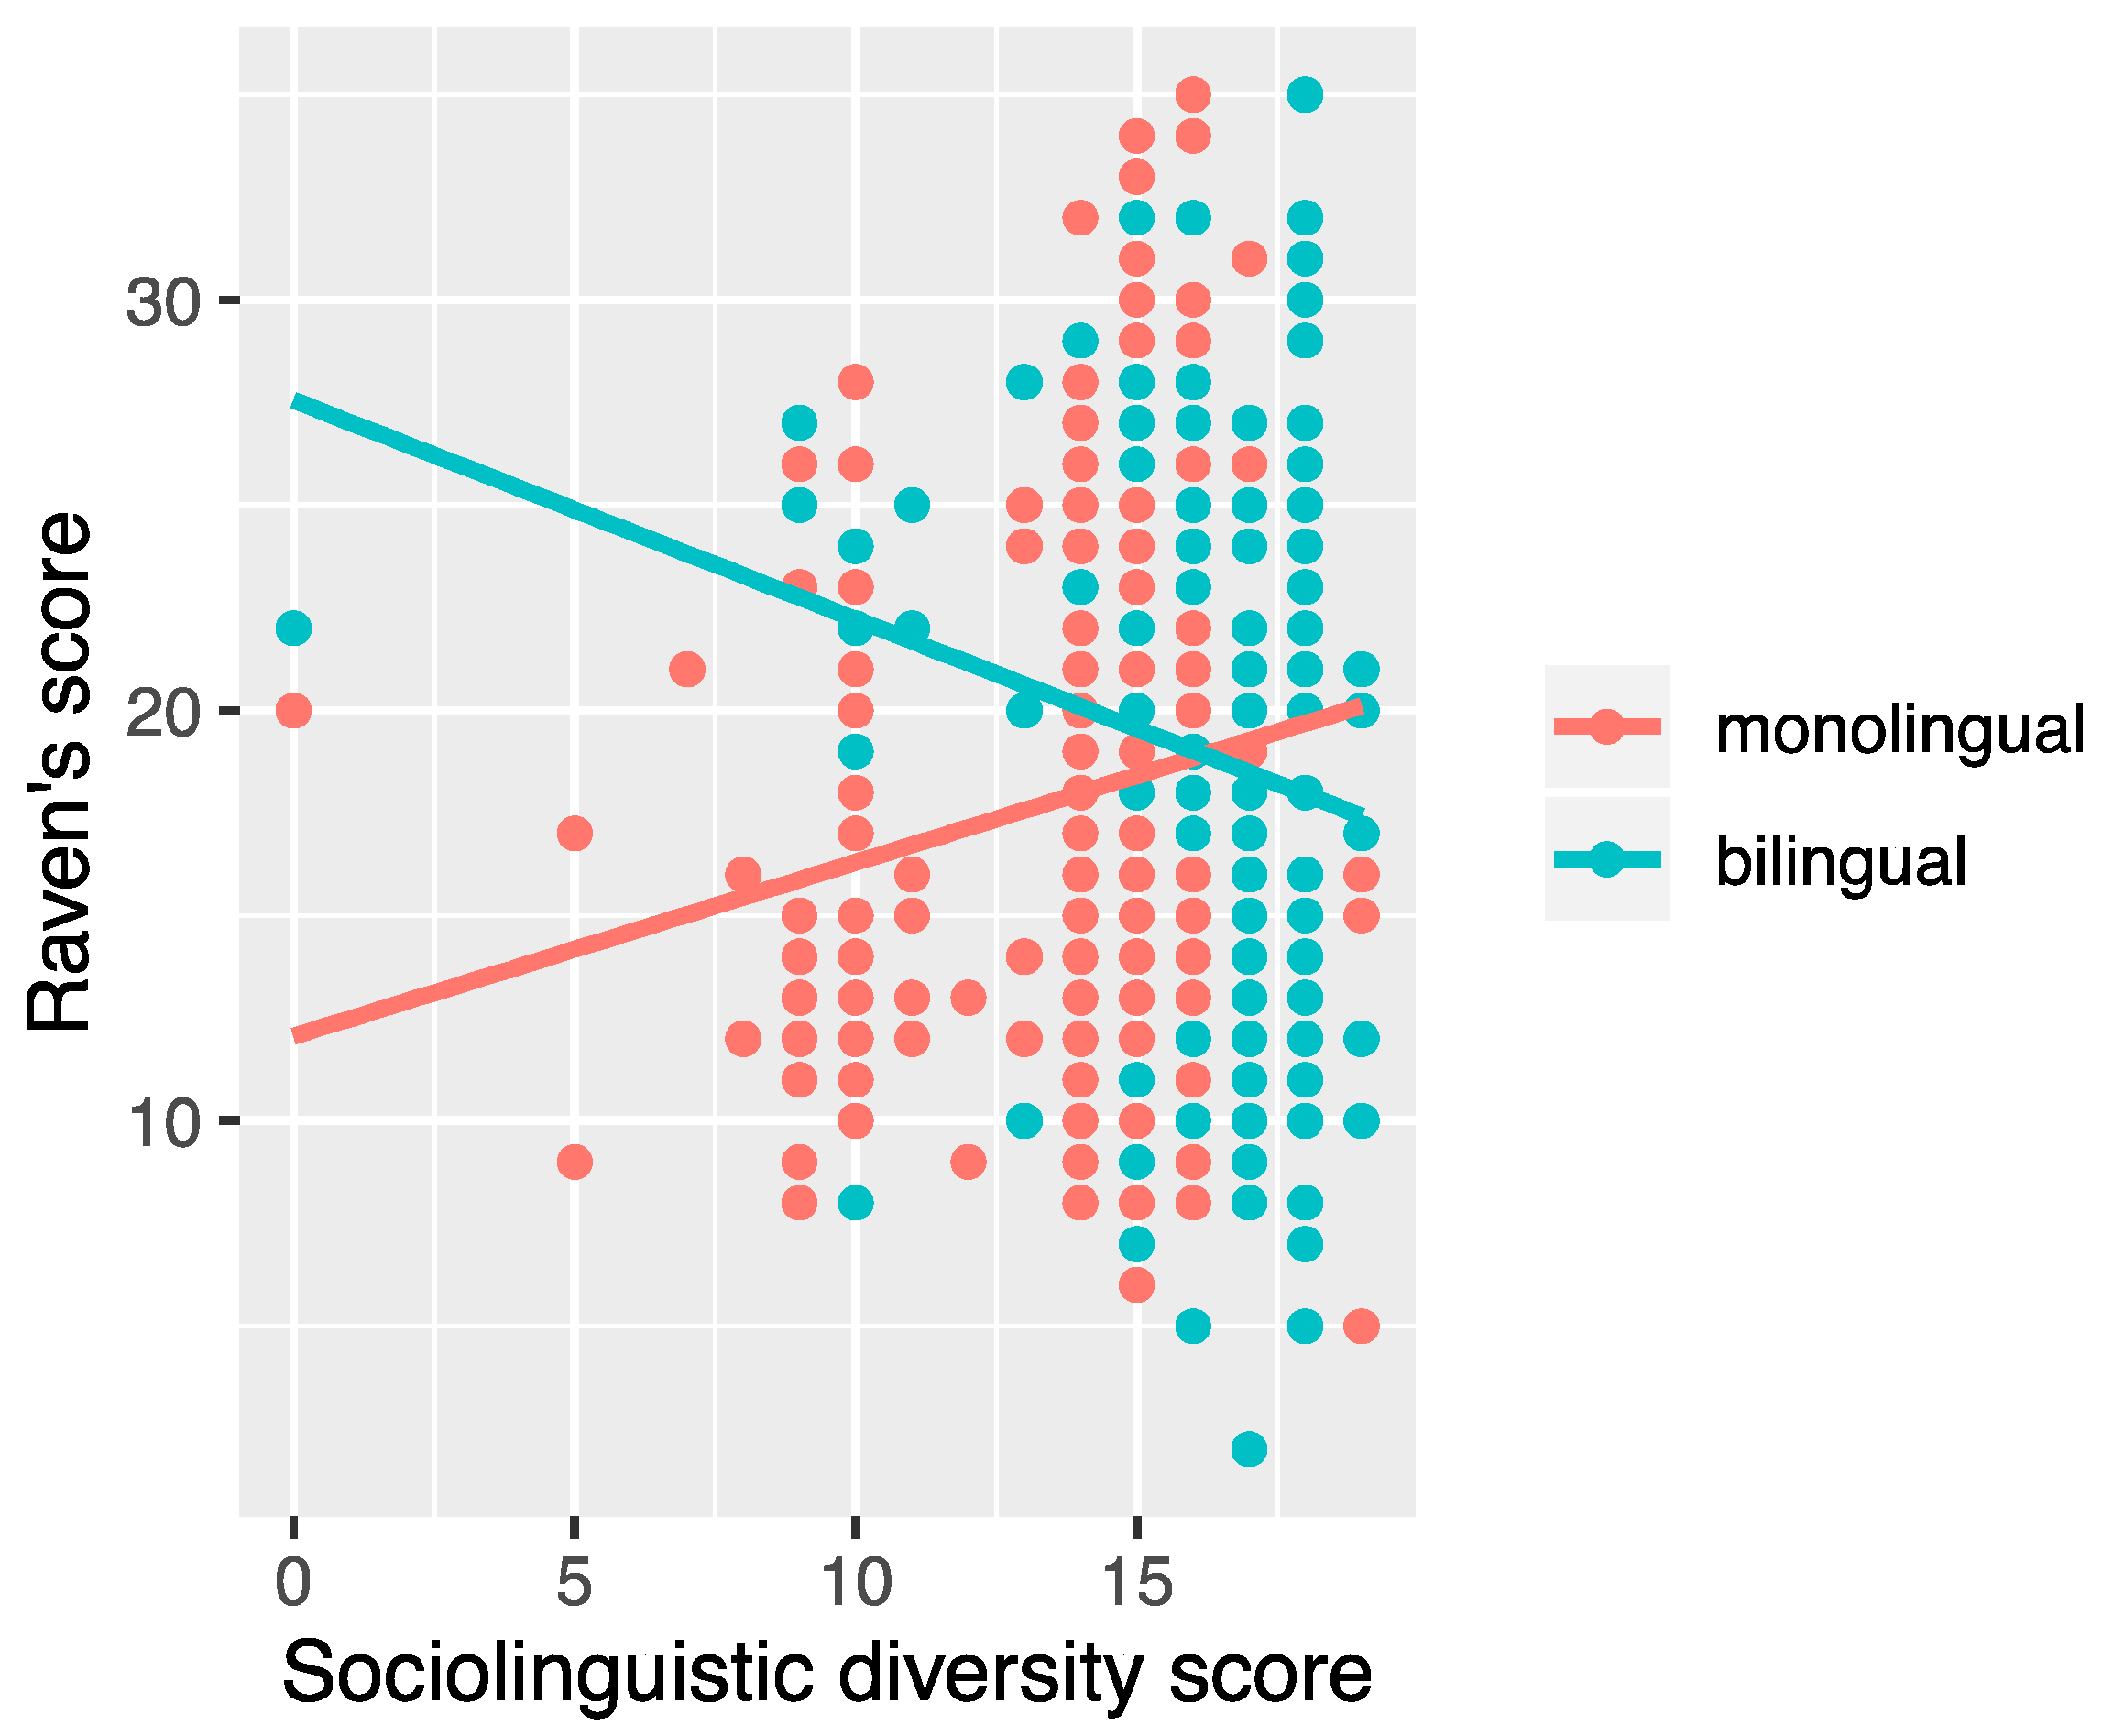
3.2. Is there a Relationship between Bilingualism and/or Sociolinguistic Diversity and Cognitive Skills?

The second research question focuses on the potential relationships between bilingualism, linguistic diversity, and cognitive skills. To this end, separate analyses were performed investigating the influence of bilingualism and sociolinguistic diversity on the 2-back task and on Raven’s task. The results show that children from bilingual homes perform better on the 2-back task, with a mean score of 0.67 for children from monolingual homes, compared to a mean score of 0.70 for children from bilingual homes (ß = 0.03; t = 2.2; p < 0.05, see Figure 4, left graph). The size of this effect is large according to a Cohen’s d of 1.97. No significant influence of sociolinguistic diversity was found for the 2-back task (ß = −0.00; t = −1.5; p = 0.13).
The results for the Raven’s task show a positive effect of bilingualism as well, with an average score of 18.2 for children from monolingual homes, compared to 19.2 for children from bilingual homes (ß = 15.5; t = 4.7; p < 0.001, see Figure 4, right graph). The size of this effect was large, based on a Cohen’s d of 3.8. No main effect of sociolinguistic diversity was found (ß = 0.05; t = 0.5; p = 0.61), but an interaction was observed between bilingualism and sociolinguistic diversity (ß = −0.96; t = −4.4; p < 0.001). This interaction indicates that the effects of sociolinguistic diversity scores on the Raven’s task were different for children from bilingual compared to those from monolingual homes (see Figure 5). Investigating this interaction further, we split up the dataset into a group of children from bilingual homes and a group of children from monolingual homes and investigated the effects of sociolinguistic diversity in these groups of children separately with linear models. The results show that for children from monolingual homes, there was a significant positive correlation between sociolinguistic diversity score and Raven’s score (ß = 0.42; t = 3.2; p < 0.01), whereas for children from bilingual homes a negative correlation was found (ß = -0.53; t = −3.1; p < 0.01).

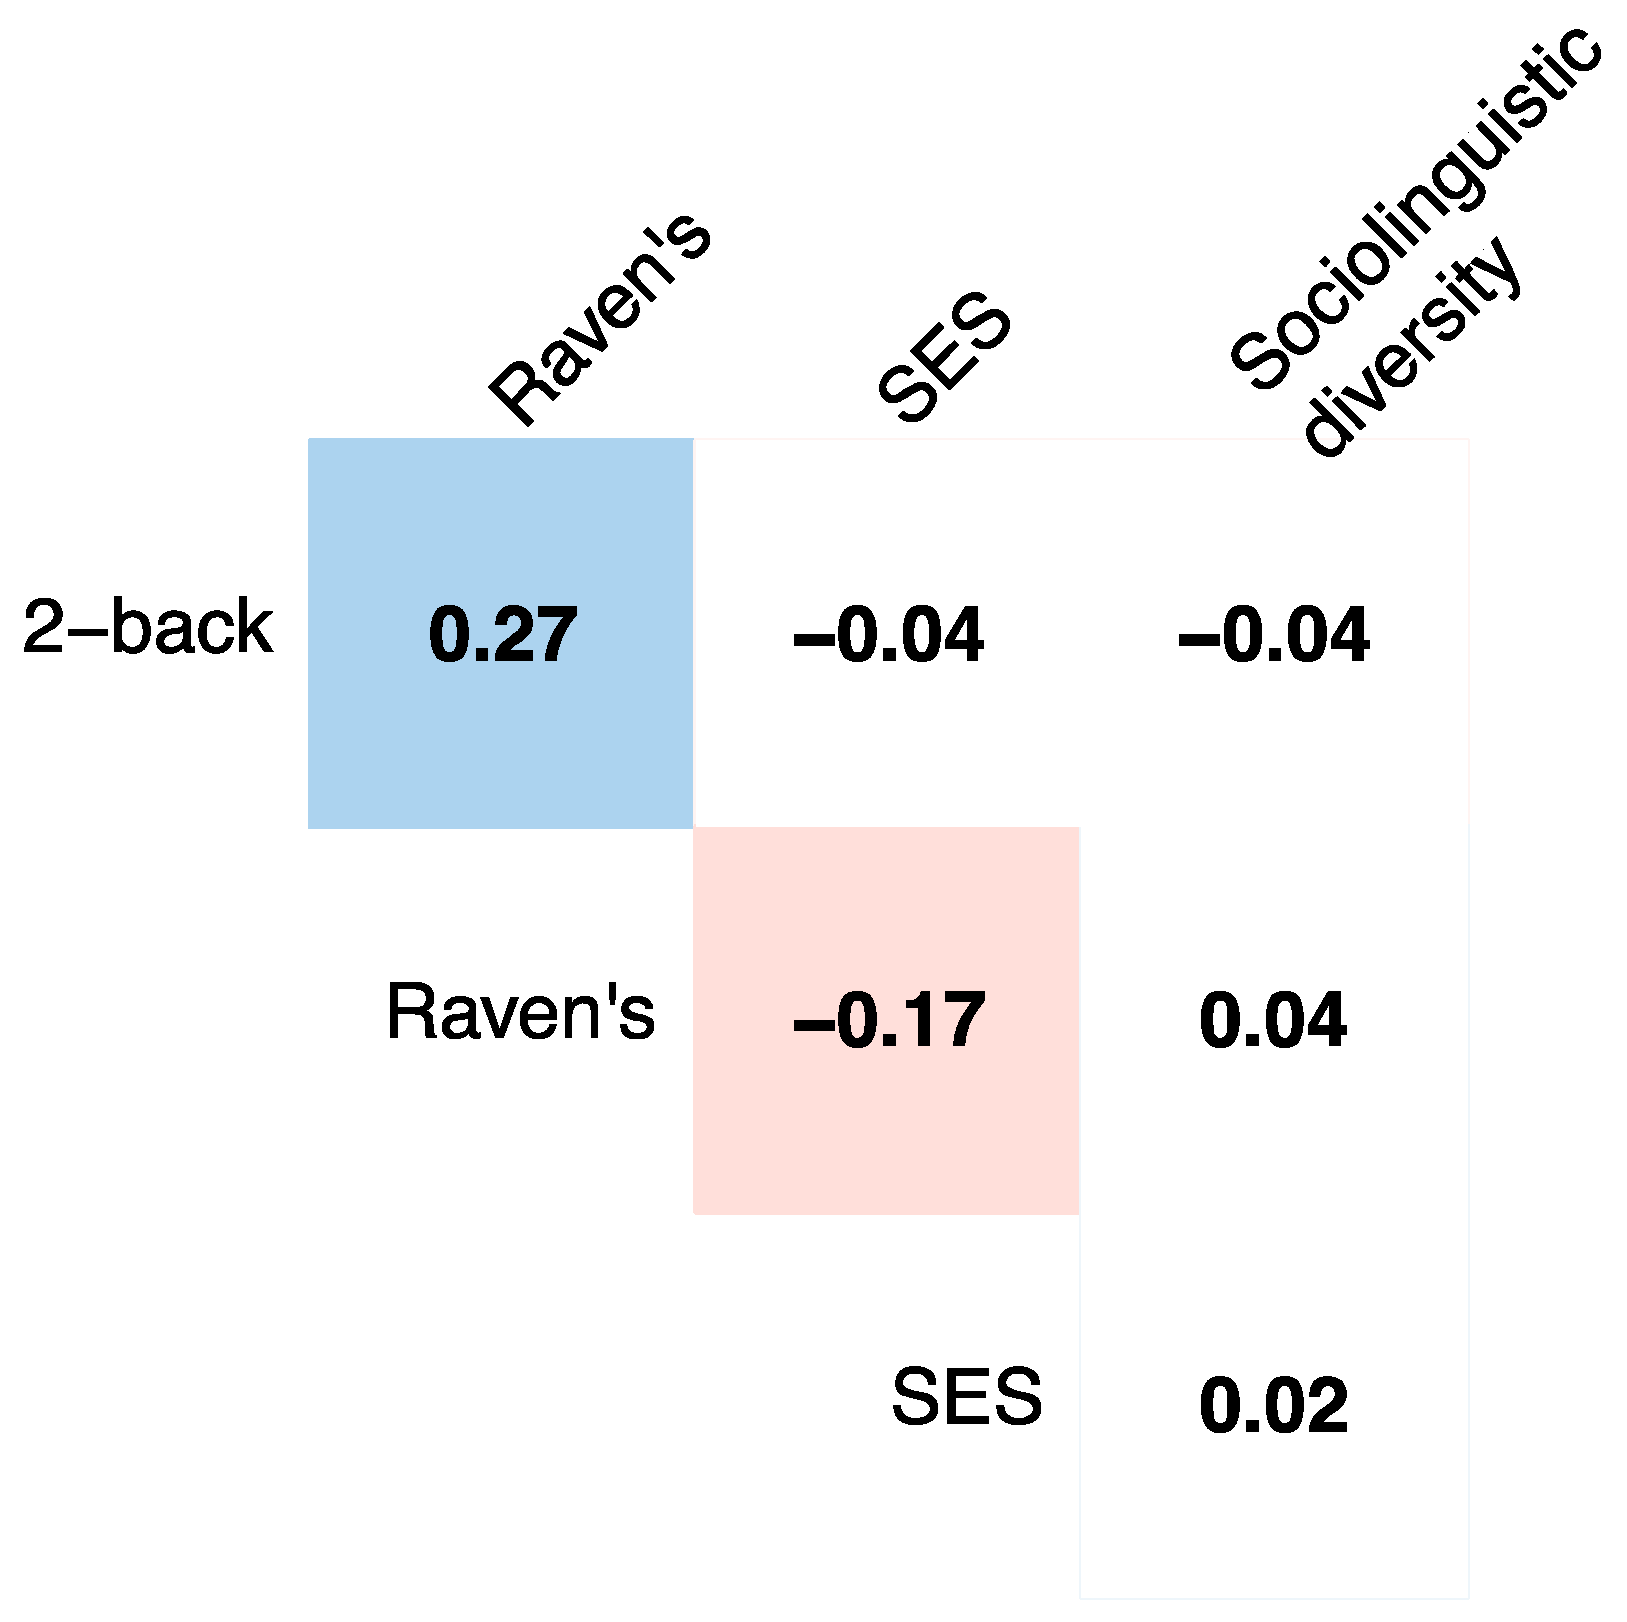
3.3. To What Extent Do Socio-Economic Status, Medium of Instruction, and Other Demographic Variables Correlate with Cognitive Skills?

The final research question investigates the possible influence of SES, gender, age, city, medium of instruction, and school site on the scores on the cognitive tasks. When examining the 2-back scores, the only factor that improved the model fit—and was thus retained as an independent variable—was medium of instruction. The results show that the average performance on the 2-back task differed between the three mediums of instruction, with children in Hindi-medium schools (mean score 0.71) outperforming children in Telugu-medium schools (mean score 0.65; ß = 0.05; t = 2.6; p < 0.01; large effect size; Cohen’s d = 2.0). Neither of these groups performed significantly differently from children in English-medium schools (mean score 0.69). Note that these were medium-of-instruction effects rather than city effects, as city did not prove to be a significant predictor (with mean scores of 0.69 in Delhi and 0.67 in Hyderabad). This is in line with the distribution of scores from the 2-back task for children from Delhi and Hyderabad, which are very similar (see Figure 6, left graph). Neither SES score nor school site (slum or non-slum) were significant predictors of performance on the 2-back task.
For the Raven’s score, only city contributed to the best model. This large effect of city indicates that children from Delhi performed better on the Raven’s task than children from Hyderabad (ß = 4.22; t = 9.6; p < 0.001; Cohen’s d = 4.5)2. This can be seen in the mean scores presented in Table 2 as well as in Figure 6 (right graph), which shows more low scores for children form Hyderabad than for children from Delhi. Note that the correlation between SES and Raven’s score, as presented in Figure 3, did not reach significance in the current analyses due to the overlap in explanatory power between city and SES; children from Delhi had lower SES scores and performed better on the Raven’s task than children from Hyderabad. To investigate the possible effect of SES further, we therefore split up the dataset into children from Delhi and children from Hyderabad and investigated the effects of SES in these groups of children separately with linear models. The results show that within these cities, no significant effects of SES on Raven’s score were found (Delhi: ß = 0.44; t = 1.5; p = 0.12, Hyderabad ß = −0.29; t = −0.9; p = 0.39).

4. Discussion

The study’s goal was to evaluate the role of multilingualism and linguistic diversity in the cognitive skills of primary school children from poor socioeconomic background in urban India. To this end, we explored variability in demographics such as age, gender and SES, as well as sociolinguistic diversity in the daily contexts of the child’s life, i.e., school, home and community, as possible factors affecting the child’s performance on tasks assessing fluid intelligence and updating. Bi- or multilingualism at home was considered a separate factor that addresses whether a child uses only one language at home, or more than one. In contrast, sociolinguistic diversity aimed to assess the child’s family, school, and social encounters with individuals who may have the same or different age or gender as the child, and who may speak one or more languages of which the child is aware, but does not necessarily know or use. Thus, although an overlap between the child’s multilingualism and sociolinguistic diversity is expected, as multiple home languages will also increase the diversity index, the two constructs are not identical.
Our first research question focused on the distinction between multilingualism in the individual child and sociolinguistic diversity in the child’s daily environment. Both factors were evaluated using a questionnaire. Our data confirmed our hypothesis, namely, that the measure of sociolinguistic diversity assesses a distinct construct from the child’s multilingualism. In particular, sociolinguistic diversity showed a large overlap between monolinguals and bilinguals, confirming that these two measures reflect different aspects of a child’s linguistic profile. Furthermore, the overlap confirms our expectation that children in India, whether monolingual or bilingual, experience considerable social and linguistic diversity in their daily lives. Similarly, the findings show that our proxy measure of SES reflects something different from the slum/non-slum distinction that is based on the location of their schools. Specifically, the overlap in the distribution of SES scores across children from slum and non-slum areas indicates that whatever the distinction encodes, it is not comprehensively captured by the measure of SES alone. Furthermore, slums do not necessarily share the same characteristics across the two cities, with conditions in urban slums in Hyderabad being considerably more challenging than those in Delhi (Glaeser and Sims 2015; Government of National Capital Territory of Delhi 2015). Specifically, the number of urban poor in Hyderabad has increased by 264% since 2001, suggesting that one third of the population lives in slums in conditions considerably worse than in other urban sites, as provisions are not adequate. This makes the comparison between Delhi and Hyderabad slums—and the respective poverty levels—hard to draw. Although we will attempt this in future research, the overlap in SES scores in slum/non-slum schools remains valid. The importance of these factors is illustrated by their differential effects on cognitive performance, as discussed below.
The second research question was concerned with the relationship between bilingualism, sociolinguistic diversity, and cognitive skills. It was found that bilinguals outperform monolinguals on both the n-back task and the Raven’s task (in line with Diaz 1985; Hansen et al. 2016; Mohanty and Das 1987; Peal and Lambert 1962, but contra Bialystok and Shapero 2005; Jarvis et al. 1995; Moradzadeh et al. 2015; Yow and Li 2015), reflecting enhanced (updating of) working memory and fluid intelligence, respectively. In addition, it was found that the monolinguals’ scores on the Raven’s task were positively influenced by linguistic diversity in their environment. Thus, a linguistically diverse environment seems to enhance cognitive performance for children who are not multilingual themselves. Nevertheless, no main effect of sociolinguistic diversity was found, indicating that bilingualism and sociolinguistic diversity are not additive effects; they both lead to better performance on cognitive tasks, but a bilingual living in a highly linguistically diverse environment does not outperform other bilinguals. An unexpected finding regarding the effects of sociolinguistic diversity concerns the negative impact they seem to have on the Raven’s scores of bilingual children. Although we are unable to explain this finding at this point, some possible reasons may be considered. First, the number of bilingual children from each city is similar, although bilinguals are proportionately more in Hyderabad. Looking more carefully at the bilingual profile data of the Delhi and Hyderabad children, we observe that all of the 143 bilingual children in Delhi have Hindi as one of their home languages. In contrast, of the 141 bilingual children in Hyderabad, 81, i.e., 57%, do not have Telugu as one of their home languages. This has implications for the difficulties faced by the Hyderabad bilinguals who attend either Telugu-medium or English-medium schools, as in both cases the children are presented with school languages that are unfamiliar to them from home. In contrast, in Delhi, the overwhelming dominance of Hindi there—and in many North Indian states from where many of the bilingual children have migrated—implies that linguistic familiarity with the school language is in place. It is worth noting at this point that the English-medium schools in Delhi provide very low oral input in English, and most of the class is delivered in Hindi (Lightfoot et al., submitted). As a result, Hindi dominance is also attested in officially English-medium schools, enabling the Delhi bilingual group to benefit from a match between the school and the home language. This difference between the Delhi and the Hyderabad bilingual groups may contribute to the negative impact of increased sociolinguistic diversity on children’s Raven’s scores, as the sociolinguistic diversity faced by the bilinguals in Hyderabad may be understood as a challenge imposed by the lack of familiarity with languages outside home. Another related reason may possibly stem from the differences among the populations of the urban poor in the two cities. As mentioned above, Hyderabad is challenged by a recent increase in the number of slum-dwellers and an overall higher percentage of urban poor compared to Delhi. It is suggested that this increase is due to an influx of rural migrants who are culturally and linguistically diverse (Glaeser and Sims 2015). It is thus possible that the combination of migration and poverty further contribute to the negative impact of sociolinguistic diversity on the bilingual group’s performance.
Regarding the positive effects of bilingualism on fluid intelligence, our results are compatible with literature suggesting contextual effects on Raven’s performance (e.g., Brouwers et al. 2009). In our study, the contextual effects on Raven’s stem not only from bilingualism, but also from sociolinguistic diversity in the monolingual group. Recall that our participants are all from disadvantaged backgrounds, albeit with some variation in their SES scores. Furthermore, sociolinguistic diversity and bilingualism are correlated. This correlation is intuitively plausible on the grounds that multilingual participants inevitably experience higher linguistic diversity. Variation is then expected to be found in the monolingual participants only, and here the effect is in the direction of improved performance on Raven’s, with higher sociolinguistic diversity in the monolingual children’s environment. Neither sociolinguistic diversity nor SES affected performance on working memory, however. Bilingualism was the only significant predictor for 2-back scores.
Turning to the third research question of our study, the findings show several effects of demographic variables on cognitive skills. No effect of SES on fluid intelligence was found, which is inconsistent with previous literature on the relationship between SES and cognitive performance (Burneo-Garcés et al. 2019; Pace et al. 2017). However, our data were obtained from a sample of disadvantaged, low-SES children, so differences in socioeconomic status within this cohort may be small. The lower SES of our participants may be exemplified in different ways. Specifically, some of the children were first-generation learners, i.e., they come from households with very low levels of literacy, a fact which may also be deduced from parents’ occupation (maid/laborer). Several of our research assistants further confirmed the disadvantaged status of many children in this cohort. In some of their reports, research assistants confirmed that “mid-day meals [are the] reason behind students’ high attendance in forenoon classes; gradually [leading to] poor[er] attendance in the afternoon classes.” In addition, “[the children’s] houses do not have proper space for sleeping and even for any activity”, and “working on a computer for cognitive tasks was something very new to many students.” This is supported by findings from the literature that provision of a mid-day meal improves school participation, especially in girls, in rural India (Drèze and Kingdon 2001). We additionally know that school attendance in India is positively related to the education level of parents and negatively related to poverty and household size (Jayachandran 2002).
In contrast, an effect of medium of instruction on the 2-back task was found, with children from Hindi medium schools outperforming children from Telugu medium schools, and an effect of city on the Raven’s task, with children from Delhi outperforming children from Hyderabad. As all Hindi medium schools were located in Delhi, and all Telugu medium schools in Hyderabad, these effects are likely to be related. We consider it highly unlikely that language itself was the cause of these effects, hence the findings warrant further inspection of the differences between children from Delhi and Hyderabad. As bilingualism was established as a predictor of better scores on cognitive tasks, we further examined which types of schools bilingual and monolingual children attend (see Table 3). A difference was found between the schools that bilinguals attend in the two cities, with monolinguals in Hyderabad attending primarily Telugu-medium schools, and monolinguals in Delhi attending both Hindi-medium and English-medium schools. We therefore postulate that the differences in medium of instruction may have been due to Telugu-medium schools being attended mainly by monolinguals, who were generally outperformed by bilinguals.
Finally, variation in our cohort can be found with respect to the average sociolinguistic diversity scores for these groups of children, and how it varies depending on city, bilingualism, and medium of instruction in school: Whereas in the Delhi data, the averages for sociolinguistic diversity were similar for EMI and HMI schools, in the Hyderabad data, children attending EMI schools are exposed to more diverse contexts on a daily basis. Furthermore, the discrepancy in the distribution of monolinguals in the two cities presented in Table 3 can be partly accounted for by a recent policy change affecting Delhi schools. Specifically, most government schools in Delhi were converted to English-medium in 2013–14, without a transition stage. Conversely, Hyderabad EMI schools have had English as the official medium of instruction for a longer period, and parents have a choice between EMI and TMI schools in this city. Thus, it appears that in Hyderabad, children with Telugu as a home language attend regional language schools, whereas most children who are bilingual or multilingual at home are enrolled in EMI schools. The discrepancy in the results from the two cities can thus shed further light into the contribution of demographics and the role of language policy in the school context on fluid intelligence, and cognition more generally.
Based on the results of the current study, some suggestions for future research can be offered. First, the finding that fluid intelligence was increased for monolingual children growing up in a sociolinguistically diverse context should be investigated further, in order to replicate the findings and examine in which populations this holds. Second, the questionnaires that were used for SES and sociolinguistic diversity—although based on previous research—did not reach the highest possible internal consistency for questionnaires, and should be developed and tested further in a separate project, aiming to develop and select an optimal set of questions that can be used by other researchers in the field. Finally, our investigations showed differences in cognitive abilities based on demographics, which we suggest reflects the different role of school languages (medium of instruction) in the different cities from which children were tested. This strongly invites further investigations into the contribution of demographics and the role of educational language policy in children’s linguistic and cognitive development.

5. Conclusions

Overall, this study examined the cognitive performance of a large sample of primary school children from government schools in India. Although all the children were from low-SES homes and were all disadvantaged with respect to housing, parental education/stimulation, and other factors influencing SES, variation was identified in the children’s multilingualism and sociolinguistic diversity. Most importantly, the study shows that bilingualism/multilingualism in this population enhanced cognitive performance on two different cognitive tasks, and that fluid intelligence was increased for monolingual children growing up in a sociolinguistically diverse context. Other demographic variables (medium of instruction/city) influenced performance on the cognitive tasks as well, providing further evidence for the role of contextual effects on children’s cognitive skills.

Author Contributions

Conceptualization, I.M.T., T.M., M.P., S.A.; methodology, I.M.T., T.M., M.P., S.A.; validation, I.M.T., M.V., A.B., A.R.; formal analysis, M.V.; investigation, I.M.T., T.M., M.P., S.A., A.R.; resources, I.M.T.; data curation, A.B., A.R.; writing—original draft preparation, M.V., A.B., and I.M.T.; writing—review and editing, T.M., S.A., A.R. and M.P.; visualization, M.V.; supervision, I.M.T.; project administration, I.M.T.; funding acquisition, I.M.T. All authors have read and agreed to the published version of the manuscript.

Funding

This research was funded by the Department for International Development and the Economic and Social Research Council (ESRC-DFID, Grant Ref: ES/N010345/1).

Acknowledgments

We would like to thank all the research assistants, participants and teachers for their participation and support. We are very grateful to Debanjan Chakrabarti, Ganesh Devy, Dhir Jhingran, Vasanta Duggirala, Amy Lightfoot, Rama Matthew, Ajit Mohanty, Lina Mukhopadhyay, Bapi Raju, Pallawi Sinha and Jeanine Treffers-Daller for their advice and support throughout the project.

Conflicts of Interest

The authors declare no conflict of interest. The funding sponsors had no role in the design of the study; in the collection, analyses, or interpretation of data; in the writing of the manuscript, or in the decision to publish the results.

Appendix A

Figure A1. Distribution of the scores on sociolinguistic diversity (left graph) and socio-economic status (SES; right graph) for children from Delhi and Hyderabad. Purple areas reflect the overlap between the children from the two cities on the on the sociolinguistic diversity and SES scores.
Languages 05 00010 g0a1

References

  1. Agrawal, Tushar. 2014. Educational inequality in rural and urban India. International Journal of Educational Development 34: 11–19. [Google Scholar] [CrossRef]
  2. Alcott, Benjamin, and Pauline Rose. 2015. Schools and learning in rural India and Pakistan: Who goes where, and how much are they learning? Prospects 45: 345–63. [Google Scholar] [CrossRef] [Green Version]
  3. Alcott, Benjamin, and Pauline Rose. 2017. Learning in India’s primary schools: How do disparities widen across the grades? International Journal of Educational Development 56: 42–51. [Google Scholar] [CrossRef]
  4. Arán-Filippetti, Vanessa. 2013. Structure and invariance of executive functioning tasks across socioeconomic status: Evidence from Spanish-speaking children. The Spanish Journal of Psychology 16. [Google Scholar] [CrossRef]
  5. Aran-Filippetti, Vanessa, and Maria Cristina Richaud de Minzi. 2012. A structural analysis of executive functions and socioeconomic status in school-age children: Cognitive factors as effect mediators. The Journal of Genetic Psychology 173: 393–416. [Google Scholar] [CrossRef]
  6. Aslam, Monazza, Rabea Malik, Shenila Rawal, Pauline Rose, and Anna Vignoles. 2019. Do government schools improve learning for poor students? Evidence from rural Pakistan. Oxford Review of Education 45: 802–24. [Google Scholar] [CrossRef] [Green Version]
  7. Bedore, Lisa M., Elizabeth D. Peña, Connie L. Summers, Karin M. Boerger, Maria D. Resendiz, Kai Greene, Thomas M. Bohman, and Ronald B. Gillam. 2012. The measure matters: Language dominance profiles across measures in Spanish-English bilingual children. Bilingualism (Cambridge, England) 15: 616–29. [Google Scholar] [CrossRef] [Green Version]
  8. Belacchi, Carmen, Barbara Carretti, and Cesare Cornoldi. 2010. The role of working memory and updating in Coloured Raven Matrices performance in typically developing children. European Journal of Cognitive Psychology 22: 1010–20. [Google Scholar] [CrossRef]
  9. Bhattacharjea, Suman, Wilima Wadhwa, and Rukmini Banerji. 2011. Inside Primary Schools: A Study of Teaching and Learning in Rural India. Pratham Mumbai Education Initiative. October 7. Available online: http://img.asercentre.org/docs/Publications/Inside_Primary_School/Report/tl_study_print_ready_version_oct_7_2011.pdf (accessed on 15 March 2020).
  10. Bialystok, Ellen. 2009. Bilingualism: The good, the bad, and the indifferent. Bilingualism 12: 3–11. [Google Scholar] [CrossRef] [Green Version]
  11. Bialystok, Ellen. 2013. The impact of bilingualism on language and literacy development. In The Handbook of Bilingualism and Multilingualism. Edited by Tej K. Bhatia and William C. Ritchie. New York: John Wiley & Sons, pp. 624–48. [Google Scholar]
  12. Bialystok, Ellen, and Dana Shapero. 2005. Ambiguous benefits: The effect of bilingualism on reversing ambiguous figures. Developmental Science 8: 595–604. [Google Scholar] [CrossRef]
  13. Bialystok, Ellen, Fergus I. M. Craik, Raymond Klein, and Mythili Viswanathan. 2004. Bilingualism, aging, and cognitive control: Evidence from the Simon task. Psychology and Aging 19: 290–303. [Google Scholar] [CrossRef] [PubMed] [Green Version]
  14. Brito, Natalie H., and Kimberly G. Noble. 2014. Socioeconomic status and structural brain development. Frontiers in Neuroscience 8: 276. [Google Scholar] [CrossRef] [PubMed] [Green Version]
  15. Brouwers, Symen A., Fons J. R. Van de Vijver, and Dianne A. Van Hemert. 2009. Variation in Raven’s Progressive Matrices scores across time and place. Learning and Individual Differences 19: 330–38. [Google Scholar] [CrossRef] [Green Version]
  16. Burneo-Garcés, Carlos, Francisco Cruz-Quintana, Miguel Pérez-García, Manuel Fernández-Alcántara, Ahmed Fasfous, and Mária Nieves Pérez-Marfil. 2019. Interaction between Socioeconomic Status and Cognitive Development in Children Aged 7, 9, and 11 Years: A Cross-Sectional Study. Developmental Neuropsychology 44: 1–16. [Google Scholar] [CrossRef] [PubMed]
  17. Byers-Heinlein, Krista, Alena G. Esposito, Adam Winsler, Viorica Marian, Dina C. Castro, and Gigi Luk. 2019. The Case for Measuring and Reporting Bilingualism in Developmental Research. Collabra: Psychology 5: 37. [Google Scholar] [CrossRef] [Green Version]
  18. Carneiro, Pedro, and James J. Heckman. 2002. The evidence on credit constraints in post-secondary schooling. The Economic Journal 112: 705–34. [Google Scholar] [CrossRef] [Green Version]
  19. Carneiro, Pedro, and James J. Heckman. 2003. Human capital policy. In Inequality in America: What Role for Human Capital Policies? Edited by James J. Heckman, Alan Krueger and Benjamin Friedman. Cambridge: MIT Press, pp. 77–239. [Google Scholar]
  20. Cattell, Raymond B. 1940. A culture-free intelligence test. I. Journal of Educational Psychology 31: 176–99. [Google Scholar] [CrossRef]
  21. Cattell, Raymond B., and A. Karen S. Cattell. 1963. Culture Fair Intelligence Test. Champaign: Institute for Personality and Ability Testing. [Google Scholar]
  22. Ciesielski, Kristina T., Paul G. Lesnik, Robert L. Savoy, Ellen P. Grant, and Seppo P. Ahlfors. 2006. Developmental neural networks in children performing a Categorical N-Back Task. NeuroImage 33: 980–90. [Google Scholar] [CrossRef]
  23. Clark, Eve V. 2004. How language acquisition builds on cognitive development. Trends in Cognitive Sciences 8: 472–78. [Google Scholar] [CrossRef]
  24. Cohen, Jonathan D., William M Perlstein, Todd S. Braver, Leigh E. Nystrom, Douglas C. Noll, John Jonides, and Edward E. Smith. 1997. Temporal dynamics of brain activation during a working memory task. Nature 386: 604–8. [Google Scholar] [CrossRef] [Green Version]
  25. Colzato, Lorenza S., Maria Teresa Bajo, Wery Van den Wildenberg, Daniela Paolieri, Sander Nieuwenhuis, Wido La Heij, and Bernhard Hommel. 2008. How does bilingualism improve executive control? A comparison of active and reactive inhibition mechanisms. Journal of Experimental Psychology: Learning, Memory, and Cognition 34: 302–12. [Google Scholar] [CrossRef] [PubMed] [Green Version]
  26. Costa, Albert, Mireia Hernández, and Núria Sebastián-Gallés. 2008. Bilingualism aids conflict resolution: Evidence from the ANT task. Cognition 106: 59–86. [Google Scholar] [CrossRef] [PubMed]
  27. Costa, Albert, Mireia Hernández, Jordi Costa-Faidella, and Núria Sebastián-Gallés. 2009. On the bilingual advantage in conflict processing: Now you see it, now you don’t. Cognition 113: 135–49. [Google Scholar] [CrossRef] [PubMed]
  28. Cotton, Sue M., Petricia M. Kiely, David P. Crewther, Brenda Thomson, Robin Laycock, and Sheila G. Crewther. 2005. A normative and reliability study for the Raven’s Coloured Progressive Matrices for primary school aged children from Victoria, Australia. Personality and Individual Differences 39: 647–59. [Google Scholar] [CrossRef]
  29. Cunha, Flavio, and James J. Heckman. 2008. Formulating, identifying and estimating the technology of cognitive and noncognitive skill formation. Journal of Human Resources 43: 738–82. [Google Scholar] [CrossRef]
  30. De Villiers, Jill. 2007. The Interface of Language and Theory of Mind. Lingua 117: 1858–78. [Google Scholar] [CrossRef] [Green Version]
  31. Devy, Ganesh. 2018. People’s Linguistic Survey of India. Gujarat: Bhasha Research and Publication Centre, Available online: http://www.peopleslinguisticsurvey.org/ (accessed on 8 February 2020).
  32. Diaz, Rafael M. 1985. Bilingual cognitive development: Addressing three gaps in current research. Child Development 56: 1376–88. [Google Scholar] [CrossRef]
  33. Drèze, Jean, and Geeta Gandhi Kingdon. 2001. School Participation in Rural India. Review of Development Economics 5: 1–24. [Google Scholar] [CrossRef]
  34. Engel de Abreu, Pascale M. J., Anabela Cruz-Santos, Carlos J. Tourinho, Romain Martin, and Ellen Bialystok. 2012. Bilingualism enriches the poor: Enhanced cognitive control in low-income minority children. Psychological Science 23: 1364–71. [Google Scholar] [CrossRef]
  35. Epstein, Jeffery N., Joshua M. Langberg, Paul J. Rosen, Amanda Graham, Megan E. Narad, Tanya N. Antonini, William B. Brinkman, Tanya Froehlich, John O. Simon, and Mekibib Altaye. 2011. Evidence for higher reaction time variability for children with ADHD on a range of cognitive tasks including reward and event rate manipulations. Neuropsychology 25: 427–41. [Google Scholar] [CrossRef] [Green Version]
  36. ESRC. 2010. ESRC Framework for Research Ethics (FRE) 2010. Available online: https://esrc.ukri.org/files/funding/guidance-for-applicants/esrc-framework-for-research-ethics-2010/ (accessed on 10 March 2020).
  37. Fernald, Lia C. H., Patricia Kariger, Melissa Hidrobo, and Paul J. Gertler. 2012. Socioeconomic gradients in child development in very young children: Evidence from India, Indonesia, Peru, and Senegal. Proceedings of the National Academy of Sciences 109: 17273–80. [Google Scholar] [CrossRef] [PubMed] [Green Version]
  38. Gentner, Dedre, and Jeffrey Loewenstein. 2002. Relational language and relational thought. In Language, Literacy, and Cognitive Development: The Development and Consequences of Symbolic Language. Edited by Eric Amsel and James P. Byrnes. Mahwah: Lawrence Erlbaum Associates, pp. 87–120. [Google Scholar]
  39. Ghosh, Satabdi, Sutanu Dutta Chowdhury, Ananga Mohan Chandra, and Tusharkanti Ghosh. 2015. Grades of undernutrition and socioeconomic status influence cognitive development in school children of Kolkata. American Journal of Physical Anthropology 156: 274–85. [Google Scholar] [CrossRef] [PubMed]
  40. Glaeser, Edward, and Helen Sims. 2015. Contagion, Crime, and Congestion: Overcoming the Downsides of Density. Growth Brief, May 2015. London: International Growth Centre. [Google Scholar]
  41. Government of National Capital Territory of Delhi. 2015. Urban Slums in Delhi; Delhi: Directorate of Economics and Statistics.
  42. Hackman, Daniel A., and Martha J. Farah. 2009. Socioeconomic status and the developing brain. Trends in Cognitive Sciences 13: 65–73. [Google Scholar] [CrossRef] [PubMed] [Green Version]
  43. Hackman, Daniel A., Martha J. Farah, and Michael J. Meaney. 2010. Socioeconomic status and the brain: Mechanistic insights from human and animal research. Nature Reviews Neuroscience 11: 651–59. [Google Scholar] [CrossRef]
  44. Hamadani, Jena D., Fahmida Tofail, Syed N. Huda, Dewan S. Alam, Deborah A. Ridout, Orazio Attanasio, and Sally M. Grantham-McGregor. 2014. Cognitive deficit and poverty in the first 5 years of childhood in Bangladesh. Pediatrics 134: e1001–8. [Google Scholar] [CrossRef] [Green Version]
  45. Hansen, Laura Birke, Pedro Macizo, Jon Andoni Duñabeitia, David Saldaña, Manuel Carreiras, Luis J. Fuentes, and M. Teresa Bajo. 2016. Emergent Bilingualism and Working Memory Development in School Aged Children. Language Learning 66: 51–75. [Google Scholar] [CrossRef]
  46. ICMR. 2006. Ethical Guidelines for Biomedical Research on Human Participants. Ethical Review Prodedures 11. Available online: http://icmr.nic.in/ethical_guidelines.pdf (accessed on 10 June 2016).
  47. Jarvis, Lorna H., Joseph H. Danks, and William E. Merriman. 1995. The effect of bilingualism on cognitive ability: A test of the level of bilingualism hypothesis. Applied Psycholinguistics 16: 293–308. [Google Scholar] [CrossRef]
  48. Jayachandran, Usha. 2002. Socio-Economic Determinants of School Attendance in India. In Working Papers 103. Delhi: Centre for Development Economics, Delhi School of Economics. [Google Scholar]
  49. Jerrim, John, and Anna Vignoles. 2013. Social mobility, regression to the mean and the cognitive development of high ability children from disadvantaged homes. Journal of the Royal Statistical Society: Series A (Statistics in Society) 176: 887–906. [Google Scholar] [CrossRef]
  50. Kaltsa, Maria, Alexandra Prentza, and Ianthi Maria Tsimpli. 2019. Input and literacy effects in simultaneous and sequential bilinguals: The performance of Albanian-Greek speaking children in sentence repetition. International Journal of Bilingualism. [Google Scholar] [CrossRef]
  51. Kelly, Yvonne, Amanda Sacker, Emilia Del Bono, Marco Francesconi, and Michael Marmot. 2011. What role for the home learning environment and parenting in reducing the socioeconomic gradient in child development? Findings from the Millennium Cohort Study. Archives of Disease in Childhood 96: 832–37. [Google Scholar] [CrossRef] [PubMed]
  52. Kirchner, Wayne K. 1958. Age differences in short-term retention of rapidly changing information. Journal of Experimental Psychology 55: 352–58. [Google Scholar] [CrossRef] [PubMed]
  53. Levin, Harvey S., Gerri R. Hanten, Ching-Chi Chang, Lifang Zhang, Russell Schachar, Linda Ewing-Cobbs, and Jeffrey E. Max. 2002. Working memory after traumatic brain injury in children. Annals of Neurology 52: 82–88. [Google Scholar] [CrossRef] [PubMed]
  54. López-Vicente, Mónica, Joan Forns, Elisabet Suades-González, Mikel Esnaola, Raquel García-Esteban, Mar Álvarez-Pedrerol, Jordi Júlvez, Miguel Burgaleta, Núria Sebastián-Gallés, and Jordi Sunyer. 2016. Developmental Trajectories in Primary Schoolchildren Using n-Back Task. Frontiers in Psychology 7: 716. [Google Scholar] [CrossRef] [PubMed] [Green Version]
  55. Mackworth, Jane F. 1959. Paced memorizing in a continuous task. Journal of Experimental Psychology 58: 206–11. [Google Scholar] [CrossRef]
  56. Miyake, Akira, Naomi P. Friedman, Michael J. Emerson, Alexander H. Witzki, Amy Howerter, and Tor D. Wager. 2000. The unity and diversity of executive functions and their contributions to complex “Frontal Lobe” tasks: A latent variable analysis. Cognitive Psychology 41: 49–100. [Google Scholar] [CrossRef] [Green Version]
  57. Mohanty, Ajit K. 2019. The Multilingual Reality: Living with Languages. Bristol: Multilingual Matters. [Google Scholar]
  58. Mohanty, Ajit K., and Prasad Sankar Das. 1987. Cognitive and metalinguistic ability of unschooled bilingual and unilingual tribal children. Psychological Studies 32: 5–8. [Google Scholar]
  59. Mohanty, Ajit K., Mahendra Kumar Mishra, N. Upender Reddy, and Gumidyala Ramesh. 2009. Overcoming the language barrier for tribal children: MLE in Andhra Pradesh and Orissa, India. In Multilingual Education for Social Justice: Globalising the Local. Edited by Ajit K. Mohanty, Minati Panda, Robert Phillipson and Tove Skutnabb-Kangas. New Delhi: Orient Blackswan, pp. 278–91. [Google Scholar]
  60. Moore, Mary E., and Bruce M. Ross. 1963. Context effects in running memory. Psychological Reports 12: 451–65. [Google Scholar] [CrossRef]
  61. Moradzadeh, Linda, Galit Blumenthal, and Melody Wiseheart. 2015. Musical Training, Bilingualism, and Executive Function: A Closer Look at Task Switching and Dual-Task Performance. Cognitive Science 39: 992–1020. [Google Scholar] [CrossRef]
  62. Morris, Neil, and Dylan Jones. 1990. Memory updating in working memory: The role of the central executive. British Journal of Psychology 81: 111–21. [Google Scholar] [CrossRef]
  63. Noble, Kimberly G., M. Frank Norman, and Martha J. Farah. 2005. Neurocognitive correlates of socioeconomic status in kindergarten children. Developmental Science 8: 74–87. [Google Scholar] [CrossRef]
  64. Ochs, Elinor, and Bambi B. Schieffelin. 2008. Language socialization: An historical overview. In Encyclopedia of Language and Education: Vol. 8. Language Socialization. Edited by Patricia A. Duff and Nancy H. Hornberger. New York: Springer, pp. 3–15. [Google Scholar]
  65. Paap, Kenneth R., and Zachary I. Greenberg. 2013. There is no coherent evidence for a bilingual advantage in executive processing. Cognitive Psychology 66: 232–58. [Google Scholar] [CrossRef] [PubMed]
  66. Paap Kenneth R., Hunter A. Myuz, Regina T. Anders, Morgan F. Bockelman, Roman Mikulinsky, and Oliver M. Sawi. 2017. No compelling evidence for a bilingual advantage in switching or that frequent language switching reduces switch cost. Journal of Cognitive Psychology 29: 89–112. [Google Scholar] [CrossRef]
  67. Pace, Amy, Rufan Luo, Kathy Hirsh-Pasek, and Roberta Michnick Golinkoff. 2017. Identifying Pathways Between Socioeconomic Status and Language Development. Annual Review of Linguistics 3: 285–308. [Google Scholar] [CrossRef] [Green Version]
  68. Pattanaik, Kabita. 2004. Relationship between Metalinguistic and Cognitive Development of Bilingual and Monolingual Tribal Children. Ph.D. dissertation, Utkal University, Bhubaneswar, Indian. [Google Scholar]
  69. Pattanaik, Kabita, and Ajit K. Mohanty. 1984. Relationship between metalinguistic and cognitive development of bilingual and unilingual tribal children. Psycholingua 14: 63–70. [Google Scholar]
  70. Paxson, Christina, and Norbert Schady. 2007. Cognitive development among young children in Ecuador the roles of wealth, health, and parenting. Journal of Human Resources 42: 49–84. [Google Scholar] [CrossRef]
  71. Peal, Elizabeth, and Wallace E. Lambert. 1962. The relation of bilingualism to intelligence. Psychological Monographs 76: 1–23. [Google Scholar] [CrossRef]
  72. Peirce, Jonathan W. 2007. PsychoPy—Psychophysics software in Python. Journal of Neuroscience Methods 162: 8–13. [Google Scholar] [CrossRef] [Green Version]
  73. Petrou, Stavros, and Emil Kupek. 2010. Poverty and childhood undernutrition in developing countries: A multi-national cohort study. Social Science & Medicine 71: 1366–73. [Google Scholar]
  74. Pollack, Irwin, and Donald A. Norman. 1964. Non-parametric analysis of recognition experiments. Psychonomic Science 1: 125–26. [Google Scholar] [CrossRef]
  75. Pratham. 2014. Annual Status of Education Report (Rural) 2013. New Delhi: Pratham, Available online: http://img.asercentre.org/docs/Publications/ASER%20Reports/ASER%202014/fullaser2014mainreport_1.pdf (accessed on 2 February 2019).
  76. Pratham. 2017. Annual Status of Education Report (Rural) 2016. Report for the Annual Status of Education Report Centre, 18 January 2017. New Delhi: Pratham, Available online: http://img.asercentre.org/docs/Publications/ASER%20Reports/ASER%202016/aser_2016.pdf (accessed on 15 November 2017).
  77. Raven, John Carlyle. 1938. Progressive Matrices: A Perceptual Test of Intelligence, Sets A, B, C, D, and E. London: H. K. Lewis. [Google Scholar]
  78. Raven, John Carlyle. 1956. Progressive Matrices, Sets A, B, C, D and E. London: H. K. Lewis. [Google Scholar]
  79. Raven, John. 2012. Coloured Progressive Matrices and Crichton Vocabulary Scale: India Edition. India: Pearson. [Google Scholar]
  80. Raven, John, John Carlylr Raven, and John Hugh Court. 2008. Ravens Coloured Progressive Matrices and Vocabulary Scales. London: Pearson Education. [Google Scholar]
  81. Revelle, William. 2019. Psych: Procedures for Psychological, Psychometric, and Personality Research. R package version 1.9.12. Evanston: Northwestern University, Available online: https://CRAN.R-project.org/package=psych (accessed on 28 January 2020).
  82. Rothou, Kyriakoula M., and Ianthi Maria Tsimpli. 2017. Biliteracy and reading ability in children who learn Greek as a second language. International Journal of Bilingual Education and Bilingualism. [Google Scholar] [CrossRef]
  83. Roy, Debraj, Bharath Palavalli, Niveditha Menon, Robin King, Karin Pfeffer, Michael Lees, and Peter M. A. Sloot. 2018. Survey-based socio-economic data from slums in Bangalore, India. Scientific Data 5: 170200. [Google Scholar] [CrossRef] [PubMed] [Green Version]
  84. Sanchez-Azanza, Victor A., Raúl López-Penadés, Lucía Buil-Legaz, Eva Aguilar-Mediavilla, and Daniel Adrover-Roig. 2017. Is bilingualism losing its advantage? A bibliometric approach. PLoS ONE 12: e0176151. [Google Scholar] [CrossRef] [PubMed] [Green Version]
  85. Scudder, Mark R., Kate Lambourne, Eric S. Drollette, Stephen D. Herrmann, Richard A. Washburn, Joseph E. Donnelly, and Charles H. Hillman. 2014. Aerobic capacity and cognitive control in elementary school-age children. Medicine and Science in Sports and Exercise 46: 1025–35. [Google Scholar] [CrossRef] [PubMed] [Green Version]
  86. Simons, Gary F., and Charles D. Fennig. 2018. Ethnologue: Languages of the World, Twenty-first edition. Dallas: SIL International, Available online: http://www.ethnologue.com (accessed on 6 February 2020).
  87. Soveri, Anna, Matti Laine, Heikki Hämäläinen, and Kenneth Hugdahl. 2011a. Bilingual advantage in attentional control: Evidence from the forced-attention dichotic listening paradigm. Bilingualism: Language and Cognition 14: 371–78. [Google Scholar] [CrossRef]
  88. Soveri, Anna, Antoni Rodriguez-Fornells, and Matti Laine. 2011b. Is There a Relationship between Language Switching and Executive Functions in Bilingualism? Introducing a within group Analysis Approach. Frontiers in Psychology 2. [Google Scholar] [CrossRef] [PubMed] [Green Version]
  89. Streiner, David L. 2003. Starting at the Beginning: An Introduction to Coefficient Alpha and Internal Consistency. Journal of Personality Assessment 80: 99–103. [Google Scholar] [CrossRef]
  90. Teubner-Rhodes, Susan E., Alan Mishler, Ryan Corbett, Llorenç Andreu, Monica Sanz-Torrent, John C. Trueswell, and Jared M. Novick. 2016. The effects of bilingualism on conflict monitoring, cognitive control, and garden-path recovery. Cognition 150: 213–31. [Google Scholar] [CrossRef]
  91. Torchiano, Marco. 2019. Effsize: Efficient Effect Size Computation, R package version 0.7.6; Available online: https://CRAN.R-project.org/package=effsize (accessed on 28 January 2020). [CrossRef]
  92. Torregrossa, Jacopo, Christiane Bongartz, and Ianthi Maria Tsimpli. 2019. Bilingual reference production: A cognitive-computational account. Linguistic Approaches to Bilingualism 9: 569–99. [Google Scholar] [CrossRef]
  93. Tsimpli, Ianthi, Lina Mukhopadhyay, Jeanine Treffers-Daller, Suverna Alladi, Theodoros Marinis, Minati Panda, Anusha Balasubramanian, and Pallawi Sinha. 2019. Multilingualism and multiliteracy in primary education in India: A discussion of some methodological challenges of an interdisciplinary research project. Research in Comparative and International Education 14: 54–76. [Google Scholar] [CrossRef] [Green Version]
  94. Tsujita, Yuko. 2009. Deprivation of Education in Urban Areas: A Basic Profile of Slum Children in Delhi, India. Institute of Developing Economies, Japan External Trade Organization (JETRO) 199: 8–10. [Google Scholar]
  95. Unsworth, Sharon. 2013. Assessing the role of current and cumulative exposure in simultaneous bilingual acquisition: The case of Dutch gender. Bilingualism: Language and Cognition 16: 86–110. [Google Scholar] [CrossRef]
  96. Ursache, Alexandra, and Kimberly G. Noble. 2016. Neurocognitive development in socioeconomic context: Multiple mechanisms and implications for measuring socioeconomic status. Psychophysiology 53: 71–82. [Google Scholar] [CrossRef] [PubMed] [Green Version]
  97. Ursachi, George, Ioana Alexandra Horodnic, and Adriana Zait. 2015. How Reliable are Measurement Scales? External Factors with Indirect Influence on Reliability Estimators. Procedia Economics and Finance 20: 679–86. [Google Scholar] [CrossRef] [Green Version]
  98. Vasanta, Duggirala, Suvarna Alladi, Jala Sireesha, and Surampudi Bapi Raju. 2010. Language Choice and Language use Patterns among Telugu-Hindi/Urdu-English Speakers in Hyderabad, India. In Proceedings of the International Conference on Language, Society and Culture in Asian Contexts. Maha Sarakham: Mahasarakam University. [Google Scholar]
  99. Vuontela, Virve, Maija-Riikka Steenari, Synnove Carlson, Juha Koivisto, Mika Fjällberg, and Eeva T. Aronen. 2003. Audiospatial and visuospatial working memory in 6–13 year old school children. Learning and Memory 10: 74–81. [Google Scholar] [CrossRef] [PubMed] [Green Version]
  100. Walker, Susan P., Theodore D. Wachs, Sally Grantham-McGregor, Maureen M. Black, Charles A. Nelson, Sandra L. Huffman, Helen Baker-Henningham, Susan M. Chang, Jena D. Hamadani, Betsy Lozoff, and et al. 2011. Inequality in early childhood: Risk and protective factors for early child development. The Lancet 378: 1325–38. [Google Scholar] [CrossRef]
  101. Weichbold, Viktor, and Hermann Herka. 2003. Performance of hearing impaired children on Raven’s Coloured Progressive Matrices Test. International Journal of Pediatric Otorhinolaryngology 67: 1213–17. [Google Scholar] [CrossRef]
  102. Weyandt, Lisa L., and W. Grant Willis. 1994. Executive functions in school-aged children: Potential efficacy of tasks in discriminating clinical groups. Developmental Neuropsychology 10: 27–38. [Google Scholar] [CrossRef]
  103. Yow, W. Quin, and Xiaoqian Li. 2015. Balanced bilingualism and early age of second language acquisition as the underlying mechanisms of a bilingual executive control advantage: Why variations in bilingual experiences matter. Frontiers in Psychology 6. [Google Scholar] [CrossRef] [Green Version]
  104. Zhang, Jun, and Shane T. Mueller. 2005. A note on ROC analysis and non-parametric estimate of sensitivity. Psychometrika 70: 203–12. [Google Scholar] [CrossRef] [Green Version]
1
In India there is no one national language. The Indian constitution in its 8th schedule recognizes 22 languages as scheduled languages. They are mostly also used as media of instruction as relevant to different Indian states. The languages are Assamese, Bangla, Bodo, Dogri, Gujarati, Hindi, Kashmiri, Kannada, Konkani, Maithili, Malayalam, Manipuri, Marathi, Nepali, Oriya, Punjabi, Tamil, Telugu, Sanskrit, Santali, Sindhi, and Urdu. Two of these are classical languages, Sanskrit and Tamil, as recognized by the Indian constitution. Hindi and English function as link languages, with the central government recognizing Hindi as the official language and English as the provisional sub-language (Devy 2018).
2
Based on this finding, we re-examined whether the findings on bilingualism and sociolinguistic diversity influencing Raven’s scores still held when city was taken into account as an independent variable in the model. The results show that the effects of bilingualism and the interaction between bilingualism and sociolinguistic diversity were unaffected by the addition of city as a factor.
Figure 1. Distribution of the scores on sociolinguistic diversity (left graph) and socio-economic status (SES, right graph), based on the questionnaires.
Languages 05 00010 g001
Figure 2. Distribution of the scores of sociolinguistic diversity for bilinguals and monolinguals (left graph) and socio-economic status (SES) for children from schools in slum and non-slum areas (right graph). Purple areas reflect the overlap between the two groups on the sociolinguistic diversity or SES scores.
Languages 05 00010 g002
Figure 3. Correlation matrix presenting the correlations between the cognitive scores and the socio-economic and sociolinguistic diversity scores investigated in this paper (SES = socio-economic status). Correlations with a blue or pink background are statistically significant at a 0.01 level.
Languages 05 00010 g003
Figure 4. Overview of the positive correlations between bilingualism and cognitive scores; 2-back score in the left graph and Raven’s score in the right graph.
Languages 05 00010 g004
Figure 5. Visual representation of the interaction between sociolinguistic diversity and bilingualism on the Raven’s score.
Languages 05 00010 g005
Figure 6. Distribution of scores on the 2-back task (left graph) and on the Raven’s task (right graph) for children from Delhi and Hyderabad. Purple areas reflect the overlap between the children from the two cities on the 2-back and Raven’s scores.
Languages 05 00010 g006
Table 1. Overview of the demographic information.
LocationNumber GenderAge (SD)Age RangeMedium of InstructionSchool Site
Delhi371178 f, 193 m8.75 (0.65)8–1275 Hindi,
296 English
173 slum,
198 non-slum
Hyderabad316176 f, 140 m9.56 (1.20)8–15199 Telugu,
117 English
170 slum,
146 non-slum
Total687354 f, 333 m9.12 (1.03)8–15274 regional language,
413 English
343 slum,
344 non-slum
Table 2. Overview of the average scores on the cognitive tasks and the questionnaires (SES = socio-economic status; SD = standard deviation).
Location Raven’s Raw Score (SD)n-Back
A-Prime (SD)
Sociolinguistic Diversity
max. 21 (SD)
SES
max. 10 (SD)
Delhimonolinguals
(n = 228, 61%)
20.1 (5.9)0.69 (0.14)14.9 (1.1)6.8 (1.0)
bilinguals
(n = 143, 39%)
21.1 (5.6)0.70 (0.15)15.4 (1.4)7.1 (1.2)
total Delhi20.5 (5.8)0.69 (0.14)15.1 (1.3)6.9 (1.0)
Hyderabadmonolinguals
(n = 175, 55%)
15.7 (5.1)0.65 (0.17)13.7 (3.0)8.2 (1.0)
bilinguals
(n = 141, 45%)
17.3 (6.2)0.69 (0.15)15.8 (2.6)8.4 (0.9)
total Hyderabad16.4 (5.7)0.67 (0.17)14.7 (3.0)8.3 (1.0)
Total averagemonolinguals
(n = 403, 59%)
18.2 (6.0)0.67 (0.15)14.4 (2.2)7.4 (1.2)
bilinguals
(n = 284, 41%)
19.2 (6.2)0.70 (0.15)15.6 (2.1)7.8 (1.2)
Total18.6 (6.1)0.68 (0.15)14.9 (2.3)7.5 (1.2)
Table 3. Overview of the percentage of monolingual and bilingual children in either English or regional language-medium of instruction schools (children in EMI (English Medium of Instruction), HMI (Hindi Medium of Instruction), and TMI (Telugu Medium of Instruction) schools).
LocationMonolingualsBilingualsSociolinguistic Diversity
Delhi46.1% EMI–53.9% HMI65.0% EMI–35.0% HMI15.0 EMI–15.2 HMI
Hyderabad18.3% EMI–81.7% TMI60.3% EMI–39.7% TMI15.5 EMI–14.2 TMI

