In this paper, the unsteady numerical calculation method is used to study the sealing characteristics of the rim seal. First, the unsteady characteristics of the sealing clearance are analyzed, and the relevant dependencies are obtained. Then, the influence of the cooling air flow rate on the flow characteristics and sealing performance is studied. Finally, the flow field and sealing characteristics of Seal-A, Seal-B, and Seal-C for typical working conditions are compared and analyzed. The effects of deep cavity in the stationary disk and the modified platform on the sealing performance are obtained.
3.1. Analysis of Unsteady Characteristics
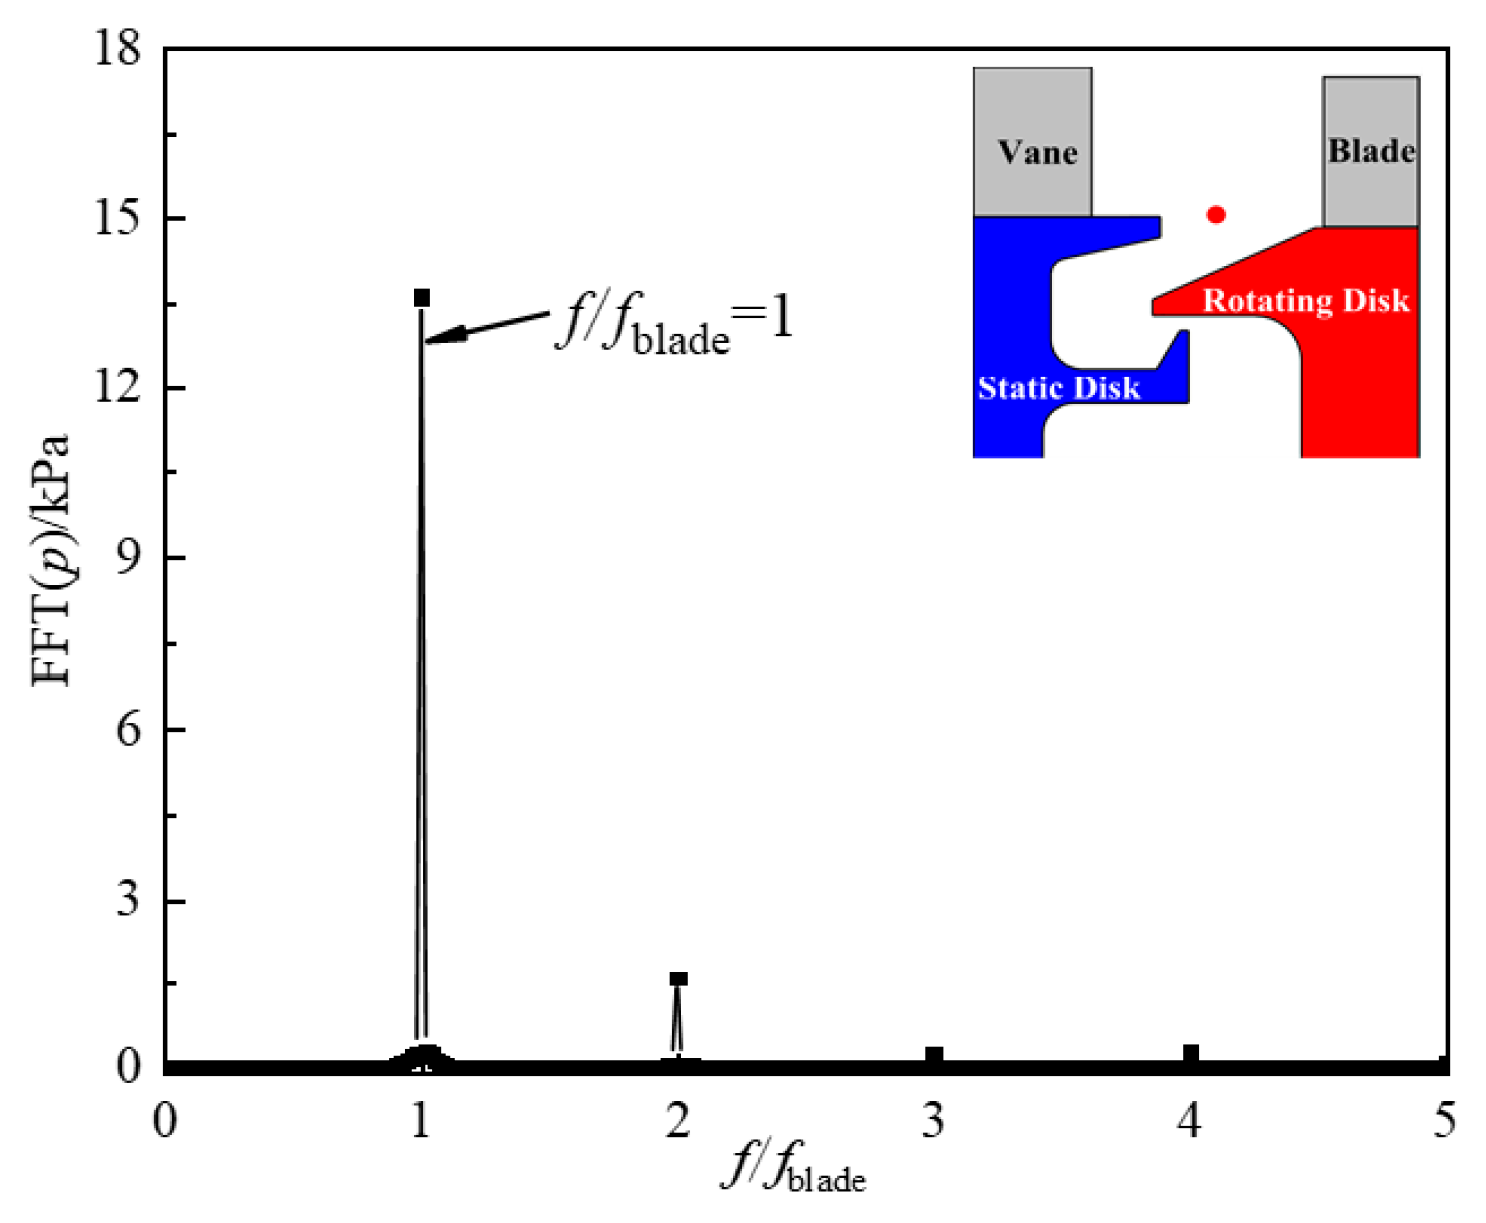
A monitoring point was selected at the sealing outlet of Seal-A to reveal the flow characteristics under a high load operating environment, and the pressure was sampled at each time step during the unsteady numerical calculations.
Figure 8 shows the frequency characteristics of the monitoring pressure at the sealing outlet obtained by a fast Fourier transform, where the horizontal coordinate is the dimensionless frequency, and
fblade is the frequency at which the blade rotates through the vane channel. It can be seen from
Figure 8 that the sealing clearance exit pressure is affected by many conditions, among which the interference between the blade and vane has a significant effect, corresponding to
f/fblade = 1 in the figure. A similar conclusion was obtained by Wang [
40] in an unsteady numerical study of the model with a 1:2 vane-to-blade ratio under experimental operating conditions. The main influencing frequency is
fblade. When the leading edge of the blade meets the high-pressure area of the vane trailing edge, the maximum pressure occurs at the sealing exit, and the ingress is the largest.
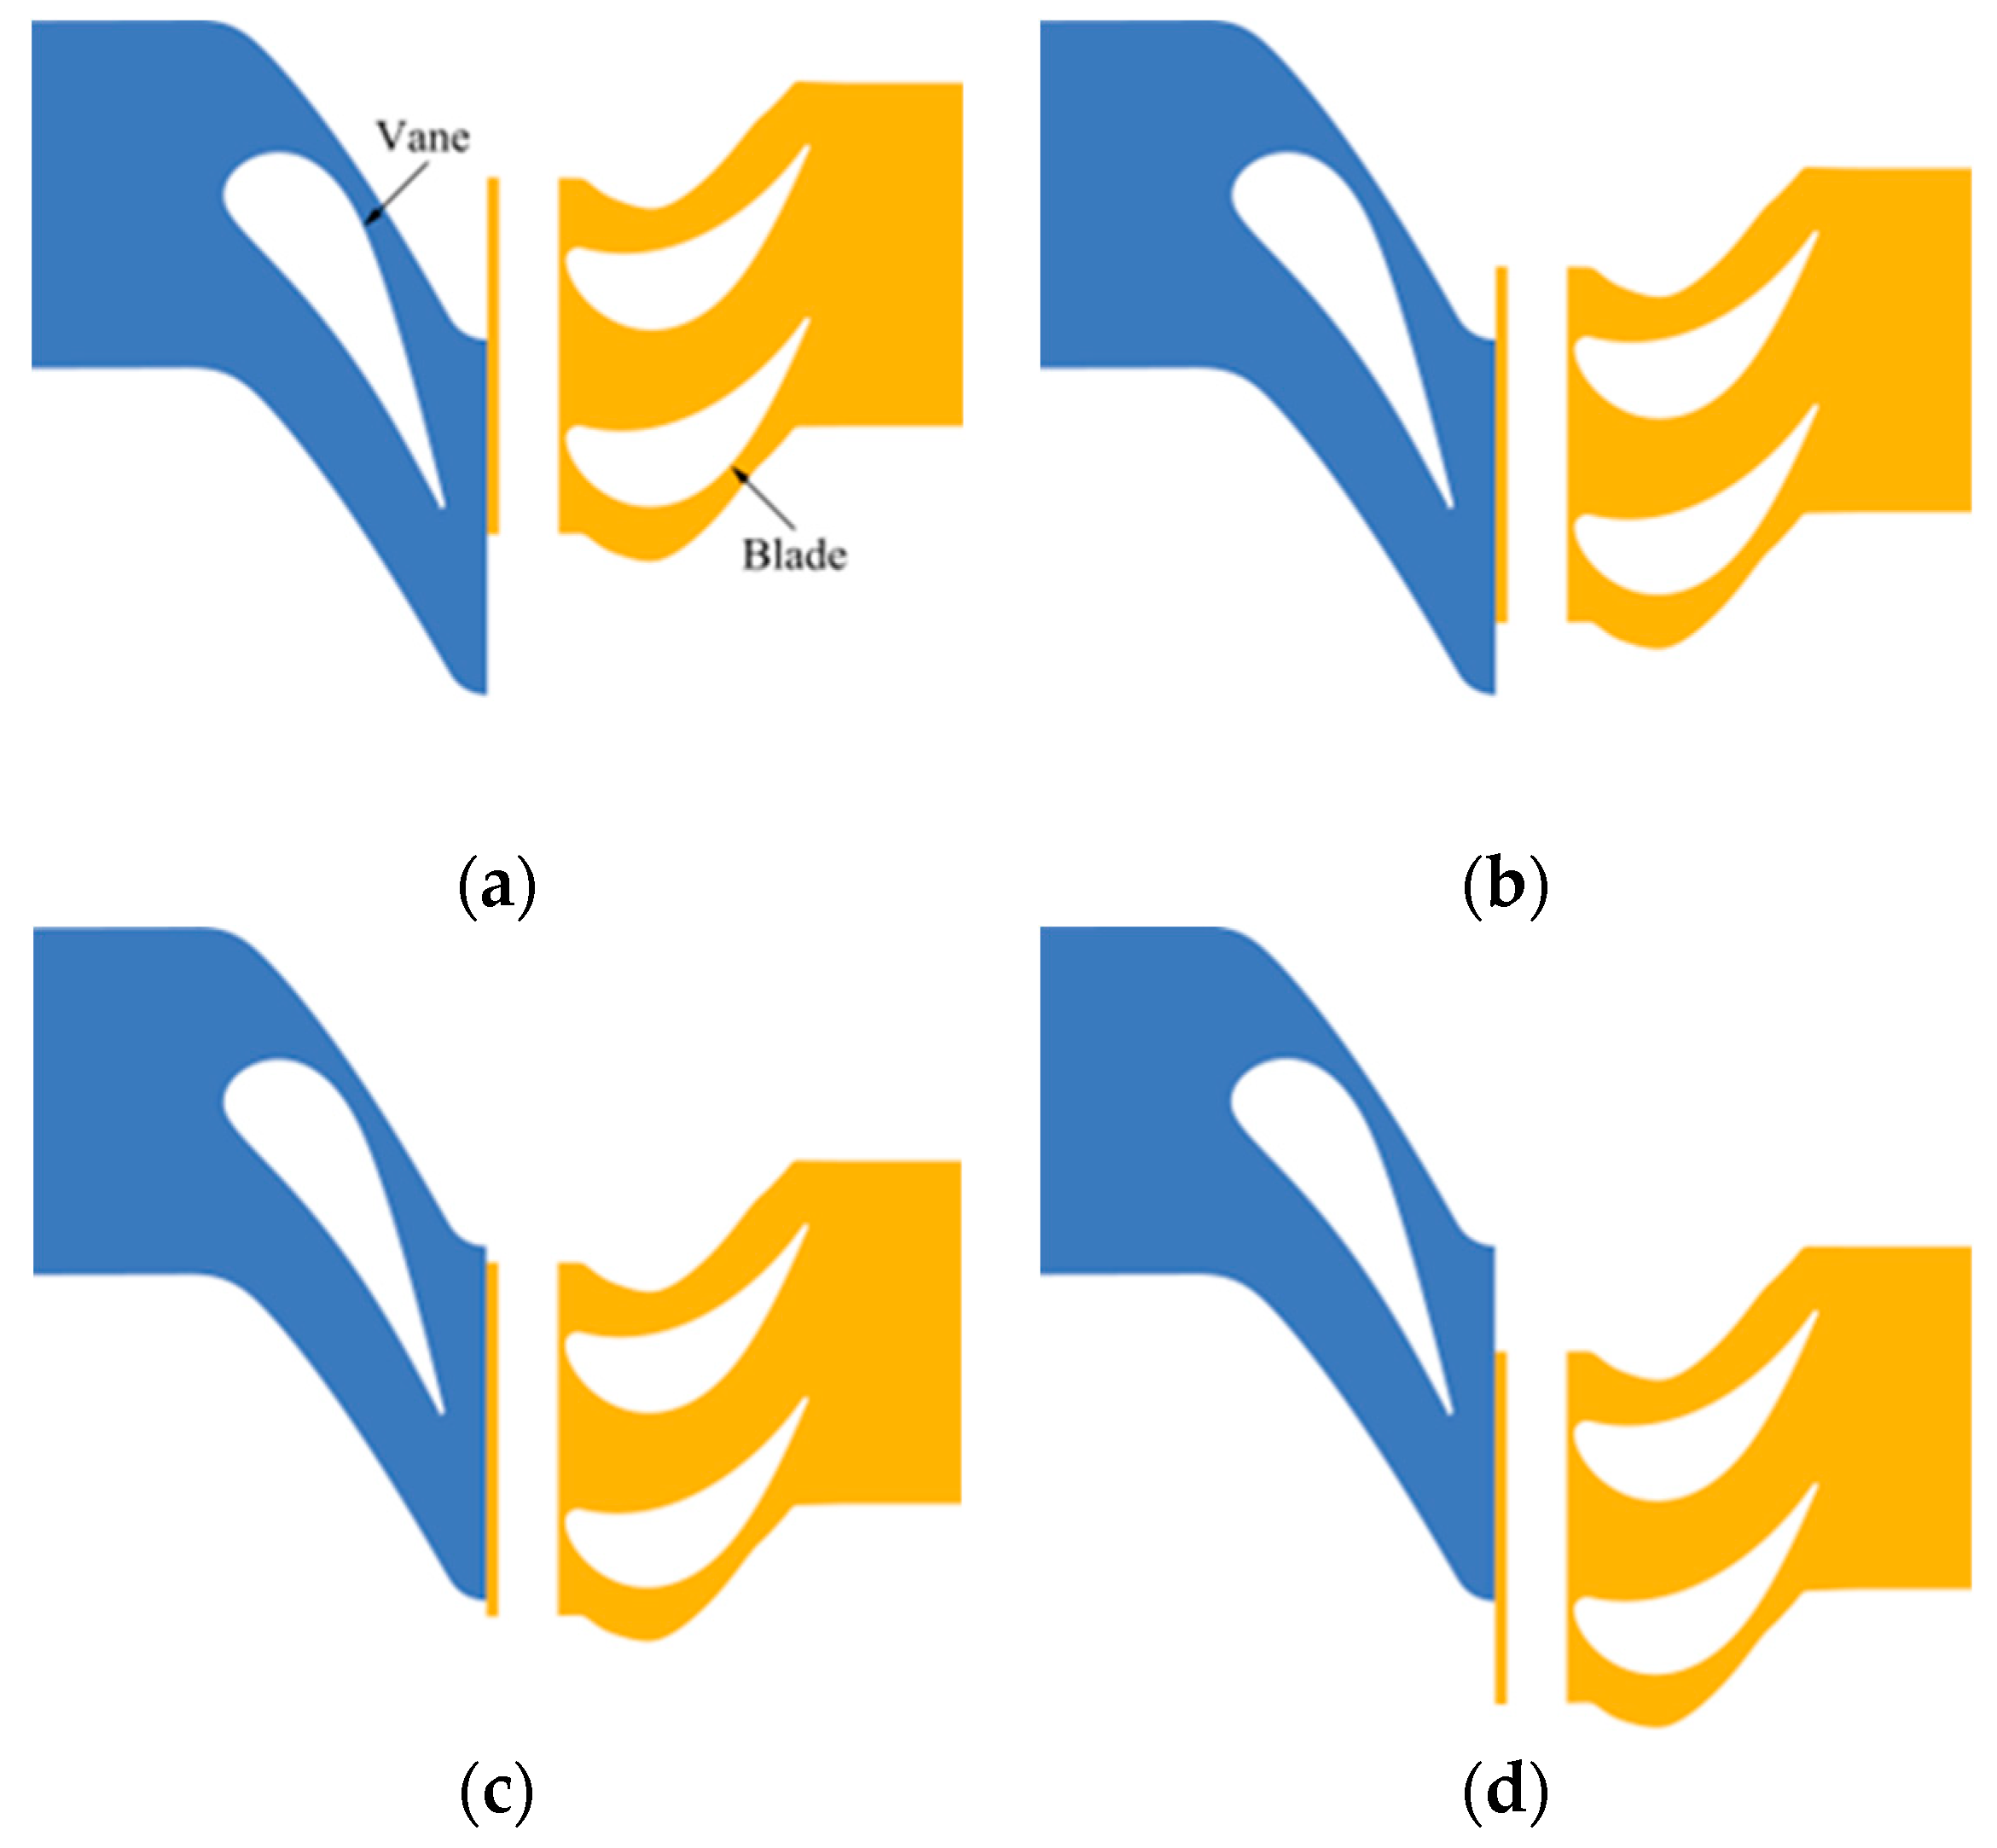
The relative positions of the vane and blade at different instants are shown in
Figure 9. The time for the blade to pass through a vane channel is
T, and the time between two adjacent instants in
Figure 9 is 1/4
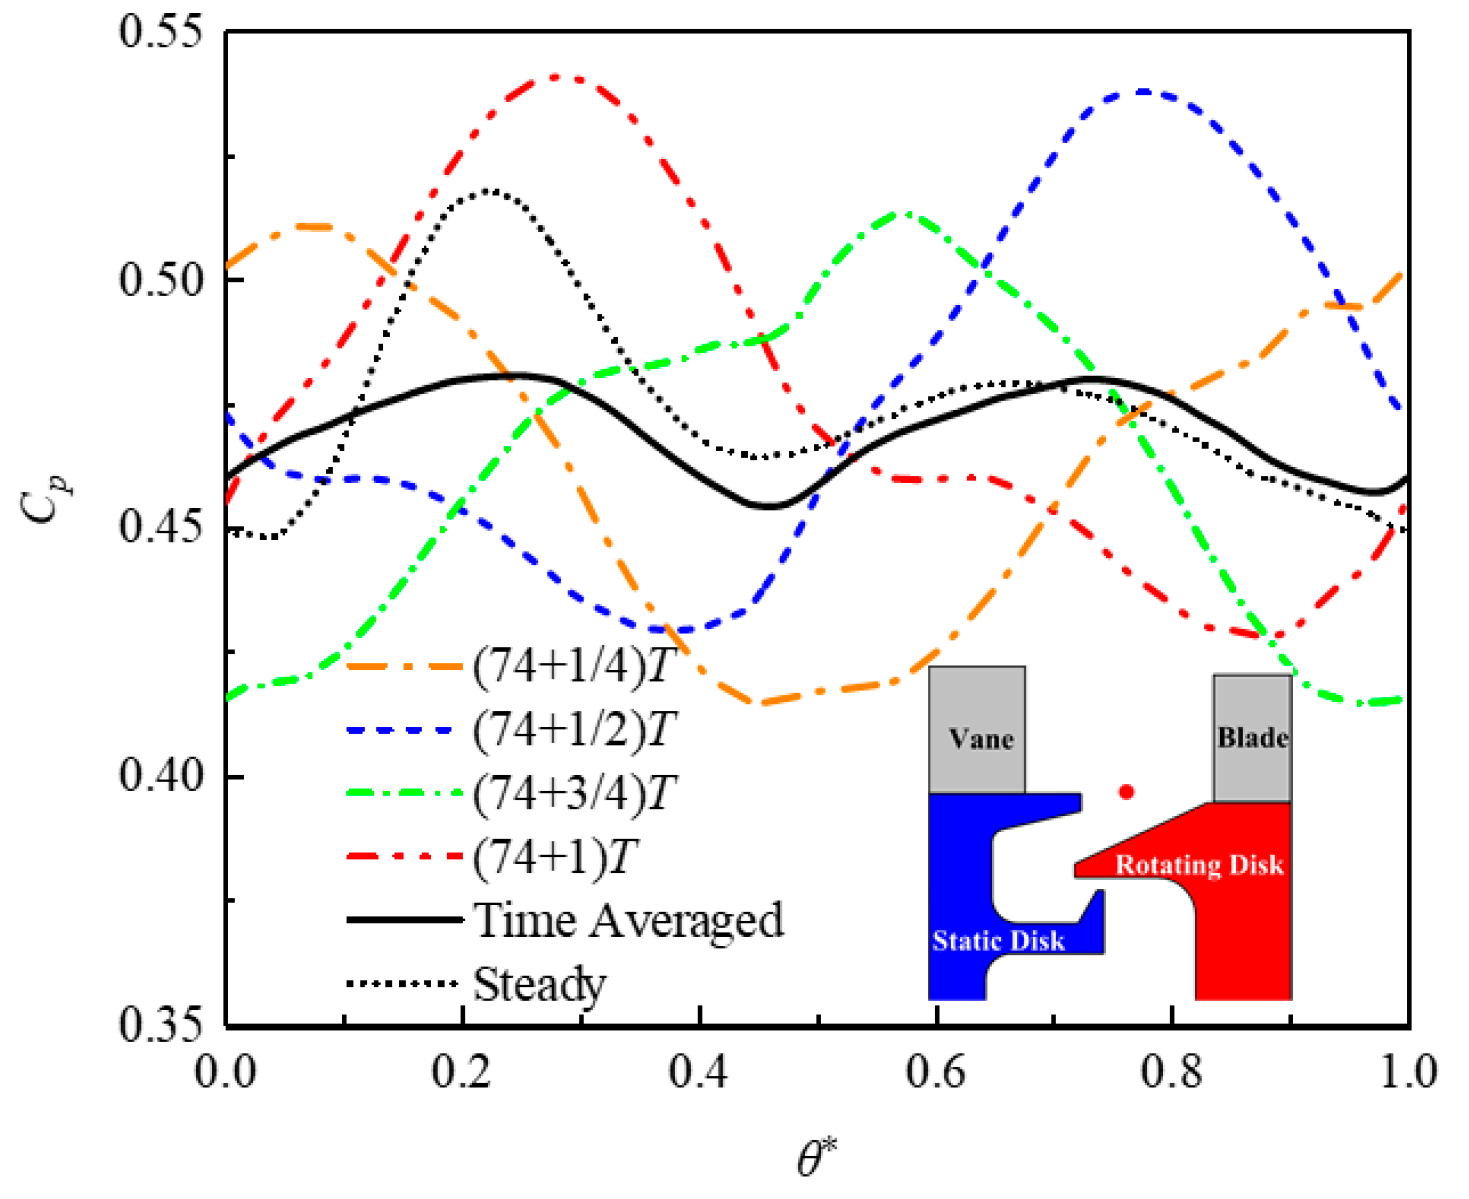
T. The circumferential pressure distribution at the sealing outlet is shown in
Figure 10. The pressure curve shows that at (74 + 1/2)
T and (74 + 1)
T, the trailing edge of the vane meets the leading edge of one of the two blades. The high-pressure area at the trailing edge of the vane and the high-pressure area at the blade’s leading edge are coupled with each other. The pressure reaches its maximum value at the trailing edge of the vane and is much higher than the time-averaged value. This is consistent with the behavior in the pressure spectrum analysis in
Figure 8.
At times (74 + 1/4)T and (74 + 3/4)T, the blade’s leading edge is far from the trailing edge of the vane. The trailing flow of the vane flows into the blade channel, the interaction with the blade’s leading edge is weakened, the maximum pressure is reduced, and the pressure fluctuation is reduced. The time-averaged pressure is calculated by averaging the pressure at each moment, smoothing the pressure fluctuation characteristics. However, the distribution characteristics of higher pressure at the blade leading edge (θ* ≈ 0.25 and θ* ≈ 0.75) and lower pressure at the blade channel’s leading edge can still be found from the curve distribution.
In the steady-state calculation, the relative position of the vane and blade does not change. The trailing edge of the vane is adjacent to the blade’s leading edge, and the pressure distribution trend is similar to (74 + 1)T. By comparing the transient and steady-state pressure circumferential distributions, it can be seen that the pressure peak is higher for the transient calculation than for the steady-state calculation, and the pressure valley for the transient calculation is lower than for the steady-state calculation. The circumferential pressure difference obtained from the transient calculation is much larger than the steady-state result. Therefore, the circumferential pressure fluctuation at the sealing outlet obtained from the steady-state calculation is smaller than from the transient calculation result, leading to more significant gas ingress in the transient calculation.
The change in the relative positions of the vane and blades affects the pressure distribution in the outlet area of the sealing clearance, which in turn affects the gas ingress and egress flow at the clearance.
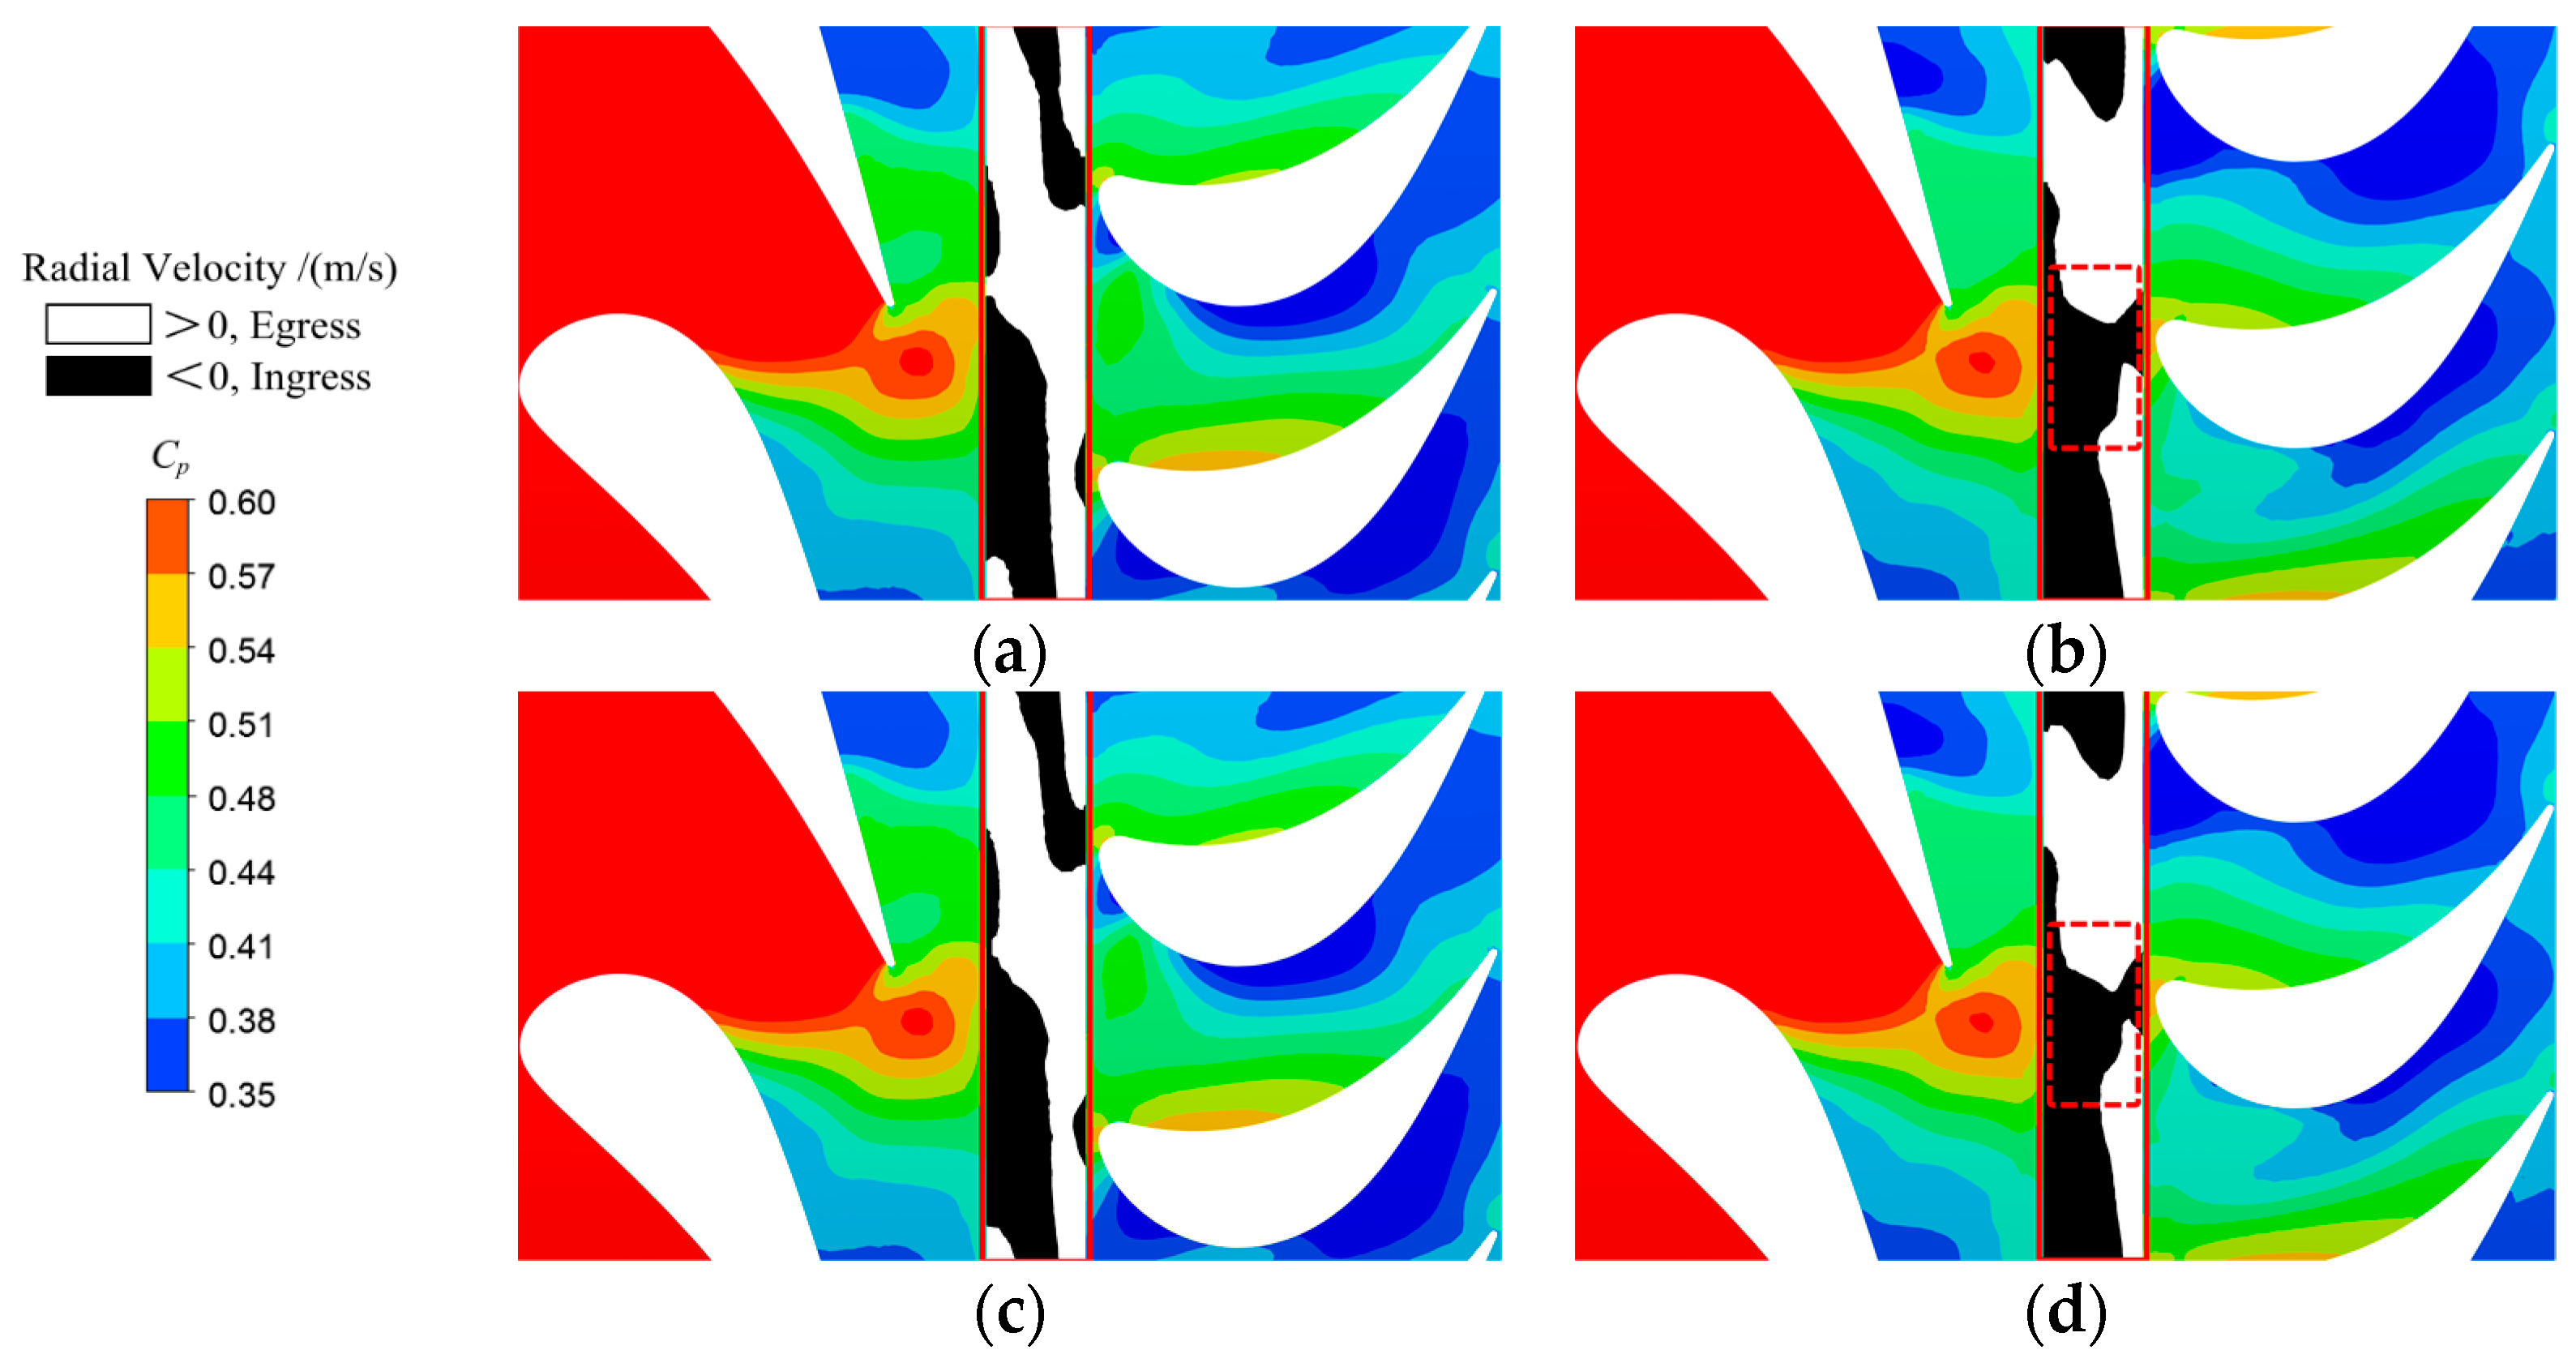
Figure 11 shows the pressure contours at the hub surface and the radial velocity contours at the sealing clearance exit at different times. The radial velocity directly reflects the gas ingress and egress flow at the sealing clearance. A radial velocity above zero indicates egress flow, and a radial velocity below zero indicates gas ingress.
As shown in the red dotted boxes in
Figure 11 at (74 + 1/2)
T and (74 + 1)
T, the high-pressure area between the trailing edge of the vane and the leading edge of the blade results in a large negative radial velocity area at the clearance exit. The negative radial velocity area at the sealing clearance is relatively large, and more mainstream gas intrudes into the disk cavity. At (74 + 1/4)
T and (74 + 3/4)
T, the radial velocity at the sealing clearance is influenced by the vane trailing edge flow, and the negative radial velocity is mainly distributed in the region affected by the vane trailing edge flow. Compared with (74 + 1/2)
T and (74 + 1)
T, the negative radial velocity region area decreases, and the area of the positive radial velocity region increases at (74 + 1/4)
T and (74 + 3/4)
T. In other words, the gas ingress is relatively weaker, and the egress flow is relatively stronger.
The circumferential distribution of the sealing efficiency in the outflow area at the sealing outlet is given in
Figure 12. The transient calculation results are time-averaged values. By comparing the sealing efficiency curves, it can be seen that the sealing efficiency at the sealing outlet obtained by the steady-state calculation is higher than for the transient calculation. This is because the vane–blade interaction, the unsteady flow characteristics of the vane trailing flow, and other flow characteristics are considered in the transient calculation. These causes increase the ingress of mainstream gas, thus reducing the sealing efficiency. Therefore, the sealing efficiency at the disk cavity under steady-state calculation is higher than that under the transient calculation.
3.2. Influence Analysis of Cooling Air Flow Rate
According to the gas ingress mechanism, it is known that externally induced ingress is the main ingress pathway. The mainstream gas flows into the disk cavity when the local pressure in the mainstream channel is higher than in the disk cavity. Egress flow occurs when the pressure in the mainstream channel is less than in the disk cavity. The circumferential pressure distribution around the endwall is closely related to the ingress and egress flows.
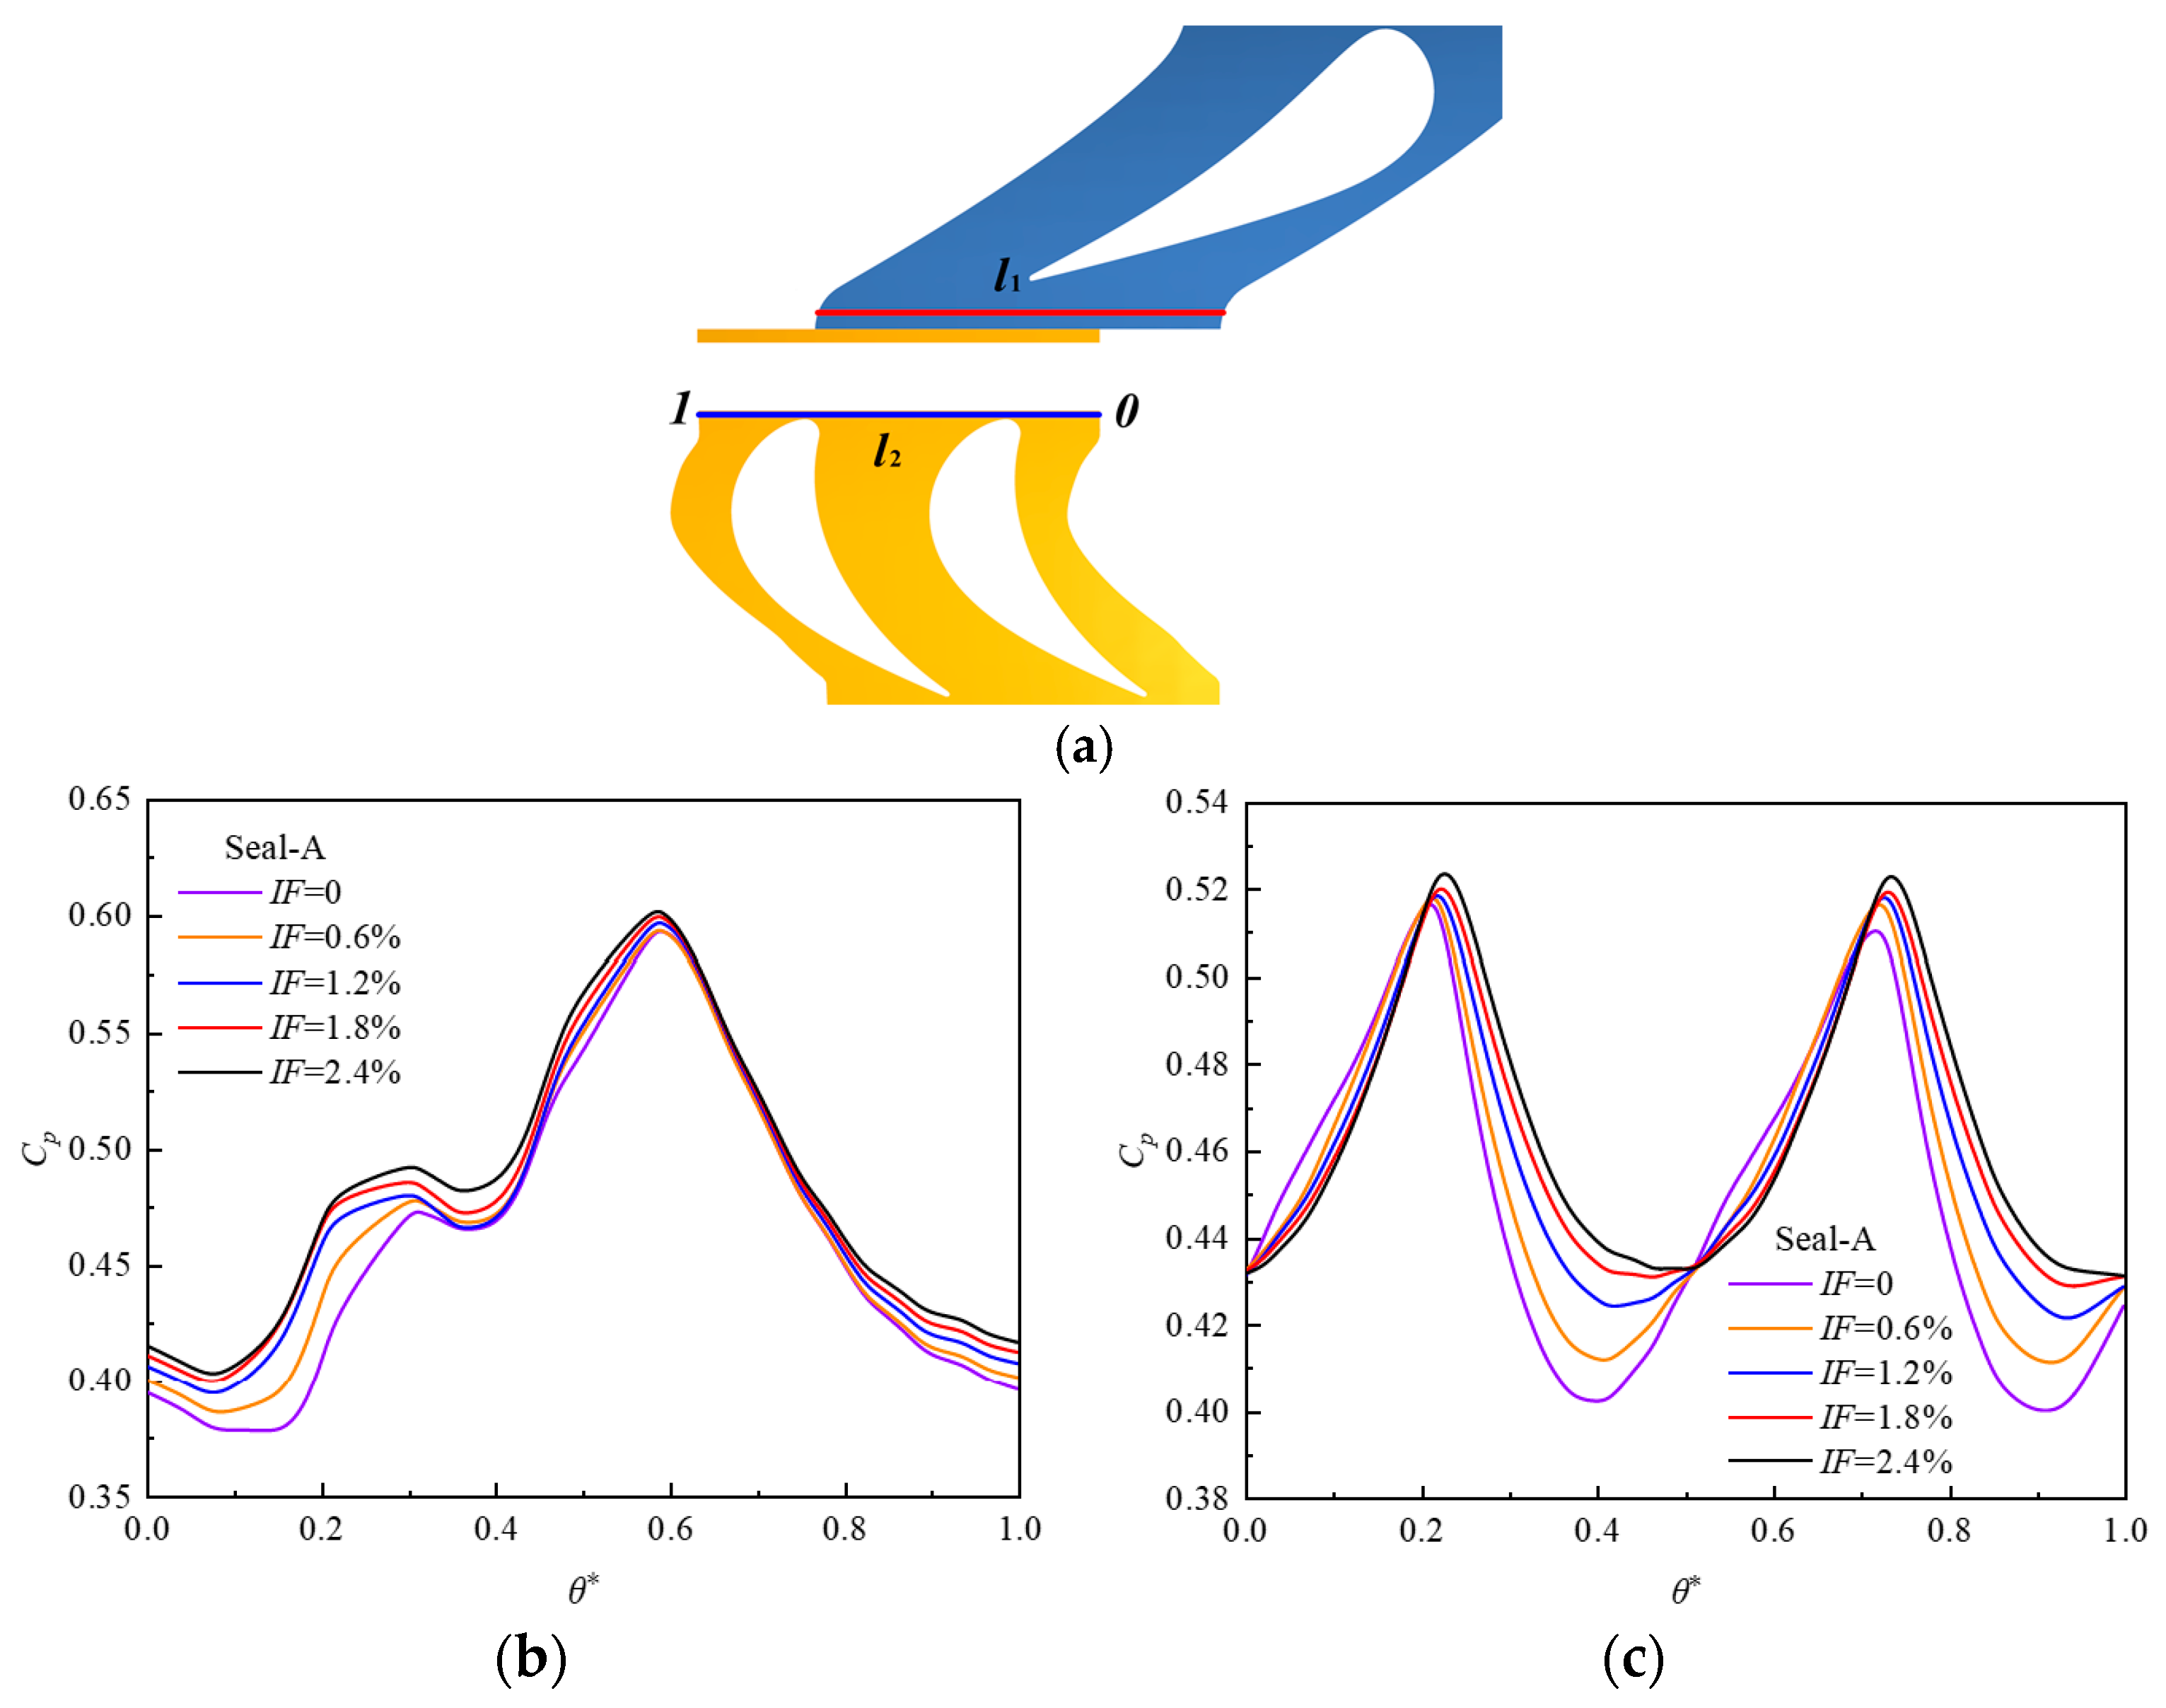
Figure 13 shows the time-averaged static pressure coefficient
Cp distribution in the circumferential direction at
l1 (downstream of the vane trailing edge) and
l2 (upstream of the blade leading edge). It can be seen from
Figure 13a that the static pressure just downstream of the vane trailing edge at the five flow ratios shows the same fluctuation in the circumferential direction. The pressure peak at
θ* = 0.6 corresponds to high pressure at the vane trailing flow, which causes gas ingress into the disk cavity. The pressure peak at
θ* = 0.3 is due to the shock wave on the suction surface of the vane, with a high-pressure region appearing after the shock wave. Adding cooling air flow strengthens the egress flow, influencing the pressure field at the clearance outlet and in turn affecting the circumferential pressure distribution downstream of the vane trailing edge and upstream of the blade leading edge. Increasing the cooling air flow significantly improves the pressure coefficients at
l1.
As seen in
Figure 13b, the pressure peaks at
θ* = 0.2 and
θ* = 0.7 correspond to the high pressure at the two blade leading edges. The higher pressure in this region is due to the potential field at the leading edge of the blades. Adding cooling air flow increases the pressure coefficients at
l2. The pressure peaks constantly approach the airflow stagnation point at the blade’s leading edge, and the pressure valleys approach the middle region of the blade cascade channel. As the cooling air flow ratio increases from 0% to 2.4%, the
Cp differences in the circumferential direction at
l1 and
l2 are reduced by 6.85% and 20.55%, respectively.
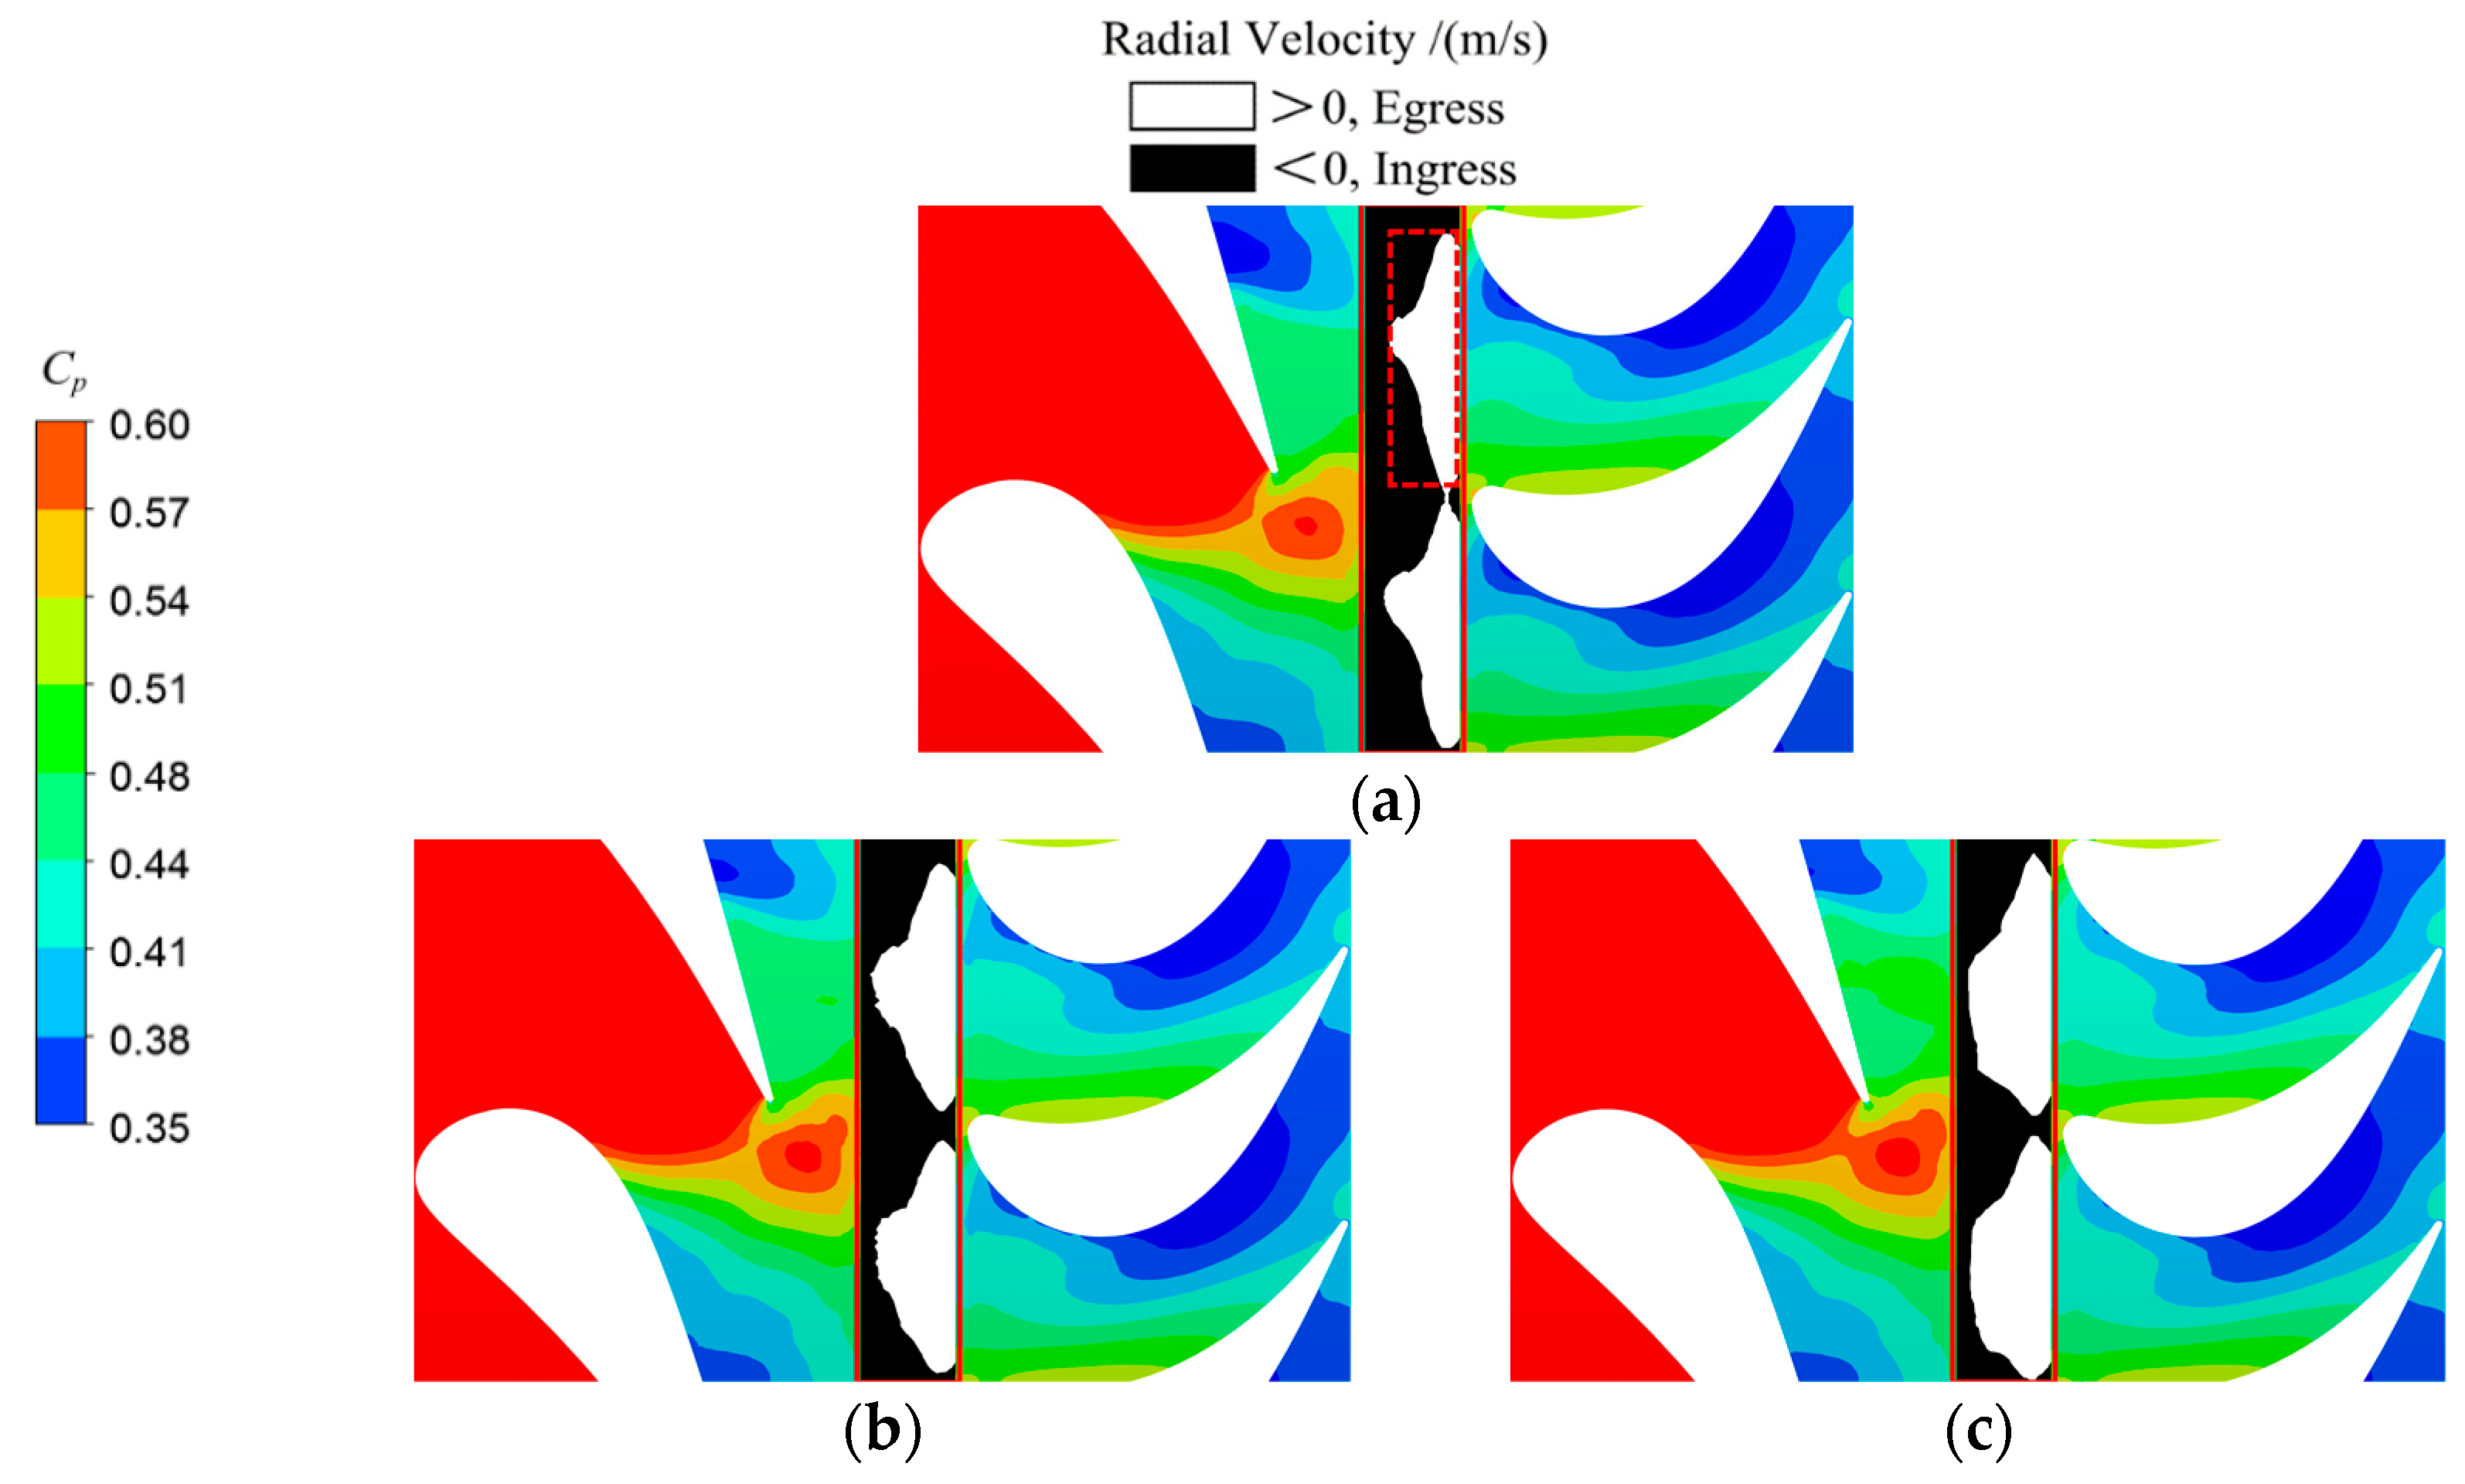
Figure 14 presents the time-averaged
Cp contour distributions at the endwall and the radial velocity contour distributions at the clearance outlet. From the radial velocity contour at the sealing clearance, the negative radial velocity region is mainly close to the high-pressure regions such as the vane trailing edge, the vane suction surface, and the blade leading edge. These areas correspond to the peak pressure areas in
Figure 13, and the negative radial velocity areas are mainly located at the stationary disk side. The positive radial velocity region is far from these high-pressure regions, and the egress flow is mainly near the rotating disk side and in the front area of the rotor cascade passage, as shown in the red-dashed box in the figure.
Comparing the time-averaged
Cp and radial velocity contours of Seal-A at the three flow ratios, the negative radial velocity region decreases continuously as the cooling air flow increases. This region is consistently concentrated in high-pressure areas, such as the vane trailing edge and blade leading edge, and the positive radial velocity region expands. In addition, the cooling airflow increases
Cp, both downstream of the vane trailing edge and upstream of the blade leading edge, corresponding to the results in
Figure 13.
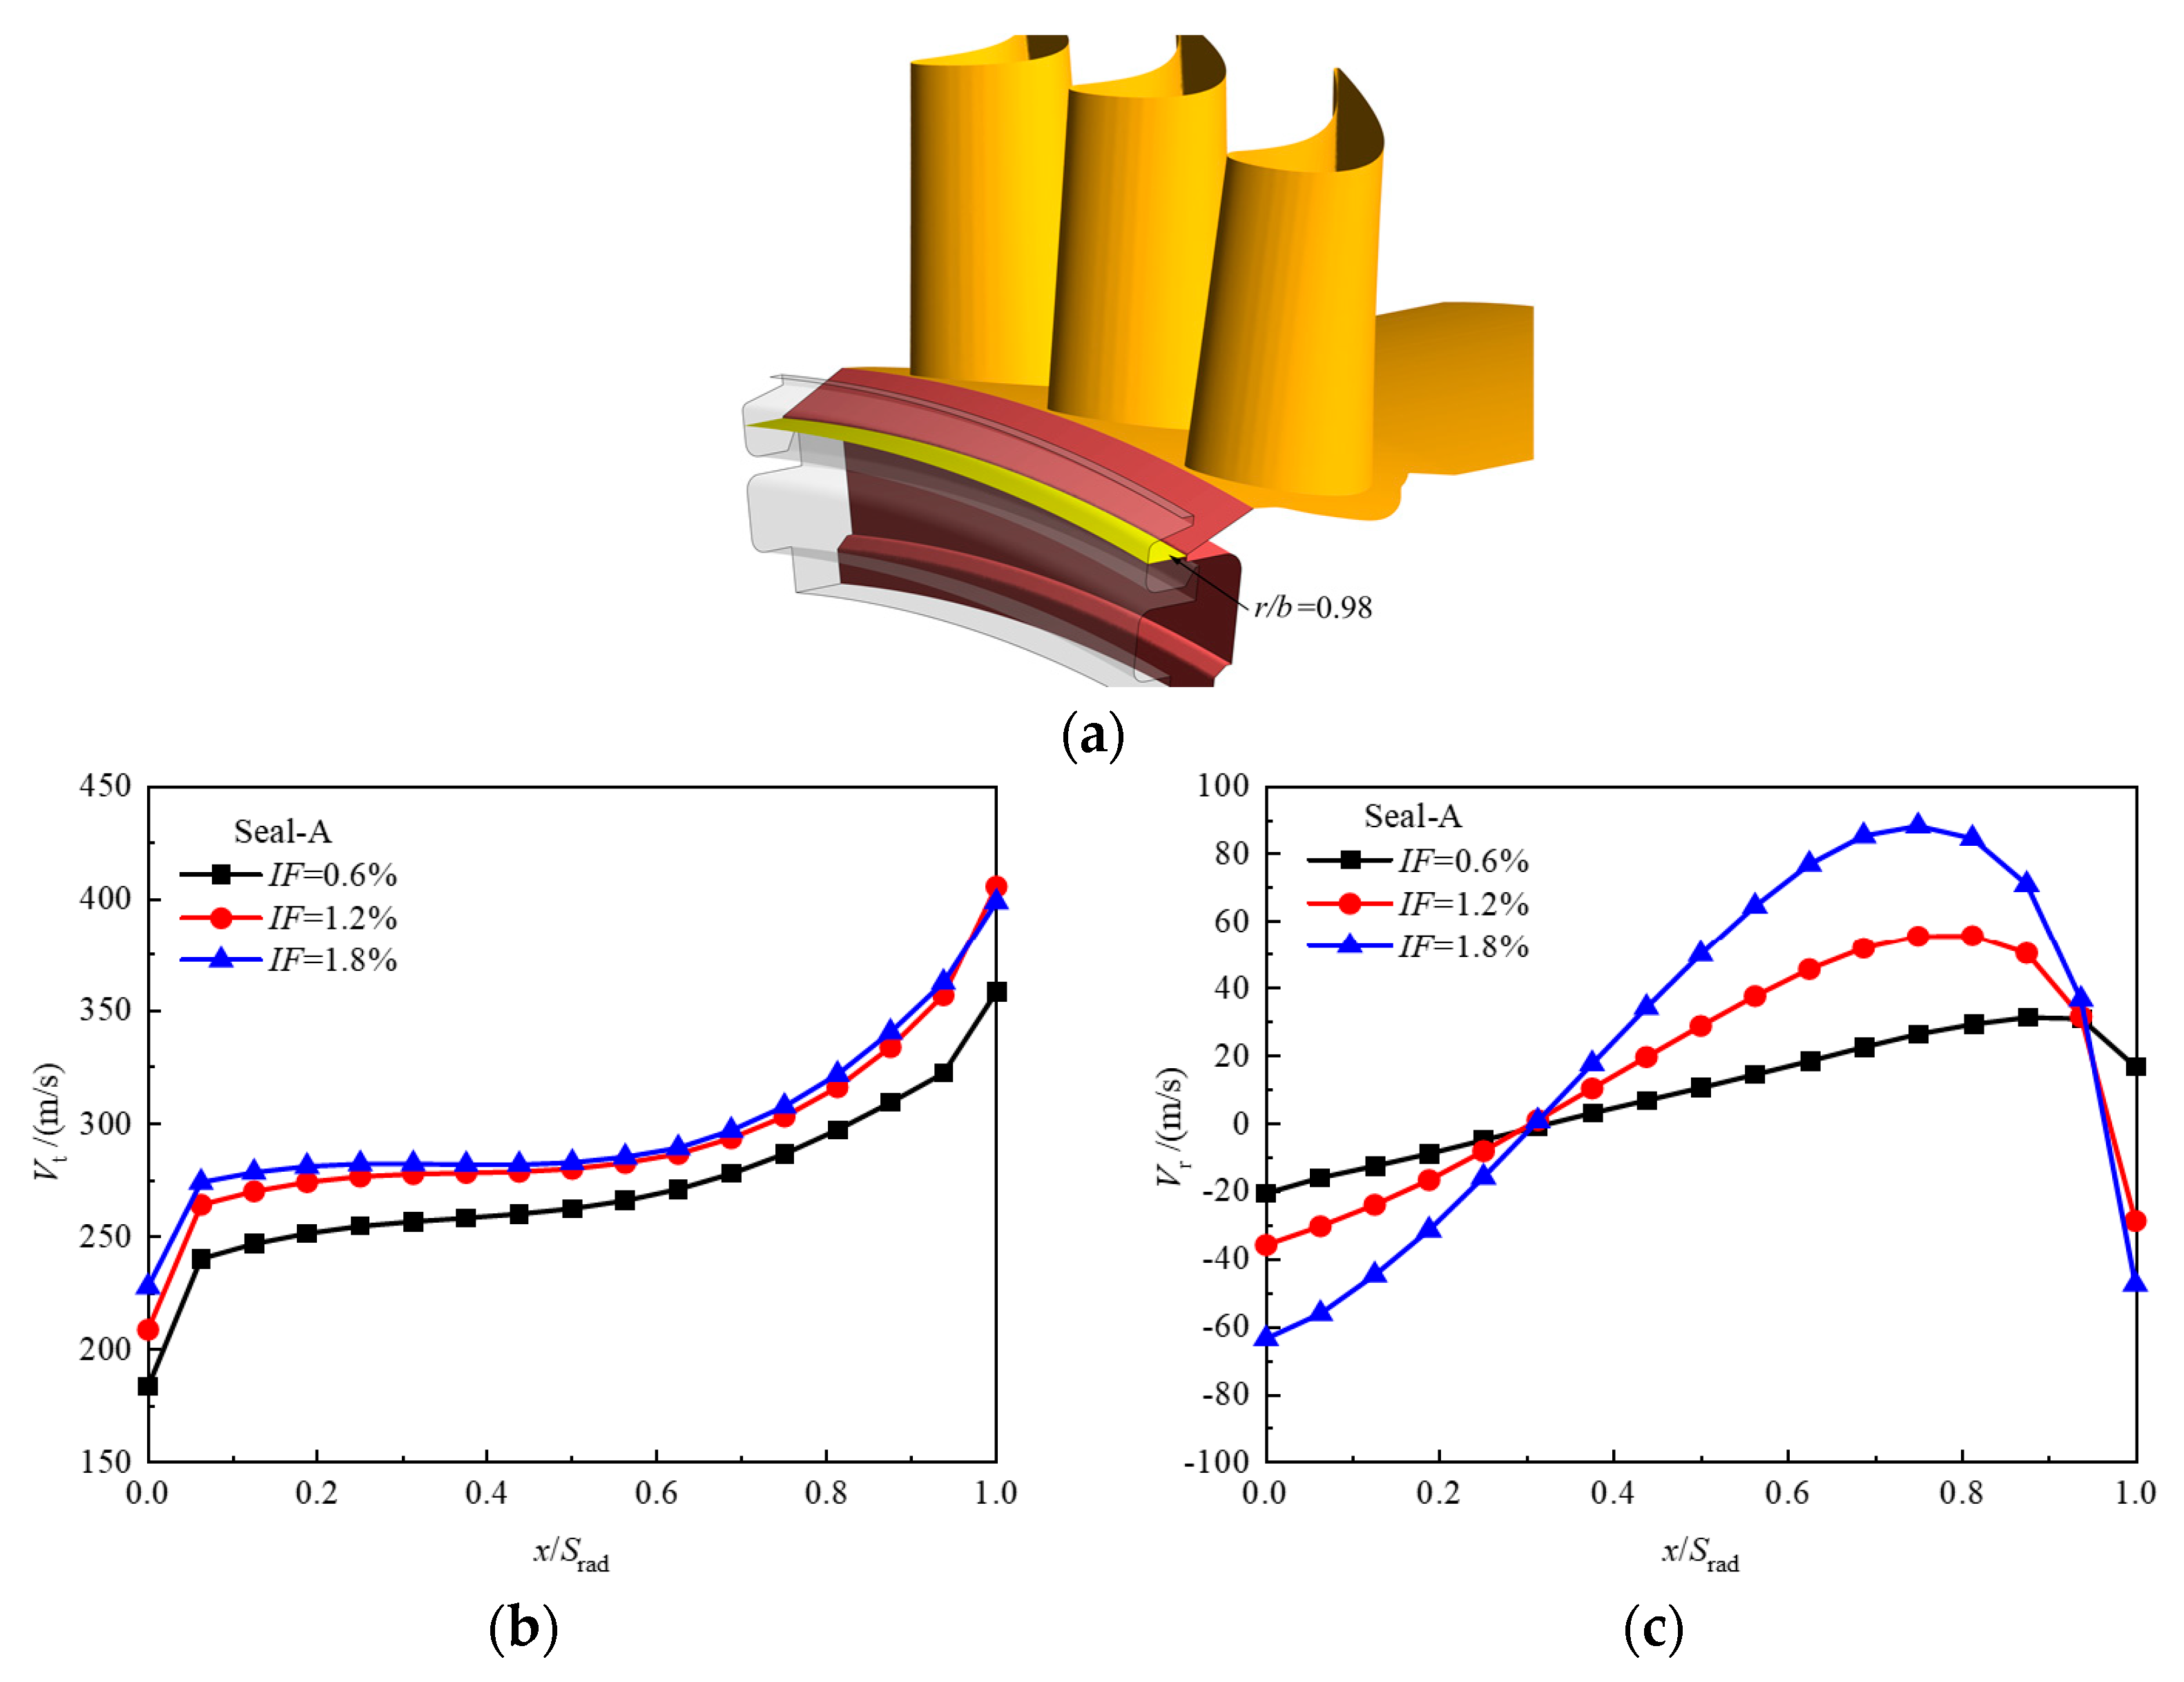
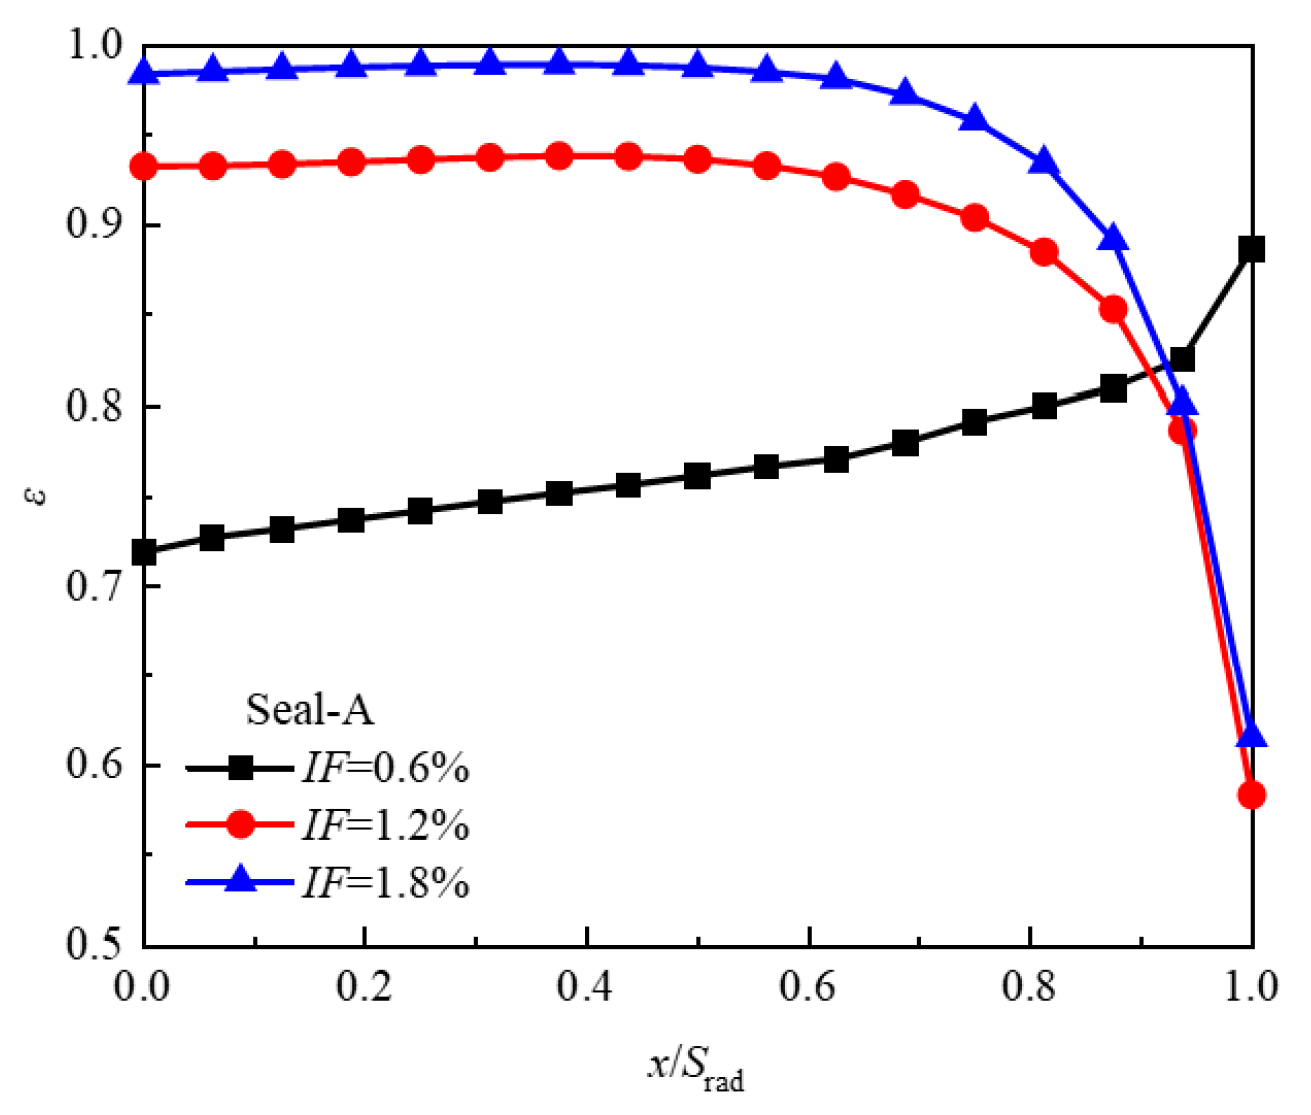
To clarify the flow state in the sealing clearance, the time-averaged tangential and radial velocity distributions along the axial direction in the middle section of the sealing cavity (
r/
b = 0.98) are given in
Figure 15. Here,
x/
Srad = 0 is defined as the axial position of the stationary disk wall, and
x/
Srad = 1 is defined as the axial position of the rotating disk wall. From
Figure 15a, a consistent tangential velocity variation trend occurs in the middle section of the sealing cavity for the three flow ratios, and the tangential velocity increases as the axial position approaches the rotating disk. By comparing the tangential velocity curves for the three flow ratios in
Figure 15a, it is found that an increasing flow ratio raises the tangential velocity values at each position in the axial direction.
In
Figure 15b, it can be observed that the radial velocity distribution in the central section of the sealing cavity is relatively complex. The speed near the rotating disk is greater than zero, and the speed value near the stationary disk is less than zero, indicating that the cooling air flows radially out from the rotating disk side, and the gas intrudes near the static disk side. Comparing the radial velocity curves in
Figure 15b, increasing the cooling air flow raises the maximum and minimum radial velocity magnitudes. The egress flow velocity near the rotating disk and the ingress velocity near the static disk both increase.
The larger the cooling air flow, the higher the maximum radial velocity, but its axial position is farther from the rotating disk. This is because a larger cooling air flow results in a higher axial velocity through the lower surface of the platform, so the airflow along the left side of the platform decreases, and more air flows radially outward, away from the rotating disk wall. The change in the radial outflow position also caused a change in the mainstream gas intruding along the outer surface of the platform, and a part of the mainstream gas intrudes along the left side of the platform. It can be seen from the curve that when x/Srad ≈ 1, the radial velocity drops rapidly and becomes negative, and this is more obvious for a larger cooling air flow rate.
The curves of the time-averaged sealing efficiency with the axial position in the middle plane of the sealing cavity are given in
Figure 16. As the cooling air flow increases, the sealing efficiency continuously increases in most areas of the cavity. The average values of the sealing efficiency were 0.74, 0.88, and 0.93, from the highest to lowest cooling air flow ratios. Increasing the cooling air flow improves the sealing efficiency in the disk cavity. In the area near the rotating disk, the sealing efficiency decreases because the increased cooling air flow causes the radial outflow core area to move to the middle of the disk cavity, and the mainstream gas is forced to intrude at the platform surface.
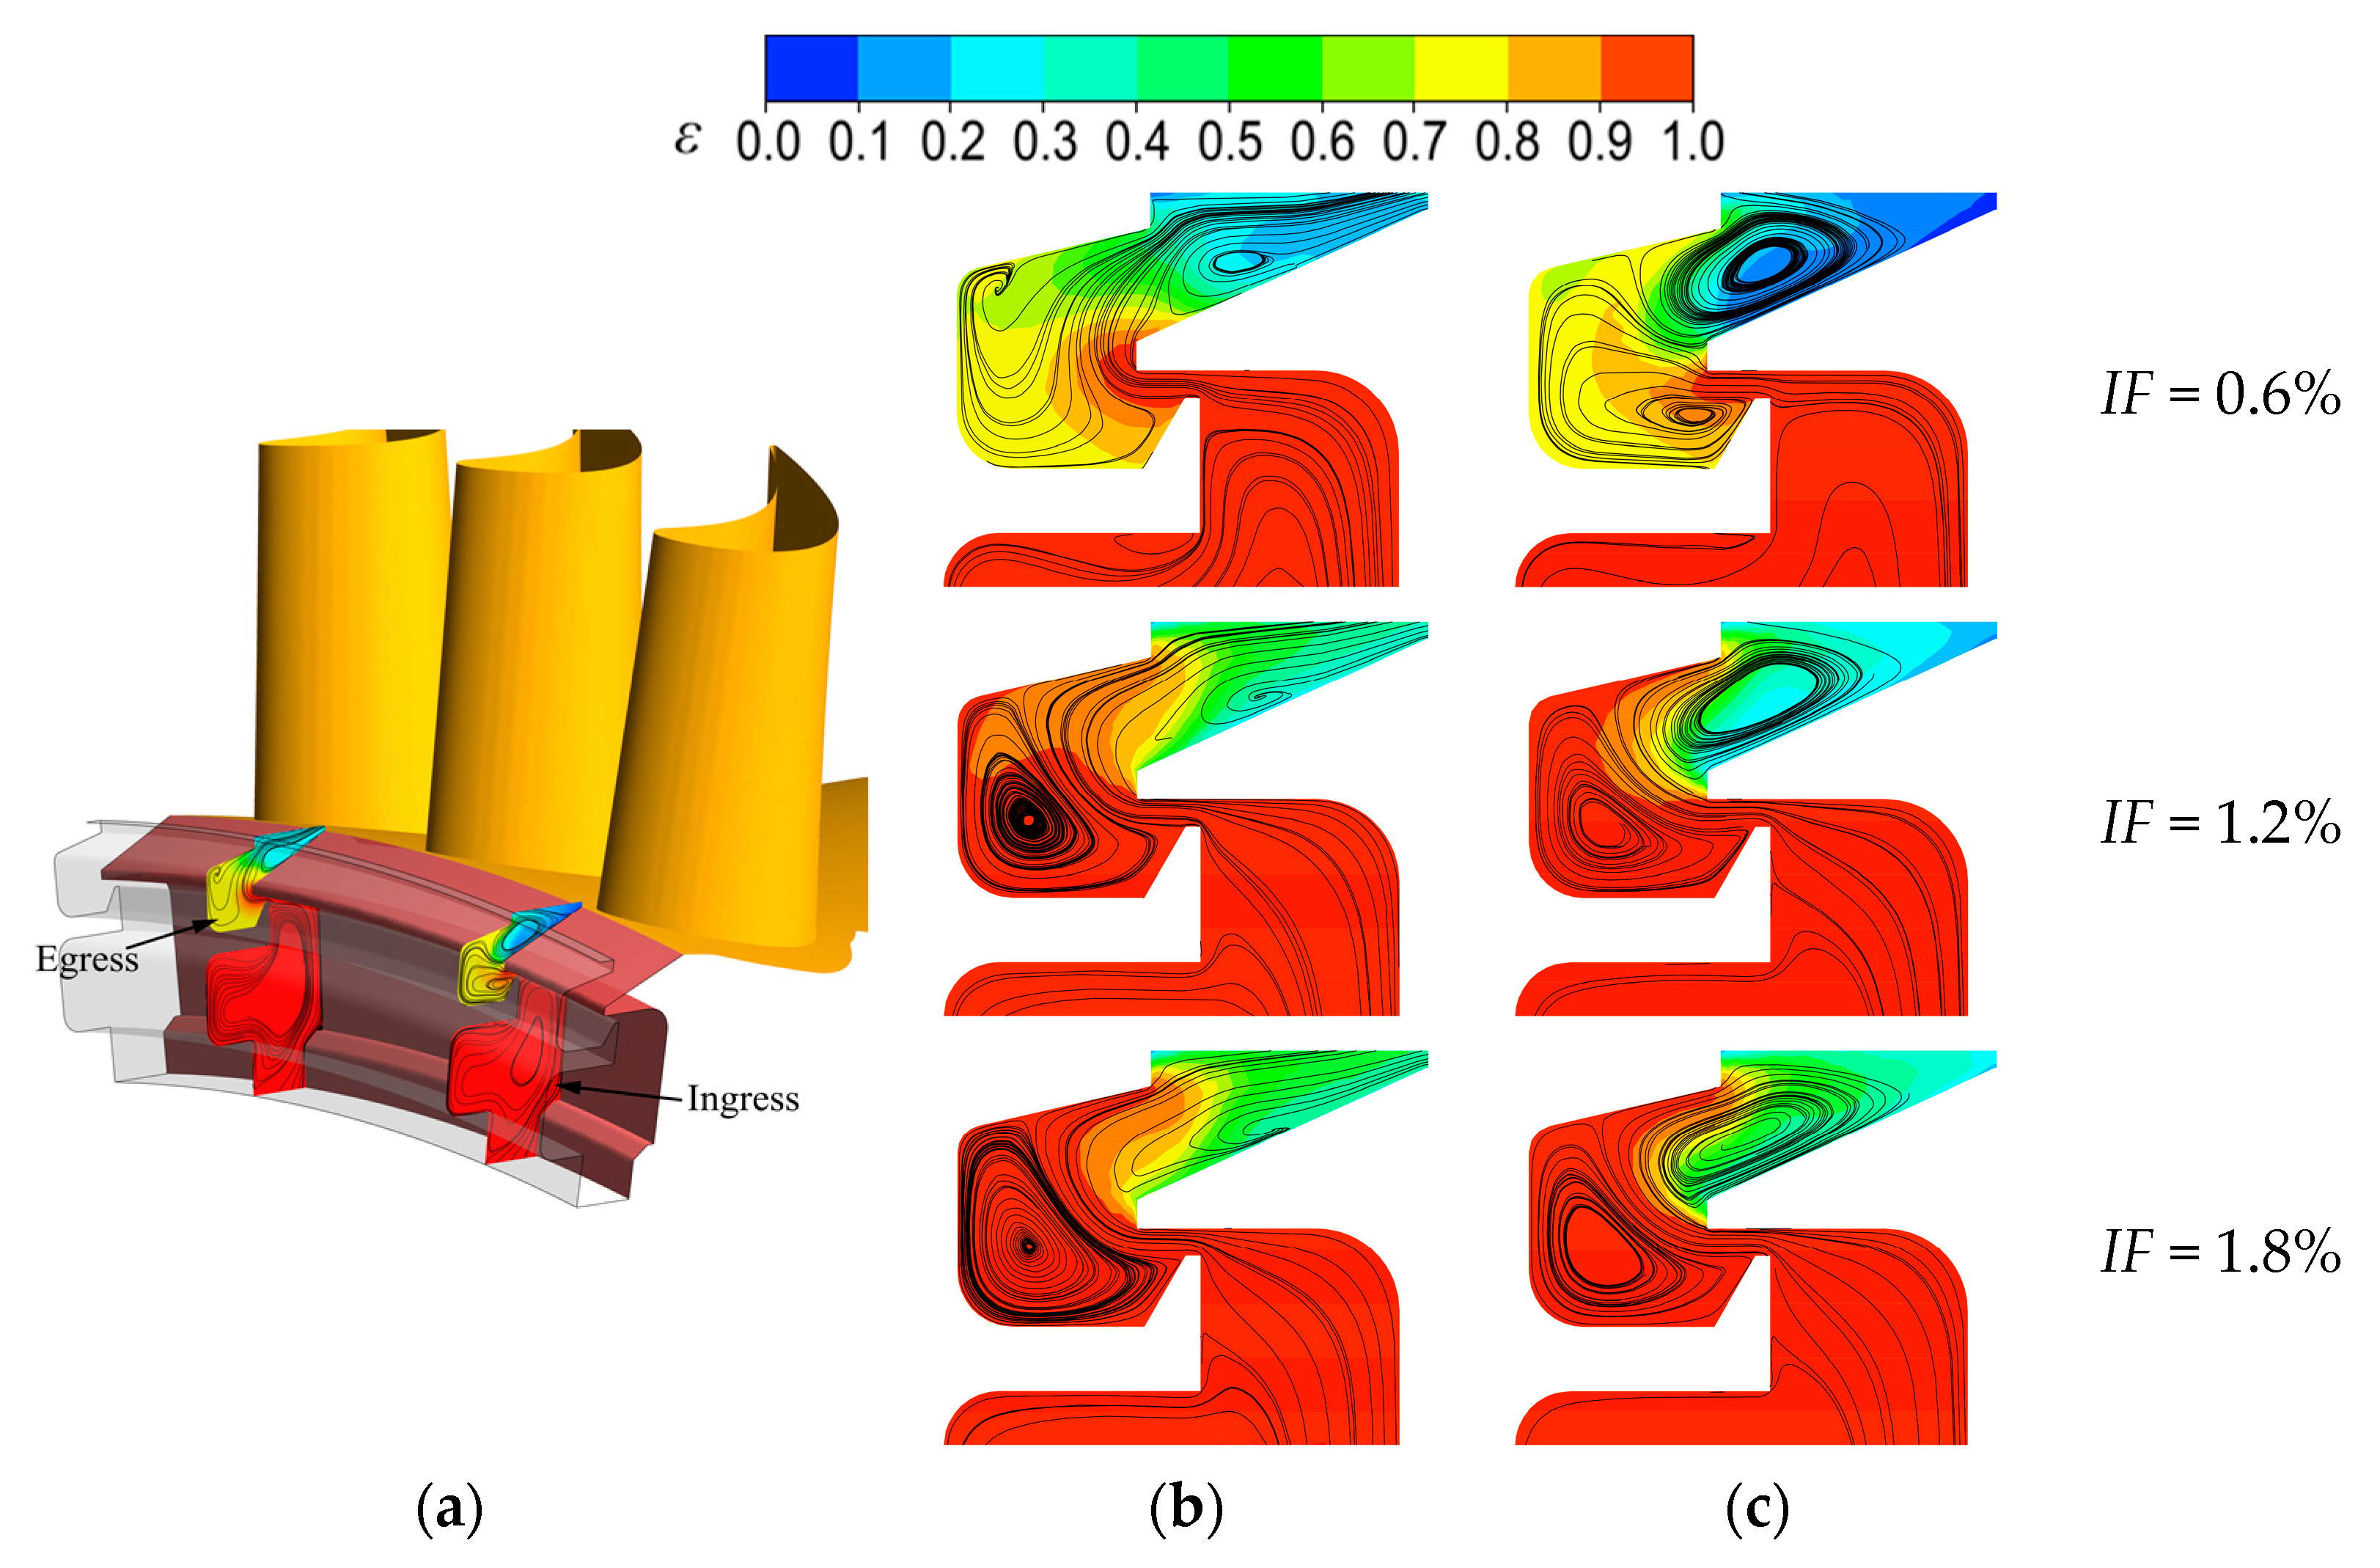
The time-averaged sealing efficiency contour distribution and the surface streamline at the ingress and egress sections in Seal-A are given in
Figure 17. The time-averaged ingress sections are at the blade’s leading edge, and the time-averaged egress sections are at the blade channel. The sealing structure in
Figure 17 is Seal-A, and flow ratios of 0.6%, 1.2%, and 1.8% are selected.
In the egress section, the pressure outside the sealing clearance is lower than the pressure inside the disk cavity, and the cooling air flows into the main flow channel along the surface of the rotating disk because of the rotating pump effect. The cold air flow is relatively small when the flow ratio is 0.6%. The cooling air flows into the sealing cavity along the lower surface of the rim platform and then directly flows radially into the clearance outlet along the left side surface of the platform. The airflow forms two vortex structures, on the left side of the sealing cavity and at the rim platform’s upper surface. With an increased cooling air ratio, the amount of cooling air flowing through the lower surface of the platform increases. The air no longer flows against the wall because of inertial effects but flows into the middle area of the sealing cavity first and then radially into the sealing outlet. On the one hand, an increase in cooling air flow strengthens the vortex structure in the sealing cavity, which occupies the entire left and lower area of the sealing cavity. On the other hand, the axial length of the return vortex at the sealing exit increases, and the vortex structure affects the area near the side surface of the platform.
As can be seen from the sealing efficiency contours, the sealing efficiency of the seal’s inner cavity is close to 100%, and the sealing cavity prevents further downward ingress of the mainstream gas. When the flow ratio is 0.6%, the cold air flows close to the left surface of the platform, so the sealing efficiency is high there. When the cold air flow rises, the vortex structure in the sealing cavity is enhanced, and a large amount of sealing cooling air is sucked, causing the sealing efficiency in the left and lower areas of the sealing cavity to increase. However, the reflux vortex at the sealing exit sucks in the mainstream gas and penetrates deeper into the sealing cavity, which causes gas ingress at the side surface of the platform, and the sealing efficiency decreases continuously there.
In the ingress section, the pressure outside the seal is higher than the pressure inside the disk cavity. The main flow gas invades the disk cavity, causing a change in its flow. The main flow gas intrudes along the upper surface of the platform and forms a return vortex in the sealing exit, where the vortex structure sucks up a large amount of the main flow gas and the mixed cooling air in the sealing cavity. The airflow in the lower area of the sealing cavity forms a reverse vortex, and the airflow contains part of the mainstream gas from the downward invasion and a large amount of the sealing cooling air. Two vortex structures occupy the entire sealing cavity and sealing outlet area.
From the sealing efficiency contours, the sealing efficiency of the inner cavity is still close to 100%. Gas ingress mainly occurs in the sealing cavity, and the two vortex structures keep the mainstream gas out of the sealing cavity. In the sealing exit area, the sealing efficiency is low in the area near the upper surface of the rim plate because the gas intrudes along the platform’s upper surface. In the upper part of the sealing cavity, the cooling air is sucked into the reflux vortex, which increases the sealing efficiency there. In the sealing cavity, the reverse vortex sucks part of the downward-invading mainstream gas along the wall of the static disk. The sealing efficiency near the static disk is low. The sealing efficiency in the middle region of the sealing cavity is improved by the addition of a large amount of sealing cooling air. As the flow ratio increases, the cooling air entering the middle region of the sealing cavity along the lower surface of the platform increases. On the one hand, the reverse vortex in the sealing cavity is affected and occupies the lower-left area of the sealing cavity, and the sealing efficiency in this area improves rapidly. On the other hand, as the axial influence of the return vortex increases, the area near the platform surface affected by this vortex structure expands. However, the increased cooling air is also mixed into the return vortex at the sealing outlet, improving the overall sealing efficiency in this area.
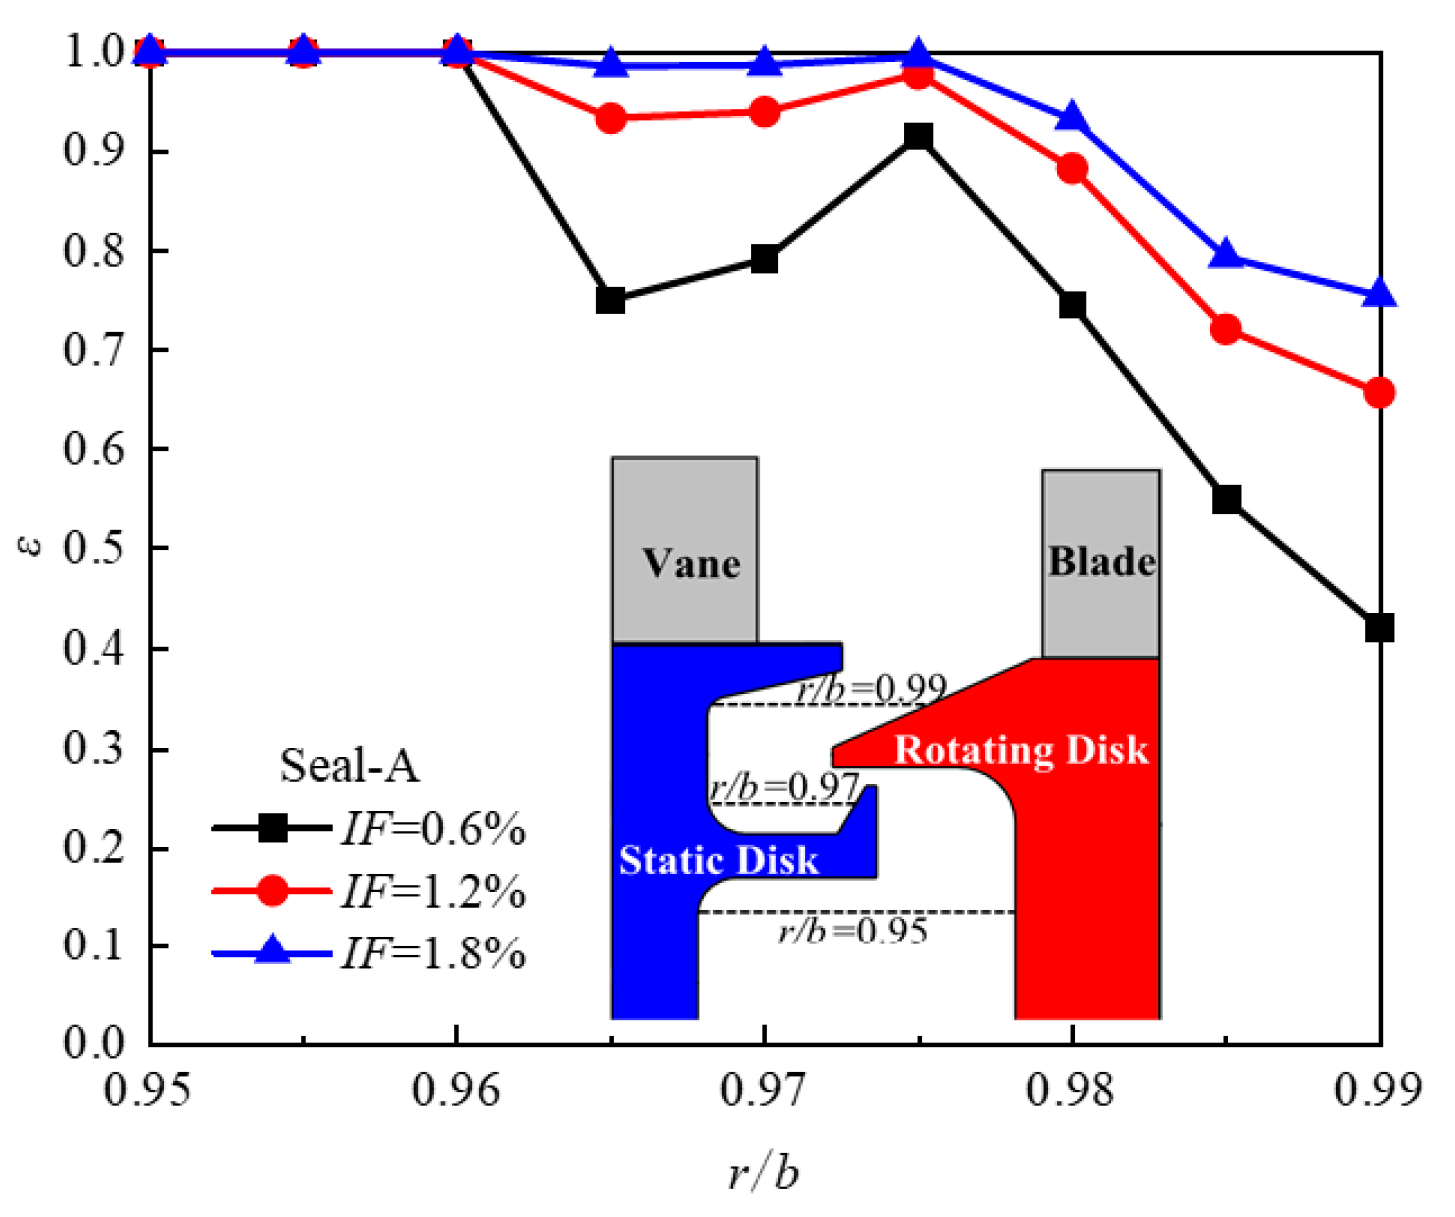
The area-averaged sealing efficiencies at different disk cavity radii are given in
Figure 18. The sealing efficiency of both the sealing cavity and the sealing outlet increases with the cooling air flow. Thus, increasing the sealing cold air volume is an effective way to improve the sealing performance of the disk cavity. The area-averaged sealing efficiency at the bottom of the sealing cavity (0.96 <
r/
b < 0.975) is less than that at the middle of the sealing cavity (
r/
b ≈ 0.975). This is because the vortex structure in the sealing cavity sucks part of the mainstream gas into the bottom area along the surface of the static disk, decreasing the sealing efficiency there. The cooling air flows into the middle region of the sealing cavity along the lower surface of the rim platform, resulting in high sealing efficiency in this region. With an increase in the cooling air flow, the sealing efficiency in the middle region of the sealing cavity increases while also rapidly increasing in the lower region. The difference in the sealing efficiencies between the two regions decreases because more cooling air is sucked into the vortex structure inside the sealing cavity, thus rapidly increasing the local sealing efficiency. When the cooling air flow ratio increases from 0.6% to 1.8%, the sealing efficiency at the high radius increases by 30% on average.
3.3. Analysis of Sealing Structure Influence
It is necessary to have a more detailed understanding of the disk cavity flow and pressure fields to characterize the influence of the deep cavity shape and the modified platform on the sealing performance. Therefore, Seal-A, Seal-B, and Seal-C are analyzed in this section.
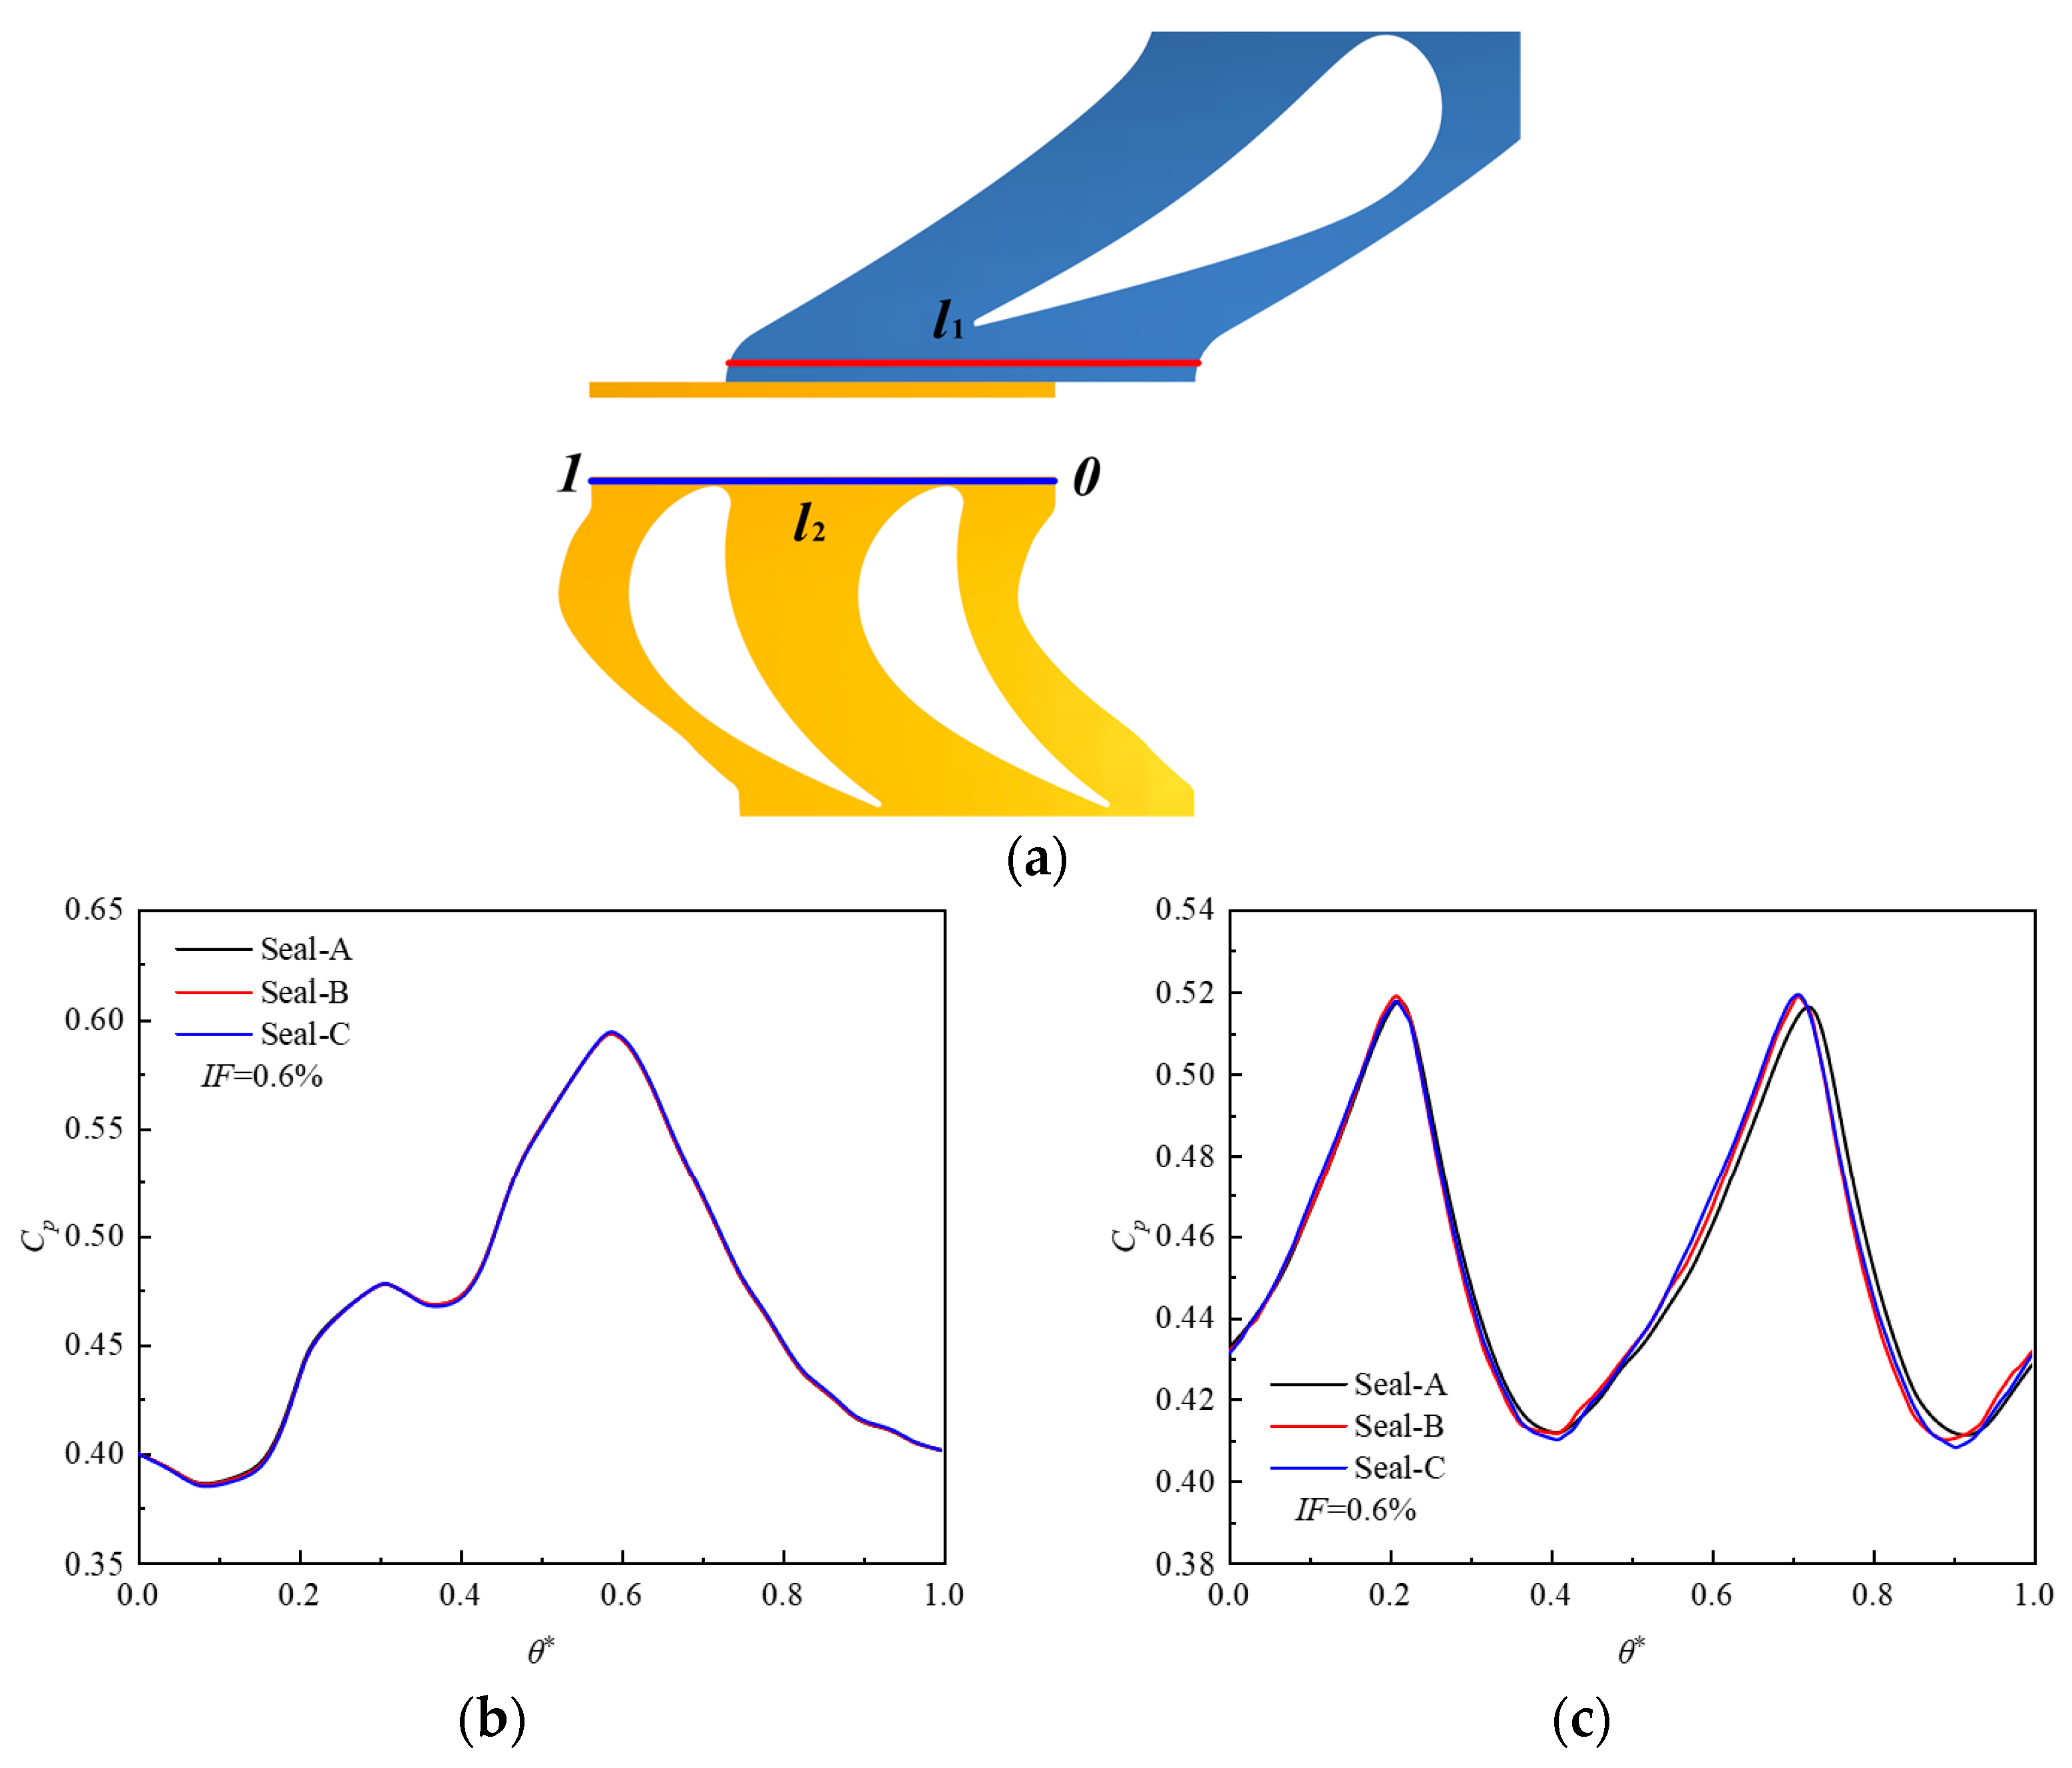
Figure 19 compares the circumferential
Cp variations of the three sealing structures at
l1 and
l2.
From
Figure 19a, the circumferential pressure variation curves of Seal-A, Seal-B, and Seal-C are the same at
l1. The sealing structure changes do not significantly affect the pressure downstream of the vane trailing edge. As shown in
Figure 19b, the circumferential pressure curves of the three sealing configurations at
l2 are also consistent. Seal-B and Seal-C only affect the pressure near one of the blades, and the newly designed sealing structure may affect the egress flow, which in turn affects the circumferential pressure at the blade leading edge.
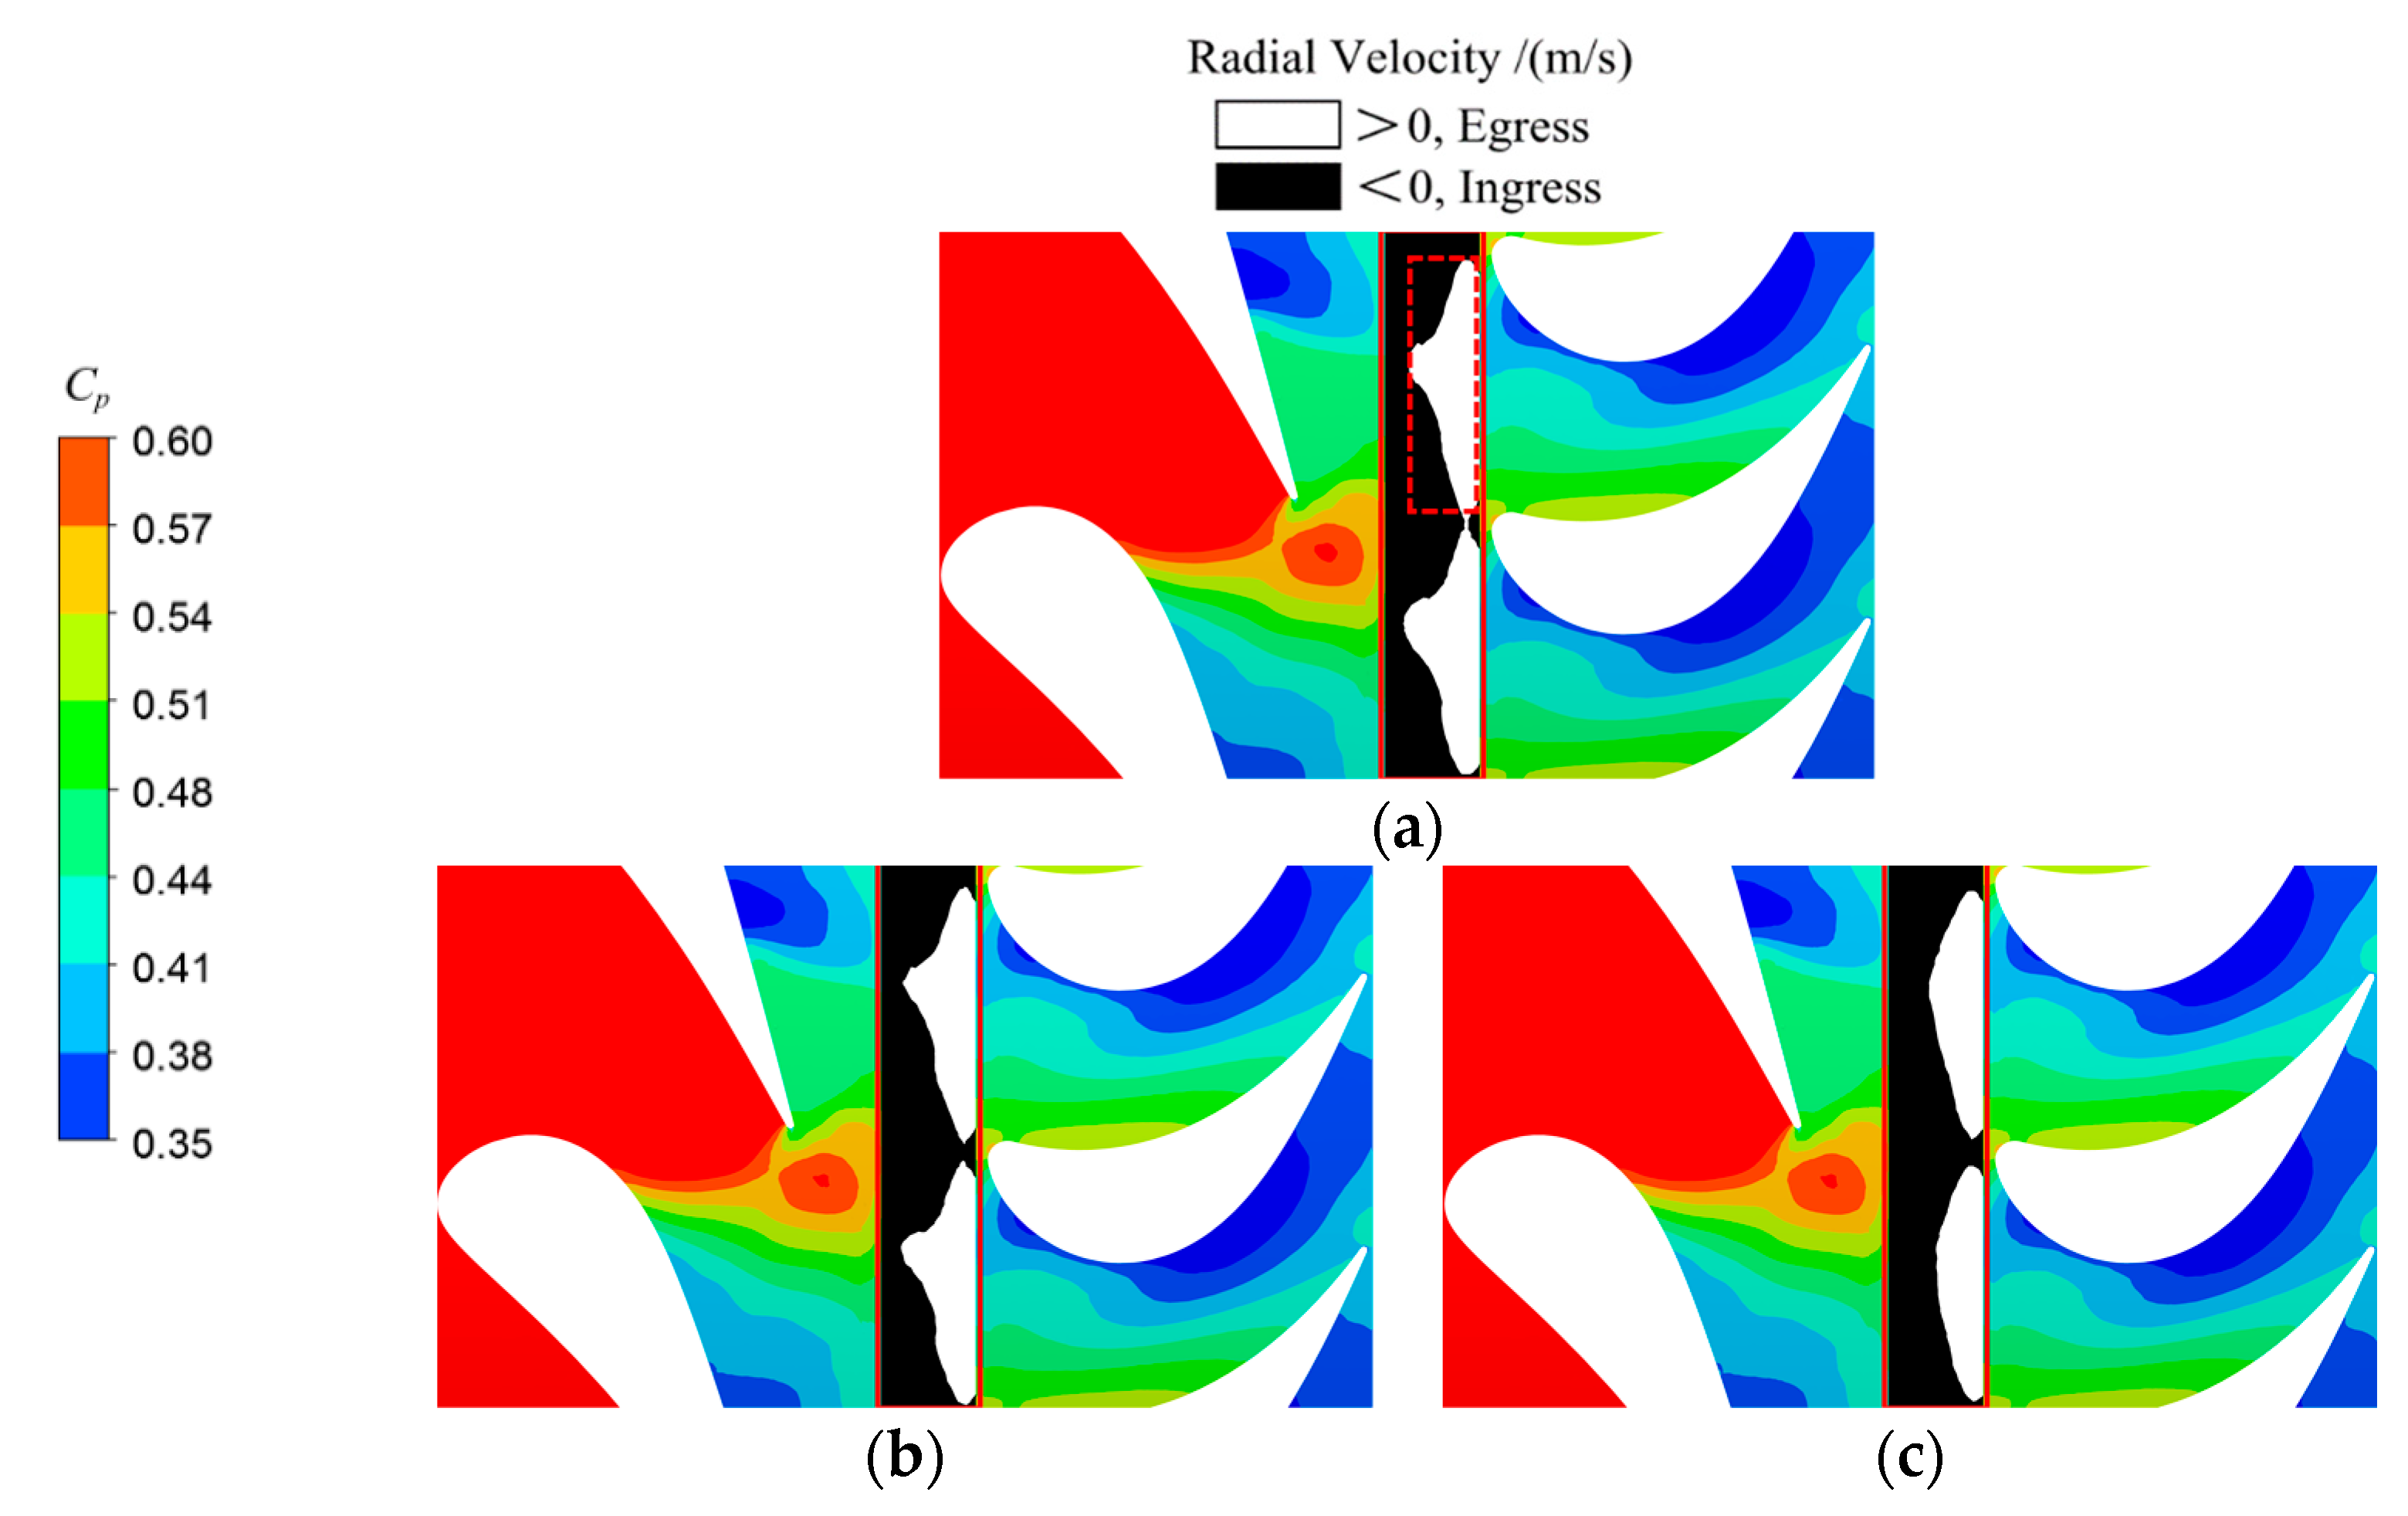
Comparing the time-averaged
Cp and radial velocity contours of the three sealing structures at the same flow ratio in
Figure 20, the distribution of the ingress and outflow areas at the sealing outlet of Seal-B does not change significantly compared to Seal-A. The deep sealing cavity has no significant impact on the ingress and outflow at the clearance outlet. For Seal-C, the area of negative radial velocity region increases, and the area of positive radial velocity region decreases slightly, indicating that the modified platform is not conducive to expanding the sealing outlet area but leads to more mainstream gas ingress into the disk cavity.
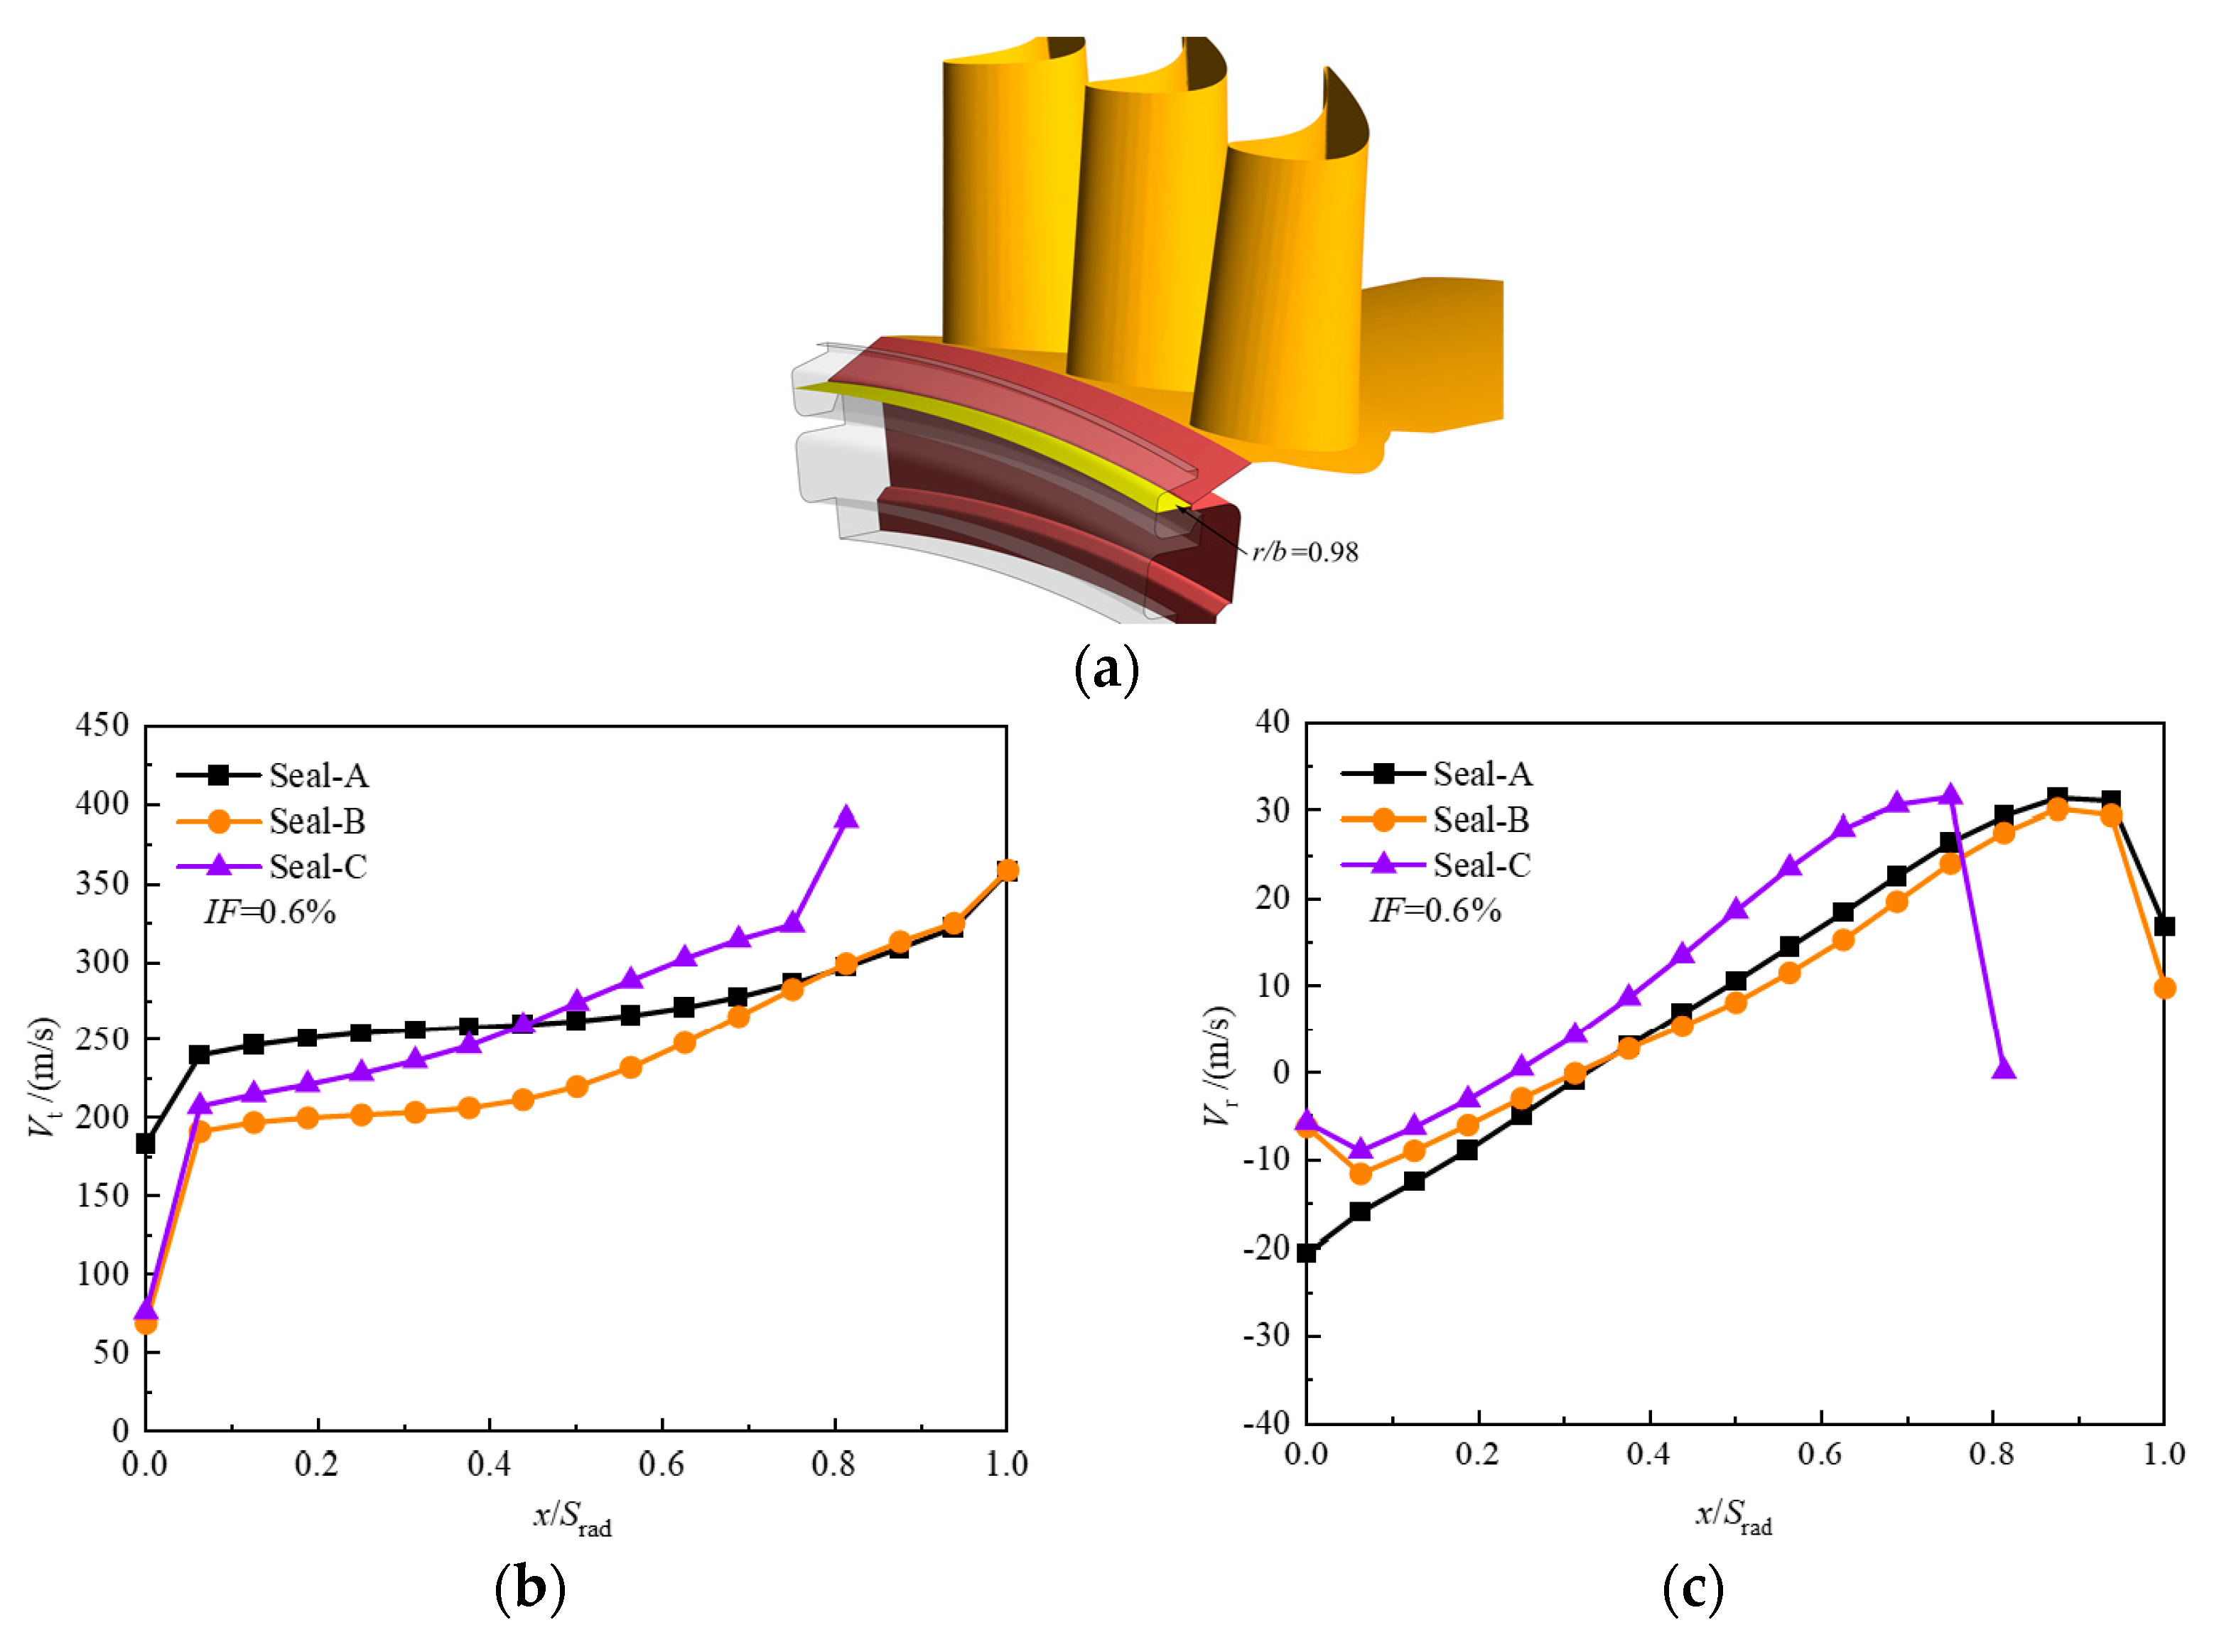
The time-averaged tangential and radial velocity variations along the axial direction at the middle section of the sealing cavity (
r/
b = 0.98) are given in
Figure 21. The three sealing structures have consistent tangential velocity variations in the middle section of the sealing cavity, and the tangential velocity increases as the axial position approaches the rotating disk from the static disk. When the tangential velocity curves of Seal-A and Seal-B in
Figure 21a are compared, the deep cavity shape of the static disk causes a decrease in the tangential velocity at each axial position. In particular, the tangential velocity decrease is most obvious near the stationary disk surface of the deep cavity. The tangential velocities at axial positions
x/
Sax > 0.5 are higher than for the other two sealing structures because of the platform structure of Seal-C.
It can be observed in
Figure 21b that the radial velocity near the rotating disk side is positive, and the velocity value near the static disk side is negative in the central section of the sealing cavity. In comparing the radial velocity curves of the three sealing structures, Seal-B’s deep cavity shape decreases the cooling air flow’s absolute radial velocity values near the rotating and static disks. This indicates that the radial outflow of the cooling airflow near the rotating disk and the ingress near the static disk both decrease in Seal-B. Because of the platform’s influence, Seal-C has higher radial velocities than the other two seal structures at the same axial position. However, the radial velocity near the rotating disk and the middle of the sealing cavity is slightly lower than Seal-A, using the rotating disk surface as the reference point. The radial outflow in this region is weakened, the radial velocity near the static disk increases, and the ingress decreases.
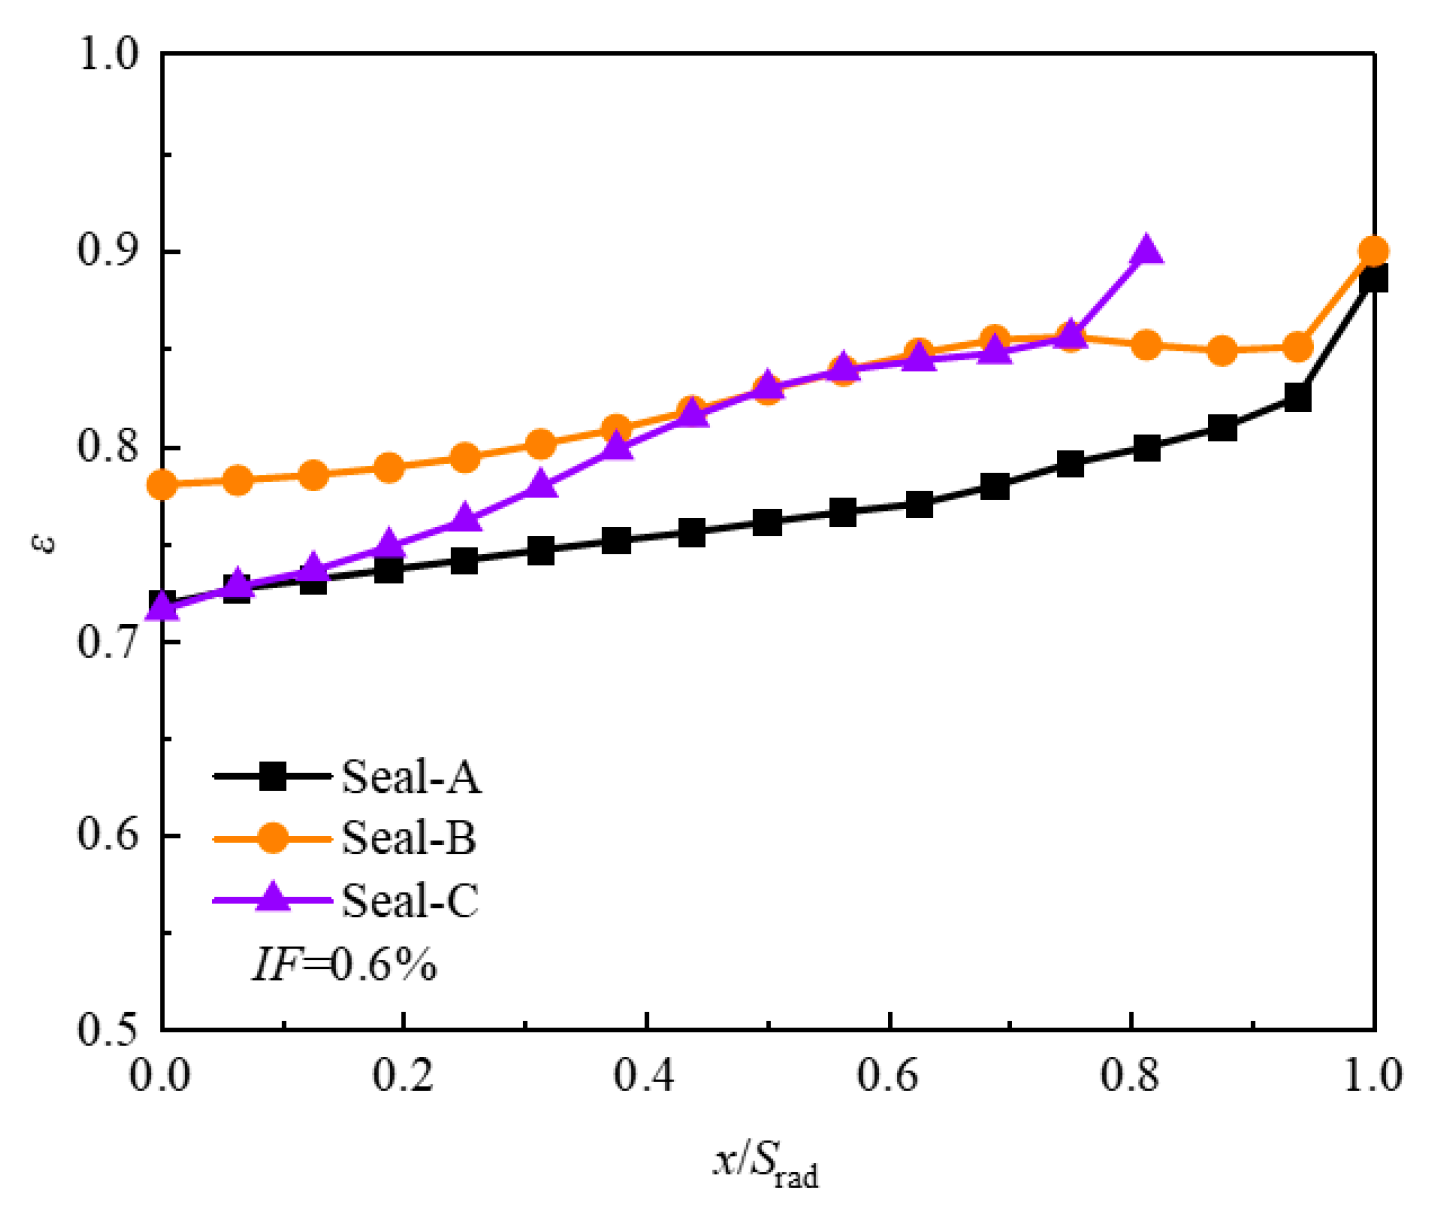
The curves of the time-averaged sealing efficiency with the axial position in the middle plane of the sealing cavity are given in
Figure 22. Seal-B and Seal-C have higher sealing efficiencies than Seal-A at different axial positions. The average face sealing efficiencies of Seal-A, Seal-B, and Seal-C in this cross-section are 0.74, 0.8, and 0.77, respectively. Compared with Seal-A, Seal-B increases the sealing efficiency by 8% because of its deep cavity shape in the static disk, and Seal-C increases the sealing efficiency by 4% after adding the platform shape.
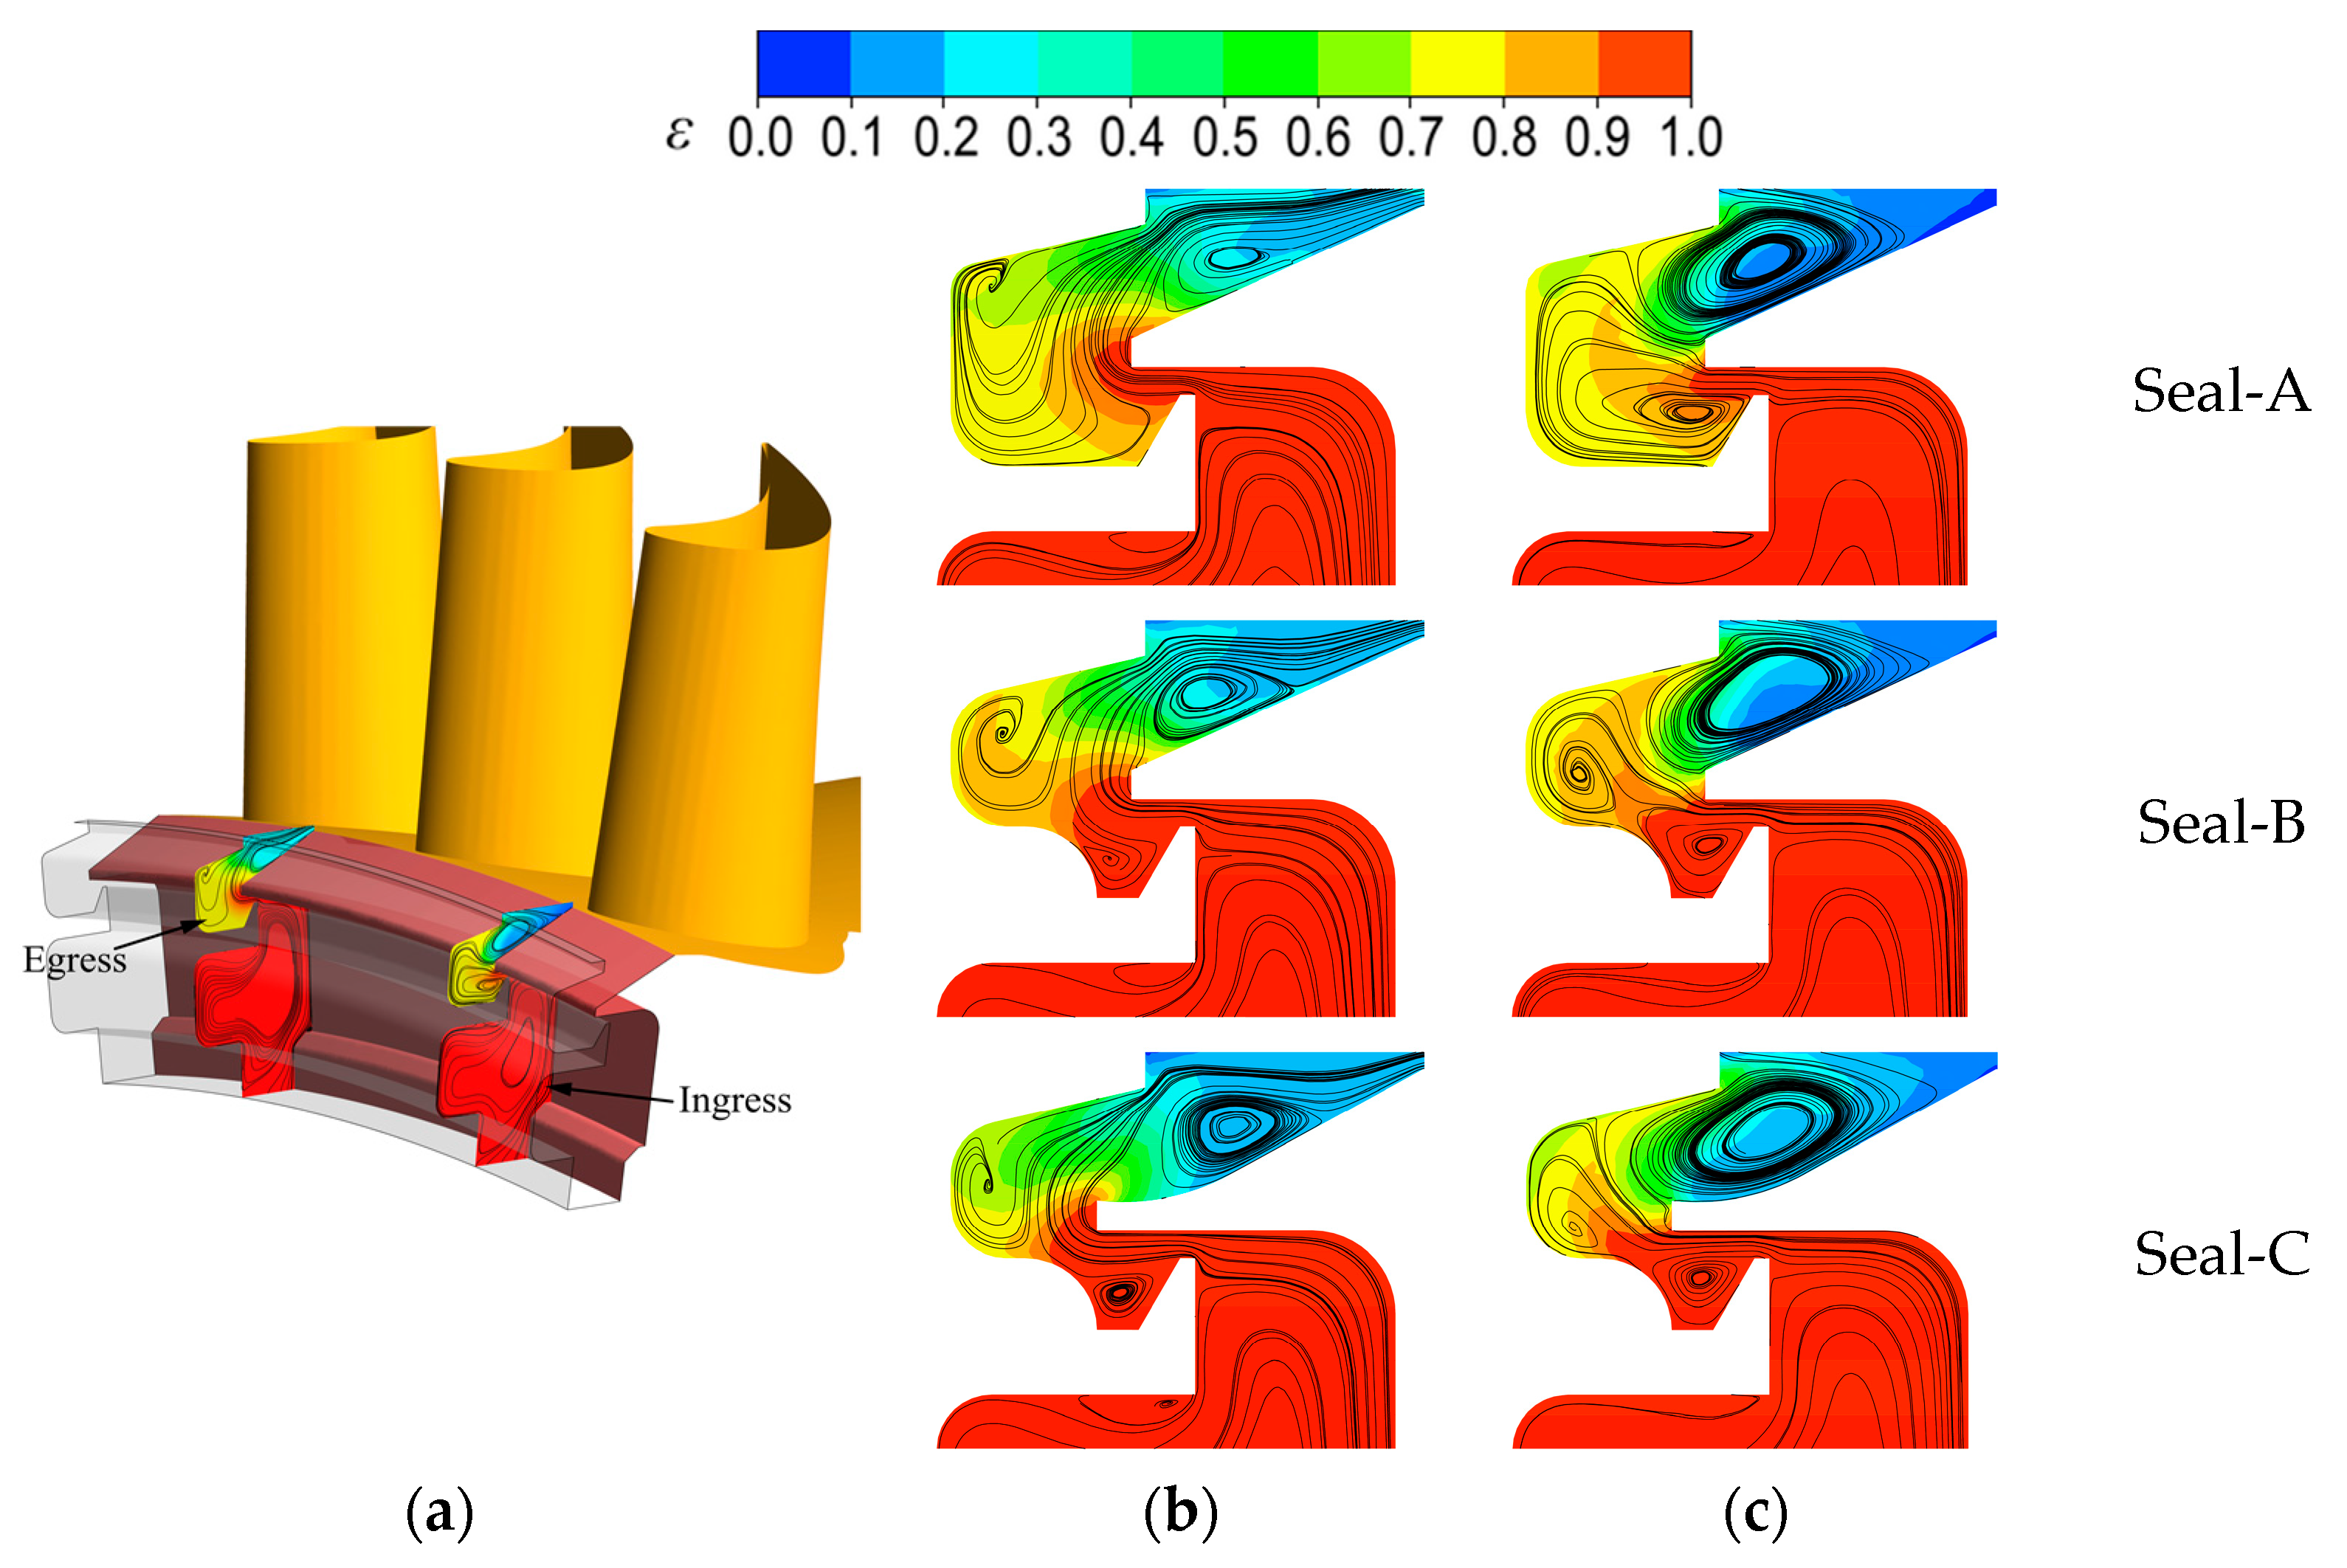
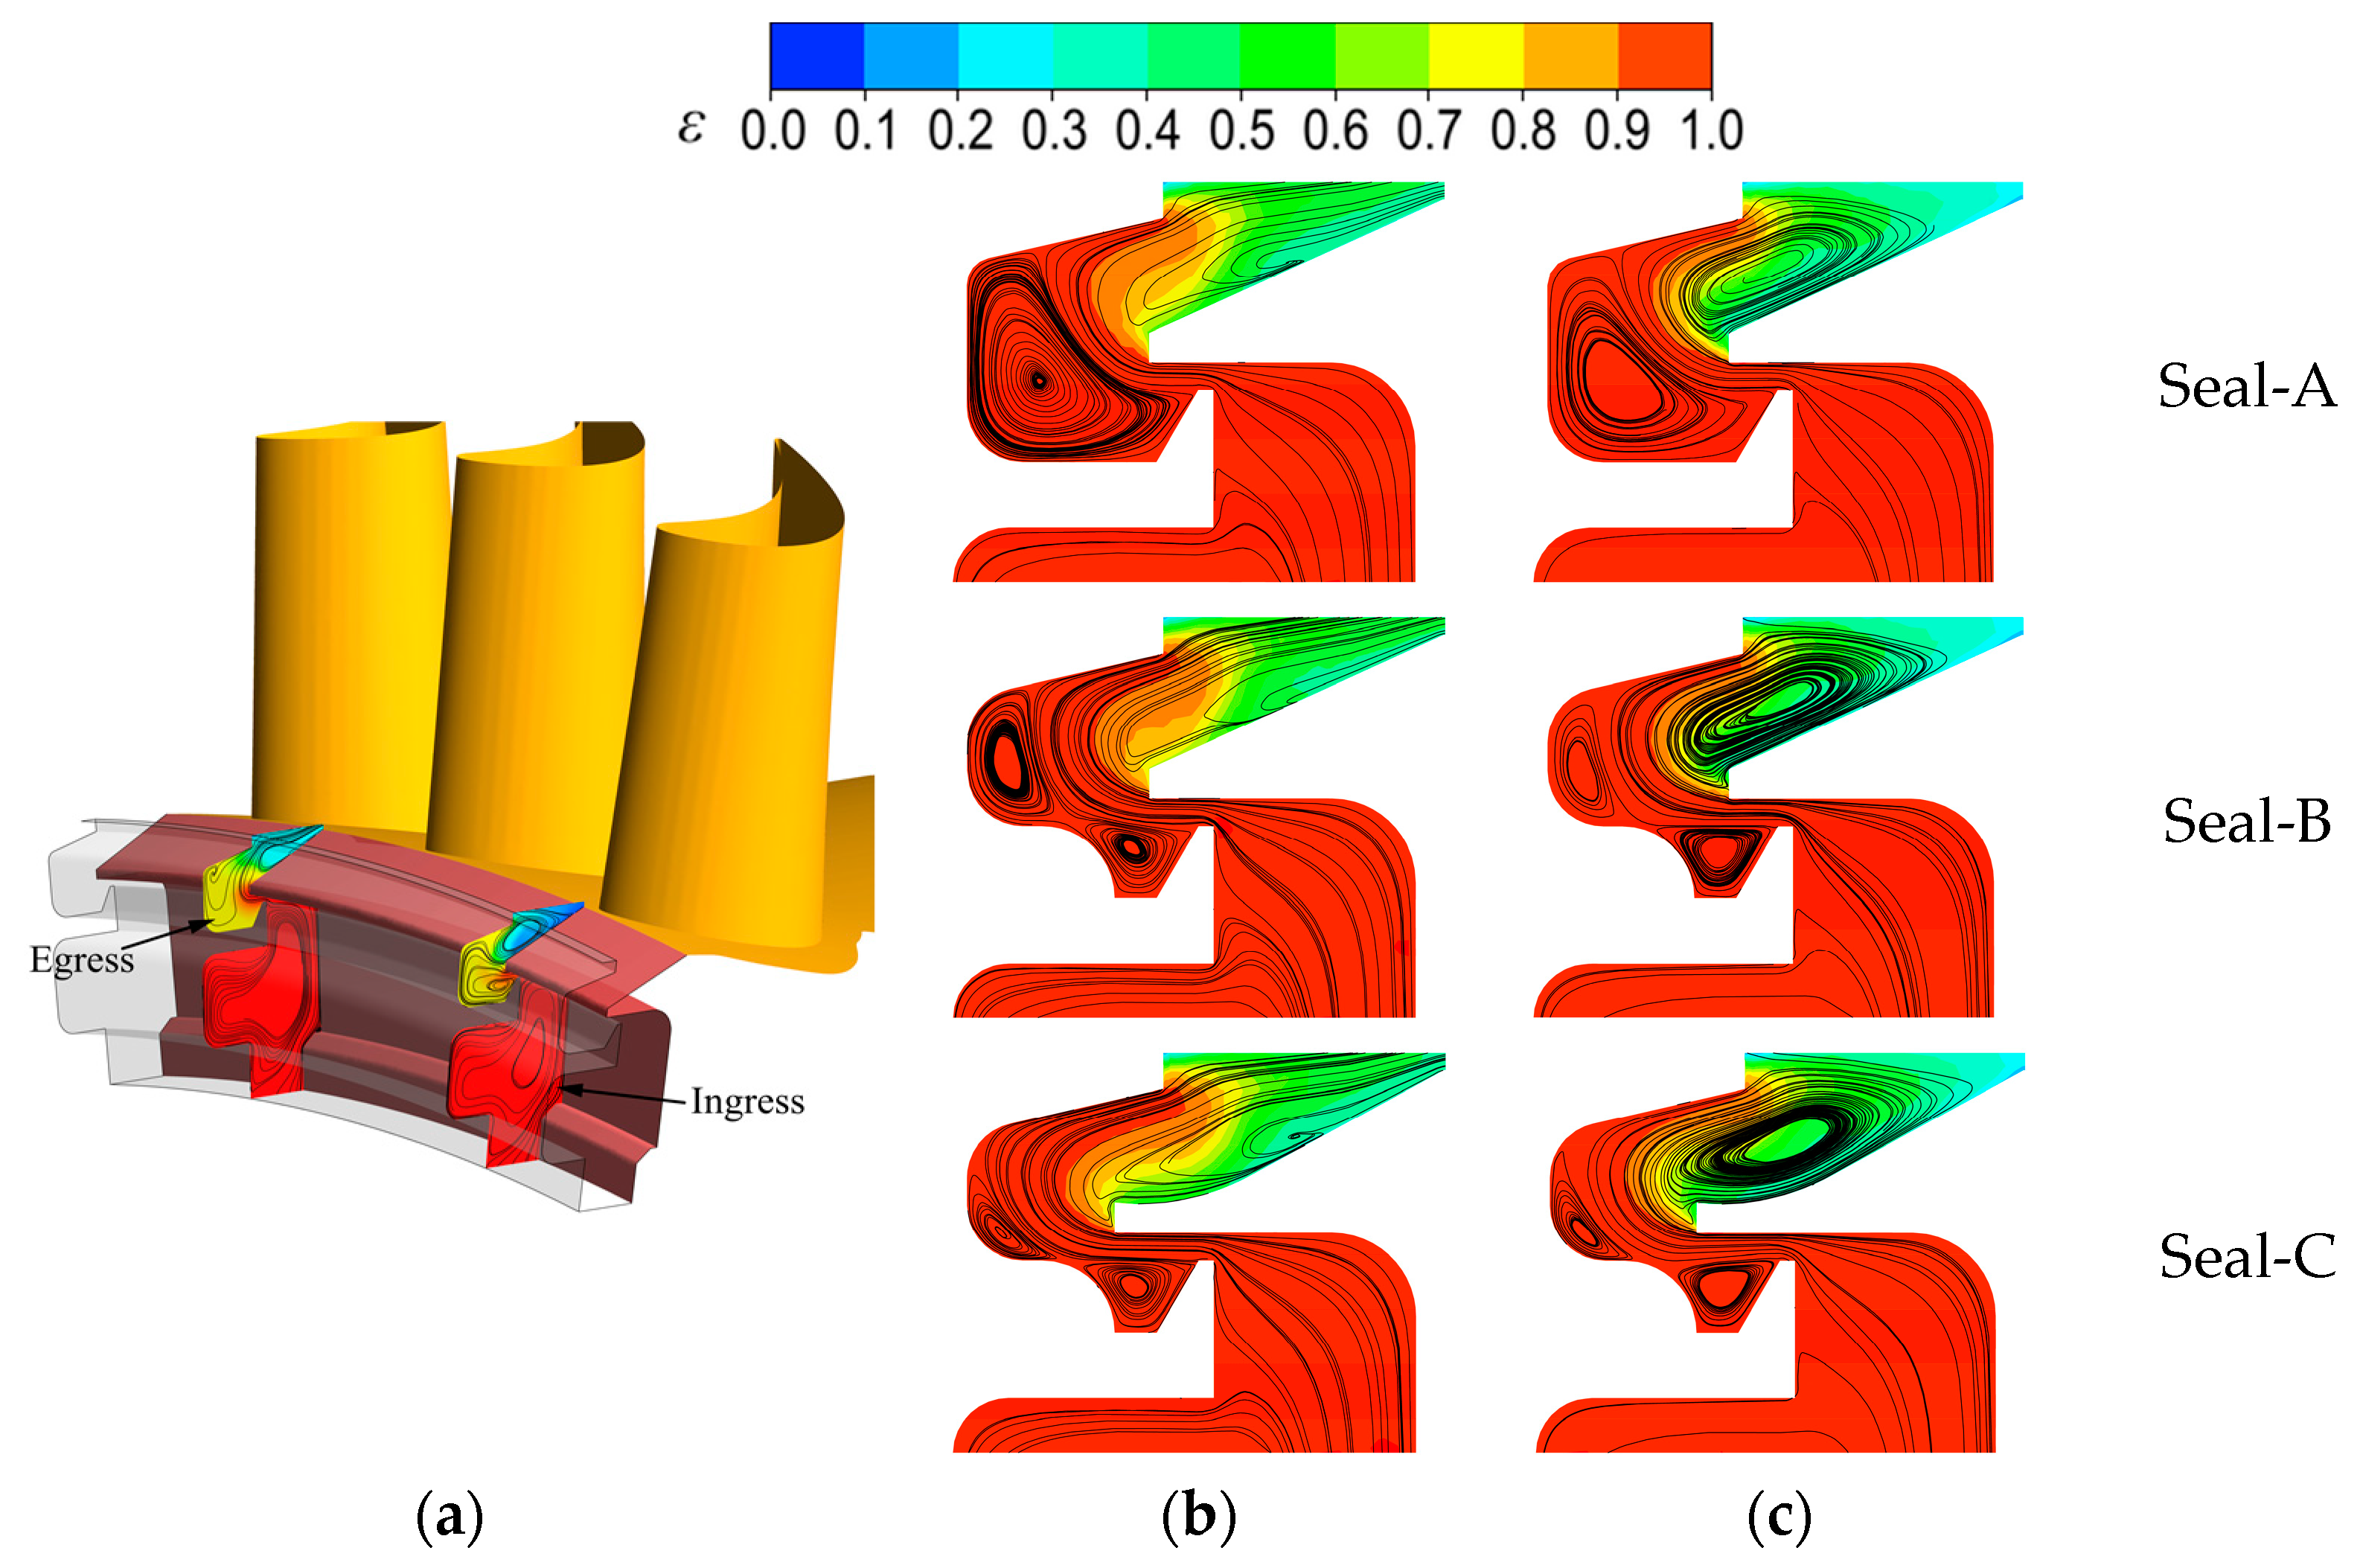
Figure 23 and
Figure 24 detail the disk cavity’s flow field for three sealing configurations at the flow ratios of 0.6% and 1.8%. Compared with Seal-A, the deep cavity shape in Seal-B only changes the flow field in the sealing cavity and has no significant effect on the return vortex at the sealing outlet. A new vortex structure is created in the lower concave cavity, both in the egress section and the ingress section, in addition to the reverse vortex in the left-side region of the sealing cavity. This is because part of the cooling air forms a return vortex in the lower concave cavity when it enters the sealing cavity along the lower surface of the platform, which consumes the cooling air. Therefore, the sealing efficiency in the concave cavity is close to 100%, as shown in the sealing efficiency contours. The deep cavity shape in the static disk and the cooling air significantly improve the sealing efficiency in the lower area of the sealing cavity compared to Seal-A.
Based on Seal-B, Seal-C has a modified shape on the upper surface of the platform, and this new structure enlarges the area of the sealing exit. We know that the modified platform structure expands the influence of the return vortex in both the egress area and ingress areas at the sealed exit from the flow field structure. Combined with the sealing efficiency contours, this is not conducive to improving the sealing efficiency at the sealing exit. In addition, the platform structure transports the cooling air deeper into the sealing cavity. The return vortex in the lower recess of the sealing cavity still consumes the cooling air and keeps the sealing efficiency in this area high. However, it also reduces the reverse vortex on the left side of the sealing cavity and the expanding return vortex at the sealing outlet.
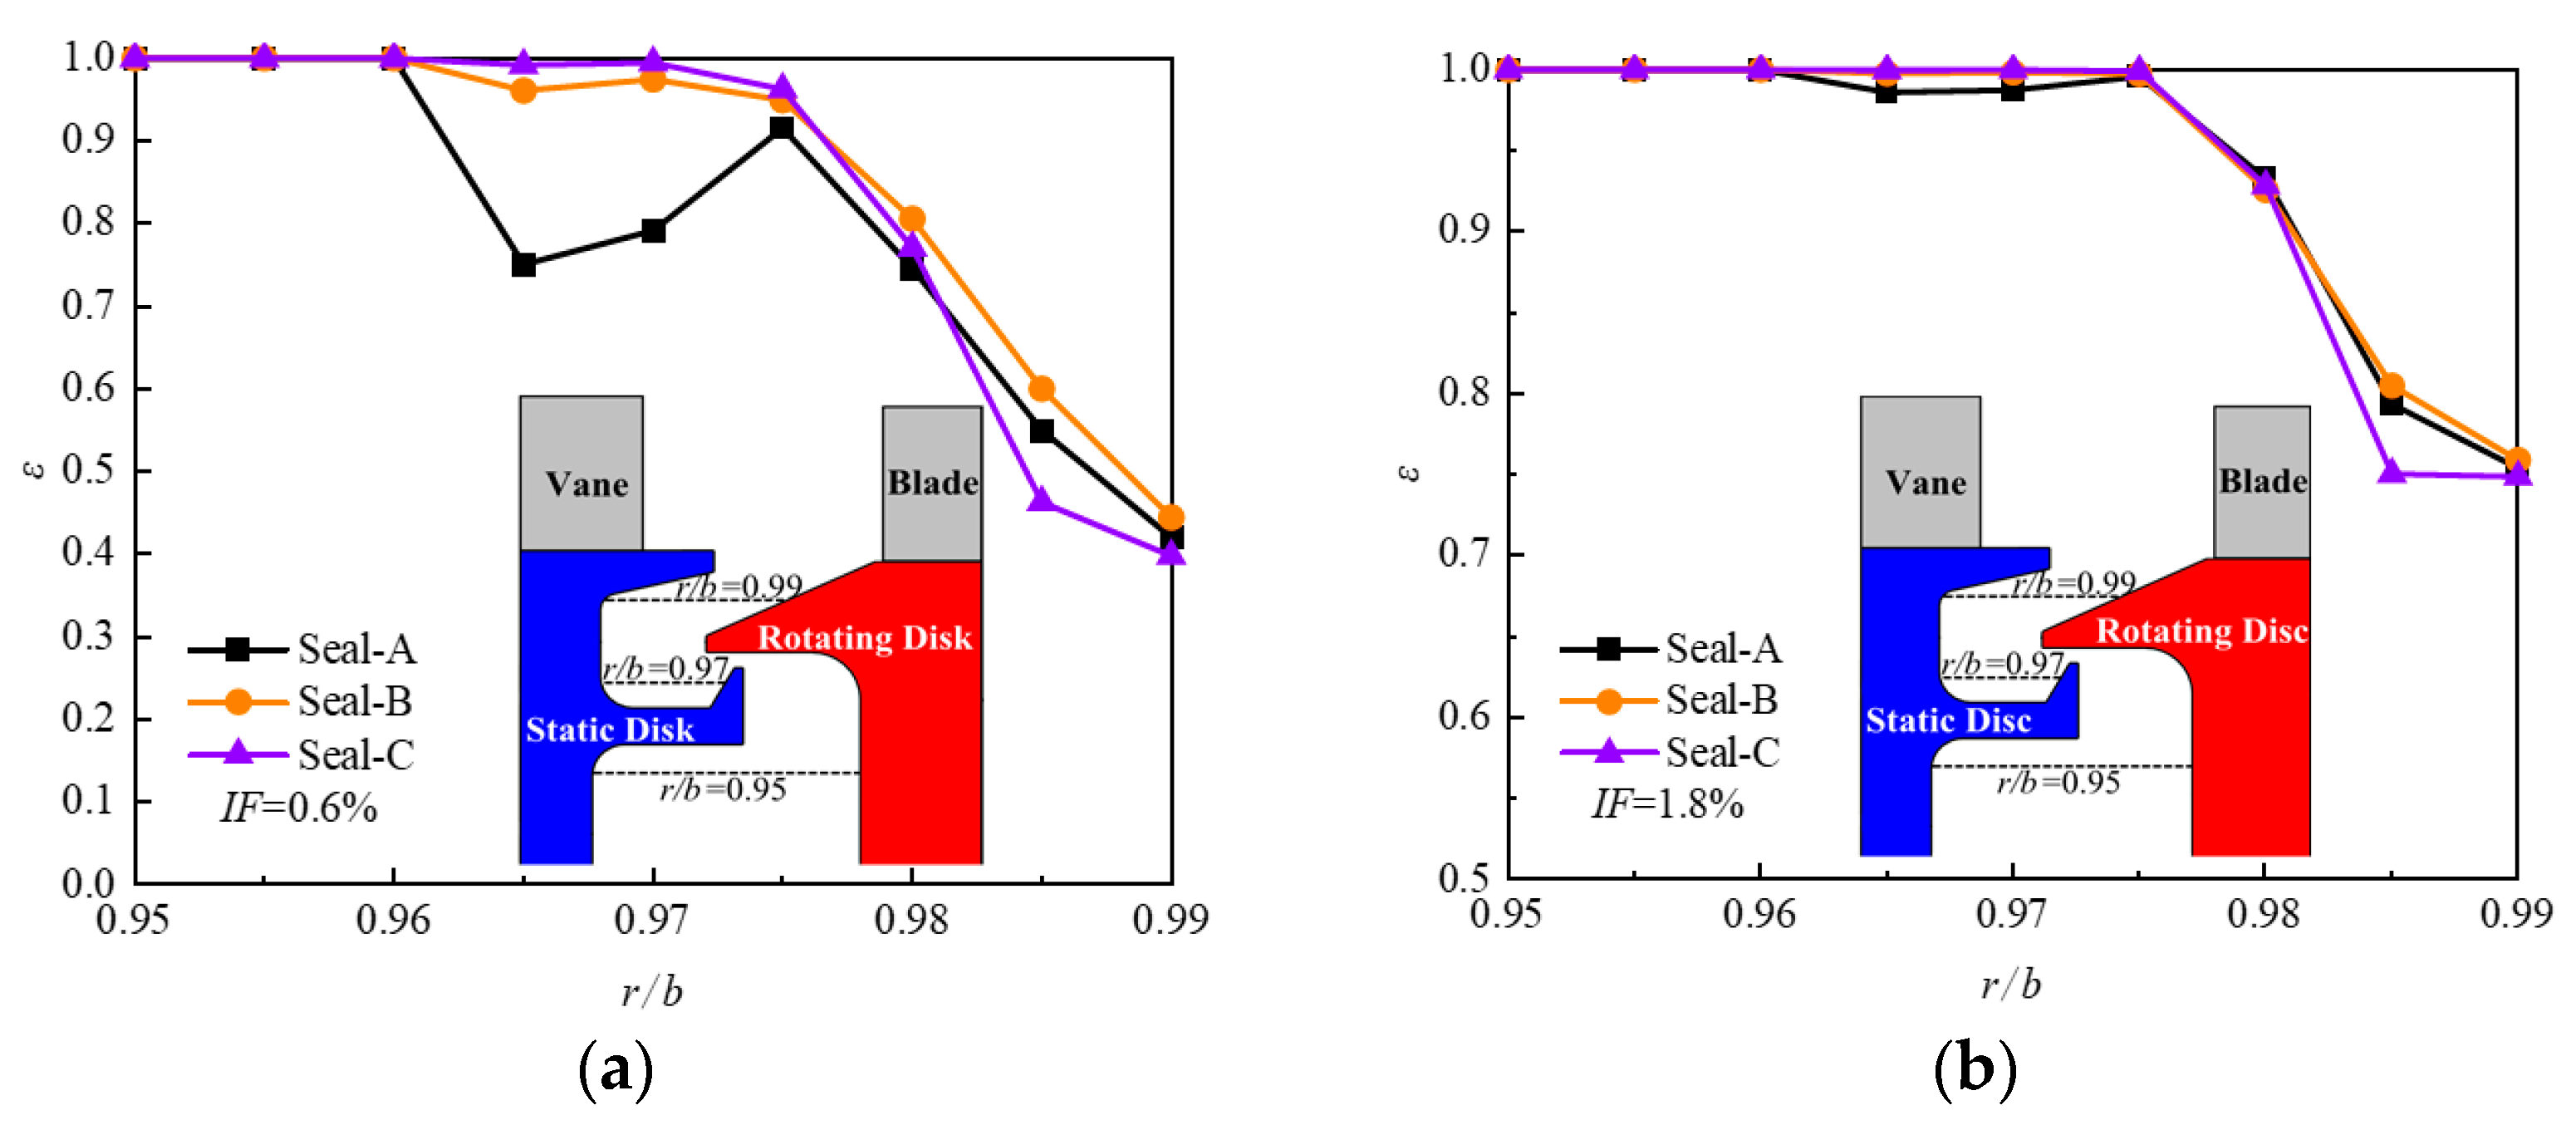
Figure 25 shows the sealing efficiency of the three sealing structures at different disk cavity radii. In the inner cavity (
r/
b < 0.96), the sealing efficiency of the three sealing structures is 100%. In the sealing cavity (0.96 <
r/
b < 0.975), Seal-C has the best sealing performance, and Seal-A has the worst performance. Therefore, the deep cavity shape in the static disk effectively improves the sealing cavity efficiency. In the sealing exit region (
r/
b ≥ 0.985), Seal-C has the lowest seal efficiency, and Seal-B has the highest. Thus, using the modified platform structure is not conducive to improving the sealing efficiency at the sealing exit but enhances the sealing efficiency in the sealing cavity. In general, compared with Seal-A, the sealing efficiency of Seal-B and Seal-C is increased by 13.5% and 10%, respectively, at
IF = 0.6%.


