1. Introduction
In recent years, additive manufacturing (AM) has been acknowledged as one of the revolutionary techniques in aeronautics, due to its unparalleled advantages in weight reduction, rapid processing and resource economization. However, AM primary structural elements have not yet been adopted in aircraft at present, which should be attributed to the detrimental effects of mesoscopic defects, such as gas-pores (GP) and lack-of-fusions (LOF), especially on fatigue performance. Despite efforts have been devoted into minimizing these mesoscopic defects in AM parts as much as possible by optimization of AM processing, it is gradually accepted that GP cannot be thoroughly eliminated, and the focus has thus been put on development of fatigue evaluation methods [
1].
To the best of the authors’ knowledge, there are four evaluation methods of GP effects. The roughest but simplest is to conduct massive fatigue experiments to establish empirical fitting equations as well as to compare with their wrought counterparts, which is obviously time-consuming and also difficult to quantitatively reveal GP effects [
2,
3]. Considering that GP is near-circular (near-spherical in 3D), another evaluation method attempts to approximate the effects of a mesoscopic GP as the effects of a macroscopic hole [
4,
5], but the difficulty lies in how to evaluate the size/scale effects [
6]. The most persuasive method, however, is based on multi-stage fatigue (MSF) model [
7,
8], which considers fatigue failure as the whole process of crack initiation, microstructurally small crack propagation and long crack propagation, in which the effective evaluation models for small crack propagation are still lacking. Also, some researchers have tried to skip the GP effects by directly correlating fatigue lifetimes with AM processing parameters with the help of machine learning techniques [
9,
10,
11], but it is based more on the perspective of data application rather than effect research.
The most prevailing method, which is based on the Murakami parameter, is established from the perspective of fracture mechanics. It is assumed that the pore can be deemed as an initial crack with crack length of
, i.e., Murakami parameter, which is defined as the square root of the projected defect area on the plane perpendicular to the maximum principal stress. Since
represents the fatigue quality of AM metals, it has been adopted in several phenomenological and semi-empirical equations to correlate fatigue strength [
12]; on the other hand,
can be furthermore adopted to calculate the equivalent stress intensity range
[
13], which offers another fatigue quality parameter and can also support the abovementioned MSF-based method. Also, by applying the
parameter, the researchers were able to correlate fatigue lifetimes [
14,
15]; however, it seems difficult to reveal the underlying GP effects, because
parameter itself is based on many assumptions and simplifications. Such a parameter has been widely adopted not only in axial fatigue studies, but also in complex cases such as multiaxial studies [
16,
17].
These four methods rely on experiments. Considering the requirements for rapid processing and evaluation, however, it is unacceptable to base everything on time-consuming and expensive fatigue experiments. With the developments of computational capability as well as computational mechanics, numerical simulation is becoming a promising means, and some efforts have already been devoted to the numerical studies of defects in AM metals and their effects on fatigue performance. For example, Vayssette et al. [
18] proposed a methodology to evaluate the effect of the surface roughness on High Cycle Fatigue (HCF) behaviors of selective laser melted (SLM) Ti-6Al-4V parts, and Wan et al. [
19] proposed multiscale damage mechanics to predict the fatigue lifetimes of the AM Ti-6Al-4V parts based on the defect content.
Nevertheless, it still remains a tough work for the present numerical methods to deal with crack problems, and it is unfortunate that fatigue failure is a process of crack initiation and crack propagation. Most methods, such as nodal release techniques and cohesive zone modelling (CZM), position themselves as numerical improvements to finite element methods (FEM); in such methods, cracks are usually modeled by element boundaries and crack propagation thus relies heavily on FEM mesh. As fatigue crack propagation is essentially plasticity-driven, however, some researchers argue that decohesion-based models are inconsistent with the fundamental mechanisms responsible for crack advances, and insist that any physical justification for CZM in ductile is deficient [
20].
The extended finite element method (XFEM), however, is different because enrichments are made not only for numerical techniques but also for underlying mechanic theories. By enriching the elements near discontinuities with the leading singular crack-tip asymptotic displacement fields [
21,
22], XFEM enables mesh strategies to be independent of discontinuity geometries, and very-fine remeshing is no longer necessary [
23], which is thus a proper numerical method for multiscale simulations. Nevertheless, external criteria for the injection of discontinuous displacement enrichment are still needed, and accuracy of XFEM results are more or less related to a certain mesh refinement; moreover, incremental crack length and its direction in XFEM have to be given by linear elastic fracture mechanics (LEFM), which makes XFEM not robust enough for multiple crack patterns and plasticity anisotropy effects; last but not least, analysis of three-dimensional crack propagations is still a challenge.
Peridynamics (PD), which is almost as young as XFEM, goes in a different direction that relies on theory extension from the perspective of mathematics [
24]. In PD theory, a nonlocal extension of classical continuum mechanics that permits discontinuous solutions, the spatial derivatives are replaced by integrals so that mechanics of continuous and discontinuous media can be unified within a single set of equations, which leads discontinuities to be part of the solution rather than part of the problem. The capability of describing crack initiations and crack propagations is especially attractive to fatigue researches, and typical fatigue behaviors [
25,
26] have also been studied by several proposed PD fatigue models.
For example, Oterkus et al. [
27] in 2010 assumed the critical bond stretch (CBS) to degrade during the alternating stress, but the specific function of CBS degradation was not given. Zaccariotto et al. [
28] in 2013 assumed the micro-modulus to degrade during the alternating stress, but it is more reasonable for application to composites. Siiling [
29] defined so-called “remaining life” for PD bonds which were assumed to be degraded during the alternating stress, but the model leads to inconsistence between fatigue crack initiations and fatigue crack propagations. Madenci et al. [
30] applied kinetic theory of fracture into peridynamics in 2020. In particular, authors in 2021 proposed a model capable of describing the whole process of fatigue failure at macroscale [
31], and adopted the model to study fatigue crack deflections in AM titanium alloys [
32].
Due to the nonlocality feature of PD, the computational costs are much higher, and it is unaffordable to directly model mesoscopic GP on fatigue behaviors of macroscale specimens. In this paper, a bond decomposition strategy (BDS) in peridynamics is proposed, which is then combined with our previously proposed fatigue damage-cumulative model to study the GP effects on fatigue strength. The structure of this paper is arranged as following. In
Section 2, PD fundamentals are briefly introduced. Then, a more precise description for interactions between material points and discontinuity geometries in PD, i.e., bond decomposition strategy, will be proposed and verified in
Section 3. In
Section 4, such bond decomposition strategy is adopted to predict fatigue strength of smooth specimens with a mesoscopic gas pore.
3. Spacing-Independent Description for Discontinuities
In this section, we develop a spacing-independent description for discontinuities in peridynamics, which is achieved by adopting the so-called bond decomposition strategy (BDS) for more precise description of the interaction between material points. Also, we presented numerical examples for verifications as well as comparisons with the present two strategies, and discussed the potential intents for the proposed BDS strategy.
3.1. Bond Decomposition Strategy
An original PD bond represents the interactions between two corresponding subdomains of materials, which are described by Equation (7) in
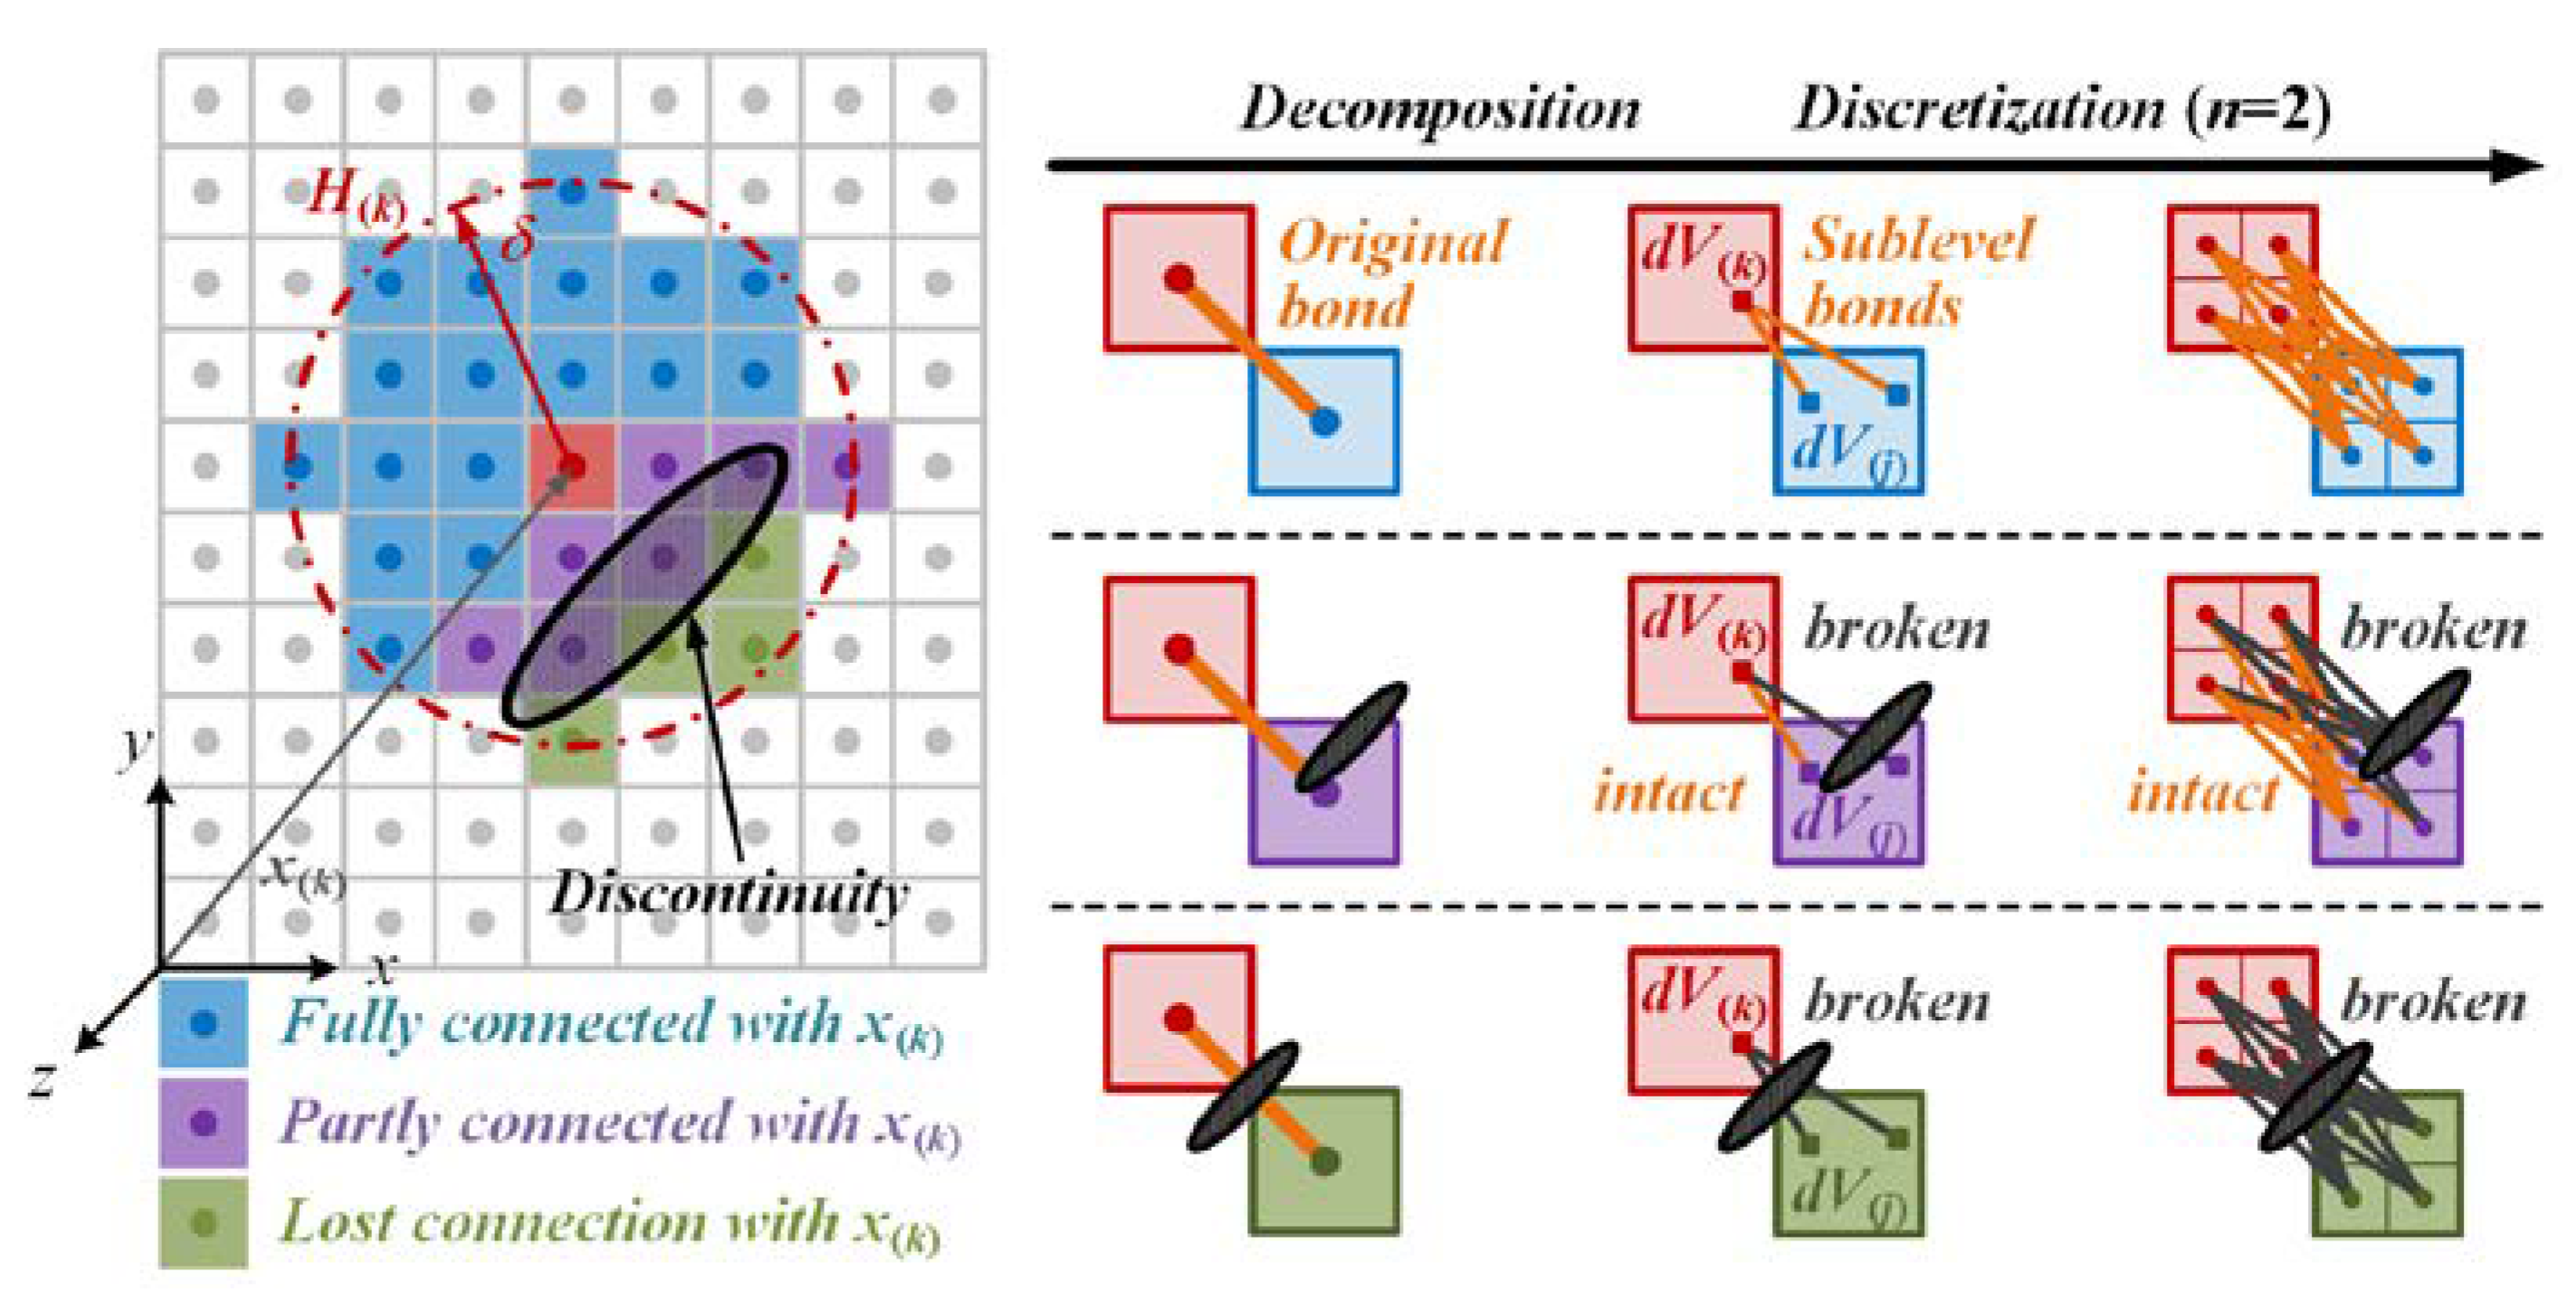
Section 2.3.1 for only two statuses, i.e., fully-connected and lost-connection. While discontinuities are involved, however, it is thus a dilemma whether to break bonds between two partly-connected material points as represented by red and purple in
Figure 5.
Due to the intrinsic nonlocality of PD, any information on material point actually represents an average of the incremental volume, which endow PD with implicit homogenization similar to coarse graining. Therefore, we propose here a bond decomposition strategy which is also shown in
Figure 5. An original bond interacting with discontinuities is decomposed into numerous sublevel bonds, and the damage extent of an original bond is characterized by multi-breakages of sublevel bonds; moreover, the breakage of each sublevel bond is judged by whether sublevel bond segment intersects with discontinuities. In other words, such decomposition strategy describes the loss of bond in a more precise way, which elegantly turns the problem of “whether to break” into “how many to count”; once the loss of original PD bond is appropriately quantified, discontinuities can be described and spacing strategy becomes thus independent of geometry features.
For computational convenience, such decomposition strategy can be expressed in a discretization form, and a uniform decomposition with partition number
as an example in
Figure 5. As can been seen, an original bond is decomposed into many (exactly 16 for uniform discretization with
in 2D case) sublevel bonds, among which the gray ones are broken due to their intersecting with the discontinuity; as a result, the number of broken sublevel bonds tactfully quantify the loss of the original bond due to the existence of discontinuities.
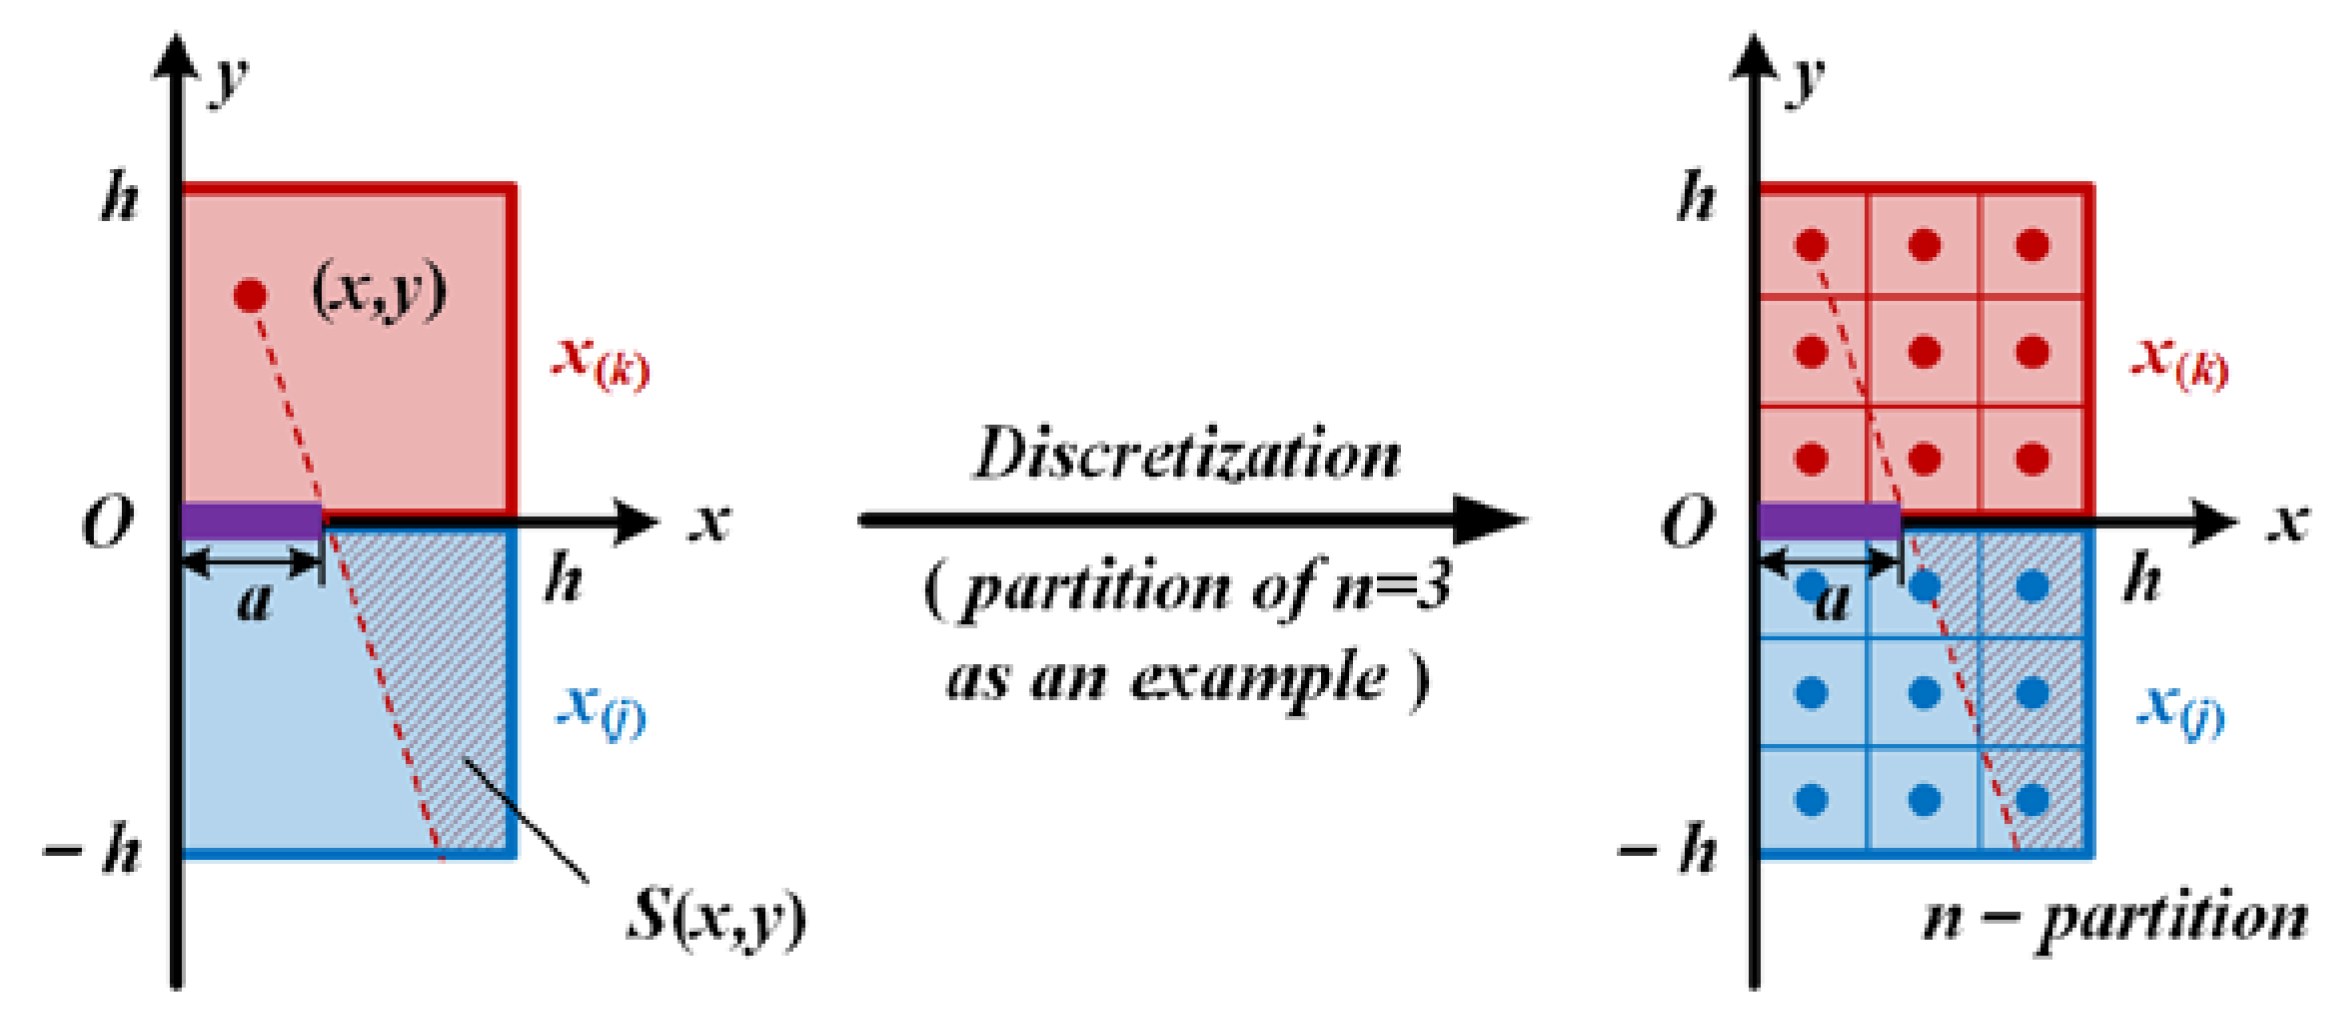
For more quantitative explanation, considering two material points occupying a respective square area of side length
with a crack of length
between them, as shown in
Figure 6. Obviously, an infinitesimal block of volume in
, denoted by
, interacts with shadowed part of
whose area is
.
In order to describe how much of original PD bond remains, a parameter
can be defined by double integral of the shadowed area
where
is the dimensional number
For a discretization consideration with uniform partitioning, Equation (11) can be rewritten as:
in which
denotes the status of sublevel bond by judgment of intersection
For models shown in
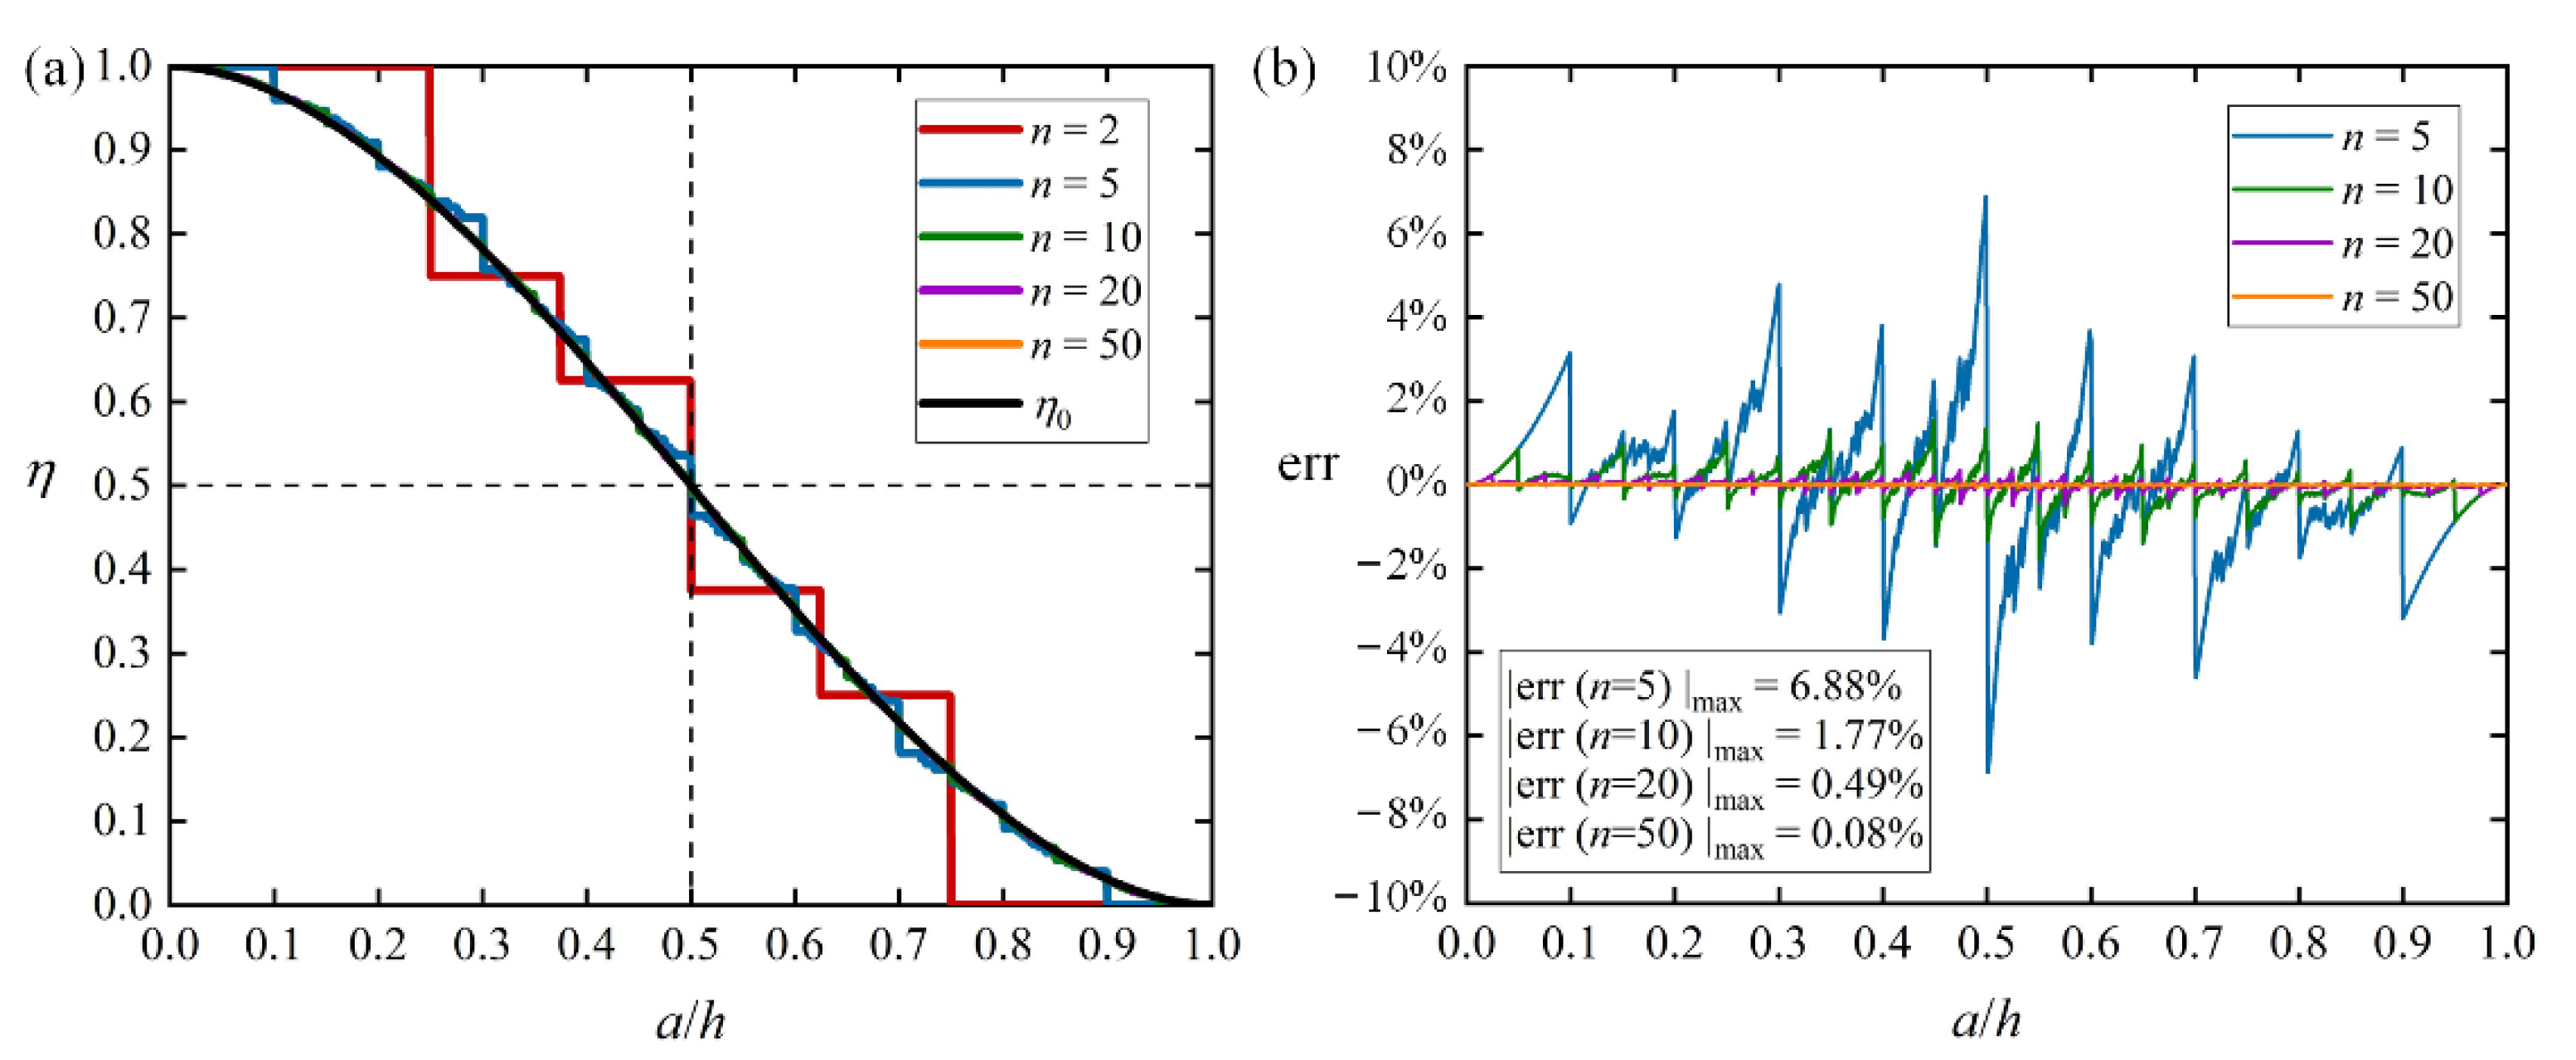
Figure 6, parameter studies and corresponding error analysis of
are presented in
Figure 7. As shown in
Figure 7a, while the relative crack length
increases by an incremental step of
, the remaining interaction percentage of original bond decreases from 1 to 0; it can also be seen that Equation (13) rapidly converge to Equation (11) as partition number
increases, because some curves are overlapped. Such convergence is also shown in
Figure 7b for the error analysis, in which the relative error is already less than
for
.
3.2. Differences from Traditional Paradigm
The key of peridynamics is the interaction between any two material points, i.e.,
bond, and more precise description of the bond status is thus beneficial for peridynamic studies in quantitative sense. In the traditional paradigm, as presented in
Section 2.3.2, the description of bond status is involved in bond breakage judgement and volume correction procedure.
On the one hand, the bond described by Equation (7) and Equation (9) in the traditional paradigm has only two individual statuses, i.e., broken or unbroken, which is not precise enough; as a result, the traditional paradigm of peridynamics heavily relies on the spacing of material points to describe discontinuity geometrical characteristics. Since the proposed bond decomposition elegantly turns such description from “whether to break” into “how many to count”, the dualistic description in the traditional paradigm is actually a dualistic simplification of BDS.
On the other hand, the name of “volume correction” is misleading. According to dimensional analysis, with the dimension of Force/(Length)6 represents the forces exerted on per volume of by per volume of . Therefore, it is essentially not volume correction but interaction correction, and the values of two correction happen to be the same for continuum media; in other words, the volume correction in Equation (4) of the traditional paradigm is actually a particular case of in Equation (11).
Considering the above analysis, the fundamental equation of peridynamics should thus be improved as:
or
in which
denotes the actual volume of material point considering discontinuities and
denotes the ideal volume of material point assuming there are no discontinuities. For simplified formulation, it can be written as:
Local damage of material point, Equation (10), should be improved as:
3.3. Verifications and Comparisons
3.3.1. Cracks
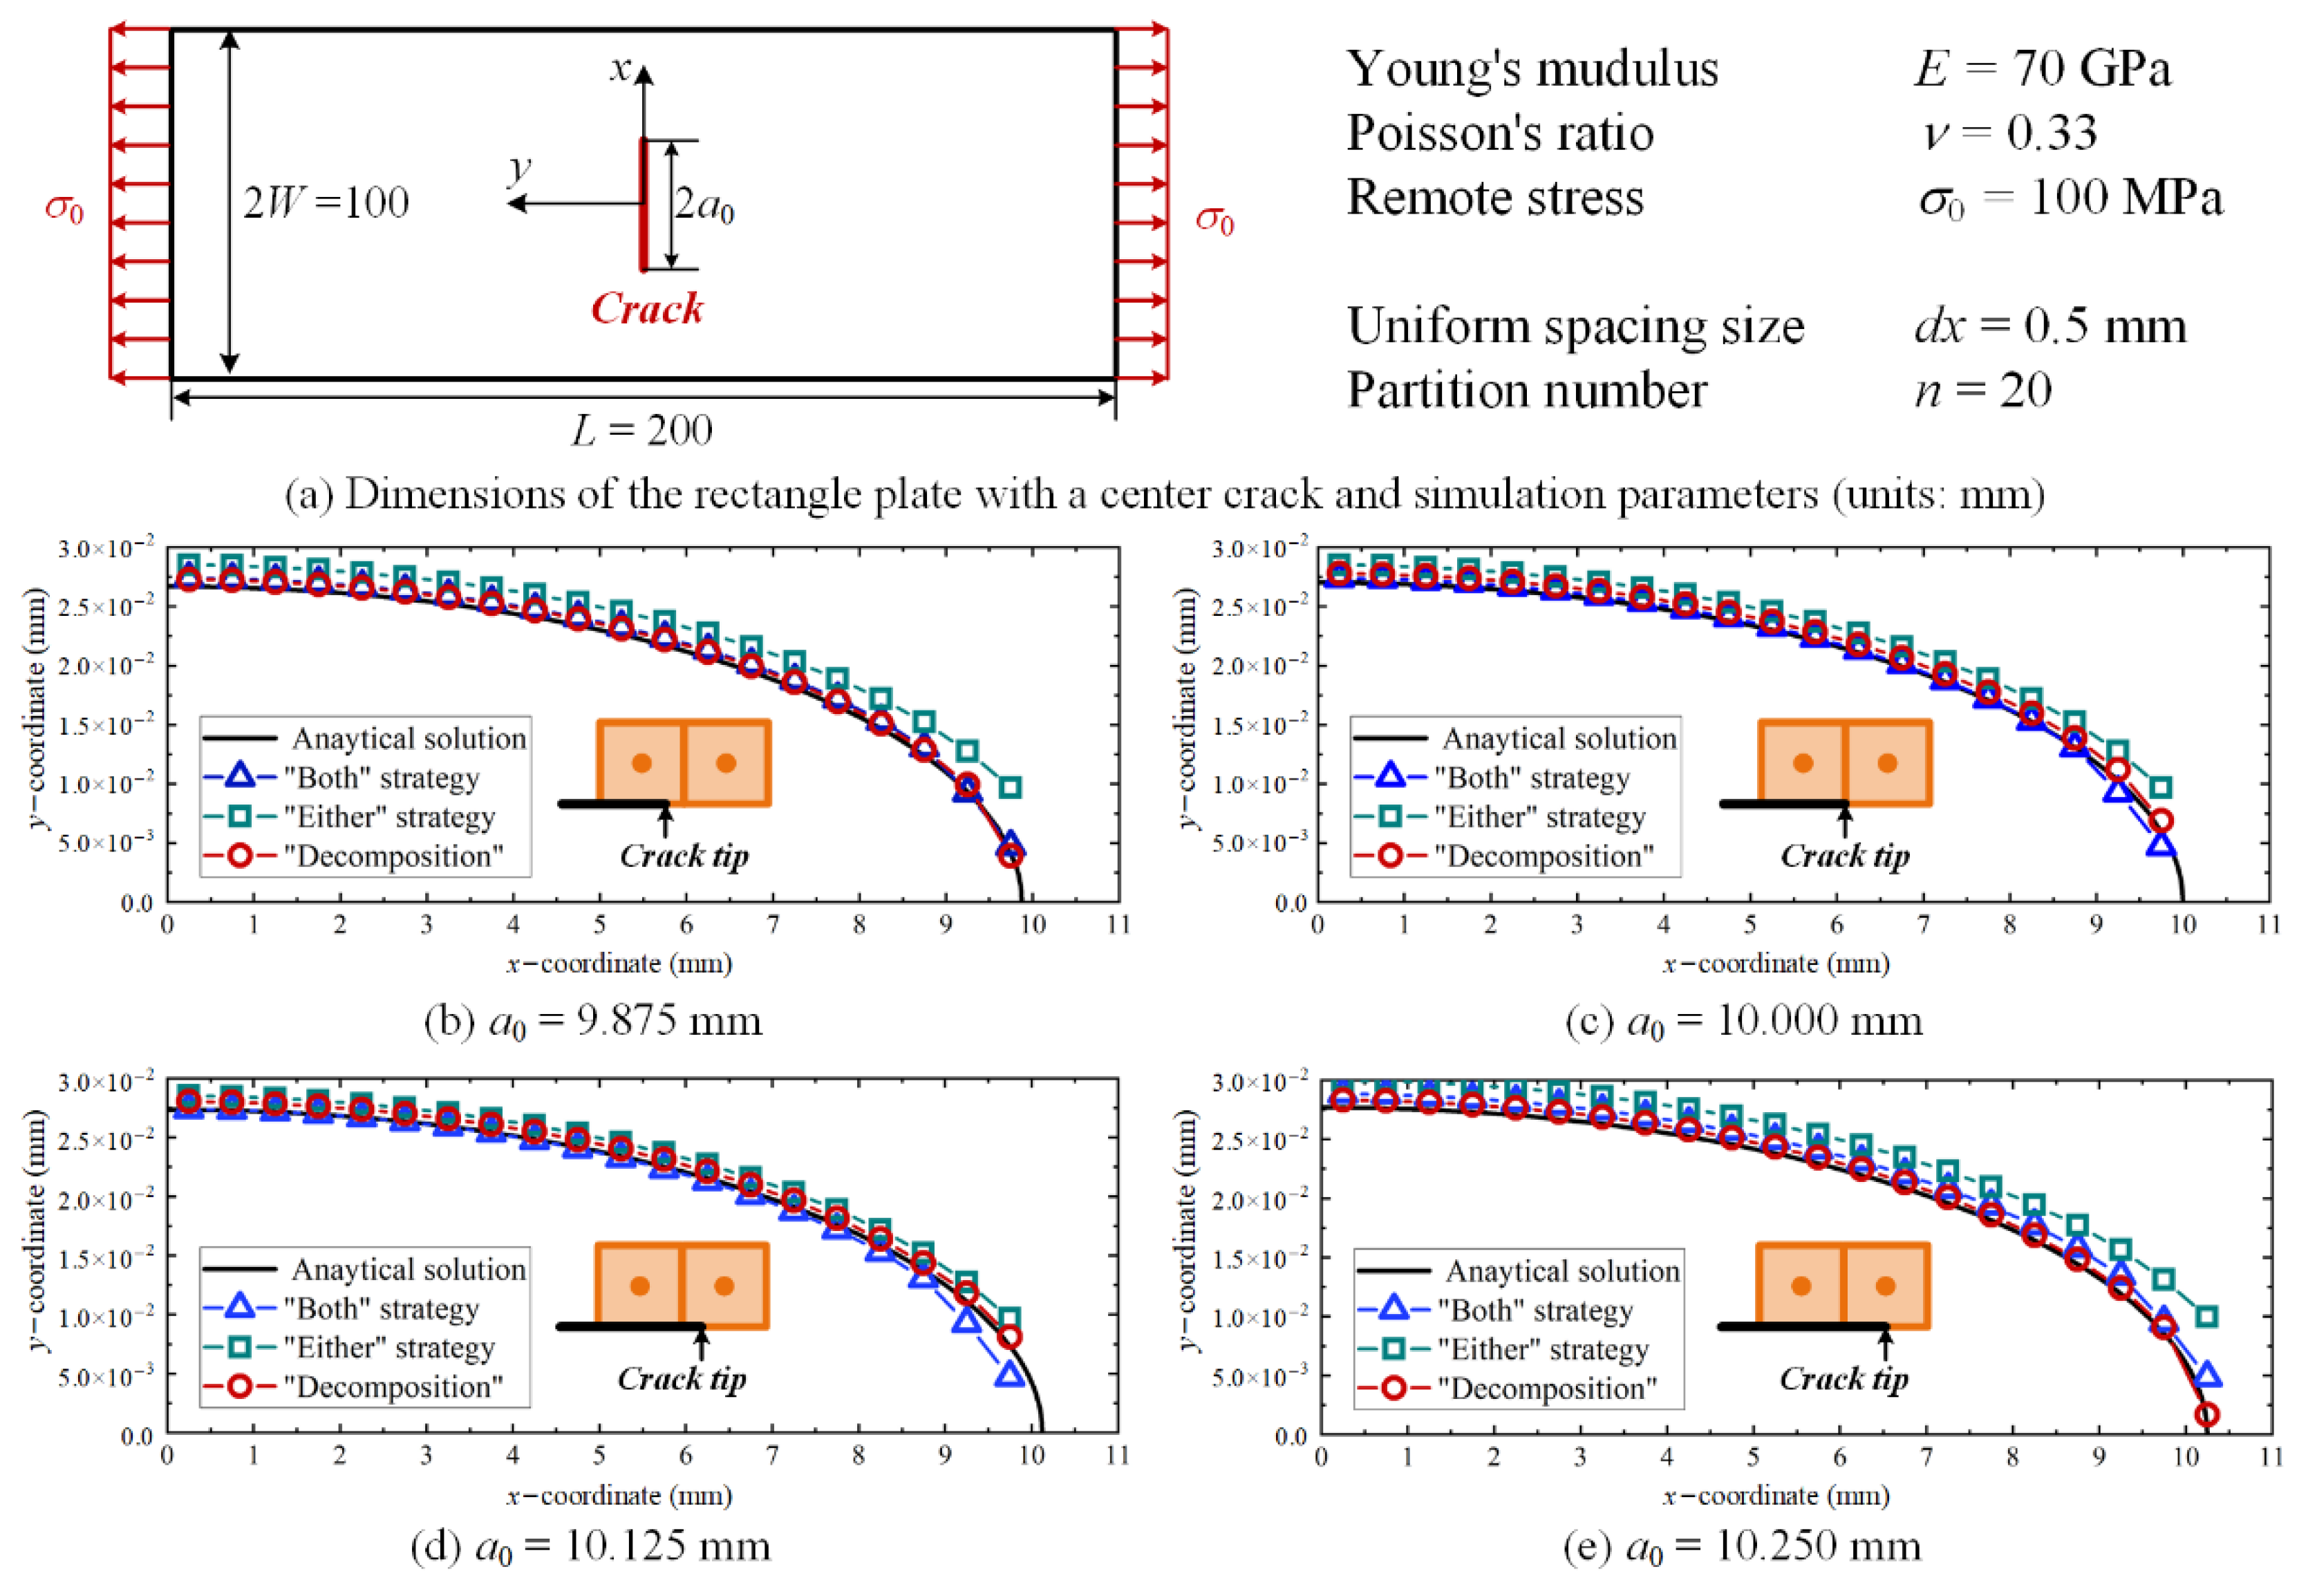
A rectangle plate with a center crack as shown in
Figure 8a is simulated, and results of crack surface
-direction displacement are compared with analytical solution
and those obtained by aforementioned two strategies in
Section 2.3.2. Due to the periodic arrangement of material points with uniform spacing, crack length is carefully chosen to vary almost within the range of a single material point (
in
Figure 8b–e); since the locations of crack tip varies between two certain material points and there are no differences in bond breakages, the results given by “both” and “either” strategies remain the same. The “either” strategy always gives predictions obviously larger than analytical solutions, and those given by “both” strategy are larger when crack tip just exceeds a material point and smaller when crack tip is about to reaching a new material point; as a contrast, the decomposition strategy gives a stably satisfying results due to its precise description of interaction loss around crack tip.
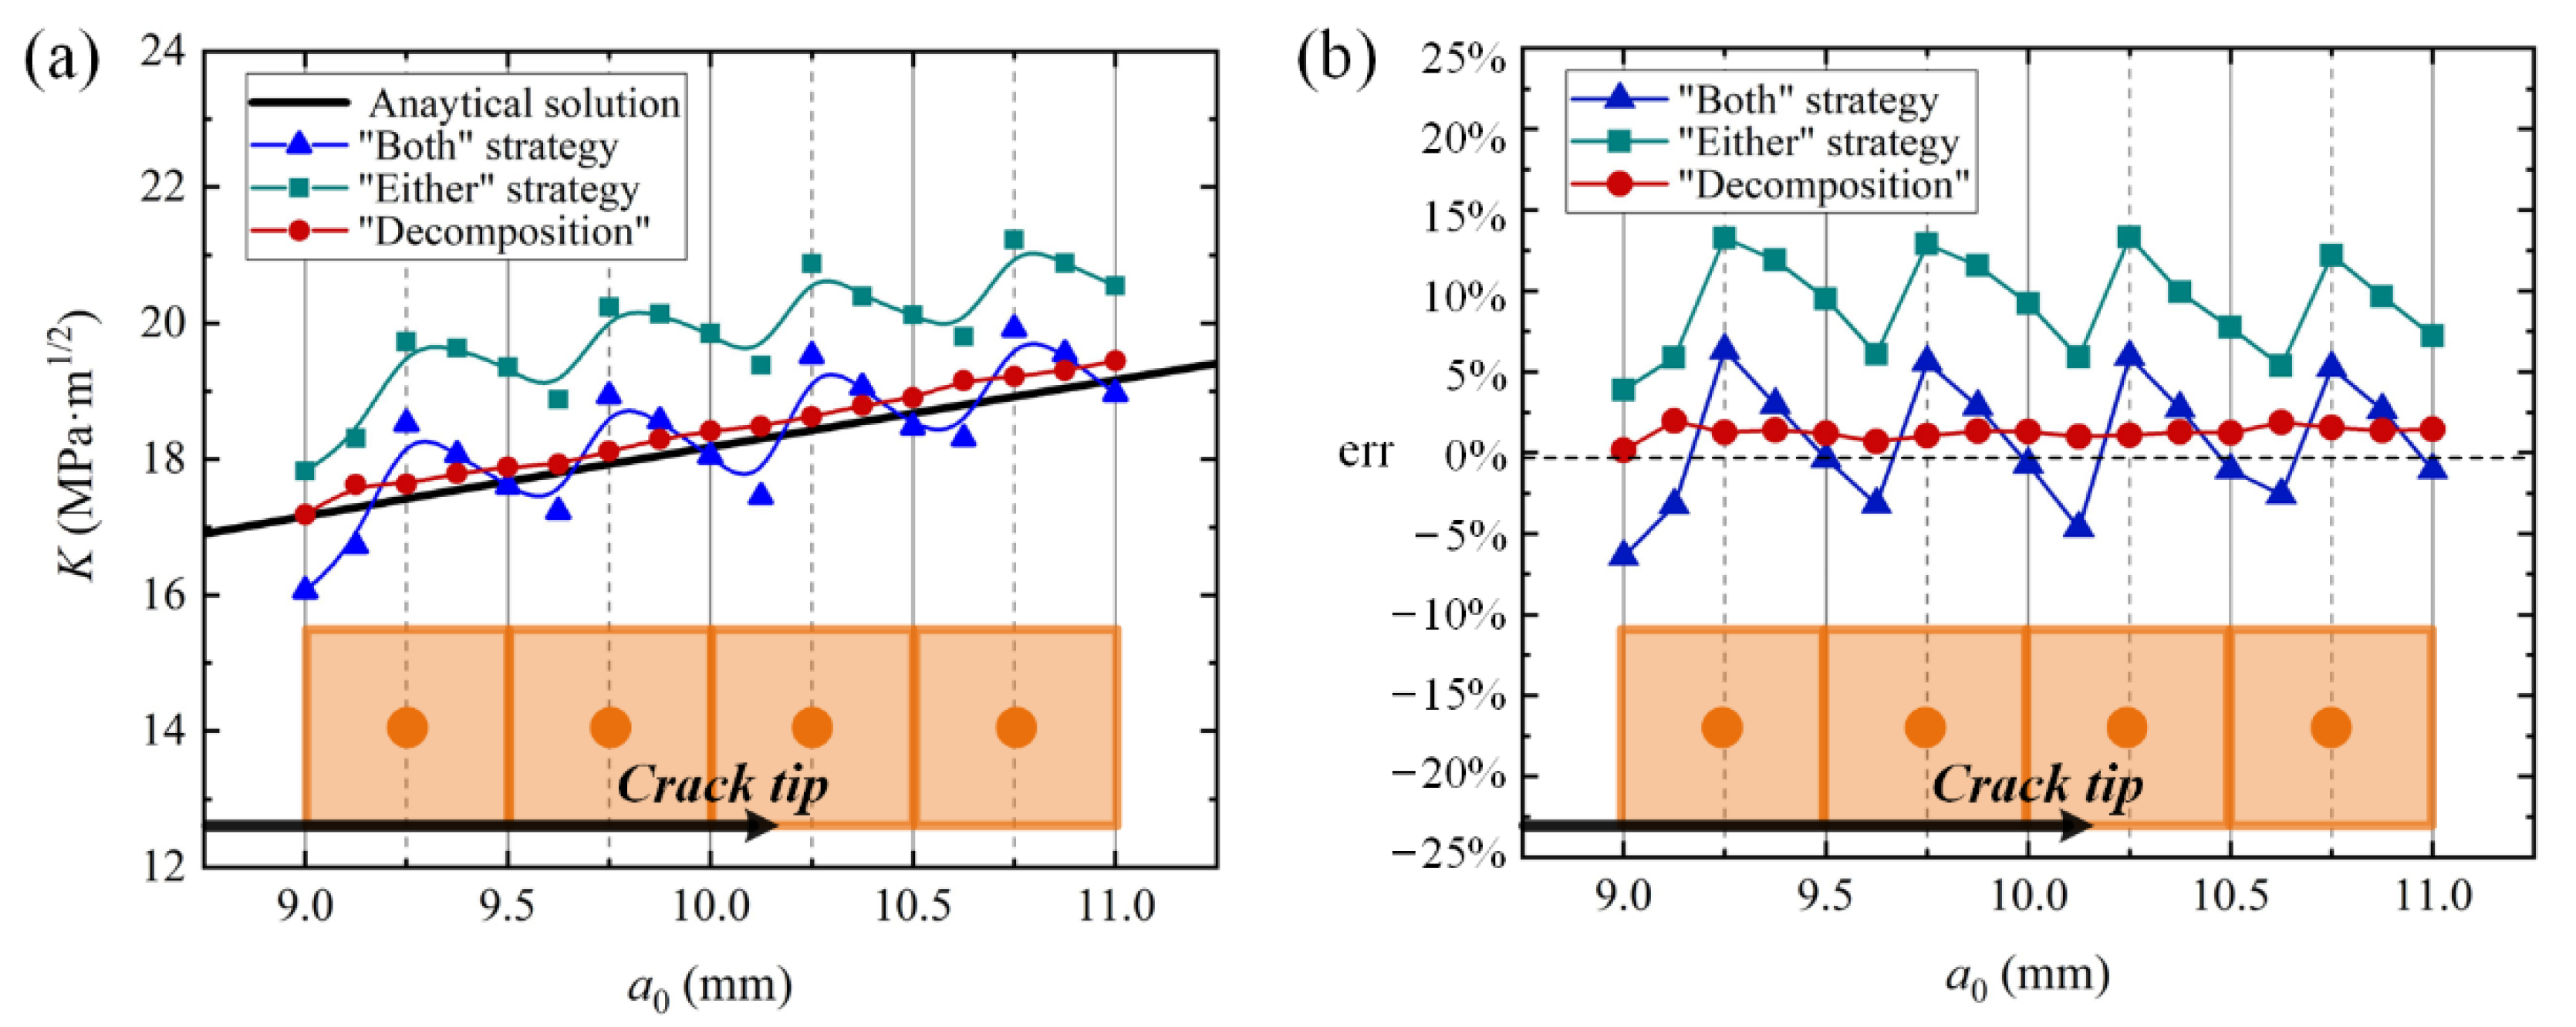
Comparisons will be clearer if the stress intensity factor (SIF) is taken as the indicator. Analytical solution of this problem is
For “Both” and “Either” strategies, since deformation remains the same if crack tip varies between two certain material points, SIF derived from methods based on crack-tip displacement fields will surely remain unchanged; therefore, we here take the displacement extrapolation method to calculate SIF which is derived from crack surface displacement for mode I problem, as shown in
Figure 9a. It is interesting that SIF for “Both” and “Either” strategies will decrease when crack length increases with crack tip between two certain material points, for the crack length becomes larger although crack tip deformation keeps unchanged; in other words, displacement extrapolation method and crack-tip deformation methods are actually not equivalent for SIF calculation by these two strategies, which does not accord with fracture mechanics. As a contrast, results obtained by decomposition strategy agree well with analytical solution. Relative errors of SIF are given in
Figure 9b, in which it is clear that the results of decomposition strategy are much better than the other two strategies.
3.3.2. Holes
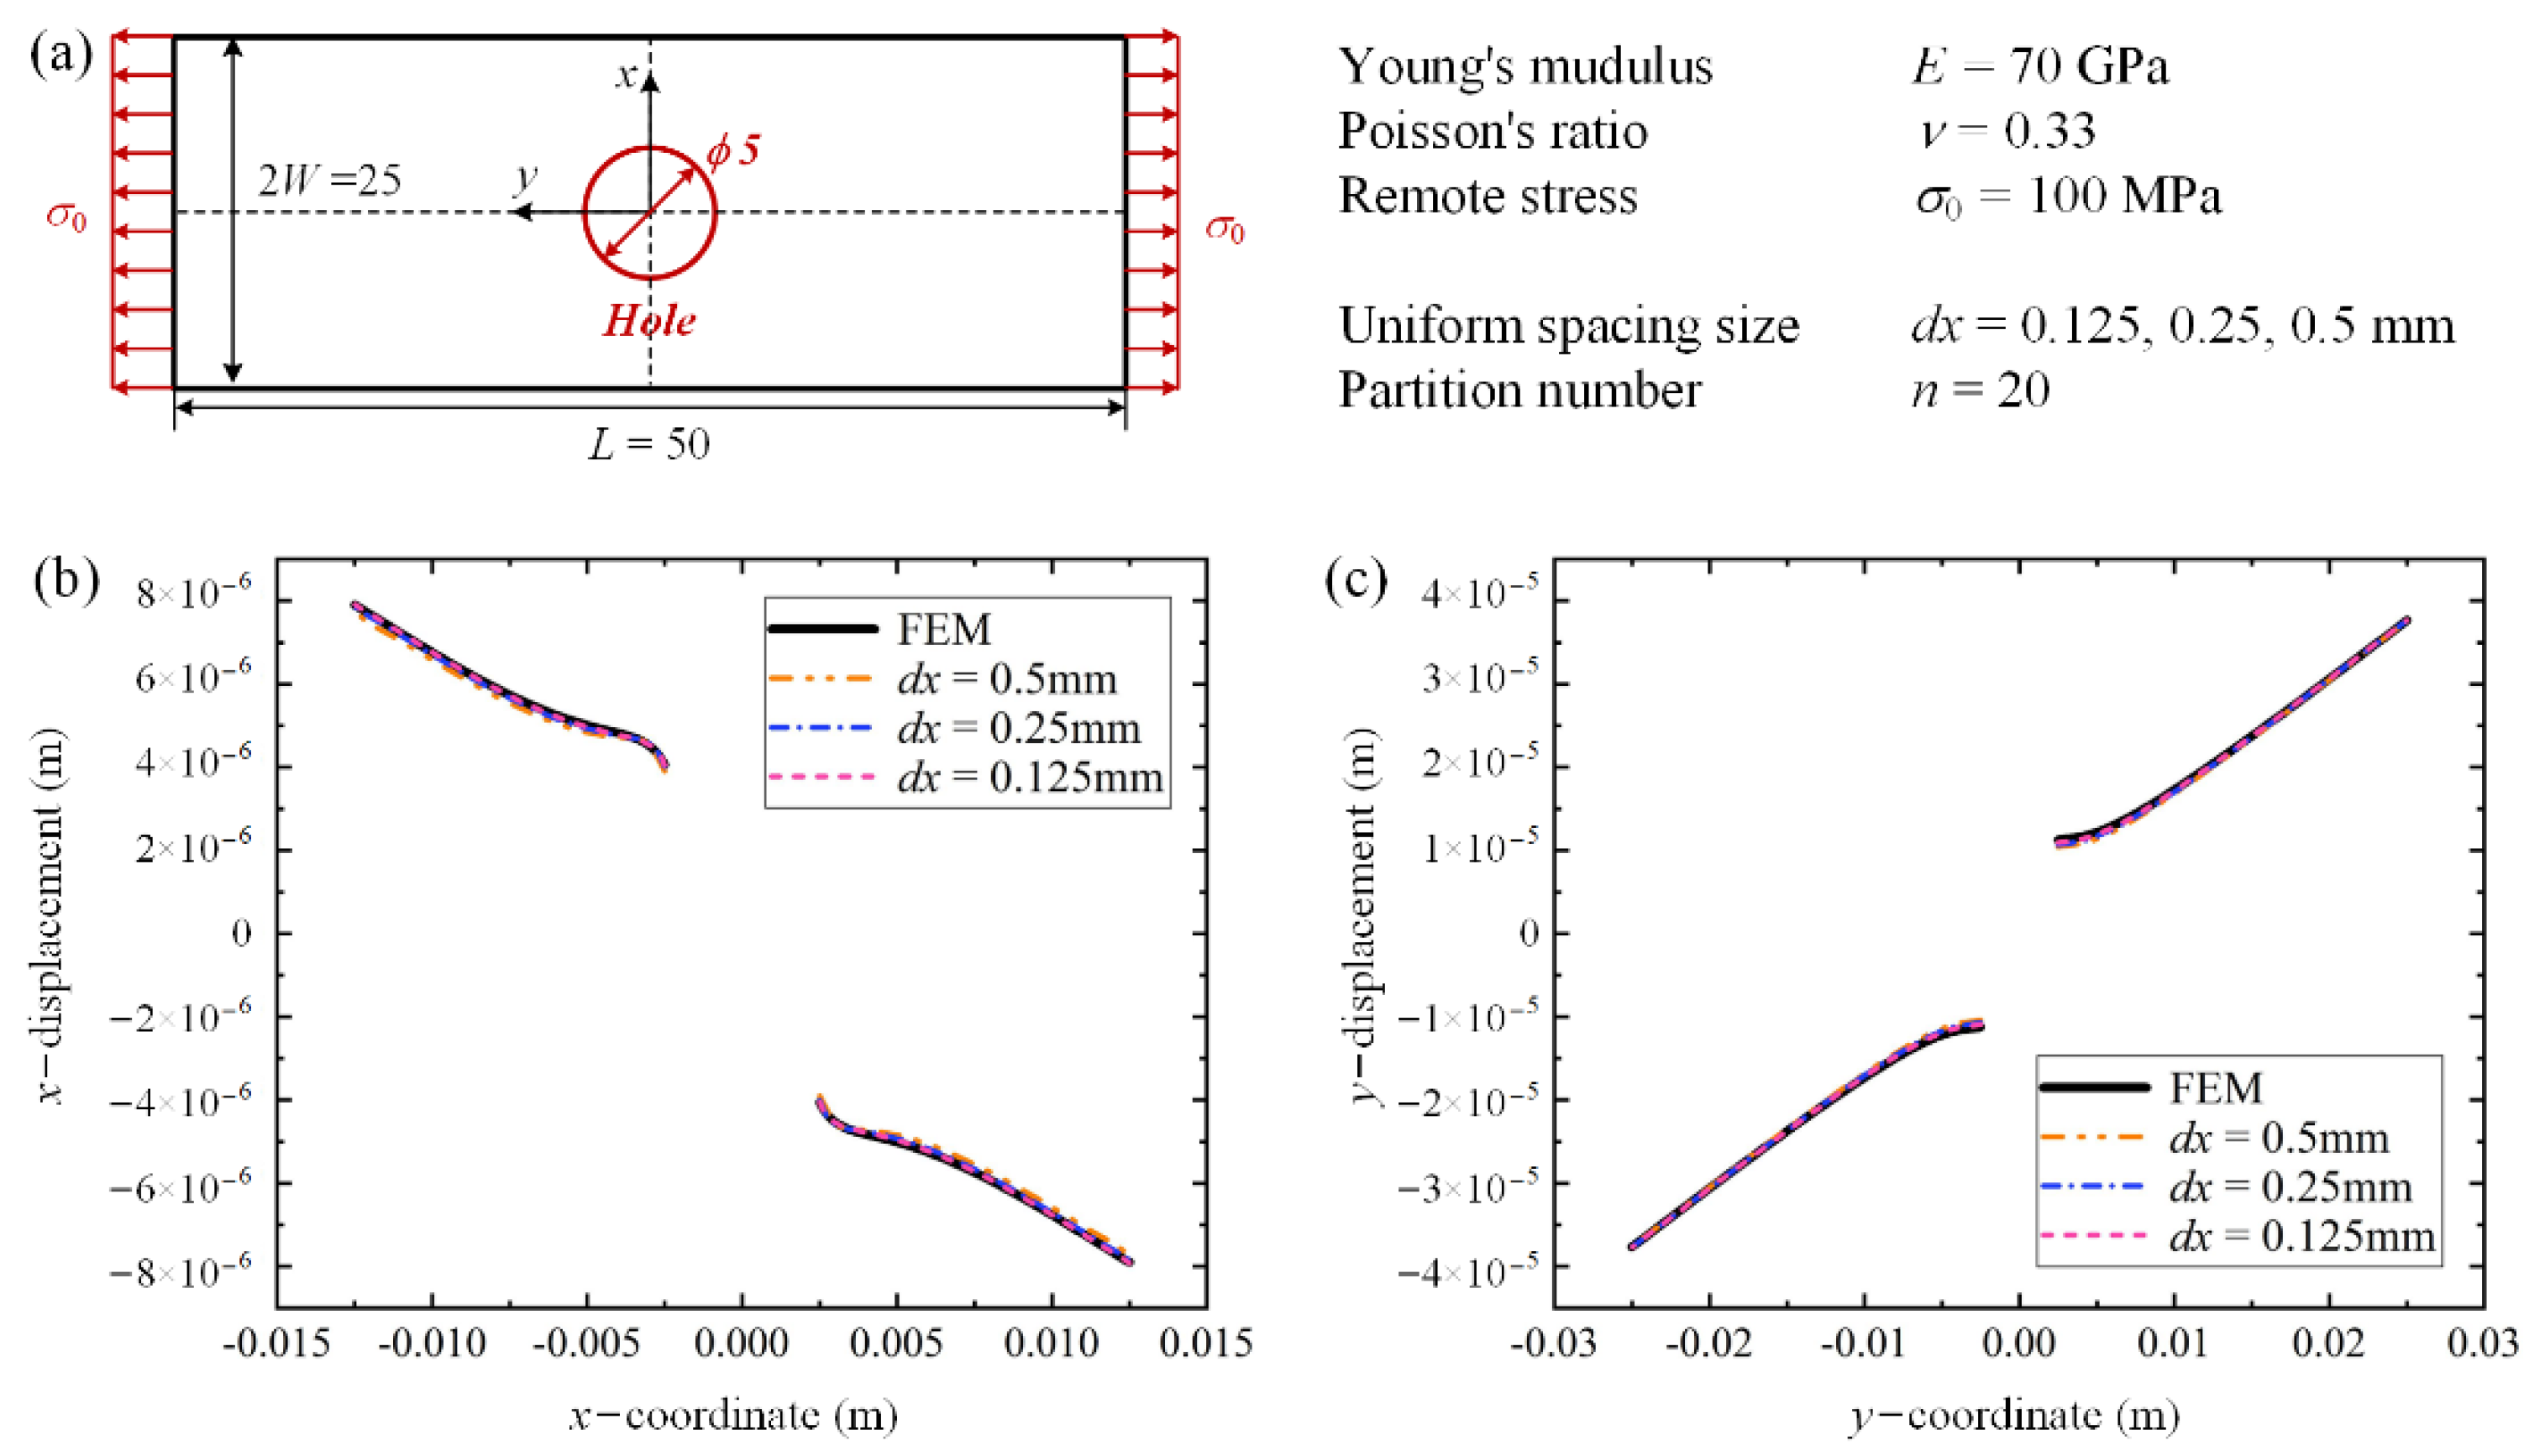
A rectangle plate with a center hole is shown in
Figure 10a for verification with common concerns about displacement fields as well as special focus on the unique feature of BDS. The dimensions of the plate are kept as the same to the examples in [
33]. On one hand, the displacement field is obtained by PD with BDS as shown in
Figure 10b,c, to compare
-displacement along
-coordinate and
-displacement along
-coordinate with FEM results, just like what previous studies for peridynamics [
33] did; for convergence studies, in addition, PD results rapidly converge to FEM ones with satisfying accuracies as uniform spacing size decreases.
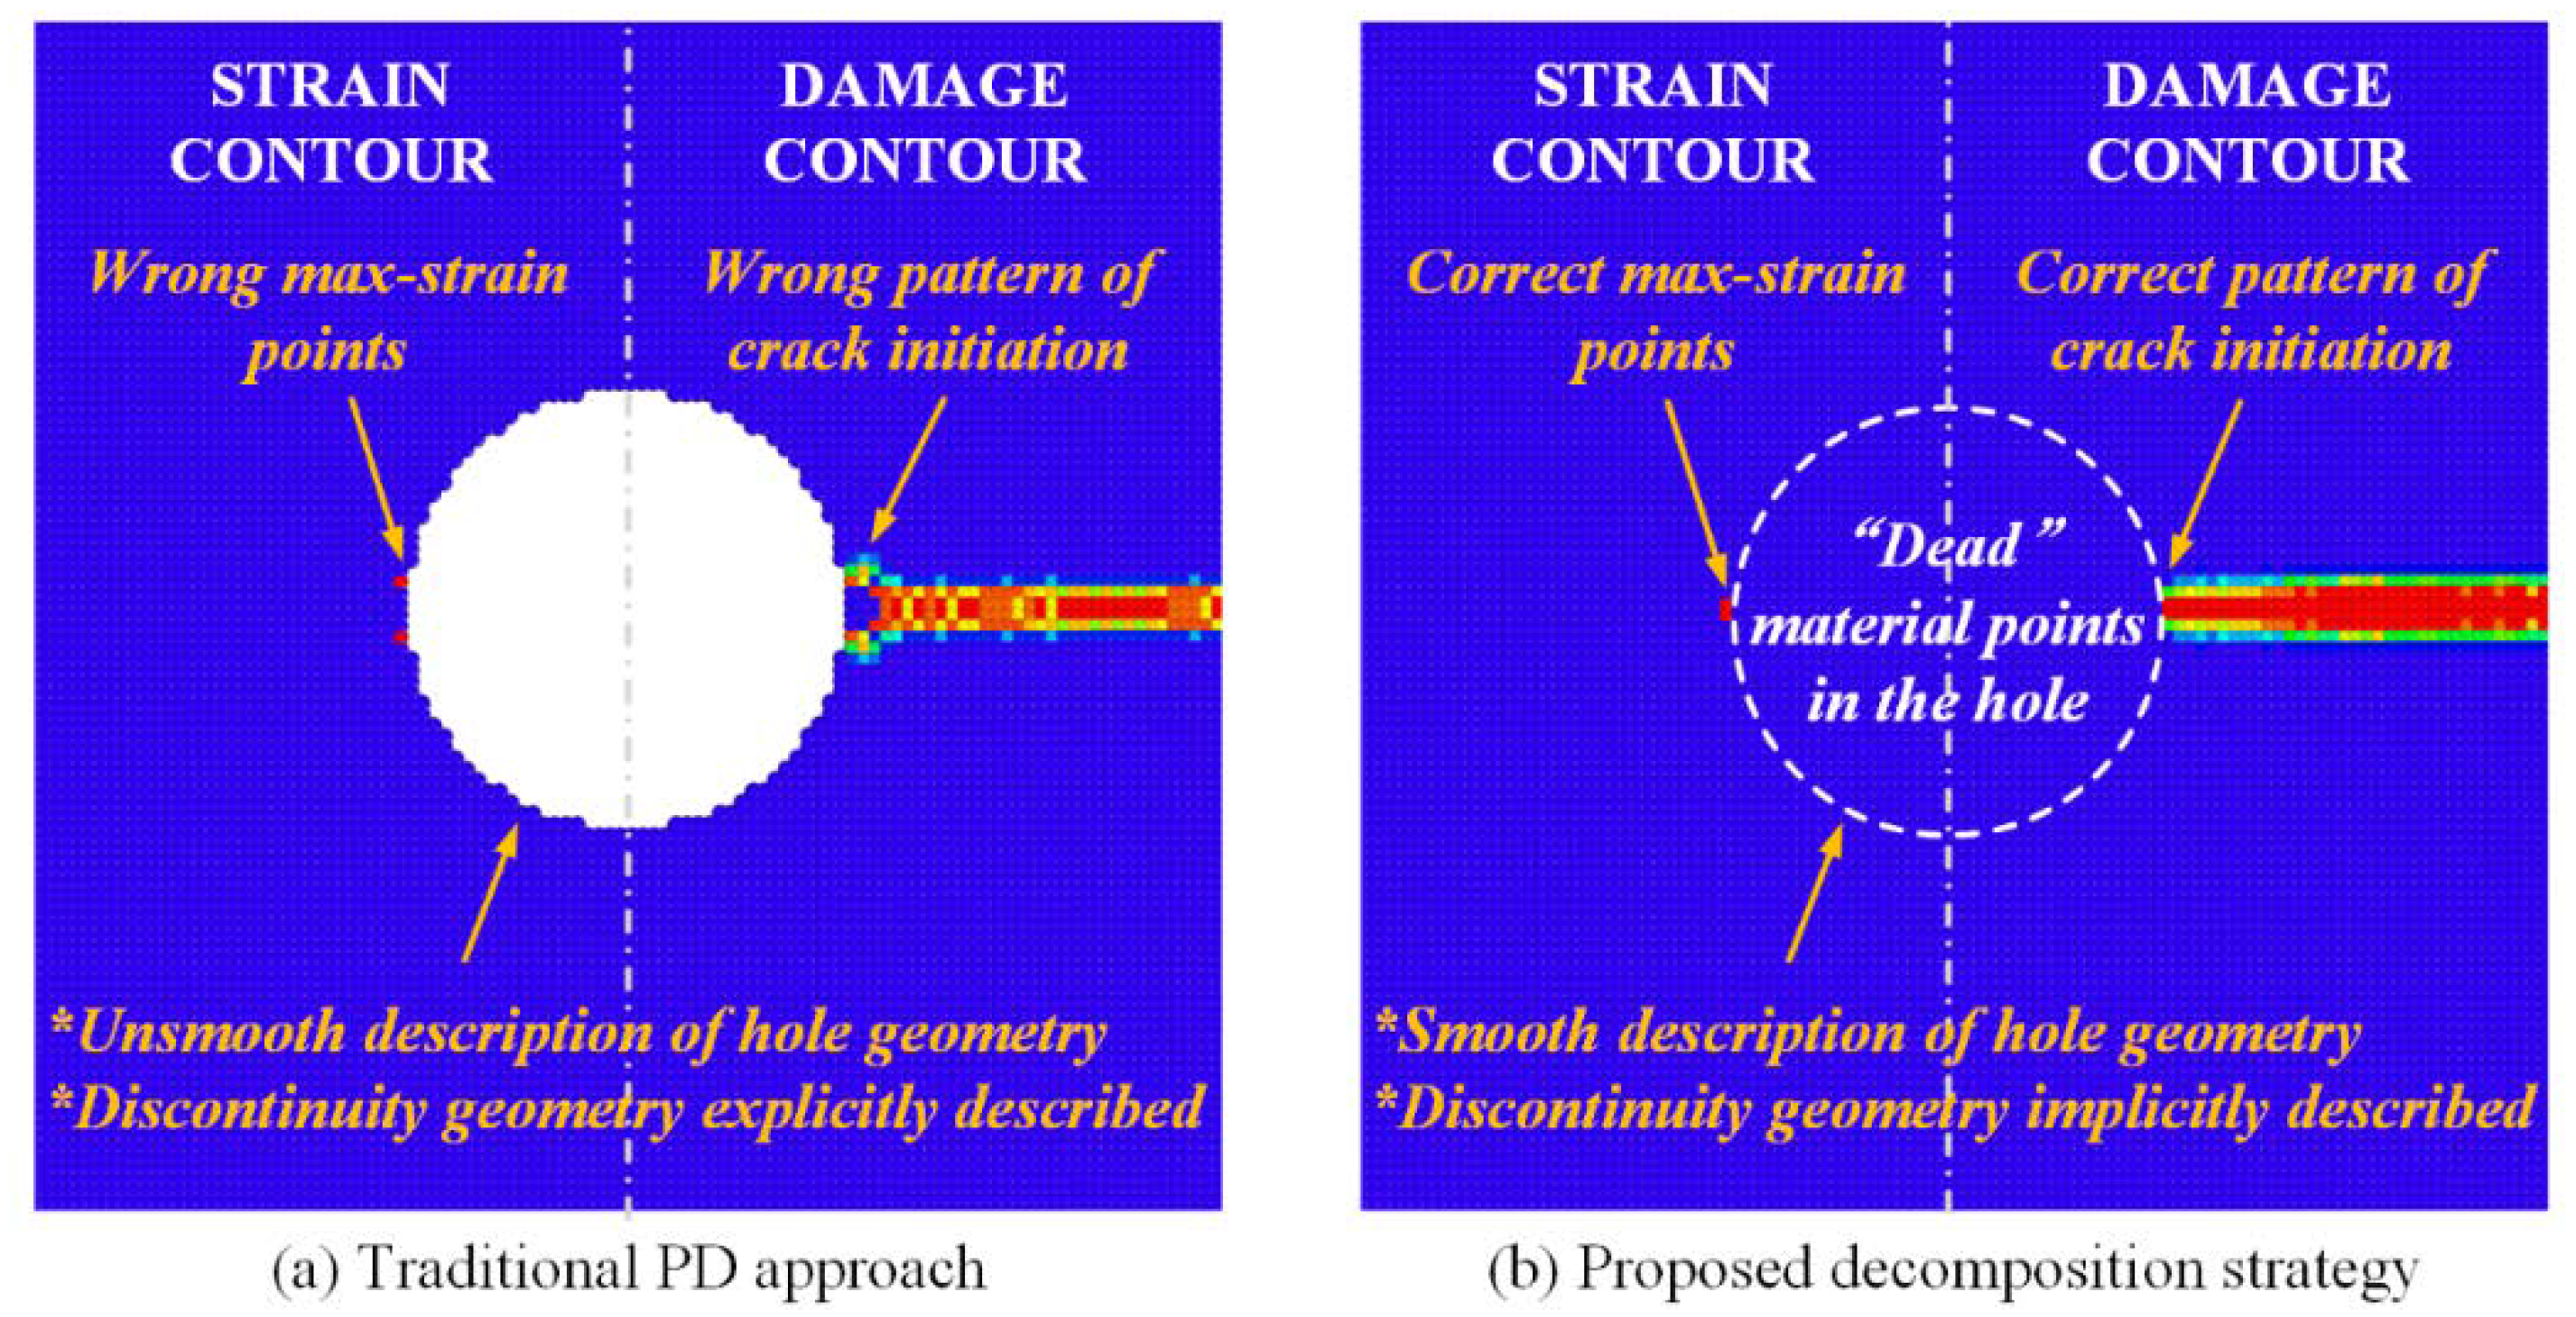
On the other hand, the unique feature of BDS is fully revealed in
Figure 11, which is the spacing-independent description of the hole. In traditional PD approaches with uniform spacing, material points within holes should be deleted which leads to unsmooth description of arc; as a result, spacing has to be rearranged if a more precise description is required, and complex numerical techniques may be applied to spacing refinement. By contrast, the proposed decomposition strategy offers a way to smoothly describe geometry features during pre-process for bond properties; descriptions of discontinuities are more accurate while a different spacing strategy is no longer necessary, which is similar to XFEM.
Compared with traditional PD approaches with uniform spacing, such unique feature of BDS brings practical benefits of estimating the maximum-strain locations or crack initiations without spacing rearrangement. As shown in
Figure 11a, max-strain points and crack initiations around holes are wrongly predicted to be at zig-zag uniform spacing of material points by traditional PD approaches, but in
Figure 11b the correct ones are given by BDS. It should be emphasized that such deviations may be tolerated in some dynamic crack problems, but will inevitably lead to huge errors in cases which are sensitive to local behaviors such as fatigue crack initiation and fatigue lifetime prediction.
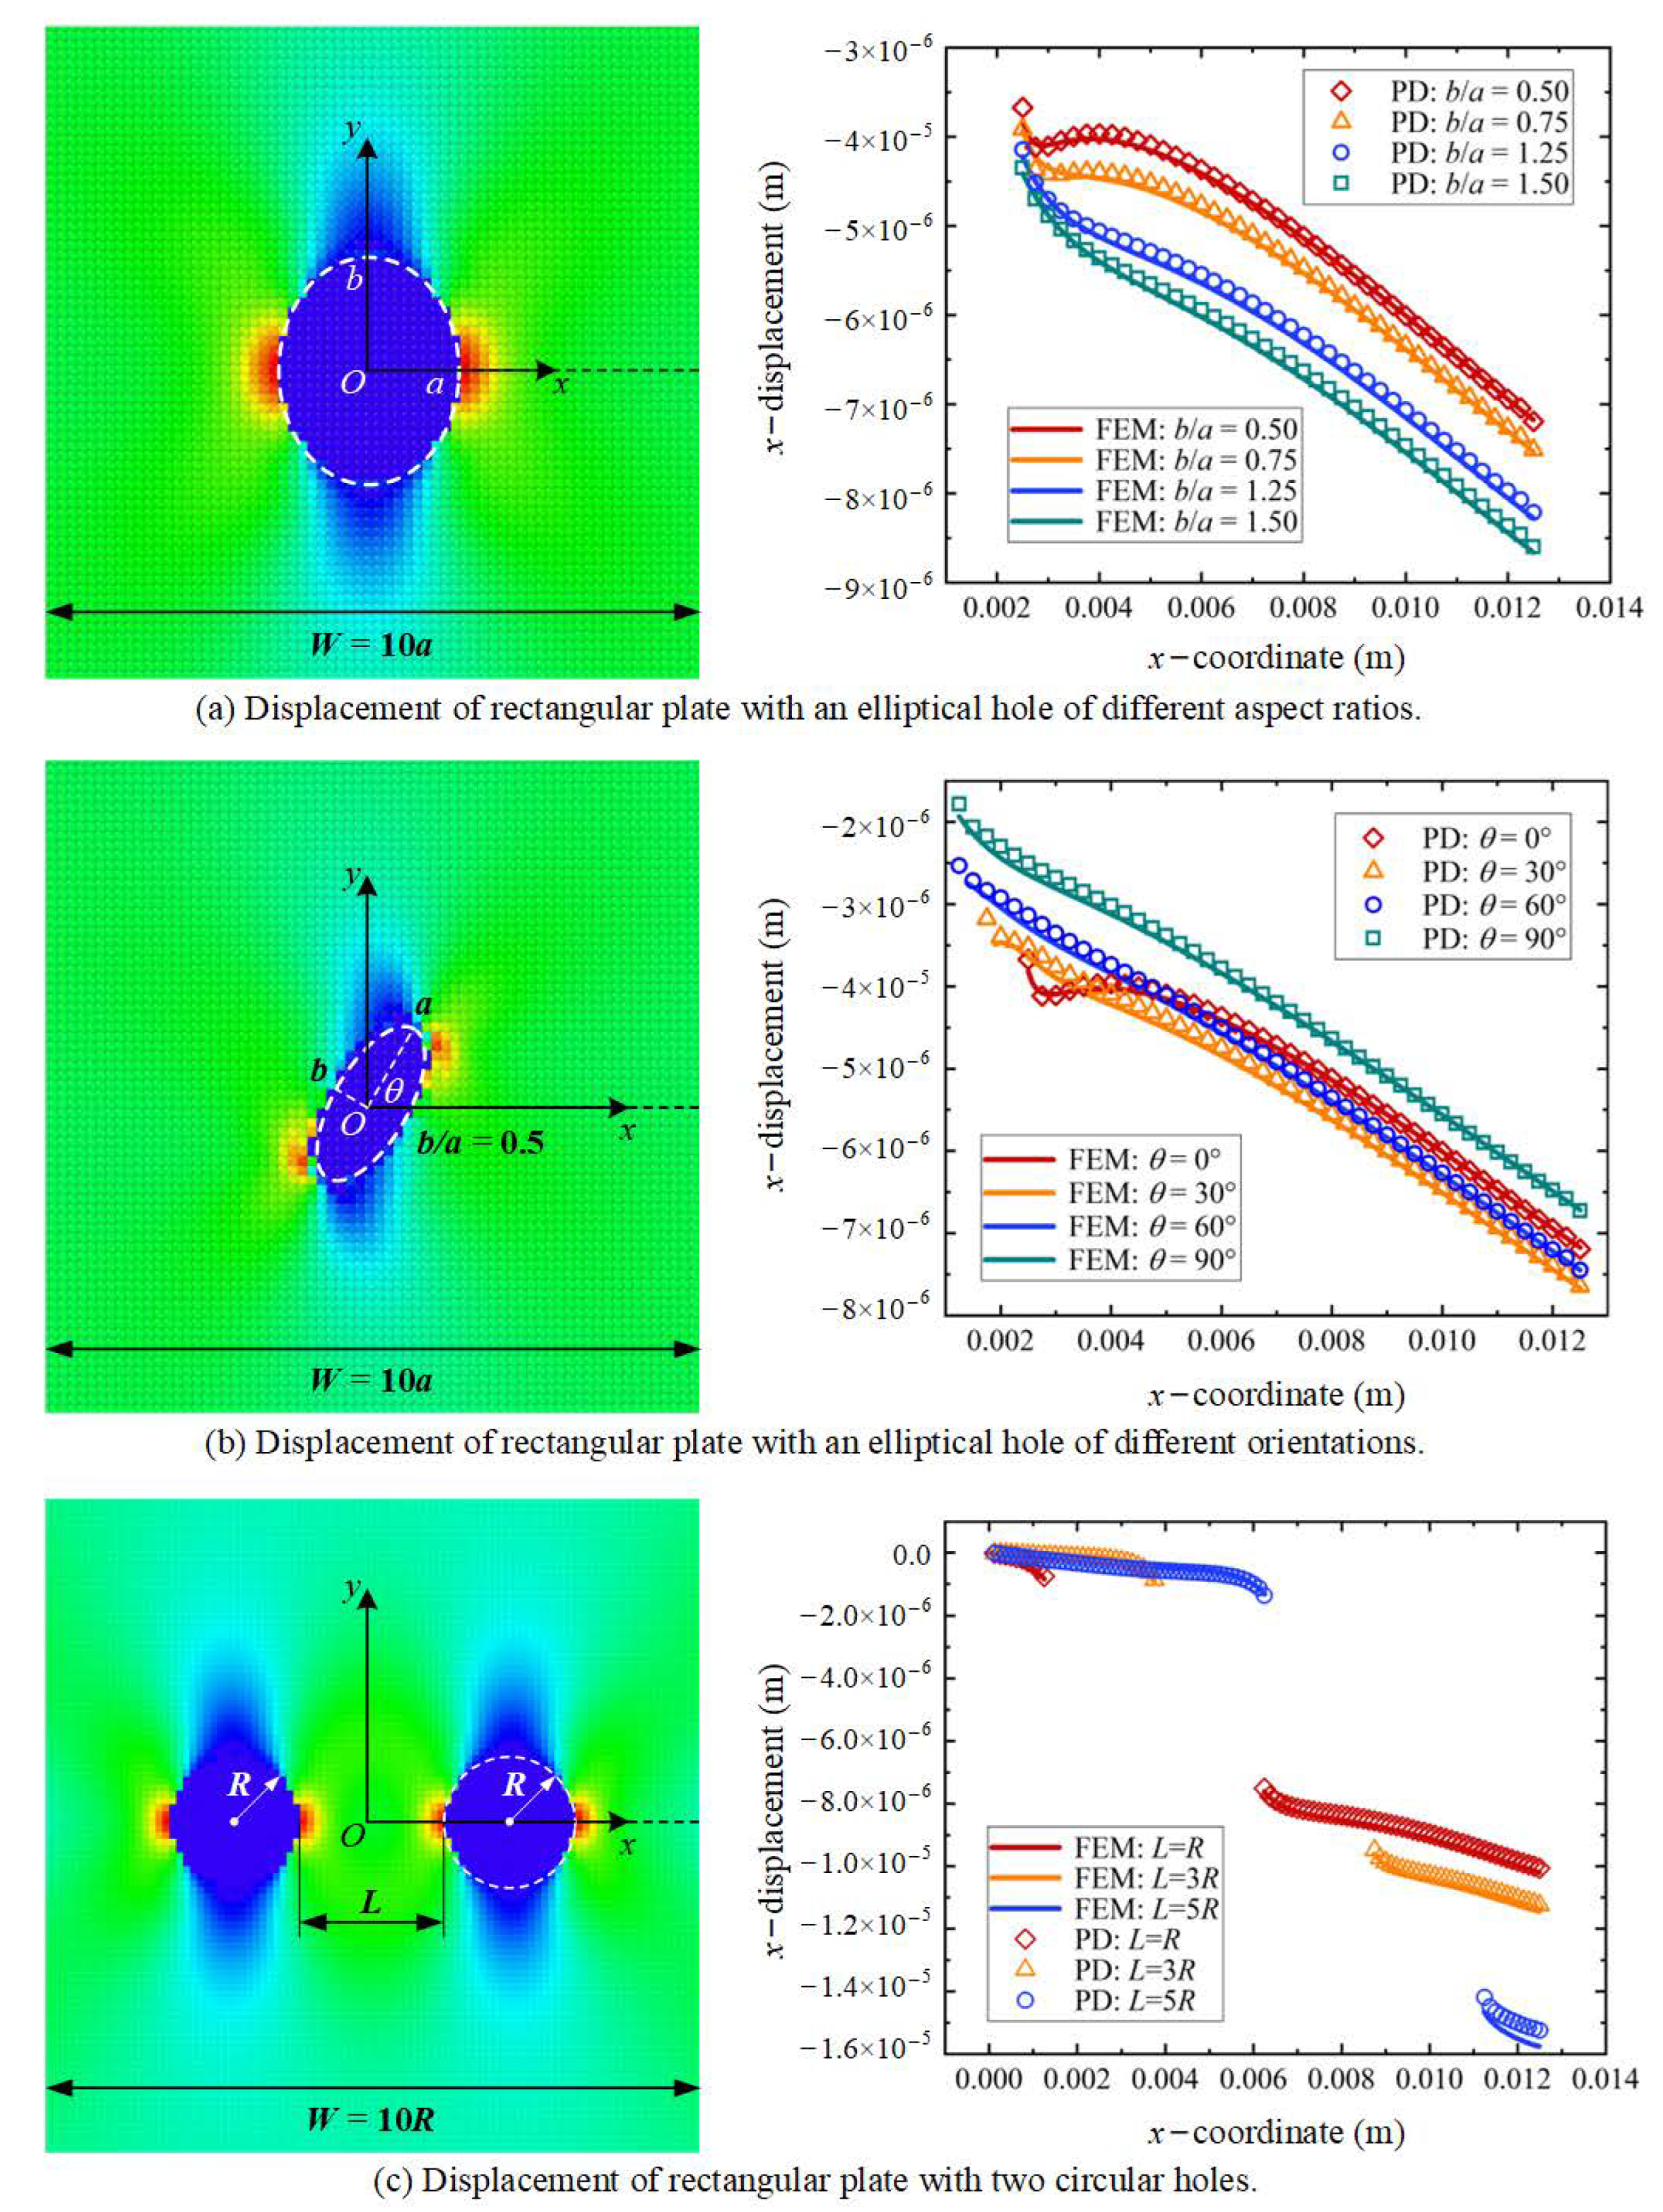
Furthermore, decomposition of PD bond is independent of discontinuity geometries and discontinuities can actually be of arbitrary shape. In
Figure 12a,b, elliptical holes with varying ellipticity as well as varying orientations are simulated and their displacements are compared with FEM results; it can be seen from strain contours that the spacing of material points remain unchanged while the ellipticity or orientation varies. Meanwhile, multi-discontinuities can also be conveniently simulated by such decomposition strategy without spacing refinement, as shown in
Figure 12c for cases of two holes as example.
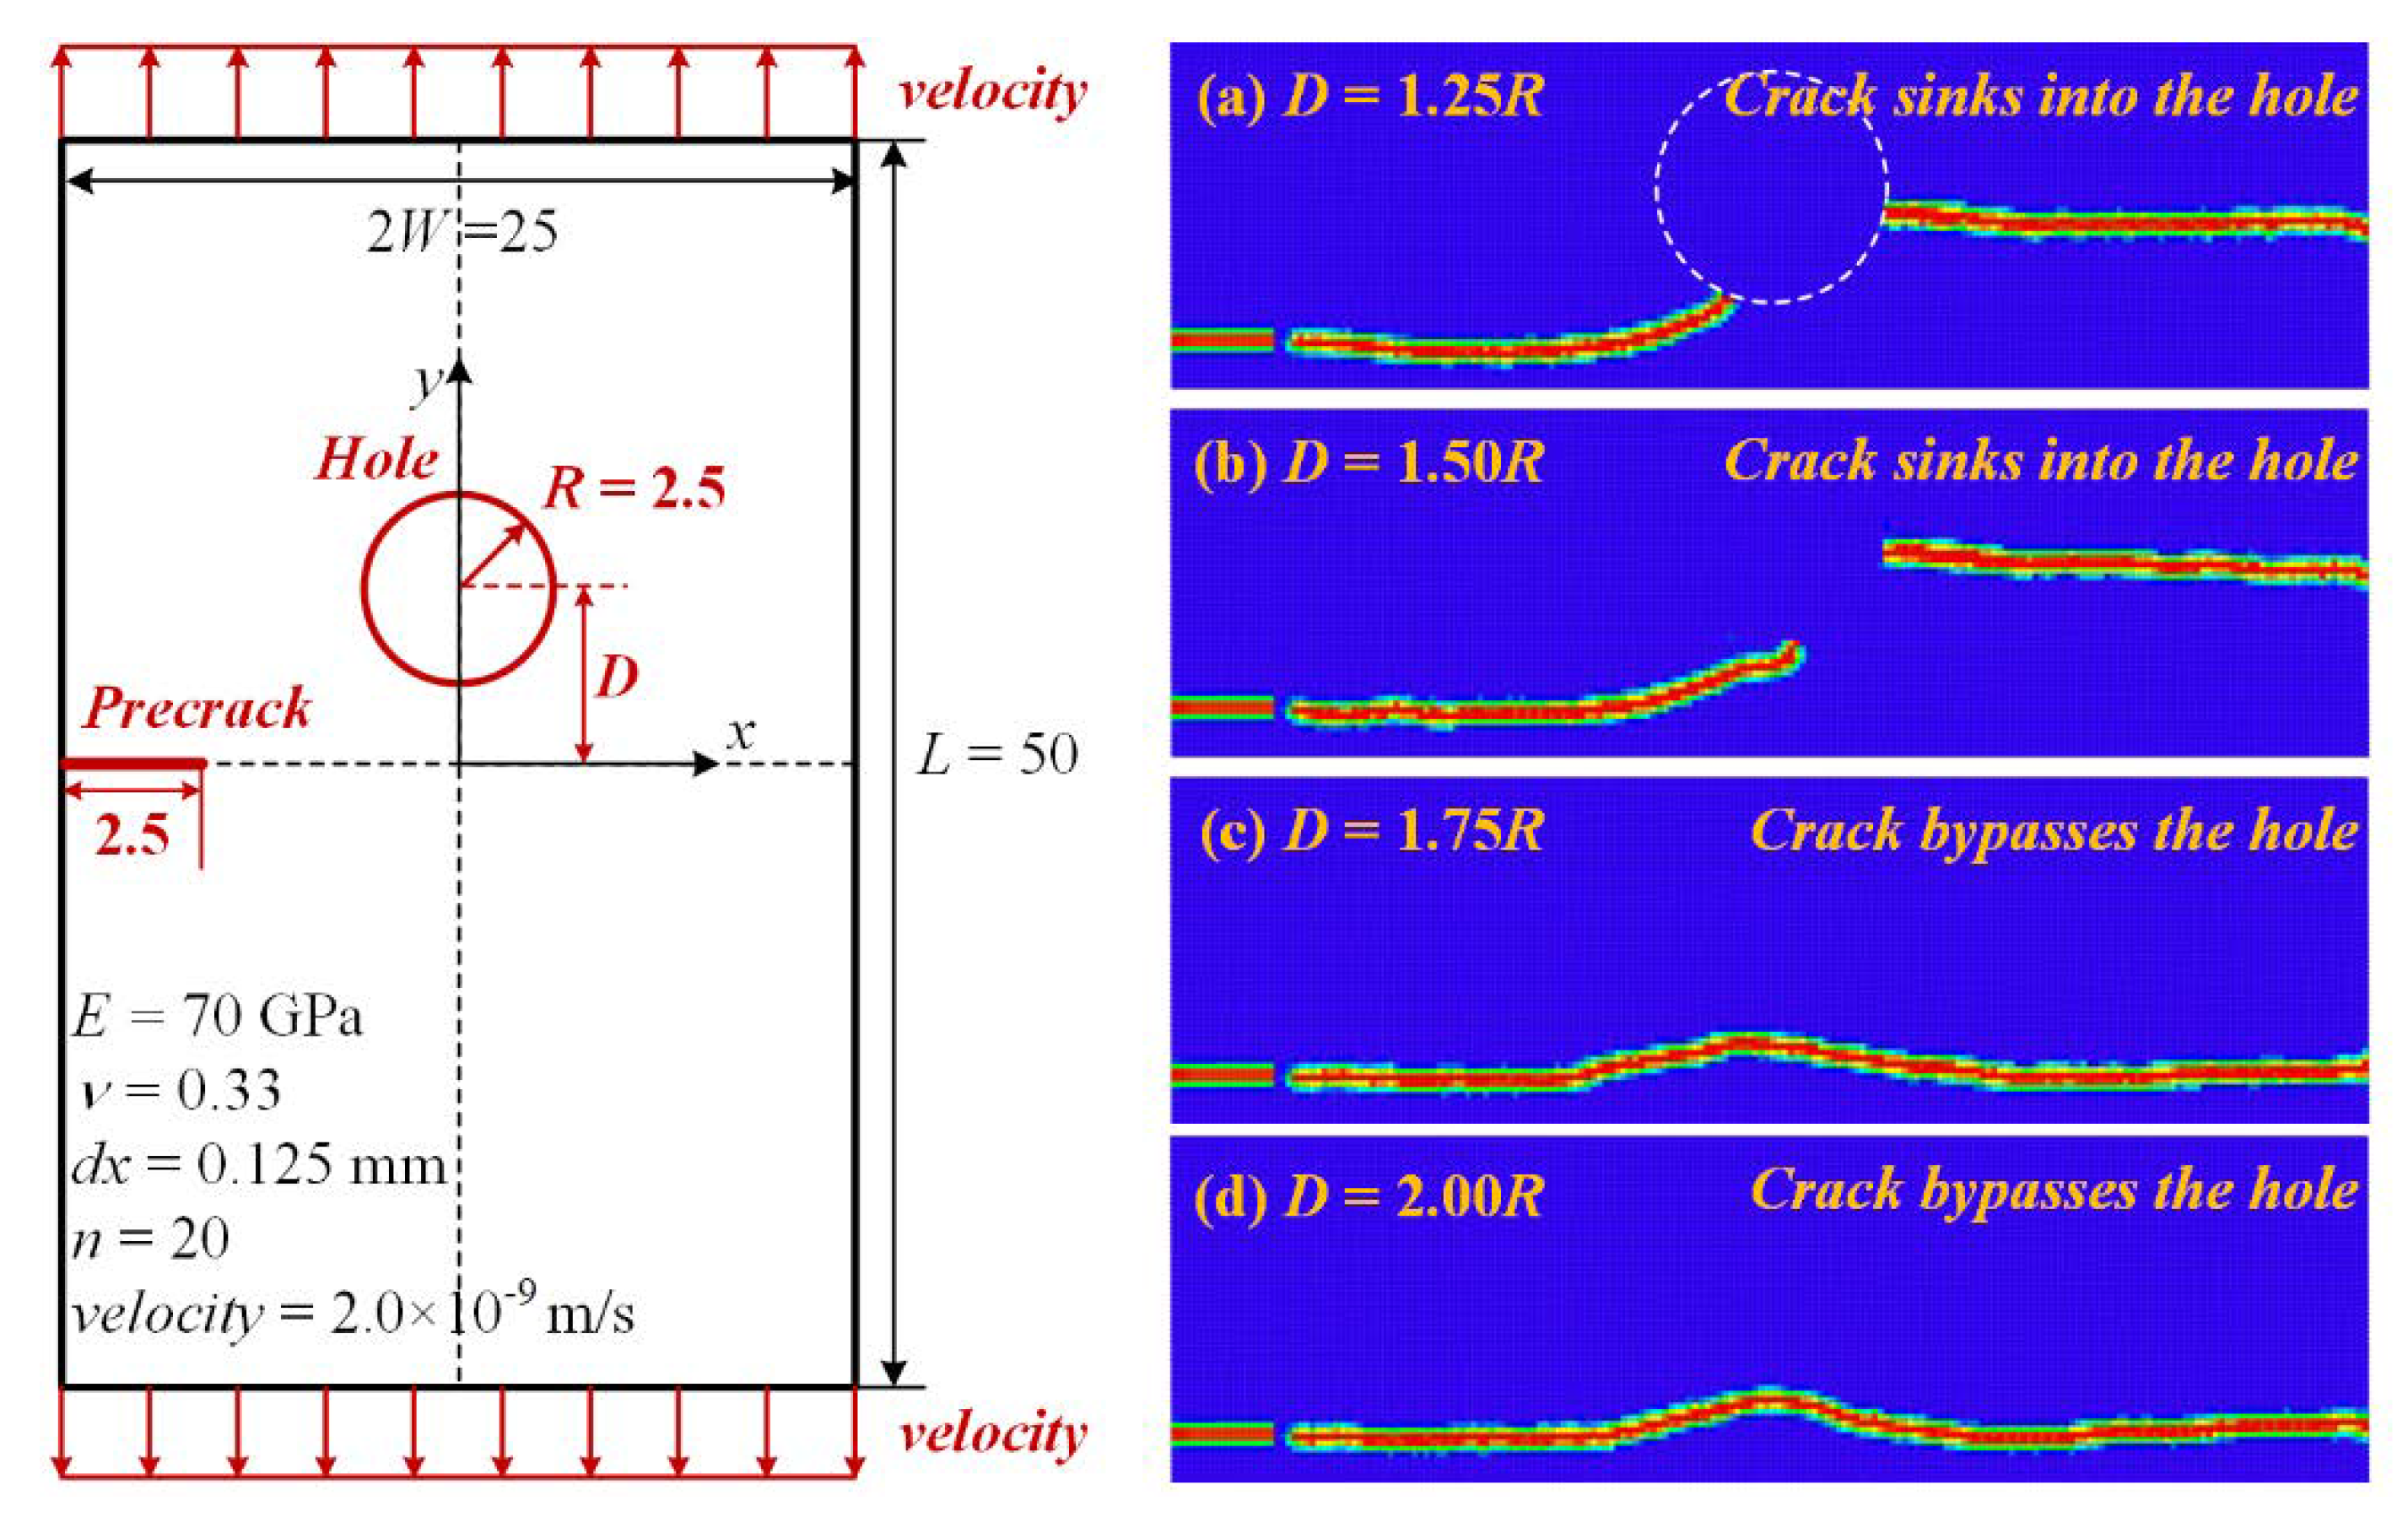
Considering that the innate advantages of peridynamics is to simulate crack growth and discontinuity evolvement, numerical examples of crack propagation interacting with discontinuities are performed. As shown in
Figure 13, a single-edge notched plate with a hole is subjected to quasi-static remote tension; cracks will either sink into the hole or bypass the hole, which depends on the distance between the hole and the pre-crack line. Such results agree with those obtained with traditional simulations where the hole is explicitly modeled by spacing of material points, and also accords with previous experiment observations [
36].
Hence, accurate displacement fields and correct damage patterns around holes of any shapes and any amounts can be obtained by BDS, with no need to refine or rearrange the spacing of material points, and its capability of spacing-independent description for discontinuities is fully verified.
3.4. Discussions
The propose BDS is similar in many aspects to several present theories or methods, i.e., continuum damage mechanics (CDM), extended finite element method (XFEM), representative volume element (RVE) in multiscale simulations. In this section, such similarities and differences will be discussed, and its potential for fatigue problems is also analyzed despite in qualitative sense.
3.4.1. For Damage Descriptions
It is interesting that
in BDS looks similar to
scalar damage variable in CDM, defined by Kachanov [
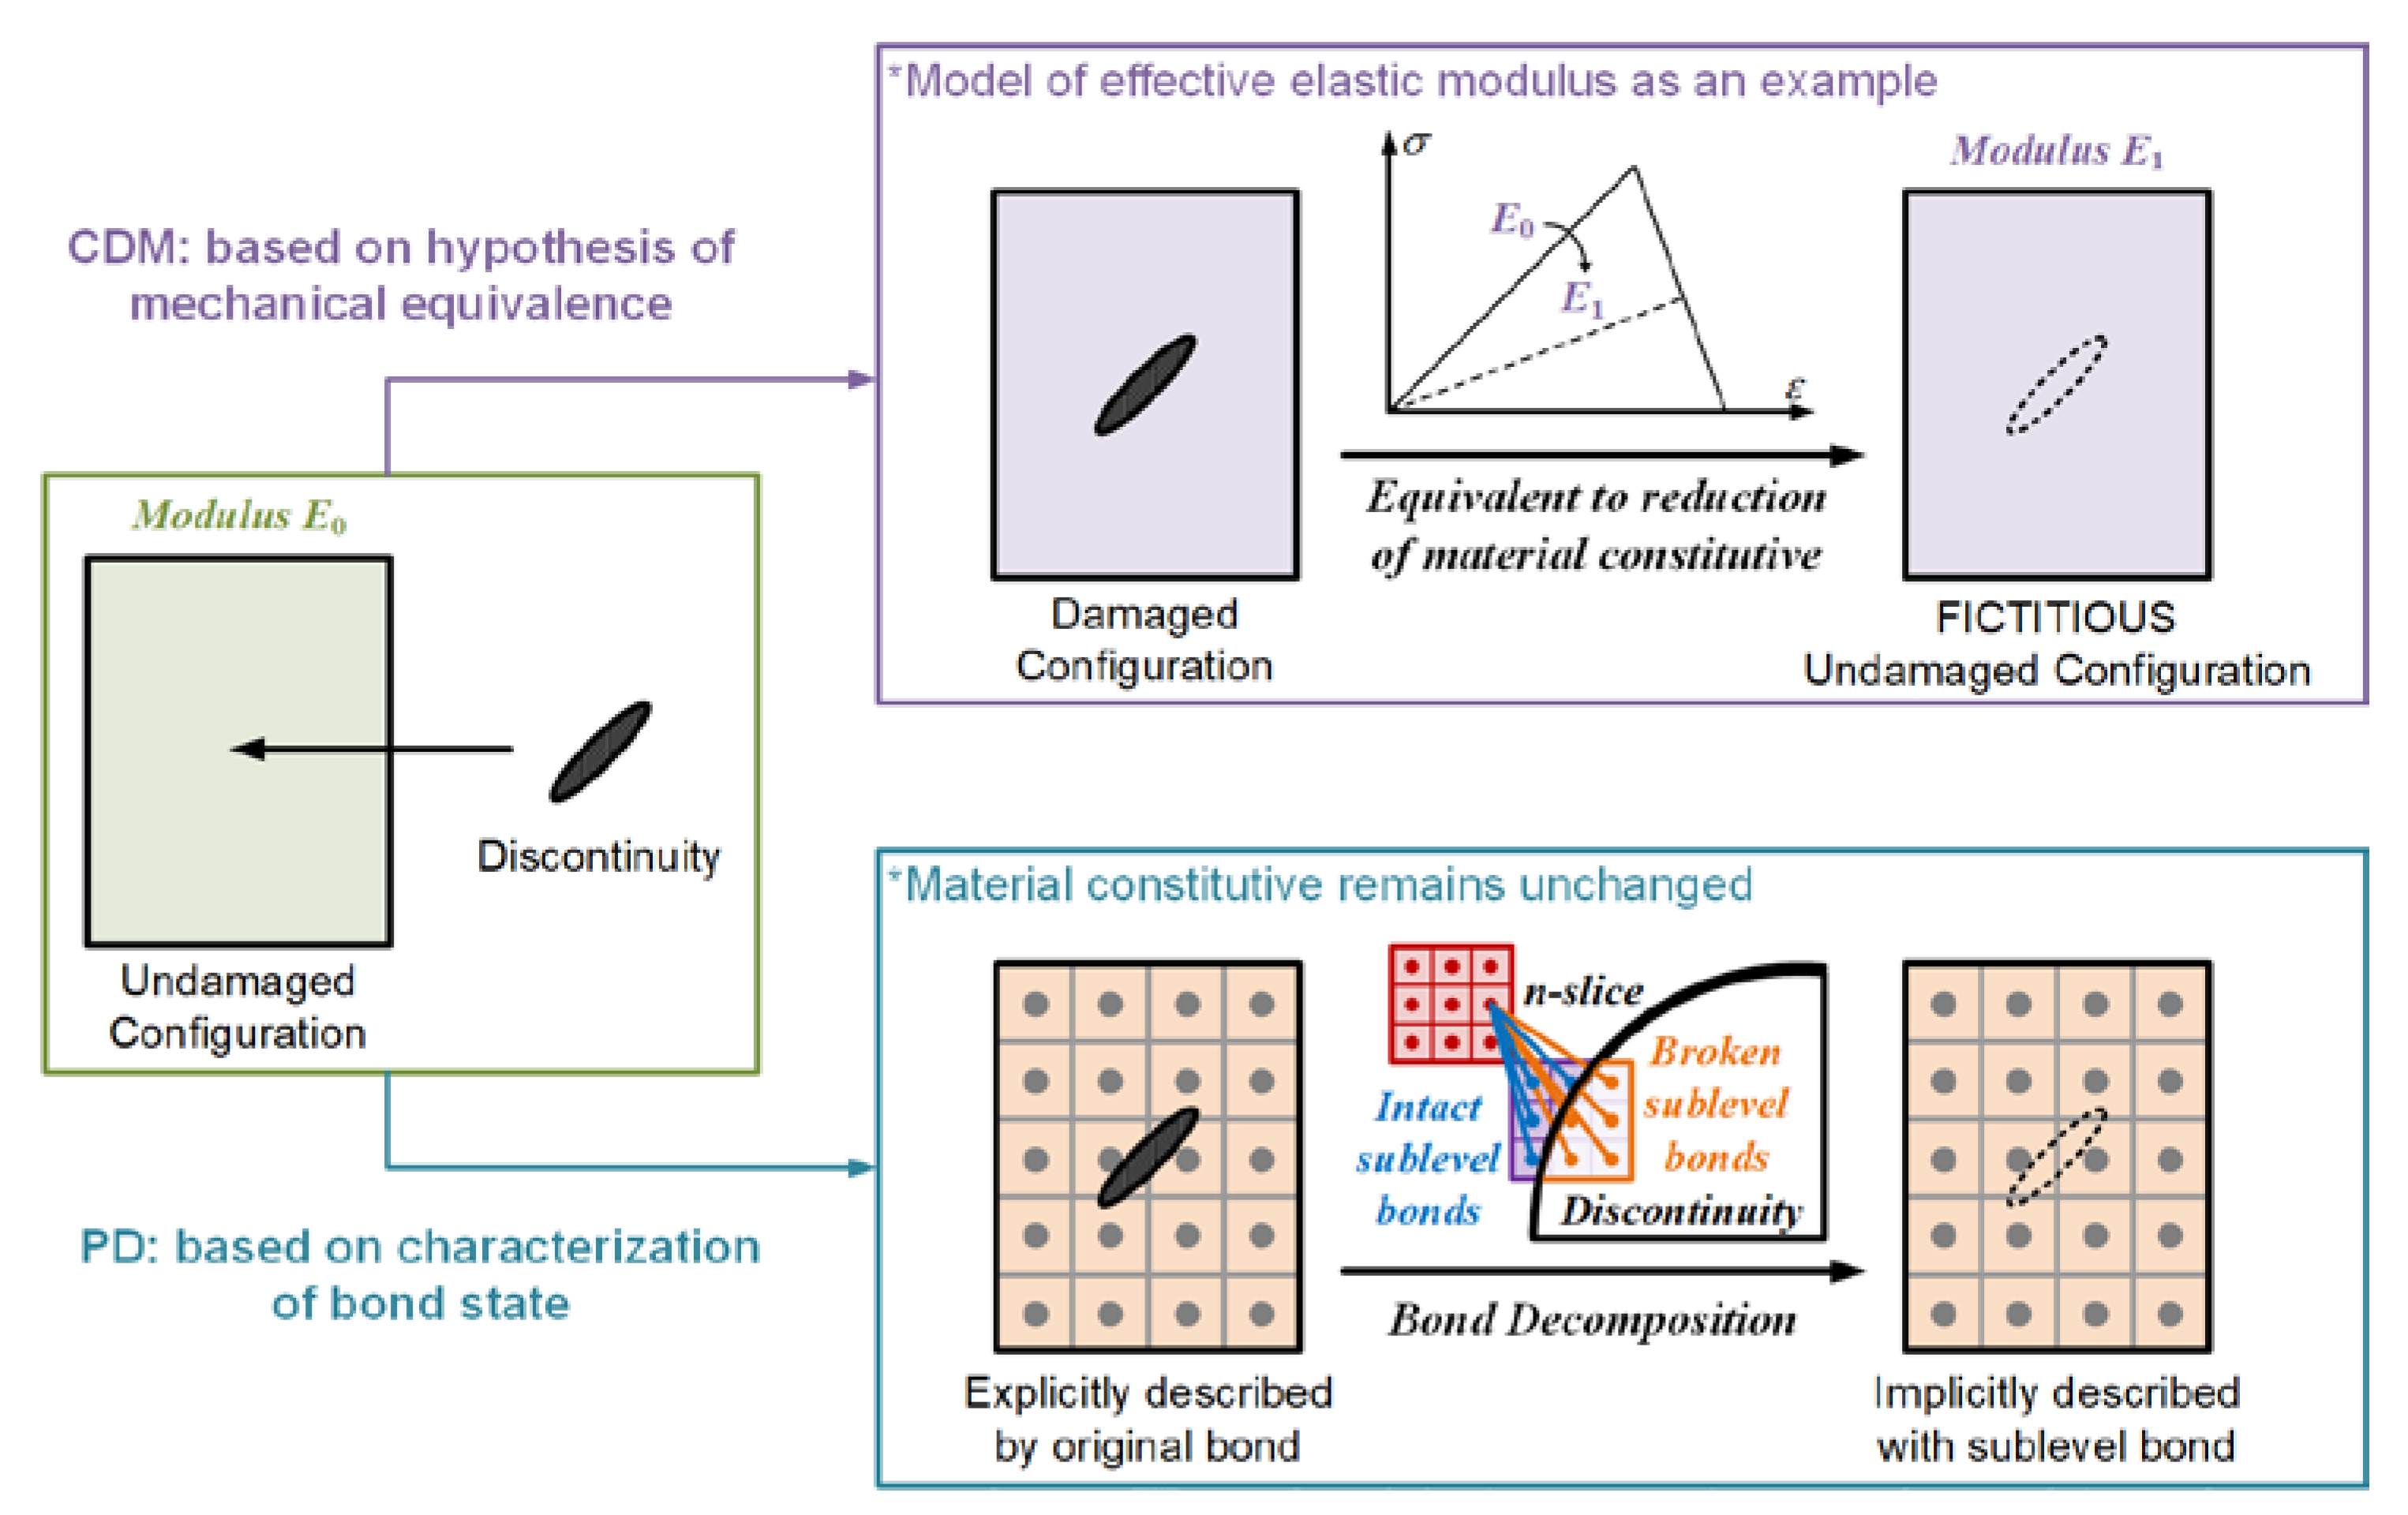
37]. For similarities, both PD and CDM can be seen as an extension of classical continuum mechanics framework to include damage caused by discontinuities, and damage is described by a specific parameter varying from 0 to 1; differences, however, lie in their distinctive underlying logic as well as mechanics basis as illustrated in
Figure 14.
In CDM, discontinuities are not physically modelled but equivalently described according to the hypothesis of mechanical equivalence, commonly by reduction of material constitutive such as equivalent elastic modulus; such equivalence is essentially phenomenological, because reduction of material property is the effect rather than the cause in nature. In PD with BDS, however, the idea is to map discontinuity effects onto corresponding macroscale material responses without material constitutive equivalence; such mapping is established through the notion of bond in PD, and reduction of material property is a natural result caused by sublevel bond breakage, which denotes the loss of interaction between material points.
In a word, the success of BDS is attributed to the nonlocality of peridynamics. As Silling [
38] states, the three most distinctive advantages of peridynamics are (1) avoiding coupling dissimilar mathematical systems, (2) modeling complex fracture patterns, and (3) communicating across length scales; while the former two features have been widely explored and applied in present studies, the last advantage of communicating across length scales did not receive equal attention.
3.4.2. For Comparisons with XFEM
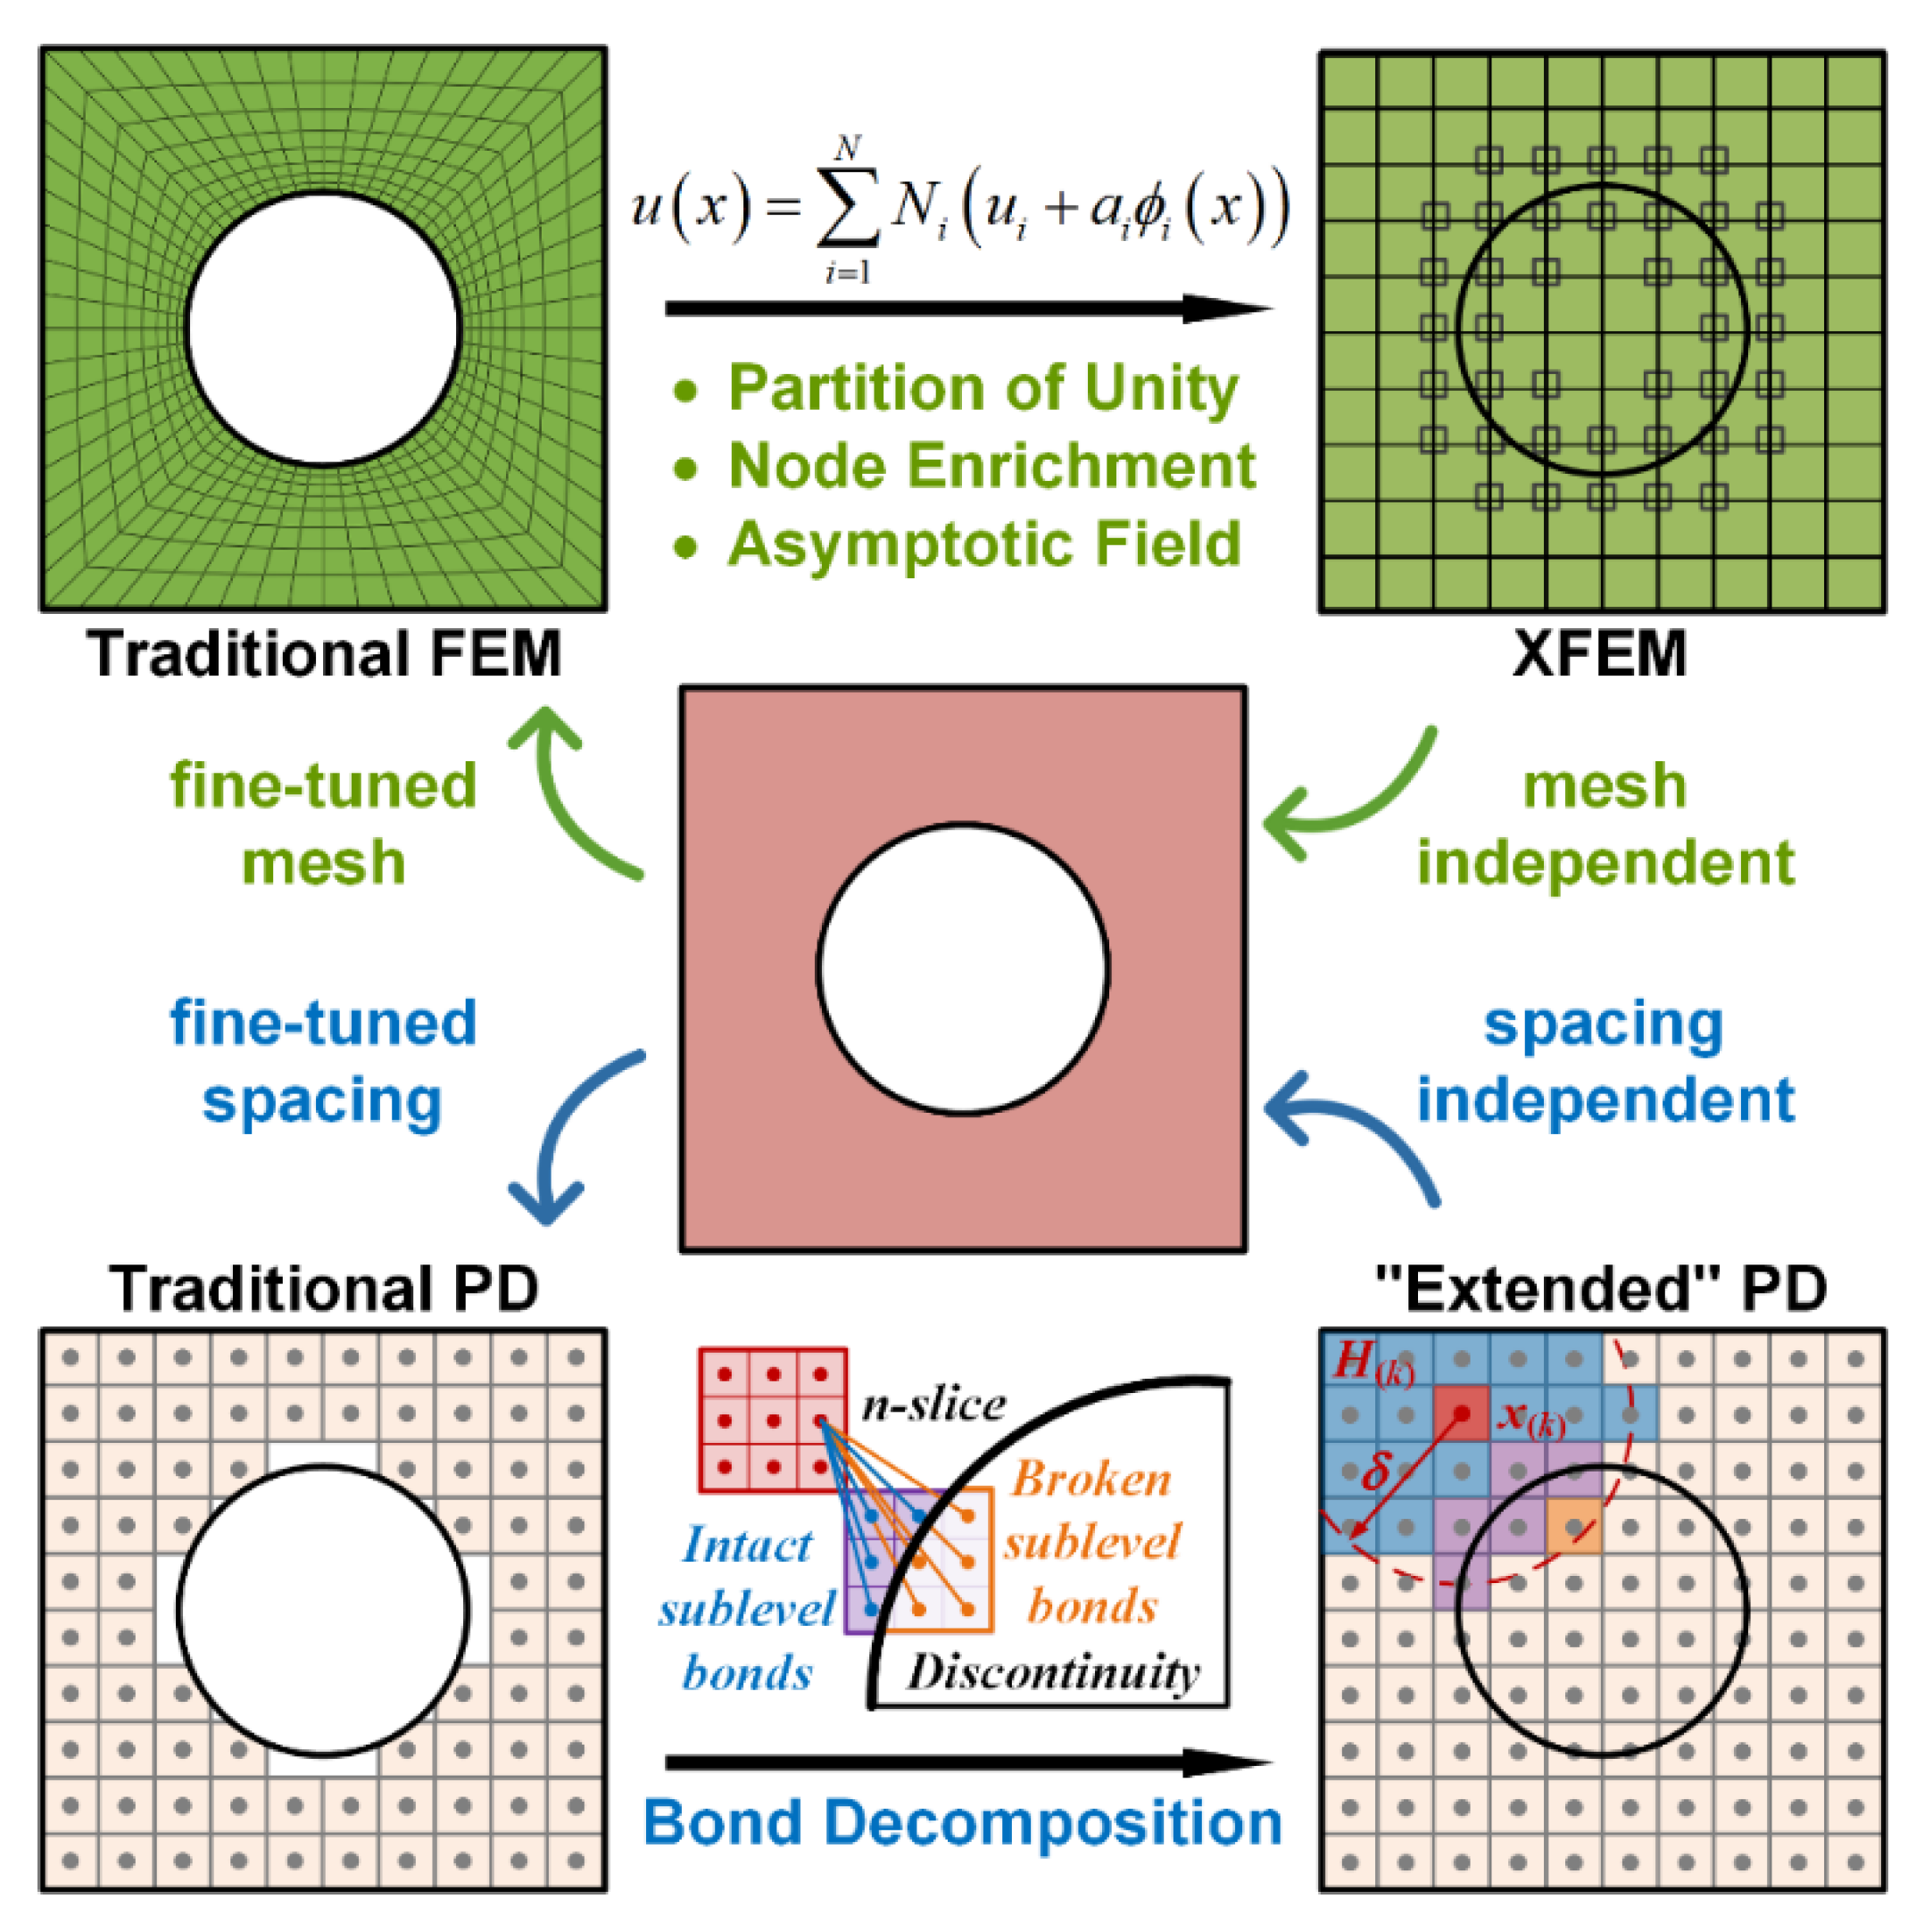
In BDS, descriptions for discontinuity geometries no longer depend on spacing of material points by elaborately quantifying the loss of interactions between material points, which is similar to XFEM who separates mesh from discontinuity geometries by incorporating discontinuity geometry information into the properties of extended element rather than expressed by mesh generation. The success of XFEM reminds us that the soul of FEM is element itself but not its mesh, and it is thus naturally easy to understand that the soul of PD is bond but not the spacing of material points.
Despite the bond decomposition strategy is inspired by XFEM, there are still obvious differences between them, as illustrated in
Figure 15. From the aspect of underlying theories, XFEM runs in continuum mechanics framework enriched with fracture mechanics, while BDS runs in peridynamics where mechanics of continuous and discontinuous media are unified in one set of motion equations. To better characterize cracks in XFEM, for example, crack-tip asymptotic fields should be known and enrichment varying with
is usually adopted to eliminate singularity; as a contrast, BDS does not require a known crack-tip asymptotic fields for enrichment.
3.4.3. For Multiscale Simulations
From the perspective of technique basis, there are three main concerns in multiscale numerical methods for material failure [
39], i.e., theories that apply to each single scale, information transmission among different scales, and corresponding numerical implementation.
For the theory, it has been acknowledged that peridynamics displays unique advantages in dealing with material failure across scales for its mathematical formulation and nonlocality, and BDS acts as an improvement to consider interactions between material points. For information transmission, BDS is a unique multiscale bridging approach in peridynamics, which is similar to homogenization technique in the hierarchical strategy such as RVE-based methods; however, BDS does not rely on periodic boundary conditions (PBCs), which does not stand when a crack touches an element boundary [
40]. For numerical implementation, it is computationally costly to perform multiscale simulation of material failure for mesh should be fine enough to characterize discontinuity geometries, which leads to a “multiscale mesh” even if no “multiscale physics” are involved; however, BDS separates the description of discontinuity geometry from spacing of material points, which makes it an effective approach to map down-scale discontinuity effects onto up-scale structure behaviors.
4. Applications for GP Effects on Fatigue Strength
In this section, BDS is combined with our previously proposed peridynamic fatigue damage-cumulative model [
29] to capture fatigue initiation modes in smooth specimens with a mesoscopic circular gas pore, which is crucial for predicting fatigue strength of additively manufactured metal parts containing gas pores [
41]. On such basis, the effects of GP sizes and locations on fatigue strength are furthermore revealed and discussed, which are also compared with the prevailing models based on Murakami parameters.
4.1. PD Approach to Simulate GP Effects on Fatigue Strength
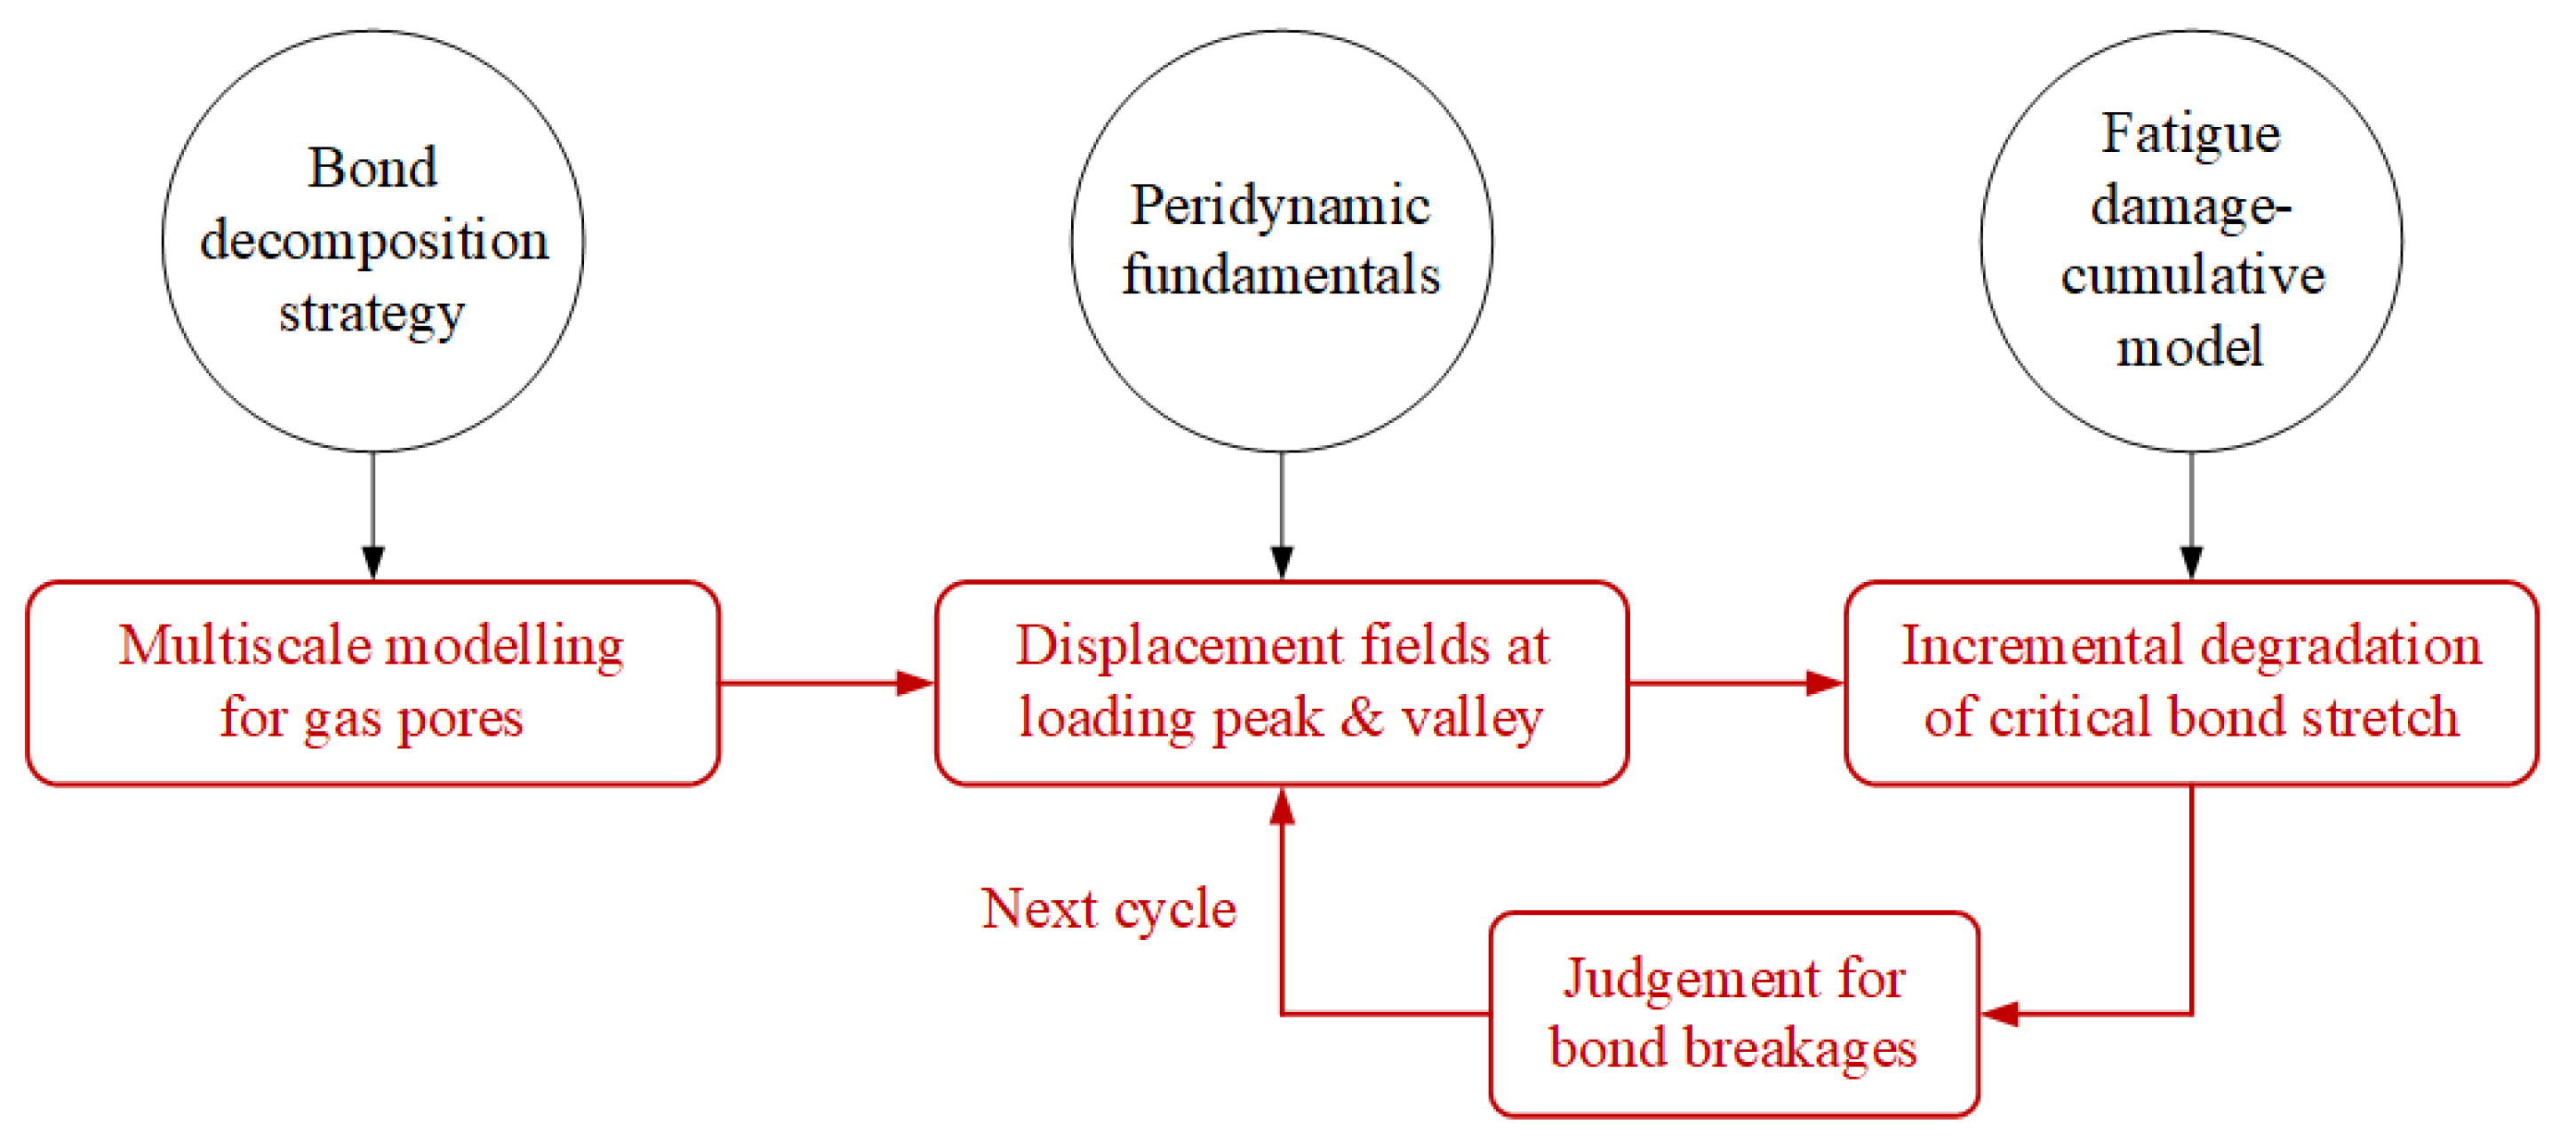
The whole framework of PD approach to simulate the GP effects on fatigue strength consists of three portions as shown in
Figure 16, i.e., PD fundamentals to obtain displacement fields, BDS for multiscale modelling of GP, and damage-cumulative model to calculate fatigue damage in PD bonds.
4.2. Fatigue Crack Initiation Modes
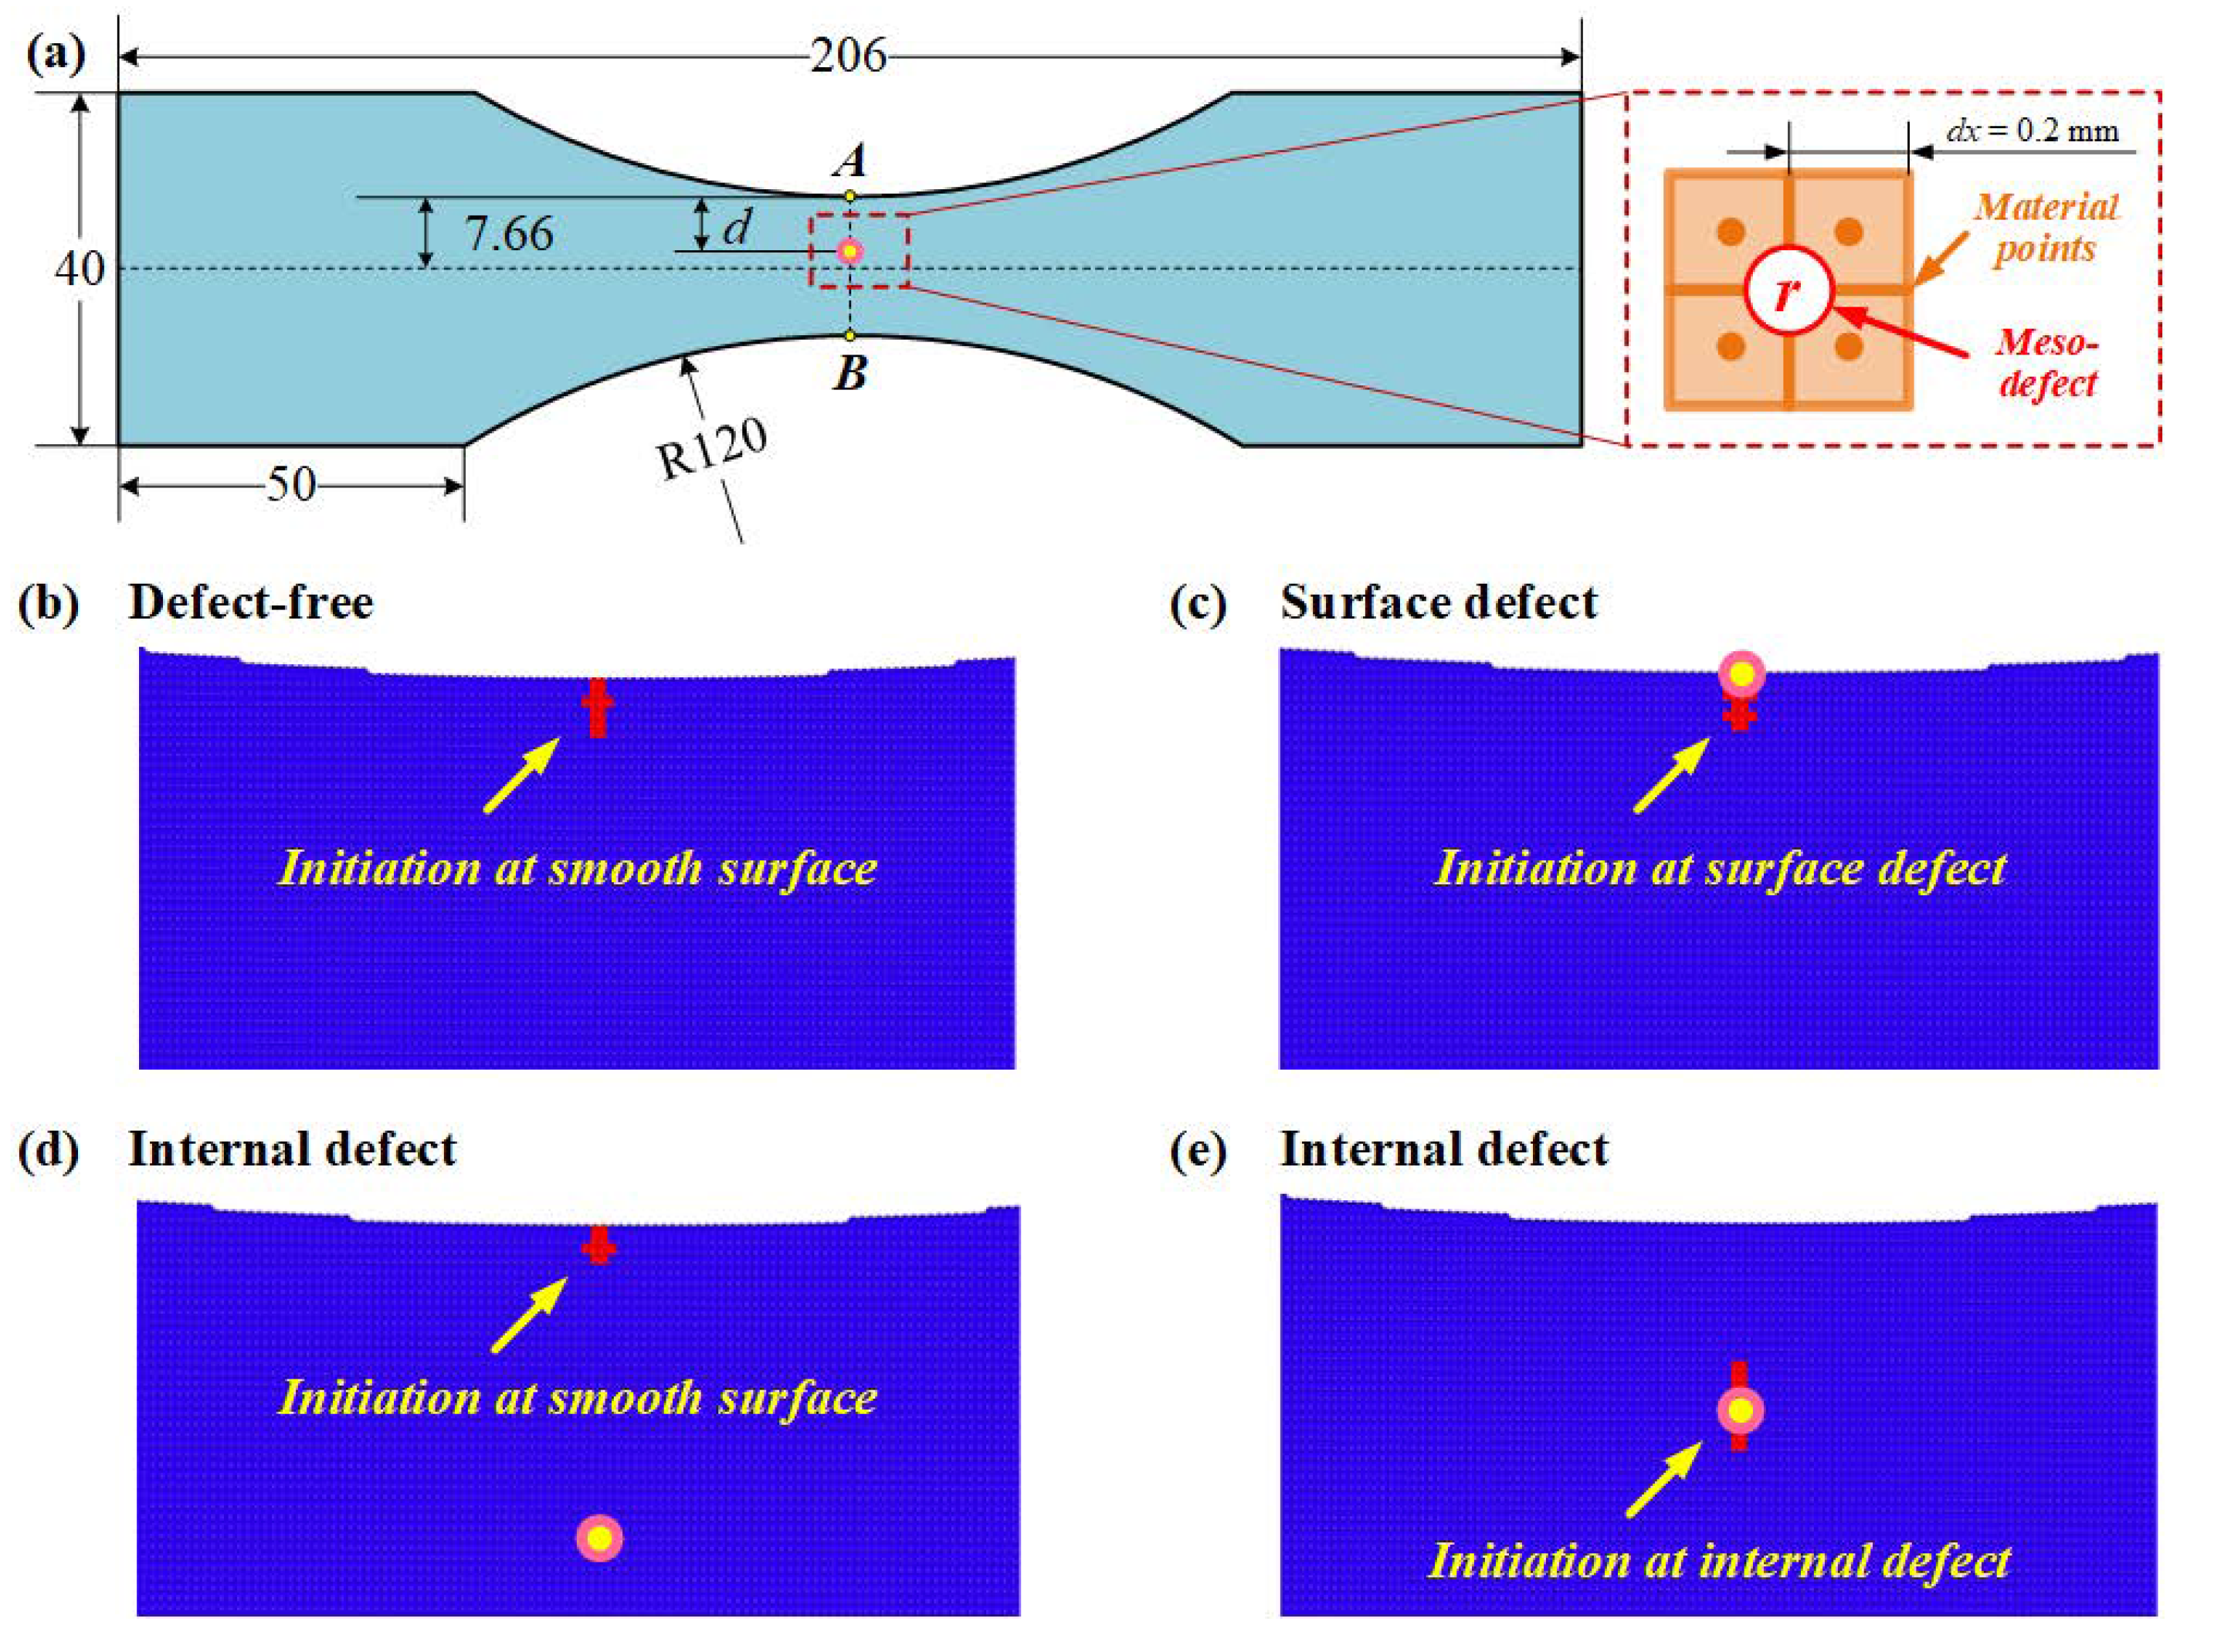
Consider a two-dimensional Ti-6Al-4V smooth specimen subjected to symmetric cyclic loading (
R = −1) with the maximum section stress of
Smax = 400 MPa, as shown in
Figure 17. The dimensions of the specimen are designed according to ASTM E466-15, and the material parameters are listed in
Table 1, which have also been adopted as well as verified in our previous studies [
29]. For the defect-free case, fatigue crack will undoubtedly initiate at “smooth surface”. For the specimen with a semicircular surface defect, fatigue crack will be even easier to initiate at surface defect, if compared with defect-free case. For the specimens with a circular meso-defect, however, fatigue cracks initiate at either “smooth surface” or internal meso-defects. The obtained initiation modes agree well with experiment observations [
42].
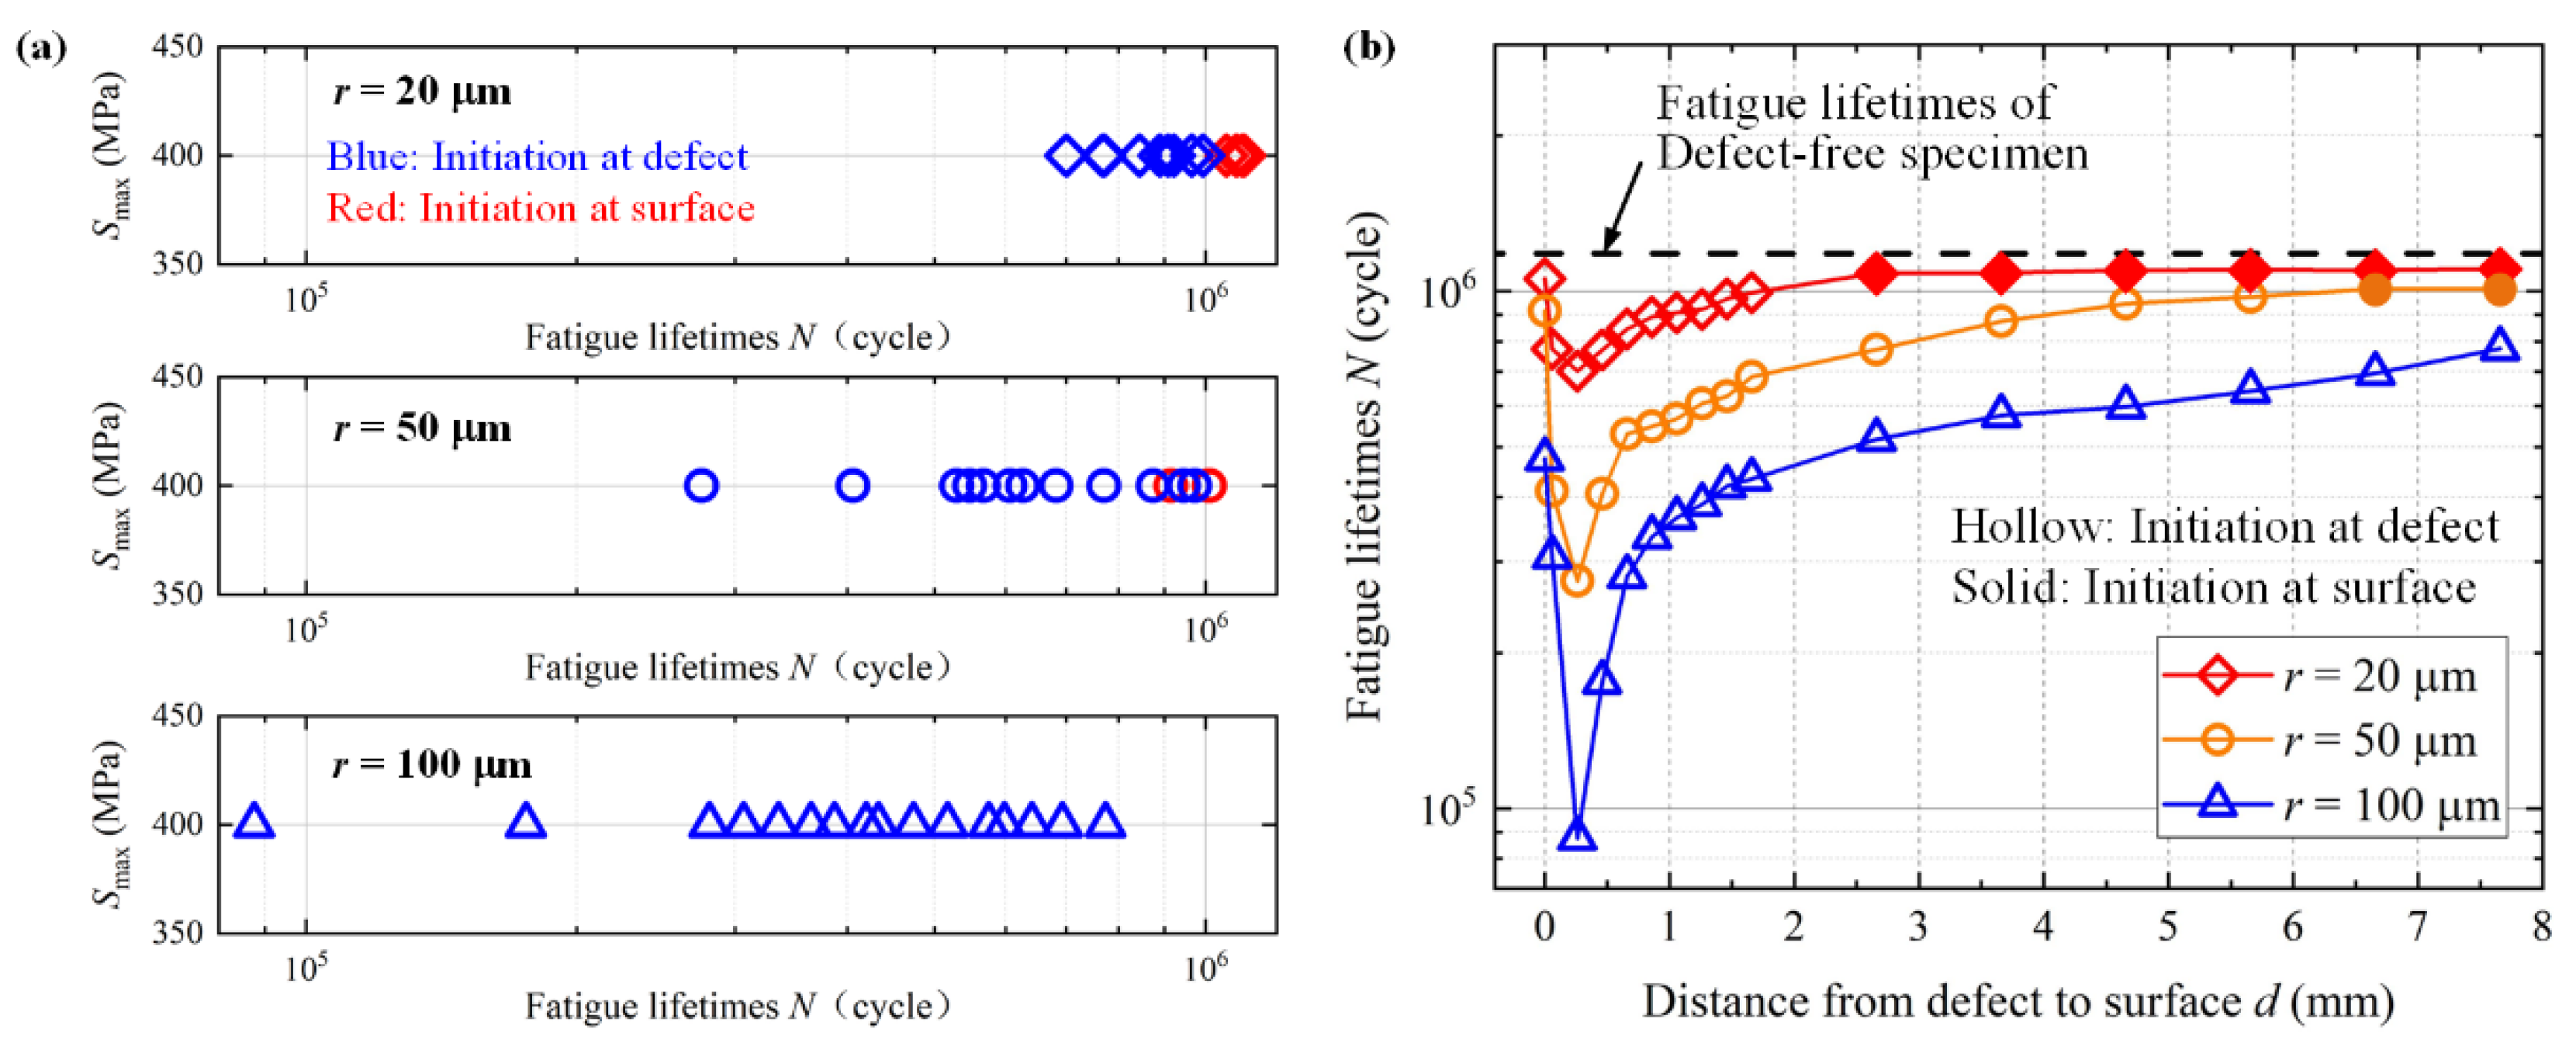
For cases of specimens with internal defect, effects of meso-defect sizes and locations on initiation modes and fatigue lifetimes are furthermore presented in
Figure 18. For meso-defects of
, which is much larger than common practice, fatigue cracks always initiate at internal defects for all locations; for meso-defects of
and
, fatigue cracks initiate at smooth surface if the defect is located closer to inside, while turn to initiate at internal defect if the defect is located close enough to the smooth surface. It can thus be concluded that the fatigue crack initiation modes depend on meso-defect sizes and locations, where fatigue cracks tend to initiate at internal defect if the size is larger and the location is closer to the surface.
It is also clear that the differences in fatigue lifetimes between specimens with a meso-defect and defect-free specimen can be ignored if the fatigue crack initiates at surface, i.e., same initiation mode, which means the existence of meso-defect has little impacts on the whole fatigue failure process; if the fatigue crack initiates at meso-defect which is a different initiation mode from defect-free case, however, the effects of meso-defect on the whole fatigue failure process are obvious, and the corresponding lifetimes will be decreased when compared with the defect-free case.
To summarize, fatigue lifetimes are affected by initiation modes, and essentially decided by meso-defect sizes and locations. For the mode of initiation at meso-defects, fatigue lifetimes are more decreased if the meso-defect is larger, and subsurface is the most dangerous meso-defect location; for the mode of initiation at surface, however, fatigue lifetimes approximate the defect-free case, while meso-defect sizes and locations exert little effects on the fatigue lifetimes. The above conclusions drawn from peridynamic simulations accord well with recent experiment observations [
43,
44,
45].
4.3. Effects on Fatigue Strength
If the effects of GP are incorporated into the material fatigue property, it is obvious that material fatigue limit will be to varying extent decreased for different GP sizes and locations. Therefore, on the basis of above studies on fatigue lifetimes, we furthermore explore such effects by peridynamic method in this section. However, it seems impossible to discuss the exact fatigue limit in a quantitative sense due to its large scatter (especially for AM metals), and we thus focus on the gas-pore effects on the fatigue limit in a qualitative sense in this sense.
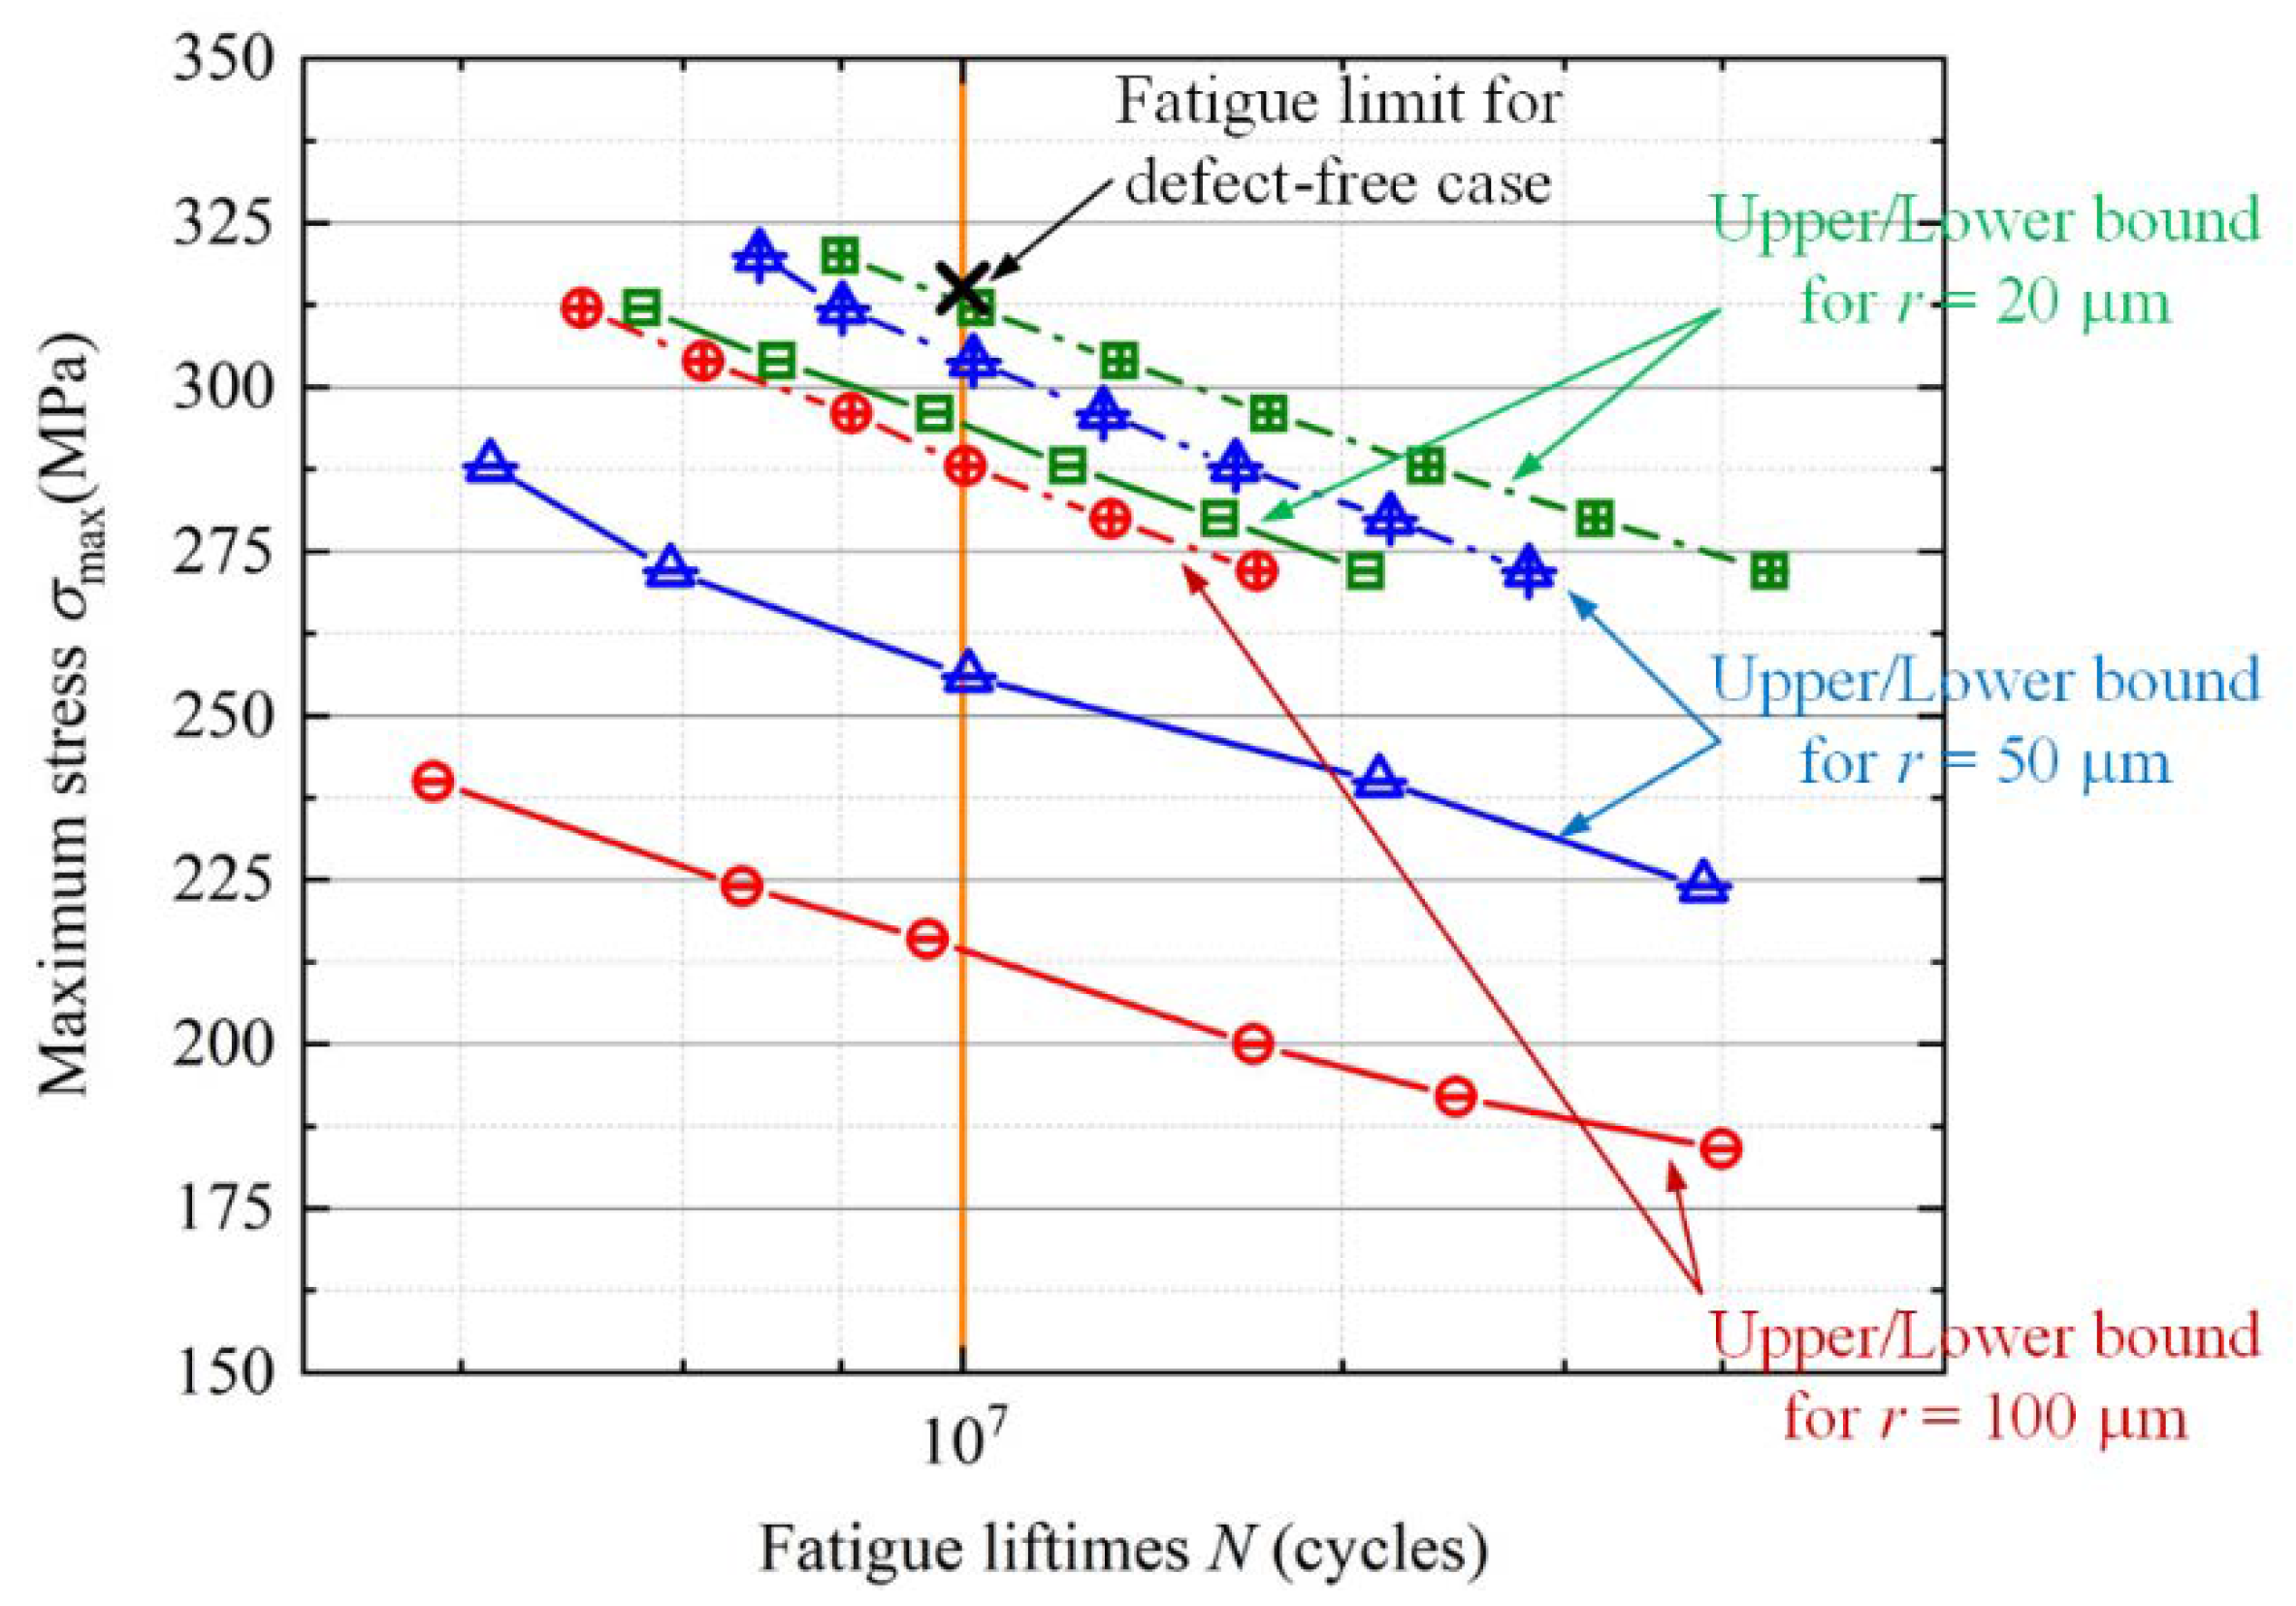
It should be firstly noted that fatigue limit is still a controversial terminology. At the very beginning, it is assumed that no fatigue crack would initiate if the applied stress level is below certain threshold, which means fatigue failure will thus never occur, and such threshold is correspondingly termed as so-called fatigue limit. While fracture mechanics was later developed, it is acknowledged that there always exist micro-voids and micro-cracks in materials, and the connotation of fatigue limit is transformed into the stress threshold of non-propagating cracks. As for practice in fatigue evaluations, however, fatigue limit commonly refers to stress levels for certain specified lifetimes in HCF regime, and fatigue limit in this paper is thus defined as stress levels for fatigue lifetimes of 107 cycles, i.e., fatigue strength.
Since it is already known that the decrease of fatigue lifetimes/strength display a varying range, we here focus on the upper bound/lower bound of fatigue limits; to be specific, for each GP size, fatigue limit for GP located at
is seen as the lower bound, and that for GP located at
is seen as the upper bound. The PD prediction results of fatigue lifetimes near fatigue limit regime are shown in
Figure 19, while the upper/lower bounds for fatigue limits in all cases are listed in
Table 2.
It is clear that fatigue limit is no longer a definite value but a range/distribution, which is specifically decided by GP sizes and locations. When GP size is larger, the data of fatigue limits not only becomes smaller but also shows more severe dispersion, and its lower bound is decided by the effects of subsurface GP. It should be noted that the input of PD simulation is material S-N curves, which does not take the intrinsic dispersion of fatigue lifetime data around fatigue limit regime; therefore, the actual dispersion ought to be the superposition of the intrinsic dispersion due to material fatigue property and the dispersion due to the GP characteristics, which makes it even more difficult to predict the fatigue limit.
For this reason, we do not present quantitative comparisons between our numerical results and experiment data in literature. The experiment data inevitably include the integrated effects of many other factors, especially considering that experiment data are usually insufficient in information about GP locations and sizes as well as different in conditions such as AM processing parameters and heat treatment, while the numerical simulations in this paper consider only GP effects; as a result, no significative conclusions are expected to be obtained by such comparisons. Despite it is considered as a golden rule that all simulations should be verified by experiment data, therefore, we insist that the verification should better be a future work. A qualitative comparison, however, can be obtained, and the results are consistent with experiment studies [
4,
43,
46]: compared with their wrought counterpart, the fatigue limits of AM metals not only are relatively lower but also show larger scatter.
Worse still, fatigue lifetimes are commonly divided by a dispersion coefficient to achieve enough reliability in practice. If such practice is followed for AM metals, such coefficient should be much larger for the same reliability level due to dispersion superposition, which will lead to much shorter usable lifetimes (likely even shorter than an acceptable level). Despite that it is impractical to thoroughly eliminate GP by processing optimization in the near future, it is easy to understand that GP effects should be at least controlled below a certain level, but the key is how to achieve this goal. Contrary to the present intentions to pursue lower porosity and smaller sizes, it is inspired by the above simulation results that additional attention should be focused on the subsurface locations.
4.4. Discussions with the Present Models
Some phenomenological and semi-empirical models were proposed to explicitly consider the effects of inclusions or voids on fatigue performance, and they are also adopted to predict fatigue limits in AM metals. For example, a well-known and widely-used equation for defects was proposed by Murakami and Endo [
12]
in which
is the projection of the area of the defect as discussed in Introduction section,
is the fatigue limit, and
as summarized from experiment data.
After fracture mechanics have been applied into fatigue studies, an equivalent stress intensity factor is proposed to describe the fatigue quality
in which
denotes the net-section stress range, and
is a coefficient to consider the effects of pore location
It is clear that Equation (21) does not take the effects of GP locations into consideration. As a matter of fact, effects of GP sizes are commonly the focus in most of the present models, while effects of GP locations are usually not considered. This idea to focus on effects of GP sizes is straightforward and intuitional, but the PD simulations in this paper show that fatigue strength is also affected by effects of GP locations, and data will display obvious dispersity if GP sizes alone are adopted to fit fatigue strength.
On the other hand, Equation (22) considers the effects of GP locations by coefficient , which is a huge progress and thus Equation (22) is more widely used; on such basis, fatigue strength can either be correlated by , or predicted by fatigue crack growth analysis with equivalent initial crack of . However, it should be noted that coefficient in Equation (22) is actually derived on the basis of stress concentration analysis, and two-value coefficient is of course rough to some extent. As indicated by PD simulations in this paper, correspondingly, the effects of GP locations should be considered from the perspective of short crack propagation; therefore, it seems more reasonable to conduct fatigue crack growth analysis with equivalent initial crack of .
As the PD simulations are in 2D in this paper and the data of GP locations are lacking in the published experimental studies, it is not appropriate here to compare PD results in this paper with other present models as well as experiment data in qualitative sense. As a matter of fact, we believe the research has to go from the shallower to the deeper, to conduct 3D simulations and corresponding experiment verifications is the focus of our future work. However, conclusions can be reasonably drawn here that it is not sufficient to consider only the GP sizes rather than GP locations, and fatigue strength or fatigue lifetimes should better be predicted on the basis of short crack propagation analysis.
5. Conclusions
In this paper, a bond decomposition strategy (BDS) is proposed within peridynamics (PD) for spacing-independent description and multiscale bridging for discontinuities. On such basis, a PD approach to study discontinuity effects on fatigue performances is furthermore established, and the effects of gas-pore (GP) sizes and locations on fatigue strength of smooth specimens are then simulated. In the end, some additional advices for AM processing optimization are proposed. The main conclusions can be listed as following:
1. The proposed BDS elaborately quantifies the interactions carried by a PD bond, and thus achieves more accurate calculations of displacement fields as well as damage patterns; as a result, discontinuity geometries in BDS are implicitly described by peridynamic bond properties rather than explicitly described by refined spacing of material points.
2. A PD approach to simulate effects of mesoscopic defects on fatigue behaviors is established, which relies the combination of the BDS for GP modelling and a previously proposed model for fatigue damage.
3. Two initiation modes, i.e., initiation at specimen surface and initiation at internal meso-defect, are captured in peridynamic simulations, and the final fatigue lifetimes are significantly affected by the initiation mode.
4. The existence of GP leads to not only lower fatigue strength but also dispersity of fatigue strength data, in which dispersity is more severe if the GP size is larger, and the decline of fatigue strength is the most severe if the GP is located at subsurface for the same GP size.
5. The present model is not sufficient to well predict GP effects on fatigue strength because the effects of GP locations are considered too roughly, and a reasonable model should be established from the perspective of short crack propagation.


