Article

Effects of Open-Hole and Reinforcement on the Bearing Performance of the Plain-Woven Fabric Composite I-Section Beams under Shear Load

Department of Astronautics Science and Mechanics, Harbin Institute of Technology, Harbin 150001, China
*
Author to whom correspondence should be addressed.
Aerospace 2022, 9(10), 537; https://doi.org/10.3390/aerospace9100537
Submission received: 21 August 2022 / Revised: 16 September 2022 / Accepted: 19 September 2022 / Published: 22 September 2022

Abstract

:
In this article, experiments and finite-element (FE) analyses have been conducted in order to study the effects of open-hole and reinforcement on the buckling and failure of the plain-woven fabric (PWF) composite I-section beams under shear load. With the shear experiments, the buckling and failure characteristics of the PWF composite beams have been obtained, and experimental results of the beams in perfect conditions are compared with the results from the specimens with open-hole and reinforcement in the web region. FE analyses for the composite beams are then carried out with the assistance of the multi-scale method proposed for the PWF composites. With the comparison between the experimental and numerical results, the composite beams’ FE models and the utilized calculation methods are proved to be feasible. According to the parametric study based on the validated models and the multi-scale methods, it is found that the existence of the open-hole decreases the flexural rigidity of the beams’ web region and introduces the stress concentration, which further reduces the structural stability and the shear carrying capacity of the composite beams. With the effects of restraining the structural off-plane deformation and relieving the hole-edge stress concentration, the intercalation reinforcement could effectively improve the bearing performance of the PWF composite beams with open-holes.

1. Introduction

Composite materials have been increasingly applied in the aerospace industry due to their high specific properties and the advantages in design flexibility. As the important component of the aerospace force-taking structures, composite I-section beams have been extensively adopted in practical engineering structures such as the wing boxes of the aircraft with the aim to increase bearing efficiency and reduce weight. Under the shear load, composite beams still maintain strong carrying capacity after the initiation of the local buckling. Postponing the buckling initiation, enhancing the failure load and confirming the failure mode are important concerns in the engineering design of the composite beams.
Research has been widely conducted in investigating the buckling instability and post-buckling carrying capacity of the composite beams. Song et al. [1] proposed the analytical solutions for the static response of composite I-section beams under shear load. Within the framework of the composite thin-walled beam theory, the analysis was conducted considering the effects of warping inhibition. Through analytical and semi-analytical methods [2,3], the lateral buckling of composite I-section beams subjected to various types of loadings have been investigated, and applicable analytical models have been developed. Asadi et al. [4] proposed an efficient modeling technique based on a 1D beam in modeling the buckling behavior of composite I-section beams. The technique was validated and in addition, applied in investigating the buckling response of composite I-section beams under combined loads.
For realistic composite beams used in practical engineering, research has also been conducted by Guo et al. [5], and the performance of composite beams with cutouts and various edge reinforcements was reported. In their further study [6], the effects of reinforcement on the composite beams’ buckling and failure response was investigated. The experimental results indicated that the appropriately settled flange reinforcement could significantly improve the structural critical failure load. In the above research, cutouts and reinforcements are commonly observed in the studied composite beams. In order to satisfy the functional requirements and reduce weight, open-holes and cutouts are unavoidably settled on the composite beams. Understanding the open-hole effects and choosing the suitable reinforcement are important concerns in the design of composite beams.
Orun et al. [7] studied the effects of hole reinforcement on the buckling of thin-walled beams used in aircrafts under combined loads. An efficient design methodology based on interaction curves was proposed for the aeronautical engineers in investigating the composite beams’ buckling characteristics with smaller calculation cost. The shapes and positions of cutouts also have considerable effects on the composite beams’ buckling and failure behaviors. Erklig et al. [8] investigated the lateral buckling behaviors of laminated composite beams. The results proved the elliptical shape to be the best open-hole shape for the studied structure. The effects of the open-hole diameter on the lateral buckling behavior of composite cantilever beams were studied by Eryigit et al. [9]. Experimental results indicated that for shorter beams, the effects of the size and location of the cutouts were more remarkable. Pasinli [10] investigated the buckling behaviors of composite beams with double holes. The results indicated that the circular cutouts had advantages over the square cutouts in improving the composite beams’ lateral buckling carrying capacity.
Stress concentration caused by the open-hole is another concern in the design of composite beams. In the research conducted by Rezaeepazhand et al. [11], the emphasis was placed on the stress concentration around the open-holes of the composite beam webs subjected to uniaxial tension load. The obtained results validated the accuracy of the utilized analytical method in determining the stress concentration around the open-hole region. With the increase in the number of open-holes, the stress concentration level tends to increase [12]. In cases whereby multiple cutouts are unavoidable, the sizes and locations of open-holes which considerably affect the stress concentration need to be carefully designed. The effects of the reinforcements in reducing the composite beams’ stress concentration should not be neglected. In the study by Guo [13], effects of different reinforcements on composite panels under shear load were investigated through experiments and validated FE models.
Plain-woven fabric (PWF) composites have attracted a growing interest in the aerospace industry due to their excellent mechanical performance. With the moderate production cost and the simpler machining process, PWF composites have been increasingly used in the manufacturing of light-weight structures. Considering the good engineering application prospects, research has been carried out in order to investigate the PWF composites’ intricate loading responses. Various advanced techniques have been utilized in the related studies, and important progress has been made in the understanding of the PWF composites’ failure mechanisms with the assistance of the analytical and experimental methods [14,15,16,17,18].
Failure criteria and theories based on the micro-mechanics [19,20,21] have been developed and are becoming increasingly appealing in the study of the composites’ failure behaviors. Combined with the micro-scale failure criteria, the multi-scale FE method is attracting a growing interest of the PWF composites’ researchers. Xu et al. [22] calculated the constituent stresses of the PWF composites on the basis of the micro-mechanics. The correlations between the meso-scale stresses and the micro-scale stresses were established. In their further study [23], the strength of the PWF composite laminates was predicted. With the multi-scale approach, the variation of the PWF composite laminates’ ultimate tensile strength with the braiding angle of the fiber tows were parametrically studied. Wang et al. [24] proposed a modified multi-scale model in simulating the PWF composites’ progressive failure. The fiber random distribution was considered in the multi-scale damage analysis, and the effects of the fiber arrangement on the damage propagation were revealed. Zhao et al. [25] proposed innovative methods to promote the practical engineering application of the multi-scale FE method. The multi-scale progressive failure analysis was considerably simplified, and the collapse of the PWF composite landing gear was investigated in detail.
The advantages in explaining the PWF composites’ failure mechanism in detail at the constituent level indicate the huge potential of the multi-scale FE methods’ engineering applications. More reliable multi-scale approaches are urgently needed to satisfy the analysis demand for the practical PWF composite structures, such as the widely used composite I-section beams.
Experiments and multi-scale FE analyses have been conducted in investigating the shear buckling and failure of the PWF composite I-section beams used in the aircrafts’ vertical tailfin with the following goals aimed to be achieved in this article. The first is to have a deep understanding on the bearing performance of the PWF composite I-section beams and provide reference for the beams’ engineering structural lectotype. The second is to develop a reliable multi-scale method suitable for the PWF composite structures’ failure analysis and practice the method’s engineering application.
In the following Section 2, the studied two types of PWF composite I-section beams are introduced, together with the corresponding shear experiments. Based on the experimental results, the buckling and failure characteristics of the specimens are analyzed and compared.
In the Section 3, the micro-mechanics failure (MMF) based multi-scale method suitable for the analysis of the PWF composites is proposed. In the aspects of the stress transformation, the damage determination and the degradation of the composite’s mechanical properties after damage, the multi-scale method is introduced in detail.
Finally, in the Section 4, FE analyses are conducted on the composite beams, and different calculation strategies have been assigned to the PWF composite beams according to the buckling characteristics. Based on the FE models, parametric analysis and comparative analysis have been further conducted.
According to the comparison between the experimental and numerical results, the feasibility of the proposed multi-scale method has been validated, and the bearing performance of the studied PWF composite beams have been compared and analyzed. The effects of open-hole and reinforcement on the shear responses of the PWF composite beams have been evaluated, and the detailed mechanisms of the effects have been achieved.

2. Shear Experiments on the PWF Composite I-Section Beams

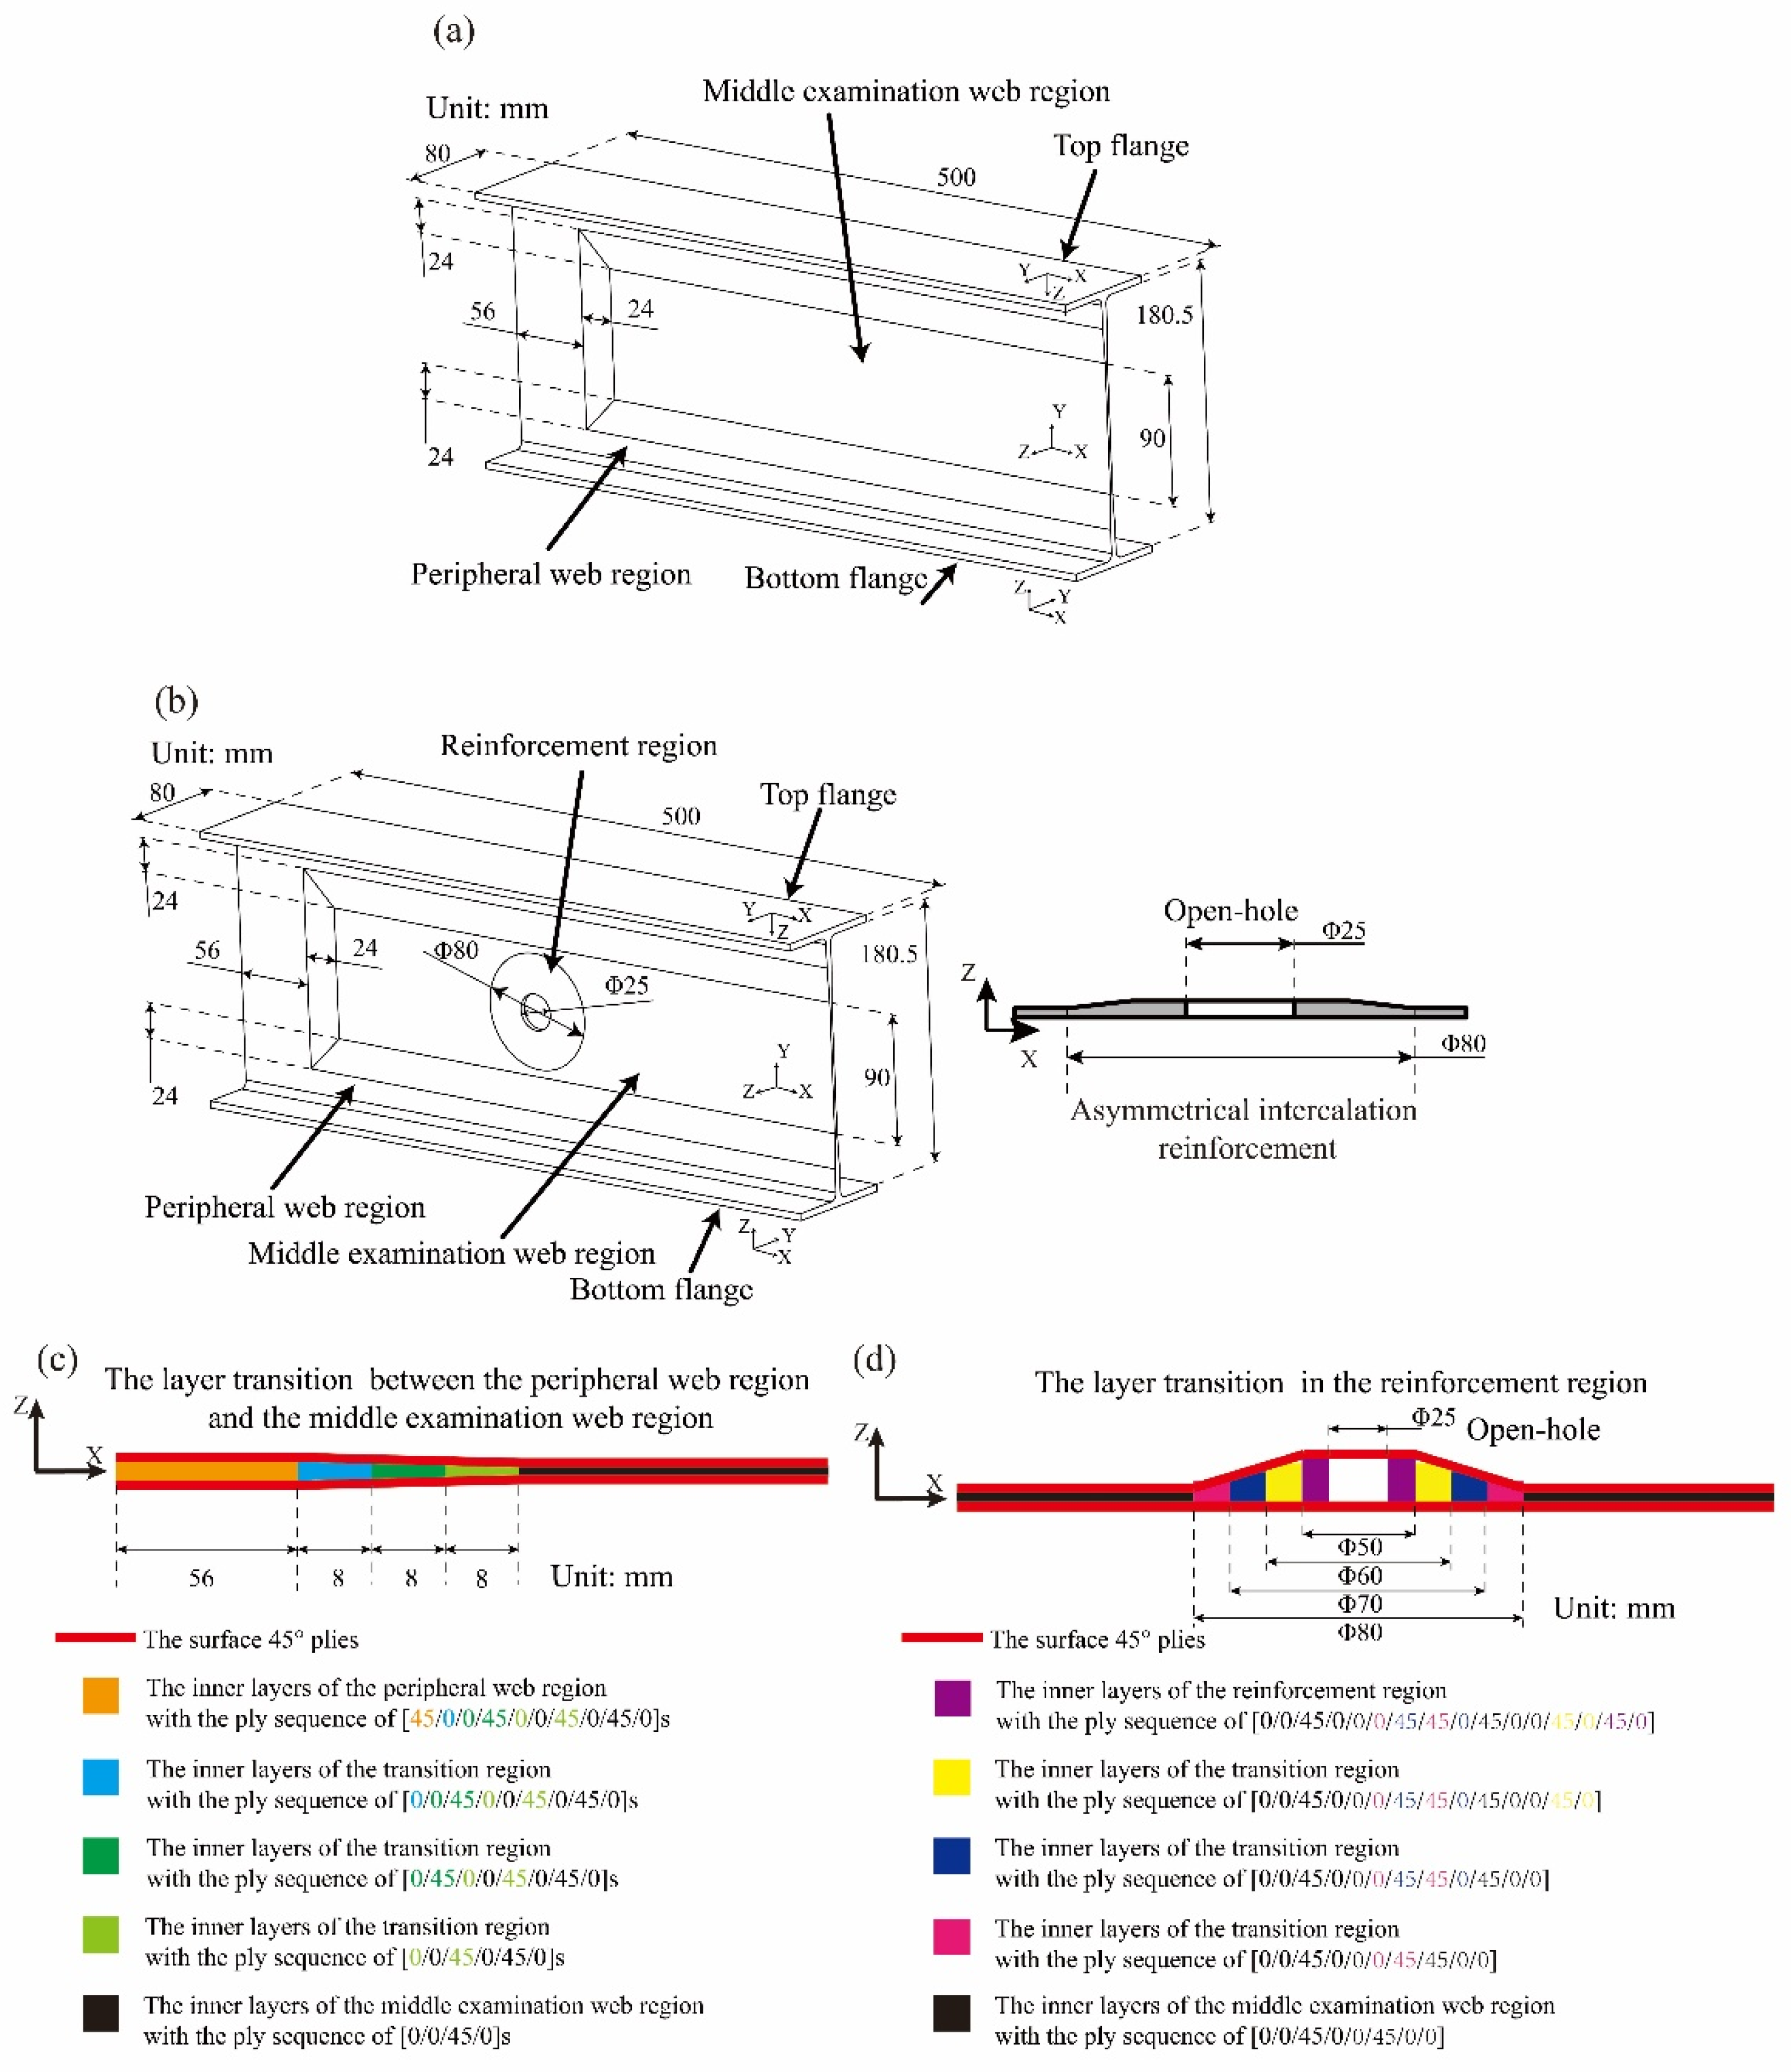
2.1. Specimens and Shear Loading

The specimens tested in the shear experiments are PWF composite I-section beams made of T300/Epoxy prepreg with the ply thickness of 0.216 mm. The experimentally achieved macro-scale mechanical properties of the PWF composite are listed in Table 1. Considering the difference in the web region, the composite beams are classified into two types of BW-I and BW-II, with the configurations and dimensions illustrated in Figure 1. In Figure 1a, the three tested beams with the web region in perfect condition are numbered as BW-I-01~BW-I-03. In Figure 1b, the three tested beams with open-hole and asymmetrical intercalation reinforcement in the center of the web region are numbered as BW-II-01~BW-II-03. According to the engineering design experience, the composite layer arrangement of the composite beams is determined on the basis of the basic design specifications and the results of the engineering iteration calculations. The ply sequences associated with the local coordinate systems for the different regions of the BW-I and BW-II composite beams are listed in Table 2 and Table 3, respectively. The layer transition between the peripheral web region and the middle examination web region is illustrated in Figure 1c, and the layer transition in the reinforcement region of the BW-II specimens is illustrated in Figure 1d.
Shear experiments are conducted to investigate the buckling and failure behaviors of the PWF composite beams. The above six specimens classified into two types are tested in the experiments. As shown in Figure 2, the specimen of the PWF composite beam is clamped at the left end with the metal fixture components and the interconnecting components. A vertical concentrated shear force is loaded at the free end through an electro-hydraulic servo actuator with the maximum displacement range of 300 mm and the maximum loading range of 200 kN. The shear load is applied under the displacement control of 1 mm/min to satisfy the static test condition. The applied force is measured with the built-in force sensor, and the corresponding loading displacement is measured with the built-in displacement sensor. The precision of force application control is ±1% and the force measurement error is ±0.5%. The displacement measurement resolution is 1/100,000 and the displacement measurement error is ±0.5%. The measured force and displacement are automatically recorded with a VC++ based system at the frequency of 10 Hz in generating the load-displacement curves for each of the specimens. As the failure of the middle test region is mainly studied, the bottom and top flanges are stiffened with metal plates with a thickness of 5 mm to prevent the undesired buckling and failure of the flanges. All the metal components of the fixture presented in Figure 2 are manufactured with the alloy steel of 30CrMnSi with the elastic modulus of 196.0 GPa and the Poisson’s ratio of 0.3, and the detailed dimensions of the steel components are presented. The metal components are fastened with the PWF composite beam through the bolt connections. Strain gauges with the resistance value of 120 Ω and the measurement limit of −20,000 μ ε ~ 20,000 μ ε are utilized in the shear experiments, as shown in Figure 2. The experimental strain results are acquired with the static strain measuring instrument. As illustrated in Figure 3, the strain gauges are placed back-to-back on the positions of interest of the middle examination region in monitoring and analyzing the loading responses of the composite beams.

2.2. Experimental Results and Analysis

2.2.1. Experimental Results of the BW-I Composite Beams

The experimental load-displacement curves of the BW-I-01~BW-I-03 PWF composite beams under shear load are compared in Figure 4, and the experimental failure load of the specimens together with the corresponding average value are listed in Table 4. With the correspondence of the load-displacement curves and the deviation of the experimental failure loads from −3.45% to 6.58% compared to the average value, the experimental results of the BW-I specimens present good repeatability. In order to simplify the following analysis, the experimental results of BW-I-01 specimen are chosen as the representative experimental results of the BW-I specimens in the subsequent discussions.
The strain-load curves of the different measurement points in the web region of the BW-I-01 specimen corresponding to Figure 3a are shown in Figure 5. At the initial loading stage, the shear load increases linearly with the displacement, and the strain results of the measurement points remain within a limited extent. After the critical buckling load is reached, obvious bifurcation could be detected from the strain-load curves, and the decrease in the structural shear stiffness is reflected from the lower slope of the load-displacement curve.
For the BW-I-01 specimen, the characteristics of the buckling deformation in the web region reflected by the results of the strain-load curves are illustrated in Figure 6. The stretched and compressed strain states on the front and back faces of the web are induced by the off-plane buckling deformation. For Point B and the nearby region in the center position of the beam web, the stretched strain state of I2L and the compressed strain state of I2R indicate that the off-plane deformation points to the Z direction, as illustrated in Figure 6a. Similarly, for the Point A & Point C and the corresponding nearby regions, the off-plane deformation points to the -Z direction. The above deformation characteristics indicate the three equally distributed buckling waves on the web corresponding to the shear buckling of the BW-I composite beams.
The concentrated shear load corresponding to the bifurcation of the strain-load curves should be taken as the critical buckling load of the BW-I composite beams. Theoretically, considering the symmetry characteristics of the BW-I specimens in the aspects of the ply sequences and the geometric configuration, the strain states on the front and back faces of the same location within the web should remain consistent before the initiation of the shear buckling. In the practical shear experiments, the theoretical consistence of the strain states in the linear loading stage could not be perfectly satisfied considering the influence of the assembly errors and the sensibility of the resistance strain gages. The above undesired influence leads to the vague impressions of the strain-load curves’ bifurcations as presented in Figure 6, and the bifurcation points of the curves corresponding to the shear buckling initiation could not be quantitatively determined. To solve this problem, the further mathematical analyses are conducted on the experimental strain-load curves.
Defined as the second derivative of strain to load, K represents the change in the strain-load curve’s slope with the increase in the shear load. Corresponding to the extreme points of the K-load curves, the shear buckling initiates with appearance of the most dramatic change in structural stiffness. For the BW-I-01 specimen, the K-load curves are achieved from the strain-load curves of Figure 5, as shown in Figure 7. The extreme points are reached under the shear load of 36.9 kN, which is taken as the experimental critical shear buckling load. With the above method, the achieved experimental results of the critical shear buckling load for the BW-I composite beams are listed in Table 4.
The rapid rise of the measured strain results in the post-buckling stage of the curves in Figure 5 indicates the continuous increase in the off-plane deformation in the web region of the BW-I-01 specimen. As the failure load is reached, the composite beam collapses with the loss of the carrying capacity. The failed state of the BW-I-01 specimen is presented in Figure 8, with obvious fractures intersect at the center of the web region. In the surface ply of the composite beam, the causes of the fractures could be found as fiber tensile failures and fiber compressive failures, respectively, in different directions, and the matrix failures appear to accompany the fiber failures.

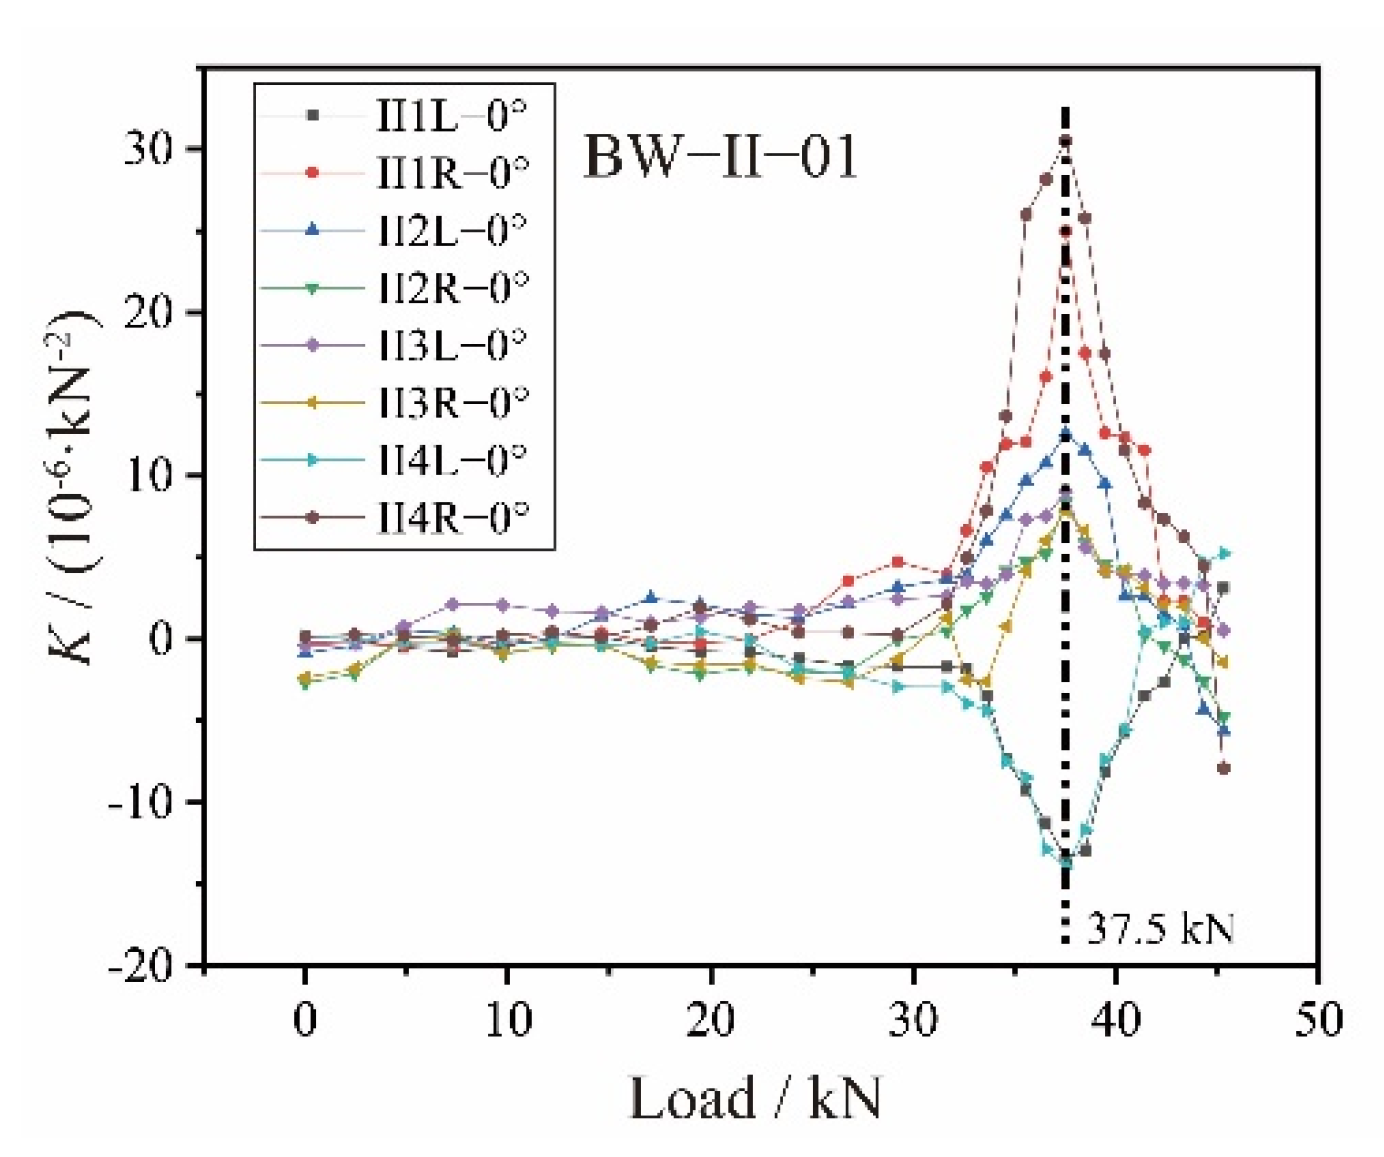
2.2.2. Experimental Results of the BW-II Composite Beams

For the three specimens of BW-II, the load-displacement curves are compared in Figure 9, and the results of the experimental failure load together with the corresponding average value are listed in Table 5. Considering the good repeatability, the experimental results of the BW-II-01 specimen are chosen as the representative experimental results in the following discussions.
The strain-load results corresponding to the measurement points of Figure 3b are presented in Figure 10. For the measurement points around the open-hole on the front and back faces of the same location within the web region, the strain-load curves bifurcate with the initiation of the shear loading under the influence of the asymmetrical intercalation reinforcement. The bifurcation of the curves indicates the off-plane deformation of the composite beam web corresponding to the application of the shear load, and the characteristics of the off-plane deformation could be reflected by the strain-load results. According to Figure 11, three buckling waves could be detected on the web region: two buckling waves deform along the -Z direction of the web exist in the nearby region of Point D and Point G, and the centered buckling wave exists in the nearby region of the open-hole with the off-plane deformation pointing to the Z direction.
With the difficulties in distinguishing the critical buckling load of the BW-II-01 specimen directly from the curves in Figure 10, a similar analytical method is applied to the strain-load results, and the K-load curves are achieved in Figure 12. The obvious critical shear buckling load of 37.5 kN for the BW-II-01 specimen could be detected, on which the structural stiffness suffers the most dramatic change. In Table 5, the critical buckling loads achieved from the K-load curves for the other BW-II specimens are listed.
In Figure 13, the failure state of the BW-II-01 specimen is presented. Similar to the BW-I-01 specimen, the fractures corresponding to the final collapse of the BW-II-01 composite beam are caused by the fiber tensile failures and fiber compressive failures respectively. Accompanied by the matrix failures, the fractures intersect at the centered open-hole of the web region.
Different buckling features of the BW-I and BW-II composite beams are detected in the above experiments. The comparison between the failure loads and buckling loads listed in Table 4 and Table 5 indicates that the BW-II specimens’ average failure load reaches 92.8% of the BW-I specimens, and the BW-II specimens’ average critical buckling load reaches 99.7% of the BW-I specimens. With the satisfactory reinforcement, the shear stability and the carrying capacity of the open-hole composite beams almost catch up to the properties of the undamaged specimens. To further investigate the effects of open-hole and reinforcement on the shear buckling and failure of the above PWF composite beams, numerical analyses based on the FE method have been conducted.

3. FE Models and Method for the FE Analysis

In this section, the basis of the FE analyses for the PWF composite beams in the above shear experiments is introduced. FE models of different analyzing scales for the composite beams and the utilized PWF composite in the above experiments are first established. After that, the multi-scale method for the failure analysis of the PWF composite beams is proposed to accompany the corresponding FE calculation process.

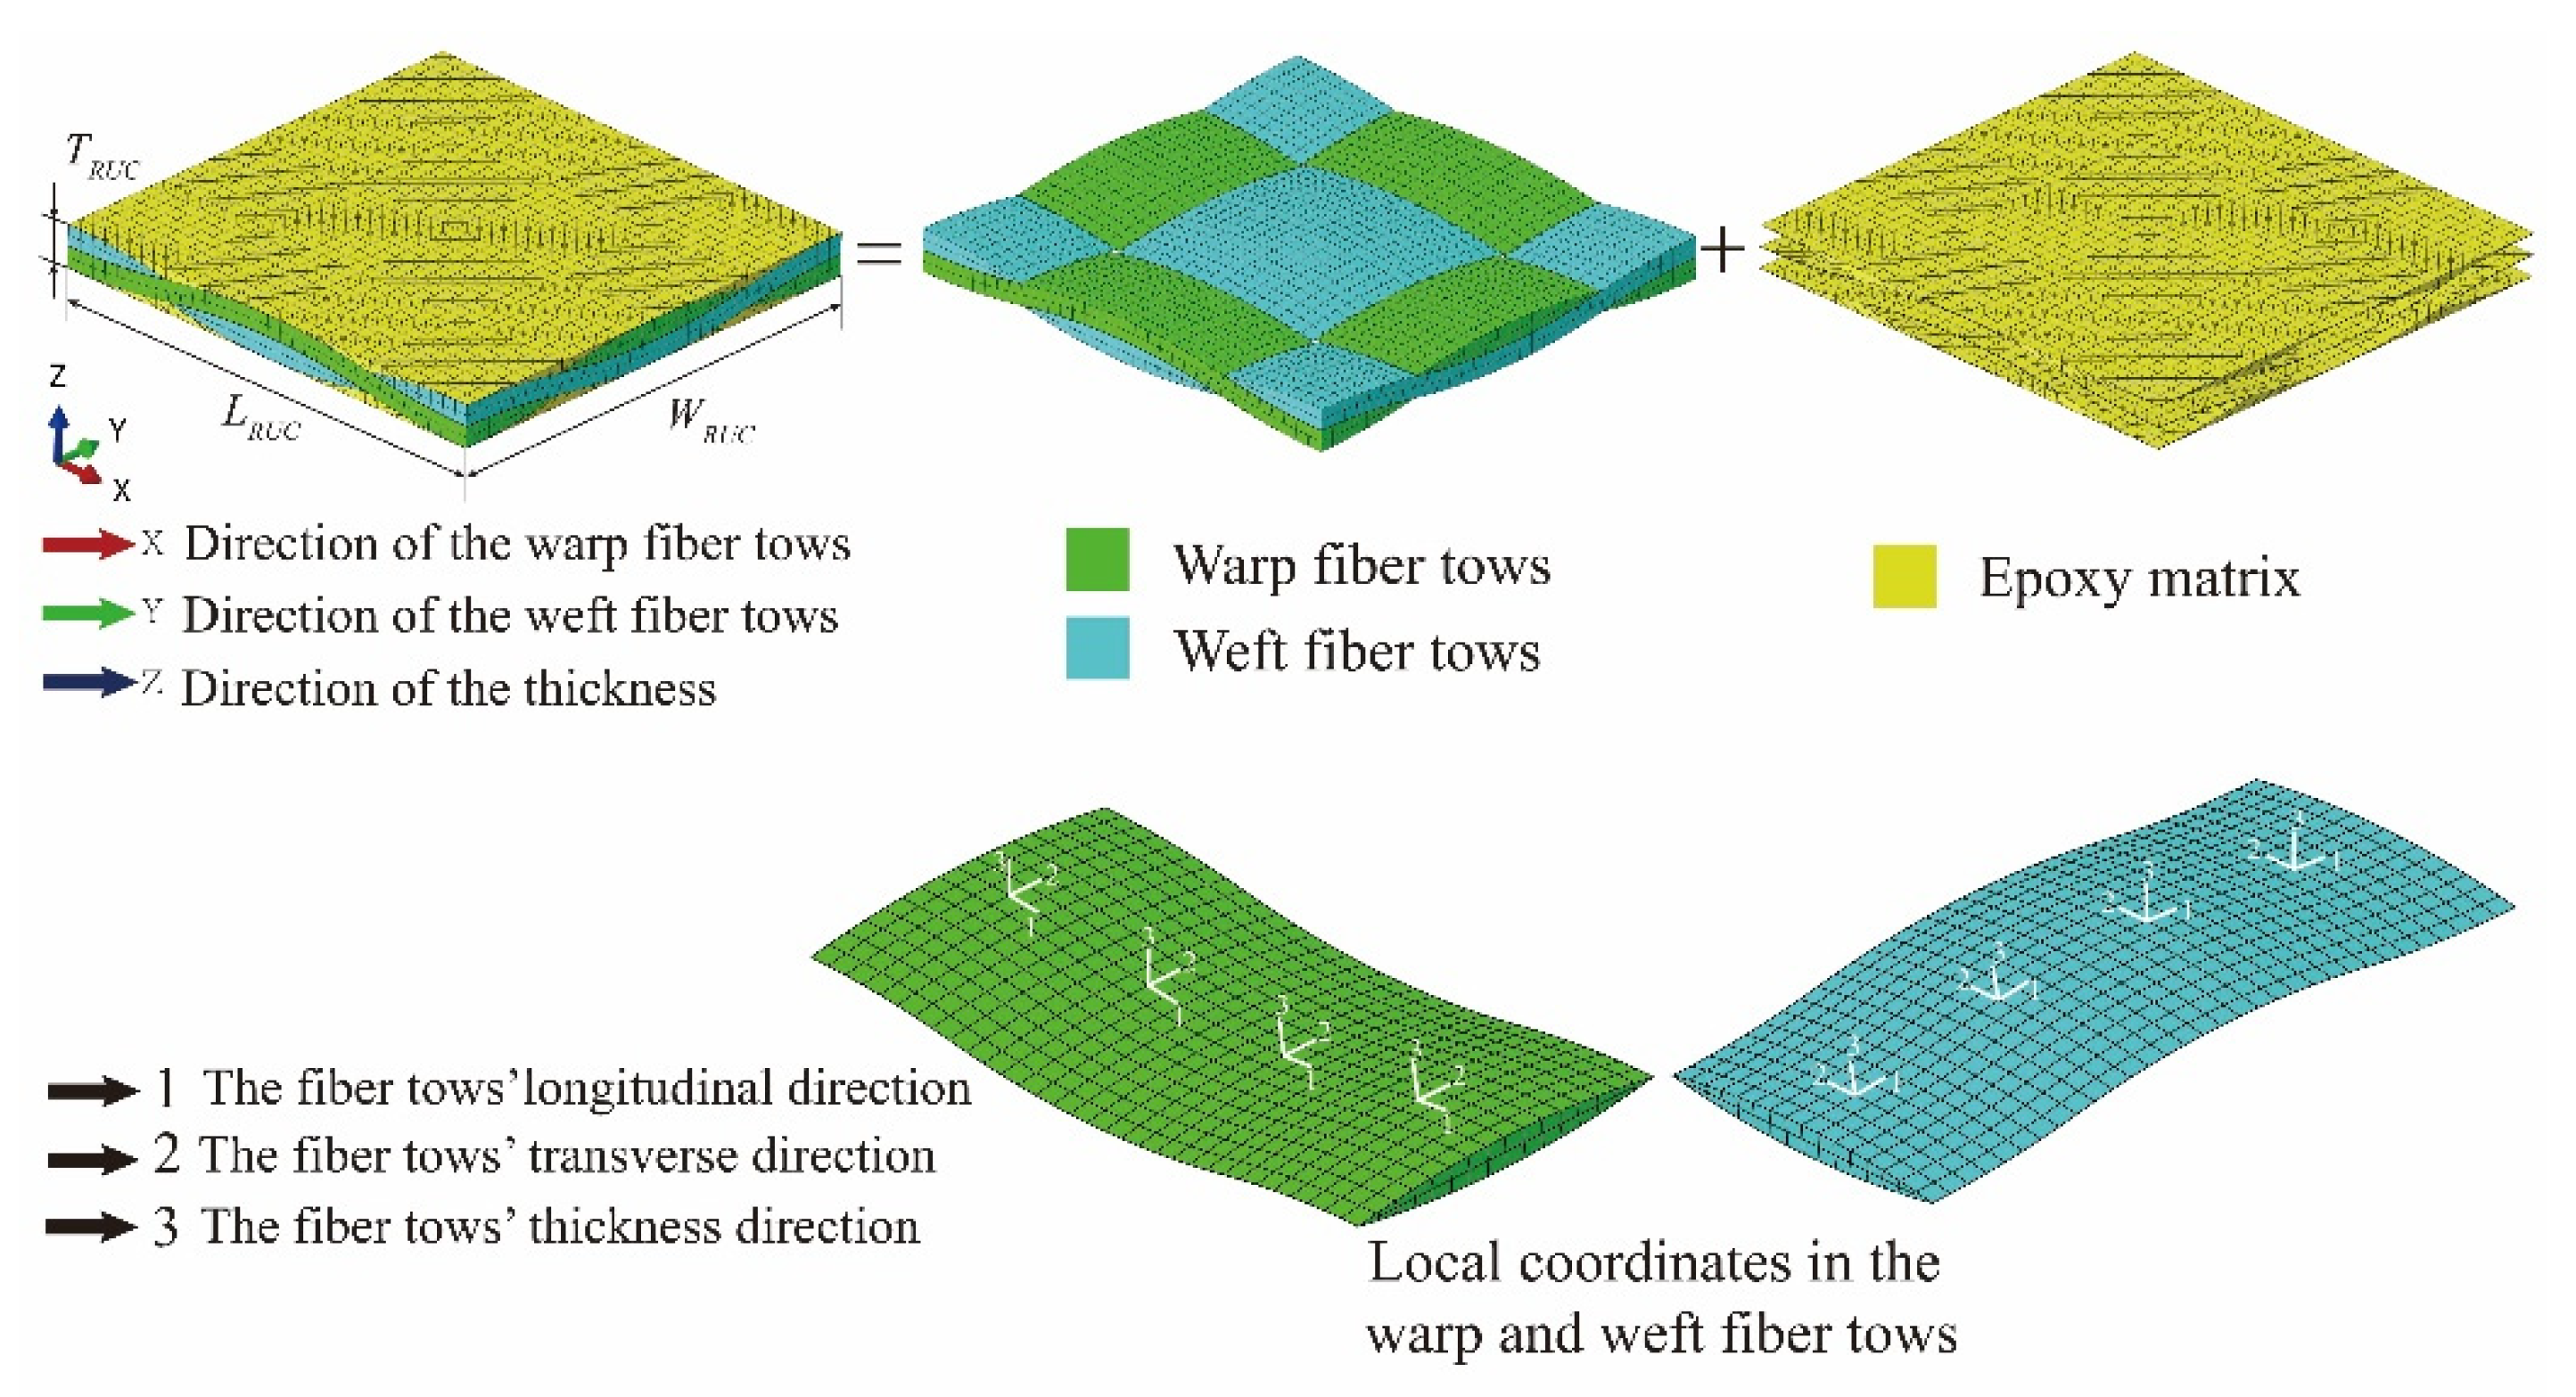
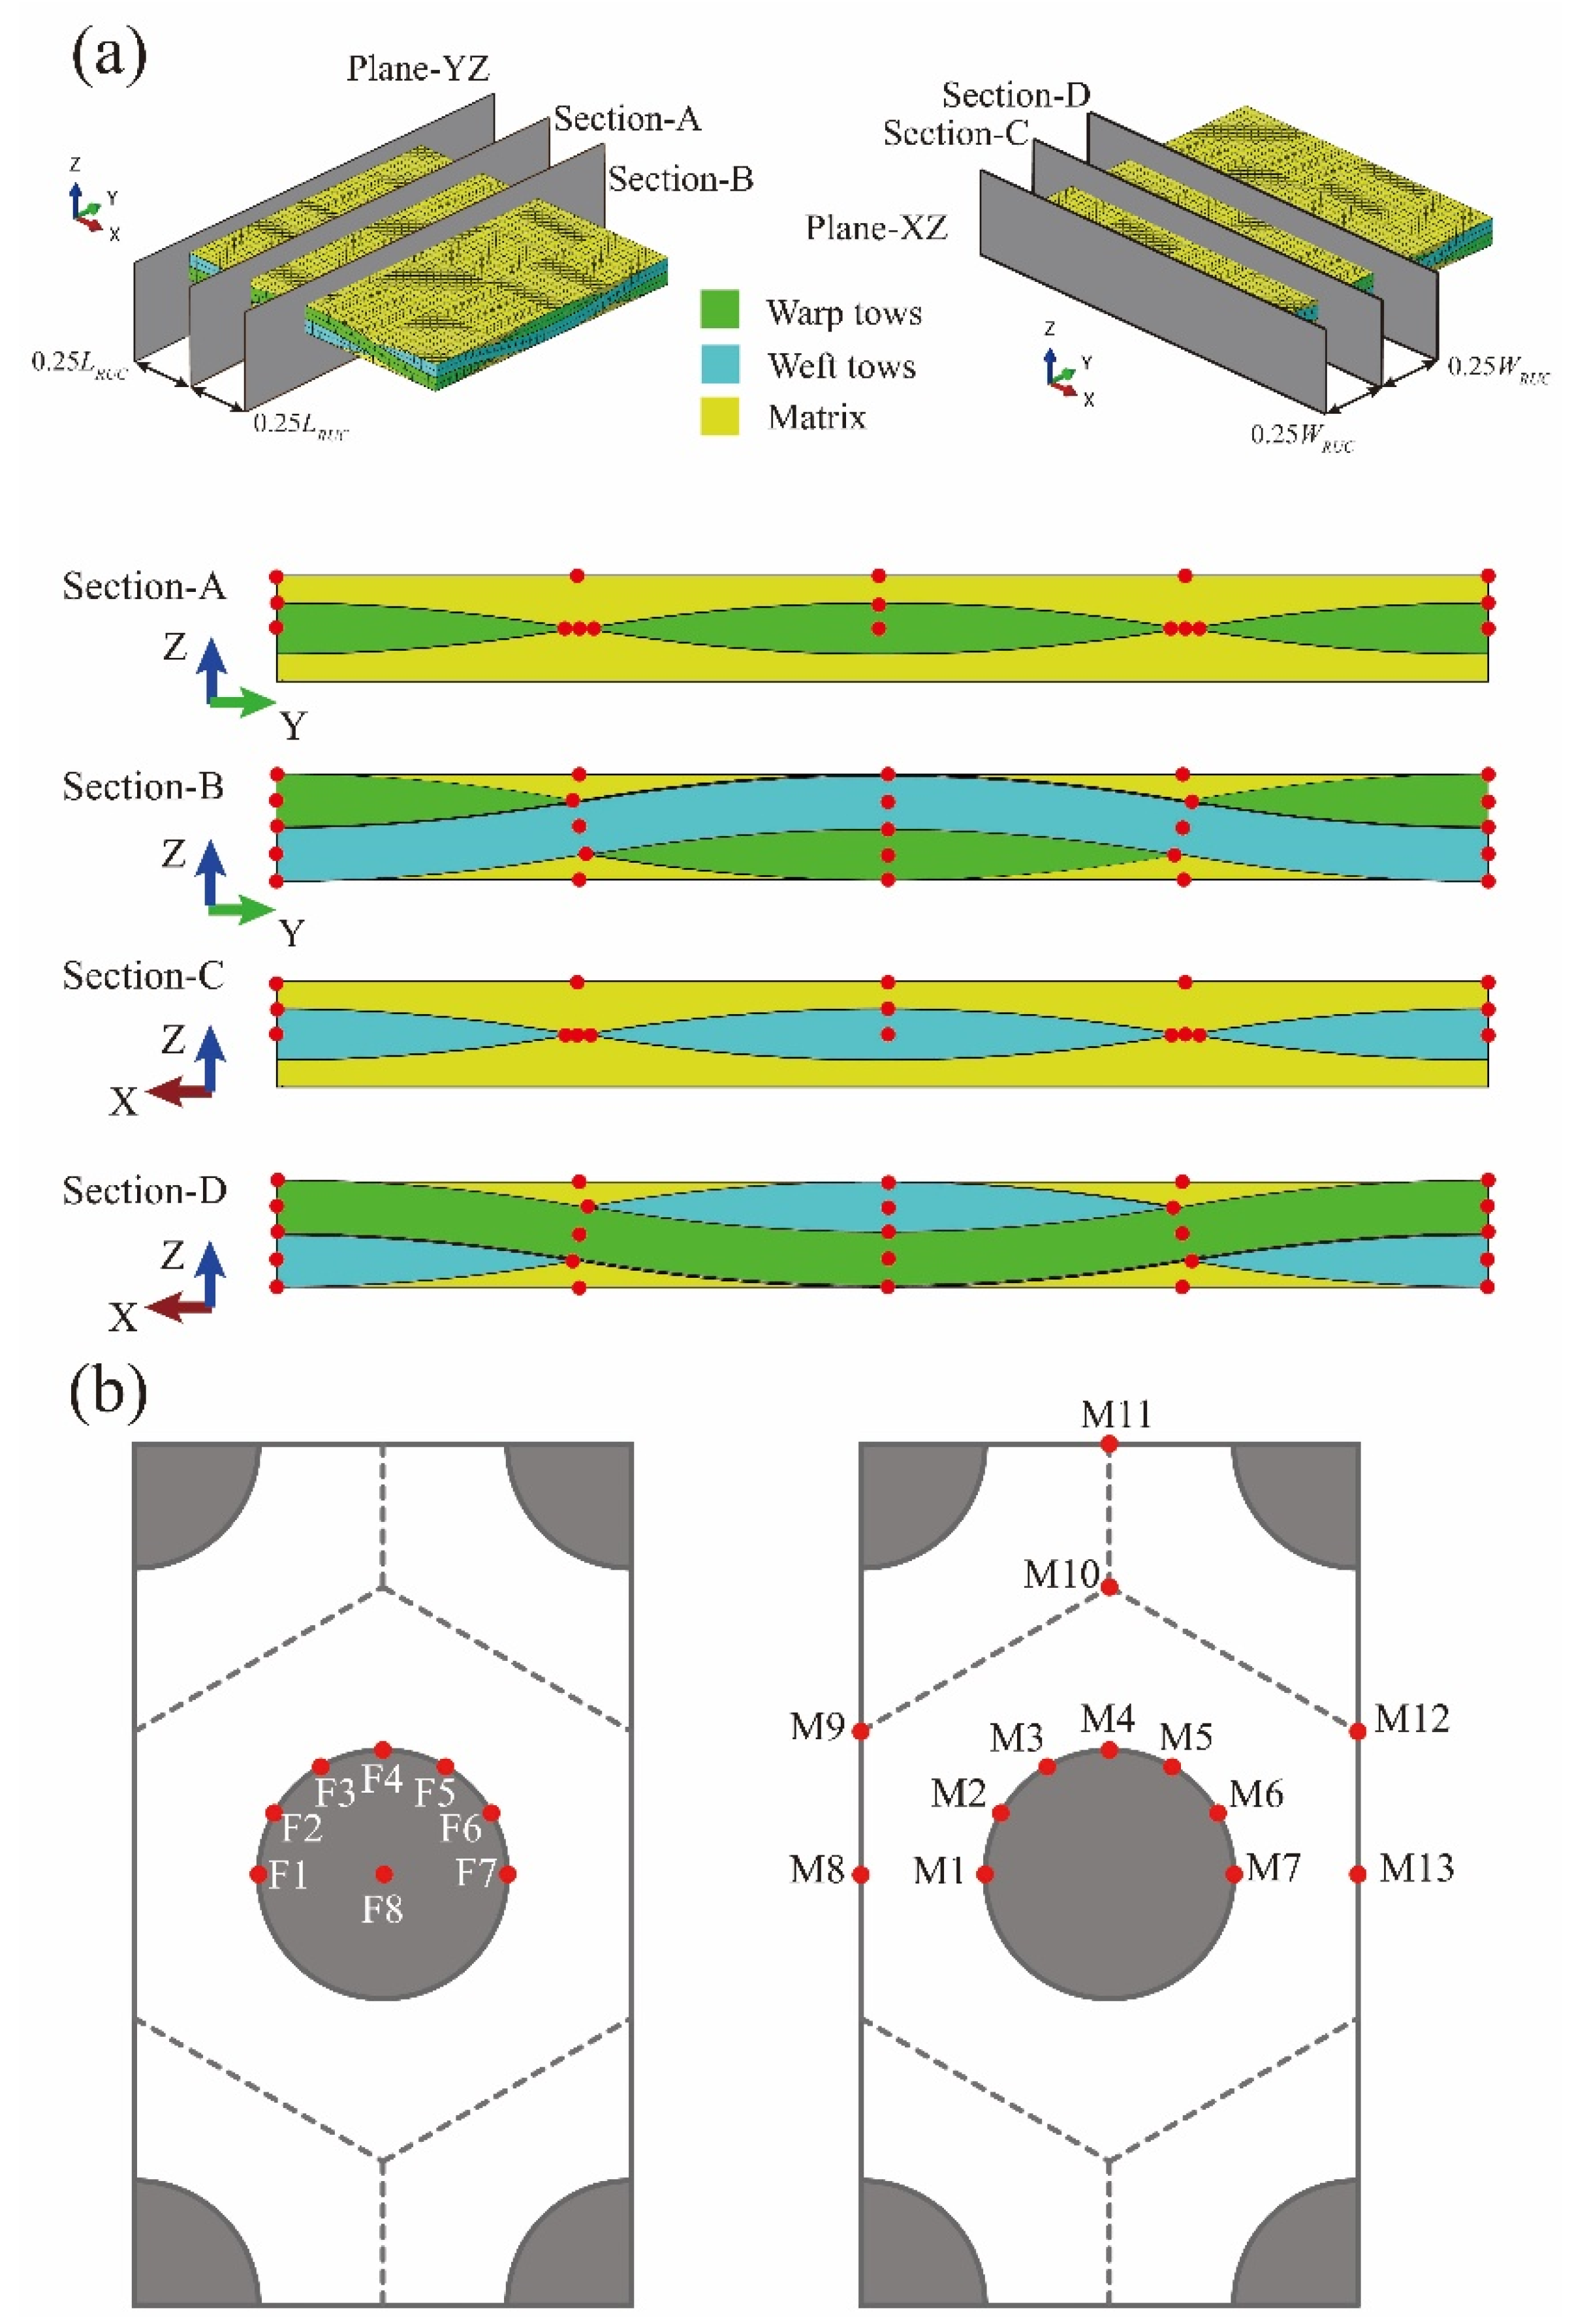
3.1. Finite Element Models

Corresponding with the specimens in the shear experiments, the macro-scale FE models of the PWF composite beams are presented in Figure 14. Mechanical properties of the steel stiffeners in the FE models are consistent with the practical used alloy steel of 30CrMnSi. Modeled with the software of ABAQUS, the point-based fasteners are used to connect the steel stiffeners and the composite beams in simulating the bolt connections in the shear experiments. The geometric dimensions, the stacking sequences of the composite plies and the material properties of the macro-scale FE model are consistent with the specimens as shown in Figure 1 and Table 1, Table 2 and Table 3. The transitions of the composite layers in the FE models are mainly referred to Figure 1c,d. For the BW-II specimen, offset ratios have been specified to the plies of the reinforcement region in modelling the asymmetrical intercalation reinforcement. In Figure 14a,b, the macro-scale FE models are discretized with the shell element of S4R. 2971 elements are used in the modeling of the BW-I specimen and 3222 elements are used in the modeling of the BW-II specimen.
In spite of the differences between the specimens in the centered open-hole and reinforcement, the application of the shear loading and the setting of the boundary conditions of the BW-I and BW-II beams are basically the same. Illustrated in Figure 15, the load application and the boundary conditions of the FE analysis have been set in reproducing the practical experimental conditions of Figure 2. All the degrees of freedom (DOF) for the nodes of the elements in the left end region of the FE model are constrained in modeling the clamped boundary condition. The nodes of the elements in the free end region are coupled with a reference point, on which a concentrate force is loaded in simulating the application of the shear loading.
Accompanying the macro-scale models, the meso-scale and micro-scale FE models of the T300/Epoxy PWF composite utilized in the specimens are together established in order to facilitate the following analysis. Based on the experimental observation and analytical validation [26], the achieved meso-scale FE model is illustrated in Figure 16.
For the above meso-scale FE model, the cross-section of the fiber tows is simplified as lenticular shape, and the corresponding undulation paths are composed of arcs with the radius of rU. Geometric parameters of the meso-scale FE model are illustrated in Figure 17, and the corresponding values are listed in Table 6.
The experimentally obtained volume fraction parameters of the T300/Epoxy PWF composite are listed in Table 7. With the fiber volume fraction in tows of V f = 0.78 and the mechanical properties of the fiber and matrix constituents listed in Table 8 [27,28], the micro-scale FE model of the T300/Epoxy PWF composite in Figure 18 is established based on the assumption of the hexagonal fiber arrangement.
The mechanical properties of the PWF composite’s fiber tows are calculated with the assistance of the micro-scale FE model and the constituents’ mechanical properties. Listed in Table 9, the fiber tows’ mechanical properties are assigned to the meso-scale FE model of Figure 16 with the consideration of the white colored local coordinates.

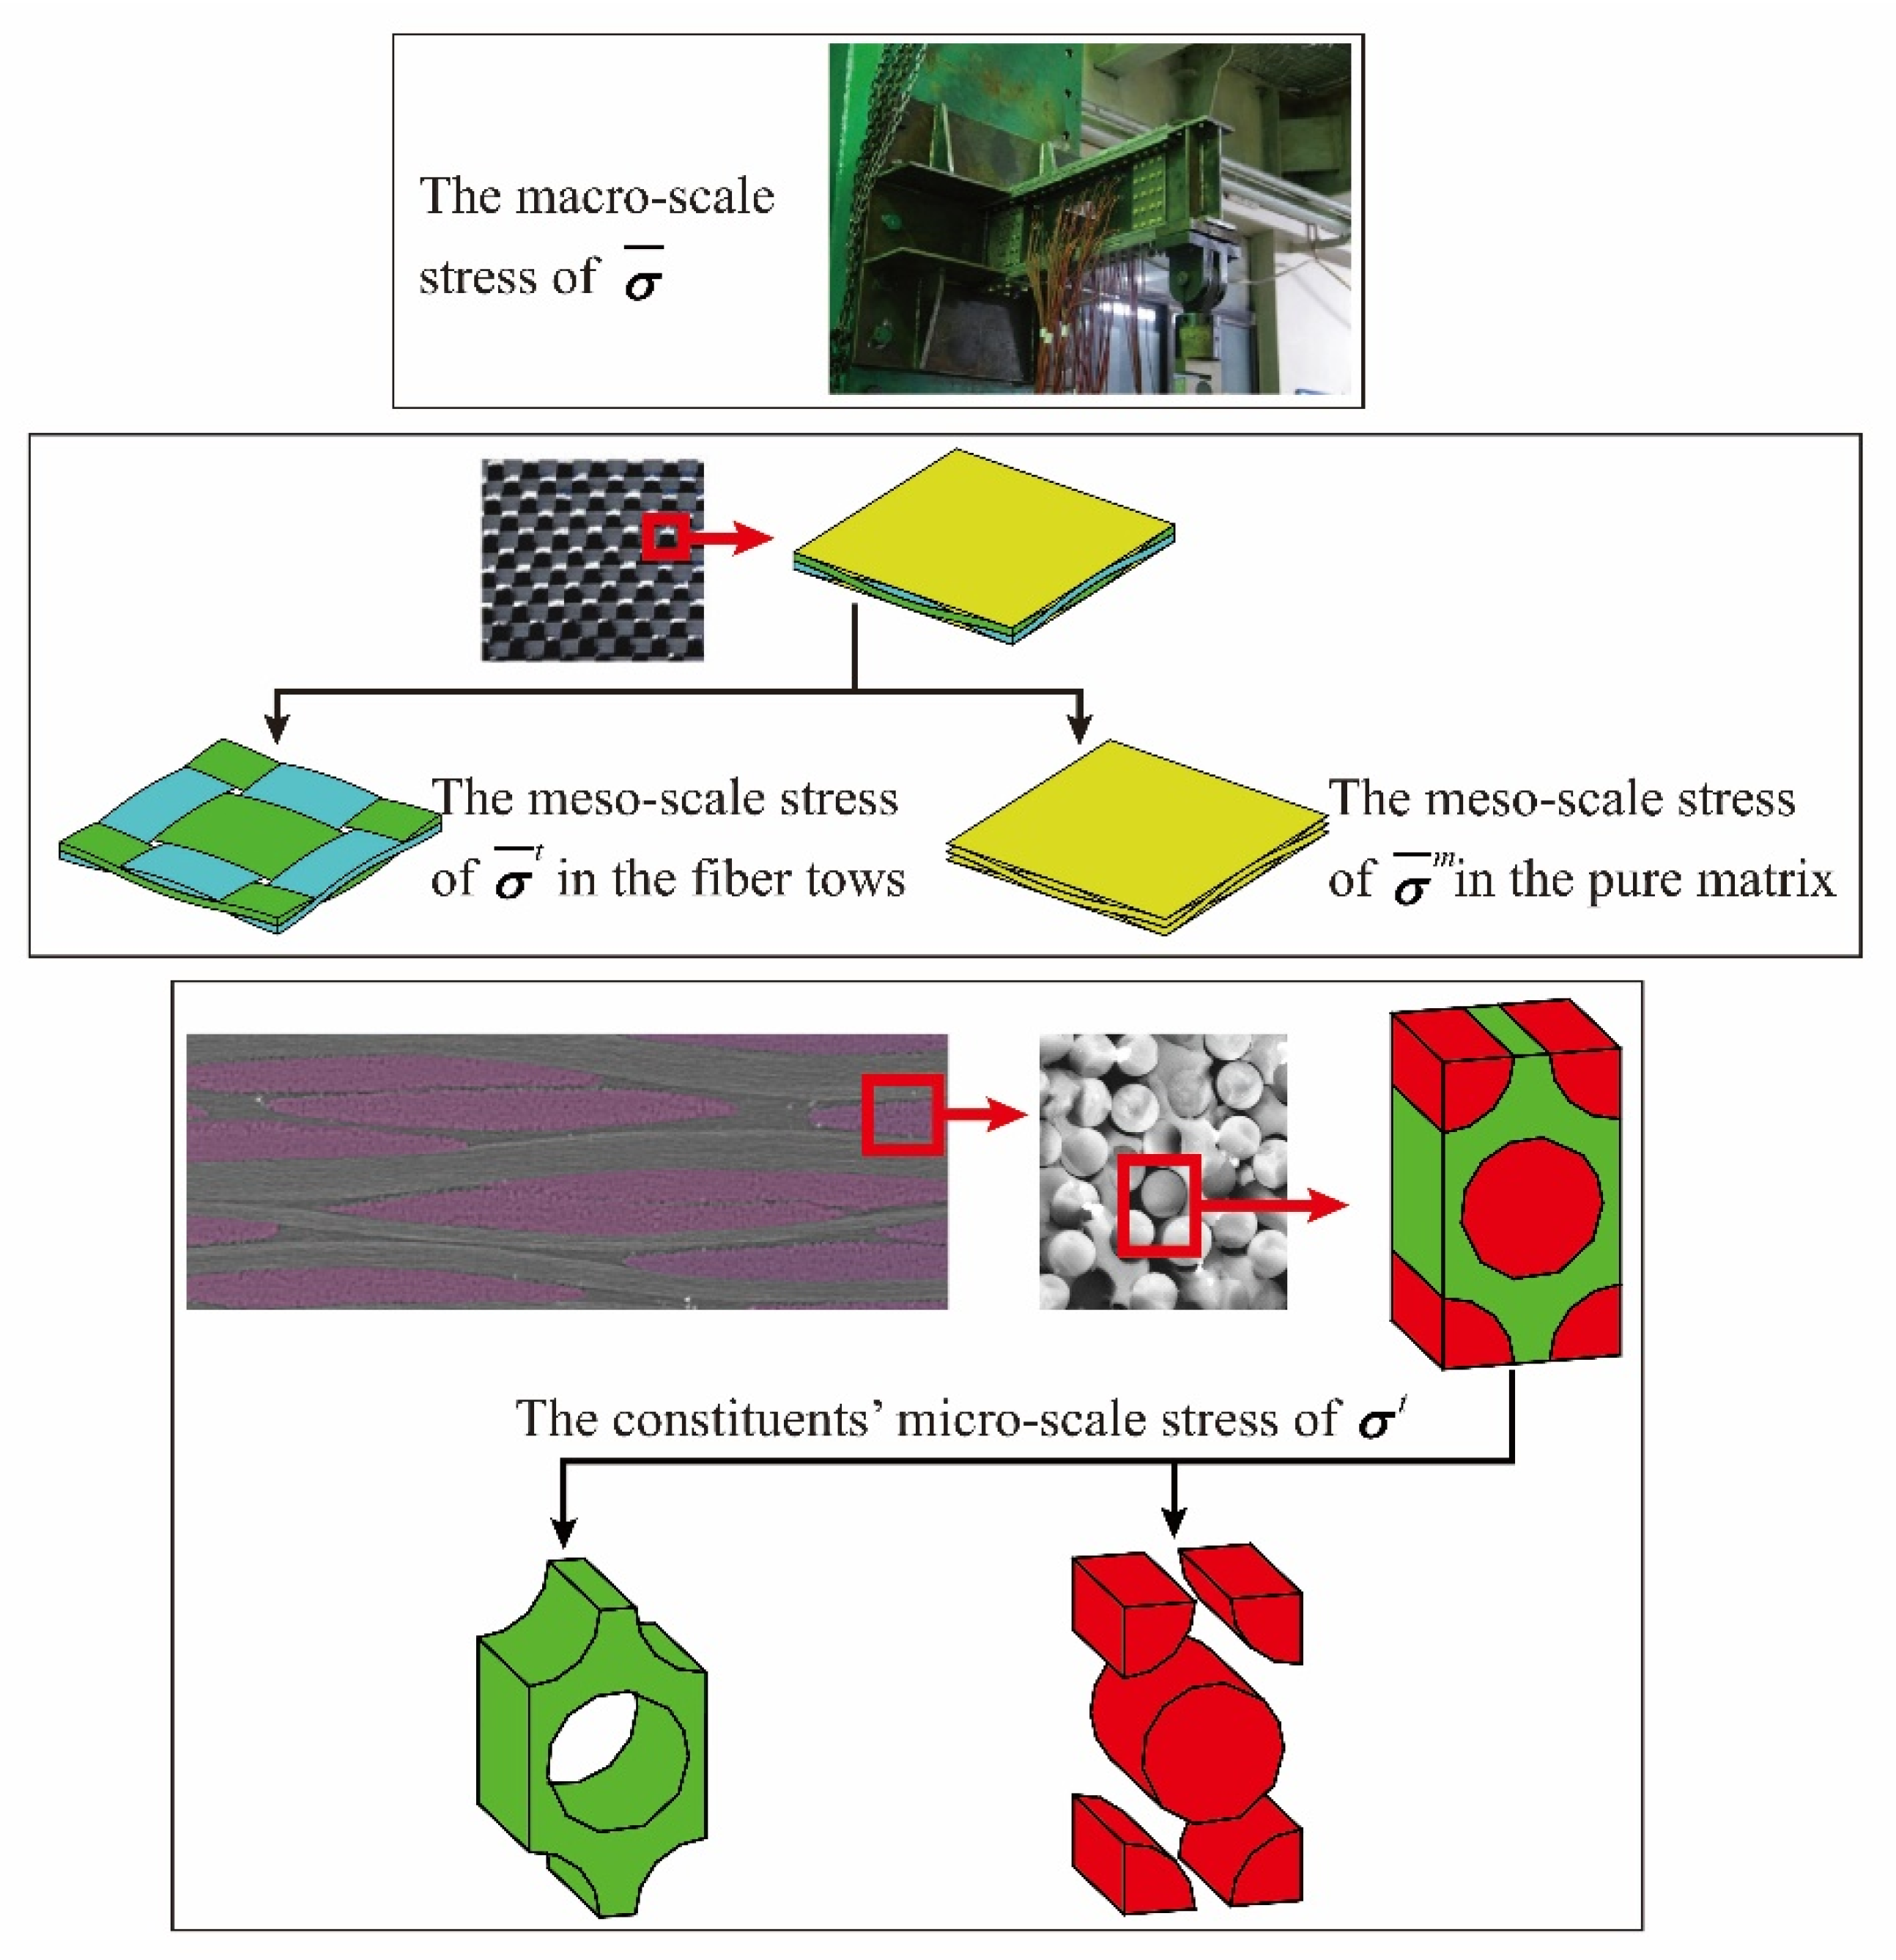
3.2. Multi-Scale FE Method for the PWF Composites’ Failure Analysis

By correlating the FE models of different analyzing scales, the multi-scale analysis methods take the advantages of both the efficiency of the macro-scale analysis and the accuracy of the micromechanics-based failure criteria. In this article, a multi-scale FE method is utilized for the failure analysis of the studied PWF composite beams.

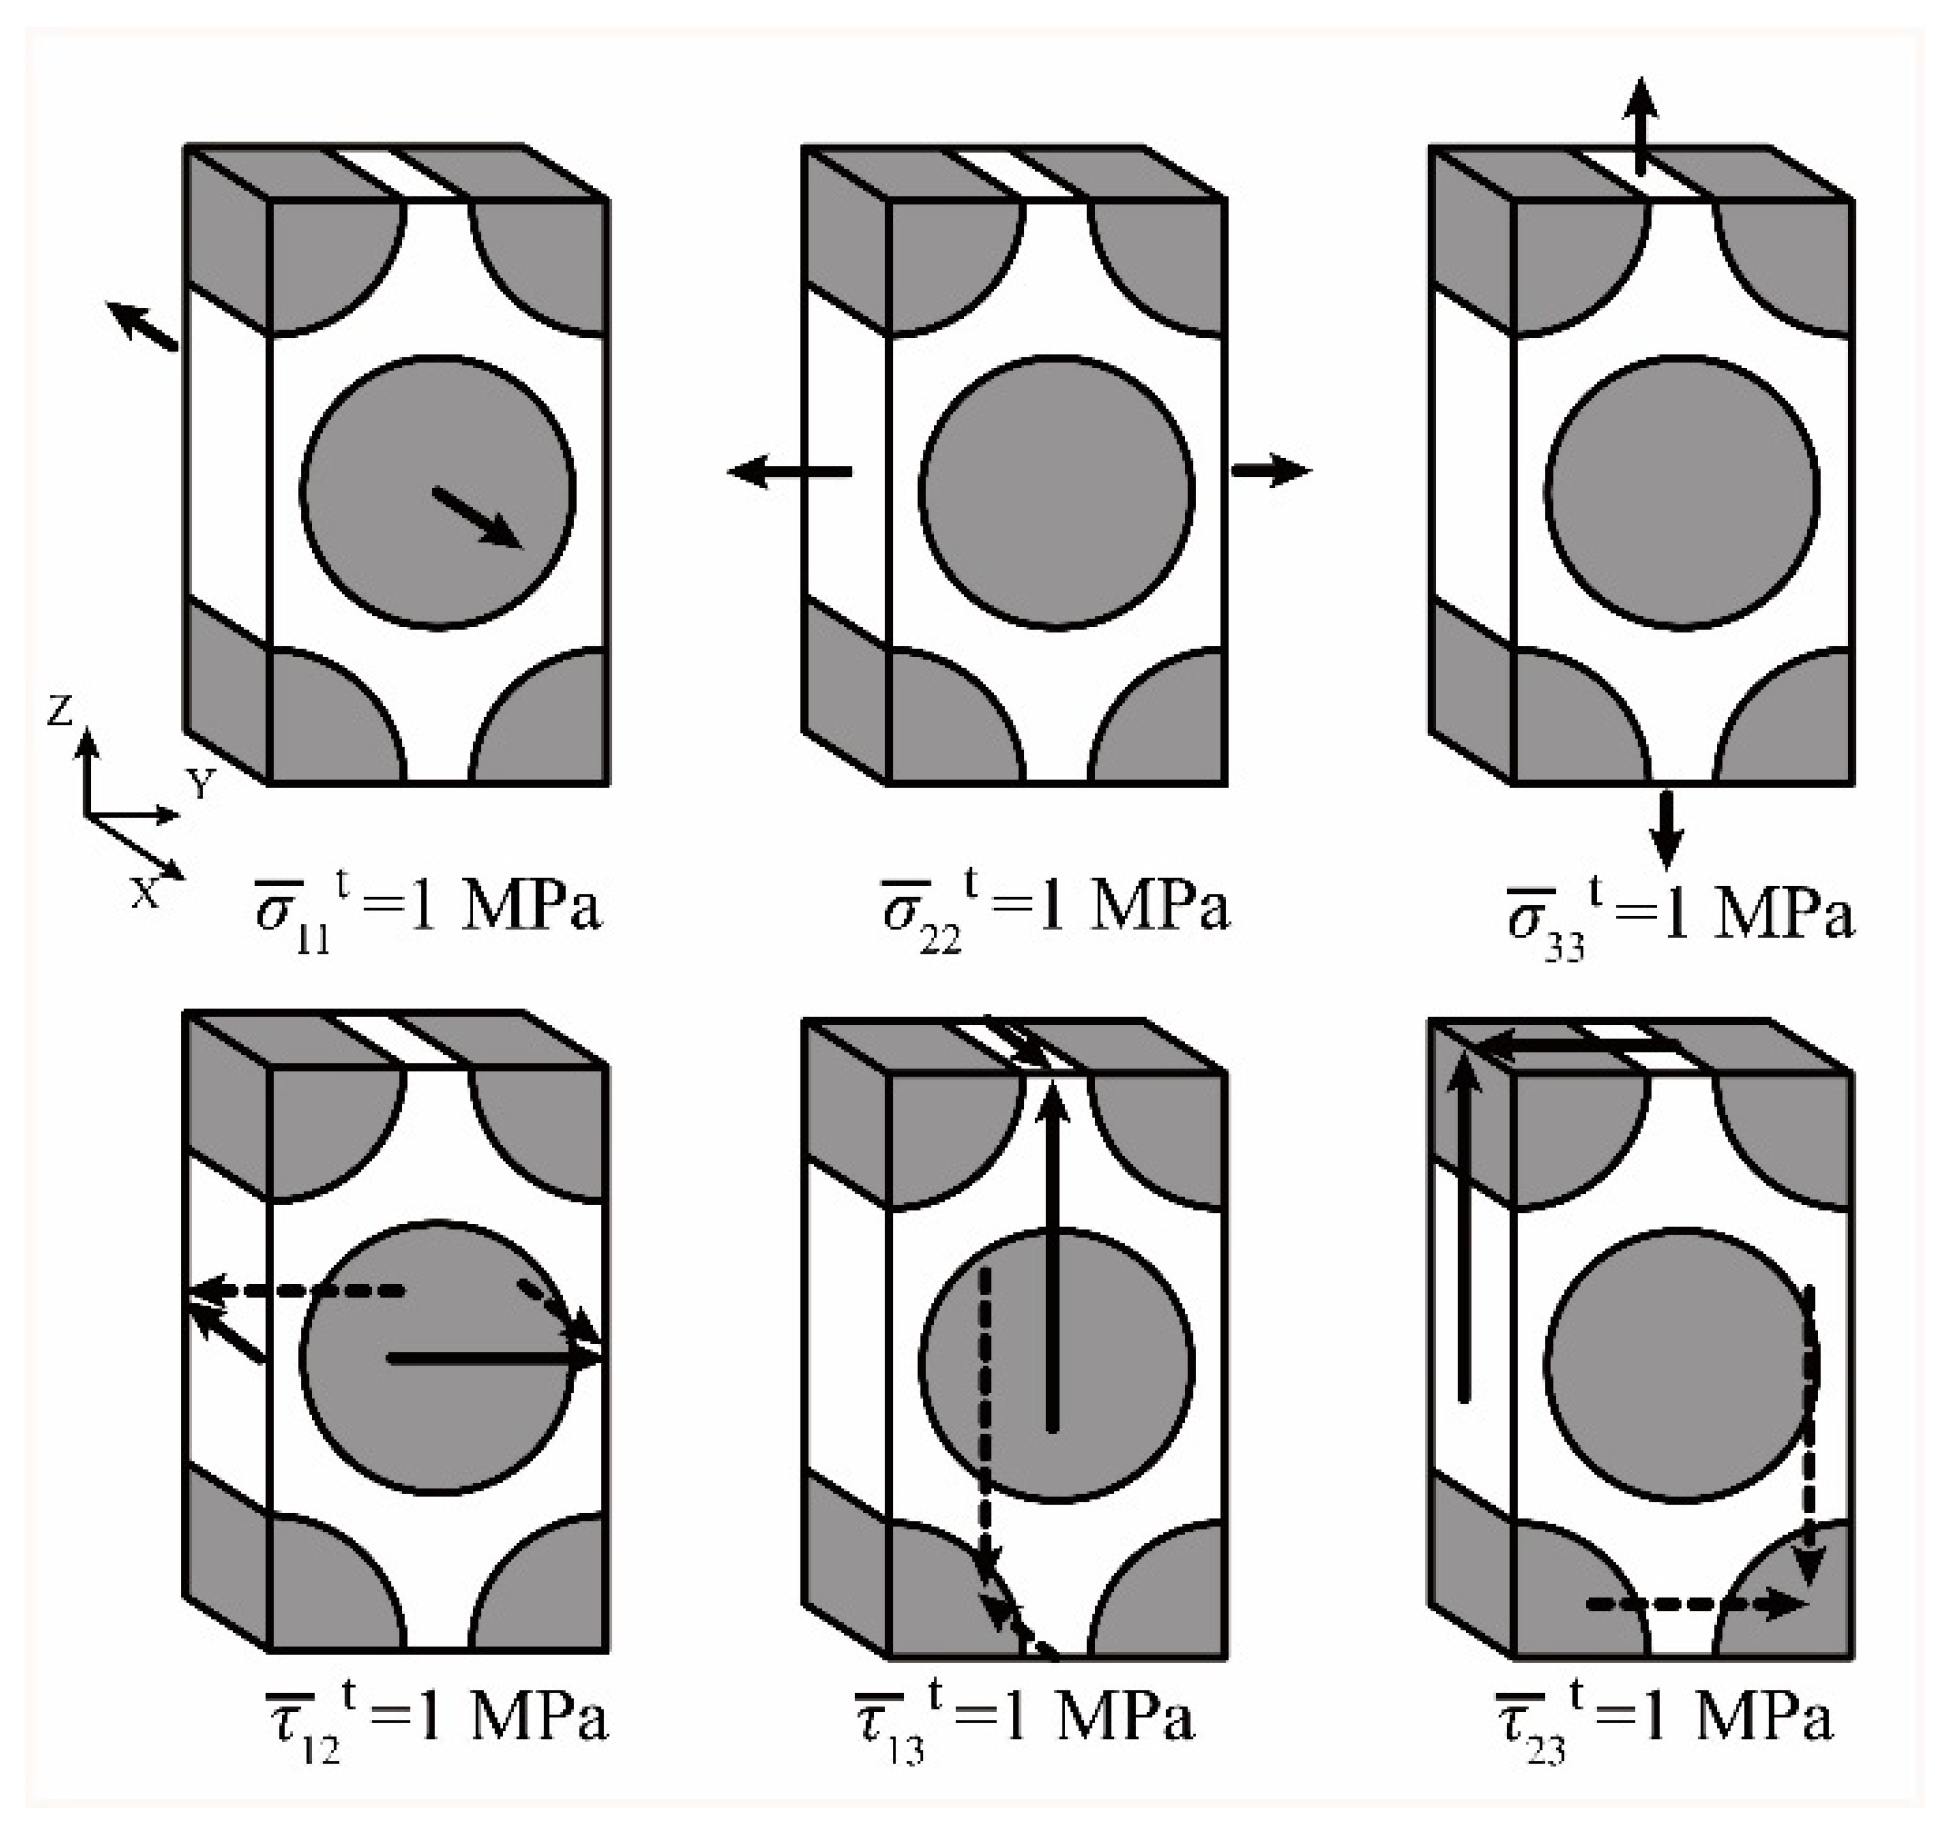
3.2.1. Stress Transformation between Different Analyzing Scales

For the PWF composite beams, the stresses classified according to the different analyzing scales are illustrated in Figure 19. The micro-scale stresses need to be calculated from the macro-scale stresses and utilized in the determination of the PWF composite’s damage initiation at the constituents’ level. In order to ensure the calculation efficiency, the stress transformation method based on the stress amplification factor (SAF) is established in obtaining the concerned micro-scale stresses at the certain reference points.
The utilized reference points should be better at covering the dangerous situations to the greatest extent [21]. However, too much of the reference points would lead to an unacceptable slowness for the multi-scale calculation. With the above considerations and refer to the related research [29,30], the determined representative reference points for the PWF composite are shown in Figure 20. In Figure 20a, for the reference points in the region of the fiber tows, the meso-scale stresses ( σ ¯ t ) could be transferred from the macro-scale stresses ( σ ¯ ) with the SAFs matrixes of Mt and At:
σ ¯ t = M t σ ¯ + A t Δ T
For the reference points in the region of the fiber tows, the meso-scale stresses ( σ ¯ m ) could be transferred from the macro-scale stresses ( σ ¯ ) with the SAFs matrixes of Mm and Am:
σ ¯ m = M m σ ¯ + A m Δ T
The complete form of Equations (1) and (2) could be expanded as the following forms of Equations (3) and (4). For each reference point in Figure 20a, the SAFs in the matrix of Mt (Mm) could be calculated with the unit stresses applied on the meso-scale FE model, as shown in Figure 21. Together, the SAFs in the matrix of At (Am) could be calculated with the unit temperature increment of Δ T = 1 K applied on the meso-scale FE model.
σ ¯ 11 t σ ¯ 22 t σ ¯ 33 t τ ¯ 12 t τ ¯ 13 t τ ¯ 23 t = M 11 t M 12 t M 13 t M 14 t M 15 t M 16 t M 21 t M 22 t M 23 t M 24 t M 25 t M 26 t M 31 t M 32 t M 33 t M 34 t M 35 t M 36 t M 41 t M 42 t M 43 t M 44 t M 45 t M 46 t M 51 t M 52 t M 53 t M 54 t M 55 t M 56 t M 61 t M 62 t M 63 t M 64 t M 65 t M 66 t σ ¯ 11 σ ¯ 22 σ ¯ 33 τ ¯ 12 τ ¯ 13 τ ¯ 23 + A 11 t A 21 t A 31 t A 41 t A 51 t A 61 t Δ T
σ ¯ 11 m σ ¯ 22 m σ ¯ 33 m τ ¯ 12 m τ ¯ 13 m τ ¯ 23 m = M 11 m M 12 m M 13 m M 14 m M 15 m M 16 m M 21 m M 22 m M 23 m M 24 m M 25 m M 26 m M 31 m M 32 m M 33 m M 34 m M 35 m M 36 m M 41 m M 42 m M 43 m M 44 m M 45 m M 46 m M 51 m M 52 m M 53 m M 54 m M 55 m M 56 m M 61 m M 62 m M 63 m M 64 m M 65 m M 66 m σ ¯ 11 σ ¯ 22 σ ¯ 33 τ ¯ 12 τ ¯ 13 τ ¯ 23 + A 11 m A 21 m A 31 m A 41 m A 51 m A 61 m Δ T
σ ¯ m in the pure matrix region of the meso-scale FE model remain the same at the micro-scale, and the stresses could be used directly in the micro-scale matrix damage determination without extra processing. The meso-scale stresses of σ ¯ t need to be further transferred into the micro-scale stresses of σ t at the reference points presented in Figure 20b with the aim of determining the micro-scale damage in the region of the fiber tows:
σ t = M P W F σ ¯ t + A P W F Δ T
Equation (5) could be fully expanded into the form of Equation (6), and the SAFs in the matrix of MPWF together with the SAFs in the matrix of APWF could be calculated with the unit stresses (as shown in Figure 22) and the unit temperature increment applied on the micro-scale FE model, respectively.
σ 11 t σ 22 t σ 33 t τ 12 t τ 13 t τ 23 t = M 11 P W F M 12 P W F M 13 P W F M 14 P W F M 15 P W F M 16 P W F M 21 P W F M 22 P W F M 23 P W F M 24 P W F M 25 P W F M 26 P W F M 31 P W F M 32 P W F M 33 P W F M 34 P W F M 35 P W F M 36 P W F M 41 P W F M 42 P W F M 43 P W F M 44 P W F M 45 P W F M 46 P W F M 51 P W F M 52 P W F M 53 P W F M 54 P W F M 55 P W F M 56 P W F M 61 P W F M 62 P W F M 63 P W F M 64 P W F M 65 P W F M 66 P W F σ ¯ 11 t σ ¯ 22 t σ ¯ 33 t τ ¯ 12 t τ ¯ 13 t τ ¯ 23 t + A 11 P W F A 21 P W F A 31 P W F A 41 P W F A 51 P W F A 61 P W F Δ T

3.2.2. Damage Determination for the Composite’s Constituents

With the above stresses achieved, the constituents’ micro-scale damage initiation could be determined. Considering its advantages in calculation convenience and accuracy, the micromechanics of failure (MMF) theory [20] is utilized in this article for the PWF composites’ micro-scale damage analysis. The MMF theory defines the failures of the fiber and matrix constituents at the micro-scale as shown in Table 10. A maximum longitudinal stress failure criterion is adopted for the failure determination of the fiber, and a modified version of the von-Mises failure criterion is adopted for the failure determination of the matrix.
The micro-scale stresses calculated from the macro-scale stresses based on the above introduced transformation methods are utilized to accompany the PWF composites’ micro-scale strengths in the micro-scale damage determination. Tf, Cf, Tm and Cm represent the micro-scale tensile and compressive strengths for the fiber and matrix, respectively. The above micro-scale strengths for the utilized T300/Epoxy PWF composite achieved based on the laminate experiments and the iteration calculations [29] are listed in Table 11. I1 and σ V M stand for the first stress invariant and von-Mises equivalent stress, and could be calculated with the components of the micro-scale stresses:
I 1 = σ 11 + σ 22 + σ 33
σ V M = I 1 2 3 I 2
In Equation (8), I2 stands for the second stress invariant:
I 2 = σ 11 σ 22 + σ 22 σ 33 + σ 11 σ 33 ( τ 12 2 + τ 13 2 + τ 23 2 )

3.2.3. Degradation of the PWF Composite’s Mechanical Properties after Damage

Once the micro-scale stresses satisfy the criteria in Table 10, the damage initiates and the properties of the corresponding constituent are degraded with the methods of Equations (10) and (11) in implementing the damage propagation. In the above equations, symbols with the superscript of * represent the degraded properties of the constituents, and the degradation factors of Df = 0.01 and Dm = 0.05 fit well with the experimental results [30]. Referring to the intact constituents’ mechanical properties in Table 8, the damaged mechanical properties of the T300/Epoxy PWF composite’s constituents are calculated in Table 12.
E f 11 * = D f E f 11 , E f 22 * = E f 22 , E f 33 * = E f 33 υ f 12 * = D f υ f 12 , υ f 13 * = D f υ f 13 , υ f 23 * = υ f 23 G f 12 * = D f G f 12 , G f 13 * = D f G f 13 , G f 23 * = G f 23
E m * = D m E m , υ m * = υ m
After the damage initiation for the pure matrix region of the PWF composite in Figure 16, the mechanical properties of the damaged matrix in Table 12 could be utilized as the reference. Considering the constituents’ micro-scale failure, the damage states of the PWF composite’s fiber tows could be further classified as: (a) the fiber constituent is damaged and the matrix constituent remains intact; (b) the matrix constituent is damaged and the fiber constituent remains intact; (c) the constituents of fiber and matrix are both damaged. Corresponding with the above damage states of the fiber tows, intact and damaged material properties in Table 8 and Table 12 are assigned to the micro-scale FE model.
Based on the micro-scale FE models with the constituents in different damage states, the mechanical properties together with the SAFs matrixes of MPWF and APWF for the damaged fiber tows are calculated. In Table 13, symbols with the superscripts of a, b, and c represent the degraded properties of the fiber tows under the above damage states of (a), (b) and (c).
The degradation of the fiber tows’ mechanical properties will further affect the PWF composite’s macro-scale mechanical properties. Considering the different damage states of the fiber tows and the matrix, the PWF composite’s meso-scale FE models which correspond with the classified damage states are illustrated in Figure 23.
On the basis of the meso-scale FE models under different damage states, the damaged macro-scale mechanical properties are calculated in Table 14, together with the SAFs matrix of Mt, Mm, At, and Am. The superscripts of a, b, and c represent the damage states of (a), (b) and (c) for the region of the fiber tows in the meso-scale FE model. The superscripts of 1 and 2 represent the intact state and the damaged state for the region of the pure matrix in the meso-scale FE model, respectively.

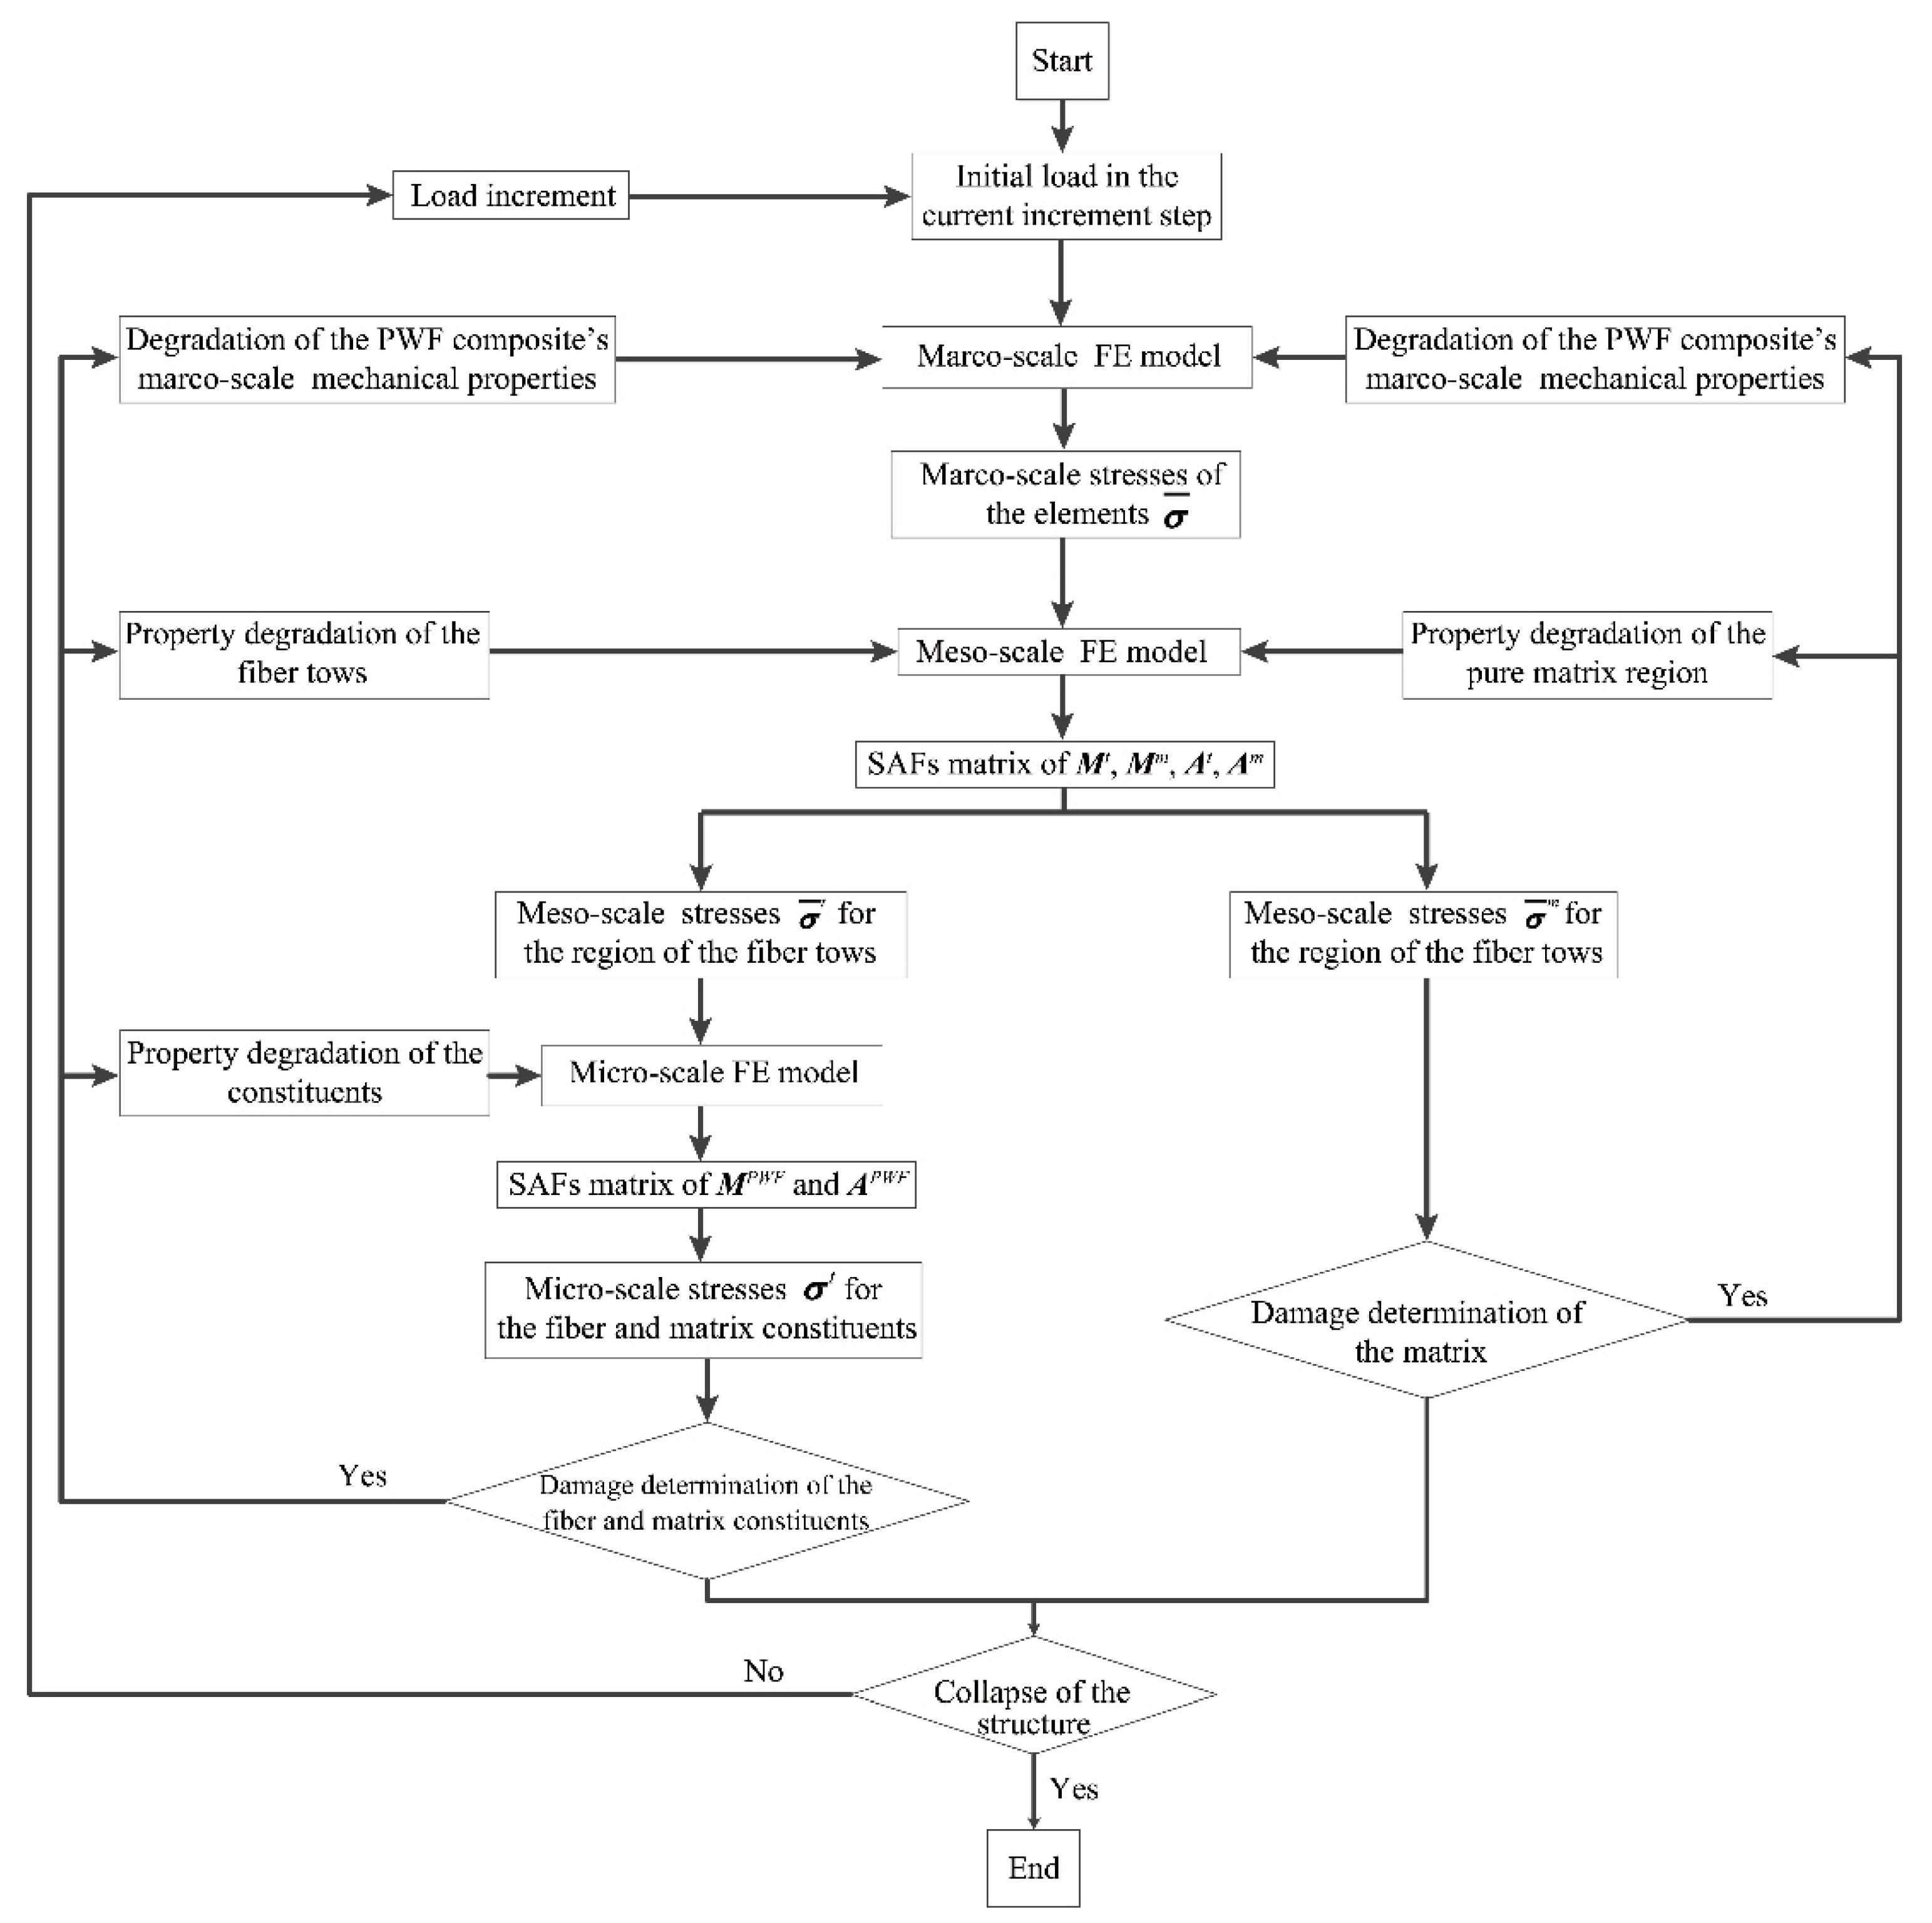
3.2.4. Multi-Scale Method for the PWF Composite’s Failure Analysis

The multi-scale method used in this article for the failure analysis of the PWF composite beams is presented in Figure 24. At the beginning of each load increment, the stresses of the elements in the macro-scale FE model are calculated. With the SAFs matrixes of Mt, Mm, At, and Am calculated on the basis of the meso-scale FE model, the meso-scale stresses of σ ¯ t in the region of the fiber tows and σ ¯ m in the region of the pure matrix are transferred from the macro-scale stresses of σ ¯ . σ ¯ m of different reference points are used directly in the damage determination of the pure matrix region, and the stresses of σ ¯ t need to be further transferred into the micro-scale stresses of σ t with the SAFs matrixes of MPWF and APWF calculated on the basis of the micro-scale FE model in determining the micro-scale damage initiation of the fiber tows. Once the failure criterion is satisfied, the mechanical properties of the PWF composite degrade at different analyzing scales according to the predefined damage states, and the SAFs matrixes of Mt, Mm, At, Am, MPWF and APWF are correspondingly renewed for the following load increment. With the appearance of the sharp load decrease, the analyzed PWF composite structure collapses, and the cycling of the above procedures stops.
The above multi-scale method is conducted using the ABAQUS user-defined field subordinate (USDFLD). The predefined field variables (FV) are used in the simulation the PWF composite’s micro-scale damage: FV1 represents the fiber tensile damage in the fiber tows, FV2 represents the fiber compressive damage in the fiber tows, FV3 represents the matrix damage in the fiber tows, and FV4 represents the matrix damage in the pure matrix region. With the assistance of the above method, the multi-scale FE analyses have been conducted on the PWF composite I-section beams in the shear experiments with the general commercial FE analyzing software of ABAQUS.

4. Model Validation and Parametric Analysis

Analyzing accuracy is the important concern for the FE analysis on the studied PWF composite I-section beams. In this section, numerical results of the studied I-section beams are first presented and compared with the corresponding experimental results in the different aspects of strain-load curves, load-displacement curves, critical buckling load, buckling deformation mode, collapse load and failure mode. With the feasibility of the proposed FE models and multi-scale method validated, parametric analysis has been further carried out.

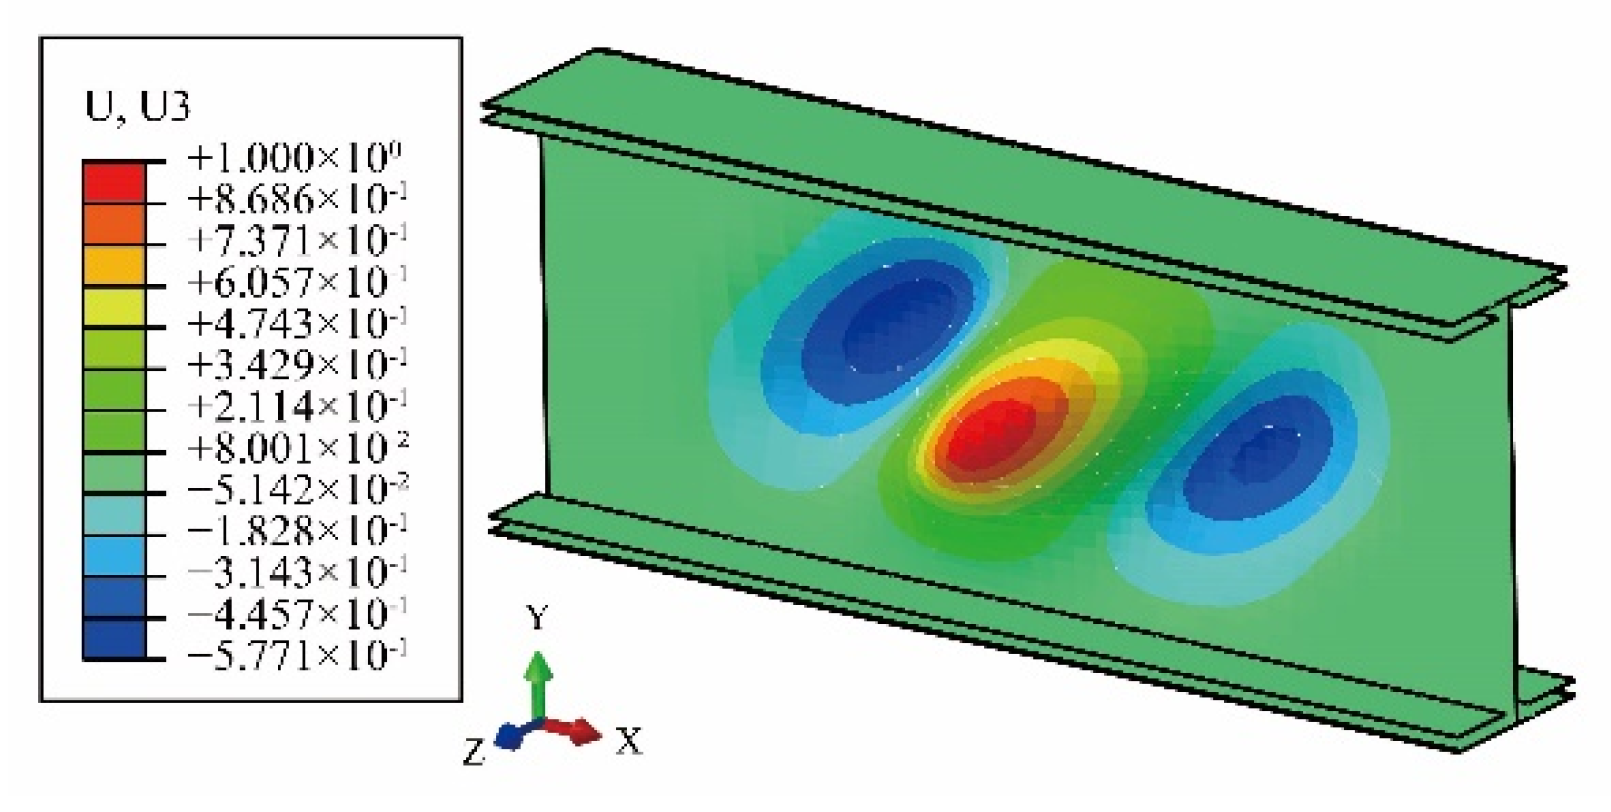
4.1. FE Analysis Results of the BW-I Composite Beams

Different buckling and post-buckling analysis strategies are assigned to the composite beams of BW-I and BW-II, respectively, considering their buckling characteristics reflected by the experiments.
With the BW-I specimens’ symmetric geometry configuration and ply sequences, obvious inflection points could be detected on the load-displacement curves and the linear bearing stages are reflected from the experiments. The above characteristics indicate that the precondition of the linear stability analysis method is satisfied, and the linear buckling analysis method is first carried out for the FE model of BW-I in Figure 14a.
The achieved numerical result of the BW-I beam’s first buckling mode is presented in Figure 25. Three buckling waves are equally distributed on the web region with the off-plane deformation in the Z and -Z directions, and the numerical result is in consistent with the buckling deformation characteristic which is reflected by the experimental strain-load results in Figure 6. The critical buckling load of 38.0 kN is calculated from the eigenvalue and has a 2.98% deviation compared to the average experimental buckling load of 36.9 kN in Table 4. The accuracy of the linear stability analysis method in predicting the buckling deformation mode and the critical buckling load indicates its feasibility for the BW-I composite beams’ buckling analysis.
The effect of geometric nonlinearity is considered in the post-buckling analysis of the BW-I composite beams, and the first buckling mode obtained above is imported as the initial structural imperfection. The failure behaviors of the composite beams are simulated with the multi-scale method illustrated in Figure 24, and the predefined field variables of FV1~FV4 are utilized in representing the constituents’ micro-scale damage.
The numerical strain-load curves of the I2L and I2R measurement points are compared with the representative experimental results of the BW-I-01 specimen in Figure 26, and the numerical and experimental load-displacement curves are compared in Figure 27. The obtained good agreements indicate the capability of the FE model in simulating the loading response of the BW-I composite beams.
In Figure 28, the calculated failure results of the BW-I composite beam’s surface ply are presented. According to the results of FV1 and FV2, the fiber tensile damage is mainly observed in the warp direction of the surface ply, and the fiber compressive damage is mainly observed in the weft direction of the surface ply. Accompanying the above damages of the fibers, the matrix damages in the region of the fiber tows and pure matrix represented by the variables of FV3 and FV 4, respectively, are correspondingly detected. According to the comparisons, the experimentally observed damages are numerically simulated by the FE analysis. With the deviation of 2.19%, the numerical collapse load of 65.2 kN is close to the experimental average collapse load of 63.8 kN.

4.2. FE Analysis Results of the BW-II Composite Beams

For the composite beams of BW-II, the asymmetrical intercalation reinforcement is considered as the innate structural imperfection, and the analysis is directly conducted based on the FE model with the geometric nonlinearity effects considered. Taking the composite beam of BW-II-01 as the representative specimen, the calculated strain-load curves are compared with the experimental results for the different measurement points in Figure 29, and the numerical and experimental load-displacement curves are compared in Figure 30. The above comparisons indicate the good agreements between the experimental and numerical results.
Similarly to the data processing method in the shear experiments, K-load curves of the different measurement points are achieved from the calculated strain-load curves. The critical buckling load of the FE analysis is determined as 37.2 kN from the curves’ extreme points in Figure 31, which has a 1.09% deviation comparing to the average experimental buckling load of 36.8 kN in Table 5.
The calculated off-plane deformation in the web region of the BW-II composite beam under the concentrated shear load is presented in Figure 32, and the numerical result is in consistent with the structural deformation mode which is reflected by the experimental results in Figure 11.
The calculated failure states of the BW-II composite beam’s surface ply are presented in Figure 33. Compared to Figure 13, the experimental failure states are basically simulated by the numerical results. The numerical collapse load for the composite beam of BW-II is 59.8 kN, which is close to the experimental average collapse load of 59.2 kN in Table 5.
With the above comparisons, the effectiveness of the FE models and the proposed multi-scale method in the simulation of the PWF composite beams’ loading response and shear failure is well-validated. Based on the validated FE models and the multi-scale failure analysis method, the parametric analysis has been conducted in investigating the effects of the beam web’s open-hole and the asymmetrical intercalation reinforcement on the structural stability and shear failure of the PWF composite I-section beams.

4.3. Parametric Analysis

The FE models of PWF composite I-section beams with the centered open-hole in the web region are established in Figure 34 on the basis of the BW-I specimens. Apart from the centered open-holes, the FE models in Figure 34 remain consistent with the BW-I composite beams in the aspects of the geometric configurations, the use of the T300/Epoxy PWF composite material and the ply sequences in the different divided regions. With the aim to study the open-hole effects, diameters of the open-holes in the FE models range from 5 mm to 80 mm.
Considering the symmetric characteristics, methods similar to the BW-I composite beams illustrated in Section 4.1 are utilized in the buckling and failure analysis of the open-hole models in Figure 34. Linear buckling analysis is first carried out in calculating the critical buckling load with the eigenvalue. In the post-buckling analysis, the obtained first buckling mode is imported as the initial structural imperfection and the multi-scale method is utilized in the failure simulation. In Figure 35, the critical buckling loads and the collapse loads of the composite beams’ FE models with the centered open-holes of different diameters are presented.
The critical buckling load of the FE model basically linearly decreases with the increase in the open-hole diameter, indicating that the composite beams’ structural stability is not dramatically reduced by the existence of the open-hole in the web region. However, the effect of the open-hole on the shear bucking of the PWF composite I-section beam should be considered during the structure design process. With the diameter of the open-hole extending to 80 mm, the composite beam’s critical buckling load decreases to 67.97% of the structure in perfect condition. The calculated buckling modes of the models with the open-holes of different diameters are presented in Figure 36. With the increase in the open-hole area, the center region of the beam web becomes more deformable, and the off-plane deformation of the middle buckling wave gradually dominates the structural buckling deformation mode. The weakening of the stiffness in the region of the beam web with the increase in the open-hole diameter is one of the reasons leading to the gradual decrease in the structural stability.
Obviously, the existence of the open-hole induces the stress concentration around the hole-edge region, leading to the decrease in the PWF composite beams’ collapse load. Compared to the composite beam of BW-I in the perfect condition, the critical buckling load and the shear failure load of the composite beam with the open-hole of d = 5 mm drop by 2.18% and 15.36%, respectively, indicating that the existence of the open-hole has a more remarkable effect on the composite beams’ carrying capacity. Results in Figure 35 indicate that the initiation of the open-hole existence dramatically decreases the composite beam’s shear strength, but a downward trend for the decrease in the collapse load is presented with the further increase in the open-hole diameter.
The effects of the open-hole on the PWF composite beams’ buckling and failure under shear load are reflected by the above parametric analysis. In the aspect of the structural stability, the open-hole weakens the flexural rigidity of the composite beams. The more deformable perforated beam web decreases the critical buckling load, and the shear buckling of the composite beam initiates in advance. In the aspect of the structural carrying capacity, the open-hole undermines the structural integrity and induces the additional stress concentrations, leading to the anticipation of the damage initiation and the decrease in the collapse load for the PWF composite beams.
The composite beam model in Figure 34 with the open-hole of d = 25 mm is named as BW-III, and the calculation results of the BW-I~III models are compared in order to investigate the effects of the reinforcement. The representative concentrated shear load in the post-buckling loading stages of the above models is chosen as 40 kN, under which the numerical results of the off-plane deformation and the stress state in the web region are presented in Figure 37.
With the intercalation reinforcement, the stiffness of the composite beam web is strengthened, and the off-plane deformation is effectively controlled as presented in Figure 37a. Moreover, the stress concentration within the open-hole region of the surface ply in Figure 37b is obviously alleviated. With the above reinforcement effects, the critical buckling load and the collapse of the composite beam decreased by the open-hole have been remarkably regained, as reflected in Table 15.

5. Conclusions

This paper introduces the analysis work on the aeronautical engineering structure of I-section beams manufactured with the advanced plain-woven fabric composite materials. Two types of composite beams are incorporated in the shear tests, and the characteristics of structural buckling and failure are reflected in the experimental results. The comparison between the results of the two types of specimens indicates that the shear stability and the carrying capacity of the reinforced perforated composite beams almost catch up to the corresponding targets of the undamaged specimens.
A multi-scale FE method has been proposed for the failure analysis of the PWF composite structures. Based on the T300/Epoxy PWF composite utilized in the studied I-section beams, details of the multi-scale method have been concluded in the aspects of the stress transformation, the micro-scale damage determination and the degradation of the PWF composite’s mechanical properties after damage. The multi-scale FE analyses have been conducted in predicting the shear response of the PWF composite beams with good agreements achieved between the numerical and experimental results. The feasibility of the calculation methods and models has been validated, and a good engineering application prospect could be anticipated for the multi-scale FE method.
The further parametric analysis for the PWF composite beams has been carried out on the basis of the validated methods and models. Reflected by the calculation results, the open-hole affects the shear buckling and failure of the composite beams through weakening the flexural rigidity of the beam web and introducing the additional hole-edge stress concentration. Corresponding with the weakening effects of the open-hole, the intercalation reinforcement postpones the buckling initiation through increasing the stiffness of the beam web and promotes the structural carrying capacity through alleviating the stress concentration around the open-hole region.

Author Contributions

Conceptualization, R.Z.; methodology, J.X.; software, R.Z.; validation, R.Z.; formal analysis, R.Z.; investigation, R.Z.; resources, W.G. and J.X.; data curation, W.L.; writing—original draft preparation, R.Z.; writing—review and editing, W.G.; visualization, W.L.; supervision, R.Z.; project administration, R.Z. All authors have read and agreed to the published version of the manuscript.

Funding

This research received no external funding.

Data Availability Statement

Not applicable.

Acknowledgments

The first author would like to thank Xing Li and Wei Sun for the helpful discussions in this paper.

Conflicts of Interest

The authors declare no conflict of interest.

References

  1. Song, O.; Librescu, L.; Jeong, N.-H. Static response of thin-walled composite I-beams loaded at their free-end cross-section: Analytical solution. Compos. Struct. 2001, 52, 55–65. [Google Scholar] [CrossRef]
  2. Lee, J.; Kin, S.-E.; Hong, K. Lateral buckling of I-section composite beams. Eng. Struct. 2002, 24, 955–964. [Google Scholar] [CrossRef]
  3. Mittelstedt, S.; Mittelstedt, C. Mixed-mode buckling of shear-deformable composite laminated I-beams. Int. J. Mech. Sci. 2020, 169, 105332. [Google Scholar] [CrossRef]
  4. Asadi, A.; Sheikh, A.H.; Thomsen, O.T. Buckling behavior of thin-walled laminated composite beams having open and closed sections subjected to axial and end moment loading. Thin Wall. Struct. 2019, 141, 85–96. [Google Scholar] [CrossRef]
  5. Guo, S.; Morishima, R.; Zhang, X.; Mills, A. Cutout shape and reinforcement design for composite C-section beams under shear load. Compos. Struct. 2009, 88, 179–187. [Google Scholar] [CrossRef]
  6. Guo, S.; Li, D.; Zhang, X.; Xiang, J. Buckling and post-buckling of a composite C-section with cutout and flange reinforcement. Compos. Part B Eng. 2014, 60, 119–124. [Google Scholar] [CrossRef]
  7. Orun, A.E.; Guler, M.A. Effect of hole reinforcement on the buckling behavior of thin-walled beams subjected to combined loading. Thin Wall. Struct. 2017, 118, 12–22. [Google Scholar] [CrossRef]
  8. Erklig, A.; Yeter, E.; Bulut, M. The effects of cut-outs on lateral buckling behavior of laminated composite beams. Compos. Struct. 2013, 104, 54–59. [Google Scholar] [CrossRef]
  9. Eryigit, E.; Zor, M.; Arman, Y. Hole effects on lateral buckling of laminated cantilever beams. Compos. Part B Eng. 2009, 40, 174–179. [Google Scholar] [CrossRef]
  10. Pasinli, A. Shape and position effects of double holes on lateral buckling of cantilever composite beams. Compos. Part B Eng. 2013, 55, 433–439. [Google Scholar] [CrossRef]
  11. Rezaeepazhand, J.; Jafari, M. Stress analysis of perforated composite plates. Compos. Struct. 2005, 71, 463–468. [Google Scholar] [CrossRef]
  12. Wu, H.-C.; Mu, B. On stress concentrations for isotropic/orthotropic plates and cylinders with a circular hole. Compos. Part B Eng. 2003, 34, 127–134. [Google Scholar] [CrossRef]
  13. Guo, S.J. Stress concentration and buckling behavior of shear loaded composite panels with reinforced cutouts. Compos. Struct. 2007, 80, 1–9. [Google Scholar] [CrossRef]
  14. Naouar, N.; Vidal-Salle, E.; Schneider, J.; Marie, E.; Boisse, P. Meso-scale FE analyses of textile composite reinforcement deformation based on X-ray computed tomography. Compos. Struct. 2014, 116, 165–176. [Google Scholar] [CrossRef]
  15. Wang, H.; Wang, Z. Statistical analysis of yarn feature parameters in C/Epoxy plain-weave composite using micro CT with high-resolution lens-coupled detector. Appl. Compos. Mater. 2016, 23, 601–622. [Google Scholar] [CrossRef]
  16. Nguyen, M.; Herszberg, I.; Paton, R. The shear properties of woven carbon fabric. Compos. Struct. 1999, 47, 767–779. [Google Scholar] [CrossRef]
  17. Doitrand, A.; Fagiano, C.; Irisarri, F.-X.; Hirsekorn, M. Comparison between voxel and consistent meso-scale models of woven composites. Compos. Part A Appl. S. 2015, 73, 143–154. [Google Scholar] [CrossRef]
  18. Goyal, D.; Tang, X.; Whitecomb, J.D.; Kelkar, A.-D. Effect of various parameters on effective engineering properties of 2 × 2 braided composites. Mech. Adv. Mater. Struct. 2005, 12, 113–128. [Google Scholar] [CrossRef]
  19. Mayes, J.S.; Hansen, A.C. Composite laminate failure analysis using multicontinuum theory. Compos. Sci. Technol. 2004, 64, 379–394. [Google Scholar] [CrossRef]
  20. Ha, S.K.; Jin, K.K.; Huang, Y. Micro-mechanics of failure (MMF) for continuous fiber reinforced composites. J. Compos. Mater. 2008, 42, 1873–1895. [Google Scholar]
  21. Li, X.; Guan, Z.; Li, Z.; Liu, L. A new stress-based multi-scale failure criterion of composites and its validation in open hole tension tests. Chin. J. Aeronaut. 2014, 27, 1430–1441. [Google Scholar] [CrossRef] [Green Version]
  22. Xu, L.; Huang, Y.C.; Zhao, C.; Ha, S.K. Progressive failure prediction of woven fabric composites using a multi-scale approach. Int. J. Damage Mech. 2018, 27, 97–119. [Google Scholar] [CrossRef]
  23. Xu, L.; Jin, C.Z.; Ha, S.K. Ultimate strength prediction of braided textile composites using a multi-scale approach. J. Compos. Mater. 2015, 49, 477–494. [Google Scholar] [CrossRef]
  24. Wang, M.; Zhang, P.; Fei, Q.; Guo, F. Modified micro-mechanics based multiscale model for progressive failure prediction of 2D twill woven composites. Chin. J. Aeronaut. 2020, 33, 2070–2087. [Google Scholar] [CrossRef]
  25. Zhao, C.; Huang, Y.; Chen, Z.; Ha, S.K. Progressive failure prediction of a landing gear structure of braided composites. Compos. Struct. 2017, 161, 407–418. [Google Scholar] [CrossRef]
  26. Zhou, R.; Gao, W.; Liu, W.; Xu, J. An analytical model for the uniaxial tensile modulus of plain-woven fabric Composites and Its Experimental Validation. Aerospace 2022, 9, 26. [Google Scholar] [CrossRef]
  27. Torayca. T300 Standard Modulus Carbon Fiber; Toray Composite Materials America, Inc.: Tacoma, WA, USA, 2018. [Google Scholar]
  28. Solvay. Cycom 970 Epoxy Resin System Technical Data Sheet; Solvay Company: Tempe, AZ, USA, 2017. [Google Scholar]
  29. Zhou, R.; Gao, W.; Liu, W. An MMF3 criterion based multi-scale strategy for the failure analysis of plain-woven fabric composites and its validation in the open-hole compression tests. Materials 2021, 14, 4393. [Google Scholar] [CrossRef] [PubMed]
  30. Liu, Z.; Guan, Z.; Tan, R.; Xu, J.; Li, X. Multiscale analysis of CFRP laminates with MMF3 criterion under different off-axis loading conditions. Materials 2018, 11, 2255. [Google Scholar] [CrossRef] [Green Version]
Figure 1. Configuration and dimensions of the PWF composite I-section beams: (a) specimens of BW-I with the web region in perfect condition; (b) specimens of BW-II with open-hole and asymmetrical intercalation reinforcement in the center of the web region; (c) the layer transition between the peripheral web region and the middle examination web region; (d) the layer transition in the reinforcement region of the BW-II specimens.
Aerospace 09 00537 g001
Figure 2. Shear experiment on the PWF composite I-section beams.
Aerospace 09 00537 g002
Figure 3. Arrangement of the resistance strain gauges in monitoring the loading responses of the PWF composite beams: (a) strain gauges in the BW-I specimens; (b) strain gauges in the BW-II specimens.
Aerospace 09 00537 g003
Figure 4. Load-displacement curves from the shear experiments on the PWF composite beams of BW-I.
Aerospace 09 00537 g004
Figure 5. The strain-load curves of different measurement points in the web region of the BW-I-01 specimen.
Aerospace 09 00537 g005
Figure 6. The characteristics of the off-plane deformation on the BW-I-01 composite beam web corresponding to the shear buckling: (a) the off-plane buckling deformation of Point A and the nearby region; (b) the off-plane buckling deformation of Point B and the nearby region; (c) the off-plane buckling deformation of Point C and the nearby region.
Aerospace 09 00537 g006
Figure 7. The experimental K-load curves of the different strain measurement points on the BW-I-01 PWF composite beam.
Aerospace 09 00537 g007
Figure 8. The failure state of the BW-I-01 composite beam after the collapse under shear load.
Aerospace 09 00537 g008
Figure 9. Load-displacement curves from the shear experiments on the PWF composite beams of BW-II.
Aerospace 09 00537 g009
Figure 10. The strain-load curves of different measurement points in the web region of the BW-II-01 specimen.
Aerospace 09 00537 g010
Figure 11. The characteristics of the off-plane deformation on the BW-II-01 composite beam web corresponding to the shear buckling: (a) the off-plane buckling deformation of Point D & G and the nearby regions; (b) the off-plane buckling deformation of Point E & F and the nearby region.
Aerospace 09 00537 g011
Figure 12. The experimental K-load curves of the different strain measurement points on the BW-II-01 PWF composite beam.
Aerospace 09 00537 g012
Figure 13. The failure state of the BW-II-01 composite beam after the collapse under shear load.
Aerospace 09 00537 g013
Figure 14. The macro-scale FE models of the T300/Epoxy PWF composite I-section beams: (a) specimens of BW-I; (b) specimens of BW-II.
Aerospace 09 00537 g014
Figure 15. The application of the shear loading and the setting of the boundary conditions for the macro-scale FE models.
Aerospace 09 00537 g015
Figure 16. Meso-scale FE model of the utilized T300/Epoxy PWF composite.
Aerospace 09 00537 g016
Figure 17. The simplification of the cross-section and undulation path for the fiber tows in the meso-scale FE model.
Aerospace 09 00537 g017
Figure 18. Micro-scale FE model of the utilized T300/Epoxy PWF composite.
Aerospace 09 00537 g018
Figure 19. The classification of the stresses in the PWF composites according to the different analyzing scales.
Aerospace 09 00537 g019
Figure 20. The choice of the reference points for the PWF composite: (a) reference points in the meso-scale FE model; (b) reference points in the micro-scale FE model.
Aerospace 09 00537 g020
Figure 21. Unit stresses applied on the meso-scale FE model in obtaining the meso-scale stress amplification factors.
Aerospace 09 00537 g021
Figure 22. Unit stresses applied on the micro-scale FE model in obtaining the micro-scale stress amplification factors.
Aerospace 09 00537 g022
Figure 23. The meso-scale FE model of the T300/Epoxy PWF composite with different damage states of the fiber tows and the matrix.
Aerospace 09 00537 g023
Figure 24. The multi-scale failure analysis method for the PWF composite structures.
Aerospace 09 00537 g024
Figure 25. The numerical result of the first buckling mode from the linear buckling analysis on the BW-I composite beams under shear load.
Aerospace 09 00537 g025
Figure 26. Comparison of the experimental and numerical strain-load curves for the composite beam of BW-I.
Aerospace 09 00537 g026
Figure 27. Comparison of the experimental and numerical load-displacement curves for the composite beam of BW-I.
Aerospace 09 00537 g027
Figure 28. The calculate damage states of the surface ply in the composite beam of BW-I after the final collapse under shear load.
Aerospace 09 00537 g028
Figure 29. Comparison between the experimental and numerical strain-load curves for the composite beam of BW-II.
Aerospace 09 00537 g029
Figure 30. Comparison of the experimental and numerical load-displacement curves for the composite beam of BW-II.
Aerospace 09 00537 g030
Figure 31. The numerical K-load curves of the different strain measurement points for the composite beam of BW-II.
Aerospace 09 00537 g031
Figure 32. The numerical result of the off-plane deformation in the web region of the BW-II composite beam under the concentrate shear load.
Aerospace 09 00537 g032
Figure 33. The calculate damage states of the surface ply in the composite beam of BW-II after the final collapse under shear load.
Aerospace 09 00537 g033
Figure 34. The FE models of the PWF composite beams with the centered open-hole and no reinforcement.
Aerospace 09 00537 g034
Figure 35. The critical buckling loads and the collapse loads of the composite beams’ FE models with the centered open-holes of different diameters.
Aerospace 09 00537 g035
Figure 36. The first buckling mode of the FE models with the centered open-holes of different diameters.
Aerospace 09 00537 g036
Figure 37. The numerical results of the BW-I~III models under the concentrate shear load: (a) numerical results of the off-plane deformation in the web region; (b) numerical results of the stress concentration in the web region.
Aerospace 09 00537 g037
Table 1. Mechanical properties of the T300/Epoxy PWF composite in the tested I-section beams.
PropertyValue
Longitudinal modulus, E 11 P W F (GPa)56.85
Transverse modulus, E 22 P W F (GPa)56.85
In-plane shear modulus, G 12 P W F (GPa)3.86
In-plane Poisson’s ratio, ν 12 P W F 0.042
Longitudinal tensile strength, X T P W F (MPa)717.0
Longitudinal compressive strength, X C P W F (MPa)597.0
Transverse tensile strength, Y T P W F (MPa)717.0
Transverse compressive strength, Y C P W F (MPa)597.0
Table 2. Ply sequences of the different regions for the BW-I composite beams.
RegionPly Sequence
Top flange[45/45/0/0/45/0/0/45/0/45/0]s
Bottom flange[45/45/0/0/45/0/0/45/0/45/0]s
Peripheral web region[45/45/0/0/45/0/0/45/0/45/0]s
Middle examination web region[45/0/0/45/0]s
Table 3. Ply sequences of the different regions for the BW-II composite beams.
RegionPly Sequence
Top flange[45/45/0/0/45/0/0/45/0/45/0]s
Bottom flange[45/45/0/0/45/0/0/45/0/45/0]s
Peripheral web region[45/45/0/0/45/0/0/45/0/45/0]s
Middle examination web region[45/0/0/45/0]s
Reinforcement region[45/0/0/45/0/0/0/45/45/0/45/0/0/45/0/45/0/45]
Table 4. Experimental results of the failure load and critical buckling load—The PWF composite beams of BW-I.
SpecimenExperimental Failure Load (kN)Average Value (kN)Experimental Critical Buckling Load (kN)Average Value (kN)
BW-I-0168.063.836.936.9
BW-I-0261.637.7
BW-I-0361.736.1
Table 5. Experimental results of the failure load and critical buckling load—the PWF composite beams of BW-II.
SpecimenExperimental Failure Load (kN)Average Value (kN)Experimental Critical Buckling Load (kN)Average Value (kN)
BW-II-0162.159.237.536.8
BW-II-0257.936.5
BW-II-0358.636.5
Table 6. The geometric parameters of the meso-scale FE model for the T300/Epoxy PWF composite.
Geometric ParameterValue
Width of the fiber tows’ cross-section, a (mm)1.82
Thickness of the fiber tows’ cross-section, b (mm)0.13
Radius of the arcs in the simplified undulation path of the fiber tows, rU (mm)7.18
Length of the PWF composite’s meso-scale FE model, LRUC (mm)4.00
Width of the PWF composite’s meso-scale FE model, WRUC (mm)4.00
Thickness of the PWF composite’s meso-scale FE model, TRUC (mm)0.28
Table 7. The volume fraction parameters of the T300/Epoxy PWF composite.
ParameterValue
Total fiber volume fraction, VfT0.56
Fiber volume fraction in tows, Vf0.78
Volume fraction of tows, Vt0.72
Table 8. Mechanical properties of the fiber and matrix constituents in the T300/Epoxy composite.
ConstituentMaterial PropertyValue
T300 fiberLongitudinal modulus of the fiber, Ef11 (GPa)230.00
Transverse modulus of the fiber, Ef22 = Ef33 (GPa)14.00
In-plane shear modulus of the fiber, Gf12 (GPa)94.00
Out-of-plane shear modulus of the fiber, Gf13 (GPa)94.00
Out-of-plane shear modulus of the fiber, Gf23 (GPa)5.20
In-plane Poisson’s ratio of the fiber, ,   ν f 12 0.26
Out-of-plane Poisson’s ratio of the fiber, ν f 13 0.26
Out-of-plane Poisson’s ratio of the fiber, ν f 23 0.34
Longitudinal coefficient of thermal expansion of the fiber, α 11 (10−6/K)−0.54
Transverse coefficient of thermal expansion of the fiber, α 22 = α 33 (10−6/K)10.50
Epoxy matrixElastic modulus of the matrix, Em (GPa)3.35
Elastic Poisson’s ratio of the matrix, ν m 0.35
Coefficient of thermal expansion of the matrix, α m (10−6/K)58.00
Table 9. Mechanical properties of the fiber tows in the meso-scale FE model of the T300/Epoxy PWF composite.
PropertyValue
Longitudinal modulus of the fiber tows, E11(tow) (GPa)174.67
Transverse modulus of the fiber tows, E22(tow) = E33(tow) (GPa) 9.51
In-plane shear modulus of the fiber tows, G12(tow) (GPa)8.52
Out-of-plane shear modulus of the fiber tows, G13(tow) (GPa)8.28
Out-of-plane shear modulus of the fiber tows, G23(tow) (GPa)3.39
In-plane Poisson’s ratio of the fiber tows, ν 12 t o w 0.28
Out-of-plane Poisson’s ratio of the fiber tows, ν 13 t o w 0.28
Out-of-plane Poisson’s ratio of the fiber tows, ν 23 t o w 0.41
Longitudinal coefficient of thermal expansion of the fiber tows, α 11 t o w (10−6/K)−0.22
Transverse coefficient of thermal expansion of the fiber tows, α 22 t o w = α 33 t o w (10−6/K)24.91
Table 10. The MMF-based criteria for the micro-scale failure determination.
Failure TypeFailure Criterion
Fiber failure σ 11 T f   or   σ 11 C f
Matrix failure 1 T m 1 C m I 1 + 1 T m C m σ V M 2 1
Table 11. Micro-scale strengths of the T300/Epoxy PWF composite.
Micro-Scale StrengthValue
Tensile strength of fiber, Tf (MPa)3526.3
Compressive strength of fiber, Cf (MPa)2942.9
Tensile strength of matrix, Tm (MPa)126.6
Compressive strength of matrix, Cm (MPa)238.3
Table 12. Mechanical properties of the fiber and matrix constituents in the T300/Epoxy composite after the initiation of the microscale damage.
ConstituentMaterial PropertyValue
T300 fiberLongitudinal modulus of the fiber after damage, Ef11* (GPa)2.30
Transverse modulus of the fiber after damage, Ef22* = Ef33 (GPa)14.00
In-plane shear modulus of the fiber after damage, Gf12* (GPa)0.94
Out-of-plane shear modulus of the fiber after damage, Gf13* (GPa)0.94
Out-of-plane shear modulus of the fiber after damage, Gf23* (GPa)5.20
In-plane Poisson’s ratio of the fiber after damage, ν f 12 *0.0026
Out-of-plane Poisson’s ratio of the fiber after damage, ν f 13 *0.0026
Out-of-plane Poisson’s ratio of the fiber after damage, ν f 23 *0.34
Epoxy matrixElastic modulus of the matrix after damage, Em* (GPa)0.1675
Elastic Poisson’s ratio of the matrix after damage, ν m *0.35
Table 13. Mechanical properties of the fiber tows in the T300/Epoxy composite after the initiation of the constituents’ damage.
Mechanical PropertyParameter and Value
Damage State (a) for the Fiber TowsDamage State (b) for the Fiber TowsDamage State (c) for the Fiber Tows
Longitudinal modulus of the fiber tows after damage E 11 t o w a
2.65 GPa
E 11 t o w b
173.88 GPa
E 11 t o w c
1.78 GPa
Transverse modulus of the fiber tows after damage E 22 t o w a
9.28 GPa
E 22 t o w b
1.27 GPa
E 22 t o w c
1.26 GPa
Transverse modulus of the fiber tows after damage E 33 t o w a
9.28 GPa
E 33 t o w b
1.27 GPa
E 33 t o w c
1.26 GPa
In-plane shear modulus of the fiber tows after damage G 12 t o w a
1.74 GPa
G 12 t o w b
0.81 GPa
G 12 t o w c
0.54 GPa
Out-of-plane shear modulus of the fiber tows after damage G 13 t o w a
1.01 GPa
G 13 t o w b
0.45 GPa
G 13 t o w c
0.31 GPa
Out-of-plane shear modulus of the fiber tows after damage G 23 t o w a
3.38 GPa
G 23 t o w b
0.46 GPa
G 23 t o w c
0.46 GPa
In-plane Poisson’s ratio of the fiber tows after damage ν 12 t o w a
0.077
ν 12 t o w b
0.28
ν 12 t o w c
0.068
Out-of-plane Poisson’s ratio of the fiber tows after damage ν 13 t o w a
0.077
ν 13 t o w b
0.28
ν 13 t o w c
0.068
Out-of-plane Poisson’s ratio of the fiber tows after damage ν 23 t o w a
0.37
ν 23 t o w b
0.37
ν 23 t o w c
0.37
Table 14. Macro-scale mechanical properties of the T300/Epoxy PWF composite after the damage initiation.
Macro-Scale Mechanical Property Parameter and Value
Damage State (a) for the Fiber TowsDamage State (b) for the Fiber TowsDamage State (c) for the Fiber Tows
Longitudinal modulus after damagePure matrix region remains intact E 11 P W F a 1
4.71 GPa
E 11 P W F b 1
49.82 GPa
E 11 P W F c 1
2.31 GPa
Transverse modulus after damage E 22 P W F a 1
4.71 GPa
E 22 P W F b 1
49.82 GPa
E 22 P W F c 1
2.31 GPa
In-plane Poisson’s ratio after damage ν 12 P W F a 1
0.22
ν 12 P W F b 1
0.012
ν 12 P W F c 1
0.23
In-plane shear modulus after damage G 12 P W F a 1
1.52 GPa
G 12 P W F b 1
0.99 GPa
G 12 P W F c 1
0.82 GPa
Longitudinal modulus after damagePure matrix region damaged E 11 P W F a 2
2.11 GPa
E 11 P W F b 2
47.17 GPa
E 11 P W F c 2
0.89 GPa
Transverse modulus after damage E 22 P W F a 2
2.11 GPa
E 22 P W F b 2
47.17 GPa
E 22 P W F c 2
0.89 GPa
In-plane Poisson’s ratio after damage ν 12 P W F a 2
0.12
ν 12 P W F b 2
0.011
ν 12 P W F c 2
0.093
In-plane shear modulus after damage G 12 P W F a 2
0.75 GPa
G 12 P W F b 2
0.40 GPa
G 12 P W F c 2
0.28 GPa
Table 15. The critical buckling loads and the collapse loads of the BW-I~III models form the FE analysis.
FE Model of the PWF
Composite Beams
The Calculated Critical
Buckling Load (kN)
The Calculated Collapse Load (kN)
BW-I38.065.2
BW-III33.848.8
BW-II37.259.8
Publisher’s Note: MDPI stays neutral with regard to jurisdictional claims in published maps and institutional affiliations.

