
Radiation Risks in Cis-Lunar Space for a Solar Particle Event Similar to the February 1956 Event


Abstract
:1. Introduction
2. Computational Methods
3. Results and Discussion
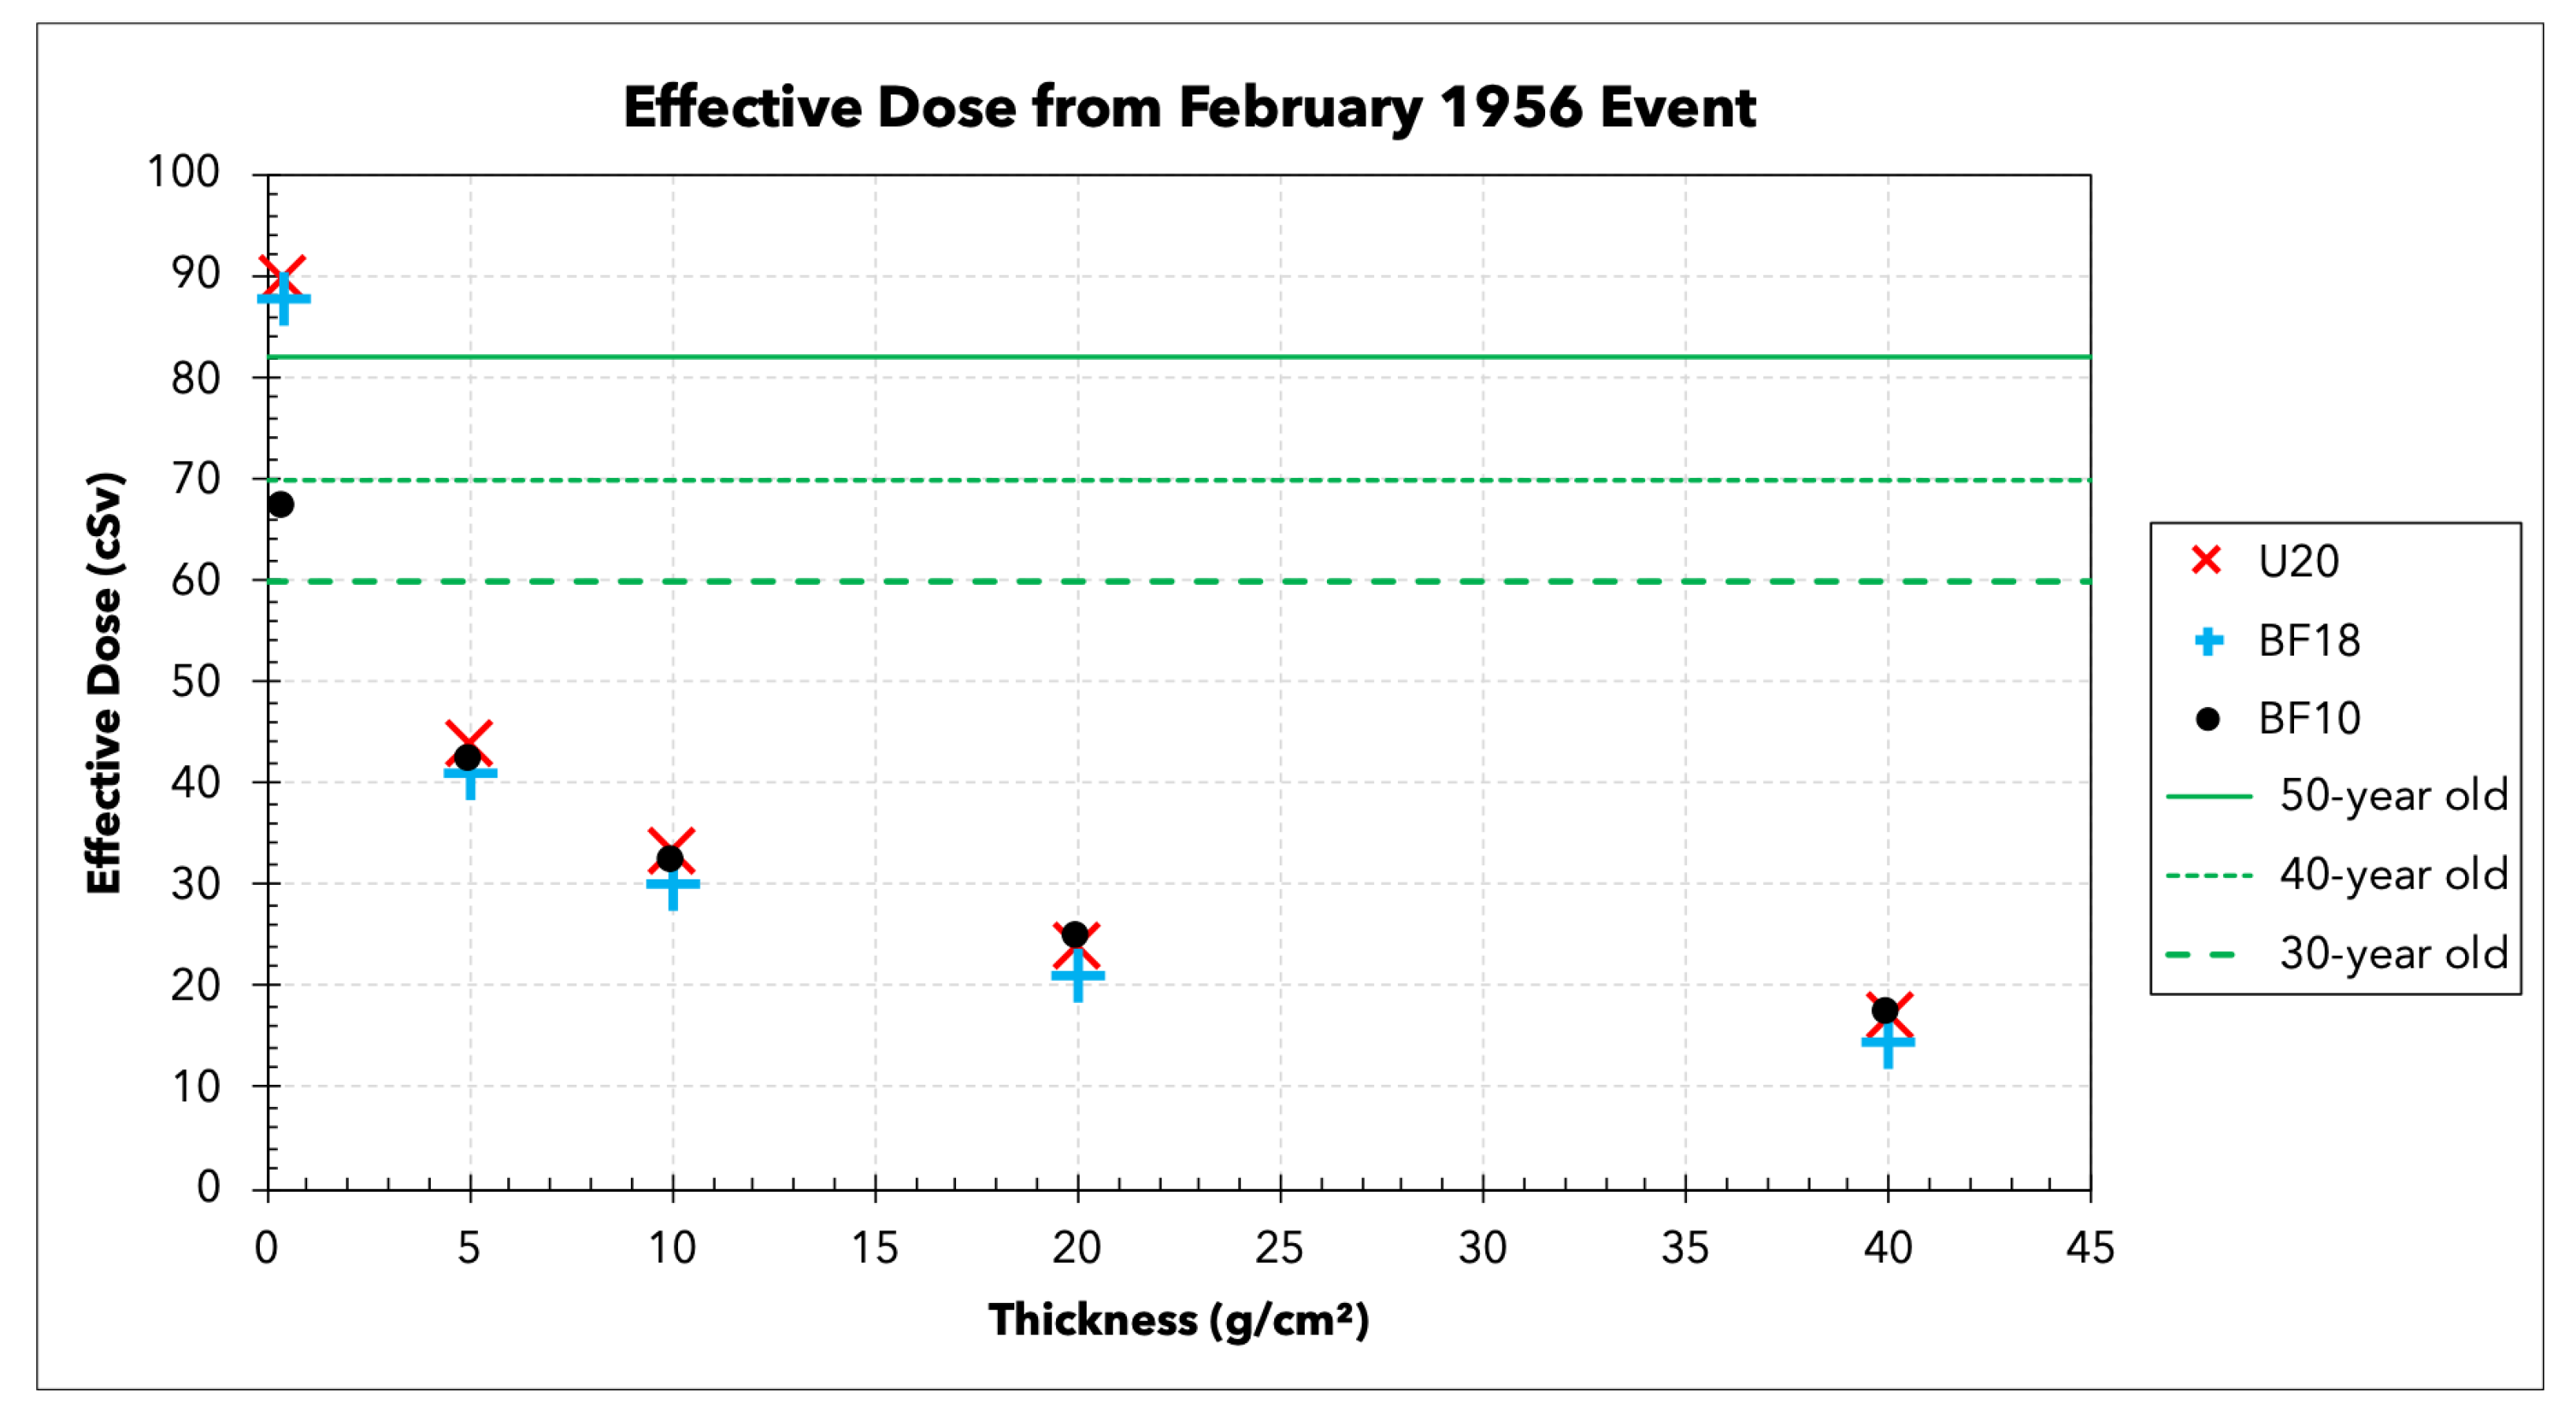
3.1. Effective Dose
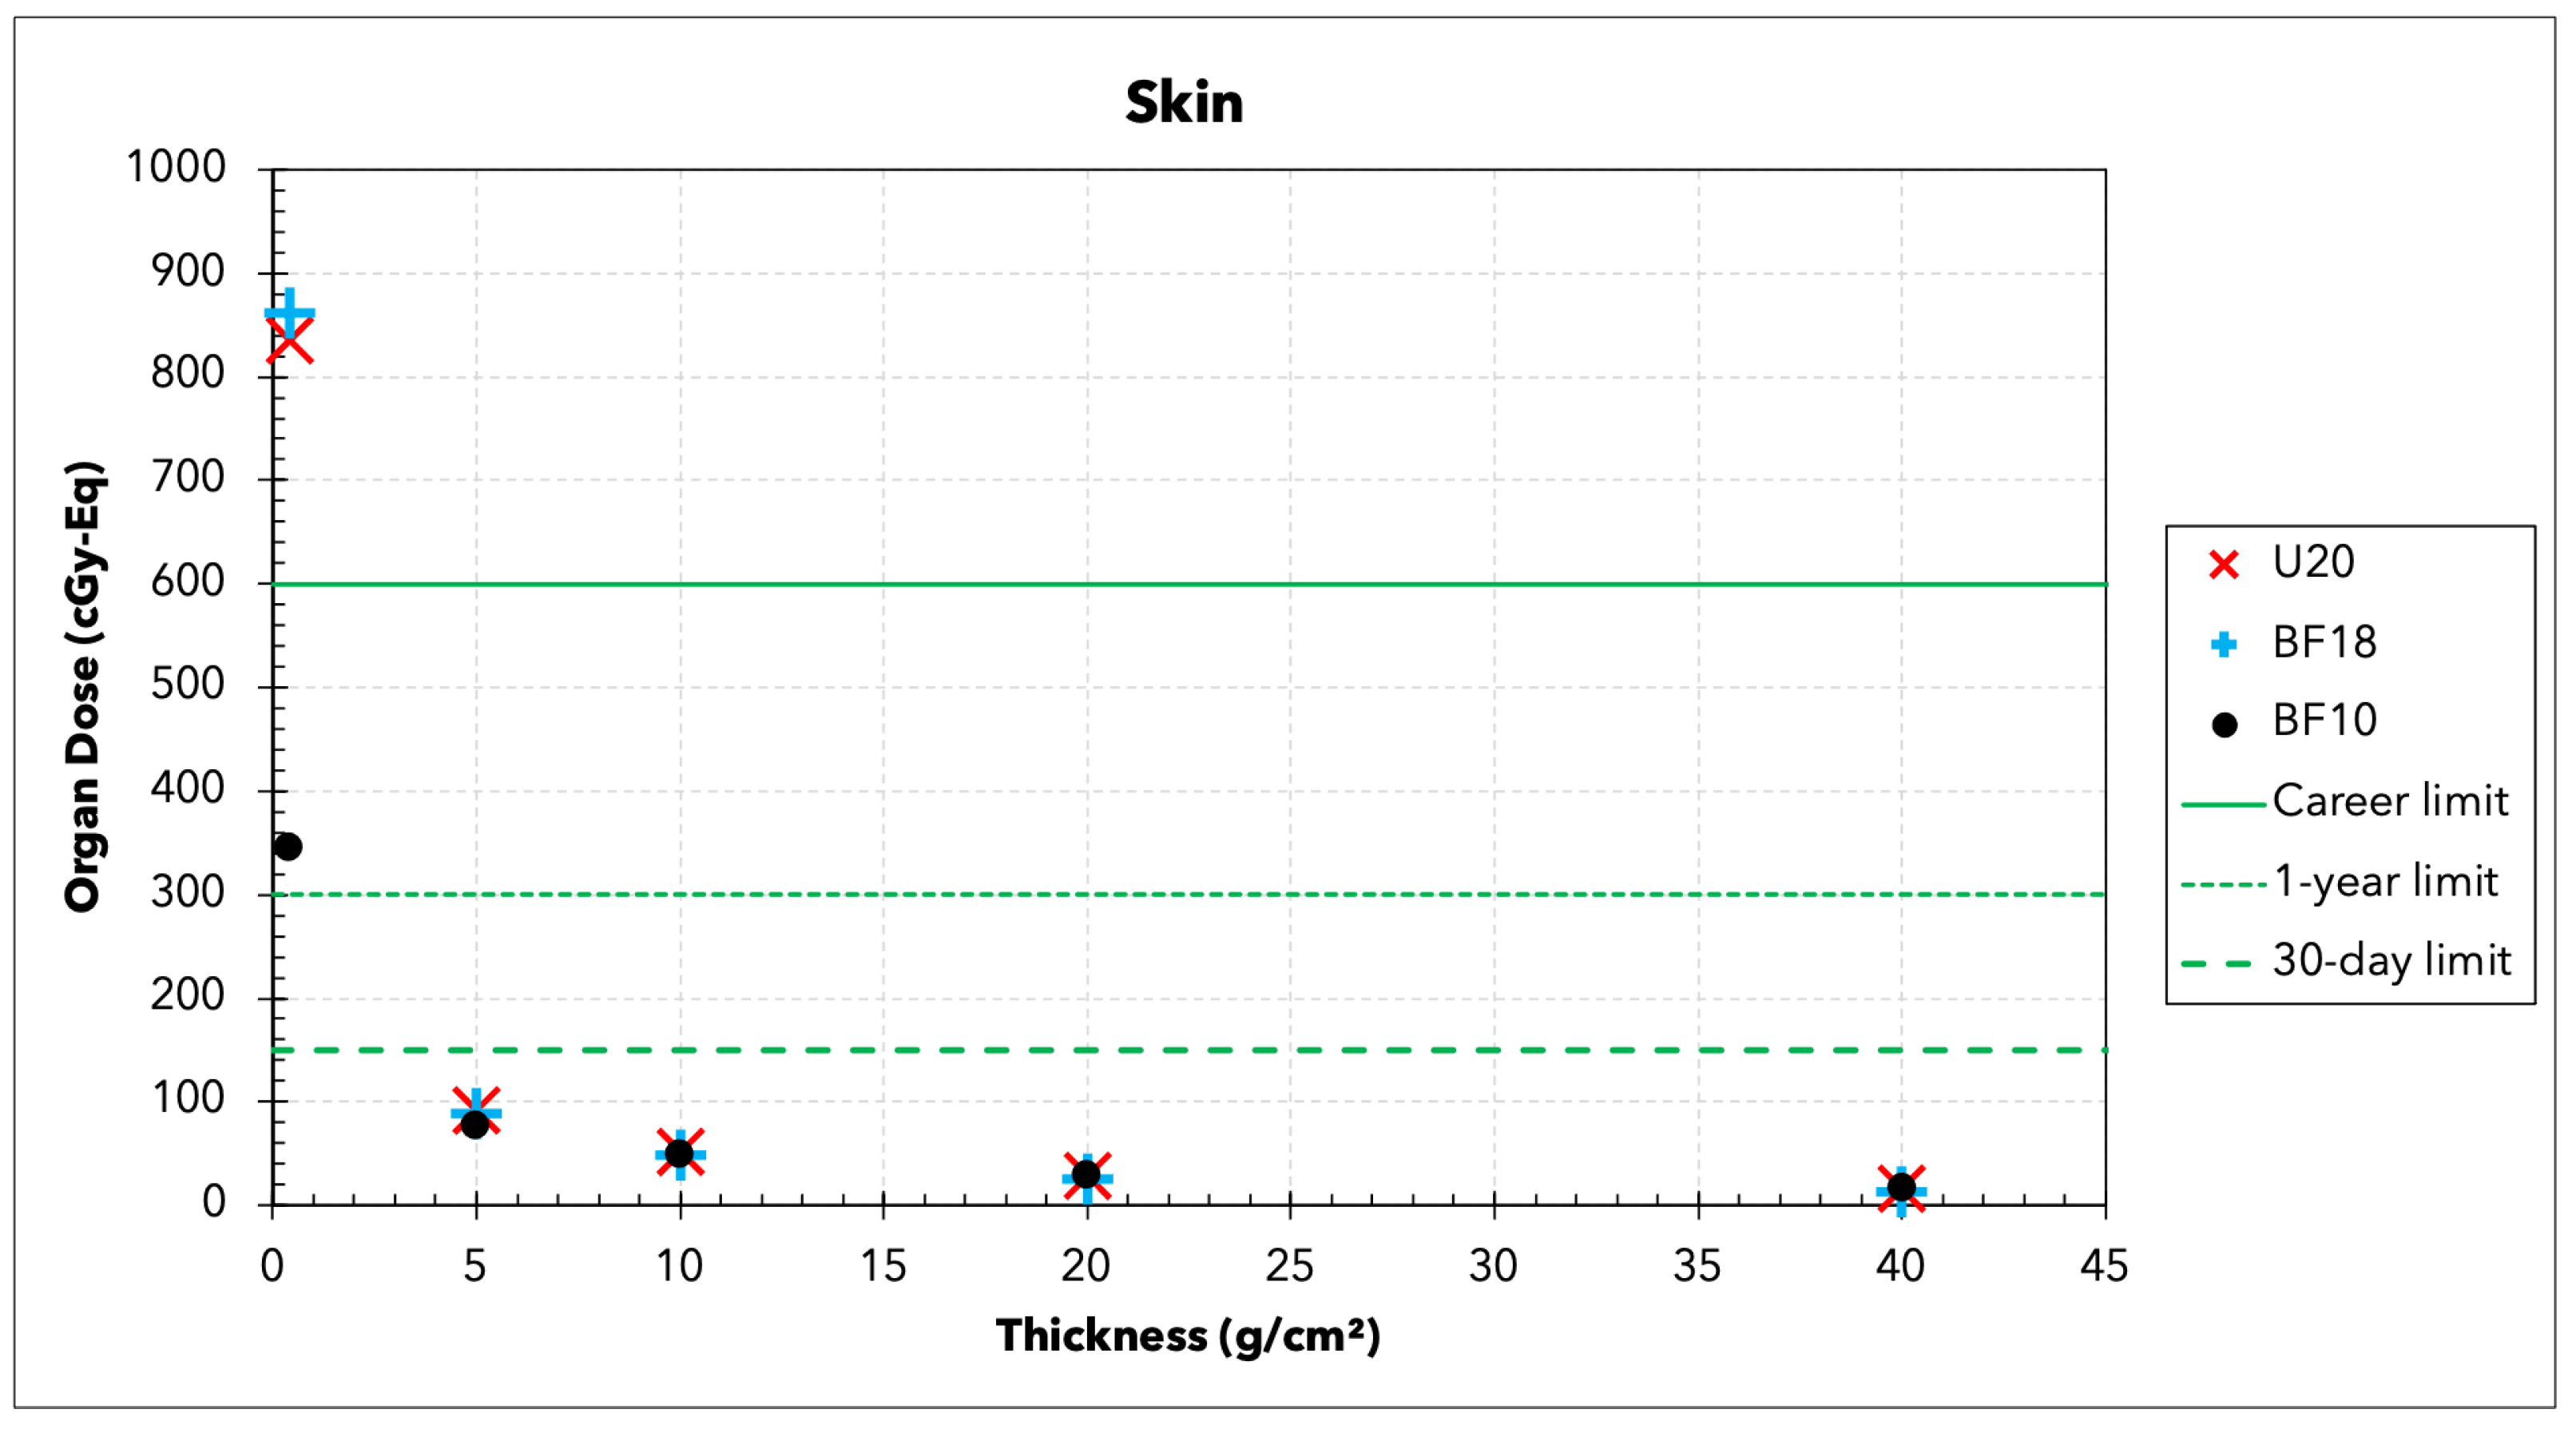
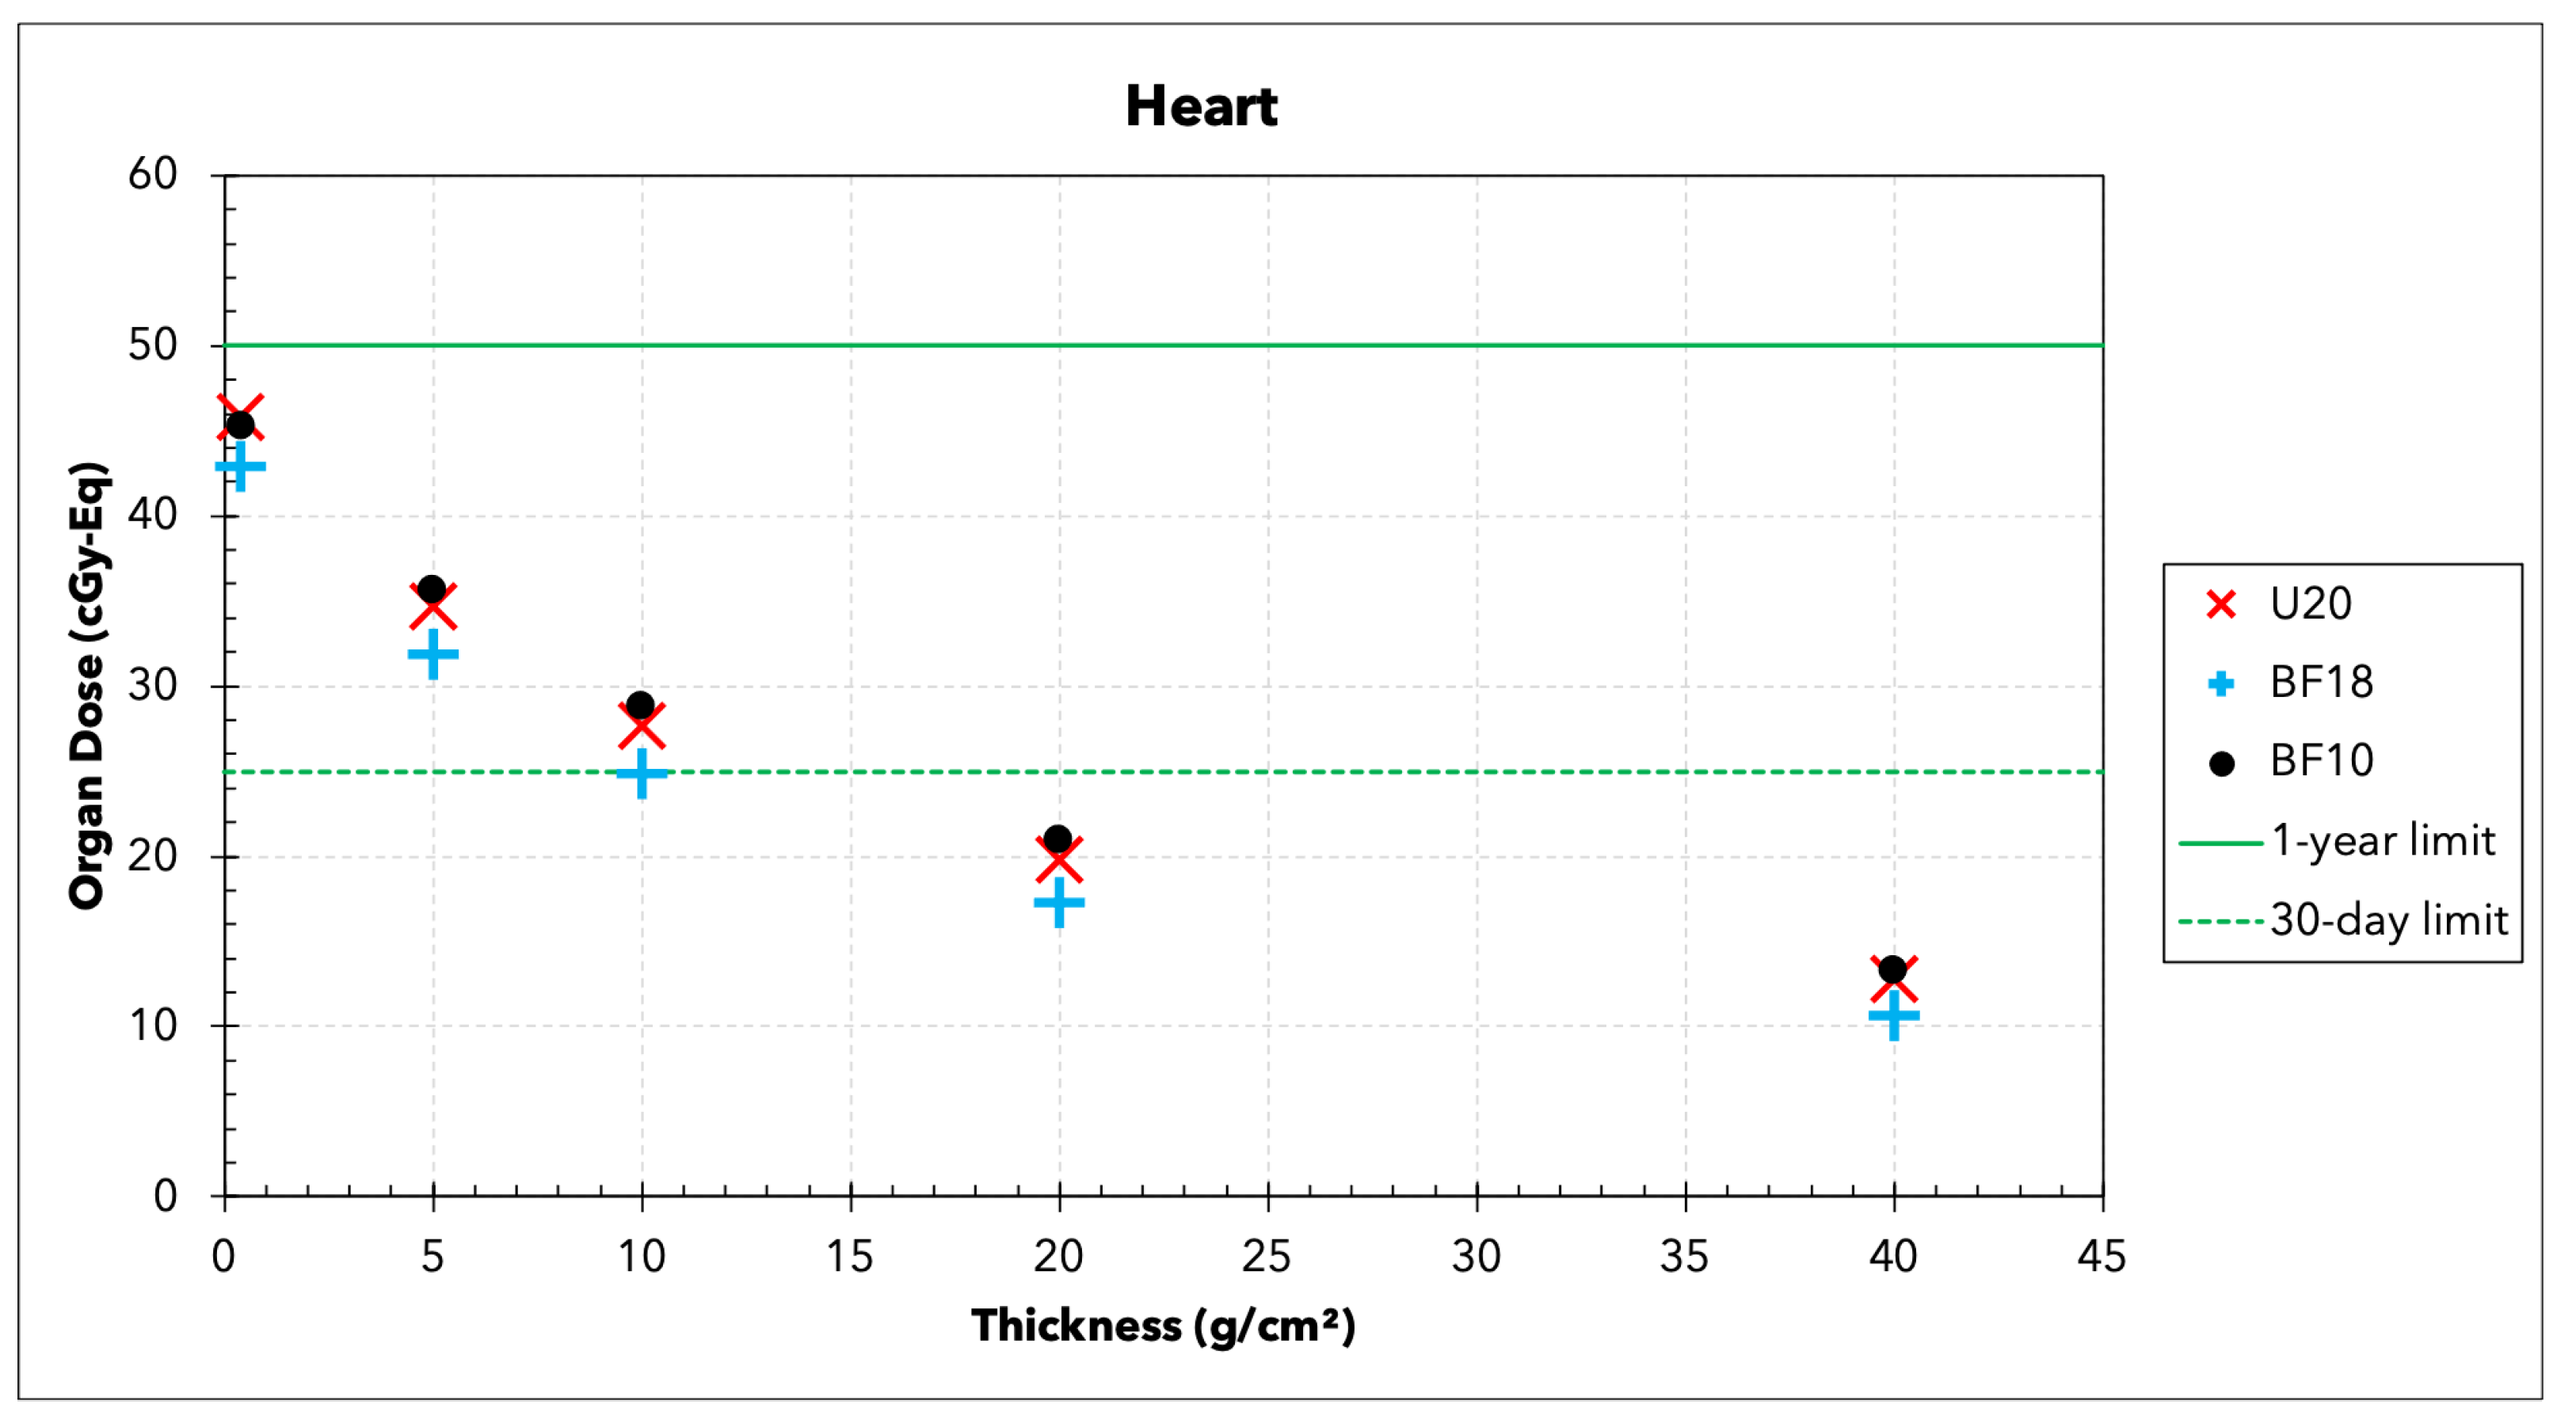
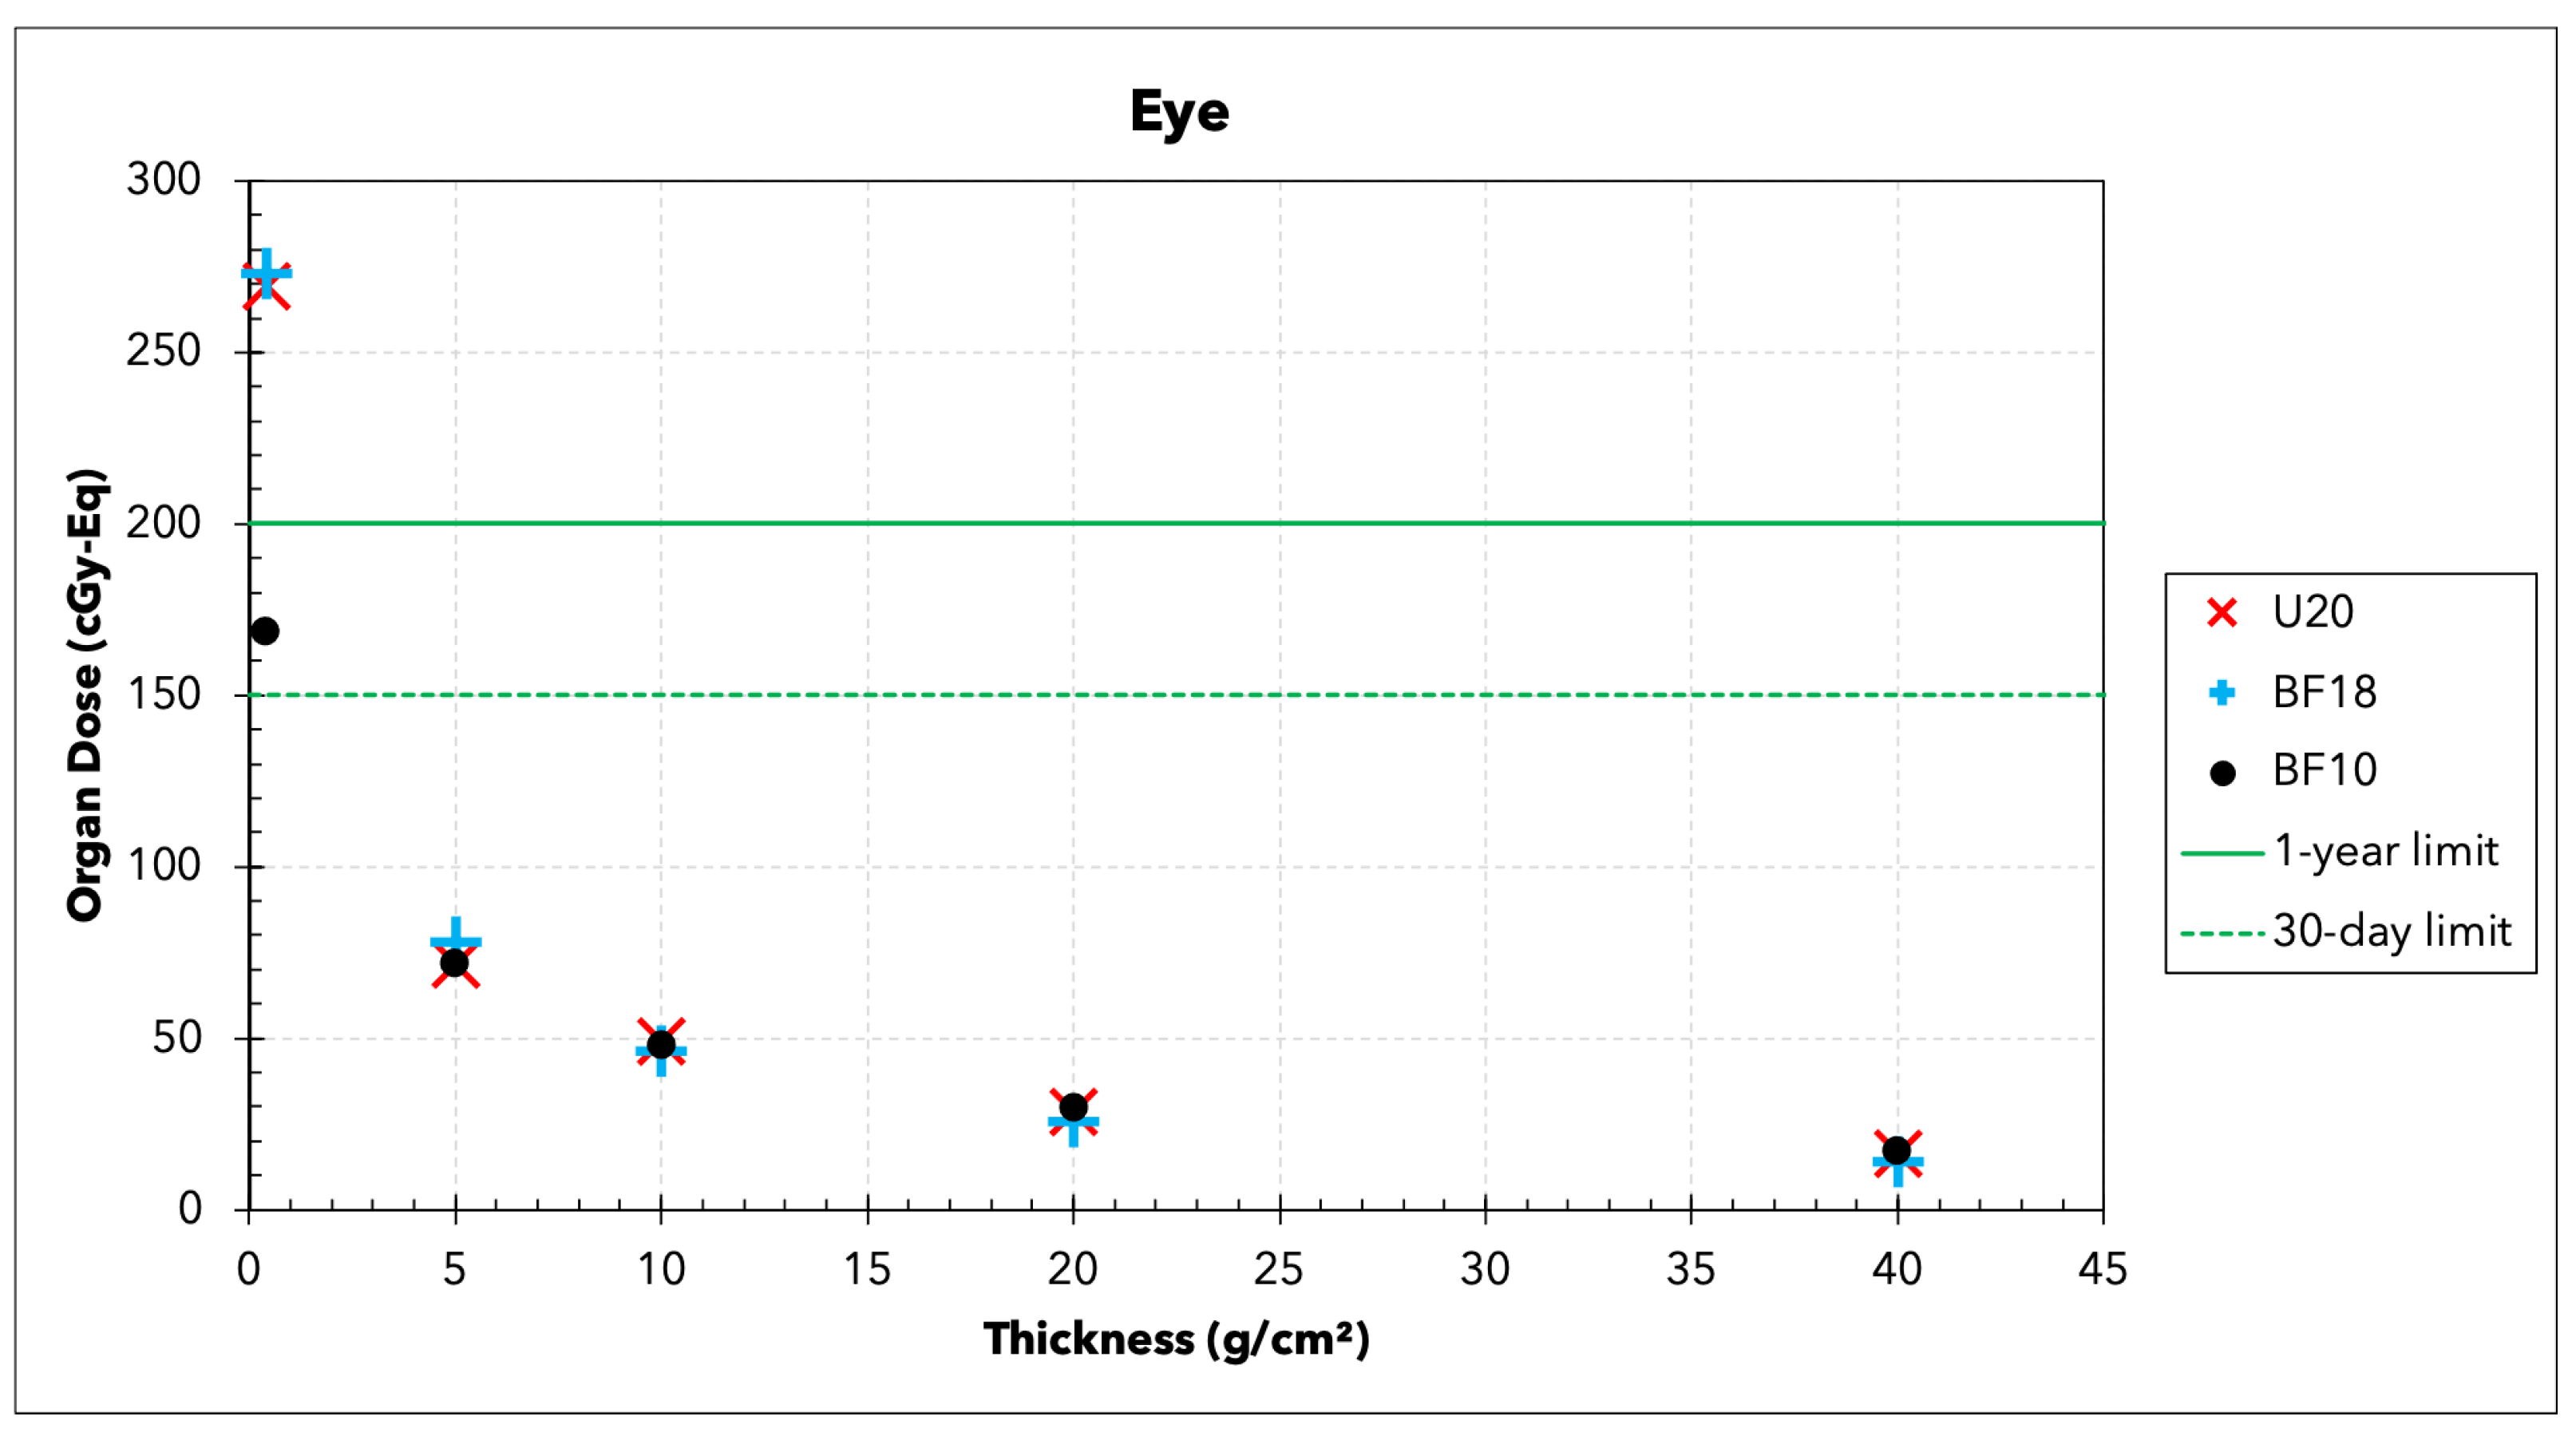
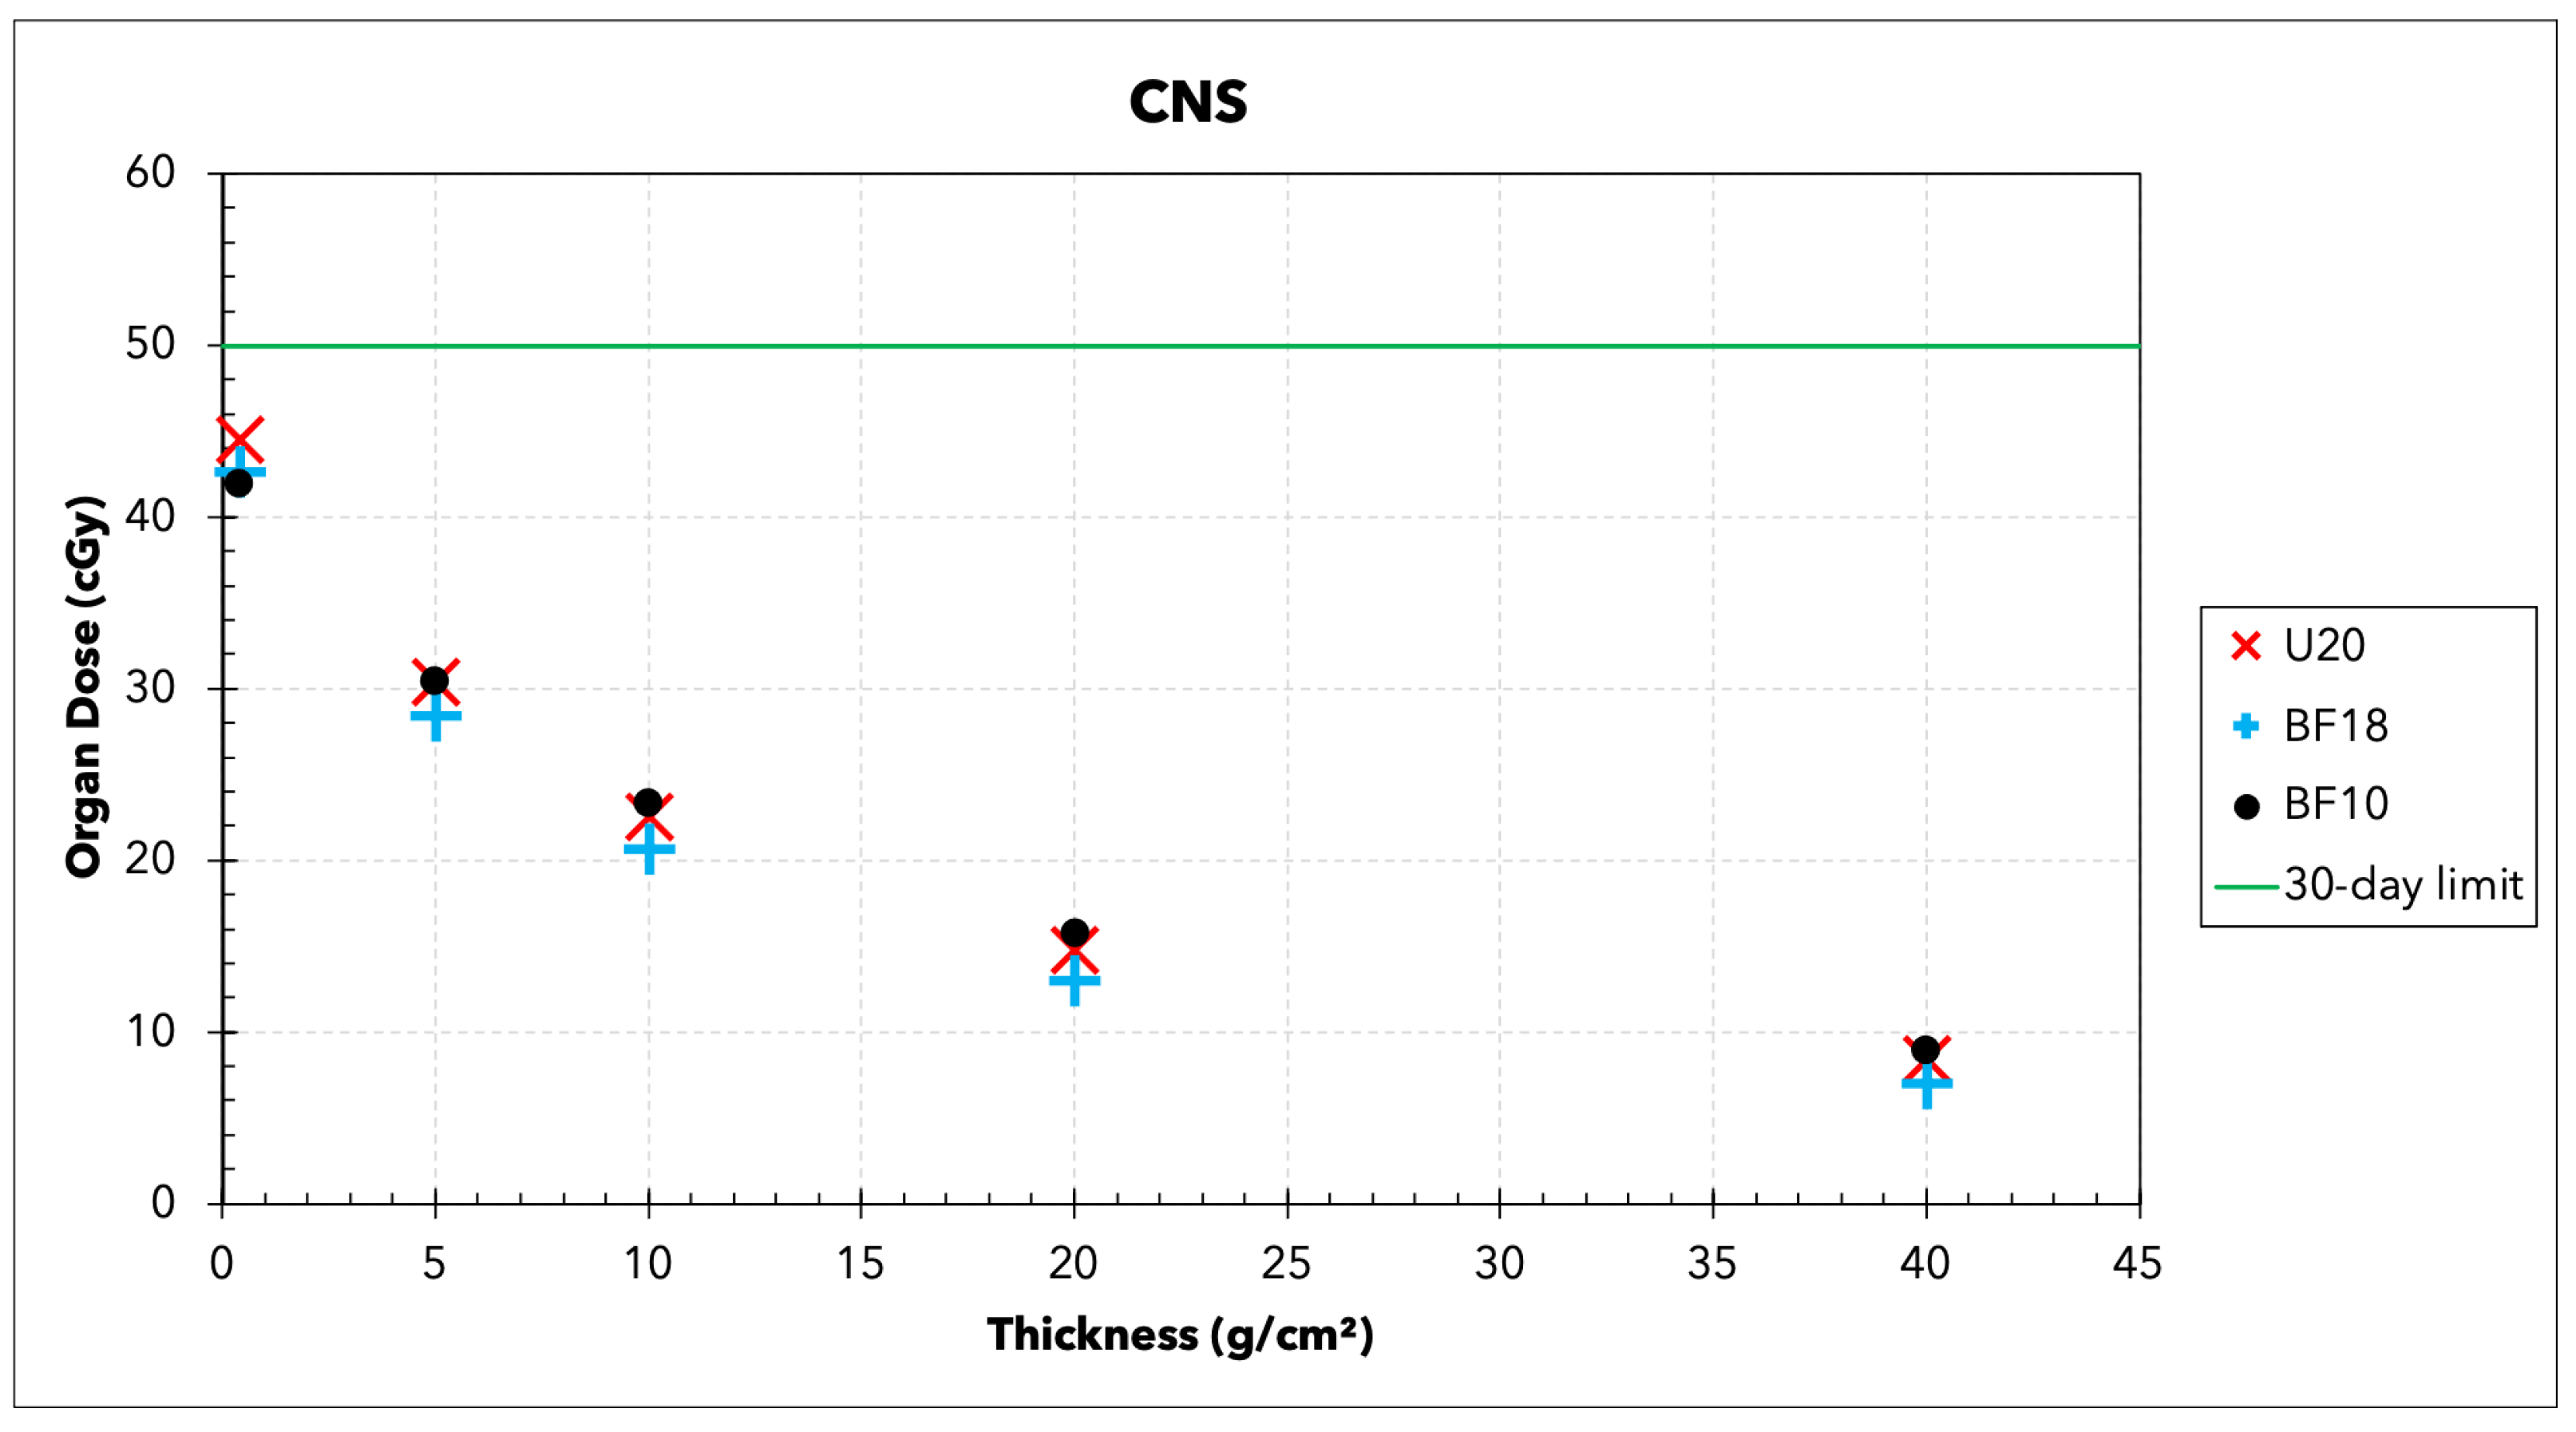
3.2. Organ Doses
4. Conclusions and Future Work
Author Contributions
Funding
Institutional Review Board Statement
Informed Consent Statement
Data Availability Statement
Conflicts of Interest
References
- Rishbeth, H.; Shea, M.; Smart, D. The solar-terrestrial event of 23 February 1956. Adv. Space Res. 2009, 44, 1096–1106. [Google Scholar] [CrossRef]
- Meyer, P.; Parker, E.; Simpson, J. Solar Cosmic Rays of February, 1956 and Their Propagation through Interplanetary Space. Phys. Rev. 1956, 104, 768–783. [Google Scholar] [CrossRef]
- Schaefer, H. Extra-Atmospheric Cosmic Ray Dosage During the Large Solar Flare of 23 February 1956. Sci. Am. Assoc. Adv. Sci. 1958, 127, 186–187. [Google Scholar] [CrossRef] [PubMed]
- Townsend, L.; Wilson, J.; Shinn, J.; Curtis, S. Human exposure to large solar particle events in space. Adv. Space Res. 1992, 12, 339–348. [Google Scholar] [CrossRef]
- Townsend, L.; Cucinotta, F.; Shinn, J.; Wilson, J. Risk Analyses for the Solar Particle Events of August through December 1989. Radiat. Res. 1992, 130, 1–6. [Google Scholar] [CrossRef] [PubMed]
- McCracken, K.; Dreschhoff, G.; Zeller, E.; Smart, D.; Shea, M. Solar cosmic ray events for the period 1561–1994: 1. Identification in polar ice, 1561–1950. J. Geophys. Res. Space Phys. 2001, 106, 21585–21598. [Google Scholar] [CrossRef] [Green Version]
- Miyake, F.; Nagaya, K.; Masuda, K.; Nakamura, T. A signature of cosmic-ray increase in AD 774-775 from tree rings in Japan. Nature 2012, 486, 240–242. [Google Scholar] [CrossRef] [PubMed]
- Usoskin, I.; Kovaltsov, G. Occurrence of extreme solar particle events: Assessment from historical proxy data. Astrophys. J. 2012, 757, 92. [Google Scholar] [CrossRef] [Green Version]
- O’Hare, P.; Mekhaldi, F.; Adolphi, F.; Raisbeck, G.; Aldahan, A.; Anderberg, E.; Beer, J.; Christl, M.; Fahrni, S.; Synal, H.; et al. Multiradionuclide evidence for an extreme solar proton event around 2610 B.P. (around 660 BC). Proc. Natl. Acad. Sci. USA 2019, 116, 5961–5966. [Google Scholar] [CrossRef] [PubMed] [Green Version]
- Wolff, E.; Bigler, M.; Curran, M.; Dibb, J.; Frey, M.; Legrand, M.; McConnell, J. The Carrington event not observed in most ice core nitrate records: Ice core nitrate and Carrington event. Geophys. Res. Lett. 2012, 39, 8. [Google Scholar] [CrossRef] [Green Version]
- Usoskin, I. A History of Solar Activity over Millennia. Living Rev. Sol. Phys. 2013, 10, 1. [Google Scholar] [CrossRef] [Green Version]
- Cliver, E.; Hayakawa, H.; Love, J.; Neidig, D. On the Size of the Flare Associated with the Solar Proton Event in 774 AD. Astrophys. J. 2020, 903, 1. [Google Scholar] [CrossRef]
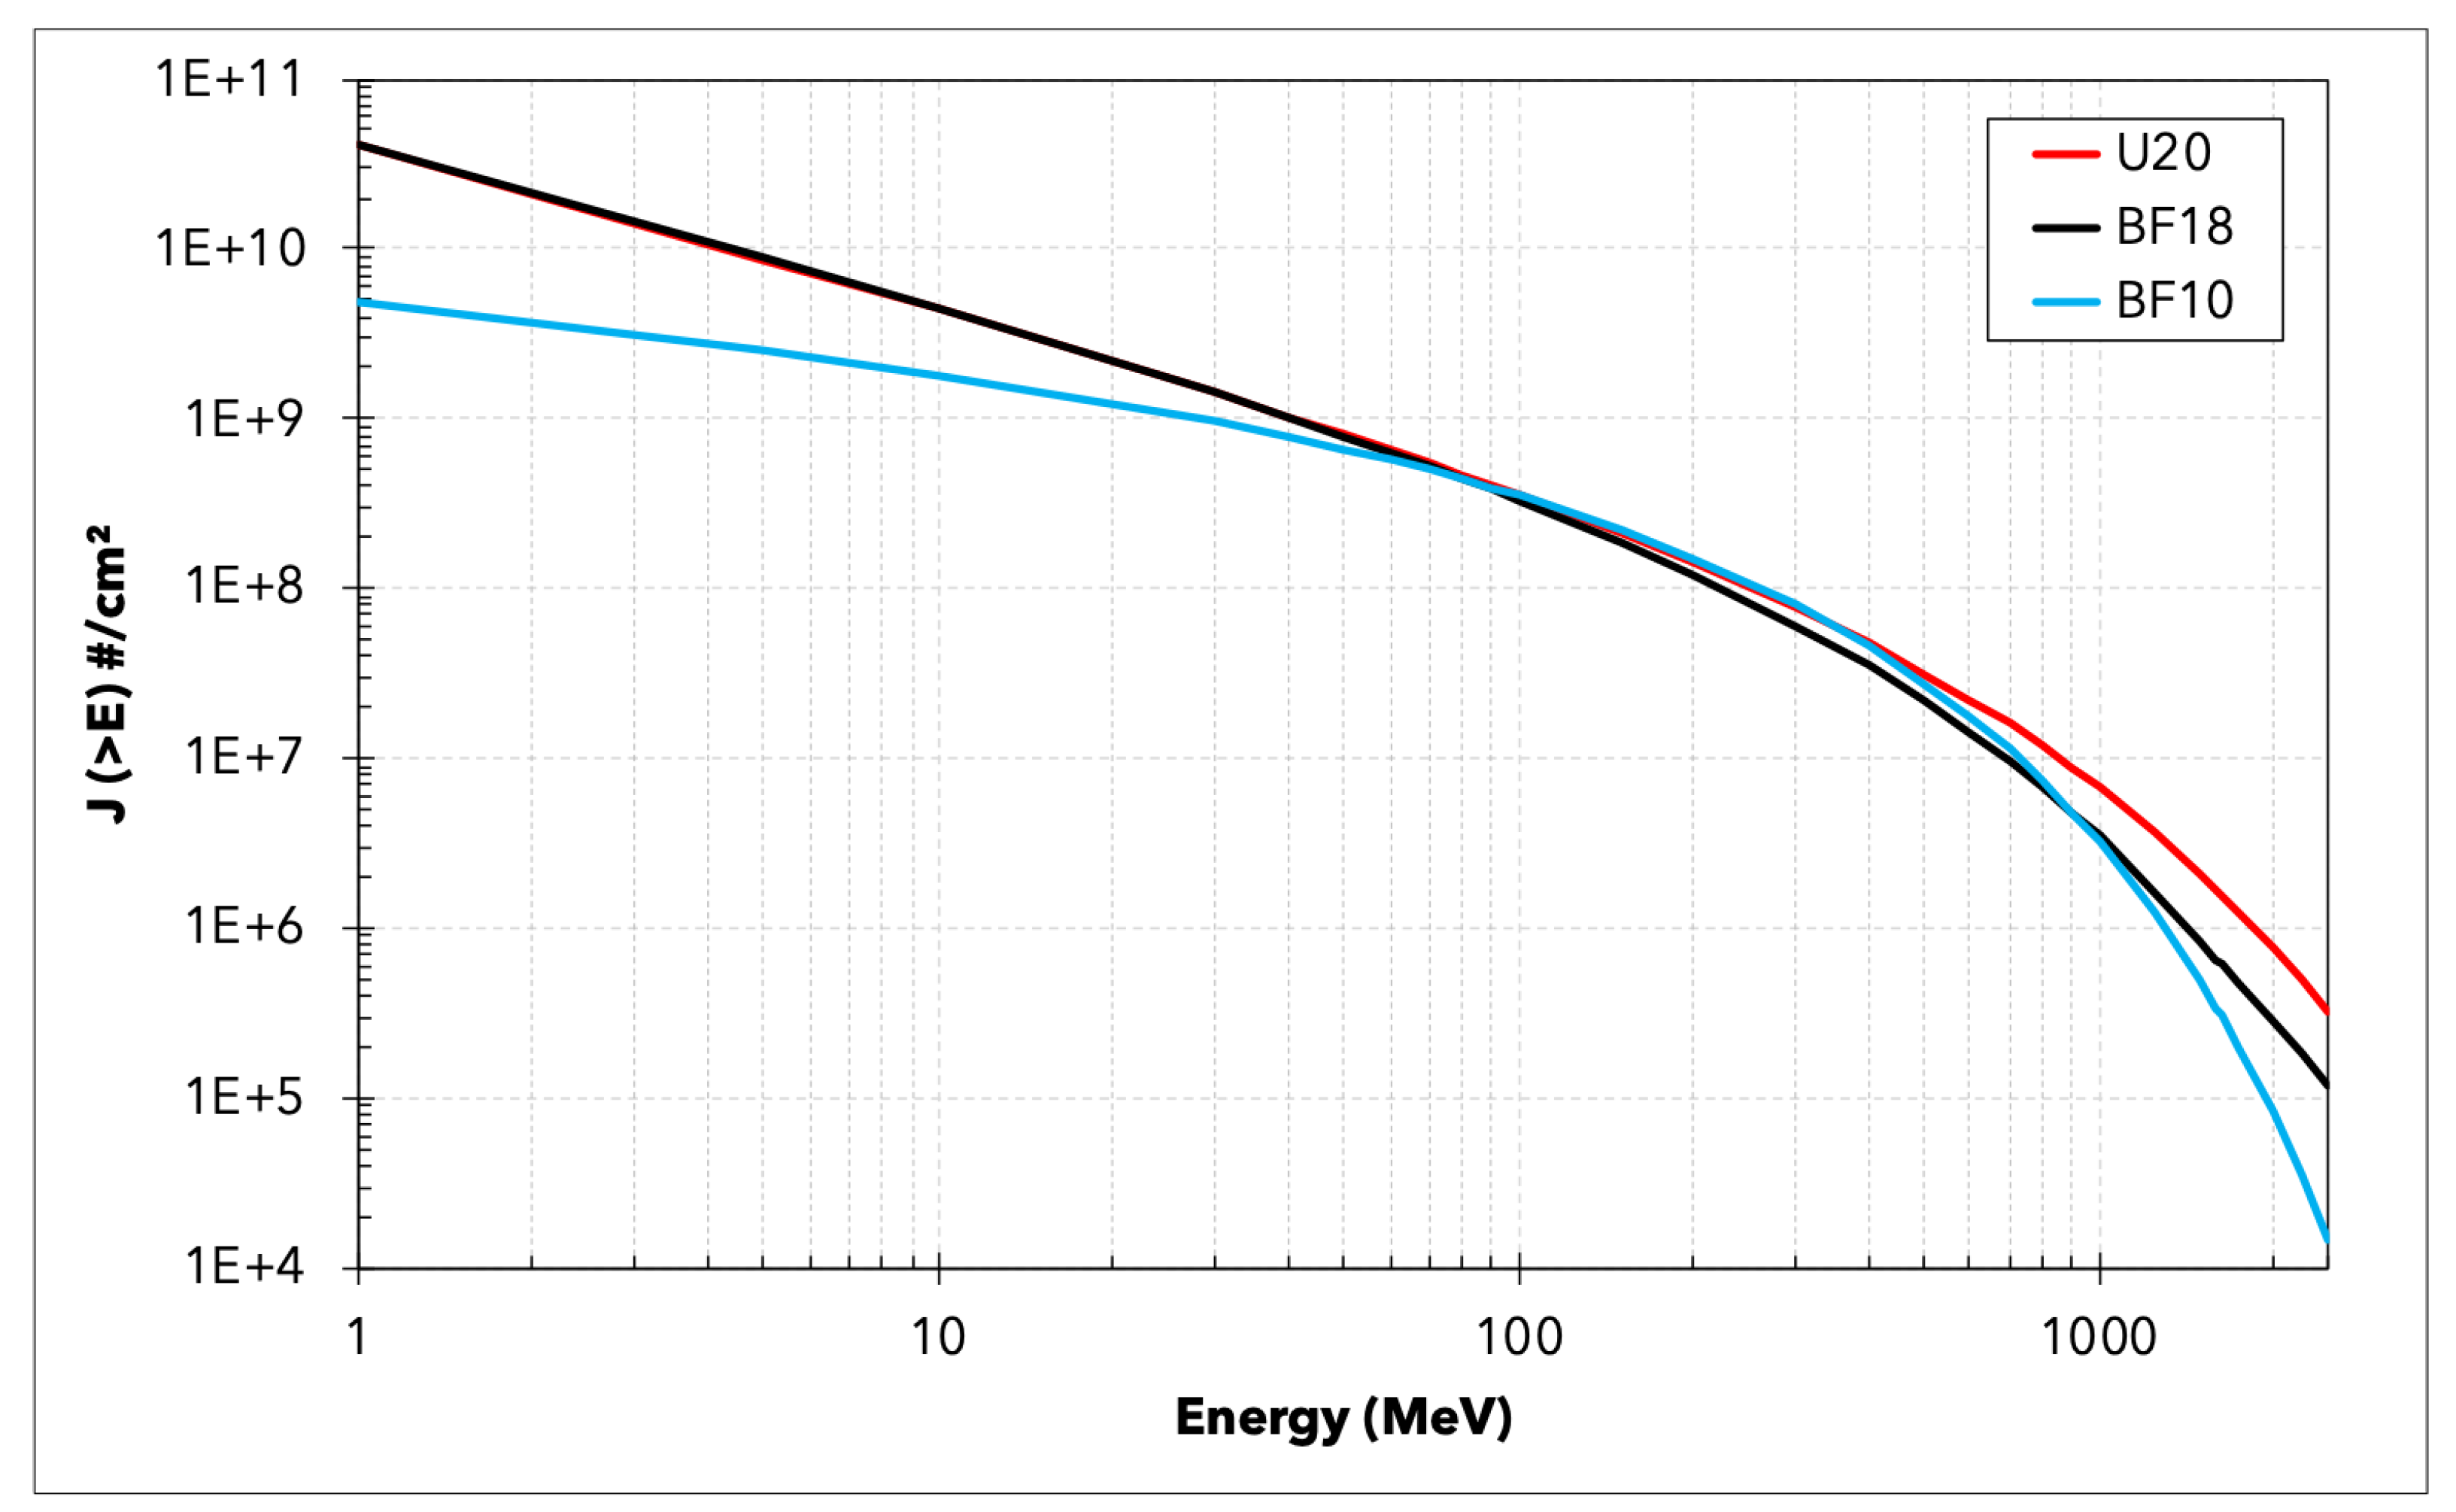
- Tylka, A.J.; Dietrich, W.; Atwell, W. Band function representations of solar proton spectra in ground-level events. 38th COSPAR Sci. Assem. 2010, 38, 4. [Google Scholar]
- Usoskin, I.; Kromer, B.; Ludlow, F.; Beer, J.; Friedrich, M.; Kovaltsov, G.; Solanki, S.; Wacker, L. The AD775 cosmic event revisited: The Sun is to blame. Astron. Astrophys. 2013, 552, L3. [Google Scholar] [CrossRef]
- Townsend, L.; Porter, J.; de Wet, W.; Smith, W.; McGirl, N.; Heilbronn, L.; Moussa, H. Extreme solar event of AD775: Potential radiation exposure to crews in deep space. Acta Astronaut. 2016, 123, 116–120. [Google Scholar] [CrossRef]
- Raukunen, O.; Vainio, R.; Tylka, A.; Dietrich, W.; Jiggens, P.; Heynderickx, D.; Dierckxsens, M.; Crosby, N.; Ganse, U.; Siipola, R. Two solar proton fluence models based on ground level enhancement observations. J. Space Weather Space Clim. 2018, 8, A04. [Google Scholar] [CrossRef] [Green Version]
- Usoskin, I.; Koldobskiy, S.; Kovaltsov, G.; Rozanov, E.; Sukhodolov, T.; Mishev, A.; Mironova, I. Revisited reference solar proton event of 23 February 1956: Assessment of the cosmogenic-isotope method sensitivity to extreme solar events. J. Geophys. Res. Space Phys. 2020, 125, e2020JA027921. [Google Scholar] [CrossRef]
- Cucinotta, F.; Schimmerling, W.; Wilson, J.; Peterson, L.; Badhwar, G.; Saganti, P.; Dicello, F. Space Radiation Cancer Risks and Uncertainties for Mars Missions. Radiat. Res. 2001, 156, 682–688. [Google Scholar] [CrossRef]
- NASA. 1:Crew Health. In NASA Space Flight Human-System Standard Volume 1, Revision A; National Aeronautics and Space Administration: Washington, DC, USA, 2014. [Google Scholar]
- Koldobskiy, S.; Raukunen, O.; Vainio, R.; Kovaltsov, G.; Usoskin, I. New reconstruction of event-integrated spectra (spectral fluences) for major solar energetic particle events. Astron. Astrophys. 2021, 647, A132. [Google Scholar] [CrossRef]
- Herbst, K.; Papaioannou, A.; Banjac, S.; Heber, B. From solar to stellar flare characteristics-On a new peak size distribution for G-, K-, and M-dwarf star flares. Astron. Astrophys. 2019, 621, A67. [Google Scholar] [CrossRef] [Green Version]


| Band Function | (#/cm) | (GV) | ||
|---|---|---|---|---|
| BF10 | 8.79 × 10 | 3.21 × 10 | 0.584 | 5.040 |
| BF18 | 1.75 × 10 | 5.66 × 10 | 1.760 | 0.566 |
| Age (Year) | Effective Dose Limit (cSv) |
|---|---|
| 30 | 60 |
| 40 | 70 |
| 50 | 82 |
| 60 | 98 |
| Organ | 30-Day | 1-Year | Career |
|---|---|---|---|
| Skin (cGy-Eq) | 150 | 300 | 600 |
| Heart (cGy-Eq) | 25 | 50 | 100 |
| Lens (cGy-Eq) | 100 | 200 | 400 |
| BFO (cGy-Eq) | 25 | 50 | N/A |
| CNS * (cGy) | 50 | 100 | 150 |
Publisher’s Note: MDPI stays neutral with regard to jurisdictional claims in published maps and institutional affiliations. |
© 2021 by the authors. Licensee MDPI, Basel, Switzerland. This article is an open access article distributed under the terms and conditions of the Creative Commons Attribution (CC BY) license (https://creativecommons.org/licenses/by/4.0/).
Share and Cite
Zaman, F.A.; Townsend, L.W. Radiation Risks in Cis-Lunar Space for a Solar Particle Event Similar to the February 1956 Event. Aerospace 2021, 8, 107. https://doi.org/10.3390/aerospace8040107
Zaman FA, Townsend LW. Radiation Risks in Cis-Lunar Space for a Solar Particle Event Similar to the February 1956 Event. Aerospace. 2021; 8(4):107. https://doi.org/10.3390/aerospace8040107
Chicago/Turabian StyleZaman, Fahad A., and Lawrence W. Townsend. 2021. "Radiation Risks in Cis-Lunar Space for a Solar Particle Event Similar to the February 1956 Event" Aerospace 8, no. 4: 107. https://doi.org/10.3390/aerospace8040107