Article

Human–Machine Interface Design for Monitoring Safety Risks Associated with Operating Small Unmanned Aircraft Systems in Urban Areas

1
German Aerospace Center (DLR), Institute of Flight Guidance, Lilienthalplatz 7, 38108 Braunschweig, Germany
2
Department of Engineering and Traffic Psychology, Institute of Psychology, Technische Universität Braunschweig, Gaußstr. 23, 38106 Braunschweig, Germany
*
Author to whom correspondence should be addressed.
Aerospace 2021, 8(3), 71; https://doi.org/10.3390/aerospace8030071
Submission received: 1 February 2021 / Revised: 18 February 2021 / Accepted: 6 March 2021 / Published: 10 March 2021
(This article belongs to the Collection Unmanned Aerial Systems)

Abstract

:
The envisioned introduction of autonomous Small Unmanned Aircraft Systems (sUAS) into low-altitude urban airspace necessitates high levels of system safety. Despite increased system autonomy, humans will most likely remain an essential component in assuring safety. This paper derives, applies, and evaluates a display design concept that aims to support safety risk monitoring of multiple sUAS by a human operator. The concept comprises of five design principles. The core idea of the concept is to limit display complexity despite increasing the number of sUAS monitored by primarily visualizing highly abstracted information while hiding detailed information of lower abstraction, unless specifically requested by the human operator. States of highly abstracted functions are visualized by function-specific icons that change hue in accordance to specified system states. Simultaneously, the design concept aims to support the human operator in identifying off-nominal situations by implementing design properties that guide visual attention. The display was evaluated in a study with seven subject matter experts. Although preliminary, the results clearly favor the proposed display design concept. The advantages of the proposed design concept are demonstrated, and the next steps for further exploring the proposed display design concept are outlined.

1. Introduction

In recent years, numerous research papers have been published that envision the operation of highly automated or even autonomous Unmanned Aircraft Systems (UAS) in low-altitude urban airspace [1,2]. The introduction of autonomous UAS into low-altitude airspace necessitates high levels of system safety, especially when operating over urban areas, as safety for the public needs to be ensured at all times. Humans are an essential component in assuring safety in aviation systems, despite the introduction of increasing system autonomy [3]. Most likely, humans will continue to be an important part of future, highly automated aviation systems and be responsible for the successful execution of safety critical system functions. If humans are to be involved in executing safety critical system functions in collaboration with a highly automated system, clear function and task allocation between the human operator and the automation is necessary to avoid confusion [4,5]. Generally, in highly automated systems the automation takes over the complete execution of functions [6,7,8], leaving the human operator in charge of monitoring the safe execution of system functions, also referred to as supervisory control [9]. The necessity of supervisory control poses one of the major challenges in designing Human–Machine Interfaces (HMIs) for highly automated or autonomous systems, such as autonomous UAS. The HMI must be designed in a way that will continuously keep the human operator updated about the automation’s behavior and its intent. However, complex autonomous systems with various modes of operation will result in vast amounts of system parameters to be monitored. If the HMI is not designed in a way that will support the human in monitoring these parameters, failures in correctly interpreting and perceiving system modes and safety critical warnings are likely to occur [10,11]. Thus, the successful design of the HMI for supervisory control of highly automated or autonomous UAS is critical for the overall system safety.
Several studies have been conducted regarding the human factors challenges of supervisory control of highly automated or autonomous UAS. However, most of these studies do not specifically focus on the design of the HMI. Instead, they focus on aspects such as the effects of different levels of automation [12,13], workload issues [14,15], decision support to fulfil mission objectives [16], or methods to enhance situation awareness [17]. Further, a detect and avoid display for UAS flying in the U.S. National Airspace System has been developed and evaluated within the scope of several studies [18,19,20]. Only a few publications specifically apply scientific methods to design HMIs for UAS supervisory control [21,22]. Further, Friedrich and Lieb [23] present an HMI (called U-FLY) that allows for supervisory control of multiple highly automated UAS, comparable to Medium Altitude Long Endurance (MALE) systems, in controlled airspace. However, none of these publications consider the unique safety challenges that arise from autonomous flight operations of Small Unmanned Aircraft Systems (sUAS) in low-altitude urban airspace while involving supervisory oversight and control of multiple vehicles simultaneously in the design of the HMIs. Therefore, studies are needed that aim to thoroughly analyze the arising safety challenges in autonomous flight operations of sUAS in low-altitude urban airspace and develop HMIs that specifically intend to enable an operator to deal with these safety challenges.
This paper introduces a display design concept that intends to enable an operator to deal with the unique safety challenges that arise from operating multiple autonomous sUAS simultaneously in low-altitude urban airspace. The display design concept represents an empirically based further development of the U-FLY’s design approach as presented in [23]. Hereby, the design concept utilizes principles of the Ecological Interface Design approach (EID [24]) and implements design properties that support parallel visual search [25] for detecting safety critical situations such as system failures. Before explaining the design concept, the following section will provide an overview of current technical approaches for enabling autonomous flight operation in low-altitude urban airspace, their associated safety risks, an overview of related human systems integration challenges, as well as short introductions to methods for guiding visual attention and to the EID approach.

2. Related Work

2.1. Autonomous Flight Operation in Urban Airspace

In recent years, research undertakings have been launched to enable the safe and efficient integration of UAS into low-altitude airspace. The European Union’s SESAR project CORUS recently released a European-wide concept of operations for UAS called U-Space [26,27]. In the U.S., the National Aeronautics and Space Administration (NASA), the Federal Aviation Authority (FAA), and industry stakeholders are working together to develop a new air traffic management ecosystem called UAS Traffic Management (UTM) [1,28]. The services that the UTM platform offers include flight planning and monitoring; means to avoid severe weather and wind conditions; as well as assurance of separation to other aircraft, buildings, obstacles and terrain. Furthermore, the goal for the future is to develop services for airspace congestion management and contingency planning. The services included in the UTM platform will be provided by so called UAS Service Suppliers.
In addition to the development of new air traffic management systems, numerous research papers have been published that propose technical means to approach safety risks due to the integration of UAS in controlled airspace. Young et al. [29] identify six safety risks that need to be addressed: (1) flight outside of approved airspace; (2) unsafe proximity to people and property; (3) critical system failures such as loss of link, degraded positional accuracy, or loss of power; (4) loss-of-control due to envelope excursions and flight control system failures; (5) cybersecurity-related risks; and (6) loss-of-separation (with other air traffic). Young et al. [29] developed a preliminary conceptual design of an in-time safety assurance system to account for these safety risks as an embellishment to the U.S. air traffic management system UTM. The safety assurance system can enable the safe operation of highly autonomous aircraft at low altitudes near and over populated urban areas. In addition to the safety assurance system, several other studies propose technical means to deal with these safety risks. These technical means include geo-fencing systems [30,31,32], autonomous collision avoidance systems such as the ICAROUS system [33,34], real-time risk assessment frameworks [35,36], flying time prediction algorithms [37,38], or a real-time software health management system for UAS [39].
It is envisioned that large numbers of UAS will operate in urban areas, executing most system functions automatically with the support of the aforementioned safety systems. However, according to Young et al. [29], a human operator will still be needed to monitor and supervise operations from a ground control station. This is because not all combinations or cascades of situations can be designed for or reacted to by autonomous systems. This means that interventions by a human can be necessary at certain times. These interventions will oftentimes not be executed by a pilot, but rather by an operator who will be involved at a higher level of abstraction, meaning that the human will mainly be an observer of potentially many vehicles with the authority to supervise changes to flight plans and maneuvers. Consequently, it is necessary that the system informs the human efficiently and thoroughly about the current situation of the system. The question remains what an effective design concept for human–system integration would be to achieve this. This paper addresses considerations for the design of such HMIs, particularly those related to assuring flight safety.

2.2. Human–System Integration Challenges

In a work system consisting of multiple highly automated UAS, human operators are required to supervise multiple UAS and intervene if needed. Thus, it is necessary to develop a design concept for an HMI that enables one ground station operator to monitor safety critical system information of multiple UAS efficiently. The HMI should present information on safety related system functions and allow for quick comprehension of current and evolving system states, especially during critical situations. If, for example, a UAS encounters a rogue aircraft and the autonomous detect and avoid functionality does not function as expected, the operator has to be informed quickly and might need to initiate a reroute maneuver. The operator can only react adequately if they have a comprehensive overview of all safety related aspects.
The task of an operator in a system of multiple highly automated UAS is therefore largely that of a supervisor of the system, reacting quickly if the need arises. However, monitoring activities can at times be monotonous. Thus, they can lead to boredom and decreased vigilance. This in turn can lead to conditions in which changes of system states are not noticed, possibly resulting in the failure to accurately detect safety critical system states. These so-called scanning failures play a major role in aircraft accidents [10]. As such, techniques that enhance the probability of detecting safety critical situations despite low levels of vigilance should be emphasized in the design of HMIs to support safety monitoring of multiple autonomous UAS.

2.3. Guidance of Visual Attention

Approaches on how to guide the operator’s visual attention to critical system states can be found in fundamental psychological research on human visual perception [40,41,42]. One example is studies on visual search tasks that show the existence of certain object attributes which can be processed in parallel and pre-attentively, prior to focused attention. These object attributes are called features and can, e.g., be hue, size, or shape. An object attribute is defined as a feature if, within a visual scene, a certain (target) object deviates from other (distracting) objects in only one basic attribute (e.g., hue) and the time to find the target object is not affected by the number of distracting objects. In other words, if distractors are uniformly colored and the reaction time to detect a differently colored target is independent of the number of distracting objects, color is a feature [25,42,43,44,45]. A visual search where a target can be identified based on a feature is said to be parallel. In parallel searches, the observer does not need to serially process each element on the display (serial search) but can perceive all items simultaneously (cf. Figure 1).
Based on these research findings, Wickens et al. [46] identified three target object attributes that are more likely to induce parallel visual search in displays: (1) discriminability from background elements (e.g., in hue, especially when distractors are uniformly colored), (2) simplicity (i.e., the target is defined by one feature), and (3) automaticity (i.e., the target should be familiar to the operator). In order to maximize the probability of detecting (noticing or recognizing) safety critical situations, a parallel search for off-nominal system states should be supported in the design of displays intended for safety monitoring. Parallel search is supported by the design concept presented in this paper by realizing the target properties identified by Wickens et al. [46] in the design of the HMI (see Section 3 on derivation of design principles).

2.4. Ecological Interface Design

Several approaches to HMI design have been proposed in the scientific literature. One of these approaches is the EID approach proposed by Vicente and Rasmussen [24]. The design concept in this paper is based on EID. Therefore, in this section, this approach will be introduced in detail.
The aim of EID is to visualize the constraints that govern the work system that the operator is monitoring and enhance understanding of the structure of the work system [3]. In the process of applying EID, two major steps are carried out: the system decomposition and the functional abstraction. These processes aim at determining the constraints of the work system and lead to the identification of information that needs to be presented to the operator in the HMI. The work system is first decomposed into meaningful entities, characterized by a part–whole relationship, also referred to as decomposition space [47]. The most common procedure is to decompose the work system into the whole system (e.g., a swarm of UAS), the subsystems (single UAS), and the components (single technical systems in a UAS). The whole system, the subsystems, and the components can be regarded as resolution levels of a system. The idea when using EID is that operators can reason on different resolution levels of a system and that the HMI always presents the information that best corresponds to the resolution level the human operator is reasoning on. For example, if an operator reasons about the battery voltage of a battery in a UAS, they are reasoning on a high system resolution. Therefore, the HMI should present information on the component level of decomposition (single technical systems in a UAS).
After decomposing the system, an abstraction hierarchy is constructed [47]. The abstraction hierarchy is a descriptive model of the functions of a work system and is composed of five different abstraction levels. Lower levels describe the actual physical objects in the work system and the physical processes. Higher levels describe the functions that a system has to fulfil to achieve the purposes of the work system. Adjacent abstraction levels are related to each other by means–end relationships [24,48]. This means that the level above a specific abstraction level describes why the function in this abstraction level is being executed and the level below describes how it is executed.
The next steps of the design process of the HMI are then based on the abstraction hierarchy. The aim of an ecological interface is to make the means–end relationships between functions from adjacent levels of the abstraction hierarchy visible to the operator. This should enable the operator to understand the interdependencies of processes and functions in the work system and meaningful associations among variables (e.g., headwind and ground speed) should become salient [3]. This understanding of the means–ends relationships between functions through the HMI design is one of the ways EID aims to improve the problem solving of operators. Vicente and Rasmussen [24] argue that if operators understand the constraints and relationships of the work system, they can start the problem-solving process (e.g., during a system failure condition) on higher levels of abstraction and identify which subparts of the system are relevant for achieving current system goals. Thus, operators can quickly narrow down their search to the subsystems and components affected by the system failure.
Another way EID aims to support problem identification and solving is by visualizing information on all variables affecting the system. Vicente [48] states that this enables the operator to easily detect off-nominal system behavior. Borst, Flach, and Ellerbroek [3] argue that with increasing system automation, even more information needs to be visualized so that the operator can understand the system and the automation’s behavior. Therefore, ecological displays can become by definition rather complex, because they aim to reflect and represent all functions and processes of what is often a complex work domain. Consequently, they are difficult to oversee, especially for novices. In fact, operators of ecological displays need extensive training to fully take advantage of the display. For complex work domains, parallel search is thus difficult to support in ecological displays. An example of an ecological display for the purpose of supervising UAS swarms is presented in Fuchs et al. [21]. The display provides a great deal of critical information and visualizes all the means–end relationships identified in the abstraction hierarchy. However, the display is complex and difficult to oversee at first glance, making search inefficient. Accordingly, parallel search is difficult to achieve in this display.

2.5. Contribution of This Paper

This paper proposes a display design concept that addresses the aforementioned display complexity issue of EID HMIs. The contributions of this paper are as follows.
  • Derivation of specific display design principles that aim to adapt EID to reduce display complexity;
  • implementation of design properties that support parallel visual search for detecting safety critical system states, while keeping the advantages of EID;
  • application of the proposed display design principles to the design of an HMI enabling a UAS operator to deal with the unique safety challenges that arise from operating multiple autonomous sUAS simultaneously in low-altitude urban airspace; and
  • mock-up evaluation of the display design concept and the designed HMI.

2.6. Structure of This Paper

In Section 3 of this paper, the proposed display design concept including its five display design principles is derived and described in detail. Section 4 describes the application of the five design principles to the design of an HMI for an operator of multiple autonomous sUAS operating in low-altitude urban airspace. Section 5 presents the final HMI layout in three different situations, including nominal and off-nominal conditions. Section 6 presents the methods and the results of the conducted HMI mock-up evaluation. Section 7 discusses the proposed display design concept in the light of the evaluation results and provides an outlook on the next steps. Section 8 consists of a short conclusion of the findings.

3. Proposed Display Design Concept and Principles

The core of the design approach of the U-FLY HMI presented by Friedrich and Lieb [23] is to visualize states of safety critical functions related to the operation of MALE class UAS by function-specific icons that change hue according to the current system state. This paper describes the further development of the design approach based on findings of the scientific literature and derives and demonstrates a display design concept based on specific design principles.
The aim of the design concept is to design an HMI that supports parallel visual search, while informing the operator about the states of all system functions that are affected by a safety critical system failure (or threshold exceedances for off-nominal conditions), thus enabling problem solving processes. Each principle will be derived from findings in the literature, and it will be explained how the principle can be applied to display design. After describing the proposed display design concept, in the next section it will be demonstrated by applying it to design a display that visualizes information on safety critical system functions that would need to be monitored by a ground station operator of multiple autonomous sUAS flying at low altitudes and within UTM urban airspace.

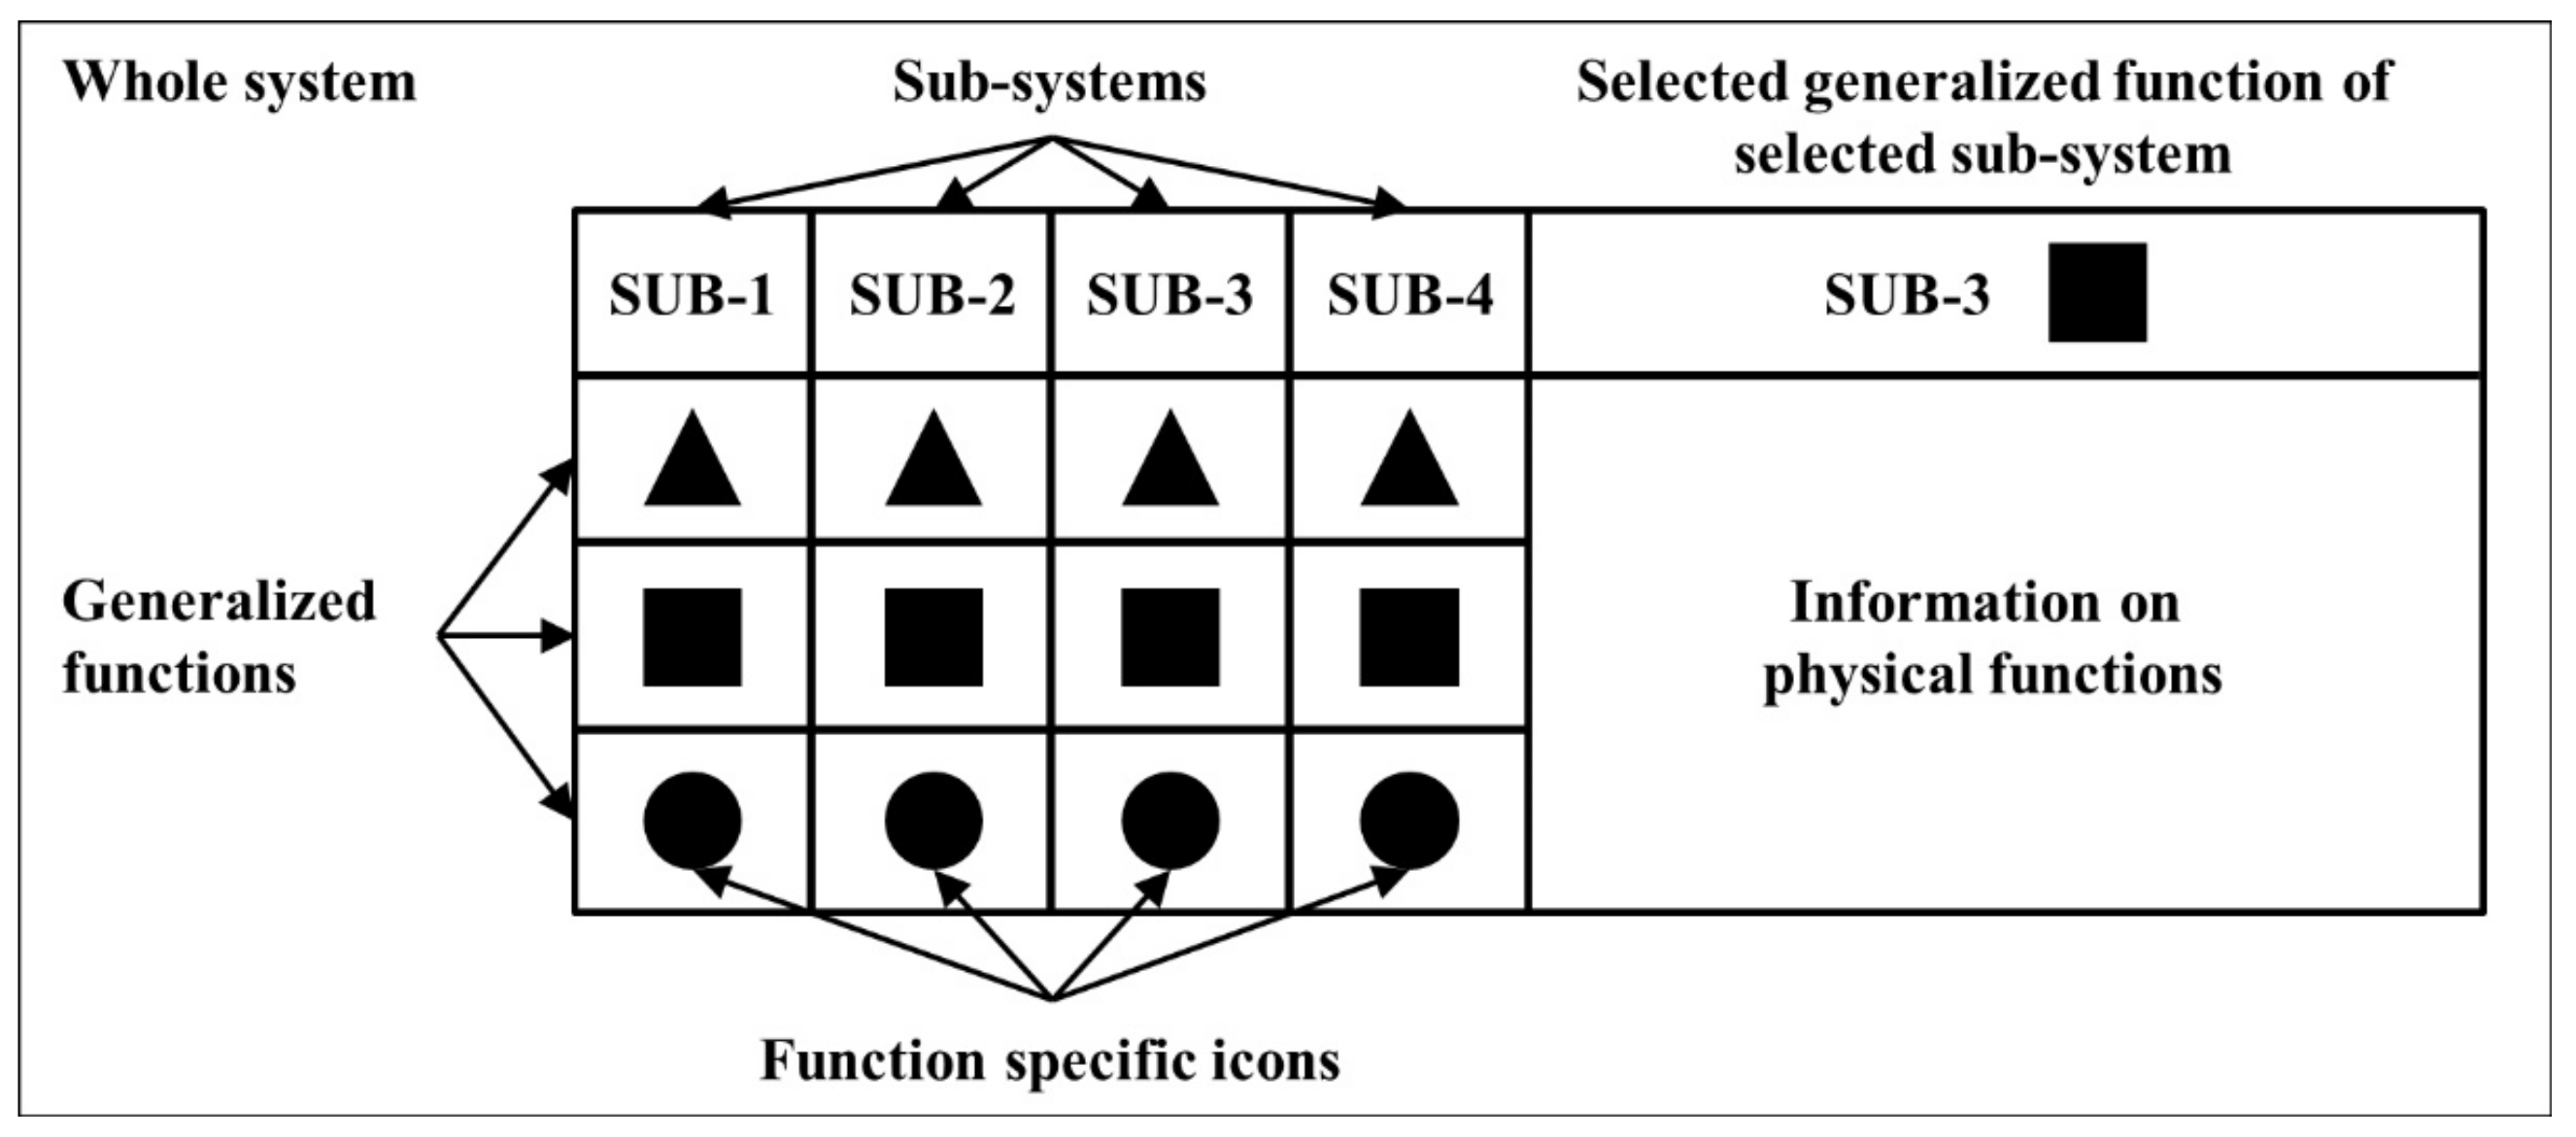
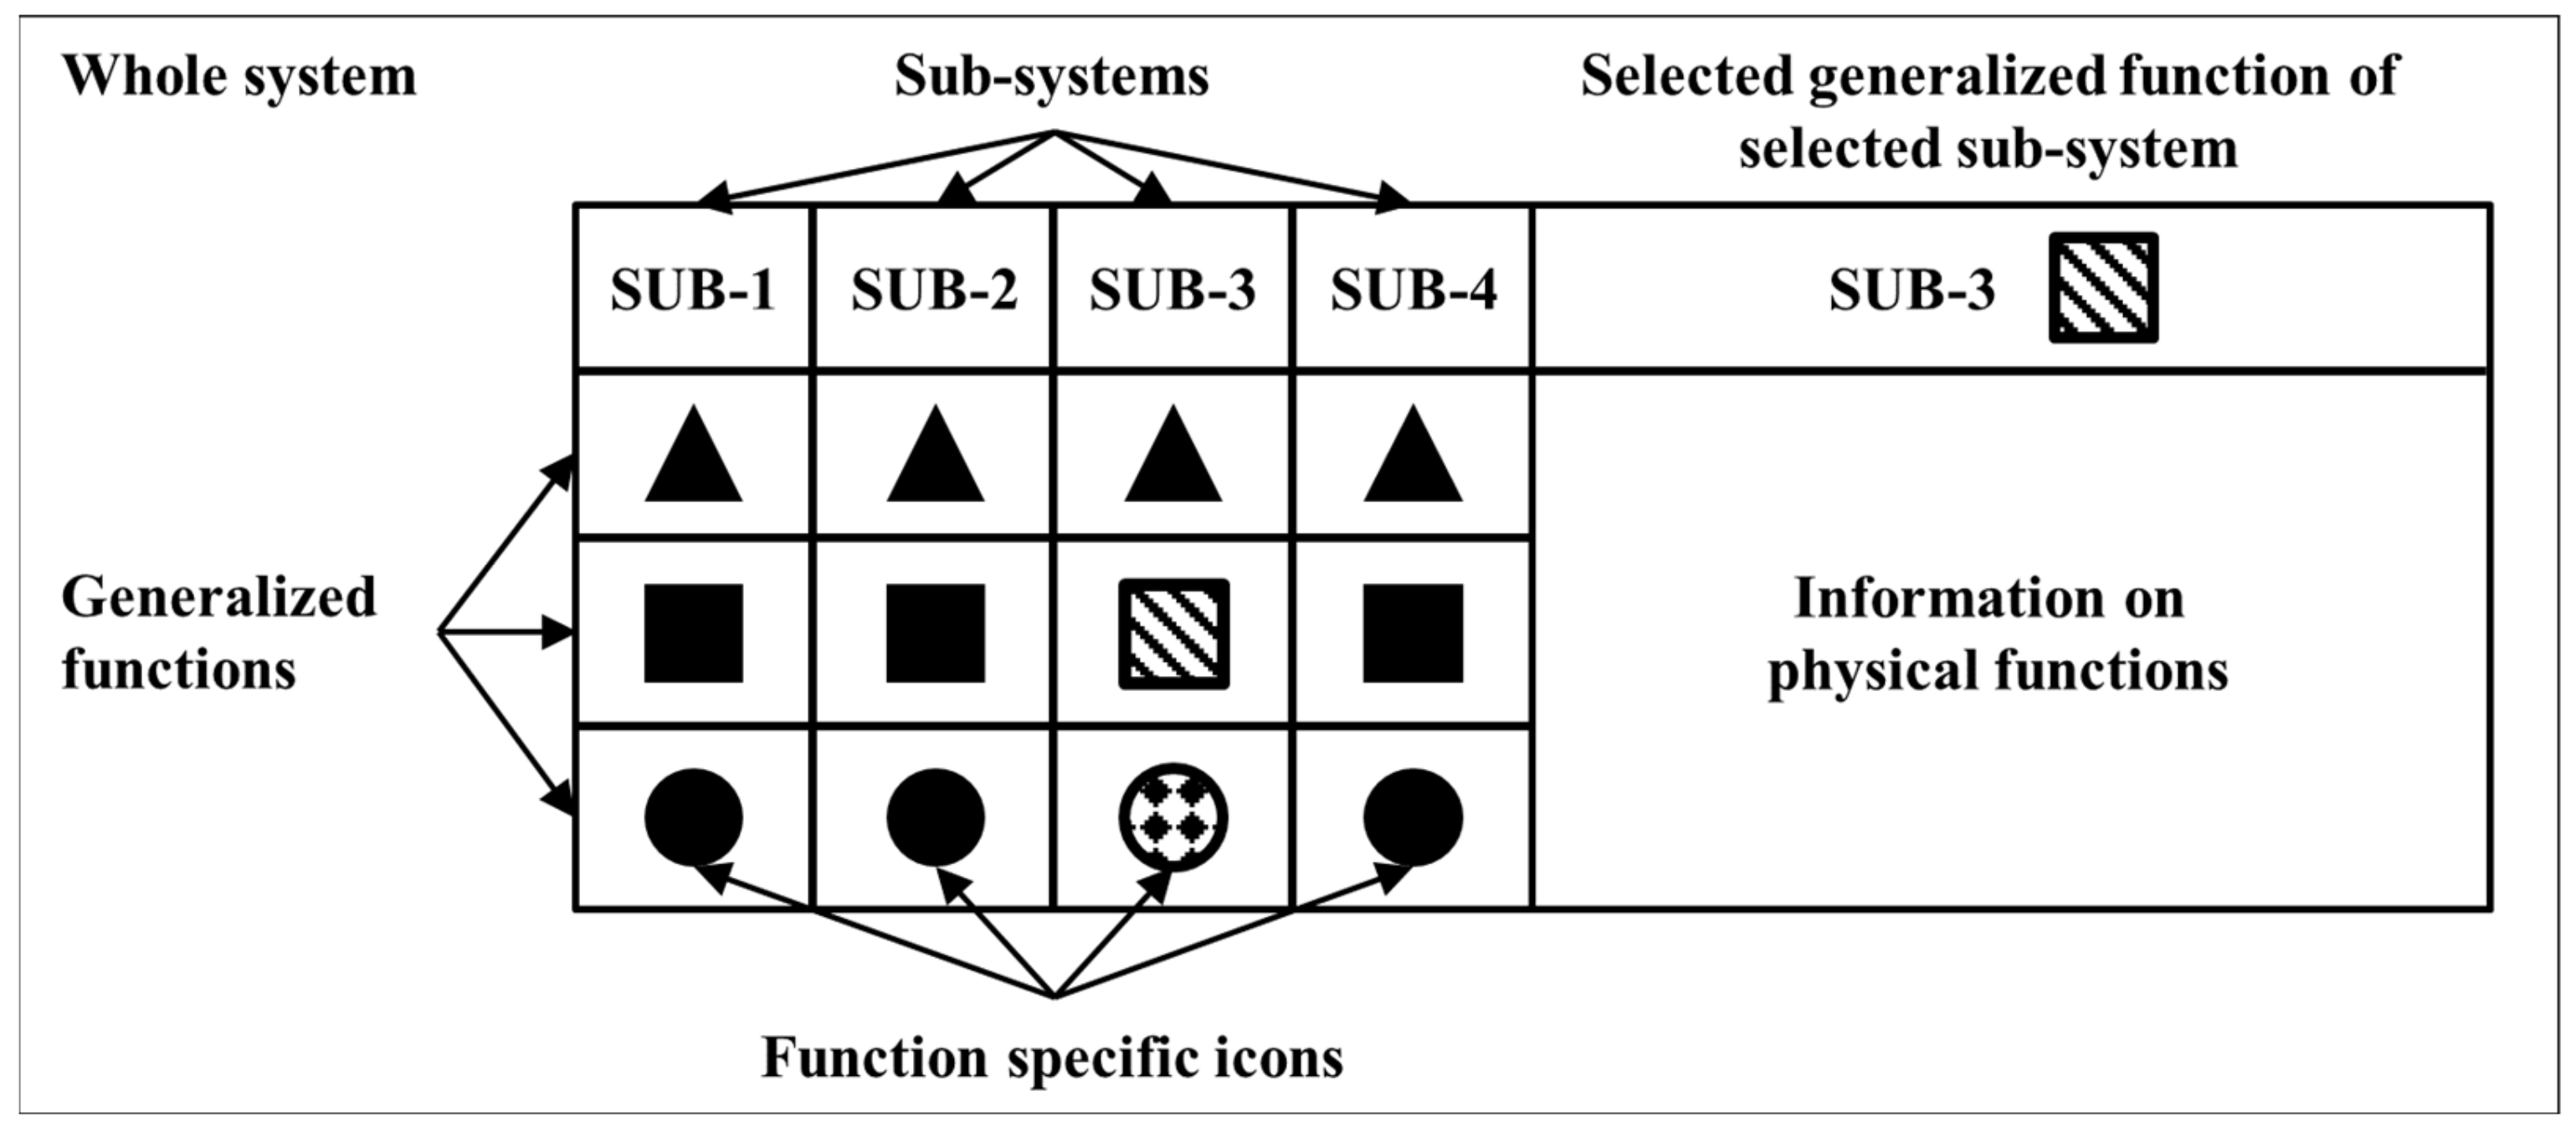
3.1. Design Principle 1: Hiding Information Depending on Levels of System Resolution and Functional Abstraction

Similar to EID, the system is first decomposed into three different resolution levels: the whole system, the subsystems, and the components. Second, an abstraction hierarchy is constructed. Depending on which resolution level of the system an operator should be reasoning on, information on different levels of abstraction is necessary [47]. Vicente and Rasmussen [24] argue that shifting the representation to a higher level of abstraction with a lower resolution of the system makes the system look simpler and thus provides a mechanism to cope with the complexity. For example, when reasoning about the state of the whole system, information from higher abstraction levels (e.g., the generalized functions level) is usually more meaningful than from lower abstraction levels (e.g., the physical functions level). When zooming in to lower levels of the system, i.e., increasing the resolution of the system the operator should reason on, the abstraction level of the provided information should decrease. For example, the state of a fuel pump is important at the component or subsystem level of an aircraft but does not provide enough information on its own regarding the state of whole aircraft performance. Similarly, information regarding the flight envelope limits does not provide meaningful information on the state of the fuel system but can be crucial information for a pilot when deciding whether the current airspeed is sufficient to ensure safe flight.
Following this line of argumentation, the proposed concept aims to adapt the type of displayed information in terms of its abstraction level to the level of system resolution and hide information from the other abstraction levels. However, information from other abstraction levels will remain available to the operator on request if they deem it necessary. Therefore, the design concept proposes that when reasoning about the state of the whole system (e.g., a system consisting of multiple sUAS), the abstraction level of the displayed information should match the generalized function level of the abstraction hierarchy and information of lower abstraction should (or can) be hidden. Within low-altitude multi-sUAS operations, a generalized function might for example be to ensure geo-fence conformance or that the range of the sUAS is still sufficient to execute the intended flight plan. When increasing the resolution level of the system and focusing on a specific subsystem (e.g., one specific sUAS), the abstraction level of the displayed information should match the physical functions and the physical forms level (cf. Table 1). For the aforementioned geo-fence conformance function, physical information could be the distance between the specific sUAS and a geo-fence. The position of the sUAS and the geo-fence itself would constitute the physical form.
Regarding the way the information should be presented on the display, research has shown that the usage of icons to convey safety critical information in complex systems promotes more efficient learning and interaction with the system compared to textual presentation of information [49,50]. In fact, textual presentation of safety critical information is one of the major design problems of current HMIs for UAS control [51] and was found to be a contributing factor in past UAS accidents [52]. Thus, safety-critical information should be displayed using icons (see design principles 2 and 4).
On a display applying the proposed display design concept, information on generalized functions should be visualized at all times using function-specific icons that change hue in accordance with the current state of the function. This ensures that an overview of safety critical information on a high abstraction level is given, i.e., an overview of the whole system. Simultaneously, information from the physical functions and physical forms levels of the subsystems are hidden from the view of the operator, unless they specifically request to have the information visualized (cf. Figure 2 and Figure 3).
This method of information visualization supports parallel visual search for off-nominal system states, as the complexity of the display is reduced by only showing the icons for the generalized functions. If an off-nominal system state occurs, the icon for the affected generalized function changes hue. The operator can then identify off-nominal system states shown by a changing icon hue quickly by applying parallel search. Simultaneously, if information is displayed through changing icon hues due to the system state, it visualizes the means–end relationships between system functions of adjacent abstraction levels. The (secondary) effect of an off-nominal system state of one function on other system functions that share common means–end relationships immediately becomes visible due to the respective icons changing their hue (cf. Figure 3). A degraded vehicle health (generalized function) due to a loss of battery voltage (physical function), for example, impacts the required range to execute intended flight plan (generalized function). In this example, the icons for the vehicle health and range functions would change hue. Consequently, an operator should be able to quickly gather information about whole system performance on the generalized functions level of abstraction (i.e., which function(s) is operating off-nominally and which functions are affected by this condition). Information on physical functions and physical objects is (or can be) displayed in a separate window or multiple separate windows as desired by the operator.
This information management approach provides a mechanism to simplify the display layout and reduce display complexity while simultaneously visualizing the means-end relationships on the generalized functions level of abstraction. The proposed design concept should thus enable an operator to focus on information of physical processes of one specific subsystem while simultaneously being able to monitor the states of the generalized functions of all other subsystems.

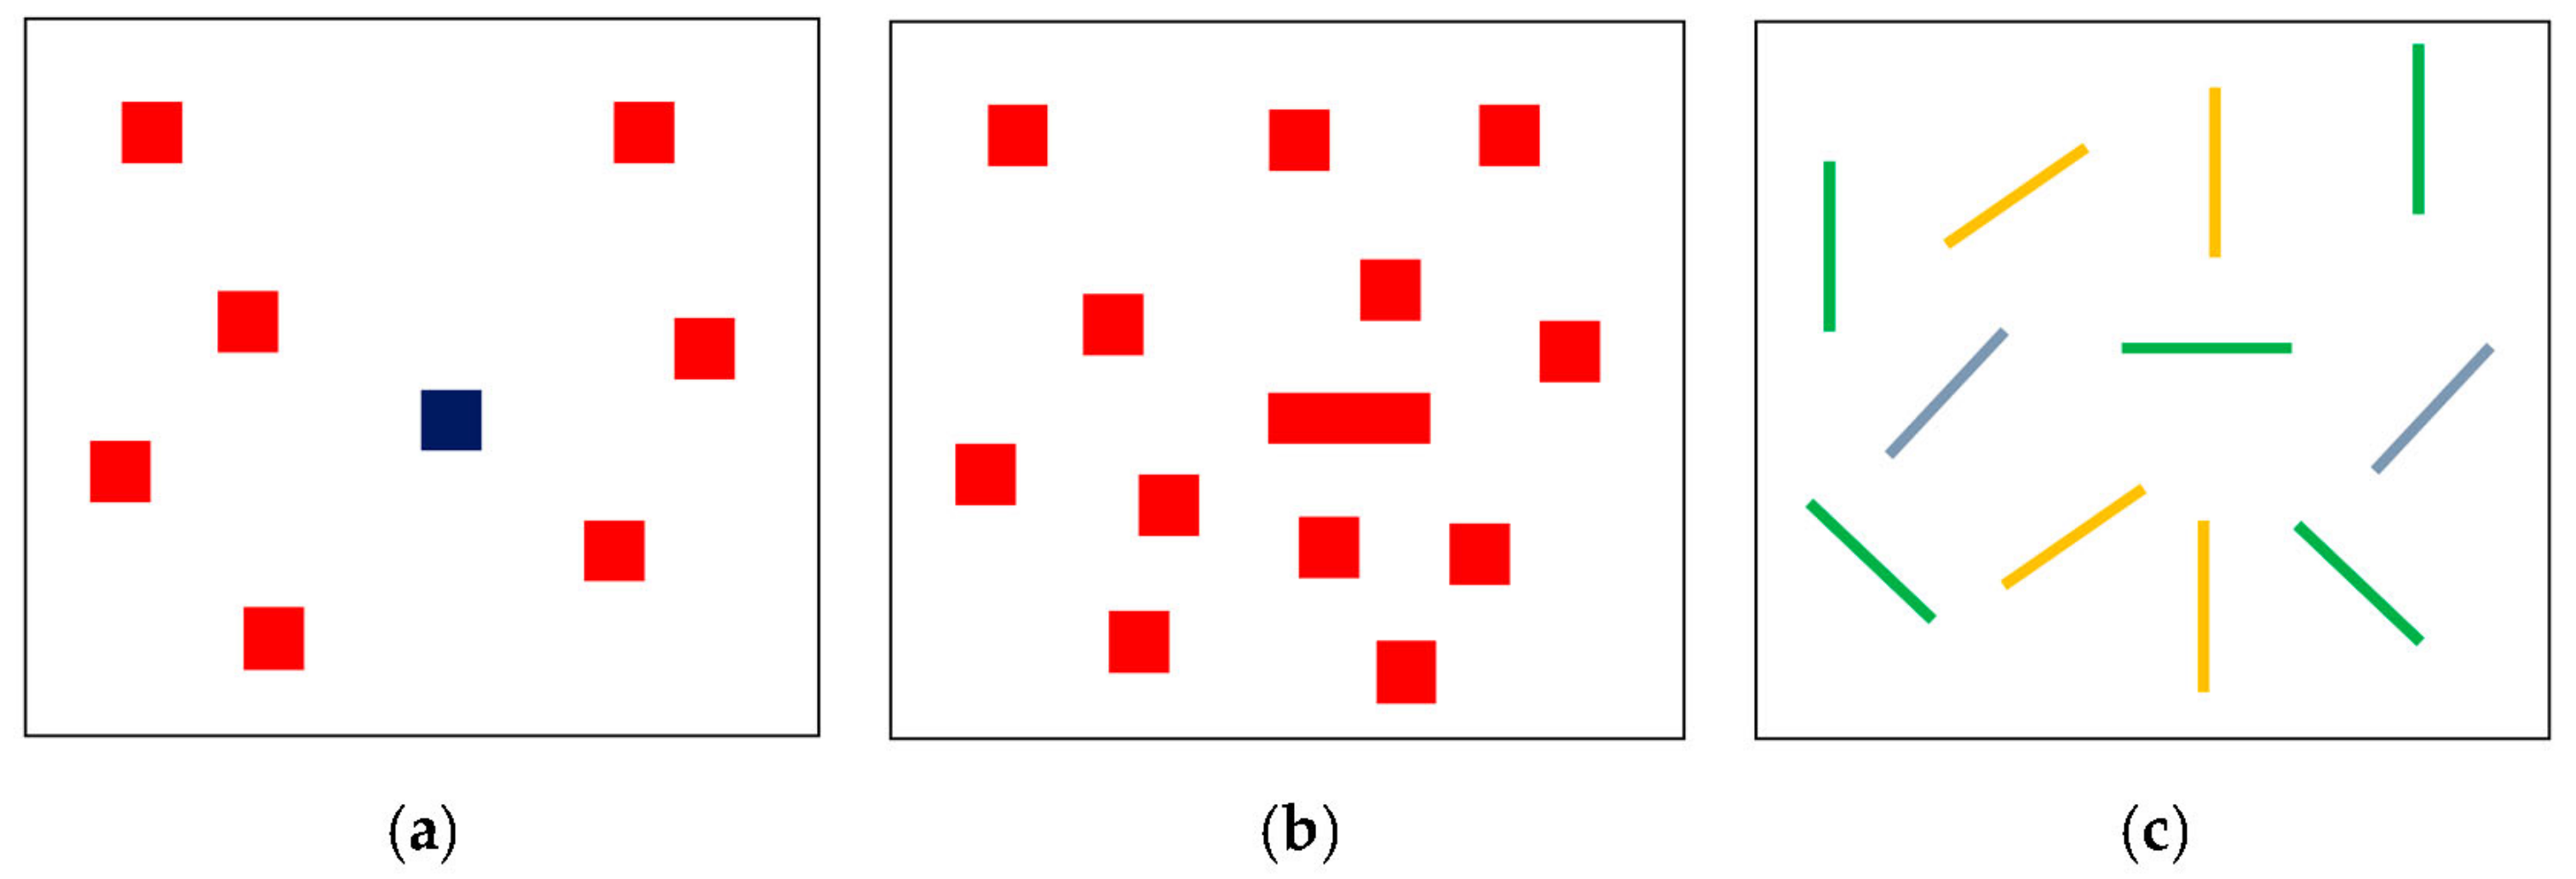
3.2. Design Principle 2: Support Parallel Visual Search Using Simple Icons and Well-Differentiable Hues

In order to support parallel visual search, the icons used to represent system states of generalized functions should preferably be kept simple and contain well-known recognizable shapes and features that are familiar to the human operator [46]. Further, the hues to differentiate between the system states of generalized function should be well differentiable from each other and the background. The background should be uniformly colored with an unobtrusive color that does not draw the human operator’s attention (e.g., gray).
Figure 2 and Figure 3 schematically illustrate an exemplary display layout. The icons are arranged in a matrix format (the triangles, rectangles, and circles represent the icons). Columns represent the different identical subsystems (e.g., different sUAS); rows represent generalized functions (e.g., geo-fence conformance). A row thus consists of multiple identical icons, each representing the same generalized function for a different subsystem.

3.3. Design Principle 3: Arrange Icons in a Semantically Meaningful Pattern

When observing a visual scene, humans tend to look for patterns of information in accordance to Gestalt principles. In fact, it has been found that the location of information is a major determinant for usability [49]. Furthermore, Howitt and Richards [49] suggest that grouping icons together in semantically meaningful clusters could create implicit categorical cues and may enhance performance. As such, the icons should be grouped together in a semantically meaningful way.
In order to group the icons meaningfully, the abstract functions level of the abstraction hierarchy is used as means to arrange the icons within each column (see Figure 2 and Figure 3). Icons that share means–end relationships with a common abstract function should be grouped together (e.g., if two icons were to represent barometric altitude and true airspeed, these icons would share a means–end relationship with the abstract function “aviate” and should thus be grouped together). Oftentimes, one generalized function shares a means–end relationship with more than one abstract function. In this case, the more important means–end relationship should be chosen to decide which abstract function the icon should be assigned to. One way to avoid situations where many generalized functions share a common abstract function is to try to define the functions in a way that decreases the amount of common means–end relationships between the generalized and the abstract functions level.

3.4. Design Principle 4: Use Unambiguous and Meaningful Icons

Icons can be used to quickly and effectively transmit information. However, if not designed adequately, icons can be ambiguous and interpreted in a number of different ways leading to inefficient or even false transmission of information. Accurate transmission of information is especially crucial in safety critical work domains. In order to ensure that icons transmit their meanings accurately, their suitability in terms of icon–function fit needs to be measured. Numerous research papers have been published that address the development of metrics for measuring and quantifying icon-function fit [53,54,55,56,57]. The most commonly proposed and investigated icon–function fit metrics are concreteness, complexity, familiarity, meaningfulness, and semantic distance. Concreteness describes how well the icon depicts an object in the real world. Complexity is a measure of the amount of detail in an icon. Familiarity describes how familiar the icon is in terms of how often it is encountered in everyday life. Meaningfulness characterizes how much meaning the icon conveys and semantic distance is a measure of closeness between the icon and its meaning.
Studies have revealed significant correlations between the five icon characteristics. Concreteness and familiarity were found to be crucial factors in the accurate transmission of meaning and showed correlations of r = 0.82 and r = 0.93 with the meaningfulness dimension [54,58]. Furthermore, McDougall, Curry, and de Bruijn [59] found that concrete icons performed better than abstract icons, especially in situations that require quick understanding of the icon (e.g., warnings). Complexity has been negatively related to search efficacy [60]. The more complex an icon is, the longer it takes participants to find the icon. However, the more detail an icon entails, the more concrete it is and the more accurate its meaning is being transmitted. Therefore, in the design of icons, the aim should be to achieve a well-balanced trade-off between concreteness and complexity and, if possible, use familiar features in the design. The guidelines for icon design are summarized in Table 2.

3.5. Design Principle 5: Define Adequate System States

The primary goal in monitoring (safety critical) functions of autonomous systems (such as autonomous sUAS) is to ensure that all functions are performing in an expected manner within some acceptable tolerance, and that there is no trend toward performing otherwise. Therefore, the operator needs information on whether a specific function is functioning as expected (i.e., normally) or whether any function is approaching critical limits (caution state) or has already reached a critical state (warning state). This distinction between system states is already required in current large aircraft cockpits [61]. Furthermore, for situations in which a function is functioning as expected but might require the operator’s awareness and potential subsequent response, the advisory state has been implemented. Accordingly, at least four states, i.e., normal/nominal, caution, warning, and advisory, should be defined. Depending on the system the display is being designed for, further system states may be introduced.

4. Application of Display Design Principles

4.1. Assumed System Capabilities

The five design principles were applied to design an HMI that comprehensively visualizes information on safety-critical functions that a ground station operator of multiple autonomous sUAS at low altitudes and within urban airspace needs to monitor. It was assumed that the sUAS are operated in UTM airspace, the air traffic management ecosystem for managing and coordinating airspace access developed by the NASA and the FAA in the U.S. [1]. In the following subsections, the enabling technologies considered as key parts of the system are described. An important criterion for the selection of the systems was that they have been demonstrated in real flight tests, as this would leverage the generalizability of the results.

4.1.1. Geo-Fencing System

A geo-fencing system is needed to operate sUAS in urban airspace to avoid sUAS entering prohibited areas (safety risks one and two by Young et al. [29]). The geo-fencing system SAFEGUARD [32] was chosen as a representative geo-fencing system. SAFEGUARD monitors whether a sUAS is currently approaching a geo-fence and/or about to hit one. The system uses three different boundaries in order to assure that a sUAS does not pass a geo-fence. The three boundaries are the warning, terminate, and hard boundary. The warning boundary represents the point when a notification should be issued (to the sUAS operator or the automation), that the sUAS is approaching the terminate boundary and therefore needs to initiate a contingency maneuver. If the sUAS crosses the terminate boundary, it is considered unrecoverable and flight termination should be initiated immediately in order to avoid crossing the hard boundary, which marks the area where the sUAS must not enter under any circumstances. SAFEGUARD has been demonstrated in a series of real flight trials [32].

4.1.2. Autonomous Collision Avoidance System

A system to avoid loss of separation autonomously is needed if sUAS are operated autonomously in shared airspace including conventional and unmanned traffic (safety risk six by Young et al. [29]). The ICAROUS algorithm [33,34] was chosen to represent an autonomous collision avoidance system. ICAROUS can be used to carry out a contingency maneuver and avoid geo-fences or other obstacles. The algorithm allows for autonomous rerouting around a detected geo-fence or air traffic that is equipped with a transponder. When encountering a geo-fence (or in case of SAFEGUARD, the warning boundary) or a detected (rogue) aircraft/sUAS, the ICAROUS algorithm computes an alternative trajectory around the object in question. In order to determine the conformance status of the sUAS, positions and distances to a geo-fence boundary or (rogue) aircraft are computed. When the distance to a geo-fence boundary or a (rogue) aircraft falls below a certain minimum, ICAROUS reroutes the sUAS around the object in question. ICAROUS has also been demonstrated in real flight trials [34].

4.1.3. Casualty Risk Assessment System

A major challenge for sUAS operation in low-altitude urban airspace is the risk minimization for the population on the ground (safety risk two by Young et al. [29]). In case of a severe system malfunction leading to a crash, timely hazard identification and proactive risk mitigation capabilities are needed to avoid endangering the public. Ancel et al. [35,36] developed a casualty risk assessment algorithm that includes three estimation models. The first one is a probabilistic model for computing the current failure probability and thus the mishap likelihood based on current vehicle health parameters, such as battery charge level or motor temperatures. The second model is an off-nominal trajectory and impact point prediction model, estimating the trajectory and point of impact after a failure has occurred, such as a motor failure leading to propulsion loss. Based on the outputs of the two afore mentioned models, a severity estimation model computes the current probability of a casualty by taking into consideration various databases, such as a population density map.

4.1.4. Flying Time Prediction System

In order to avoid the necessity for premature flight termination due to insufficient range and endurance of the sUAS, a system calculating the remaining flying time is needed. The remaining flying time prediction system by Hogge et al. [37] and Kulkarni et al. [38] is one example for flying time predictions for sUAS. For predicting the remaining flying time, the system uses online battery state estimation, a prediction of the future motor power demand based on the current flight plan, an online estimation of additional unknown demands on the battery, as well as a prediction of the battery discharge during executing the intended flight plan. The system was also tested in a series of flight tests [37,38].

4.1.5. Real Time Sensor and Software Health Management

In order to avoid critical system failures and subsequent loss-of-control (safety risks three and four by Young et al. [29]), the health of safety critical systems of the sUAS needs to be monitored. The real-time sensor and software health management system for sUAS by Schumann et al. [39] was selected as a suitable, field-tested enabling technology. The health models are computed among others by statistical reasoning using Bayesian networks.

4.2. Definition of System Resolution Levels through System Decomposition (Design Principle 1)

For this use case application, the system is defined by the whole fleet of sUAS that are being supervised. Therefore, the whole system consists of all sUAS, of which each sUAS represents a separate but similar or even identical subsystem. In accordance with the principles of the proposed display design concept, information on generalized functions (e.g., geo-fence conformance) is presented for all subsystems, i.e., for all sUAS that are being supervised. Information from the physical functions (e.g., the distance between a sUAS and a geo-fence) and physical forms (e.g., the position of a sUAS or a geo-fence) levels of abstraction is presented only on request of the operator for the selected sUAS (i.e., subsystem, cf. Figure 4).

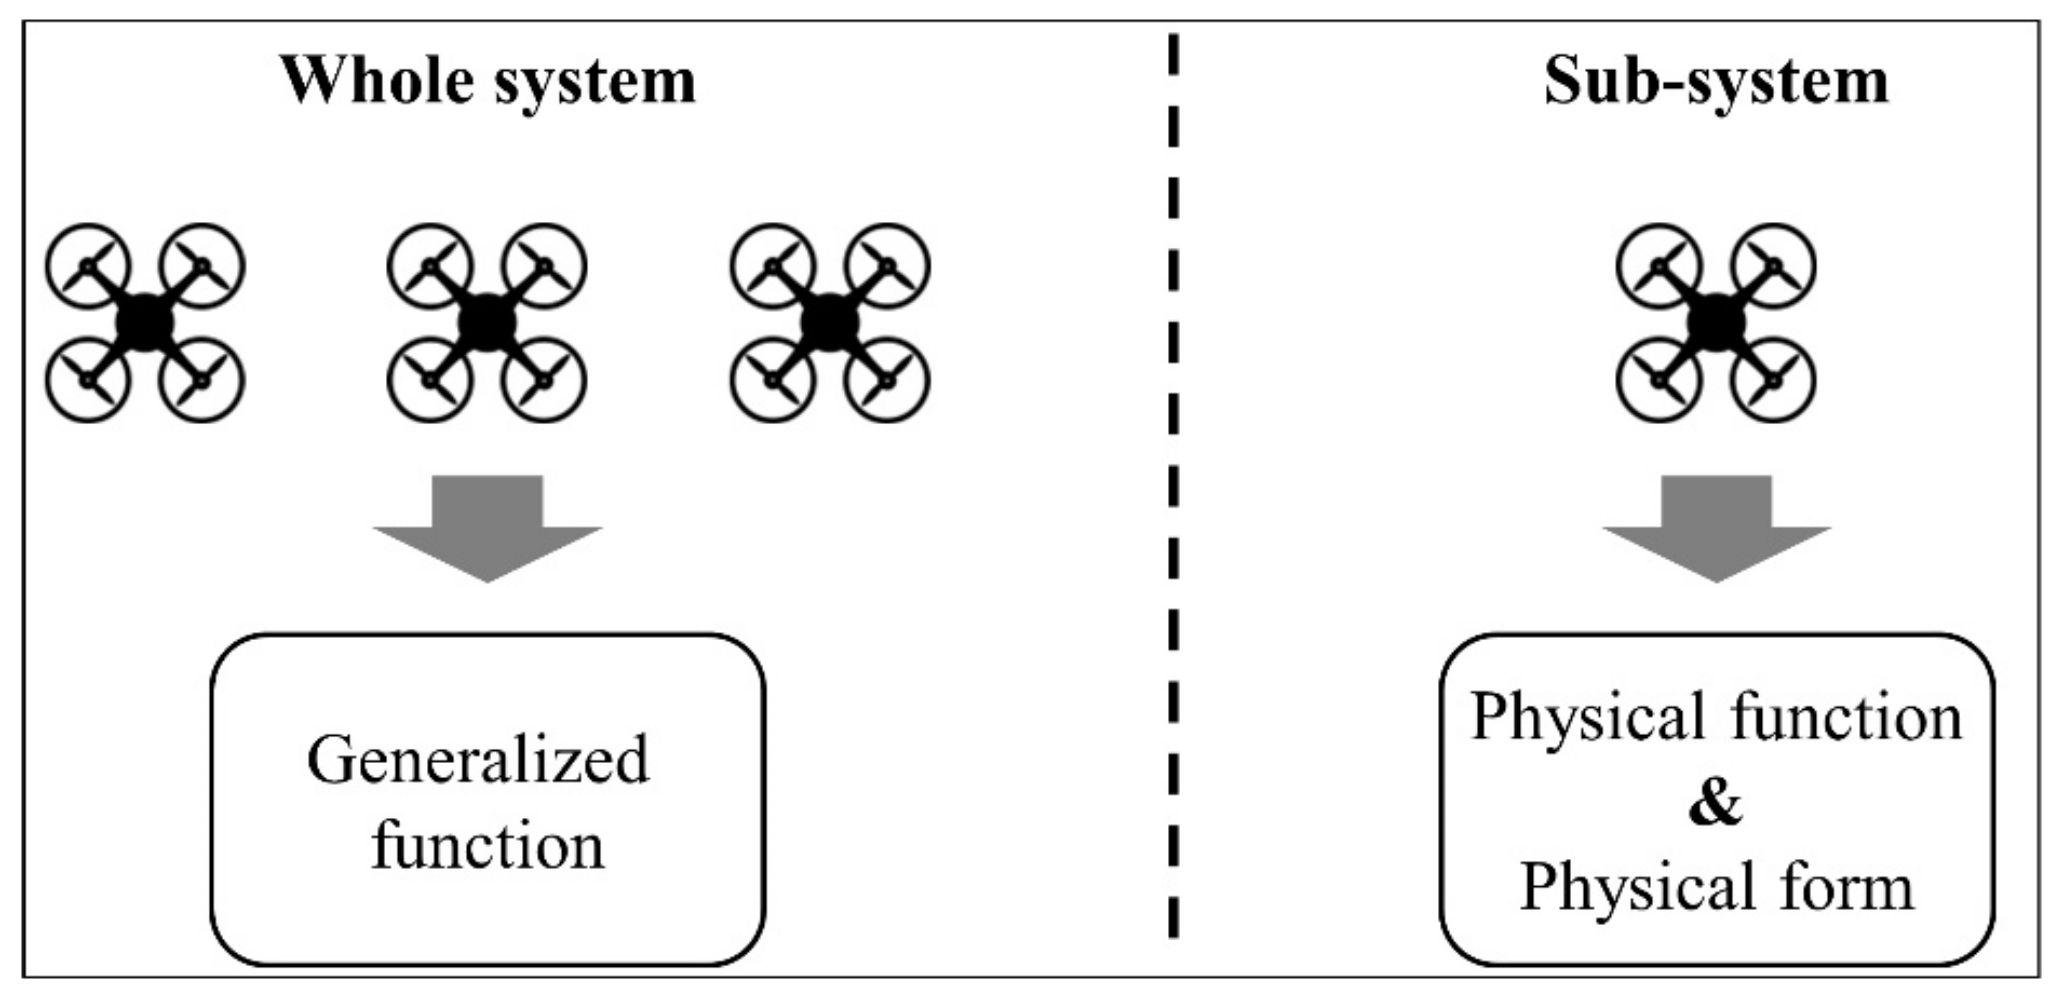
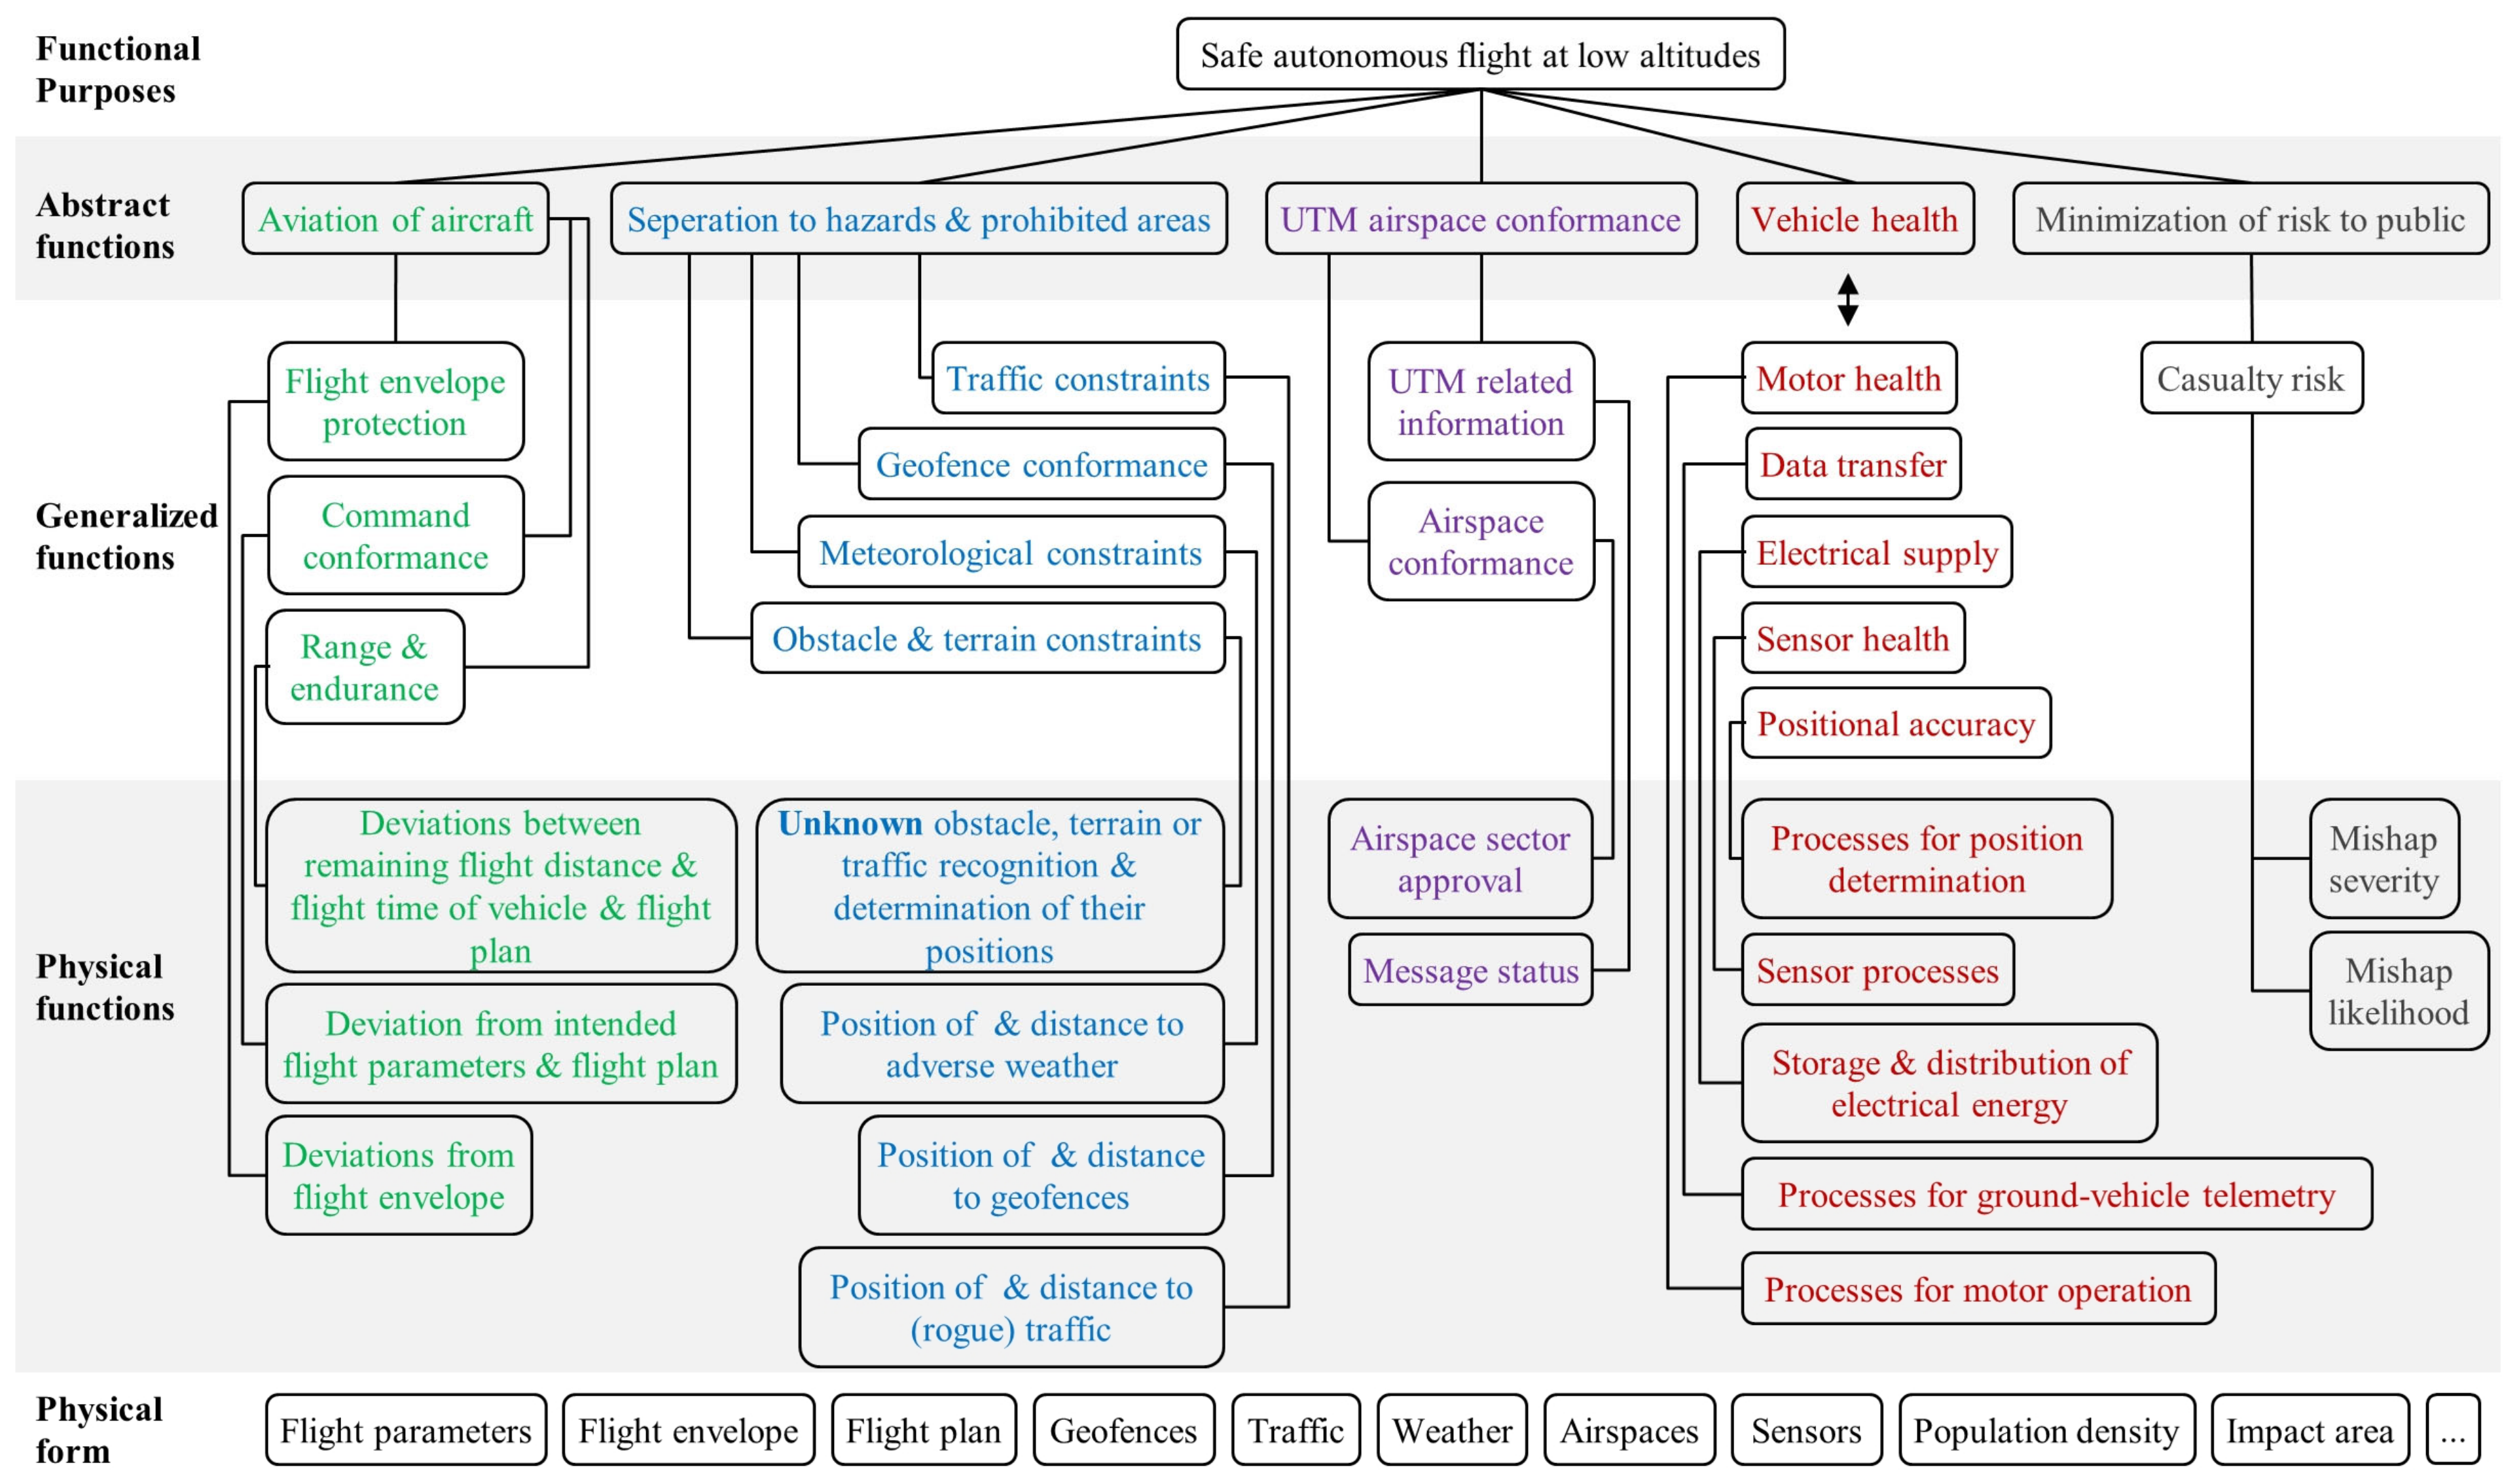
4.3. Functional Abstraction—The Abstraction Hierarchy (Design Principle 1)

In the construction of the abstraction hierarchy, the aim was to comprehensively reflect the safety risks related to autonomous flight operations in low-altitude urban airspace, such as those identified by Young et al. [29]. They identified the following safety risks: flight outside of approved airspace, unsafe proximity to people and property, critical system failures, loss of control, cyber security-related risks, and loss of separation. The enabling technologies to approach the safety risks (i.e., SAFEGUARD, ICAROUS, the casualty risk assessment and flying time prediction algorithms, and the real-time software health management system) were considered as key parts of the overall system. The systems/algorithms were matched to the five levels of the abstraction hierarchy depicted in Figure 5.
For reasons of simplicity and clarity, only the most important means–end relationships that were considered as sufficient for understanding the rationales behind the construction of the abstraction hierarchy are visualized in Figure 5 and are being discussed in the following section.
The functional purposes level is the highest level of abstraction. At this abstraction level, the reasons and purposes of the system are described. The functional purpose of a system consisting of multiple autonomous sUAS is the safe autonomous flight operation at low altitudes. The abstract functions represent the second level of abstraction. Abstract functions are means to accomplish the functional purposes. The abstract functions were defined as functions that aim to mitigate the safety risks identified by Young et al. [29]. After defining the abstract functions, the subsequent levels of abstraction were defined. Thus, the abstract functions were decomposed into generalized functions, physical functions, and physical forms. In the following, the abstraction levels for each safety risk are described.

4.3.1. Loss of Control—Aviation of Aircraft

In order to avoid a loss of control of the air vehicle, the sUAS needs to be aviated successfully. Therefore, the abstract function to counteract loss of control was labeled Aviation of aircraft. The functions Flight envelope protection, Command conformance, and Range & endurance were defined as the generalized functions contributing to safe aviation of the sUAS. The physical function necessary to detect a potential violation of the flight envelope of the sUAS is the computation of deviations between the actual flight parameters (e.g., bank angle) and the maximum allowable parameters as defined by the flight envelope of the sUAS.
Command conformance refers to the supervision of flight parameters such as speed, altitude, track, or flight mode of the sUAS. The generalized function was labeled Command conformance because its main purpose is to monitor whether the sUAS is executing the predefined flight plan as expected. If, for example, the preplanned altitude for the current section of the flight plan was set to 40 m, the altitude indication should also indicate 40 m plus/minus an acceptable range (e.g., 5 m). The computation of the deviations between planned and actual flight parameters represents a physical function and was labelled Deviations from intended flight parameters and flight plan.
For the generalized functions flight envelope protection and command conformance, mere computations of deviations are necessary. For the generalized function range and endurance however, the computation is more challenging. The purpose of the function is to monitor if the range and endurance of the sUAS are still sufficient for the safe execution of the intended flight plan. Thus, predictions about the current remaining range and endurance need to be computed, considering various parameters, such as the current battery status or wind strength and direction. The predictions of the current remaining range and endurance then need to be compared to the required range and flight time for successfully executing the intended flight plan. The computations of predictions and comparisons represent the physical functions.

4.3.2. Air Traffic-Related Risks—Separation to Hazards and Prohibited Areas

In order to prevent hazards due to encountering other air traffic, the abstract function Separation to hazards and prohibited areas was defined. In order to achieve safe separation to potential hazards and prohibited areas, conformance monitoring is crucial regarding other (rogue) air traffic, geo-fences around prohibited areas, obstacles, and terrain, as well as areas with hazardous meteorological conditions. Accordingly, the generalized functions were defined as Traffic constraints, Geo-fence conformance, Meteorological constraints, and Obstacle & terrain constraints. The subsequent physical functions were defined as Computation of positions and Computation of distances to, e.g., other air traffic, geo-fences, or obstacles (cf. Figure 5). Examples of the technical implementation of these physical functions are the systems ICAROUS and SAFEGUARD, designed to autonomously avoid (rogue) air traffic and geo-fences [32,33,34].
Further, obstacles and terrain that are unknown to the system (e.g., because they are not available in a navigational database), as well as rogue air traffic without transponders and areas with severe meteorological conditions need to be detected and avoided. Therefore, the positions of and distances to these objects and possible areas with adverse meteorological conditions need to be computed. Again, the computations of positions and distances represent physical functions (cf. Figure 5). These functionalities are not covered by ICAROUS or SAFEGUARD and will therefore require the future development of safety systems or algorithms.

4.3.3. Flight Outside of Approved Airspace-UTM Airspace Conformance

In the UTM ecosystem, the UAS Service Suppliers are responsible for airspace management and airspace approvals and each sUAS needs to comply with their approvals. Therefore, the abstract function was labelled UTM Airspace Conformance. In order to achieve UTM airspace conformance, the sUAS operator needs to be supplied with information regarding airspace constraints and UTM-related information from the UAS service supplier. Specifically, the sUAS operator needs to be informed about current airspace sector constraints and other important notifications. Therefore, the generalized functions were labelled Airspace conformance and UTM related information with the contributing physical functions Airspace sector approval and Message status (cf. Figure 5).

4.3.4. Critical System Failures—Vehicle Health

In order to counteract potential hazards due to failures of safety-critical systems, the health of the technical systems of the sUAS itself needs to be monitored. The relating abstract function was labeled Vehicle health. Five generalized functions and five physical functions were defined to ensure vehicle health. The generalized functions were labeled as the monitoring of Motor health, Data transfer, Electrical supply, Sensor health, and Positional accuracy.
Monitoring of motor health is accomplished by supervising the physical processes that are necessary for motor operation, such as the spinning of the rotors. Assurance of successful data transfer between the aircraft and the ground control station is accomplished by monitoring the physical processes that are necessary for ground–vehicle telemetry, i.e., successful transmission and reception of radio signals. One necessary requirement for the monitoring of the motor and data transfer functions is the supply with electrical energy. Therefore, the physical function Storage and the distribution of electrical energy were defined.
In order to ensure that sensor data is trustworthy and not corrupt, a plausibility check of the received data is necessary. Thus, the physical sensor processes, i.e., sensor health need to be monitored (e.g., in terms of signal count/second). The corresponding physical function was labeled Sensor processes.
Positional accuracy is a critical function, especially when it comes to missions requiring operation of the sUAS in close proximity to solid and potentially dangerous structures, such as powerlines [62]. Therefore, an estimate of the current vertical and horizontal positional accuracy needs to be computed from the different methods of determining the position of the sUAS (e.g., the (Differential) Global Positioning System (GPS/ DGPS) or barometric altitude). This estimate needs to be monitored constantly. The computation of the accuracy estimate represents a physical function and was labeled Processes for position determination.

4.3.5. Unsafe Proximity to People and Property—Minimization of Risk to the Public

A fundamental aspect related to safety monitoring of UAS in low-altitude urban airspace is the risk of potential casualties because of an accident. The casualty risk caused by a UAS crash needs to be minimized. Accordingly, the abstract function relating to unsafe proximity to people and property was labeled Minimization of risk to the public. The subsequent generalized function was labeled Casualty risk. An estimation of the current casualty risk during UAS operation can be computed using real-time risk assessment. One example for such a risk assessment framework for UAS UTM was developed by Ancel et al. [35,36]. They developed an algorithm that computes the current mishap likelihood based on current system parameters. In addition, the mishap severity is derived from the estimated impact area and the population density around it. The computations of Mishap severity and Mishap likelihood were defined as the required physical functions contributing to the generalized function Casualty risk.

4.4. Design of Unambiguous and Meaningful Icons (Design Principles 2, 3 and 4)

In order to visualize safety-critical system states related to the generalized functions of the abstraction hierarchy depicted in Figure 5, function-specific icons were developed. The icons were designed based on the icon design principles presented in Table 2. Table 3 shows the designed icons and a brief description of the design rationale. Further, the table shows the order of arrangement of the icons in each column (cf. Figure 2 and Figure 3) based on the abstract functions.

4.5. Definition of System States and Hues (Design Principles 2 and 5)

The three system states nominal, caution, and warning were defined for each generalized function. In order to enhance awareness of successful execution of the command and geo-fence conformance as well as rerouting around obstacles, terrain, and traffic functions, a fourth state was introduced and labeled expected change. This state can be regarded as equivalent to the advisory state in current large aircraft cockpits [61]. A function is in the expected change state when a flight parameter is changing intentionally and as expected. As such, the human operator should be aware of the change but not be alarmed by it. For example, if the flight plan expects the sUAS to climb to 55 m and the sUAS is in the process of climbing, the command conformance function is in the expected change state. Similarly, when encountering a geo-fence or a rogue vehicle and the ICAROUS algorithm computes an alternative trajectory, the geo-fence conformance or the reroute around obstacles, terrain and traffic functions are active and impact the command conformance function due to updating the flight plan. Thus, an expected change occurs and both functions (i.e., the command conformance and reroute around obstacles, terrain, and traffic function) are in expected change states.
The background color of the display is grey (RGB: 64, 64, 64). A slightly lighter gray hue (RGB: 128, 128, 128) is used to indicate nominal states. An expected change is visualized in cyan (RGB: 0, 220, 220). The color was chosen because it should not resemble urgency or caution/danger. For the caution and warning states, yellow (RGB: 255, 230, 0) and red (RGB: 255, 35, 35) were chosen, because, as opposed to cyan, they imply urgency [63]. Red was chosen to represent the warning states, as it was found to imply a more urgent state than yellow. Additionally, when a function is in a warning state, flashing is used to make the icon even more salient and draw the operators’ attention to the icon. Additionally, parallel visual search for off-nominal system states should be supported by the layout of the icon displays. The system states, a specification and examples are provided in Table 4. Note that meanings of color and thus their implications can be culture specific. This may be a limitation of this color concept which might need to be further explored.

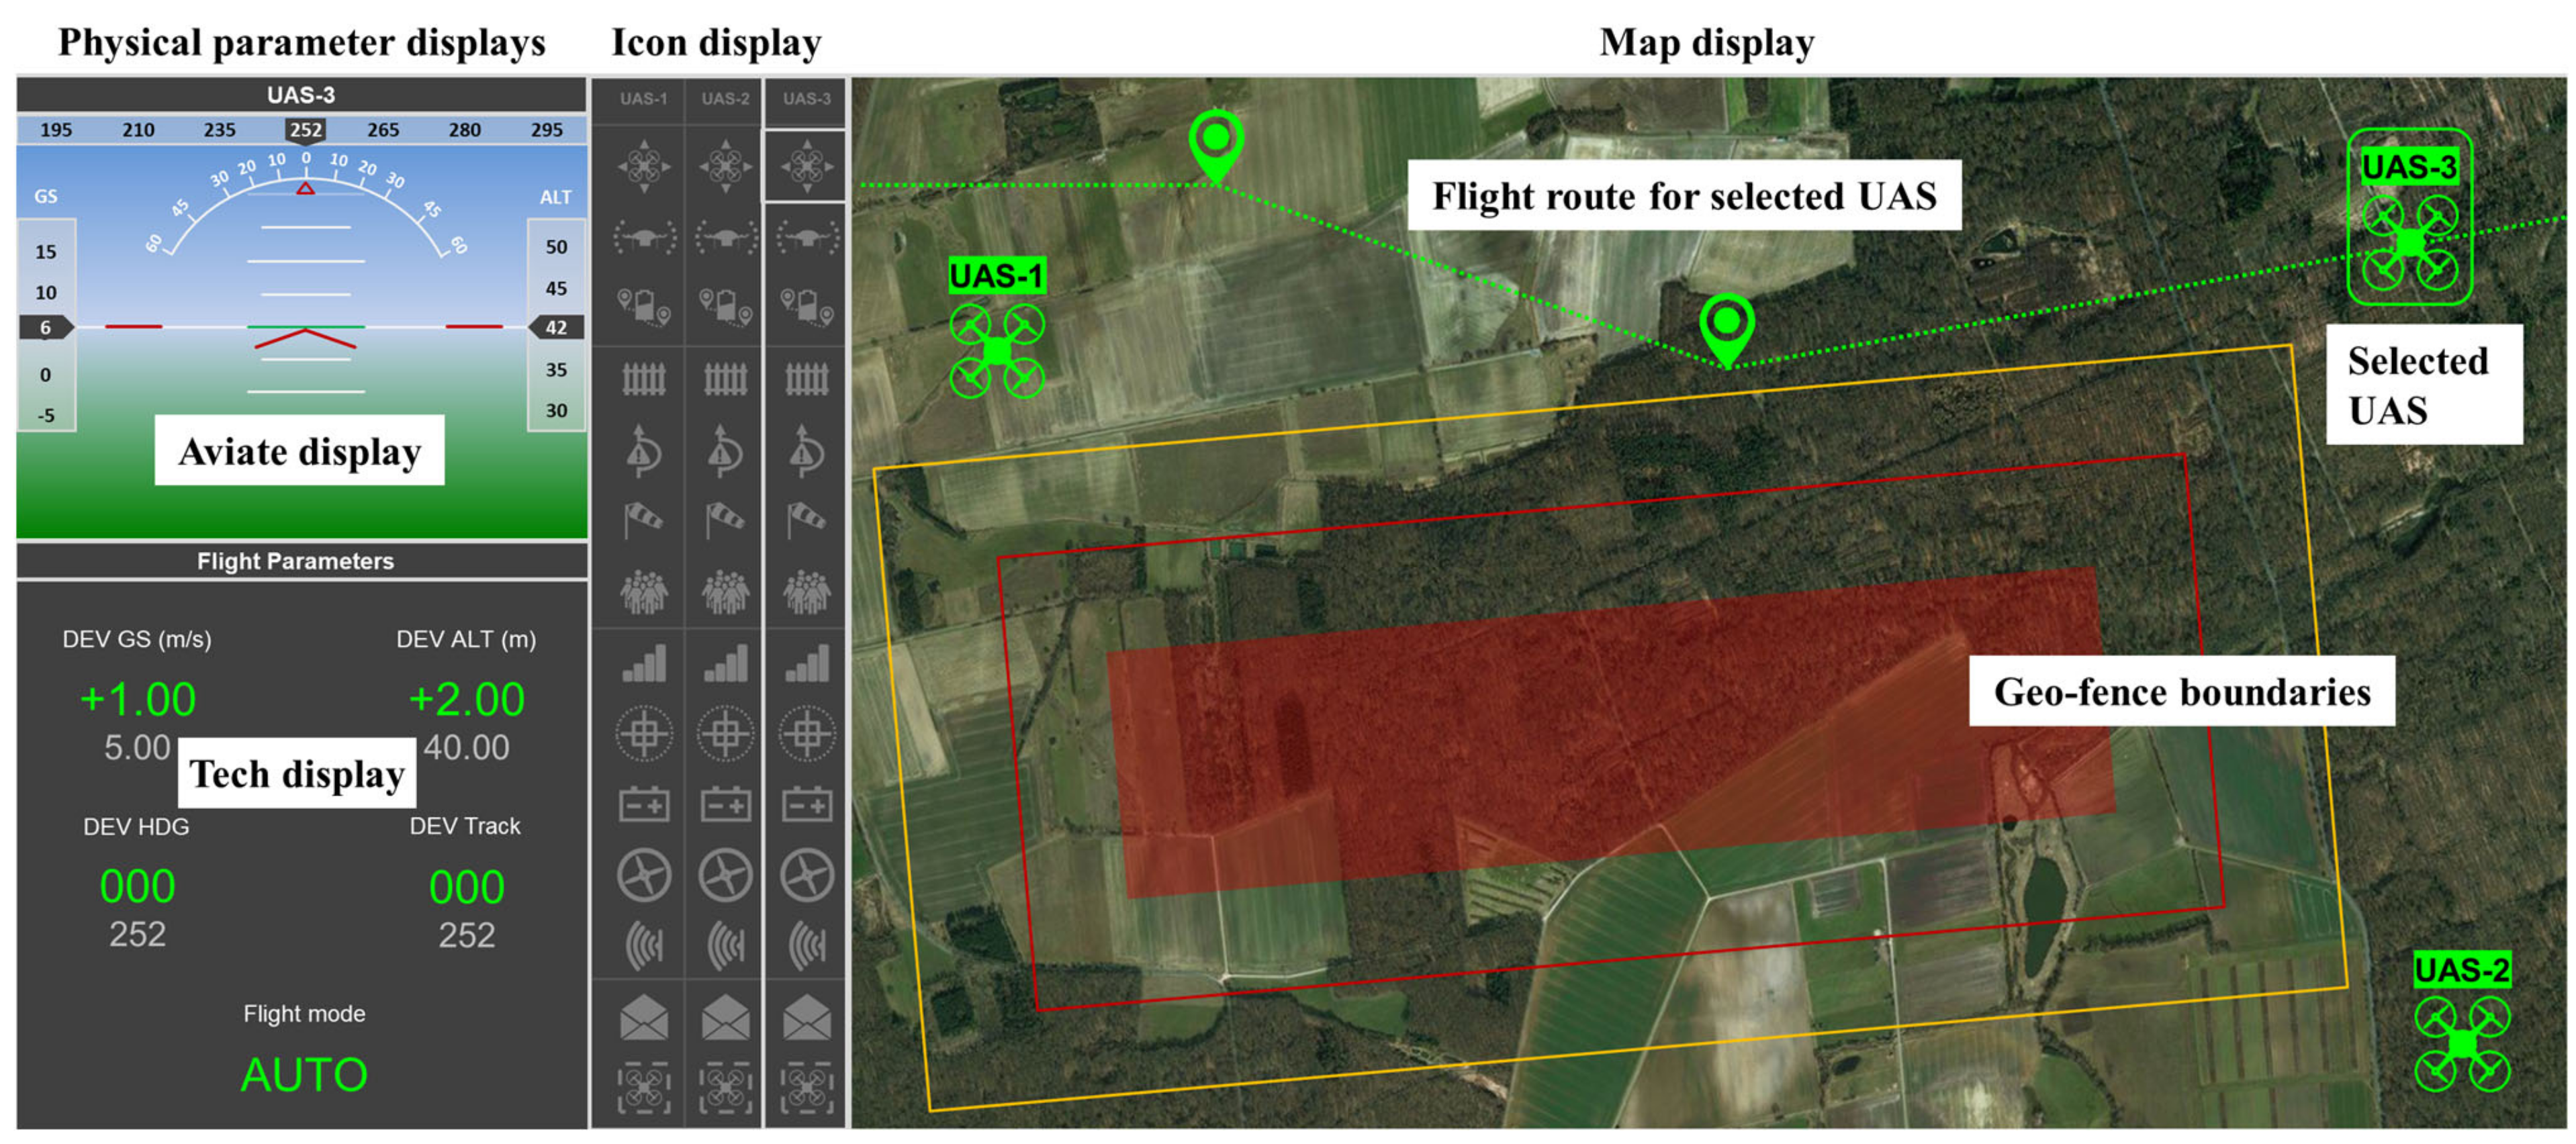
5. Final Display Layout

In the following, the final display layout will be presented and described for three different situations including nominal and off-nominal conditions as well as differing numbers of UAS under supervision. Figure 6 presents the final display layout in a situation where all three supervised sUAS are in a nominal state. In the middle of the display, the Icon display is shown, presenting the states of the identified generalized functions. Each column in the Icon display represents a different subsystem (i.e., sUAS) and each row a different generalized function. In Figure 6, all functions show a nominal state, indicated by the gray color of each icon. The column of UAS-3 is framed in white, indicating that UAS-3 is currently selected and information on physical parameters is presented. The information on physical parameters is presented on two displays on the left side of the Icon display. The upper physical parameters display (cf. Figure 6) is called the Aviate display and shows an artificial horizon including indications of current attitude, Ground Speed (GS), Altitude (ALT), and Heading (HDG). The lower physical parameters display is called Technical parameter display (or short Tech display) and presents the physical parameters of the currently selected generalized function in the icon display, which in this case is the command conformance function, indicated by the white frame around the icon. As evident from the abstraction hierarchy (see Figure 5), the parameters of the physical functions that correspond to the generalized function command conformance are the deviations between intended and actual parameter values. Whereas the Aviate display shows the current GS, ALT, and HDG, the Tech display presents the Deviations (DEV) from the intended values indicated by the letters “DEV”. For example, the GS indicator in the upper display shows a current ground speed of 6 m/s. The deviation from the intended value, which is 5 m/s, is +1.00 m/s. However, as a deviation of 1 m/s is within the acceptable range of variation, the icon of the command conformance function stays gray indicating that all flight parameters are within the acceptable limits of variation. If the GS were to exceed a predefined value of, e.g., +/− 5 m/s, the icon would turn yellow, indicating a caution state informing the operator about the conformance violation. Above the Aviate display, the call sign of the selected sUAS is shown (in this case, UAS-3 is selected). On the right side of the Icon display, the Map display (cf. Figure 6) is presented, showing geographical information such as the position of the sUAS, geo-fence boundaries and the flight route of the selected sUAS. In the Aviate, Tech, and Map displays, only the parameters from the physical functions and physical forms levels of the selected sUAS, i.e., UAS-3, are shown.
Figure 7 presents a situation with eight UAS in which a rogue UAS (shown in magenta) is approaching the currently selected UAS-4. As the situation could potentially result in a collision, the collision avoidance system (in this case ICAROUS) computed a new trajectory around the rogue UAS to evade it. The updated trajectory (which represents information from the physical forms abstraction level) is visualized with cyan lines in the Map display. The icons representing the generalized functions obstacle, terrain and traffic, and command conformance are displayed in cyan, indicating that the flight plan has intentionally been updated in order to avoid a collision and therefore the flight mode intentionally changed to GUIDED (i.e., guided by ICAROUS). The flight mode indicator together with other relevant physical parameters are shown in the Tech display in the bottom left of Figure 7.
Simultaneously to the rogue UAS encounter of UAS-4, UAS-2 is experiencing a loss of data link. This critical event is visualized by the red icons representing data transfer (due to the impaired signal strength) and command conformance (due to the unreliable/ unavailable data of the UAS) as well as the red colored icon of the UAS itself. If the human operator wished to get more detailed information, they could select the red icons in the Icon display and the information would be displayed in the Tech display.
Figure 8 presents the display during a critical situation for UAS-3 due to a problem in the electrical supply function while UAS-1 is simultaneously and intentionally rerouting around a geo-fence. In Figure 8, UAS-3 is currently selected, indicated by the white frame around the column in the Icon display. Consequently, only physical information on UAS-3 is being displayed in the Aviate, Tech, and Map displays. Further, the icon representing the generalized function range and endurance for UAS-3 is selected. Accordingly, the information presented in the Tech display is physical information (i.e., information from the physical functions and forms levels of abstraction), corresponding to the generalized function range and endurance. The displayed parameters are the estimated remaining ranges and endurances in meters and minutes after successful completion of the intended flight plan (Range/Endurance Flight Plan) as well as after a potential direct return to the launch point (Range/Endurance Home). In this case, the estimated range and endurance after completing the intended flight plan are below 0 for UAS-3, meaning that the flight plan cannot be completed. However, if the UAS-3 were to directly return to the launch point, the estimated remaining range would still be 200 m with a leftover endurance of 5 min. Consequently, in the icon display, the icons representing the generalized functions command conformance, range, and endurance, as well as electrical supply show caution states, indicated by the yellow color. Even though the corresponding physical parameters of the electrical supply functions are not displayed, the operator can assume that there must be a malfunction of the battery due to which the remaining range is not sufficient for completing the intended flight plan. By selecting the electrical supply icon and retrieving the corresponding physical parameters, they could confirm that assumption. The caution state of the command conformance icon results from the fact that the flight mode of UAS-3 switched to the so-called Return to Launch mode (RTL). The flight mode indicator (physical parameter related to the generalized function command conformance) is not shown since the range and endurance icon is currently selected. However, by looking at the yellow command conformance icon and the current flight route, displayed in yellow on the Map display, the operator is able to see that the flight route of UAS-3 has been modified and that it is directly returning to the launch point. The flight route and waypoints that could still be reached as well as the RTL route are displayed on the Map display in yellow, and the route section and waypoints that cannot be reached anymore are displayed in red.
Simultaneously, UAS-1 is encountering a geo-fence which was set up after planning the flight for UAS-1. The avoidance maneuver is indicated by the cyan color of the command conformance and geo-fence conformance icons as well as the icon representing the sUAS itself. The cyan color of the command conformance icon indicates a change of flight plan and flight mode (to GUIDED), and the cyan color of the geo-fence conformance icon indicates that the flight plan and flight mode changed intentionally due to encountering the geo-fence. Note that the updated flight route of UAS-1 is not shown in the Map display, as the flight route represents physical information of UAS-1, but UAS-3 is currently selected, meaning that physical information is only shown for UAS-3. By selecting UAS-1, the operator can display the flight route on the Map display.
Figure 6, Figure 7 and Figure 8 show the advantage of the proposed display design concept with regard to multiple UAS supervision. By systematically hiding information from the primary view, the display design concept enables the human operator to concentrate on one sUAS in a potentially critical situation while still being able to monitor the states of the other sUAS under supervision. Simultaneously, the display is kept simple and implements the criteria for supporting parallel visual search for off-nominal system states in the Icon display.

6. HMI Evaluation

An evaluation study with seven Subject Matter Experts (SME) was conducted. The study was an online study using mock-ups of the designed HMI (cf. Figure 6, Figure 7 and Figure 8). The use of system mock-ups without extensive simulations requiring a considerable amount of development is a commonly used tool for early evaluations of HMI concepts [64,65,66,67]. Given that the mock-up correctly reflects the behavior of the assumed system and all parts of the assumed system have been tested in the field, the results of the mock-up-based HMI evaluation may be generalized to a real environment. The aim of the study was to first investigate if the SMEs perceive themselves as situationally aware while using the HMI to monitor multiple UAS simultaneously during nominal and off-nominal situations. Second, it was investigated how much effort they think would be required to use the HMI. Third, it was investigated if the perceived complexity of the display is in fact within acceptable limits, as postulated by the design concept.

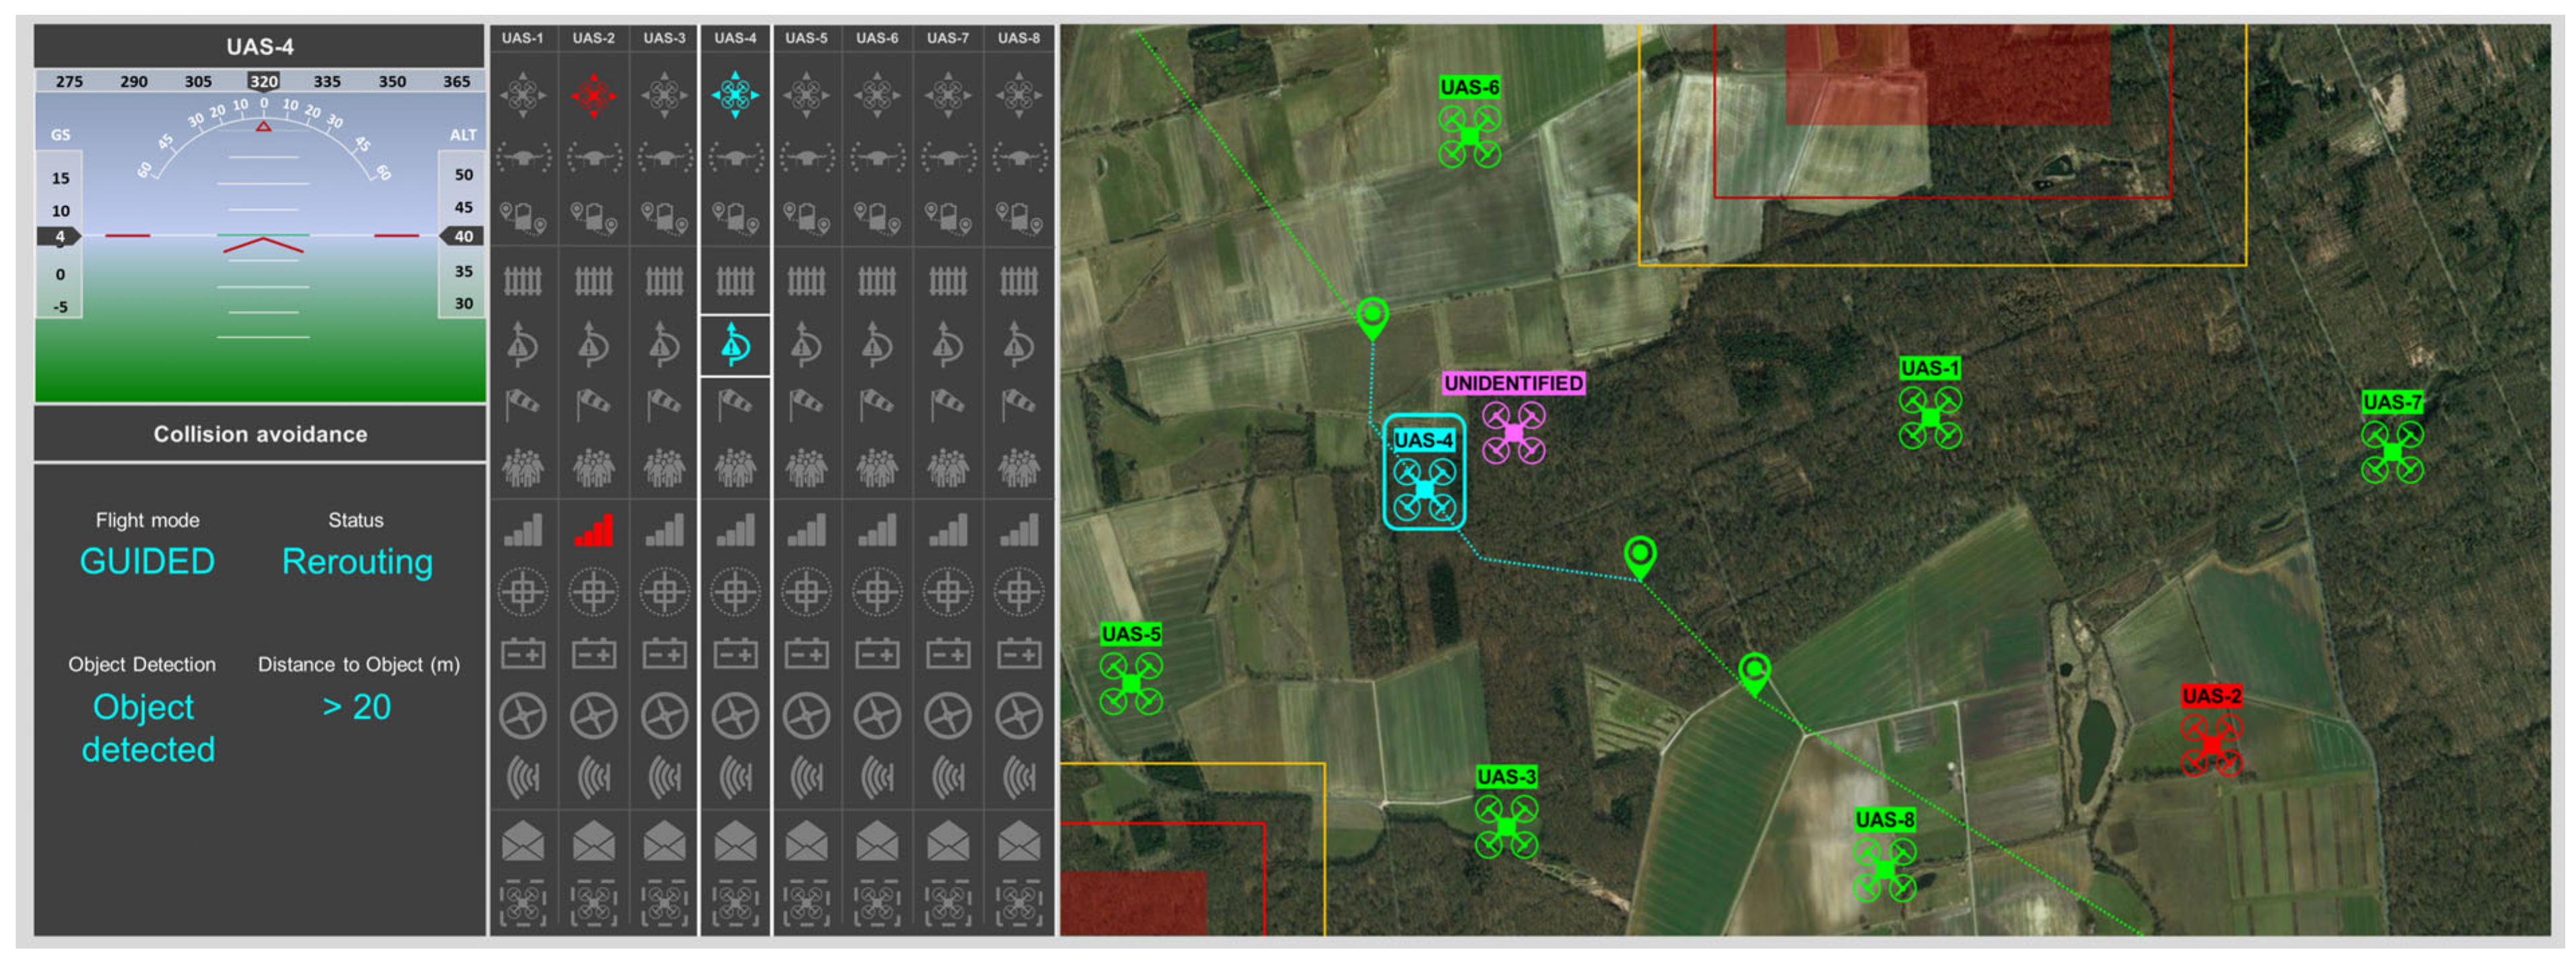
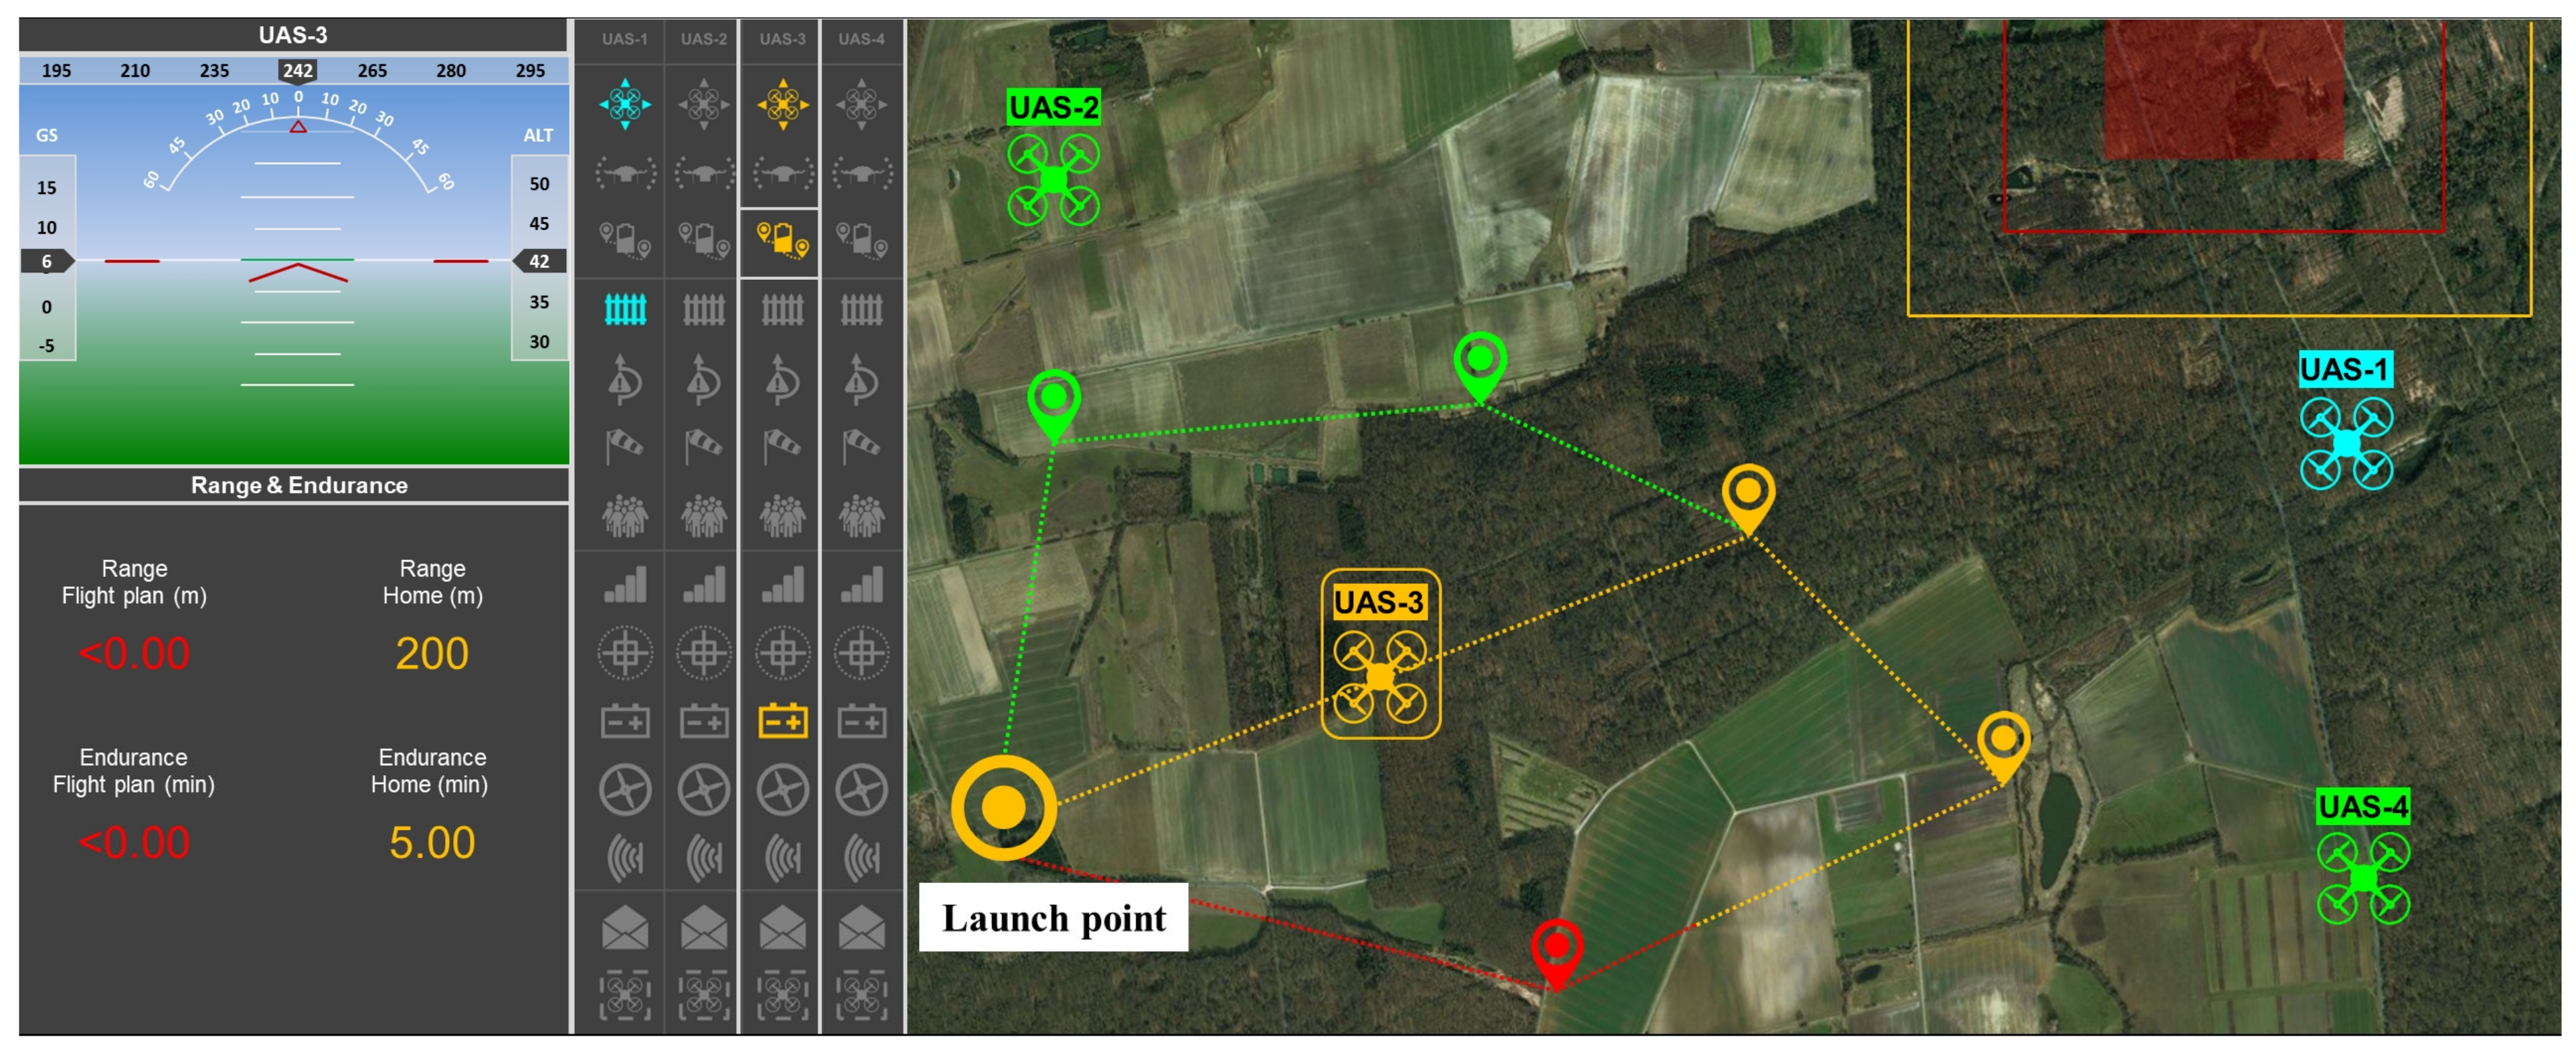
6.1. Scenarios and Tasks

The participants completed four different scenarios. Three of the scenarios utilized static versions of the mock-up, meaning that the sUAS were not moving and system parameters did not vary. However, user interaction with the mock-up was possible and the participants were able to “click through” the mock-ups and retrieve information as they wished (they were, for example, able to click on each of the sUAS to show their flight routes as well as retrieve information on the physical parameters of each generalized function by clicking on the respective icons). In each of the static scenarios, eight sUAS were under supervision, of which two were experiencing an off-nominal event. In scenario 1, UAS-1 encountered a geo-fence and was currently rerouting (displayed by the cyan color of the command and geo-fence conformance icons as well as the UAS icon on the Map display) and UAS-6 experienced a degraded positional accuracy due to a low number of available satellites (displayed by the red color of the command conformance and positional accuracy icons as well as the UAS icon on the map display). Scenario 2 included an encounter with a rogue UAS for UAS-4 and a loss of data link for UAS-2, as depicted in Figure 7. Scenario 3 consisted of a geo-fence encounter for UAS-8 and a degraded range due to low battery voltage and subsequent return to the launch point for UAS-5. This scenario closely resembled the situation depicted in Figure 8, only with eight instead of four sUAS. In each static scenario, the participants were instructed to report which of the sUAS were currently experiencing off-nominal situations, name the problem including the affected system parameters (e.g., degradation of positional accuracy due to a low number of satellites), and articulate their thoughts while clicking through the mock-up to retrieve the information they based their assessment on. The order of the scenarios was randomized across all participants to mitigate possible learning effects.
Scenario 4 consisted of a video showing the mock-up with eight dynamic (i.e., moving) sUAS and varying system parameters. The participants were not able to interact with the HMI in scenario 4. Throughout the video, the positional accuracy icon of UAS-6 was selected, meaning that the participants only saw the flight route of UAS-6 on the Map display and the physical parameters of the positional accuracy function in the Tech display. During the course of the video, each of the UAS experienced off-nominal events (leading to color changes of the icons of the affected functions and UAS) and the participants were instructed to (1) stop the video once they observed an off-nominal event and (2) report what the event was in a similar manner as in the static scenarios. Note that the participants based their interpretation of the events only on the information they received from the Map display and the color changes of the icons in the Icon display, as UAS-6 was selected at all times. The events were essentially the same as in the static scenarios (e.g., rogue UAS/ geo-fence encounter or degraded range), only the flight routes and therefore the positions of the UAS on the Map display differed.

6.2. Dependent Variables

6.2.1. Performance

A video of the screen and the voice of the participants were recorded. From the recordings, the performance of the participants was determined, i.e., whether they correctly identified the events and the system parameters that displayed the off-nominal condition. Further, it was analyzed how they reached their conclusions.

6.2.2. Display Complexity

In order to obtain a measure of the perceived display complexity, a questionnaire to evaluate information complexity on displays [68] was used. For the purpose of this study, the questionnaire was shortened, because some of the questions required active interaction with the display. These questions were removed. The questionnaire consisted of 26 statements regarding the perceived visual complexity, which are answered on a 6-point Likert scale, ranging from 1 to 6. High values point to a favorable and low values to an unfavorable result.

6.2.3. Situation Awareness

For obtaining a measure for situation awareness, the Situation Awareness for Solutions for Human Automation Partnerships in European Air Traffic Management (SASHA) questionnaire [69] was used. In order to use the questionnaire for the static mock-up scenarios, the questions needed to be modified slightly and one question was deleted. The questionnaire consisted of five statements, which were answered on a 7-point Likert scale, ranging from 0 to 6. High values point to a favorable and low values to an unfavorable result.

6.2.4. Perceived Effort

The perceived effort needed to use the display was obtained with the Perceived Ease of Use questionnaire by Davis [70]. This questionnaire consisted of six statements that are answered on a 7-point Likert scale, ranging from 0 to 6. High values point to a favorable and low values to an unfavorable result.

6.3. Procedure

The study was conducted online using a conference call software. In the beginning, each participant gave their informed consent for inclusion in the study, followed by a 30 min presentation explaining the scope of the study and the functionalities of the HMI. A 15 min training followed, during which the participants made themselves familiar with the HMI using a mock-up showing a static scenario with eight UAS, one of which was currently rerouting around a geo-fence. To interact with the HMI, screen control was transferred to the participants. After the training, the three static scenarios were conducted in a randomized order. On average, the participants needed five minutes to complete each scenario. After the static scenarios, the dynamic scenario was presented (five minutes), followed by an online questionnaire (~25 min). In total, participation in the study took about 90 min.

6.4. Participants

Seven participants took part in the study. The mean age was 36 years. Six of the participants held an active UAS license, and the mean UAS flight experience was 40 h on various UAS types, such as DJI Phantom (DJI, Shenzhen, China), Mavic Pro (DJI, Shenzhen, China), or SwissUAV V125. (Swiss UAV AG, Niederdorf, Switzerland).

6.5. Results

6.5.1. Performance

The screen and voice recordings indicated that all participants could correctly identify each critical event. For scenarios 2 and 3, all participants could identify the physical parameters that displayed off-nominal values and caused the critical conditions. In scenario 1, one participant was not able to correctly identify the cause of the degraded positional accuracy. From the screen recordings, each participant’s strategy to gather the required information could be identified. For the most part, the participants used the Icon and the Map display to retrieve the information they needed. Only when they narrowed down the causes of critical system states (i.e., caution and warning states) did they retrieve the detailed (physical) information from the Tech display. For the expected change states during reroute maneuverers, most participants looked at the Tech display only once (mostly during the first scenario). In the remaining scenarios, they mainly relied on the information they received from the Icon and Map displays, which essentially were the cyan colored icons and the adapted flight route, also displayed in cyan.

6.5.2. Display Complexity

The mean score of the display complexity questionnaire was 4.69 (SD = 0.62) with a median of 5 across all participants. Of particular interest for the support of parallel visual search were the results of the first four questions, which answer the question how easily information could be found on the display. For questions 1, 2, and 4, the median score was 5, and for question 3 the median score was 4.

6.5.3. Situation Awareness & Perceived Effort

The mean situation awareness score across all participants was 4.97 (SD = 0.62) with a median of 5. The mean score for the ease of use was 5.12 (SD = 0.60) with a median of 5.17. Table 5 depicts the descriptive results for all dependent variables.

7. Discussion

This paper derives, demonstrates, and evaluates a display design concept that aims to limit display complexity of HMIs that support the monitoring of safety risks associated with the operation of sUAS in low-altitude urban airspace. The display design concept is based on five design principles which were introduced and applied to design a display supporting the monitoring of multiple sUAS flying at low altitudes in urban airspace. The display visualizes system states of safety relevant system functions using unique icons that change hue according to current system states. The rationale of the design approach is to primarily visualize system states of highly abstracted functions from the generalized functions level of an abstraction hierarchy and hide information from lower abstraction levels from the primary view. The final display layout was presented for three different situations including nominal and off-nominal conditions and evaluated by seven subject matter experts.

7.1. Visualization Approach

The main notion of EID is to enable the human operator to gain a deep understanding of the current state of the system that they are supervising. This is done by displaying all variables associated with the physical processes and functions of the system [3,48]. However, this paper argues that in order to avoid scanning failures [10], it is necessary to limit the complexity of HMIs. This is especially true when it comes to the supervision of multiple highly complex systems with various modes of operation and vast amounts of system parameters that need to be monitored. If all variables in this case were to be shown on the display, the information load would simply be too high for a human operator to comprehend. In order to limit display complexity, it is necessary to limit the amount of simultaneously displayed variables. This paper demonstrates that it is possible to adapt the EID approach to design a display that should enable a human operator to gain a deep understanding of the current system state, although the amount of simultaneously displayed information is limited. It is shown that it should be possible to support parallel visual search for off-nominal conditions and enable the human operator to effortlessly perceive the current state of the system by systematically hiding detailed technical information from low abstraction levels with a high resolution of the system. Instead, system states on higher abstraction levels and lower system resolution are displayed using unique icons.
The results of the evaluation study provide initial empirical proof that the display complexity of the designed HMI is at least within acceptable limits. The results of the display complexity questionnaire showed considerably high (i.e., favorable) scores with a mean of 4.69 (maximum possible value: 6). The results of the display complexity questionnaire were also informative regarding the goal to support parallel visual search in the display. The questions evaluating parallel visual search showed moderate to high scores, providing data backing the assumption that the HMI design supports parallel visual search for information. However, more empirical studies are necessary to support this hypothesis that gather eye tracking data of participants while using the display.

7.2. Functional Decomposition Approach

The design approach of only displaying high-level system states itself is not new. Many cockpit design philosophies already implement this approach by presenting only high-level status information of the system, sometimes referred to as the dark display design philosophy (for details, please refer to the works in [71,72]). Oftentimes, the pilots are only notified in off-nominal conditions; otherwise, the displays stay dark (or silent). For the most part, these HMIs provide information on physical functions and processes, and are heavily based on the technical structure of the aircraft. They do not provide information on the functional implications of different conditions of physical functions. The pilot might for example be warned about a hydraulic failure leading to the inability to deflect flaps. The inability of deflecting flaps then implies among others the necessity for a higher speed during the approach and landing phases (to prevent the aircraft from stalling), resulting in a longer landing distance. However, information on these functional implications is not displayed. Pilots must be able to derive the functional implications from the technical information—if they are not, it can result in a safety risk. Especially during situations with a high workload for the pilots (such as the landing phase) or during unfamiliar situations that require experience to quickly derive the functional implications of a system failure, making the right decisions is challenging. As such, presenting the functional implications would relieve the pilots of the cognitive processing of technical data (to derive the functional implications) and thus limit the amount of additional workload resulting from, e.g., a hydraulic failure or an unfamiliar situation. The pilots would therefore be supported in making the right decisions despite the complexity and unfamiliarity of the situation.
An HMI designed according to ecological interface design principles displays these functional consequences. However, EID HMIs include all parameters entering into a system and all means–end relationships of system functions of adjacent abstraction levels. This leads to an HMI that provides the human operator with a lot of information, resulting in a more difficult visual search when monitoring the HMI. The increased time needed for visual search could lead to important information being perceived slower or not at all, which could be a safety risk. The proposed display design concept presented in this paper approaches this issue by implementing key design principles to support parallel visual search while presenting the functional implications resulting from an off-nominal system state or a failure condition.
The display design concept aims to combine the advantages of a quick visual search resulting from a more decluttered HMI while providing the human operator with both physical information and information on functional consequences. Information about the failure of a physical function, such as sudden loss of battery voltage, leading to warning states for the generalized functions electrical supply, range and endurance, and command conformance, is available to the operator on the Icon display due to the respective icons changing their hues. Hereby, the warning states of the command conformance and range and endurance functions represent the functional consequence of the battery failure (i.e., the sUAS is about to enter a contingency maneuver since it cannot execute the intended flight plan anymore). Therefore, the operator is not left to evaluate the functional consequences of the sudden loss of battery voltage by themselves. Instead, the functional consequences are comprehensively visualized through the icon hues, supporting the operator in quickly understanding the current situation.
By displaying information on the generalized functions using simple icons, the supervision of multiple sUAS is supported. If two or more sUAS under the supervision of the operator encounter a problem, the operator can quickly perceive these problems through parallel visual search. The hue of the icon informs the operator if they have to manage the problem or if the system is taking care of it. This functional decomposition and information visualization approach of the proposed display design concept thus enables the operator to quickly perceive current system states (using parallel visual search) and gain an understanding the functional implications resulting from different system states including safety critical system failures of all sUAS under supervision. The results of the evaluation study support the hypothesis that the display enables an operator to quickly gather an understanding of the cause and the functional consequences of a critical situation. The screen and voice recordings indicated that the participants were able to correctly identify the causes of a critical situation, e.g., a low battery voltage, and identify the functional consequences.
The SASHA scores for measuring situation awareness were also considerably high, indicating that the participants perceived themselves as situationally aware while using the HMI during the scenarios. Furthermore, the scores of the ease of use questionnaire indicated that the participants thought that not much effort would be required to use the HMI.

7.3. Future Work

This paper derives a new display design approach based on several design principles. These design principles were then applied in the design of a new HMI and the resulting HMI was evaluated. The next steps that are planned to further develop the design approach are described in the next sections.

7.3.1. Further Evaluation Studies

The results of the evaluation point to a successful implementation of the design approach, resulting in an adequate display complexity, ease of use, and a high situation awareness while supporting parallel visual search. However, the conclusions are limited due to the low fidelity of the mock-ups and the small sample size. As such, studies are needed that specifically aim to investigate whether the designed HMI for monitoring multiple sUAS (1) supports parallel visual search for off-nominal system states (using eye-tracking data) and (2) enables an operator to gain a deep understanding of the current state of the system despite limiting the amount of simultaneously displayed variables. If the rationale behind the proposed display design concept holds true, the operators should be able to quickly and correctly perceive the impact of a critical functional state on the performance of other system functions that share a common means–end relationship, despite hiding information from lower abstraction levels from the primary view.

7.3.2. Embedding the HMI into a Simulation Environment

In order to evaluate the HMI further, studies in which the participants have the possibility to actively intervene are necessary. For this purpose, the HMI needs to be embedded into a simulation environment. The simulation environment needs to be capable of real-time simulation of multiple sUAS and simulate the envisioned capabilities of the system as assumed in this paper (e.g., geo-fencing and autonomous collision avoidance). One future approach could be to develop an interface to connect the HMI and the ArduSim simulation environment [73], which is capable of simulating multiple multicopters accurately and in real-time.

7.3.3. Application to Other Use Cases

In addition, the display design concept may be applied to another use case. This paper, for example, assumes that the sUAS are operated in UTM airspace, the air traffic management ecosystem developed by the NASA and the FAA in the U.S. [1]. However, the European-wide concept of operations for UAS called U-Space was recently released [26,27]. U-space and UTM differ in a number of aspects, for example, in the definition of the so-called very low-level airspace in which sUAS are supposed to be operated. The proposed display design concept could easily be applied to design an HMI to support an operator supervising multiple sUAS operated in U-space airspace. Most likely the differences between UTM and U-space will become predominantly evident on the physical functions and forms levels of abstraction as both systems serve the same purposes but partly achieve the purposes using different approaches reflected on the physical functions level.

8. Conclusions

The novelty of the proposed display design concept lies in the application of EID principles while hiding information from low abstraction levels to limit display complexity. The scientifically derived design principles were thoroughly introduced, and the design concept was applied to design an HMI that supports monitoring of safety critical functions of multiple sUAS operated in low-altitude urban airspace. While the designed display was only evaluated with a small sample size using mock-ups, this paper thoroughly demonstrates the advantages of the display design concept and the resulting HMI. Thus, further exploration of the proposed display design concept within the scope of simulation studies using simulation environments such as ArduSim [73] is warranted.

Author Contributions

Conceptualization, M.F. and M.V.; Data curation, M.F.; Formal analysis, M.F.; Investigation, M.F.; Methodology, M.F. and M.V.; Software, M.F.; Supervision, M.V.; Visualization, M.F.; Writing—original draft, M.F.; Writing—review and editing, M.V. All authors have read and agreed to the published version of the manuscript.

Funding

This research did not receive external funding.

Informed Consent Statement

Informed consent was obtained from all subjects involved in the study.

Acknowledgments

The authors thank Steven Young and Maik Friedrich for their constructive and helpful feedback.

Conflicts of Interest

The authors declare no conflict of interest.

Abbreviations

ALTAltitude
EIDEcological Interface Design
DEVDeviation
DGPSDifferential Global Positioning System
FAAFederal Aviation Authority
HDGHeading
GPSGlobal Positioning System
GSGround Speed
HMIHuman–Machine Interface
MALEMedium Altitude Long Endurance
NASANational Aeronautics and Space Administration
RTLReturn to Launch
SASHASituation Awareness for Solutions for Human Automation Partnerships in European Air Traffic Management
SMESubject Matter Expert
UASUnmanned Aircraft System
sUASSmall Unmanned Aircraft System
UTMUnmanned Aircraft Systems Traffic Management

References

  1. Aweiss, A.S.; Owens, B.D.; Rios, J.L.; Homola, J.R.; Mohlenbrink, C.P. Unmanned Aircraft Systems (UAS) Traffic Management (UTM) National Campaign II. In Proceedings of the 2018 AIAA Information Systems-AIAA Infotech @ Aerospace, Kissimmee, FL, USA, 8–12 January 2018. [Google Scholar] [CrossRef] [Green Version]
  2. Peinecke, N.; Kuenz, A. Deconflicting the urban drone airspace. In Proceedings of the 2017 AIAA/IEEE 36th Digital Avionics Systems Conference (DASC), St. Petersburg, FL, USA, 16–21 September 2017. [Google Scholar] [CrossRef]
  3. Borst, C.; Flach, J.M.; Ellerbroek, J. Beyond ecological interface design: Lessons from concerns and misconceptions. IEEE Trans. Hum. Mach. Syst. 2015, 45, 164–175. [Google Scholar] [CrossRef]
  4. Feigh, K.M.; Pritchett, A.R. Requirements for effective function allocation: A critical review. J. Cogn. Eng. Decis. Mak. 2014, 8, 23–32. [Google Scholar] [CrossRef]
  5. Pritchett, A.R.; Kim, S.Y.; Feigh, K.M. Measuring human-automation function allocation. J. Cogn. Eng. Decis. Mak. 2014, 8, 52–77. [Google Scholar] [CrossRef] [Green Version]
  6. Sheridan, T.B.; Verplank, W.L. Human and Computer Control of Undersea Teleoperators. Massachusetts Inst of Tech Cambridge Man-Machine Systems Lab 1978. Available online: https://apps.dtic.mil/sti/pdfs/ADA057655.pdf (accessed on 9 March 2021).
  7. Parasuraman, R.; Sheridan, T.B.; Wickens, C.D. A model for types and levels of human interaction with automation. IEEE Trans. Syst. Man Cybern. Part A Syst. Hum. 2000, 30, 286–297. [Google Scholar] [CrossRef] [PubMed] [Green Version]
  8. Bonner, M.; Taylor, R.; Fletcher, K.; Miller, C.A. Adaptive automation and decision aiding in the military fast jet domain. In Proceedings of the Conference on Human Performance, Situation Awareness and Automation: User-Centered Design for the New Millennium, Savannah, GA, USA, 15–19 October 2000; Available online: http://citeseerx.ist.psu.edu/viewdoc/download?doi=10.1.1.123.253&rep=rep1&type=pdf (accessed on 9 March 2021).
  9. Ferrell, W.R.; Sheridan, T.B. Supervisory control of remote manipulation. IEEE Spectr. 1967, 4, 81–88. [Google Scholar] [CrossRef]
  10. Jones, D.G.; Endsley, M.R. Sources of situation awareness errors in aviation. Aviat. Space Environ. Med. 1996, 67, 507–512. [Google Scholar]
  11. Sarter, N.B.; Woods, D.D. How in the World Did We Ever Get into That Mode? Mode Error and Awareness in Supervisory Control. Hum. Factors J. Hum. Factors Ergon. Soc. 1995, 37, 5–19. [Google Scholar] [CrossRef]
  12. Calhoun, G.L.; Ruff, H.A.; Draper, M.H.; Wright, E.J. Automation-Level Transference Effects in Simulated Multiple Unmanned Aerial Vehicle Control. J. Cogn. Eng. Decis. Mak. 2011, 5, 55–82. [Google Scholar] [CrossRef]
  13. Ruff, H.A.; Narayanan, S.; Draper, M.H. Human interaction with levels of automation and decision-aid fidelity in the supervisory control of multiple simulated unmanned air vehicles. Presence Teleoperators Virtual Environ. 2002, 11, 335–351. [Google Scholar] [CrossRef]
  14. Dixon, S.R.; Wickens, C.D.; Chang, D. Mission Control of Multiple Unmanned Aerial Vehicles: A Workload Analysis. Hum. Factors J. Hum. Factors Ergon. Soc. 2005, 47, 479–487. [Google Scholar] [CrossRef] [PubMed]
  15. Donmez, B.; Cummings, M.L.; Graham, H.D. Auditory Decision Aiding in Supervisory Control of Multiple Unmanned Aerial Vehicles. Hum. Factors J. Hum. Factors Ergon. Soc. 2009, 51, 718–729. [Google Scholar] [CrossRef] [PubMed] [Green Version]
  16. Cummings, M.L.; Mitchell, P.J. Automated scheduling decision support for supervisory control of multiple UAVs. J. Aerosp. Comput. Inf. Commun. 2006, 3, 294–308. [Google Scholar] [CrossRef]
  17. Fortmann, F.; Lüdtke, A. An intelligent SA-adaptive interface to aid supervisory control of a UAV swarm. In Proceedings of the 2013 IEEE International Conference on Industrial Informatics (INDIN), Bochum, Germany, 29–31 July 2013. [Google Scholar] [CrossRef]
  18. Fern, L.; Rorie, R.C.; Pack, J.; Shively, J.; Draper, M. An Evaluation of Detect and Avoid (DAA) Displays for Unmanned Aircraft Systems: The Effect of Information Level and Display Location on Pilot Performance. In Proceedings of the 15th AIAA Aviation Technology, Integration, and Operations Conference, Dallas, TX, USA, 22–26 June 2015. [Google Scholar] [CrossRef] [Green Version]
  19. Rorie, R.C.; Fern, L.; Monk, K.; Santiago, C.; Shively, R.J.; Roberts, Z.S. Validation of Minimum Display Requirements for a UAS Detect and Avoid System. In Proceedings of the 17th AIAA Aviation Technology, Integration, and Operations Conference, Denver, CO, USA, 5–9 June 2017. [Google Scholar] [CrossRef]
  20. Vu, K.-P.L.; Rorie, R.C.; Fern, L.; Shively, R.J. Human Factors Contributions to the Development of Standards for Displays of Unmanned Aircraft Systems in Support of Detect-and-Avoid. Hum. Factors J. Hum. Factors Ergon. Soc. 2020, 62, 505–515. [Google Scholar] [CrossRef] [Green Version]
  21. Fuchs, C.; Borst, C.; De Croon, G.C.H.E.; Van Paassen, M.M.; Mulder, M. An ecological approach to the supervisory control of UAV swarms. Int. J. Micro Air Veh. 2014, 6, 211–229. [Google Scholar] [CrossRef] [Green Version]
  22. Perez, D.; Maza, I.; Caballero, F.; Scarlatti, D.; Casado, E.; Ollero, A. A ground control station for a Multi-UAV surveillance system: Design and validation in field experiments. J. Intell. Robot. Syst. Theory Appl. 2013, 69, 119–130. [Google Scholar] [CrossRef]
  23. Friedrich, M.; Lieb, J. A Novel Human Machine Interface to Support Supervision and Guidance of Multiple Highly Automated Unmanned Aircraft. In Proceedings of the 2019 IEEE/AIAA 38th Digital Avionics Systems Conference (DASC), San Diego, CA, USA, 8–12 September 2019. [Google Scholar] [CrossRef]
  24. Vicente, K.J.; Rasmussen, J. Ecological Interface Design: Theoretical Foundations. IEEE Trans. Syst. Man Cybern. 1992, 22, 589–606. [Google Scholar] [CrossRef] [Green Version]
  25. Treisman, A.M.; Gelade, G. A feature-integration theory of attention. Cogn. Psychol. 1980, 12, 97–136. [Google Scholar] [CrossRef]
  26. Barrado, C.; Boyero, M.; Brucculeri, L.; Ferrara, G.; Hately, A.; Hullah, P.; Martin-Marrero, D.; Pastor, E.; Rushton, A.P.; Volkert, A. U-space concept of operations: A key enabler for opening airspace to emerging low-altitude operations. Aerospace 2020, 7, 24. [Google Scholar] [CrossRef] [Green Version]
  27. CORUS. SESAR Concept of Operations for U-Space, 2019. Available online: https://www.sesarju.eu/node/3411 (accessed on 9 March 2021).
  28. Federal Aviation Administration, UTM Concept of Operations Version 2.0 (UTM ConOps v2.0), 2020. Available online: https://www.faa.gov/uas/research_development/traffic_management/media/UTM_ConOps_v2.pdf (accessed on 9 March 2021).
  29. Young, S.D.; Quach, C.; Goebel, K.; Nowinski, J. In-time safety assurance systems for emerging autonomous flight operations. In Proceedings of the 2018 AIAA/IEEE 37th Digital Avionics Systems Conference (DASC), London, UK, 23–27 September 2018. [Google Scholar] [CrossRef]
  30. EUROCAE Working Group 105. Focus Area UTM-Report: E-Identification and Geo-Fencing for Open and Specific UAV Categories; Version 1.0; EUROCAE: Saint-Denis, France, 2017. [Google Scholar]
  31. Geister, D.; Korn, B. Density based management concept for urban air traffic. In Proceedings of the 2018 AIAA/IEEE 37th Digital Avionics Systems Conference (DASC), London, UK, 23–27 September 2018. [Google Scholar] [CrossRef]
  32. Gilabert, R.V.; Dill, E.T.; Hayhurst, K.J.; Young, S.D. SAFEGUARD: Progress and test results for a reliable independent on-board safety net for UAS. In Proceedings of the 2017 AIAA/IEEE 36th Digital Avionics Systems Conference (DASC), St. Petersburg, FL, USA, 16–21 September 2017. [Google Scholar] [CrossRef] [Green Version]
  33. Consiglio, M.; Munoz, C.; Hagen, G.; Narkawicz, A.; Balachandran, S. ICAROUS: Integrated configurable algorithms for reliable operations of unmanned systems. In Proceedings of the 2016 IEEE/AIAA 35th Digital Avionics Systems Conference (DASC), Sacramento, CA, USA, 25–30 September 2016. [Google Scholar] [CrossRef] [Green Version]
  34. Consiglio, M.; Duffy, B.; Balachandran, S.; Glaab, L.; Muñoz, C. Sense and avoid characterization of the independent configurable architecture for reliable operations of unmanned systems. In Proceedings of the 13th USA/Europe Air Traffic Management Research and Development Seminar, Vienna, Austria, 17–21 June 2019; Available online: https://ntrs.nasa.gov/citations/20200002709 (accessed on 9 March 2021).
  35. Ancel, E.; Capristan, F.M.; Foster, J.V.; Condotta, R.C. Real-time risk assessment framework for unmanned aircraft system (UAS) traffic management (UTM). In Proceedings of the 17th AIAA Aviation Technology, Integration, and Operations Conference, Denver, CO, USA, 5–9 June 2017. [Google Scholar] [CrossRef] [Green Version]
  36. Ancel, E.; Capristan, F.M.; Foster, J.V.; Condotta, R.C. In-Time Non-Participant Casualty Risk Assessment to Support Onboard Decision Making for Autonomous Unmanned Aircraft. In Proceedings of the AIAA Aviation 2019 Forum, Dallas, TX, USA, 17–21 June 2019. [Google Scholar] [CrossRef]
  37. Hogge, E.F.; Kulkarni, C.S.; Vazquez, S.L.; Smalling, K.M.; Strom, T.H.; Hill, B.L.; Quach, C.C. Flight tests of a remaining flying time prediction system for small electric aircraft in the presence of faults. In Proceedings of the Annual Conference of the Prognostics and Health Management Society (PHM), St. Petersburg, FL, USA, 2–5 October 2017; Available online: https://www.phmsociety.org/sites/phmsociety.org/files/phm_submission/2017/phmc_17_006.pdf (accessed on 9 March 2021).
  38. Kulkarni, C.; Hogge, E.; Quach, C.C. Remaining Flying Time Prediction Implementing Battery Prognostics Framework for Electric UAV’s. In Proceedings of the AIAA Propulsion and Energy Forum, Cincinnati, OH, USA, 9–11 July 2018; Available online: https://ntrs.nasa.gov/citations/20180004466 (accessed on 9 March 2021).
  39. Schumann, J.; Rozier, K.Y.; Reinbacher, T.; Mengshoel, O.J.; Mbaya, T.; Ippolito, C. Towards real-time, on-board, hardware-supported sensor and software health management for unmanned aerial systems. Int. J. Progn. Health Manag. 2015, 6, 1–27. [Google Scholar]
  40. Scolari, M.; Edward, F.; Serences, J.T. Feature- and Object-Based Attentional Modulation in the Human Visual System. In Oxford Handbook of Attention; Nobre, A.C., Kastner, S., Eds.; Oxford University Press: Oxford, UK, 2014; pp. 573–600. [Google Scholar] [CrossRef]
  41. Theeuwes, J.; Van der Burg, E. The Role of Spatial and Nonspatial Information in Visual Selection. J. Exp. Psychol. Hum. Percept. Perform. 2007, 33, 1335–1351. [Google Scholar] [CrossRef] [PubMed]
  42. Wolfe, J.M.; Horowitz, T.S. What attributes guide the deployment of visual attention and how do they do it? Nat. Rev. Neurosci. 2004, 5, 495–501. [Google Scholar] [CrossRef]
  43. Carter, E.C.; Carter, R.C. Color and conspicuousness. J. Opt. Soc. Am. 1981, 71, 723–729. [Google Scholar] [CrossRef] [PubMed]
  44. Christ, R.E. Review and Analysis of Color Coding Research for Visual Displays. Hum. Factors J. Hum. Factors Ergon. Soc. 1975, 17, 542–570. [Google Scholar] [CrossRef]
  45. Wolfe, J.M.; Utochkin, I.S. What is a preattentive feature? Curr. Opin. Psychol. 2019, 29, 19–26. [Google Scholar] [CrossRef] [PubMed]
  46. Wickens, C.D.; Lee, J.D.; Liu, Y.; Gordon-Becker, S.E. An introduction to Human Factors Engineering; Pearson-Longman Publishing: Harlow, UK, 2004. [Google Scholar]
  47. Vicente, K.J. Cognitive Work Analysis: Toward Safe, Productive, and Healthy Computer-Based Work; CRC Press: Boca Raton, FL, USA, 1999. [Google Scholar]
  48. Vicente, K.J. Ecological interface design: Progress and challenges. Hum. Factors J. Hum. Factors Ergon. Soc. 2002, 44, 62–78. [Google Scholar] [CrossRef]
  49. Howitt, S.L.; Richards, D. The Human Machine Interface for Airborne Control of UAVs. In Proceedings of the 2nd AIAA “Unmanned Unlimited” Conference and Workshop and Exhibit, San Diego, CA, USA, 15–18 September 2003. [Google Scholar] [CrossRef]
  50. Wogalter, M.S.; Begley, P.B.; Scancorelli, L.F.; Brelsford, J.W. Effectiveness of elevator service signs: Measurement of perceived understandability, willingness to comply and behaviour. Appl. Ergon. 1997, 28, 181–187. [Google Scholar] [CrossRef]
  51. Hobbs, A.; Lyall, B. Human Factors Guidelines for Unmanned Aircraft Systems. Ergon. Des. 2016, 24, 23–28. [Google Scholar] [CrossRef] [Green Version]
  52. Tvaryanas, A.P.; Thompson, W.T. Recurrent error pathways in HFACS data: Analysis of 95 mishaps with remotely piloted aircraft. Aviat. Space Environ. Med. 2008, 79, 525–532. [Google Scholar] [CrossRef]
  53. Martein, R. Norms for name and concept agreement, familiarity, visual complexity and image agreement on a set of 216 pictures. Psychol. Belg. 1995, 35, 205–225. [Google Scholar] [CrossRef]
  54. McDougall, S.J.P.; Curry, M.B.; De Bruijn, O. Measuring symbol and icon characteristics: Norms for concreteness, complexity, meaningfulness, familiarity, and semantic distance for 239 symbols. Behav. Res. Methods Instrum. Comput. 1999, 31, 487–519. [Google Scholar] [CrossRef] [Green Version]
  55. Silvennoinen, J.M.; Kujala, T.; Jokinen, J.P.P. Semantic distance as a critical factor in icon design for in-car infotainment systems. Appl. Ergon. 2017, 65, 369–381. [Google Scholar] [CrossRef] [PubMed] [Green Version]
  56. Snodgrass, J.G.; Vanderwart, M. A standardized set of 260 pictures: Norms for name agreement, image agreement, familiarity, and visual complexity. J. Exp. Psychol. Hum. Learn. Mem. 1980, 6, 174–215. [Google Scholar] [CrossRef]
  57. Tsaparina, D.; Bonin, P.; Méot, A. Russian norms for name agreement, image agreement for the colorized version of the Snodgrass and Vanderwart pictures and age of acquisition, conceptual familiarity, and imageability scores for modal object names. Behav. Res. Methods 2011, 43, 1085–1099. [Google Scholar] [CrossRef] [PubMed] [Green Version]
  58. McDougall, S.J.P.; De Bruijn, O.; Curry, M.B. Exploring the effects of icon characteristics on user performance: The role of icon concreteness, complexity, and distinctiveness. J. Exp. Psychol. Appl. 2000, 6, 291–306. [Google Scholar] [CrossRef] [PubMed]
  59. McDougall, S.J.P.; Curry, M.B.; de Bruijn, O. The Effects of Visual Information on Users’ Mental Models: An Evaluation of Pathfinder Analysis as a Measure of Icon Usability. Int. J. Cogn. Ergon. 2001, 5, 59–84. [Google Scholar] [CrossRef] [Green Version]
  60. Smythwood, M.; Hadzikadic, M. The Effects of Icon Characteristics on Search Time. In Proceedings of the 9th International Conference on Applied Human Factors and Ergonomics, Orlando, FL, USA, 21–25 July 2018. [Google Scholar] [CrossRef]
  61. European Aviation Safety Agency. Certification Specification and Acceptable Means of Compliance for Large Aeroplanes (CS-25), 2020. Available online: https://www.easa.europa.eu/sites/default/files/dfu/cs-25_amendment_25.pdf (accessed on 9 March 2021).
  62. Moore, A.J.; Schuber, M.; Rymer, N. Autonomous inspection of electrical transmission structures with airborne UV sensors and automated air traffic management. In Proceedings of the 2018 AIAA Information Systems-AIAA Infotech @ Aerospace, Kissimmee, FL, USA, 8–12 January 2018. [Google Scholar] [CrossRef] [Green Version]
  63. Ng, A.W.Y.; Chan, A.H.S. Color associations among designers and non-designers for common warning and operation concepts. Appl. Ergon. 2018, 70, 18–25. [Google Scholar] [CrossRef]
  64. Durham, J.; Kenyon, A. Mock-Ups: Using Experiential Simulation Models in the Healthcare Design Process. HERD Health Environ. Res. Des. J. 2019, 12, 11–20. [Google Scholar] [CrossRef]
  65. Ricca, F.; Scanniello, G.; Torchiano, M.; Reggio, G.; Astesiano, E. Assessing the Effect of Screen Mockups on the Comprehension of Functional Requirements. ACM Trans. Softw. Eng. Methodol. 2014, 24, 1–38. [Google Scholar] [CrossRef]
  66. Peavey, E.K.; Zoss, J.; Watkins, N. Simulation and Mock-Up Research Methods to Enhance Design Decision Making. HERD Health Environ. Res. Des. J. 2012, 5, 133–144. [Google Scholar] [CrossRef]
  67. Rivero, J.M.; Rossi, G.; Grigera, J.; Burella, J.; Luna, E.R.; Gordillo, S. From Mockups to User Interface Models: An Extensible Model Driven Approach. In Proceedings of the 10th International Conference on Web Engineering, Vienna, Austria, 5–9 July 2010. [Google Scholar] [CrossRef]
  68. Xing, J. Designing Questionnaires for Controlling and Managing Information Complexity in Visual Displays (Tech. Rep. to Federal Aviation Administration No. DOT/FAA/AM-08/18). Civil Aerospace Medical Institute, Office of Aerospace Medicine: Oklahoma City, OK, USA, 2008. Available online: https://apps.dtic.mil/sti/pdfs/ADA488605.pdf (accessed on 9 March 2021).
  69. SESAR Joint Undertaking. Situation Awareness for SHAPE (SASHA), 2012. Available online: https://ext.eurocontrol.int/ehp/?q=node/1609 (accessed on 9 March 2021).
  70. Davis, F.D. Perceived Usefulness, Perceived Ease of Use, and User Acceptance of Information Technology. MIS Q. 1989, 13, 319–340. [Google Scholar] [CrossRef] [Green Version]
  71. Abbott, T.S. A Simulation Evaluation of the Engine Monitoring and Control System Display (Technical Report No. 2960), 1990. Available online: https://ntrs.nasa.gov/citations/19900009077 (accessed on 9 March 2021).
  72. Novacek, P. Design Displays for Better Pilot Reaction. Avion. News. October 2003, pp. 44–47. Available online: http://aea.net/AvionicsNews/ANArchives/DesignDisplayOct03.pdf (accessed on 9 March 2021).
  73. Fabra, F.; Calafate, C.T.; Cano, J.C.; Manzoni, P. ArduSim: Accurate and real-time multicopter simulation. Simul. Model. Pract. Theory 2018, 87, 170–190. [Google Scholar] [CrossRef]
Figure 1. Illustration of parallel and serial search. The task of the observer is to find the unique object: (a,b) the targets are presented among homogeneous distractors and defined by the unique attributes color (a) and shape (b), enabling parallel search for finding the targets. (c) The distractors are heterogeneous, and the target (horizontal green bar) is not defined by a unique attribute, leading to serial search for finding the target.
Aerospace 08 00071 g001
Figure 2. Schematic illustration of the proposed display design concept. Note: SUB = Subsystem.
Aerospace 08 00071 g002
Figure 3. Schematic illustration of the proposed display design concept for off-nominal system state indications of two generalized functions of subsystem SUB-3. The display visualizes which generalized functions are currently affected by a failure and which state they are in through the different hues. In the figure, the different hues are visualized by the patterns of the icons.
Aerospace 08 00071 g003
Figure 4. System and functional decomposition of a work system consisting of multiple sUAS according to the principles of the proposed display design concept.
Aerospace 08 00071 g004
Figure 5. Abstraction hierarchy for the work domain of an operator monitoring an autonomous sUAS operated in low-altitude urban airspace. For reasons of clarity, the number of visualized means–end relationships is limited.
Aerospace 08 00071 g005
Figure 6. Final display layout showing an exemplary non-critical situation. The yellow and red boxes represent the three geo-fence boundaries from the geo-fencing system SAFEGUARD, warning, terminate and hard boundary. DEV = deviation, GS = ground speed, ALT = altitude, HDG = heading.
Aerospace 08 00071 g006
Figure 7. Final display layout showing a situation in which UAS-3 encounters a rogue UAS and ICAROUS autonomously computes an alternative trajectory around the rogue aircraft in order to avoid a collision. Simultaneously, UAS-2 is experiencing a loss of data link.
Aerospace 08 00071 g007
Figure 8. Final display layout showing a critical situation for UAS-3. Due to a battery failure, UAS-3 cannot execute the intended flight plan and is directly returning to the launch point. At the same time, UAS-1 is rerouting around a geo-fence.
Aerospace 08 00071 g008
Table 1. System decomposition and abstraction levels of displayed information.
System Decomposition LevelFunctional Abstraction Level
Whole systemGeneralized functions
Subsystem and componentsPhysical functions
Physical forms
Table 2. Derived icon design principles.
Derived Design PrincipleMetric
Icons shall resemble the real-world object they are intended to represent.Concreteness
Icons shall entail as much detail as necessary, but as little as possible.Complexity
Icons shall include features that are familiar to the operator.Familiarity
Table 3. Designed icons and descriptions of the design rationales.
Abstract FunctionGeneralized FunctionIconDescription
Aviation of aircraftCommand conformance Aerospace 08 00071 i001sUAS + arrows representing direction of movement.
Flight envelope protection Aerospace 08 00071 i002sUAS + scales representing the bank angle.
Range & endurance Aerospace 08 00071 i003Battery capacity + route from origin to destination.
Separation to
hazards &
prohibited areas
Geo-fence conformance Aerospace 08 00071 i004Fence representing a geo-fence.
Obstacles, terrain & traffic Aerospace 08 00071 i005Arrow around a triangle + exclamation mark, representing rerouting around a potentially hazardous object.
Meteorological constraints Aerospace 08 00071 i006Wind sock representative for weather.
Minimization of
risk to the public
Casualty risk Aerospace 08 00071 i007Group of people representing the general public that needs to be protected.
Vehicle healthData transfer Aerospace 08 00071 i008Icon for signal reception quality, known from mobile phones, representing data link reception.
Positional accuracy Aerospace 08 00071 i009Cross + square + dotted circle, intended to resemble a target for representing accuracy.
Electrical supply Aerospace 08 00071 i010Battery icon, familiar from the automotive domain.
Motor health Aerospace 08 00071 i011Rotors + circle, representing a motor of a multi-copter.
Sensor health Aerospace 08 00071 i012Sensor + radio waves, representing a sensor.
UTM airspace conformanceUTM information Aerospace 08 00071 i013Open envelope, visualizing incoming mail.
Airspace conformance Aerospace 08 00071 i014Air vehicle + box with a dotted line, representing approved airspace boundaries.
Table 4. Description of the defined system states.
StateSpecificationColorExample
NominalAll parameters are within nominal limits.Gray Aerospace 08 00071 i015Range is sufficient.
Expected changeOne or more parameters are changing in an expected manner.Cyan Aerospace 08 00071 i016Guided mode engaged due to encounter of rogue traffic.
CautionOne or more parameters are approaching critical limits.Yellow Aerospace 08 00071 i017Battery voltage below threshold value.
WarningOne or more parameters are within critical limits.Red (flash) Aerospace 08 00071 i018Loss of data link.
Table 5. Results of the questionnaires.
QuestionnaireMSDMD
Display complexity4.690.625.00
Situation awareness4.970.625.00
Ease of use5.120.605.17
Questions assessing visual searchMSDMD
I know where to look for the information I need.5.290.765.00
I can see the information I need without searching.4.570.985.00
I have to search through the display to find the information I need. (inverted)3.431.724.00
I can find the information I need with one or a few glances.5.140.905.00
Publisher’s Note: MDPI stays neutral with regard to jurisdictional claims in published maps and institutional affiliations.

