1. Introduction
While investigating the flight performance of new aircraft configurations or technologies, knowledge about aerodynamic and flight mechanical parameters is required to understand their impact on the aircraft. From the perspective of aircraft design, one main focus is the impact on flight performance when investigating for example the effects of new propulsion technologies or aircraft configurations. To investigate and assess the flight performance, the determination of lift and drag is of major importance. Especially the determination of drag from flight tests with an unmanned propeller aircraft is a challenging task.
Flight tests with unmanned aircraft systems (UAS) have become increasingly important in recent years. Scaled platforms are not only used as payload carriers, but also for the analysis of novel aircraft configurations or for the assessment of unconventional propulsion systems.
The lower costs as well as the reduction of risks especially in the area of unconventional configurations militate in favor of using unmanned systems. Typical examples for demonstrators used to study flight dynamic effects are the AlbatrossONE [
1] of Airbus and the platform of the project FLEXOP (flutter free flight envelope expansion for economical performance improvement) [
2]. In the case of the AlbatrossONE, gust loads are minimized by structural interventions in the area of the wing tip, while aeroelastic effects on the wing are observed with the help of the carrier platform FLEXOP. To investigate the impact on flight performance of new technology on an aircraft configuration, a direct comparison between base line configuration and modified aircraft is of interest, as demonstrated by NASA with its Area-I Prototype Technology Evaluation and Research Aircraft (PTERA) [
3]. In the research, the PTERA platform was modified to investigate for example combined circulation control [
4] and a spanwise adaptive wing [
5].
Unmanned aircraft are an important tool to investigate new aircraft configurations and novel aviation technologies at University of Stuttgart, [
6]. New technologies or concepts can be flight-tested with little effort, low costs and manageable project risks after initial theoretical investigation. This way, research concepts can reach a much higher feasibility, of particular interest to industry, to close the gap between upstream research and industrial exploitation. This can build a bridge, demonstrating technologies at a higher technology readiness level (TRL). Innovative ideas can be demonstrated and validated in a relevant environment which corresponds to a TRL 5/6. However, there are limitations due to the degree of scaling of the technologies under consideration.
A disadvantage for the investigation of flight performance with scaled unmanned aircraft is the limited data available for the different aircraft system components. When investigating the flight performance, propeller characteristics and efficiency of the individual components of the propulsion system are of specific interest.
The Institute of Aircraft Design (IFB) at the University of Stuttgart has developed the “e-Genius-Mod” test platform based on this background. The platform is modelled on a scale of 33.3% of the electrically powered “e-Genius” aircraft [
7], which is also designed, manufactured and operated by the institute. In this particular case, the UAS was realized as Froude-scaled version [
6].
Due to the modular design of the testbed, different configurations can be easily realized, which allows an adaptation to different applications. Furthermore, the geometry of the fuselage offers ideal conditions for accommodating various payloads.
For the purpose of identifying the aircraft and measuring flight performance, it is essential to map the aerodynamic parameters of the system. The most important parameters are the aircraft drag and the lift polar. From the correlation of the coefficients for lift and drag of the aircraft, a direct statement about the performance and energy consumption can be derived. The gliding characteristics, the required power installed and the potential range are important parameters that are required to compare different propulsion concepts and identify their impact for a prospective aircraft design.
In order to obtain reliable drag and lift polar, manned test aircraft often would carry out comparative flights with calibrated systems. Especially in the field of gliding, where a precisely identified system is very important, such survey flights are still state of the art today.
In the unmanned area, such survey flights are difficult to carry out. For UAS, a method for a glider model is described by Edwards [
8]. Due to the induced drag of the propeller system, this method is not useful for the proposed identification of propeller-driven UAS. A method to identify drag of a propeller aircraft was developed by Norris and Bauer [
9]. Alternatively, if available, a model for the propeller wind-milling drag or thrust could be used to apply this method. For the e-Genius-Mod testbed, a different approach was taken. In order to record the performance data, a measurement system was developed that is capable of recording the thrust values required during the flight. Such systems have not yet been installed in large UAS, but have only been used sporadically on manned aircraft. For the aerodynamic characterization of smaller UAS, on-board thrust measurements have been performed in the past, such as presented by M. Bronz and G. Hattenberger [
10]. However, for the identification of the flight performance and to show the feasibility of novel technologies in aviation the measurement of drag is essential.
Although the thrust values for the operation of a propeller-driven system can be measured without any problems when stationary, the thrust values during flight are not comparable due to the induced flow to the propeller without prior identification of the propeller via wind tunnel experiments. The efficiency of the drive also changes significantly under different flow conditions. Therefore, a direct, mechanical thrust measurement in flight is of significant advantage.
1.1. Challenge of Current Research Using Unmanned Aircraft as Free-Flight Test Platform
A current research topic at the University of Stuttgart is how to use unmanned propeller-driven aircraft as a test platform to determine their flight performance without knowing specific data of propeller and powertrain. This ability is for example required to compare different propulsion configurations like Wing Tip Propellers (WTP) to a basic configuration in flight. Based on the collected flight data, the estimated benefits of this technology in flight should be validated and demonstrated. For this purpose, the basic in-flight measurement system of the test platform is extended with a system to measure the thrust of the propeller in-flight.
For this, the assumption was made that in steady horizontal flight the thrust performed by the propeller corresponds to the aerodynamic drag acting on the aircraft.
1.2. The Modular Test Platform e-Genius-Mod
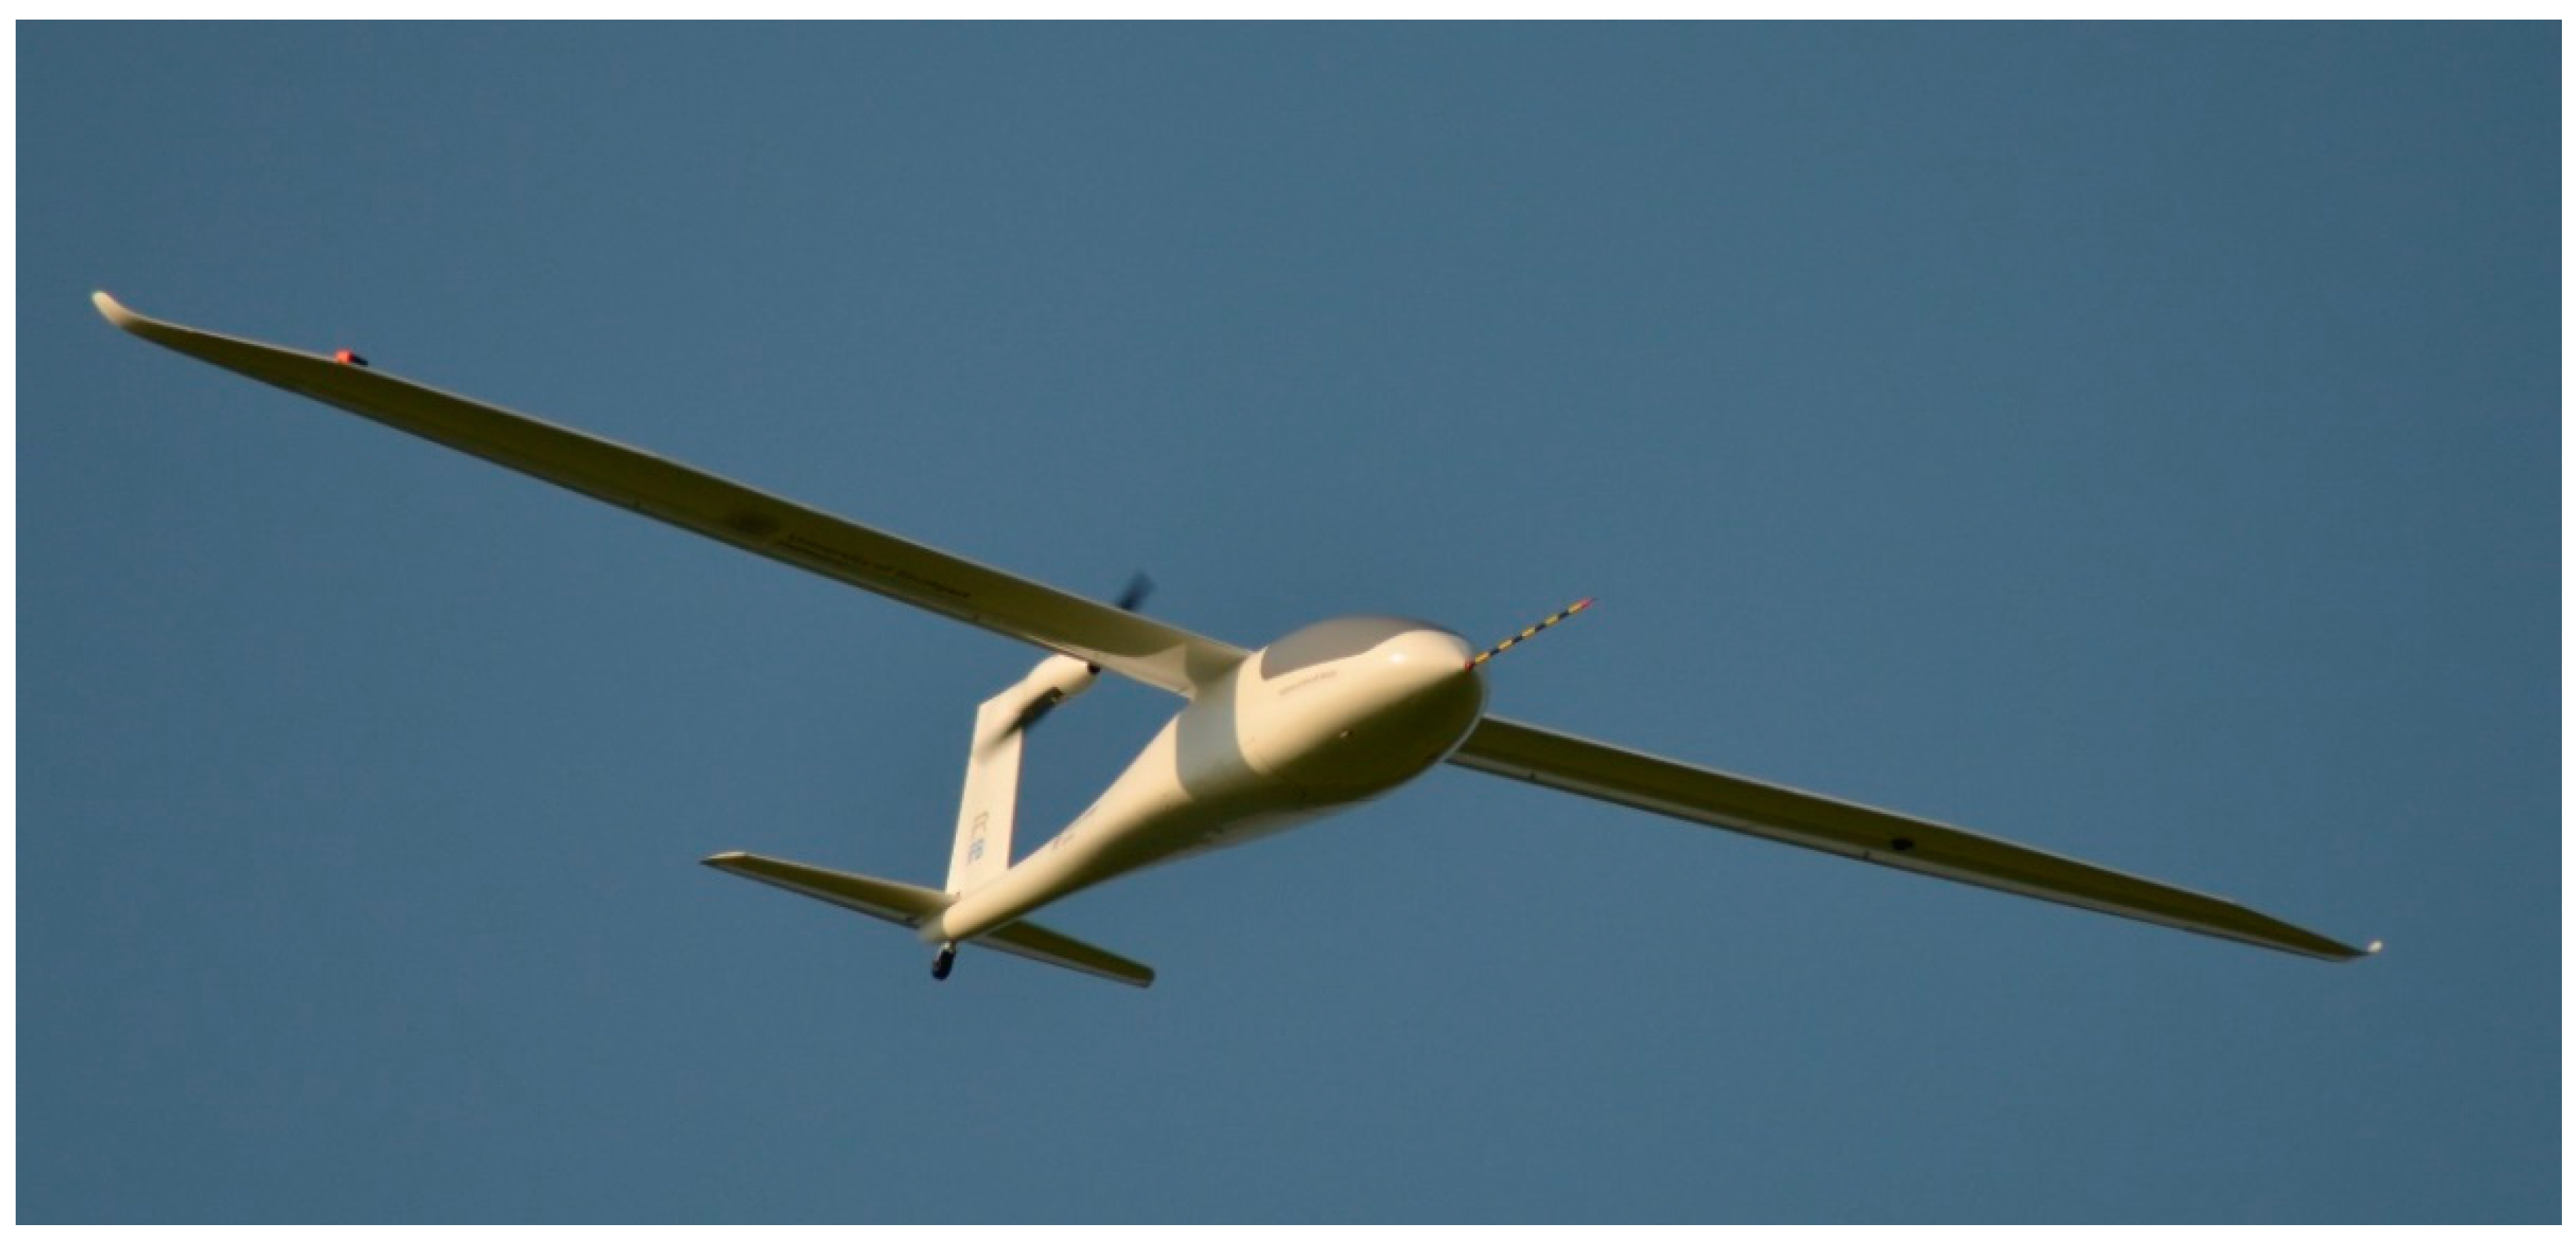
The free-flight platform e-Genius-Mod (
Figure 1) is established as a technology test bed to demonstrate new technologies for future aircraft design in a relevant environment. The UAS test platform [
6] is used for academic and innovative research projects to investigate scaling similarities of free flight models and to demonstrate new technologies up to TRL 6. The modular design of the test bed is ideally suited for the investigation of new aircraft configuration solutions for distributed electric propulsion systems. The size of the aircraft with a wingspan of 5.62 m, maximum take-off weight of 40 kg and a payload capacity of more than 10 kg [
6] is suited to perform prospective investigations. The maximum possible flight time is up to 100 min, depending on the particular battery capacity and the payload weight. An overview of the technical data of the e-Genius-Mod is summarized in
Table 1.
The test bed e-Genius-Mod is an extension of the full-scale aircraft for further investigation of electric flight and new aviation technologies. For this reason, the test platform is equipped as a free flight wind tunnel. In order to perform measurements in steady, horizontal flight, an autopilot is used to steer the aircraft along a predefined path of constant altitude and velocity, as described in [
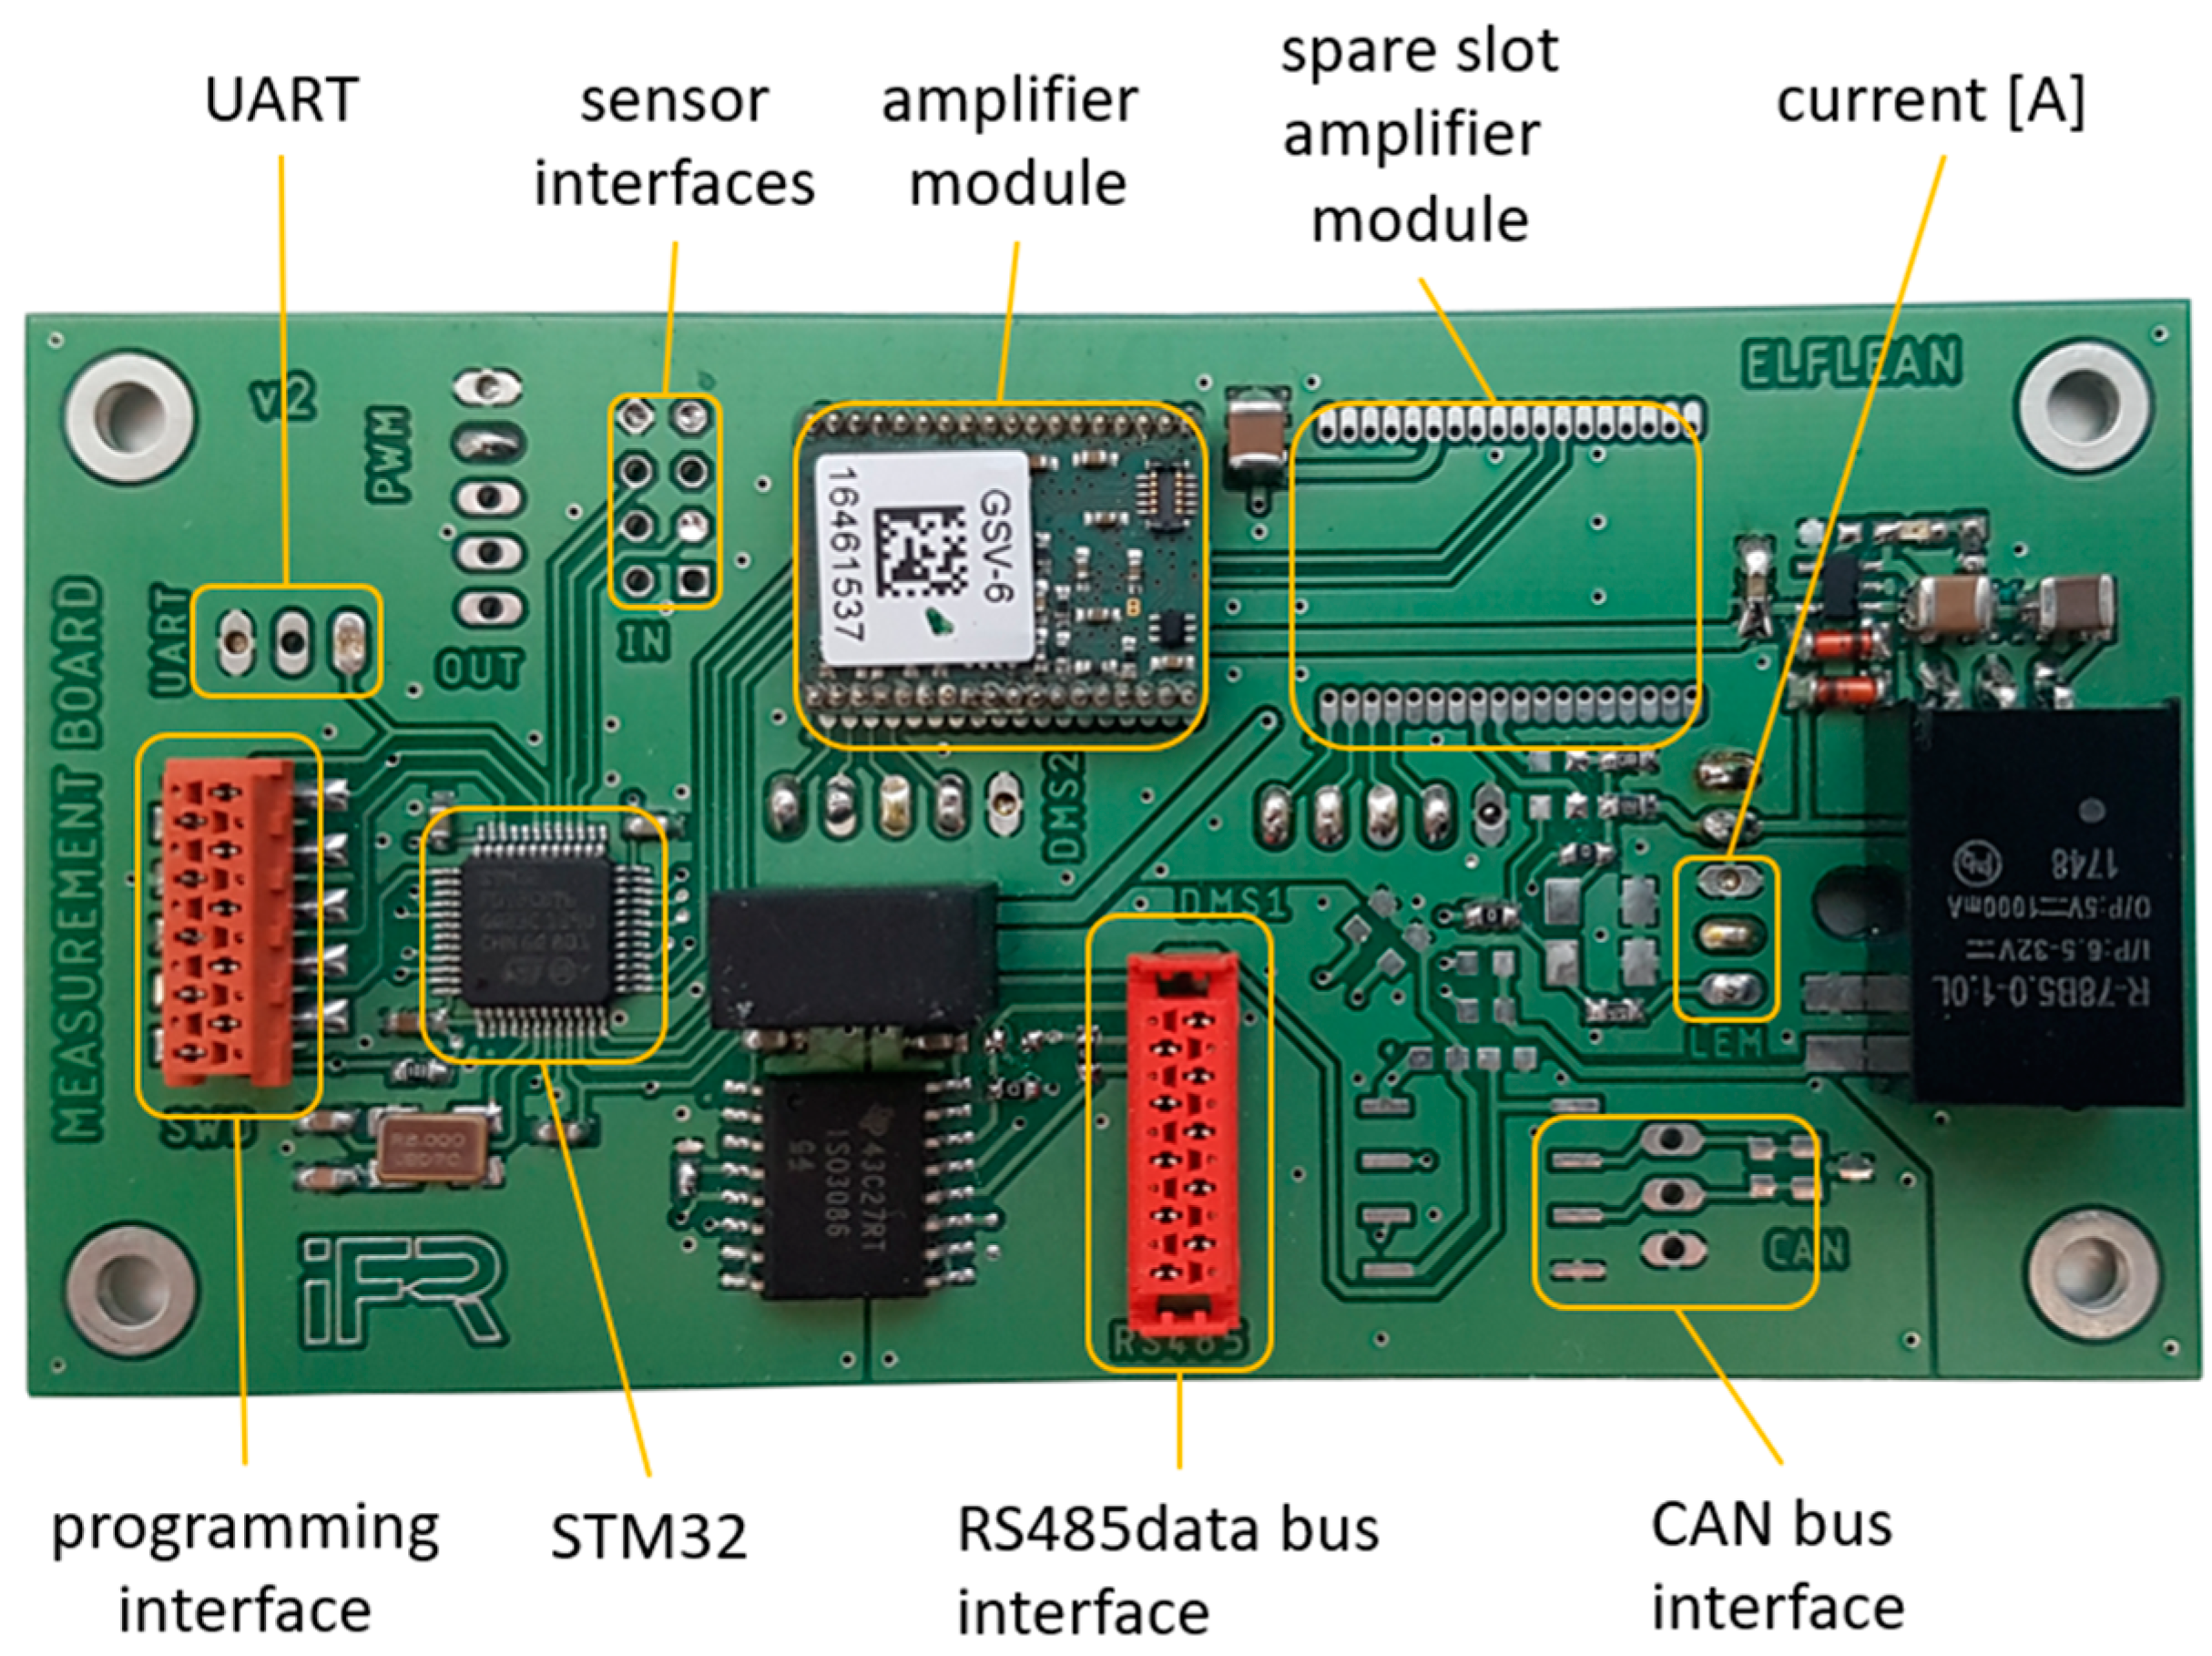
11]. The measurement system ensures the synchronous logging of all relevant variables (
Table 2), as further detailed in
Section 3.
The basic free flight measurement equipment can be easily expanded by connecting additional sensors to the dedicated bus system used solely for measurement data.
Electric propulsion systems allow for new design alternatives in terms of propulsion integration and aircraft design. To investigate and demonstrate new concepts, a modular testbed like the unmanned scale model is a very useful and flexible tool. The demonstration of innovative concepts like distributed propulsion on a manned aircraft would be expensive and time intensive and not useful for research with open-ended findings at this early stage. With its modular airframe design, the e-Genius-Mod is the basis for an efficient and systematic research of the various effects of distributed propulsion.
Onboard thrust measurements on a UAS pose a particular challenge. On the one hand, it must be possible to carry out reliable, calibrated measurements, and on the other hand, the sensor systems are subject to narrow limits in terms of dimensions and weight. For this purpose, sensor systems specifically designed for the e-Genius Mod were developed, calibrated and tested in wind tunnel experiments before installation.
The thrust values are in many respects informative for the evaluation of the flight controller itself, as well as for the assessment of the efficiency of an engine. In general, they establish a direct relationship to aerodynamic quality and, in case the electrical power consumption is known, allow a direct statement about the overall efficiency of the corresponding powertrain. Especially when considering several distributed engines, it is possible to make a reliable statement about the overall energy balance onboard the platform.
The aim of the thrust measurements is to prove the expected positive effects of the distributed engines in terms of quality, and, in further steps, to make statements about where on the aircraft they can be used most efficiently. Furthermore, previously performed simulations are to be validated with these measured values.
2. Research Objective
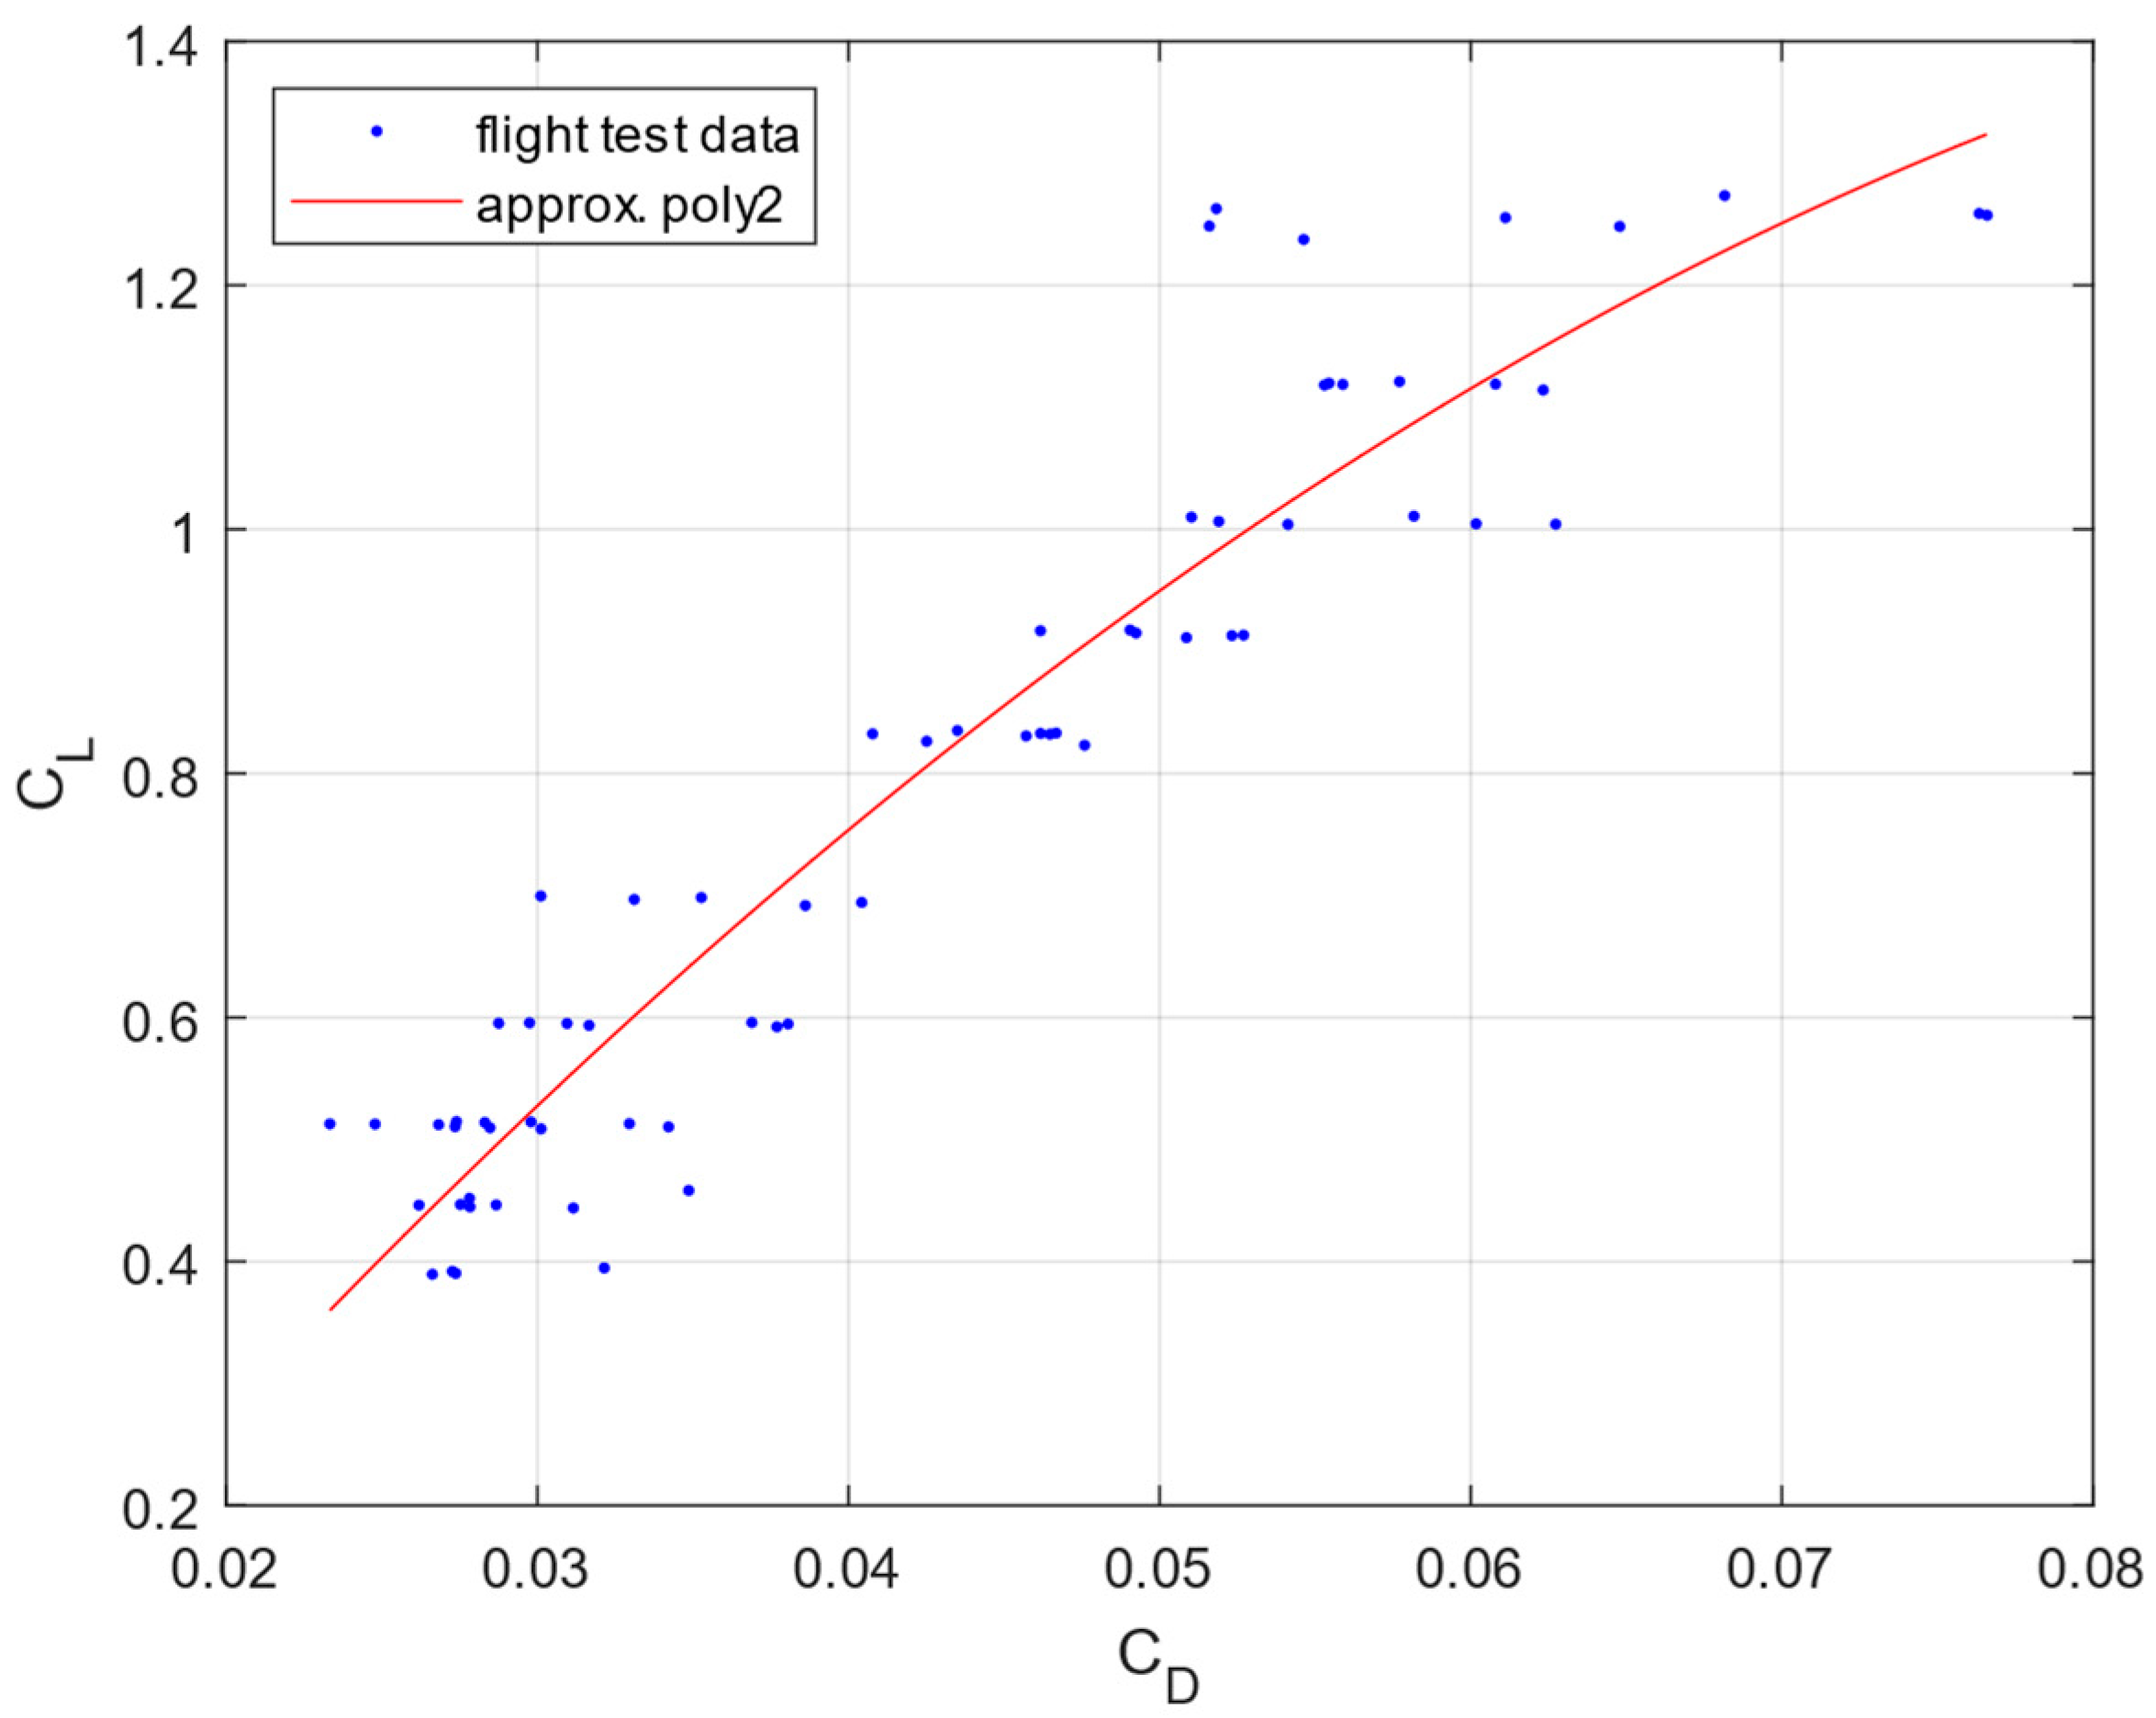
To assess and validate the impact of a novel configuration or technology in flight, knowledge of the flight performance is of vital importance. Required basic information in aircraft design are the aerodynamic coefficients for lift () and drag () of an aircraft with respect to the angle of attack (AoA). Therefore, the objective of this research is the identification of the , and polars in-flight. For the investigation of these coefficients in-flight the following well-known approach is proposed as a starting point.
While the investigations are carried out under cruise conditions, it is assumed as a basis for the investigations that the measurements are carried out in a non-accelerated (steady) horizontal flight. This allows to establish the balance of forces in flight direction and perpendicular to it respectively:
Thrust will be directly measured between engine and engine mount. The measured force corresponds to the force acting on the aircraft caused by the propeller thrust. With
and the knowledge about the true air speed (
) and air density (
), we can directly determine the drag coefficient (
) of the aircraft by assuming drag (
) and thrust (
) as balanced.
describes the reference wing area of the test platform. True air speed and air density will be measured with the air data boom installed in the nose of the aircraft (
Table 2). A small deviation has to be considered by the frictional forces of linear bearings in the thrust measurement unit which can be eliminated by a calibration.
The lift coefficient (
) can be determined by the following equation:
Since the aircraft is electrically powered by a battery system, the weight is constant throughout the flight. To identify the corresponding angle of attack, the air data boom is used. Angle of attack and angle of sideslip are measured with a five-hole probe. As the measured values of the different sensors are synchronised, the coefficients of lift and drag can be described directly in relation to the AoA. The measured AoA has only to be corrected by its installation position in relation to the wing. In this way, the direct connection between AoA and the corresponding lift and drag values should be representative in flight. Larger values of lift and drag are to be expected with an increasing of the AoA.
3. Approach for the Flight Test Scenario
The approach for the flight test scenario is based on the assumptions made in
Section 2 to investigate the flight performance under the condition of a steady horizontal flight and with a zero-wind condition for the atmosphere.
However, considering the reality of free-flight tests, perfect atmospheric conditions will never be achieved. To meet these requirements to some degree, the flight tests are carried out in the early morning on days with calm atmosphere. The impact of atmospheric disturbances was estimated in [
12]. To realize a statistical accuracy of the data measured in flight, the data for a single measurement point is collected over a minimum of four legs with two different flight directions.
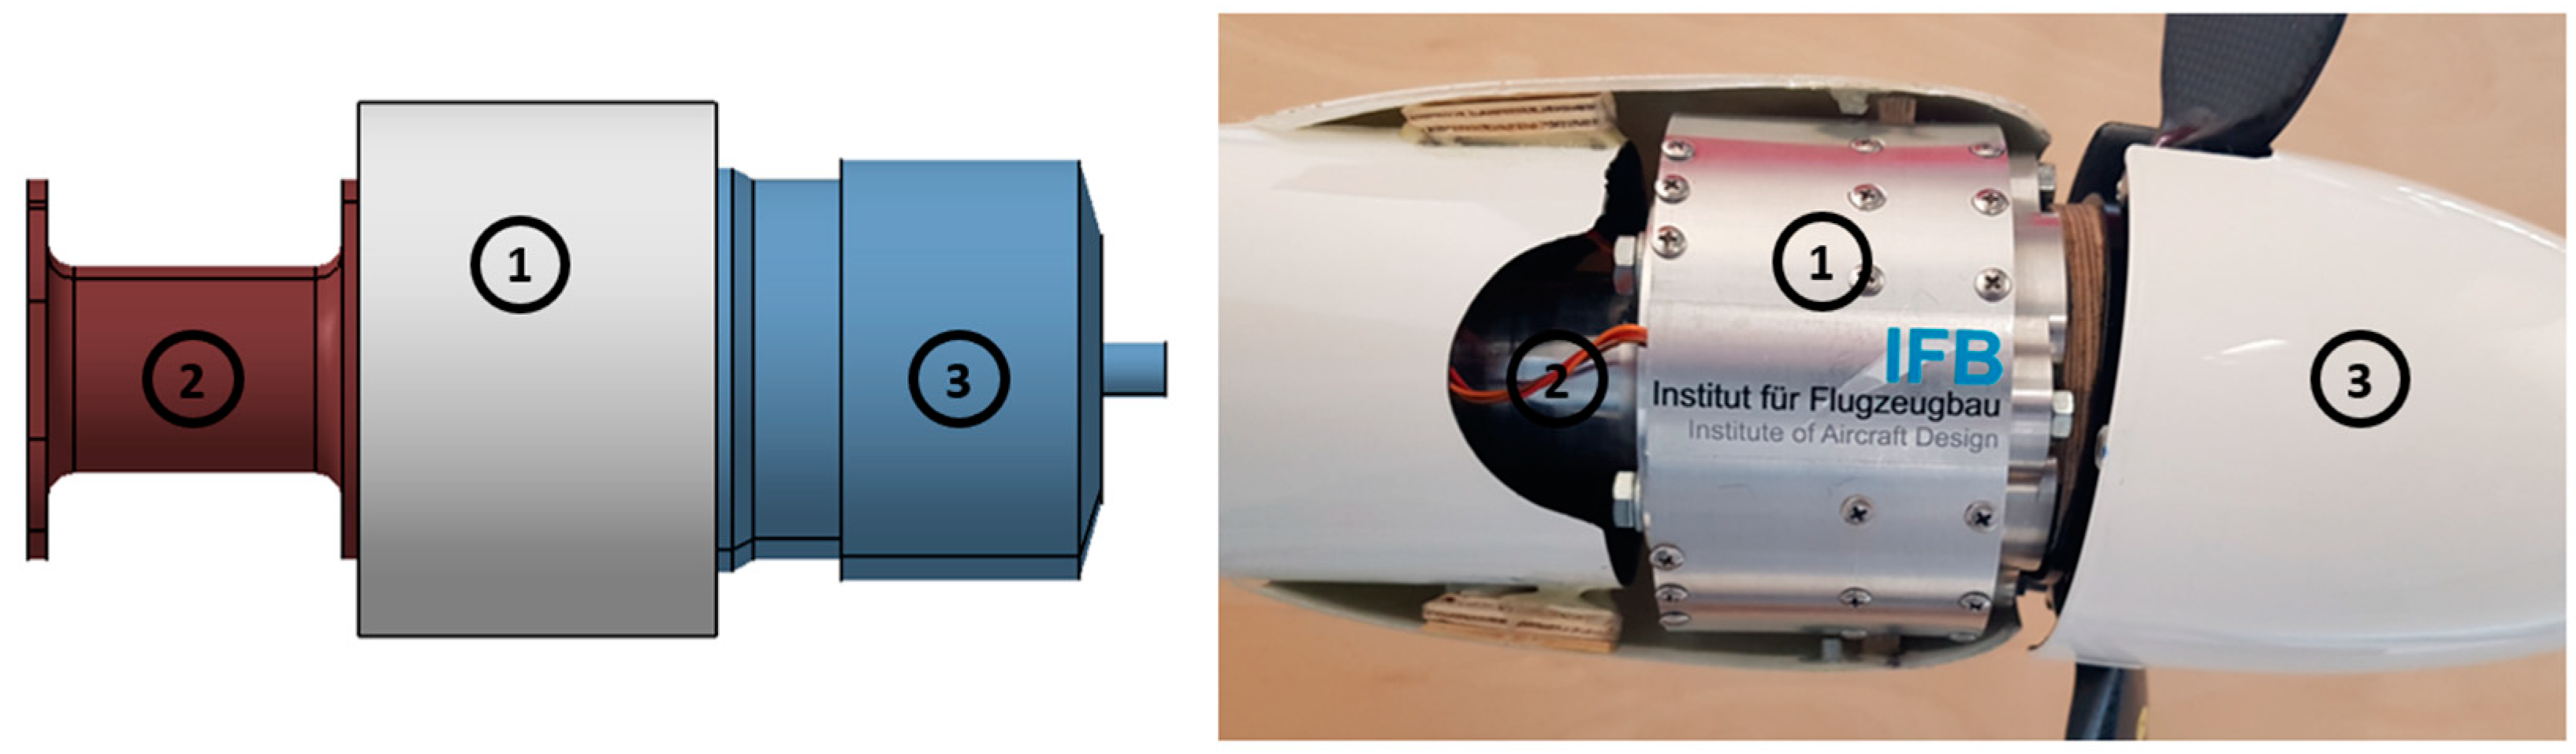
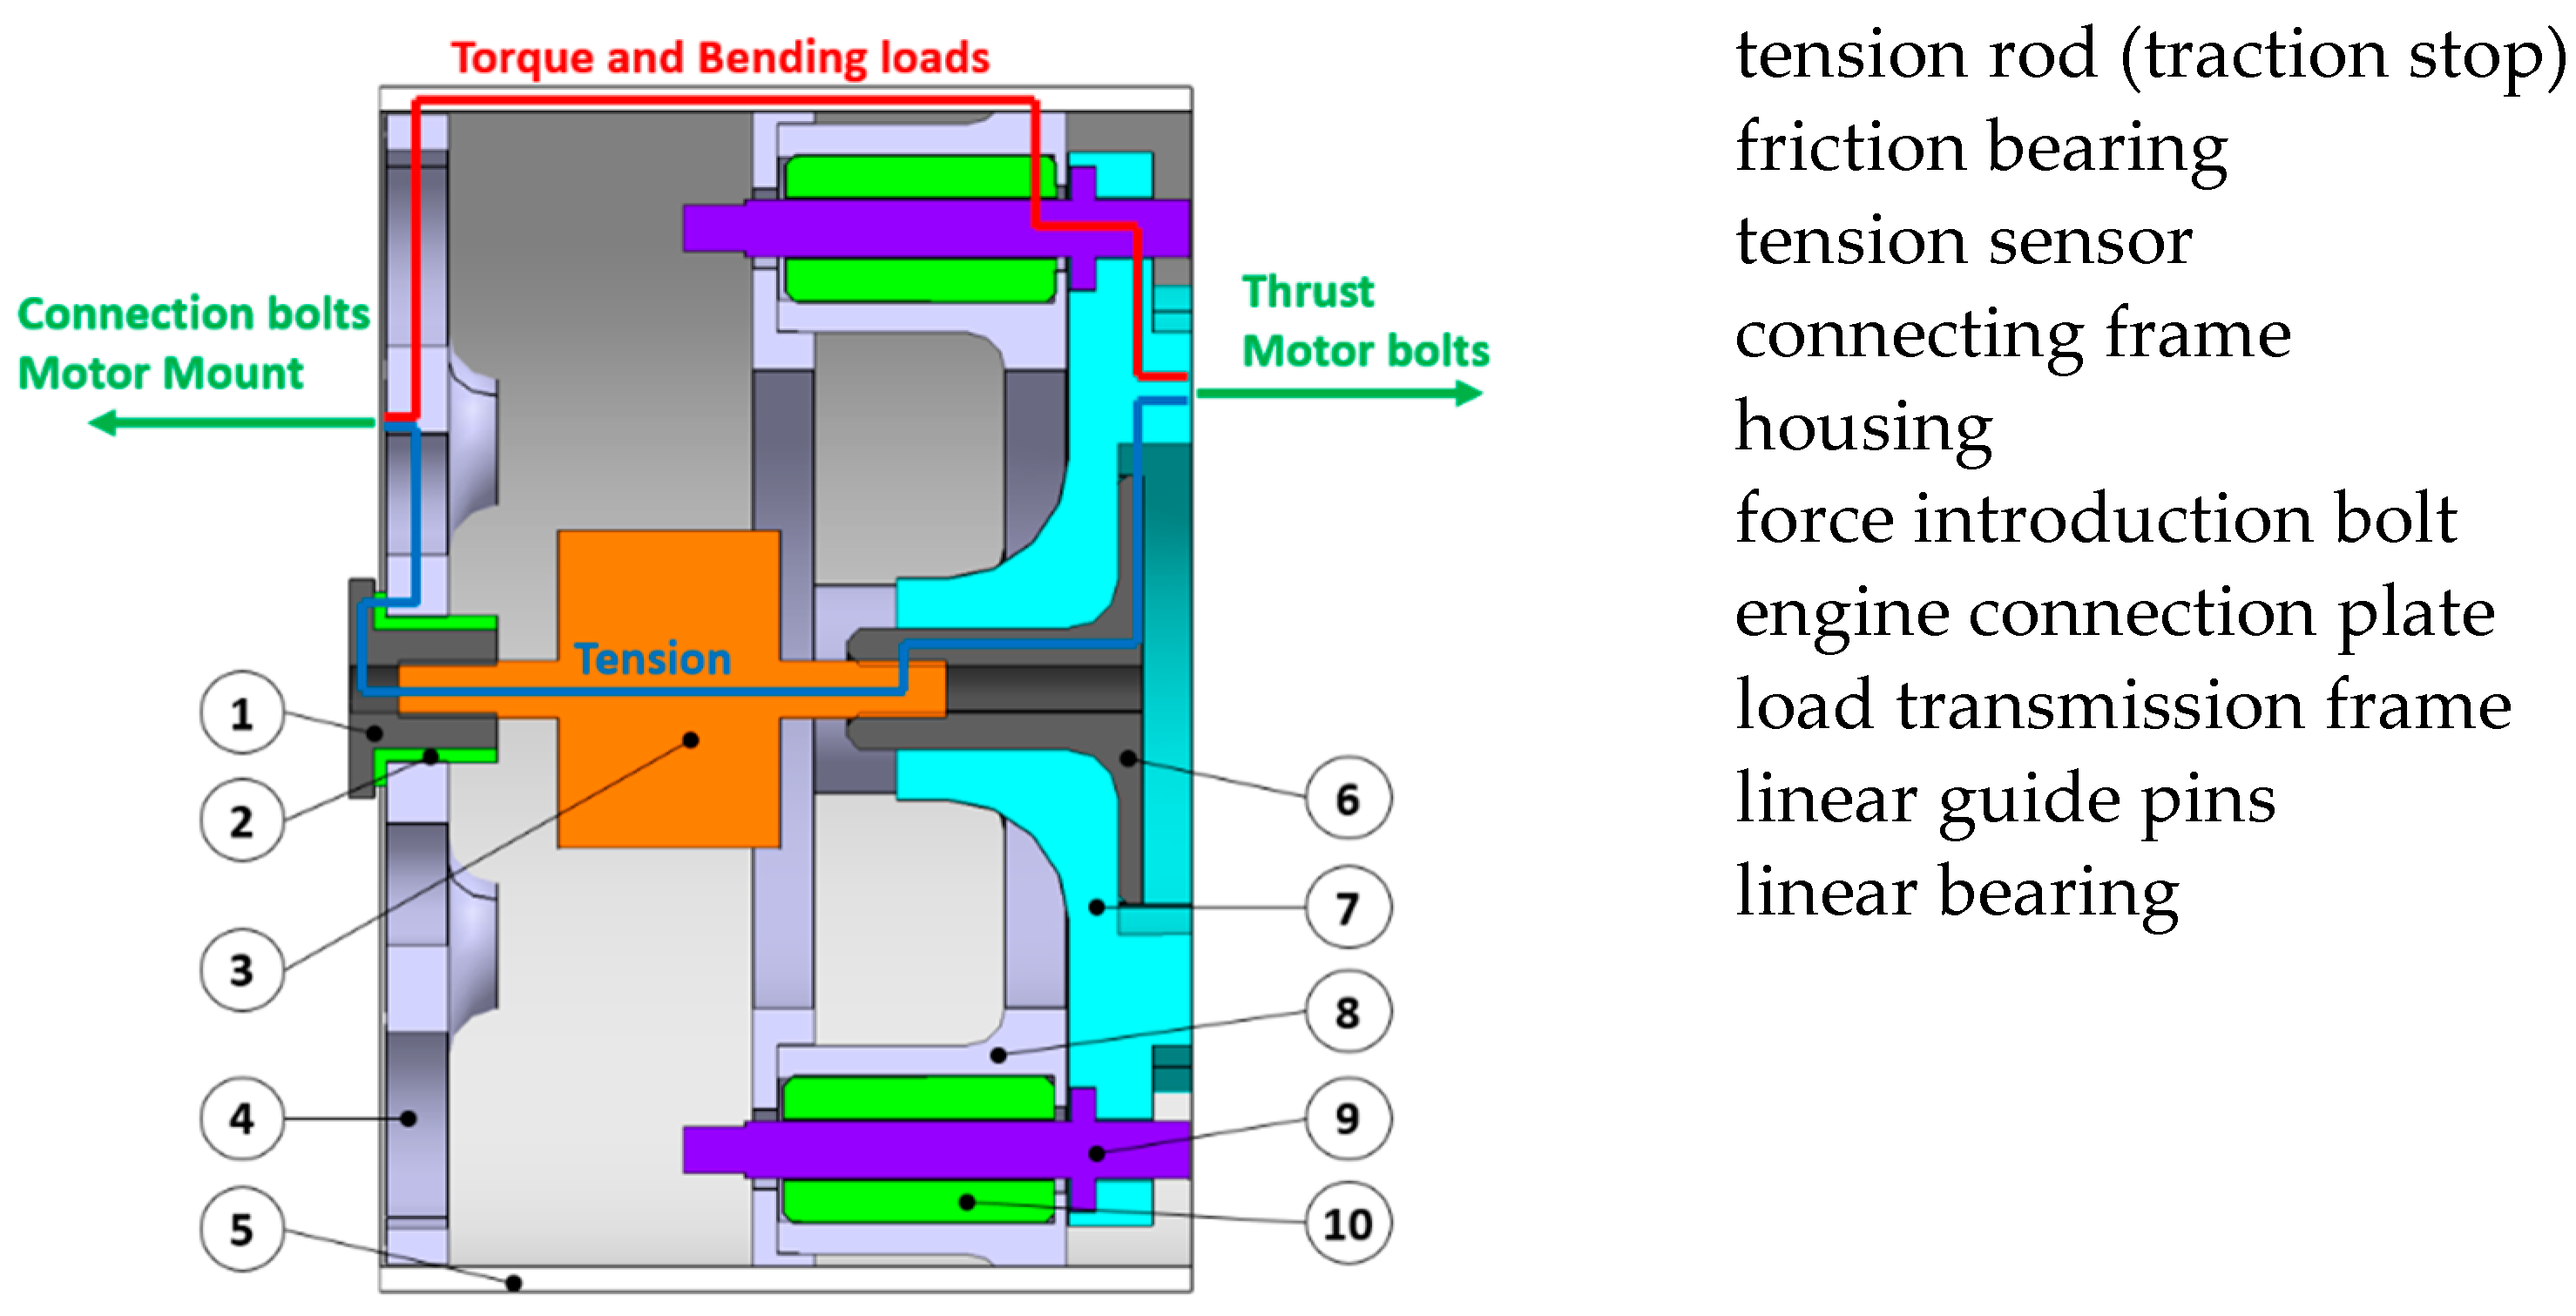
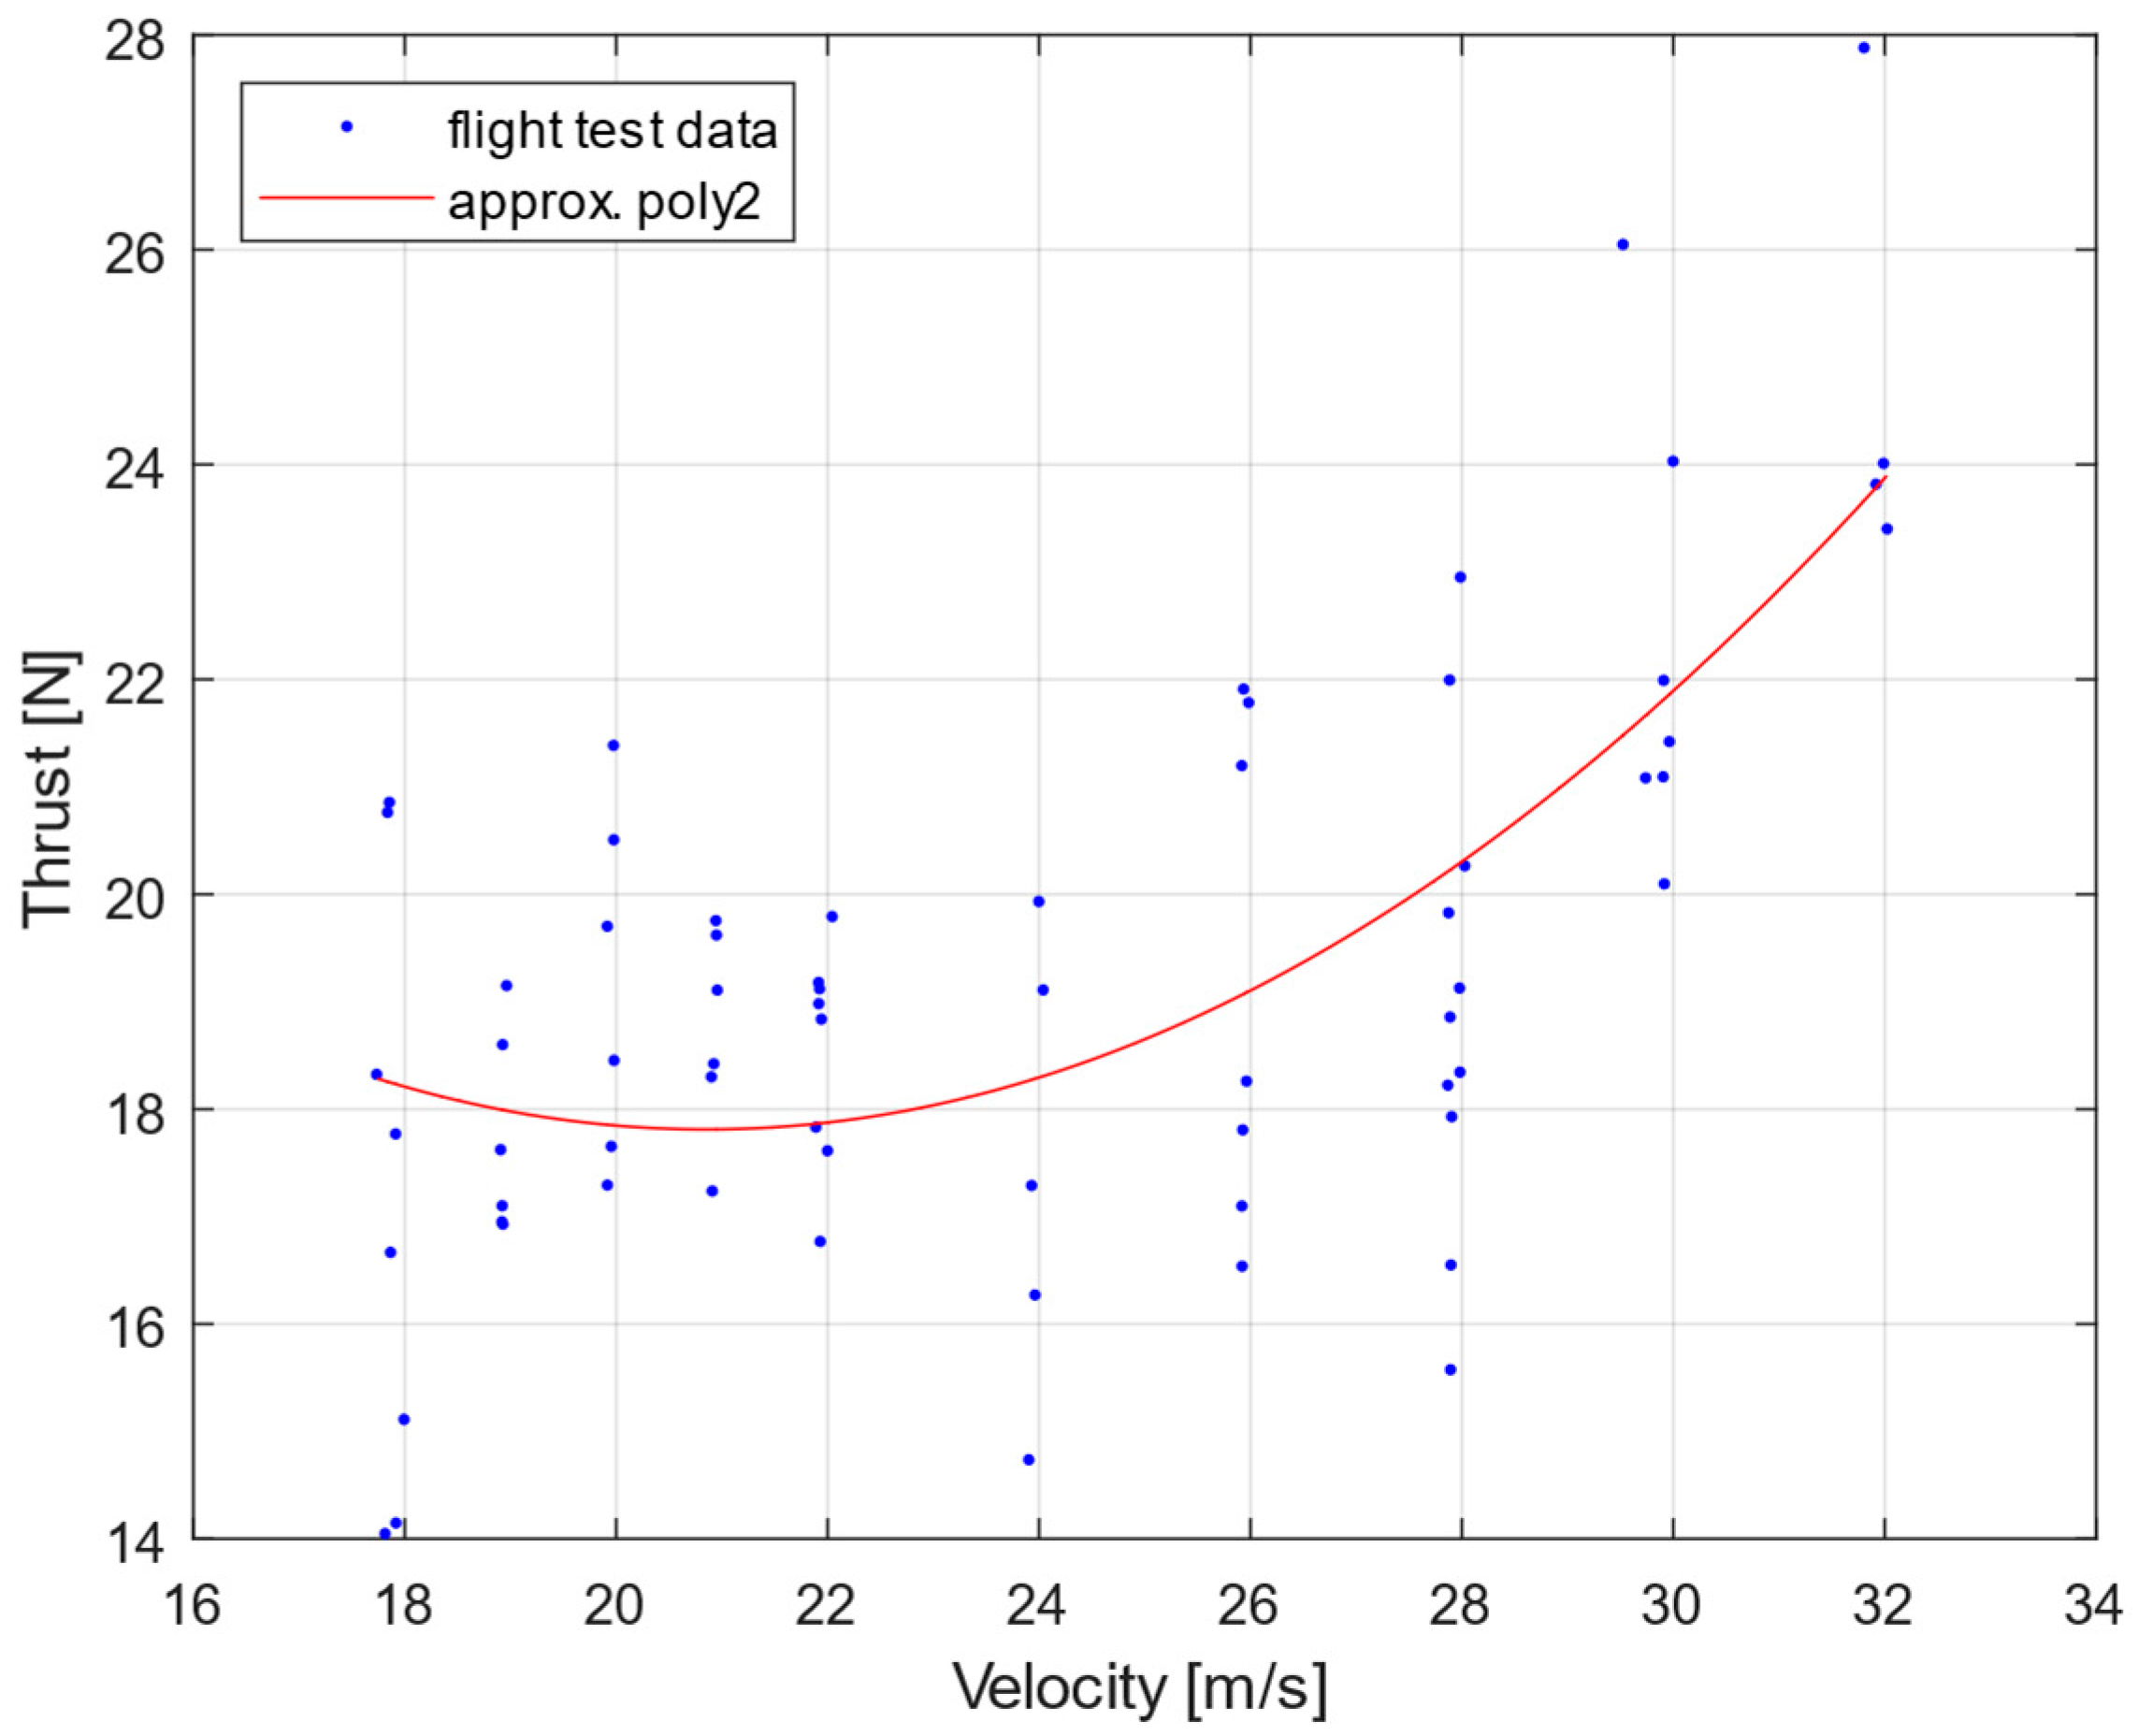
To determine the thrust during flight, a measuring system is installed between the electric engine and the engine mount to measure the tensile forces. The occurring tensile forces correspond to the thrust generated by the propulsion system.
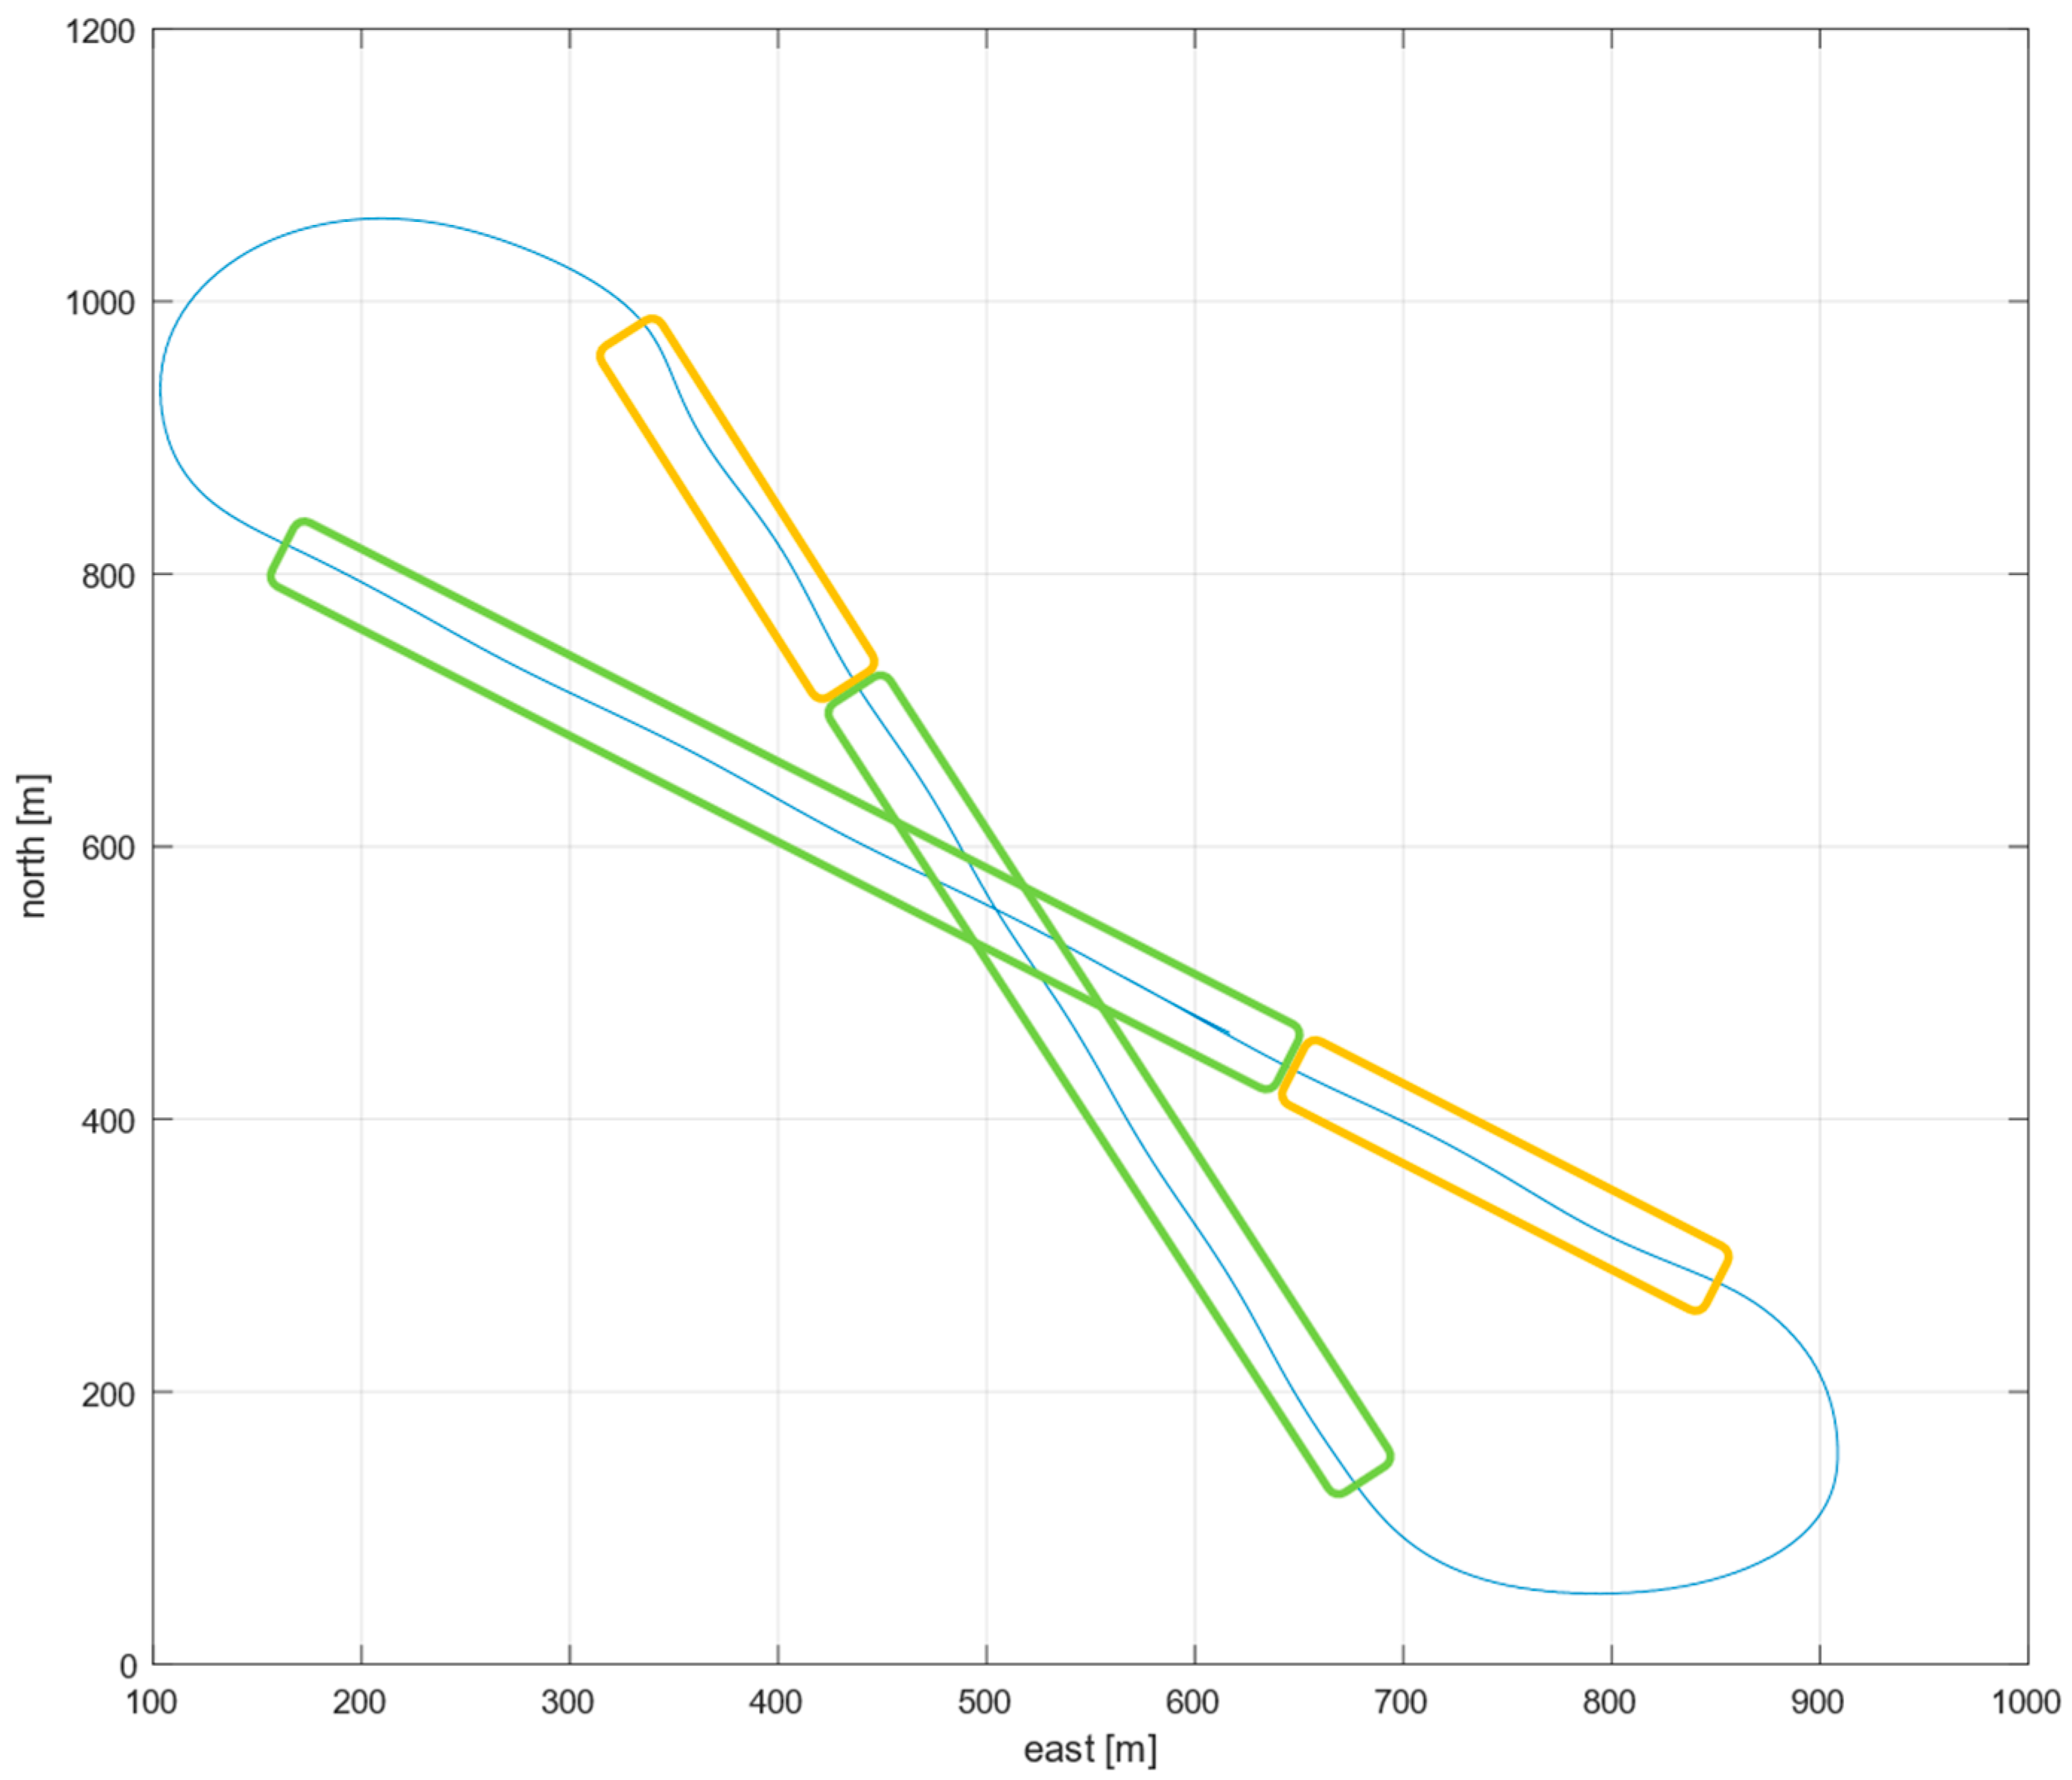
The thrust measurement is particularly relevant due to its direct correlation with the aerodynamic drag. The investigations are carried out under cruise conditions, i.e., steady, horizontal flight. For the investigation, a flight track is chosen which allows the longest possible horizontal legs. The limiting factor for the tests is the current regulatory framework, which specifies a maximum flight envelope for the tests in the permitted airspace.
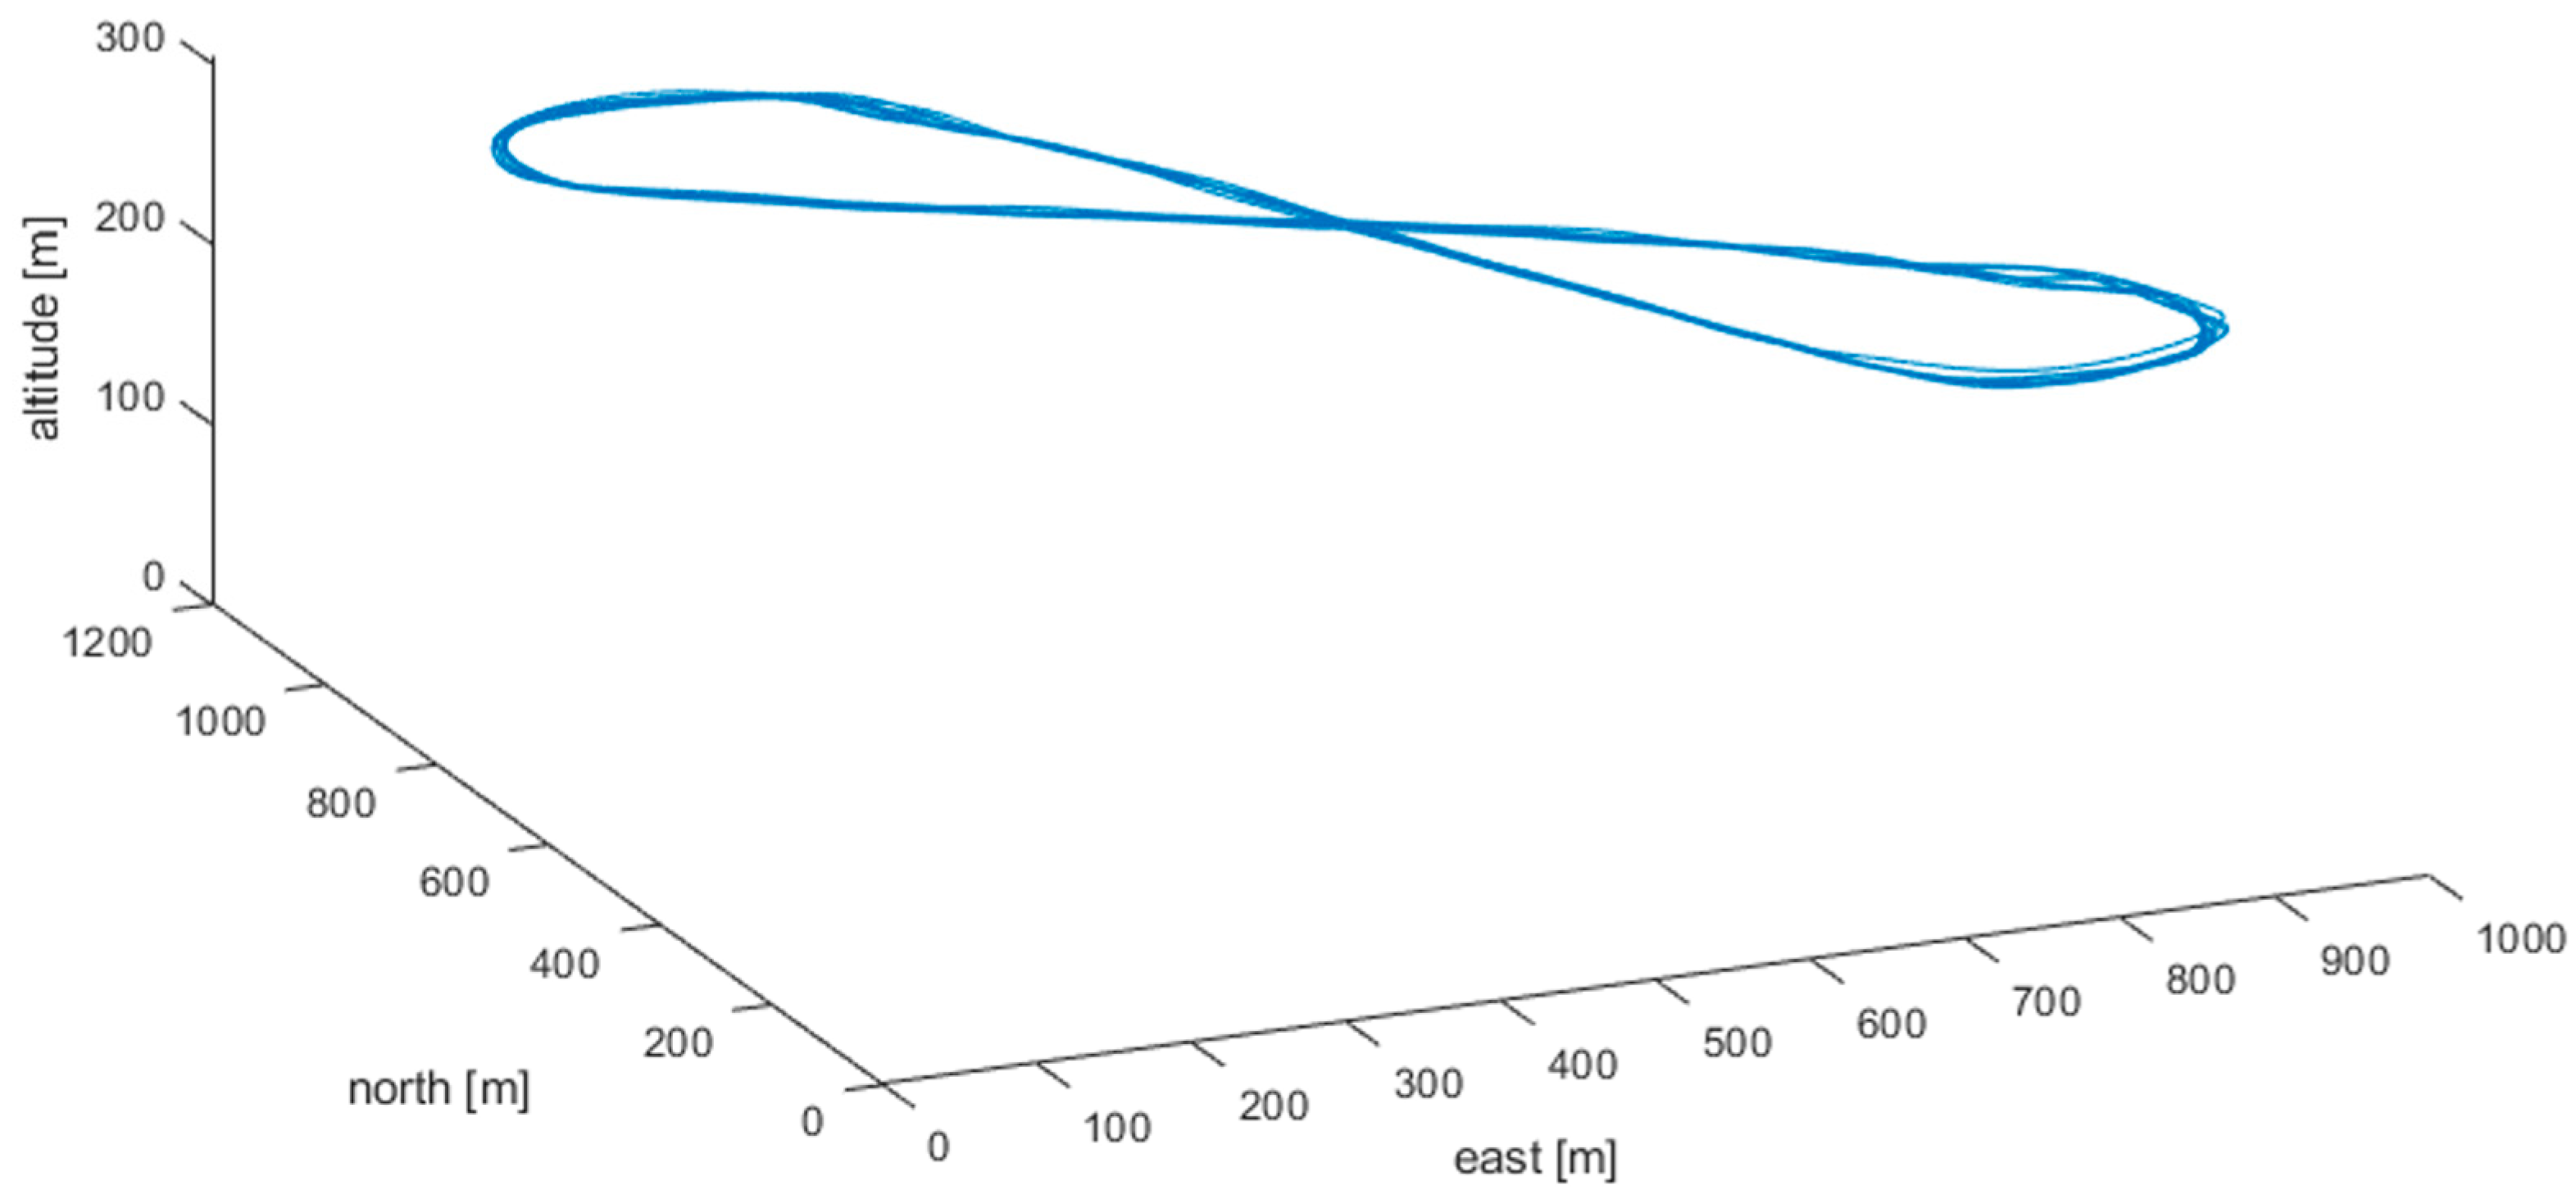
The measurement flights are performed with an autopilot in control to achieve steady, horizontal flight and high repeatability. For the test flight a circuit with maximized straight segments (legs) in-between is chosen. Given the airspace restrictions, the leg on which the measurements can be made is nearly 1000 m long.
Figure 2 represents the flight path of a measurement flight at 300 m altitude.
The legs are divided into two segments. The first segment is the “level off section”. After the turn, airspeed, altitude and attitude are stabilized in this section. Data in this section will not be considered. In the section of measurement, a stabilized flight attitude is expected and the data will be used for the analysis of lift and drag. As there will be no perfect steady horizontal flight with constant altitude and airspeed, limits for the deviation in roll angle, airspeed and altitude are set, to assign a confidence rating to the single leg that is considered in the evaluation. To optimize the steady horizontal flight, the autopilot controls a constant velocity and altitude.
7. Discussion
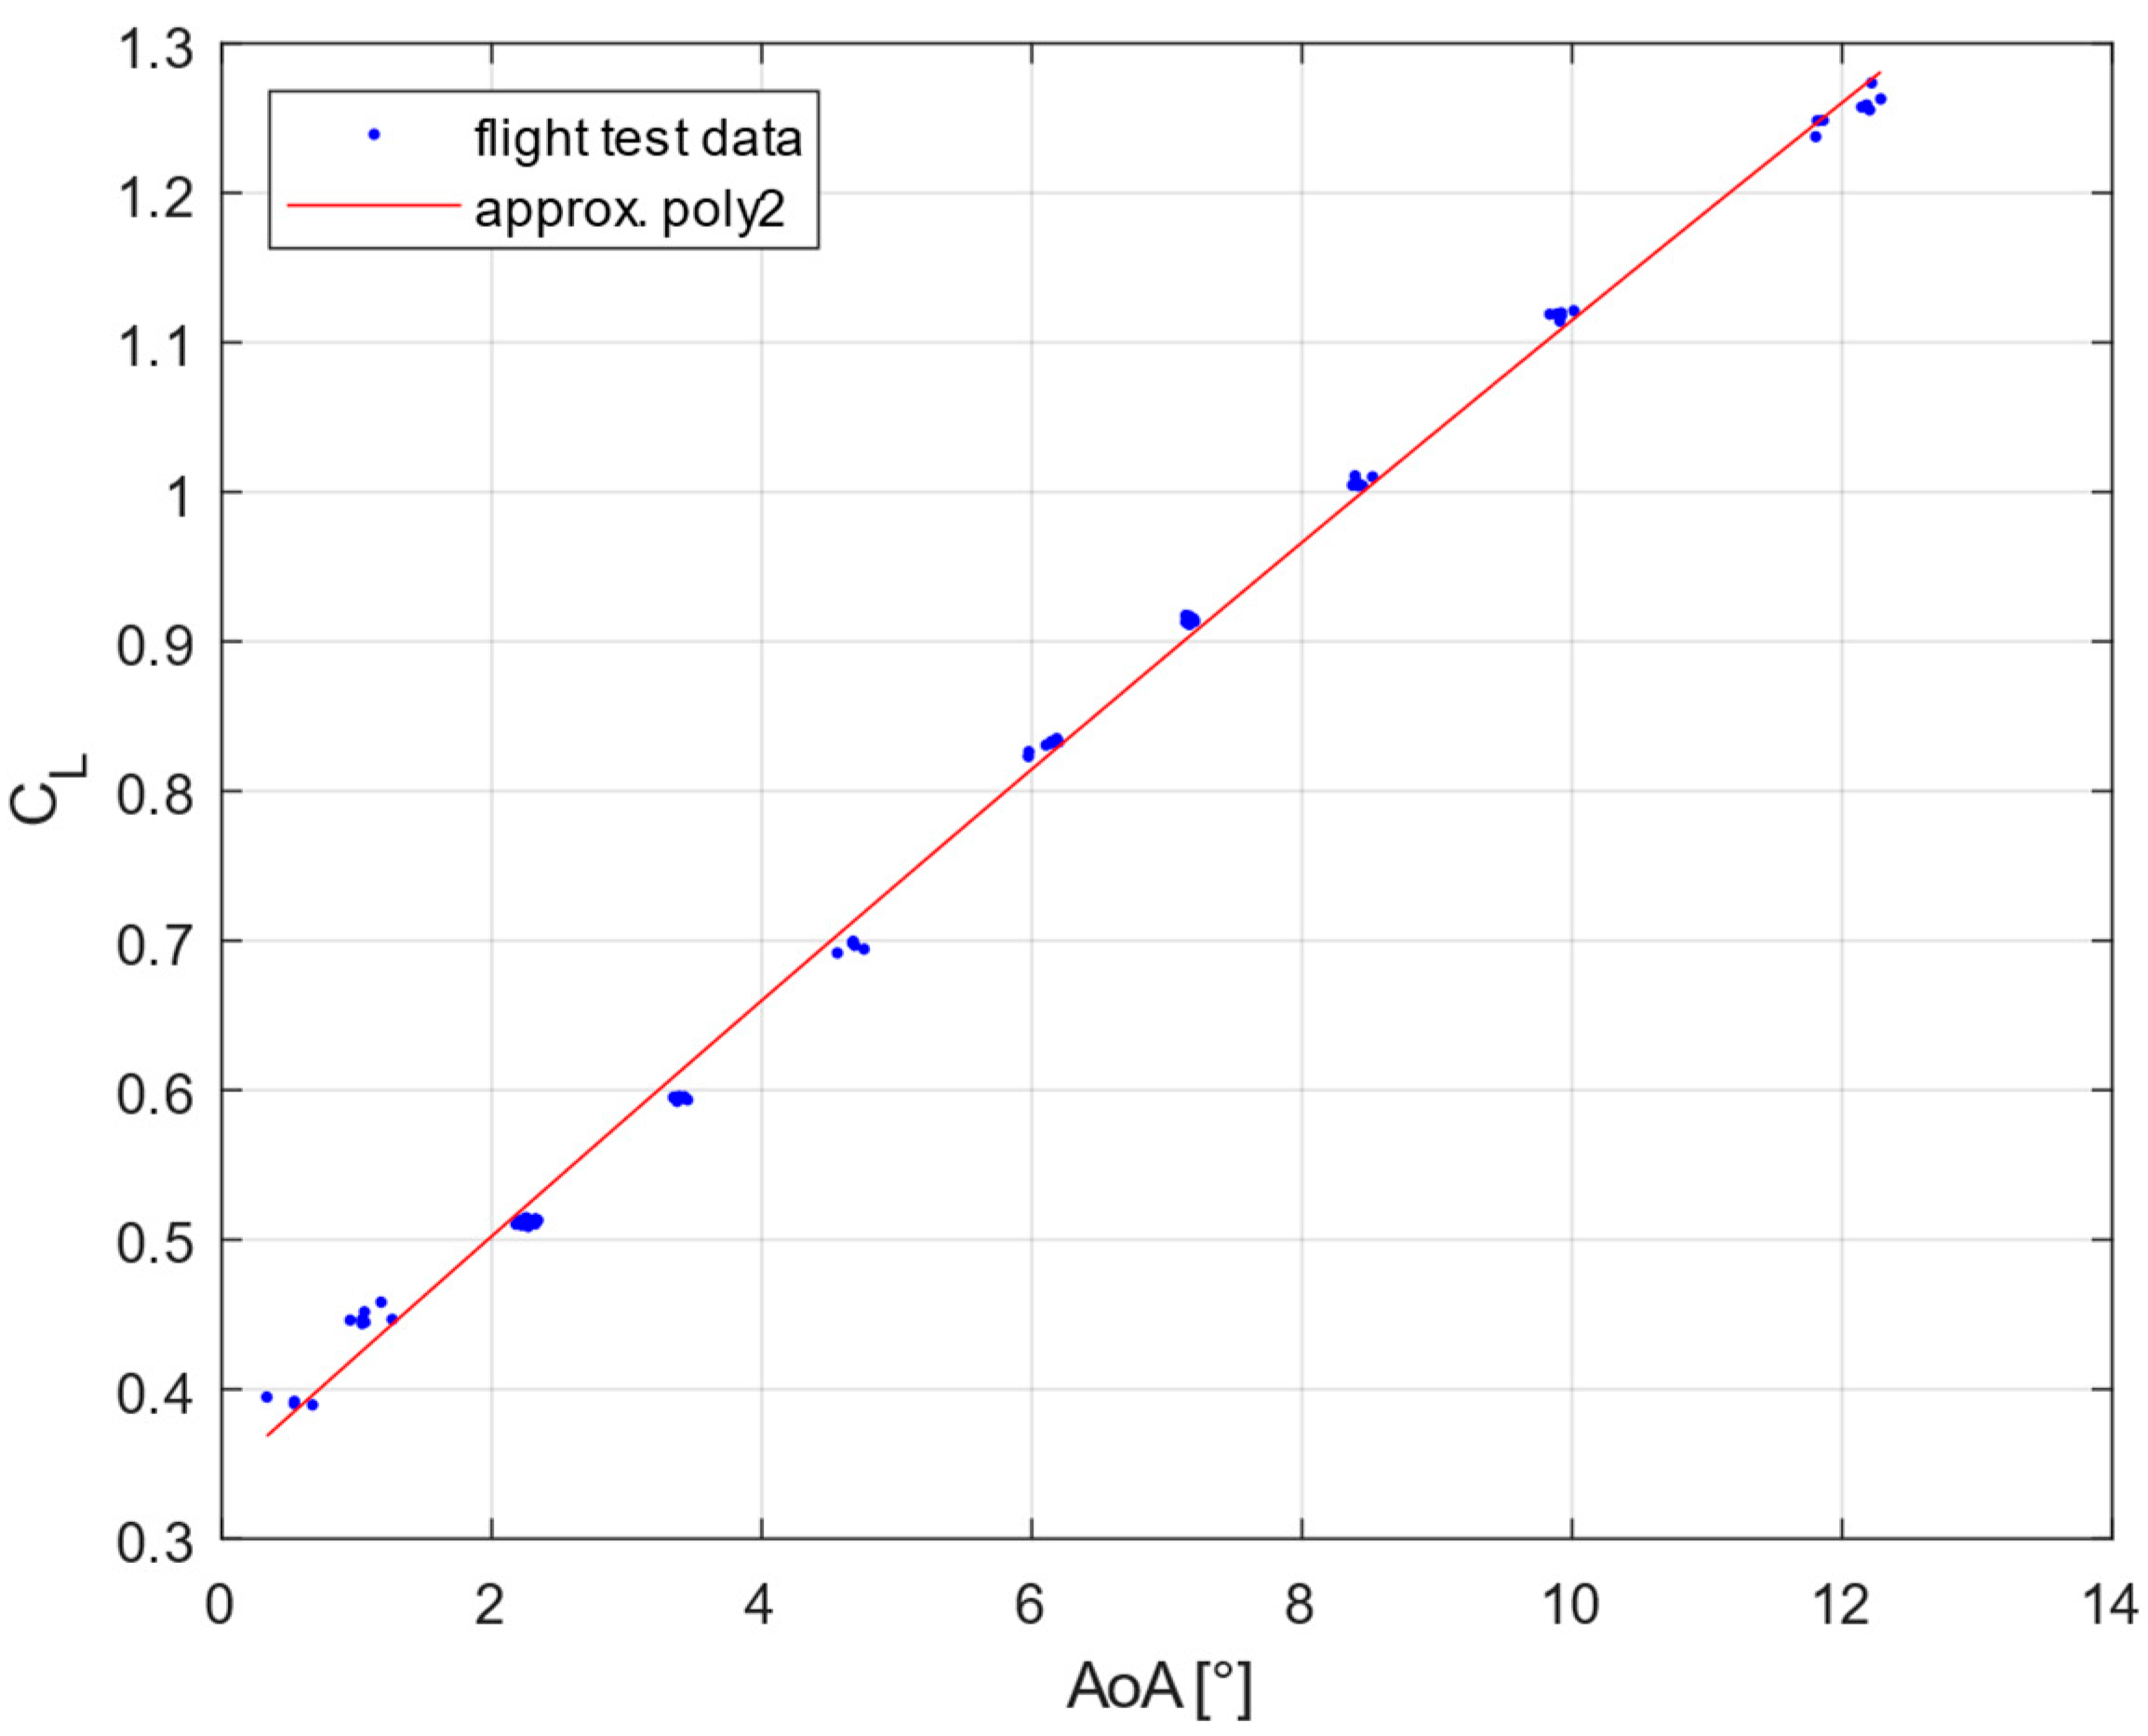
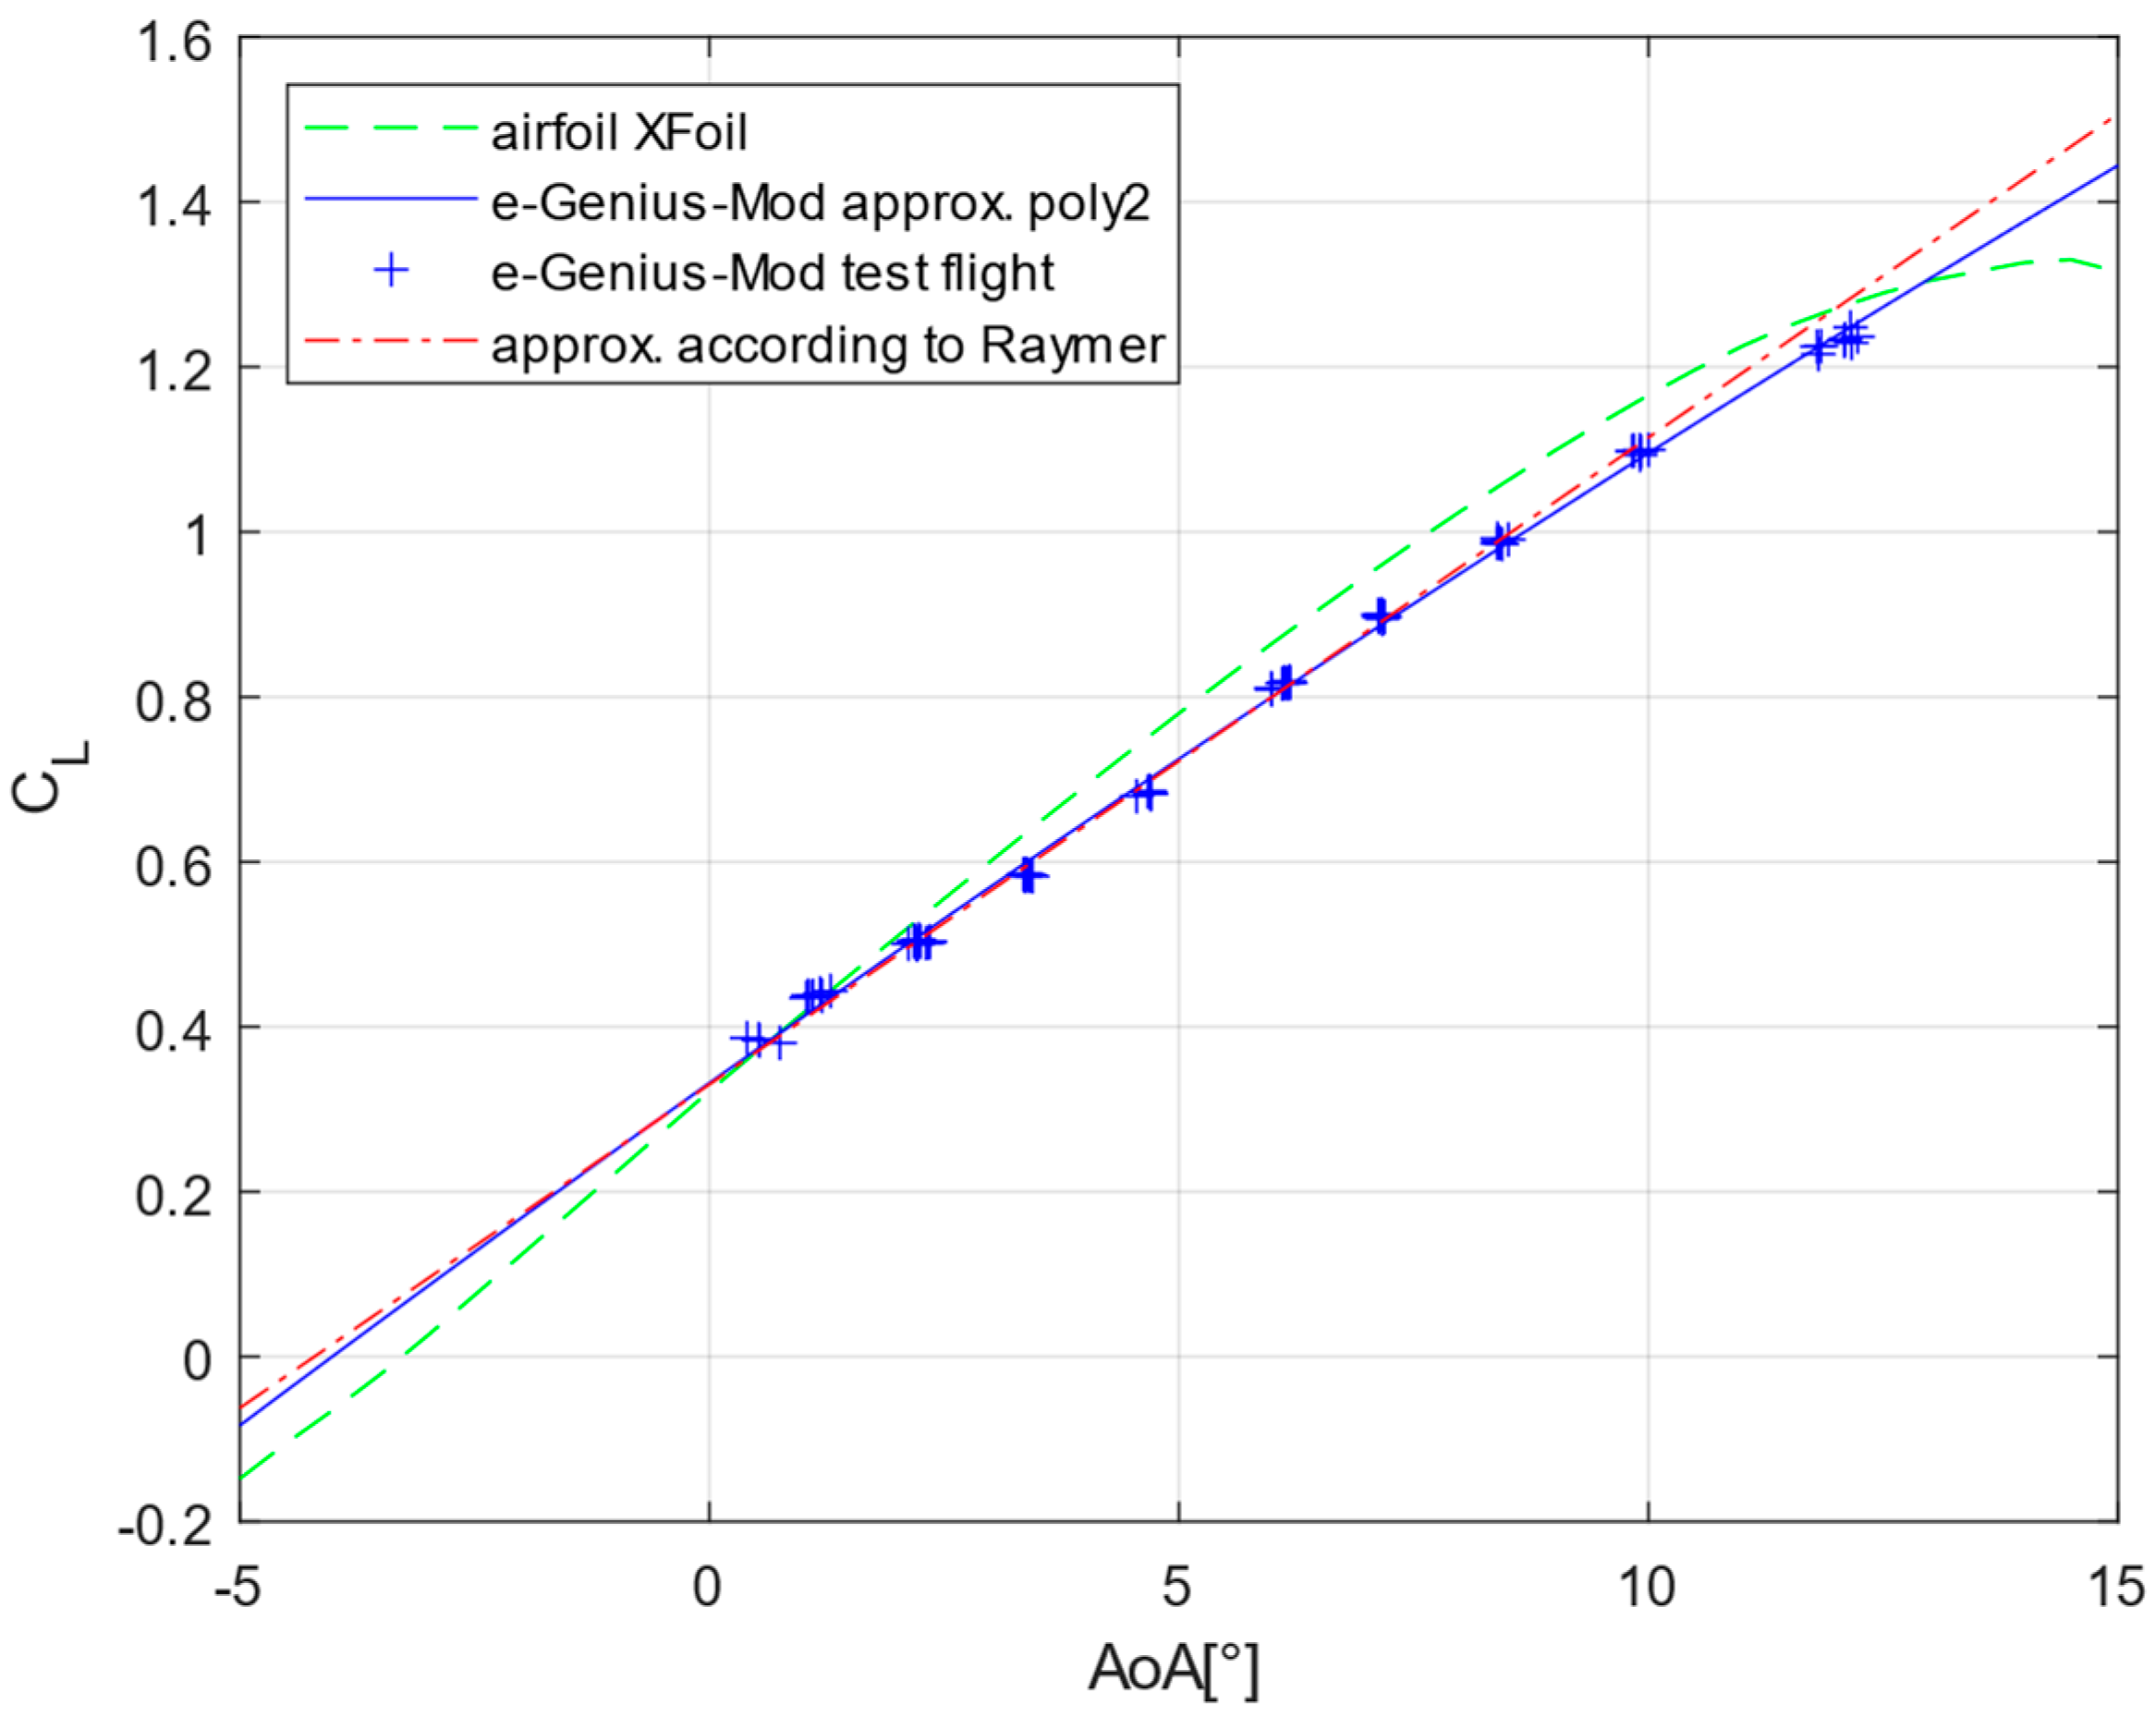
The measurements obtained from the flight tests provided the expected results with regard to the thrust curves and the resulting polar. As a first comparison between flight test results and a simulation of the wing airfoil, the gradient of lift coefficient versus the angle of attack was assessed. A comparison with the lift of the airfoil simulated in XFoil [
13] shows a very good agreement with reality (
Figure 14). The slight deviation of the slope of the two curves results from the influence of the lift distribution on the real wing caused by the boundary vortices.
The amount of the deviation depends on the aspect ratio (
) of the wing and can be calculated approximately [
14] as follows with
describing the wing span and
the reference wing area:
The angle of attack for zero lift is found as −3.8° from interpolation of the measured values from real flight, which gives a good agreement with the value expected from the simulation. The corresponding installation position of the air data probe in relation to the wing’s angle of attack is thus correctly recorded.
An additional validation method was performed, calculating the wing’s lift curve slope with a semi-empirical formula [
15], applicable for subsonic design.
Within formula (6)
describes the so-called efficiency of the airfoil and is approximately 0.95 according to [
15].
considers the flight velocity respectively the Mach number (M).
The wing geometry and the influence of the wing are considered in Equation (7) with
and
:
is the aspect ratio of the wing section with the thickest airfoil chord location. The wing area exposed by the fuselage is considered with
and the lift generated by the wing is approximated with
estimated via the diameter
of the fuselage tube under the wing. According to Raymer [
15], these can be calculated as follows.
To consider also the effects of the winglet the effective aspect ratio of the wing is estimated according to [
14] taking into account the height of the winglets
in relation to the wing span.
The polar of the calculated lift curve slope (
) is plotted in
Figure 14 and the zero crossing is shifted by the estimated
. In a direct comparison of the part of the lift polar which can be considered as nearly linear between the semi-empirical and the measured lift curve slope with
a good match is achieved with only 3.01% deviation of the curve slope.
In the simplified approach used in this paper, the possible error in the results must also be considered. A relatively small error can be assumed for the lift coefficient. This error is made up of the accuracy of the air data probe (measurement error flow angle: <1.0°, velocities: <1.0 m/s) and a possible installation error which is corrected in the post processing. The drag measurement must be viewed with greater caution. The accuracy of the measuring system has been demonstrated under laboratory conditions, the variation of the measured thrust values due to the fluctuating speed controller (see
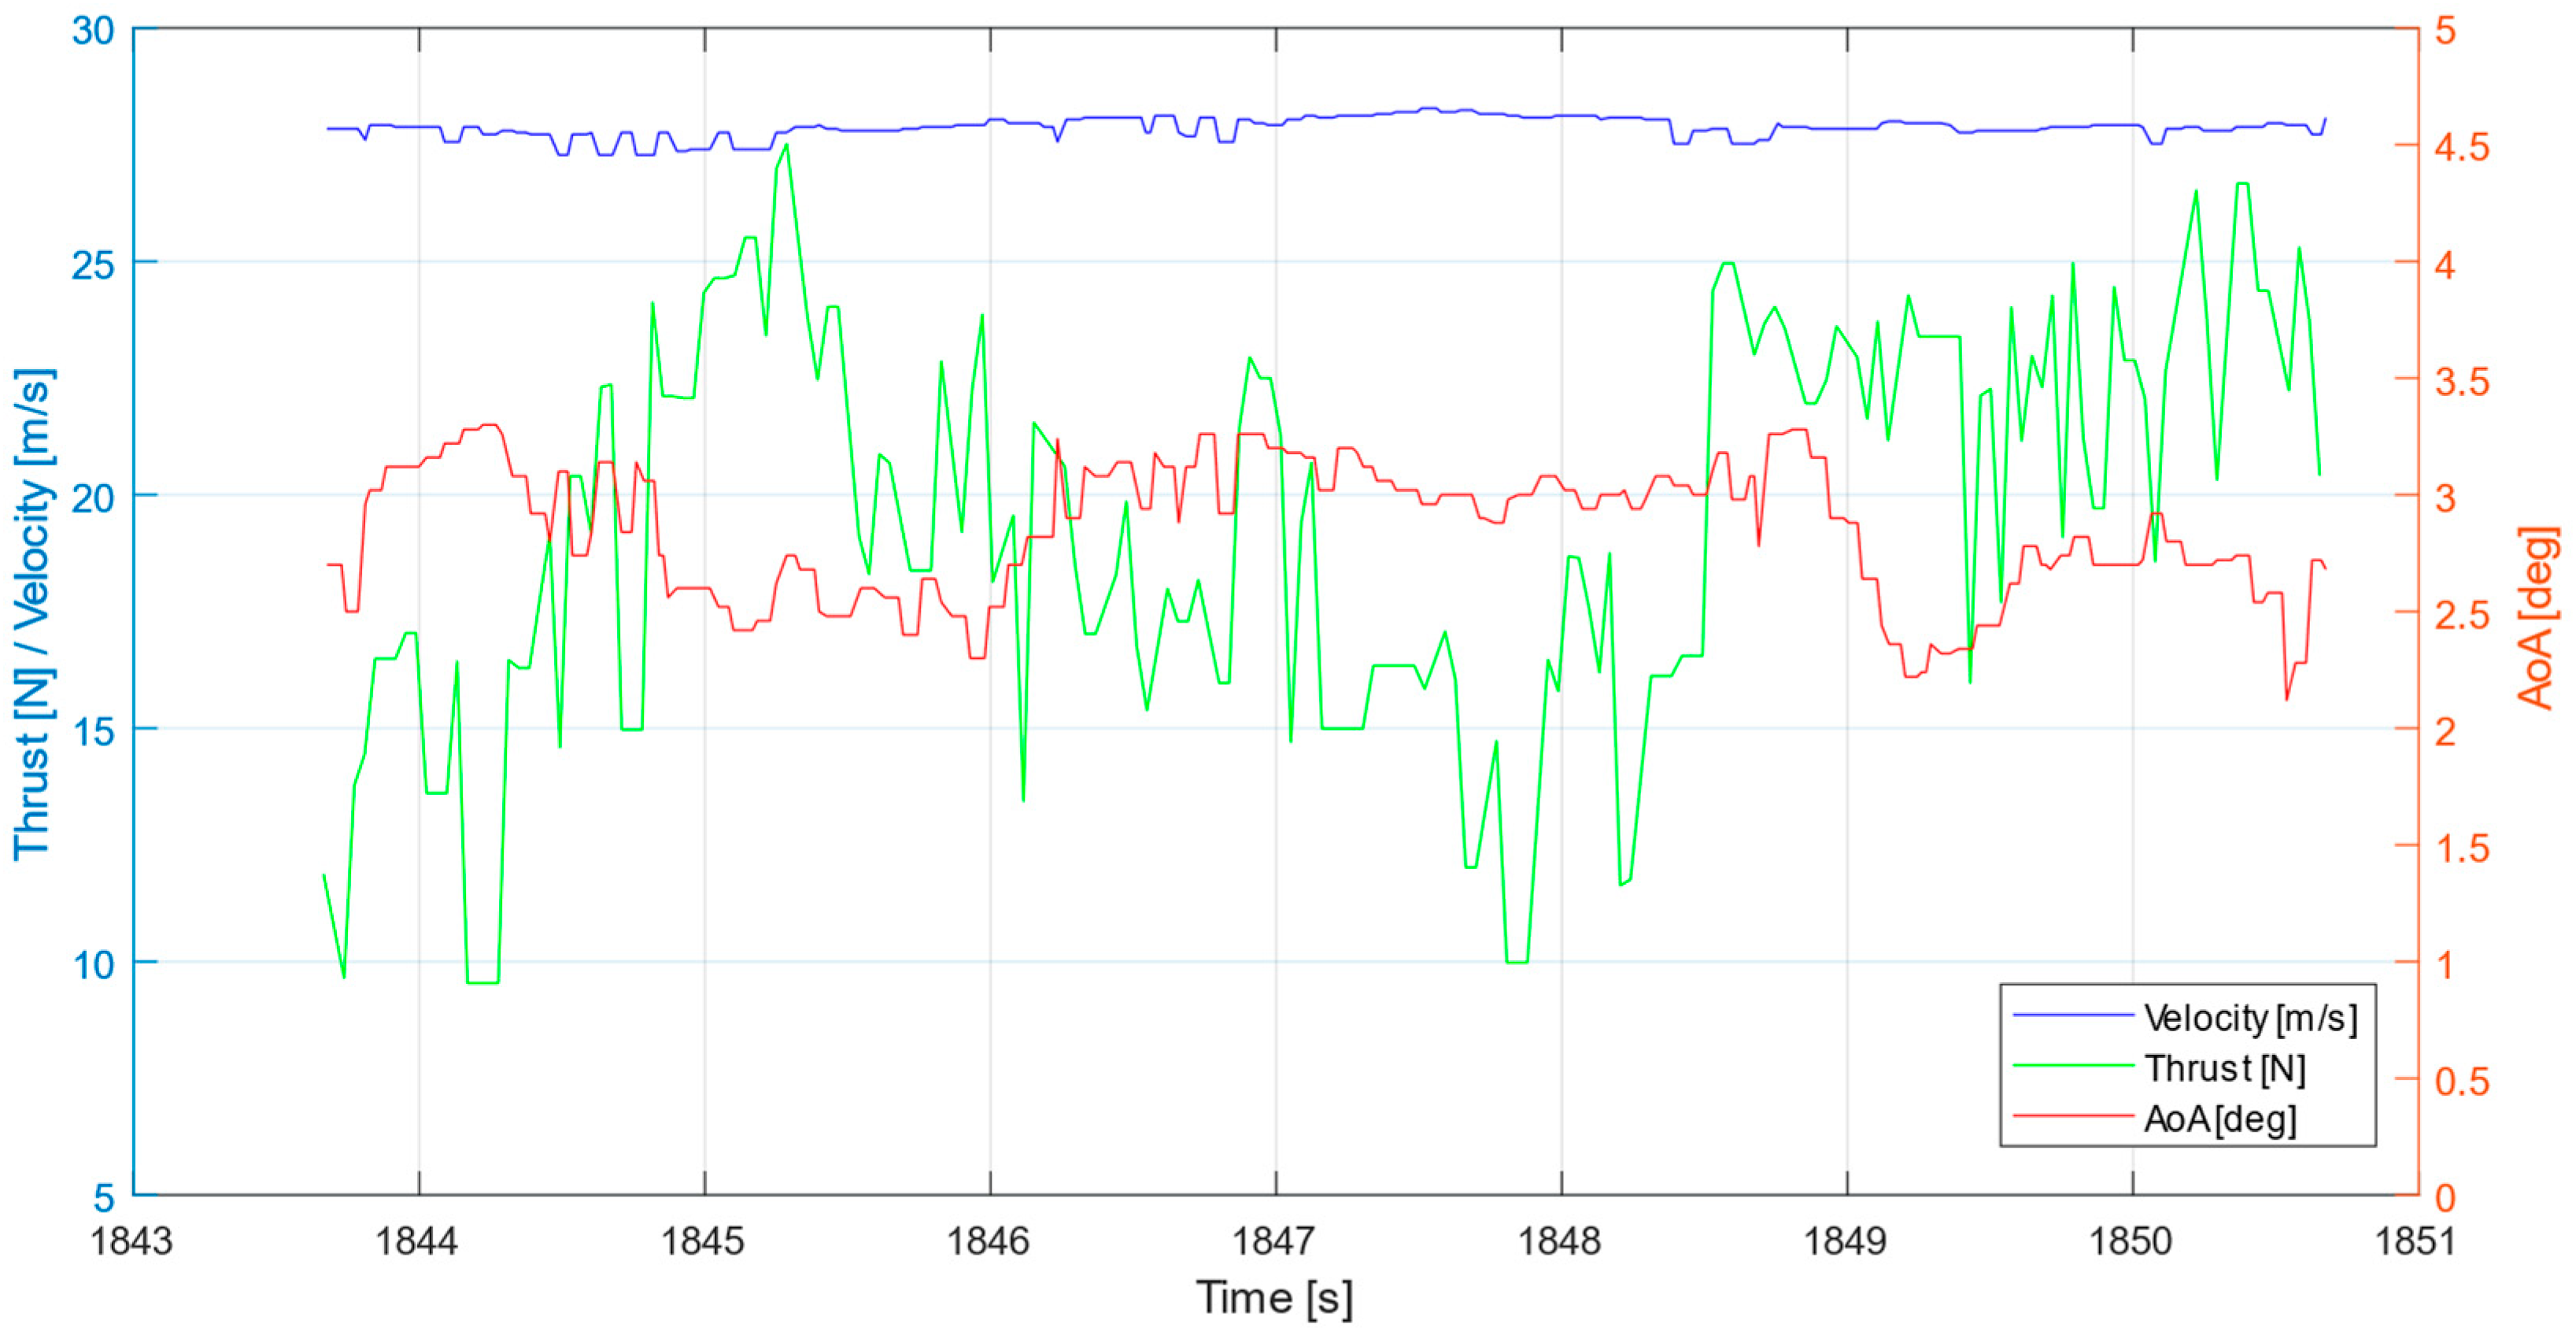
Section 5) leads to a high standard deviation (mean 26.56%).
Nevertheless, the thrust measuring system generated usable data, which, however, are subject to fluctuations due to controlling thrust values. This must be considered in the evaluation. For further flight tests, control authority for the airspeed control should be reduced in order to ensure that the measured thrust values are smoother and there is less scattering. The proper functioning of the measuring system was verified in laboratory tests before and after the flight tests.
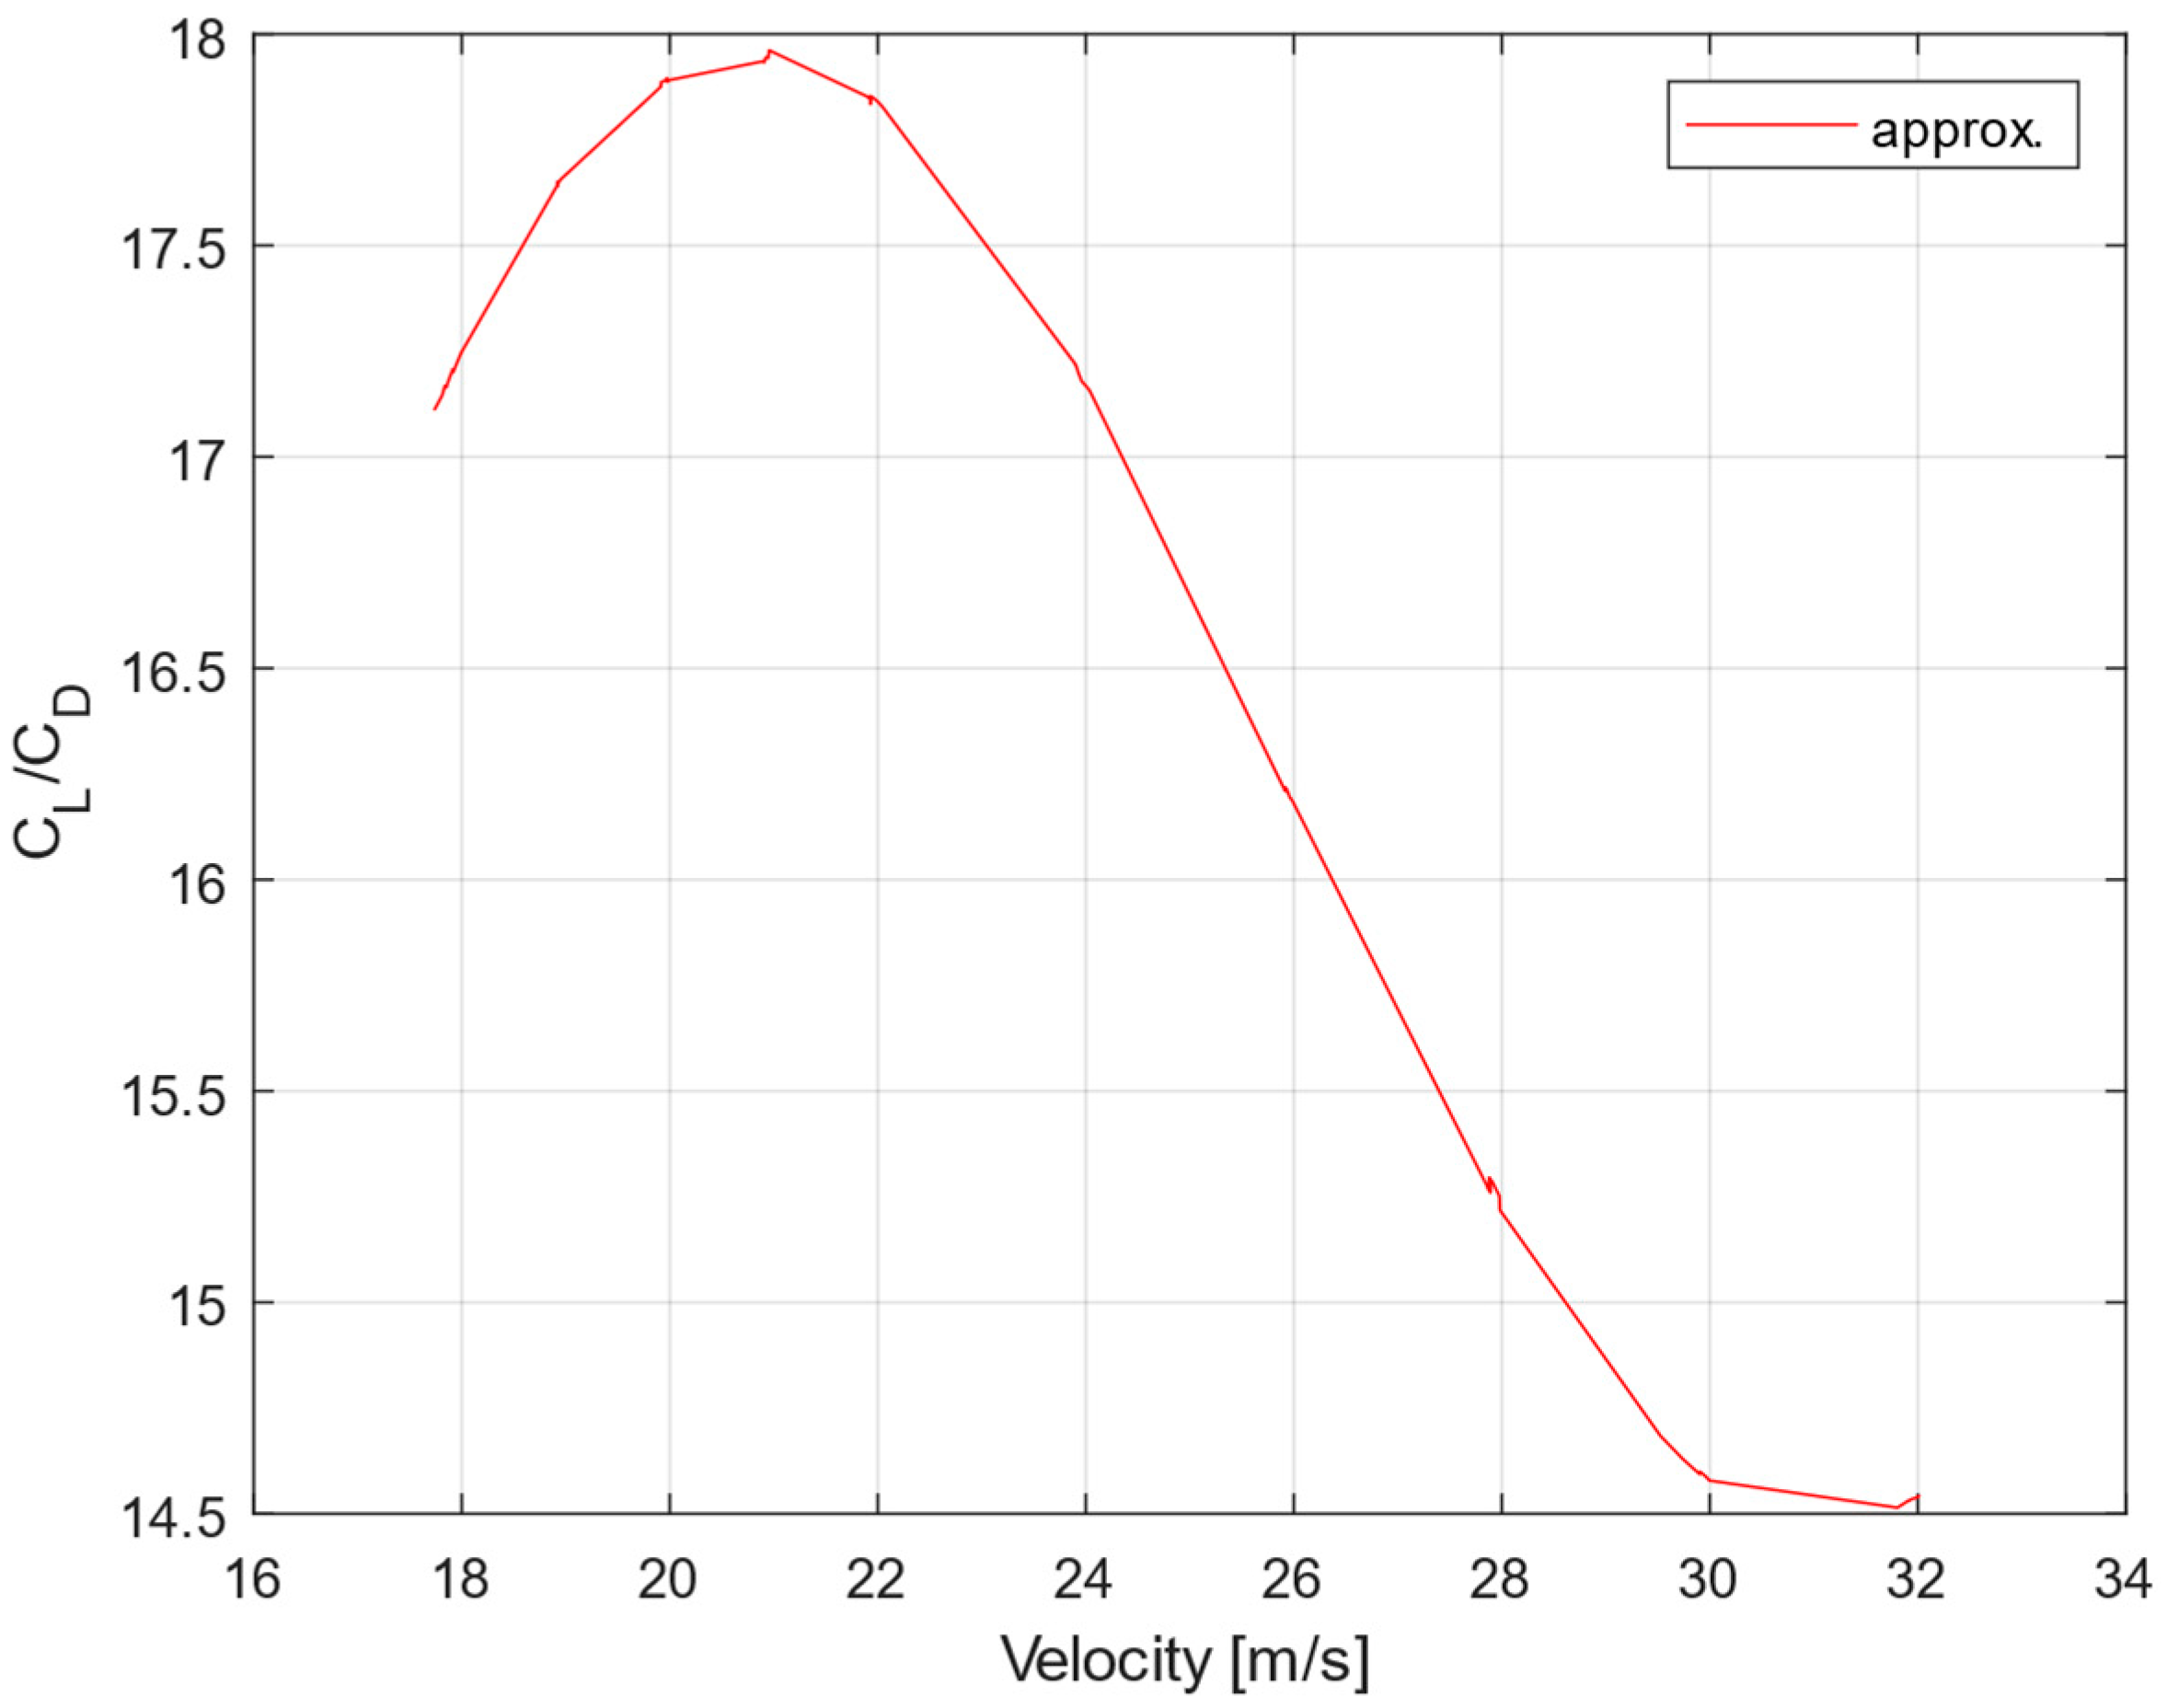
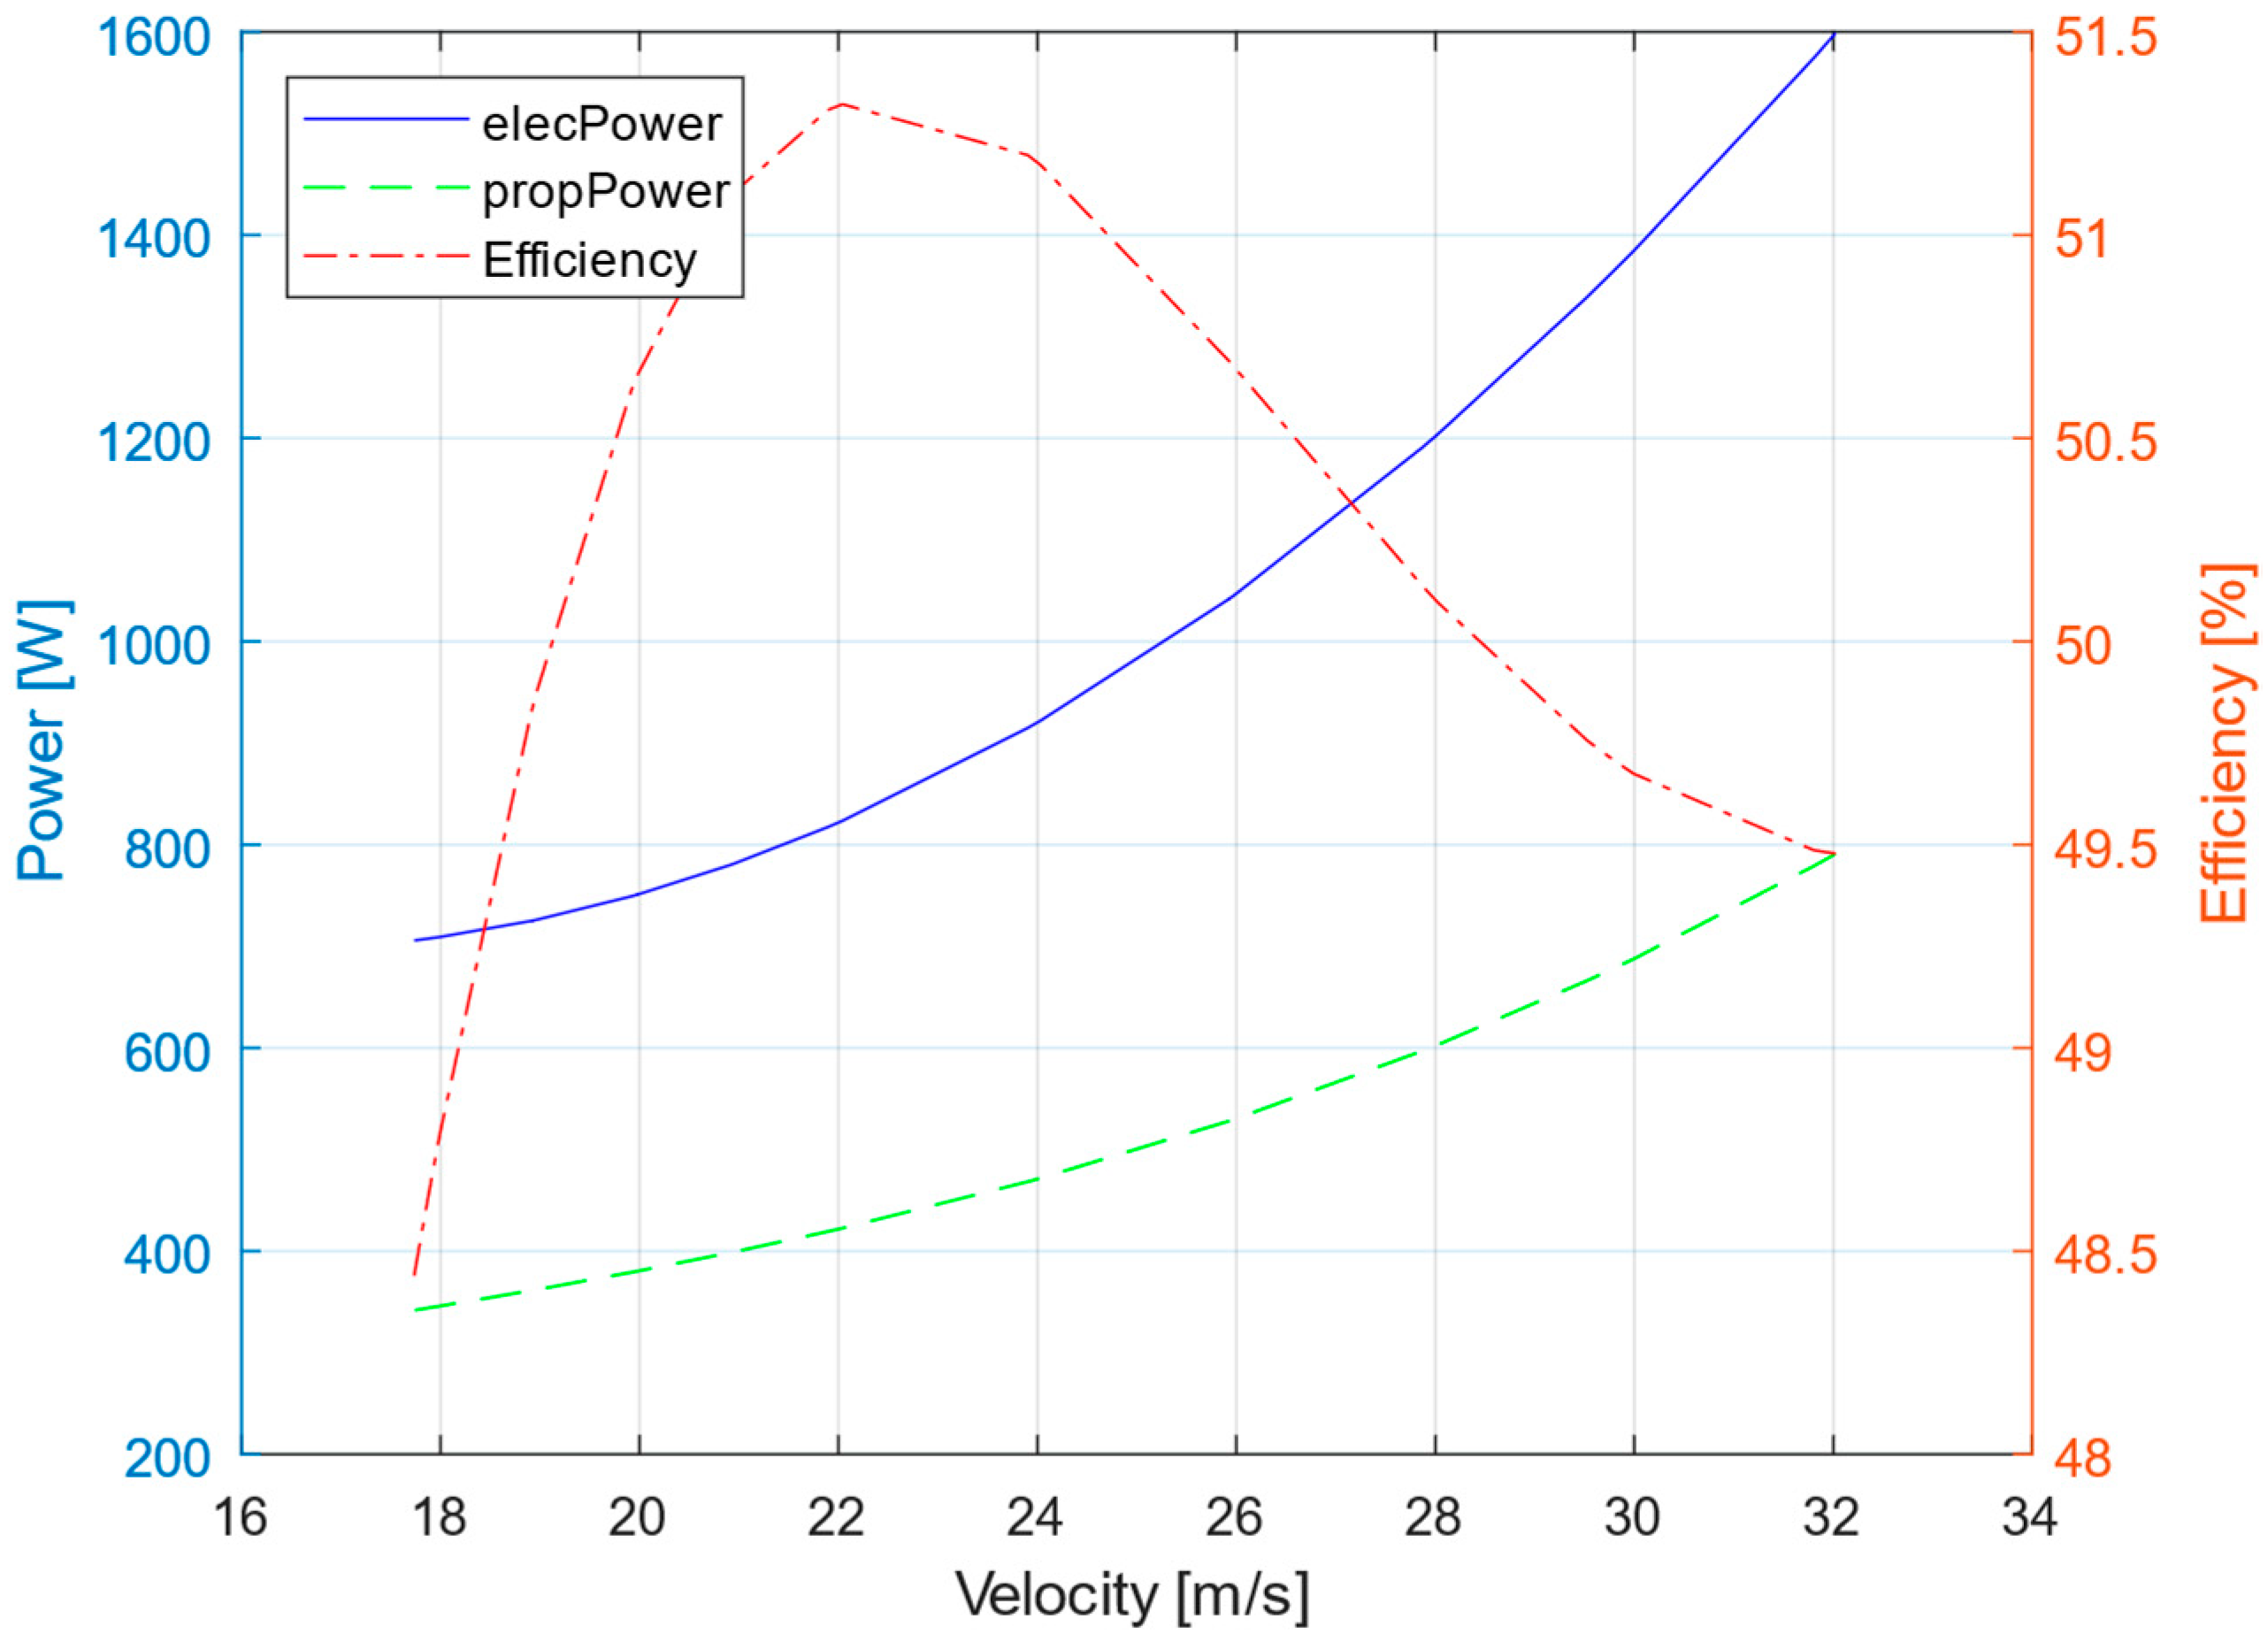
The measurement of the thrust finally gives information about the total drag, which is necessary to establish the drag polar and aerodynamic parameters of interest. From the illustrations in the “results” section the corresponding statements regarding the aerodynamic performance of the system can be derived. The values are within the predicted range. As expected, the scaling of the aircraft brings the optima for best range and flight duration very close together. By measuring the thrust during flight while simultaneously observing the electrical power consumption, a direct statement can also be made about the overall efficiency of the drive train. It can be seen from
Figure 13 that the optimum efficiency is found in the range of the speed at which the system is operated in the glide ratio of best range. This is an important step to assess the impact of future design changes to the e-Genius Mod.


 ,
, 


