Article

Prediction and Validation of Landing Stability of a Lunar Lander by a Classification Map Based on Touchdown Landing Dynamics’ Simulation Considering Soft Ground

1
Division of Mechanical Engineering, Jeonbuk National University, 567 Baekje-daero, Deokjin-gu, Jeonju-si 54896, Korea
2
Agency for Defense Development, 160, Bugyuseong-daero 488beon-gil, Yuseong-gu, Daejeon 34060, Korea
3
Korea Aerospace Research Institute, 169-84 Gwahak-ro, Yuseong-gu, Daejeon 34133, Korea
*
Author to whom correspondence should be addressed.
Aerospace 2021, 8(12), 380; https://doi.org/10.3390/aerospace8120380
Submission received: 20 August 2021 / Revised: 23 November 2021 / Accepted: 3 December 2021 / Published: 6 December 2021
(This article belongs to the Special Issue Vibration Control for Space Application)

Abstract

:
In this paper, a method for predicting the landing stability of a lunar lander by a classification map of the landing stability is proposed, considering the soft soil characteristics and the slope angle of the lunar surface. First, the landing stability condition in terms of the safe (=stable), sliding (=unstable), and tip-over (=statically unstable) possibilities was checked by dropping a lunar lander onto flat lunar surfaces through finite-element (FE) simulation according to the slope angle, friction coefficient, and soft/rigid ground, while the vertical touchdown velocity was maintained at 3 m/s. All of the simulation results were classified by a classification map with the aid of logistic regression, a machine-learning classification algorithm. Finally, the landing stability status was efficiently predicted by Monte Carlo (MC) simulation by just referring to the classification map for 10,000 input datasets, consisting of the friction coefficient, slope angles, and rigid/soft ground. To demonstrate the performance, two virtual lunar surfaces were employed based on a 3D terrain map of the LRO mission. Then, the landing stability was validated through landing simulation of an FE model of a lunar lander requiring high computation cost. The prediction results showed excellent agreement with those of landing simulations with a negligible computational cost of around a few seconds.

1. Introduction

Most of the countries with developed space programs have been actively pursuing planetary exploration missions to closely observe planets by sending probes to the Moon, Mars, and asteroids. In the United States (US), lunar exploration missions of manned and unmanned lunar landers, including Apollo landers and Surveyors, have been successfully carried out [1]. In 2009, the US launched the Lunar Reconnaissance Orbiter (LRO) and created a 100-m, coarse-resolution map of the entire lunar surface with a 0.5-m resolution around Apollo landing sites. SpaceX recently began planning a project called DearMoon, in which an orbiter will fly in the lunar orbit in 2023 and launch Orion spacecraft on the Moon with NASA in 2024. In 2009, China launched a lunar orbiter, Chang’e 1, and then launched a lunar lander, Chang’e 3, with a small rover that landed successfully on the lunar surface in 2013. The exploration rover of Chang’e 3 explored the topography and geological configuration of the lunar surface for 3 months and sent photographs and observations back to Earth. In November 2020, China launched Chang’e 5 to the Moon, and it returned with 1.73 kg of lunar soil and rock samples to Earth [2,3,4].
In addition, India launched a lunar orbiting satellite, Chandrayaan 1, in 2008 and launched Chandrayaan 2 to analyze the lunar surface in July 2019. A month after launch from Earth, Chandrayaan 2 safely entered the lunar orbit and successfully separated the orbiter and the lunar lander but lost communication while landing [5,6]. In Israel, the world’s first private space exploration company, SpaceIL, launched a lunar lander, Beresheet, in December 2018, but the onboard computer malfunctioned during its descent to the surface of the Moon. Then Beresheet lost communication at 489 feet from the lunar surface and crashed.
To perform successful lunar landing missions, a safe landing site must be chosen. In the Apollo project, the landing site was determined by human eyes, and the existing Mars/Moon landing missions used radar and lidar of various wavelengths to select the final landing site using a simple altimeter, speed, and rangefinder. Recently, to increase the success rate of lunar landing missions, a method of performing evasive maneuvers after real-time terrain mapping using lidar is being studied [3]. The lunar lander has to hover stably about 3 m above the lunar surface at the target landing point, stop the engine, and perform a free fall to land on the ground. At this time, the touchdown speed must be less than 3 m/s in the vertical direction and less than 1 m/s in the lateral direction, according to the many lunar mission. Moreover, it is necessary to land safely on the lunar surface without the lunar lander tipping over or sliding.
Thus, predicting the landing stability at a given landing site is essential for lunar exploration missions [7,8,9,10,11,12,13,14]. As a method of predicting landing stability, many studies have been conducted on selecting an optimal landing site by analyzing the slope angle of the Moon’s surface. In the work of Cui [15] and Ploen [16], a safety index, which is a criterion for evaluating several landing zones, was proposed by considering the topographic stability and topography of landing points during the descent of lunar landers. In addition, Serrano et al. [17] evaluated real-time, ground-based stability using fuzzy rules and measurement data from onboard sensors, such as radar, cameras, and lidar, which led to the selection of a safe landing site. Liu [18] proposed a method for selecting a safe landing site by applying the optimization problem. In addition, methods for finding craters through machine learning and deep learning are being studied for hazard avoidance or real-time evaluation [19,20,21,22].
However, considering only the lunar surface configuration, it is somewhat difficult to predict the actual landing stability because shock absorption caused by the soft lunar soil and shock absorber cannot be simulated. Furthermore, the computation cost of predicting the landing stability has to be minimized because of the limitation of the onboard computer and memory, thus making the development of such algorithms more difficult.
Therefore, the goal of this work was to present a new method to estimate landing site safety, which is more time efficient than full simulations through the classification map with the help of logistic regression, a kind of machine learning-based classification algorithm through explicit touchdown landing dynamics’ simulation.
The proposed method of predicting landing stability is summarized in the flow chart shown in Figure 1.
First, a small, flat lunar surface was considered, and the landing simulation of the lunar lander was conducted under various landing conditions according to the slope angle, friction coefficient, and soft/rigid ground. All of the landing simulation results obtained for the small, flat lunar surface were categorized into three stability conditions: safe (=stable), sliding (=unstable), and tip-over (=statically unstable). Next, the results were converted to a classification map of landing stability with the aid of a logistic regression model, a machine-learning classification algorithm. Finally, the landing stability was evaluated by Monte Carlo (MC) simulation [23] for two virtual lunar surfaces by just referring to the classification map for an arbitrary input dataset, consisting of the friction coefficient, slope angles, and rigid/soft ground. The accuracy of this prediction and the computation cost were compared with those of the landing simulation of the FE model of a small lunar lander.
The rest of this paper is organized as follows. Section 2 will describe how to construct FE models of a lunar lander and initial and boundary conditions for landing dynamics’ simulation. Section 3 discusses the process of predicting landing stability, followed by the prediction accuracy and computation cost. Finally, we conclude this paper with concluding remarks.

2. Touchdown Landing Dynamics’ Simulation

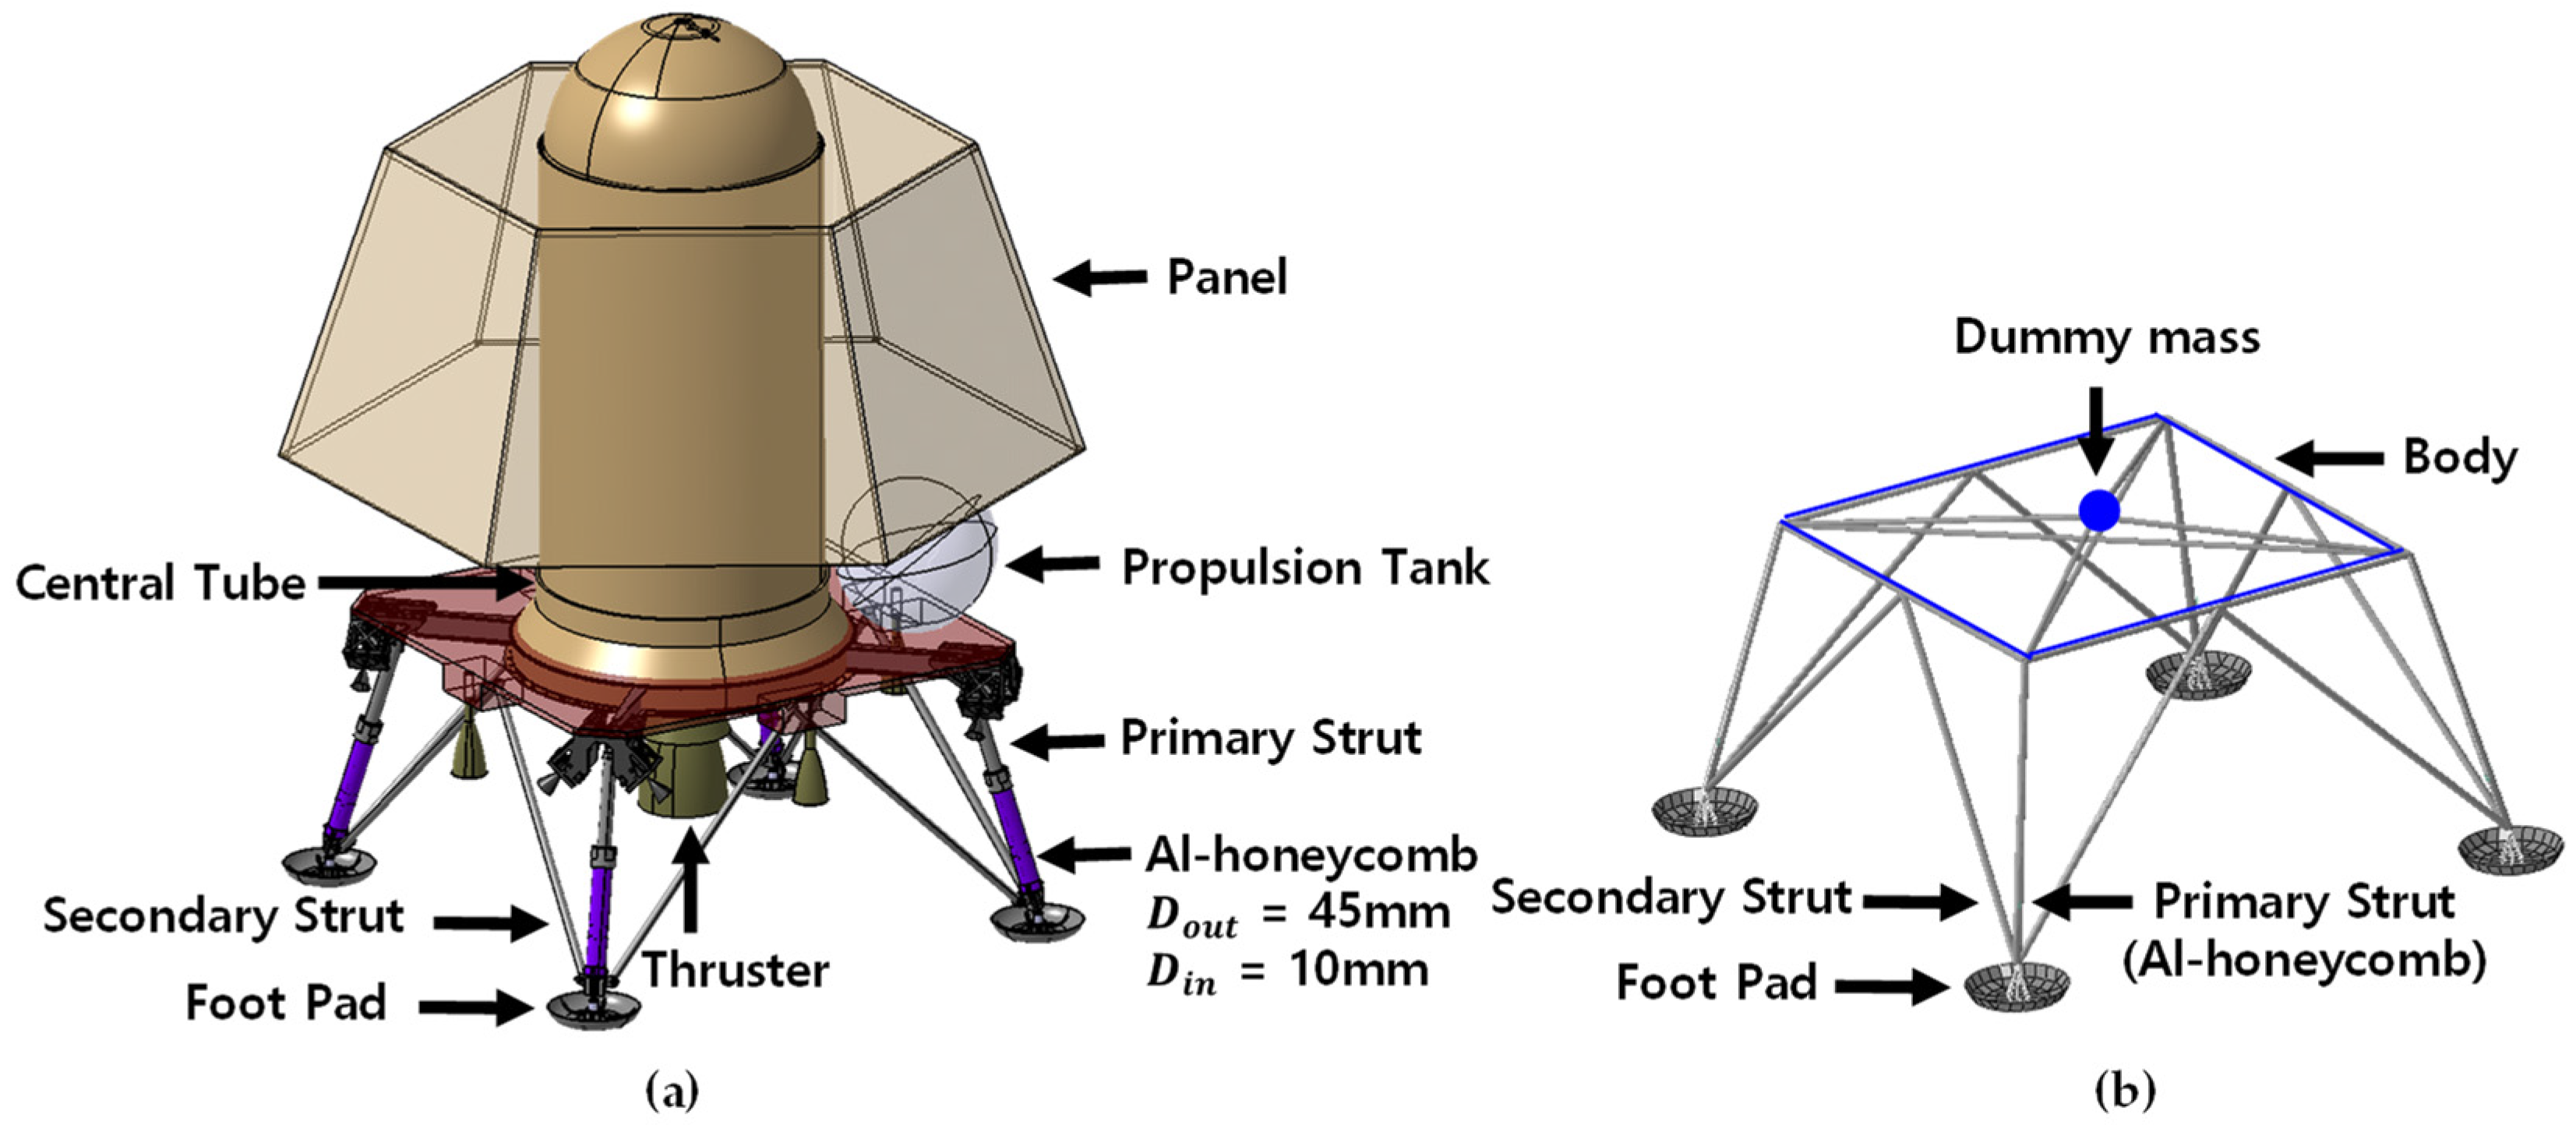
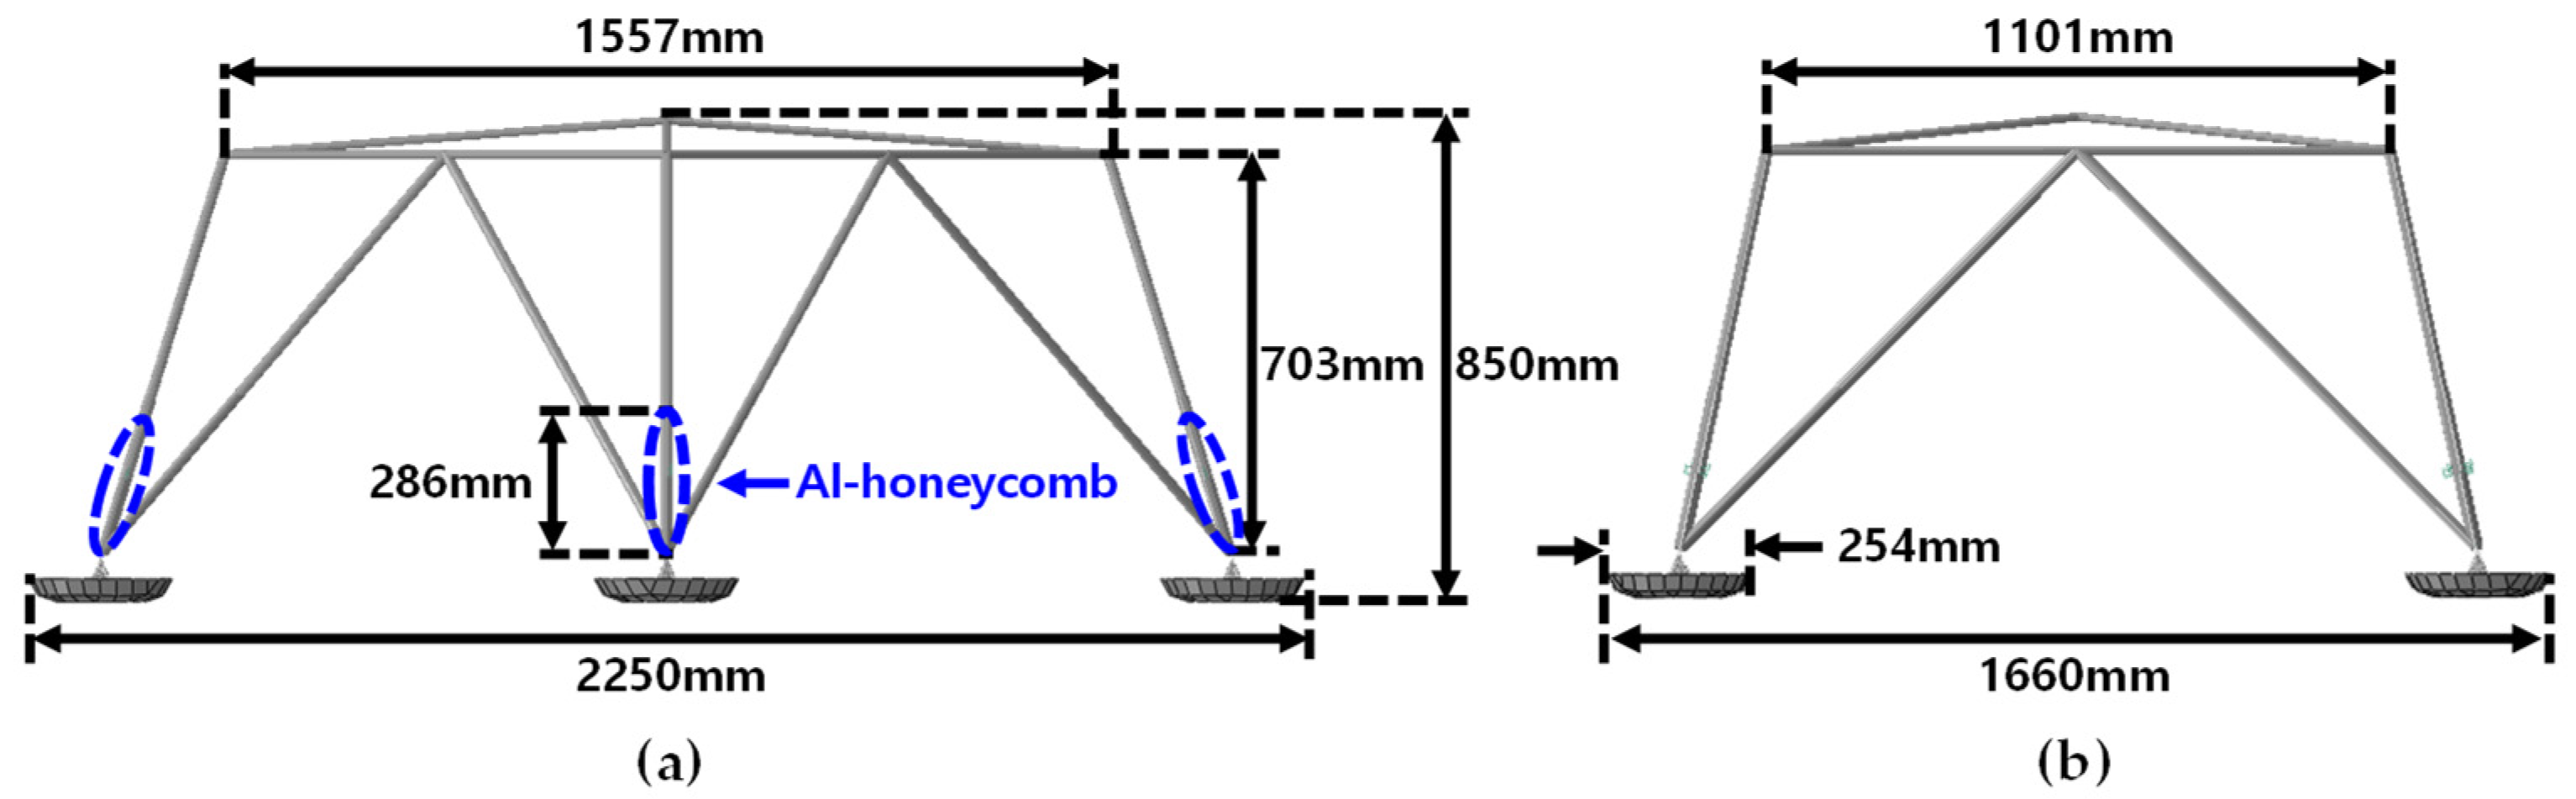
2.1. Finite-Element Model of the Lunar Lander

As shown in Figure 2a, a CAD model of the lunar lander consist of a central tube, a propulsion tank, a body plate, panels, primary struts, secondary struts, footpads, and so forth. A lunar lander FE model was constructed (see Figure 2b); the footpads, which come into contact with the lunar surface, were modeled in detail. The primary struts have shock absorbers made of aluminum (Al) honeycombs (HCs) and were modeled with truss elements (T3D2 element) that can realize elastoplastic behavior. The others were simplified as dummy mass elements in terms of mass and mass moment of inertia [24,25,26], which are efficient for landing dynamics’ simulation.
Among Al-HCs, CRIII-5/32-5052-.0007P-2.6 was chosen in Hexcel [27]. To simulate the mechanical behavior of Al-HCs from the data obtained through the compression test in ABAQUS, the truss element (T3D2) was employed with the elastoplastic material behavior. To this end, the true axial stress (σtrue) and plastic strain (εpl) are required for ABAQUS material input [28]. From the compressive load versus displacement test results in Figure 3, the true axial stress and plastic strain were computed as
σ t r u e = F A 0 × ( 1 + δ L 0 )
ε p l = ln ( 1 + δ L 0 ) σ y i e l d E
where σtrue and εpl indicate the true stress and the plastic strain, respectively, F and δ represent the compressive load and compressive displacement of the compression test, respectively, A0 and L0 indicate the initial compressive cross-sectional area and length of Al-HC, respectively, and σyield and E are the yield stress and elastic modulus of Al-HC obtained by the compression test. The curve of σtrue and εpl (see Figure 3) was implemented in the truss element for the Al-HC of the shock absorbers in the landing gear to reproduce the compression test data of the Al-HC specimen, as seen in Figure 4.
The footpads support the lunar lander to avoid overturning upon touchdown and were constructed using shell elements, as seen in Figure 5 [29]. The mass property table and the major dimensions of the FE model according to the landing configurations of 1-2-1 and 2-2 landings are shown in Table 1 and Figure 5. A “1-2-1 landing” indicates a landing configuration in which the lander first touches down on the ground with one leg; a 2-2 landing indicates a landing configuration in which the lander first touches down on the ground with two legs.

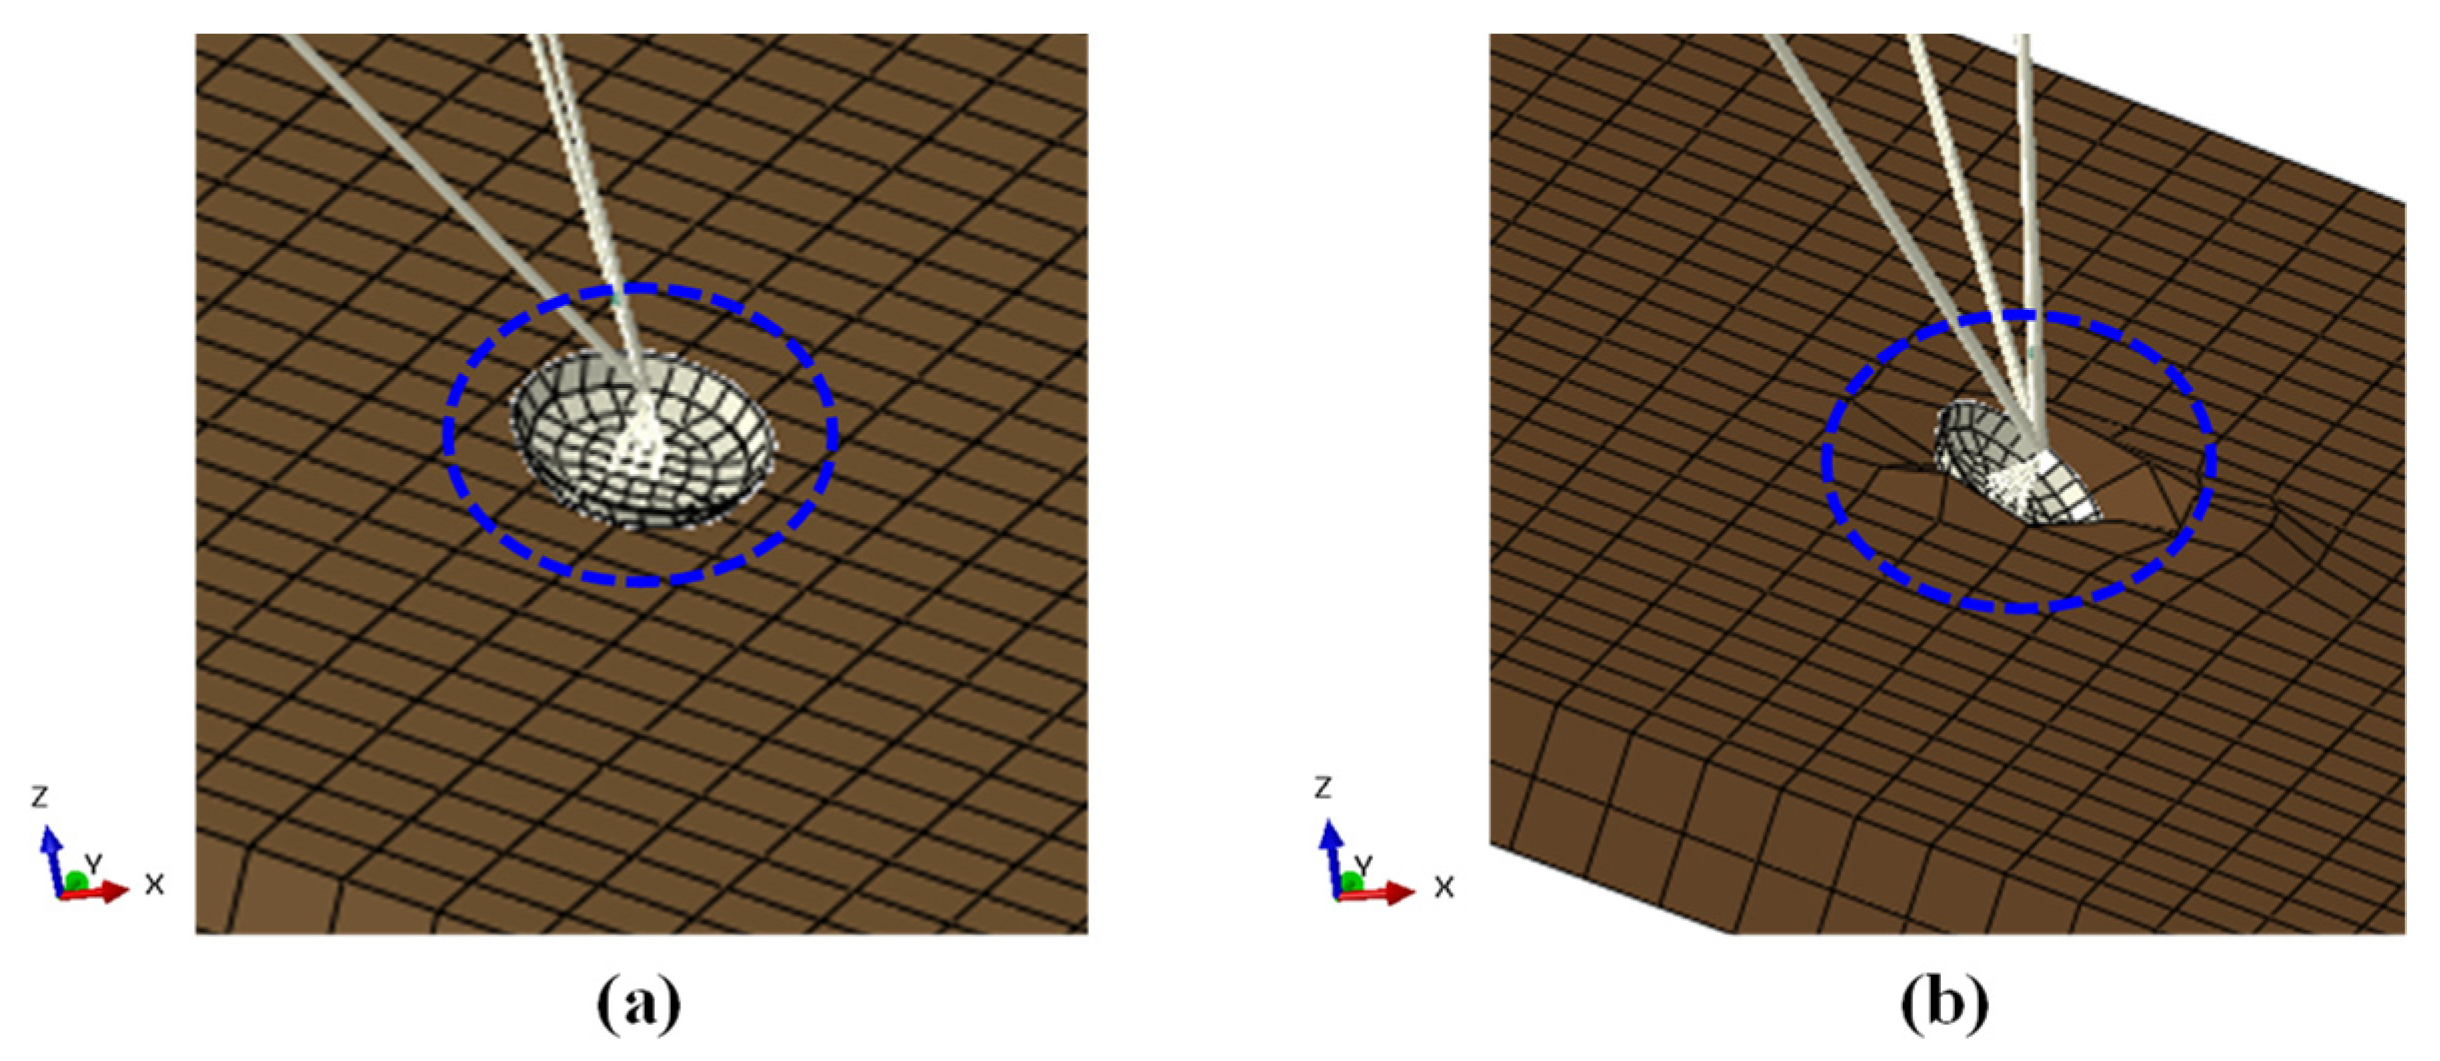
2.2. FE Model of the Soil Models

The mechanical behavior of many soil samples was approximately expressed by the Mohr–Coulumb model. This was characterized by two parameters: the internal friction angle (ϕd) and cohesion stress, which were obtained by a direct shear test of Jumunjin sand [30], a lunar soil simulant, according to ASTM D3080. The ϕd was 33.6°, typically ranging from 30° to 50°, and the cohesion was 2.45 kPa, which was confirmed to be similar to the cohesion of lunar soil. The relations between ϕd, relative density Dr, and void ratio e can be expressed as
ϕ d = 0.0009 ( D r ) 2 + 0.0216 D r + 31.233
D r = e max e e max e min × 100
where emax is the maximum void ratio of 0.864 and emin is the minimum void ratio of 0.617.
To compute the initial Young’s modulus (Ei), the initial shear modulus (Gi) is calculated as
G i = B p a t m 0.3 + 0.7 e 2 ( p p a t m ) 0.5
where B is the shear modulus number of 150, patm is the atmospheric pressure (assumed to be 101.3 kPa), and p is the effective stress. Because dry Jumunjin soil was used for drop testing, p can be calculated as
p = γ d × H
where γd is the dry unit weight and H is the depth of the soil. The dry unit weight is calculated as
γ d = G s γ w 1 + e
E i = 2 G i ( 1 + ν )
where γw is the unit weight of water, Gs is the specific gravity, mostly in the range of 2.6–2.9, initial Young’s modulus Ei is assumed as 1 MPa, and v is Poisson’s ratio. The mechanical properties of Jumunjin sand for the touchdown dynamics’ simulations are listed in Table 2.

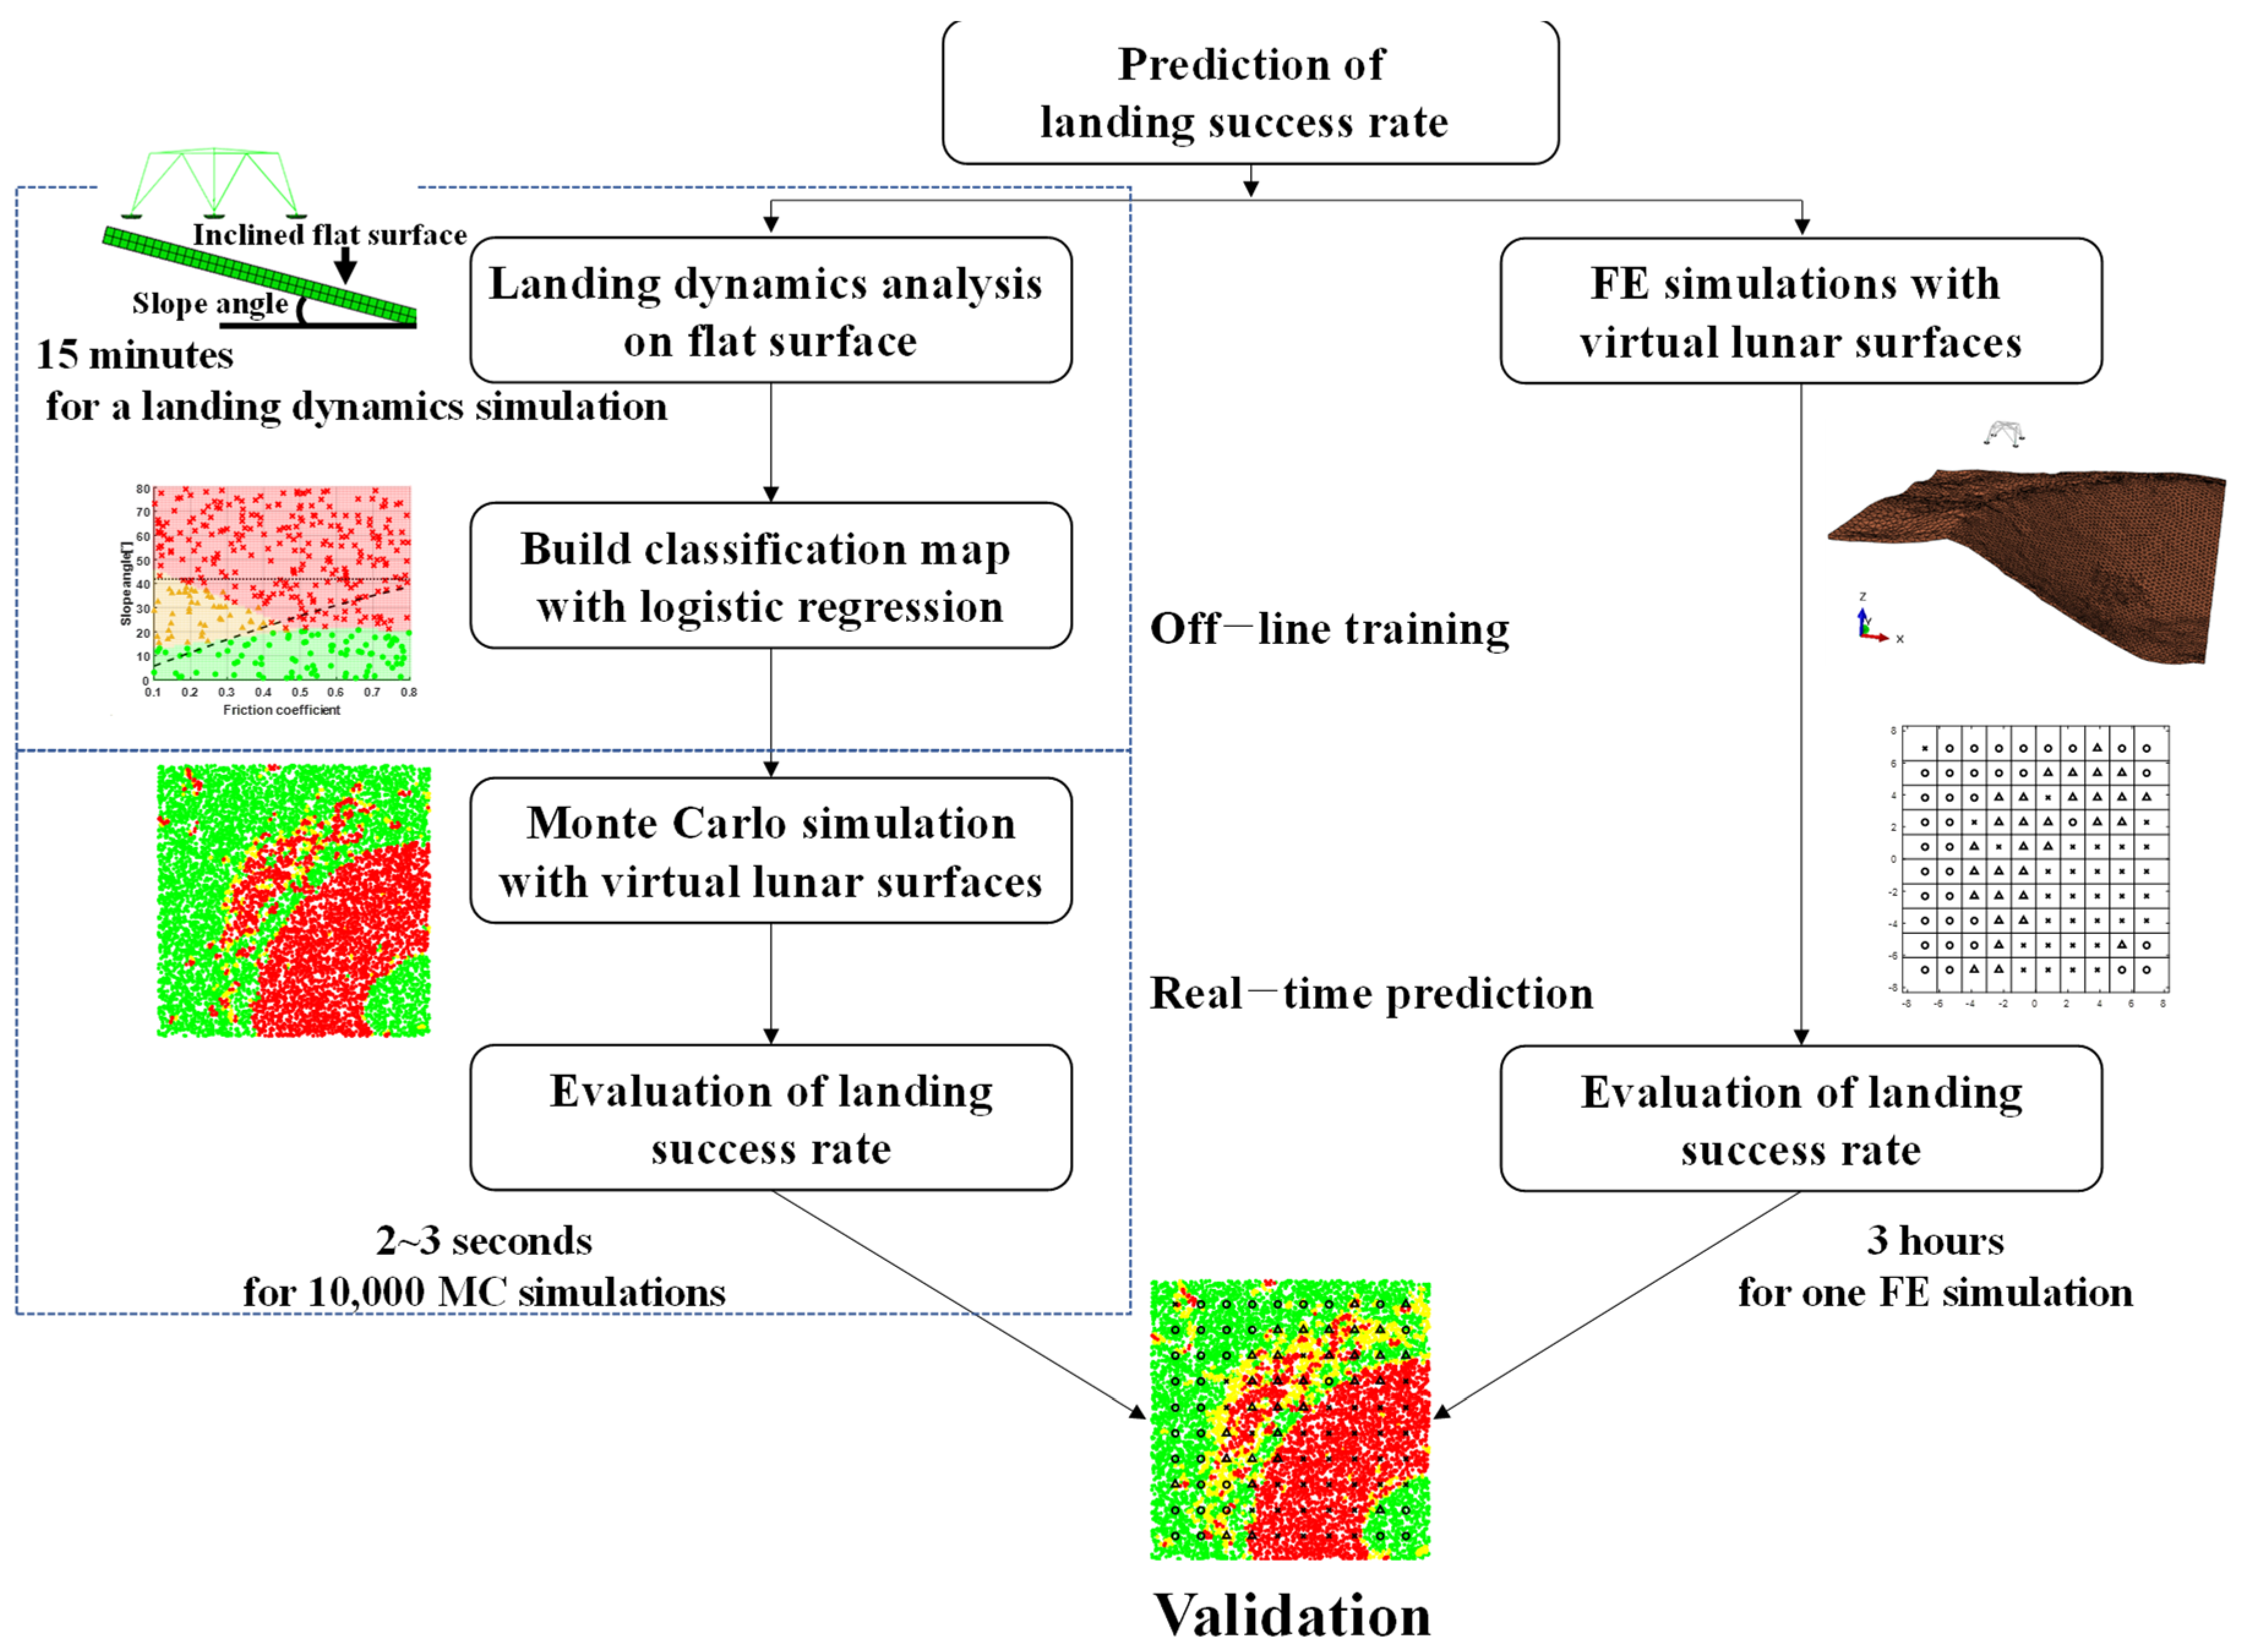
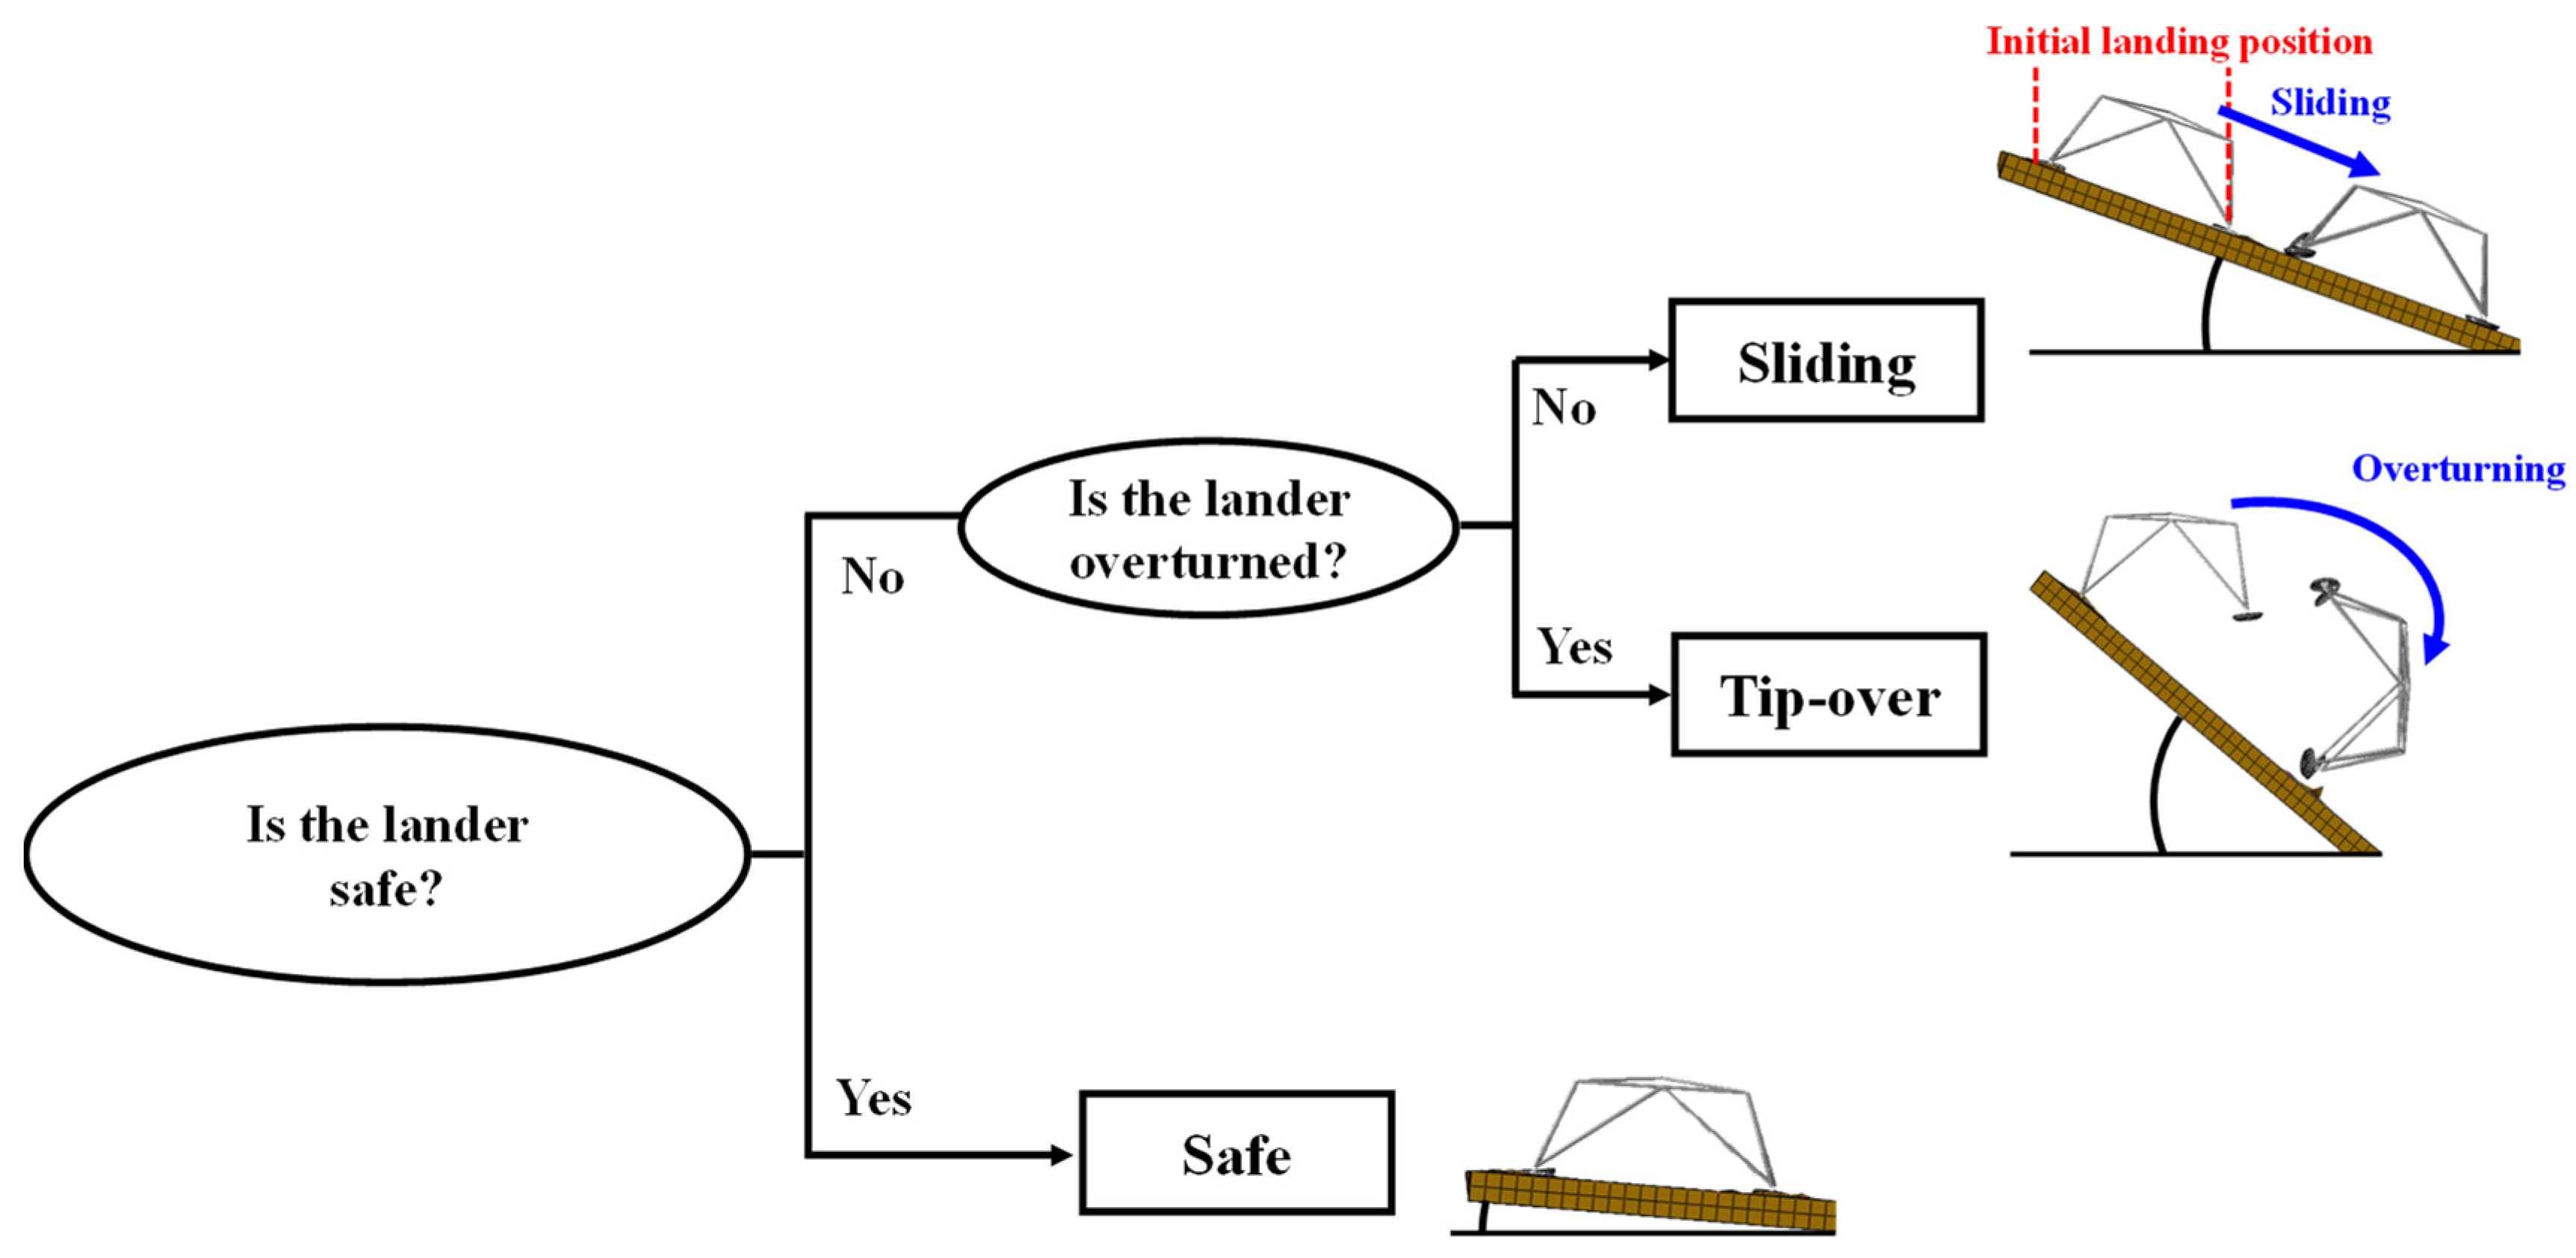
3. Prediction of Landing Stability

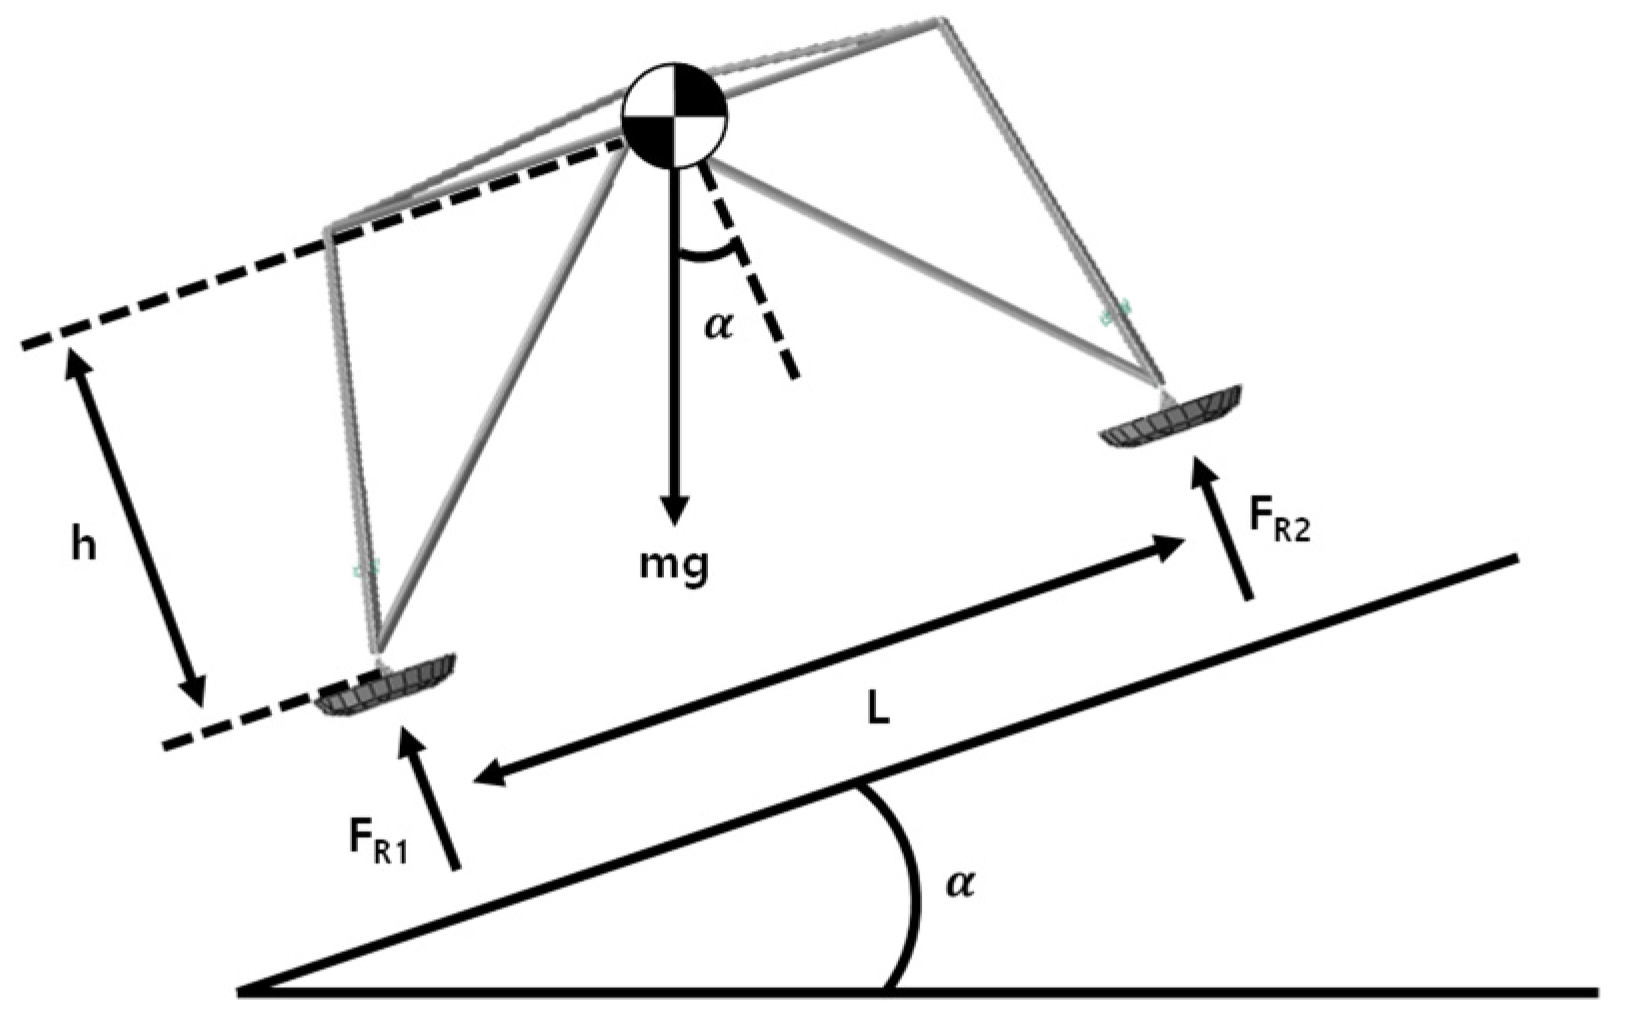
3.1. Static Stability Condition

After landing simulation, the final stability condition of the lunar lander was classified into three categories, namely, safe (=stable), sliding (=unstable), and tip-over (=statically unstable). During the landing, various landing results other than three categories may come out. However, we classified the landing results into three types, safe, sliding, and tip-over, as in the other references [12,17]. It was illustrated in Figure 6. Stability conditions are highly dependent on the slope angle, drop height, and friction coefficient of the lunar surface, the condition of soft/rigid ground, vertical and horizontal velocity [31,32], and so forth. However, in this work, the drop height was fixed to maintain the vertical velocity at 3 m/s and the horizontal velocity was assumed to be zero for simplicity.
Landing stability was predicted by a theoretical static stability condition on rigid ground, proposed by Pham et al. [33]. In their work, to distinguish between safe, sliding, and tip-over landing conditions, the following quasi-static equilibrium equations of the lunar lander were derived. The variables of the quasi-static equilibrium equations are defined as shown in Figure 7.
First, they assumed that sliding occurs when the horizontal touchdown force with respect to the ground is greater than the friction force Ff between footpads and the ground. Thus, the condition of sliding can be derived as in Equations (9) and (10)
m g × sin α F f ( = m g × μ × cos α )
tan α μ
where m and g indicate the mass of the lunar lander and the gravity acceleration, respectively, μ is the friction coefficient between the footpads and the ground, respectively, and α is the slope angle of the ground. According to the lunar surface data, the friction coefficient ranges from 0.4 to 1.0 depending on the landing site [25].
Secondly, the static stability condition of tip-over was derived as in Equations (11) and (12). At the point of reaction force FR1, the moment equilibrium can be expressed as
F R 2 × L + m g × sin α × h m g × cos α × L / 2 = 0
In this state, if the reaction force FR2 is 0, the lunar lander loses its stability. When the equilibrium is higher than zero, the lunar lander tips over and the moment equilibrium can be simplified as
tan α L 2 × h
As a result, the tip-over angle of the 1-2-1 landing configuration was 51.7°, which was higher than 41.8° of the 2-2 landing configuration. This means that the 1-2-1 landing was more stable than the 2-2 landing. However, this static stability condition had some limitations because it cannot consider the effect of soft soil regolith and the actual 3D terrain, leading to a complex interaction between the lander’s footpads and the lunar soil during sliding.

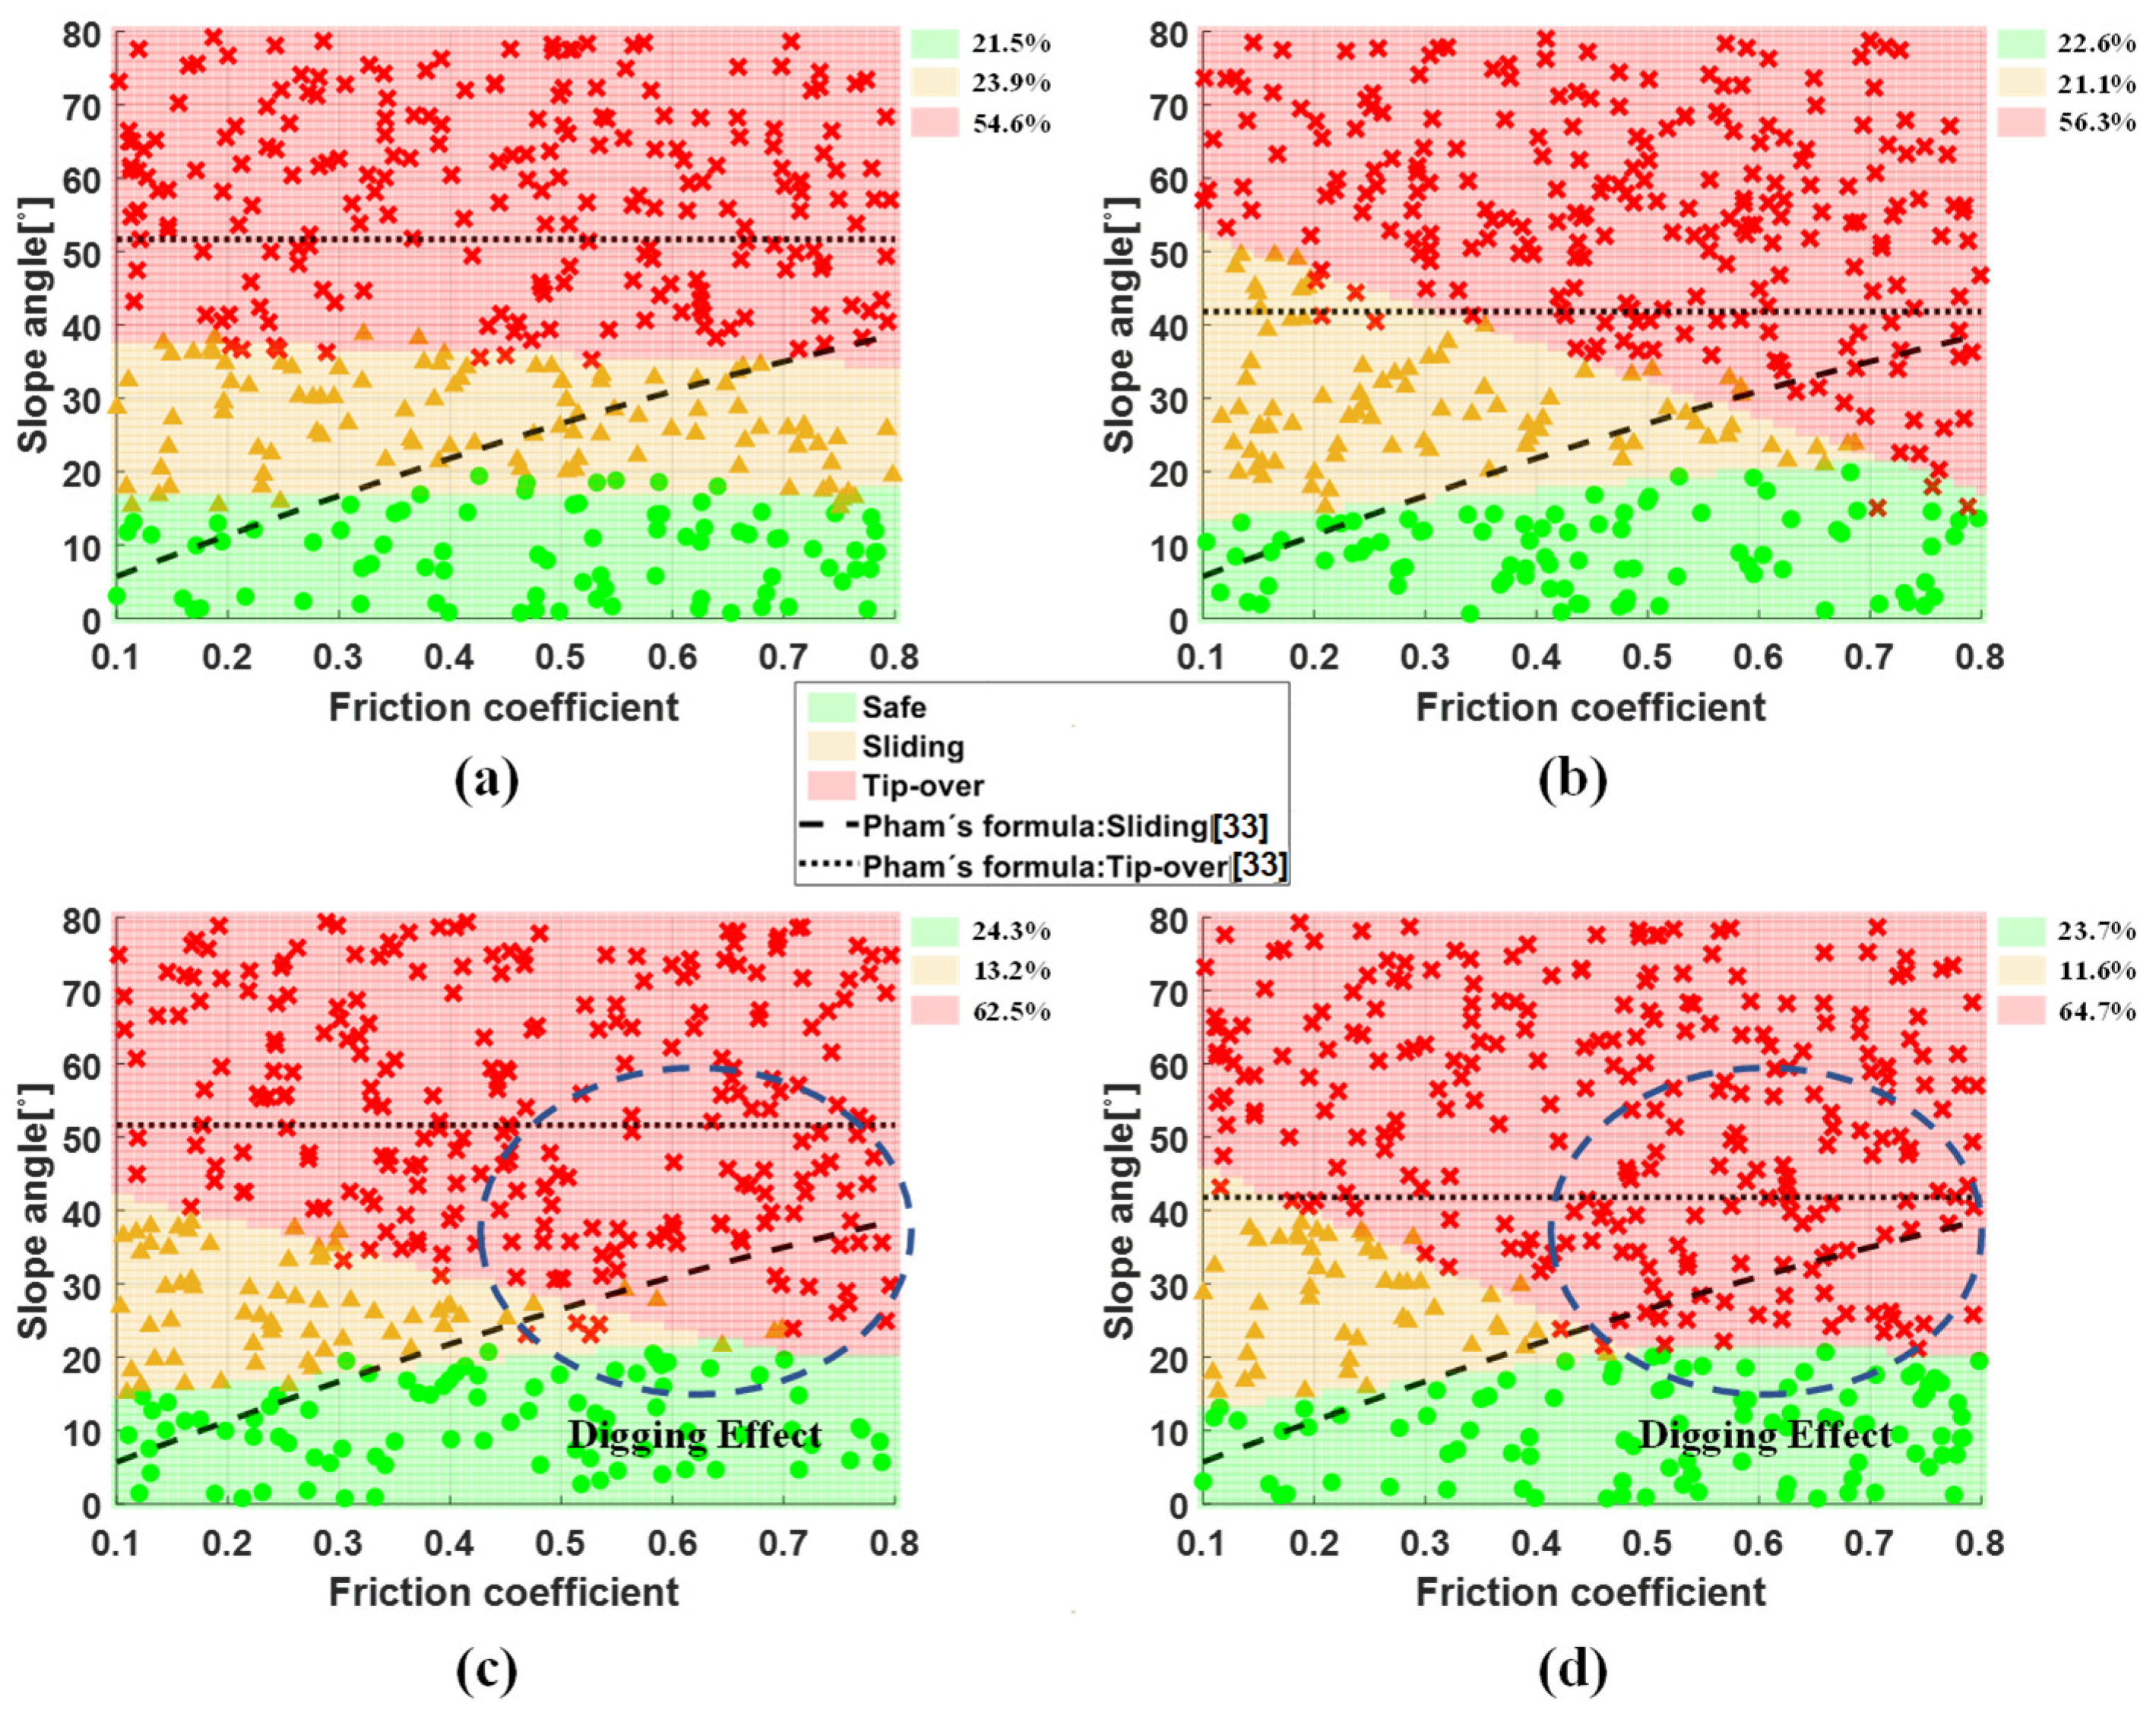
3.2. Building a Landing Stability Classification Map by Logistic Regression

In this work, to distinguish between safe, sliding, and tip-over landing statuses, a total of 300 touchdown dynamics’ simulations with a computation cost of 15 min per simulation were conducted on a flat, rigid soil ground with finite-element models, as mentioned in Section 2, according to the friction coefficient and the surface slope angle of lunar soils similar to the reference [26]. During landing simulation, the slope angle ranged from 0° to 80° and the friction coefficient ranged from 0.1 to 0.8. The obtained landing stability condition was simplified by the classification map. Using the logistic regression, we divided the simulation results into three classes: safe/sliding, sliding/tip-over, and safe/tip-over. Logistic regression classifies the data through a straight line as in Equation (13) [34].
z = ω T x + b
where ω is the weight vectors, b is the bias term, and x is the input feature vector in terms of the slope angle and the friction coefficients.
To create a probability function, z is plugged into a sigmoid function, as in Equation (14).
σ ( z ) = 1 1 + e z ( 0 , 1 )
It was mapped into the range [0, 1]. These values are almost linear around 0, but outlier values get squashed toward 0 or 1. Here, the ω and b values were determined by solving an optimization problem with a logarithmic likelihood function [34]. Through this process, multiclass classification was achieved to divide the three landing stability conditions. In our work, the logistic regression was conducted with the statistics and machine learning toolbox in MATLAB [35].
In addition, the landing stability was color-coded for the mesh grid with the generated logistic regression model, as shown in Figure 8. The landing stability status can be predicted for any given friction coefficient and slope angle from the results.
From the simulation results on the rigid surface, as seen in Figure 8a,b, there are some deviations of the tip-over angles according to friction angles between 1-2-1 landing and 2-2 landing. This might be due to the complex interaction between the lander and ground as the slope angles and friction coefficients increase. However, the sliding angles were almost unchanged, consistent with those of the landing stability condition. Furthermore, all of the simulation results were quite deviated from Pham’s formula [3], as in Equations (10) and (12).
On the other hand, the prediction results on the soft soil surface are shown in Figure 8c,d. Compared to the prediction results on the rigid ground, lower tip-over angles were obtained due to the soil-digging effect of the footpads, as seen in Figure 9. It increased the friction force between the footpads and soft ground, thus making the lander tip over instead of sliding. In contrast to this phenomenon, the safe landing region was slightly enlarged from 21.5% to 24.3% for 1-2-1 landing and from 22.6% to 23.7% for 2-2 landing because the soft ground absorbs the landing impact loads.

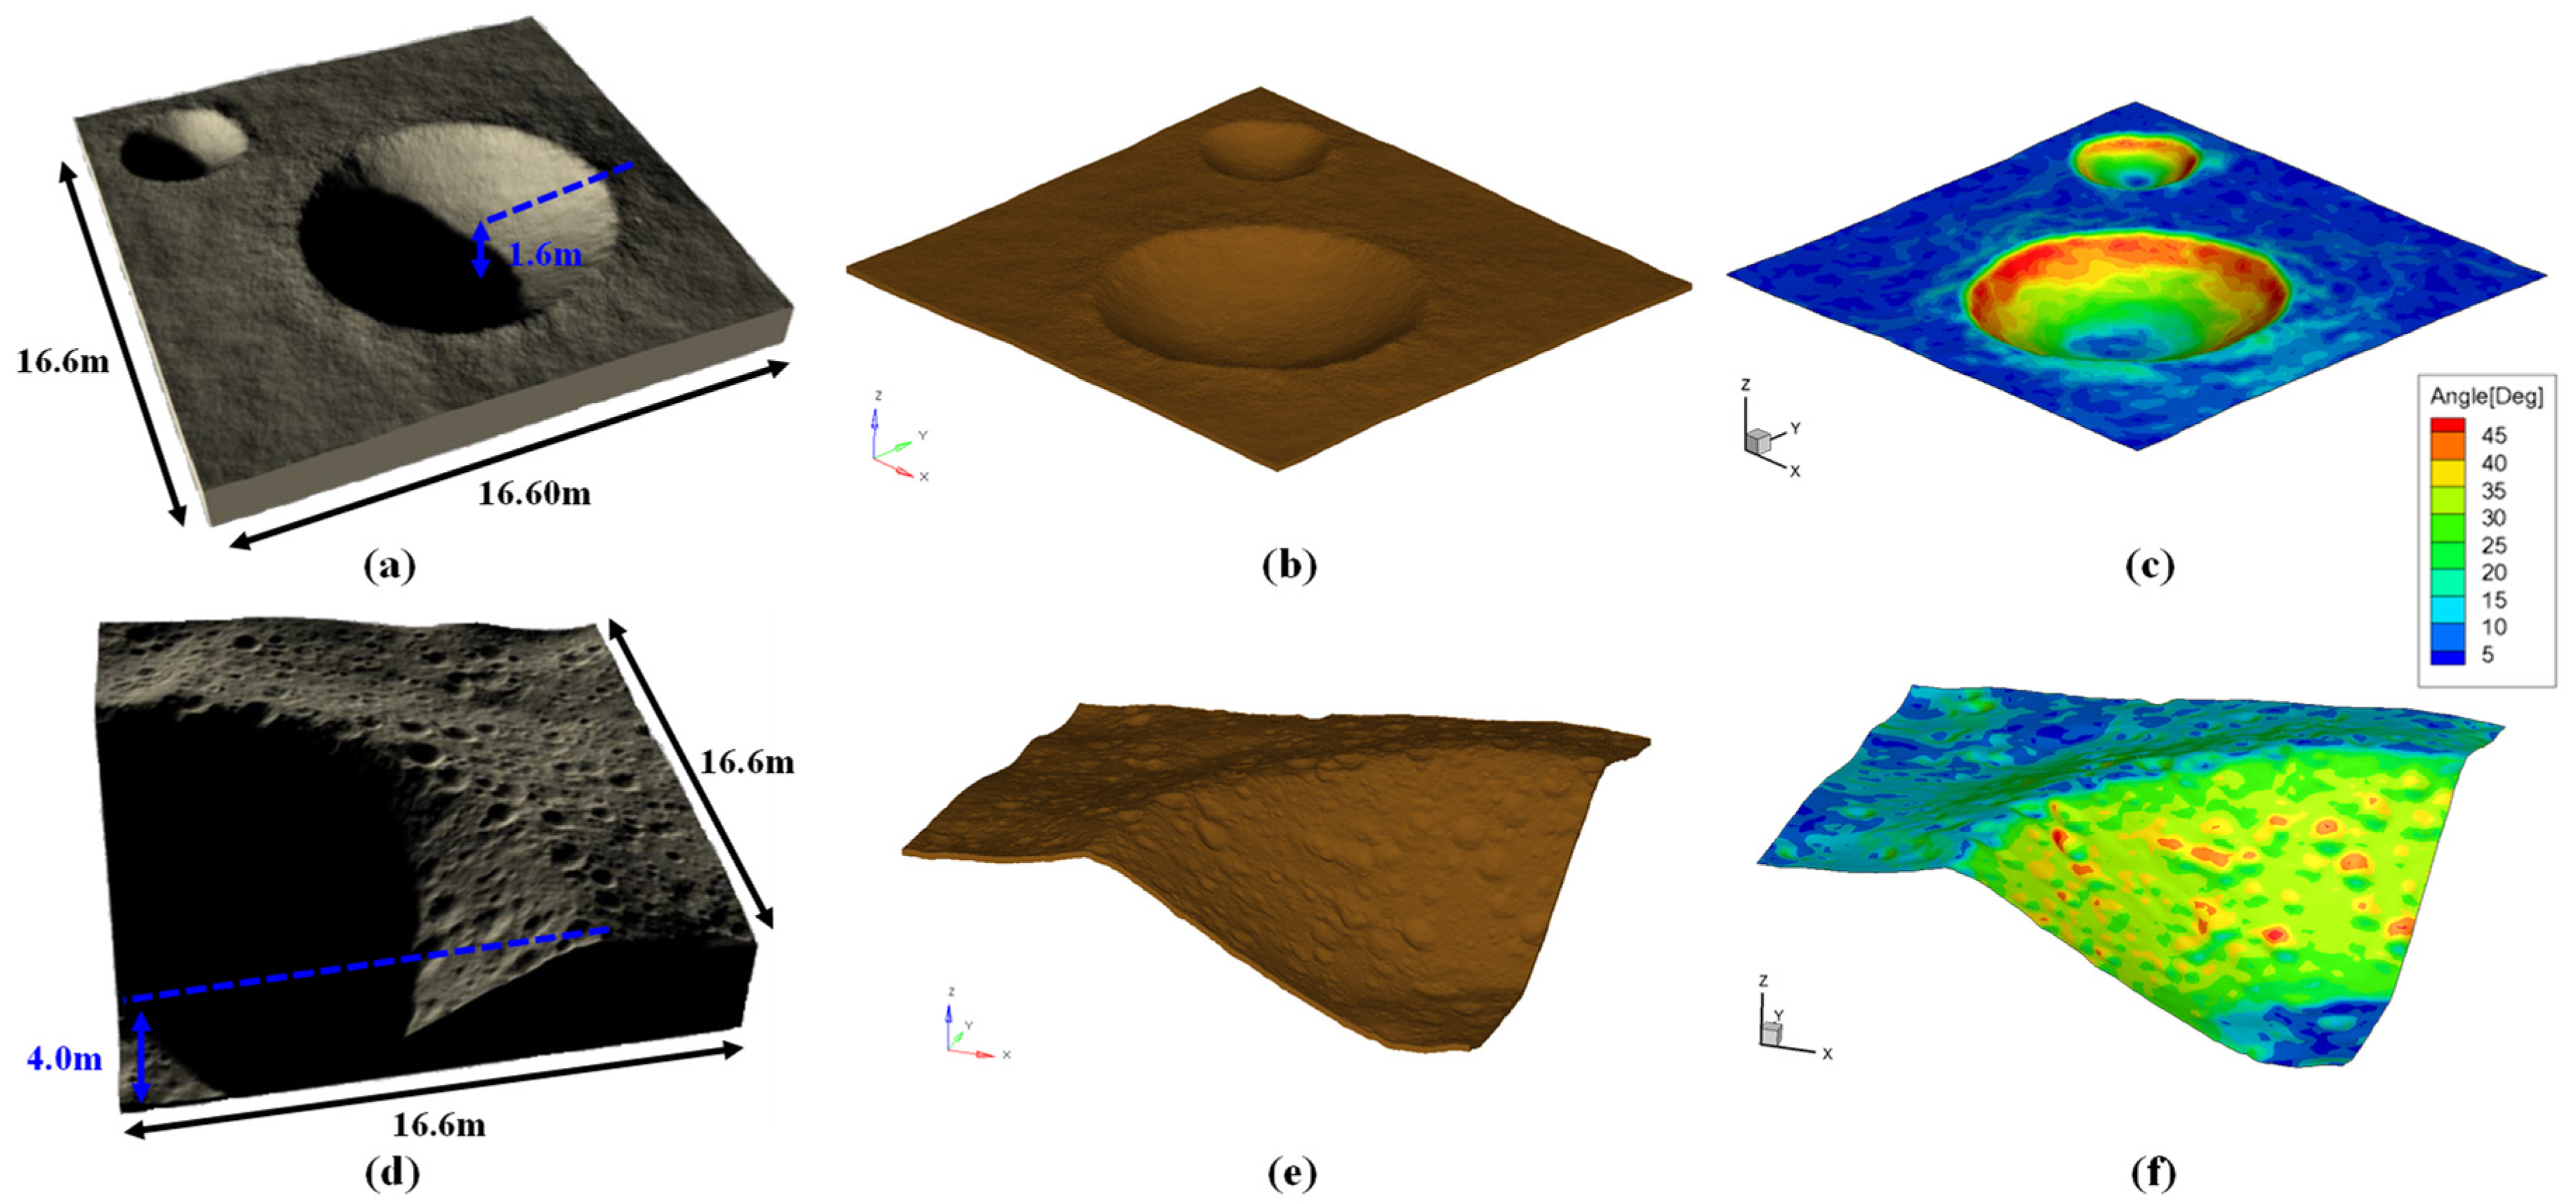
3.3. Preparation of Synthetic Lunar Surface Models

To demonstrate the performance of the prediction methods, two virtual lunar surface models were prepared to predict and validate the landing stability, which was based on a global terrain map of the LRO mission collection with a 100-m coarse resolution. Even though we employed a map with 100-m coarse resolution, we added random artifacts of 0.5-cm class to simulate the actual lunar ground. In other words, the virtual lunar surface was created by adding artificial small and large craters, rocks, and fractal noise to a flat surface to make a realistic lunar surface. We implemented fractal noise using random Gaussian values, which are listed in the reference paper [36,37]. Zone 1 (Figure 10a) had a flat surface, but two craters were constructed to simulate the sea of tranquility on the Moon. The area was 16.6 m × 16.6 m, and the maximum crater depth was 1.580 m. Zone 2 (Figure 10d) was created using 3-D terrain data with some data of the edges of Shackleton craters at the south pole of the Moon with many small and large craters. This is a place of high interest in countries with developed space programs because there is always sunlight capable of generating power, shadows to bury water, and areas for communication with the Earth. The area was 16.6 m × 16.6 m, and the maximum crater depth was 3.894 m.
FE models of two virtual surfaces were created, as shown in Figure 10b–e. Additionally, the root sum square (RSS) of the slope angles of the virtual lunar surface elements was presented, as shown in Figure 10e,f. As a result, the RSS slope angle of zone 1 ranged from 0.4° to 40.4°; those of zone 2 ranged from 1.4° to 48.7°.

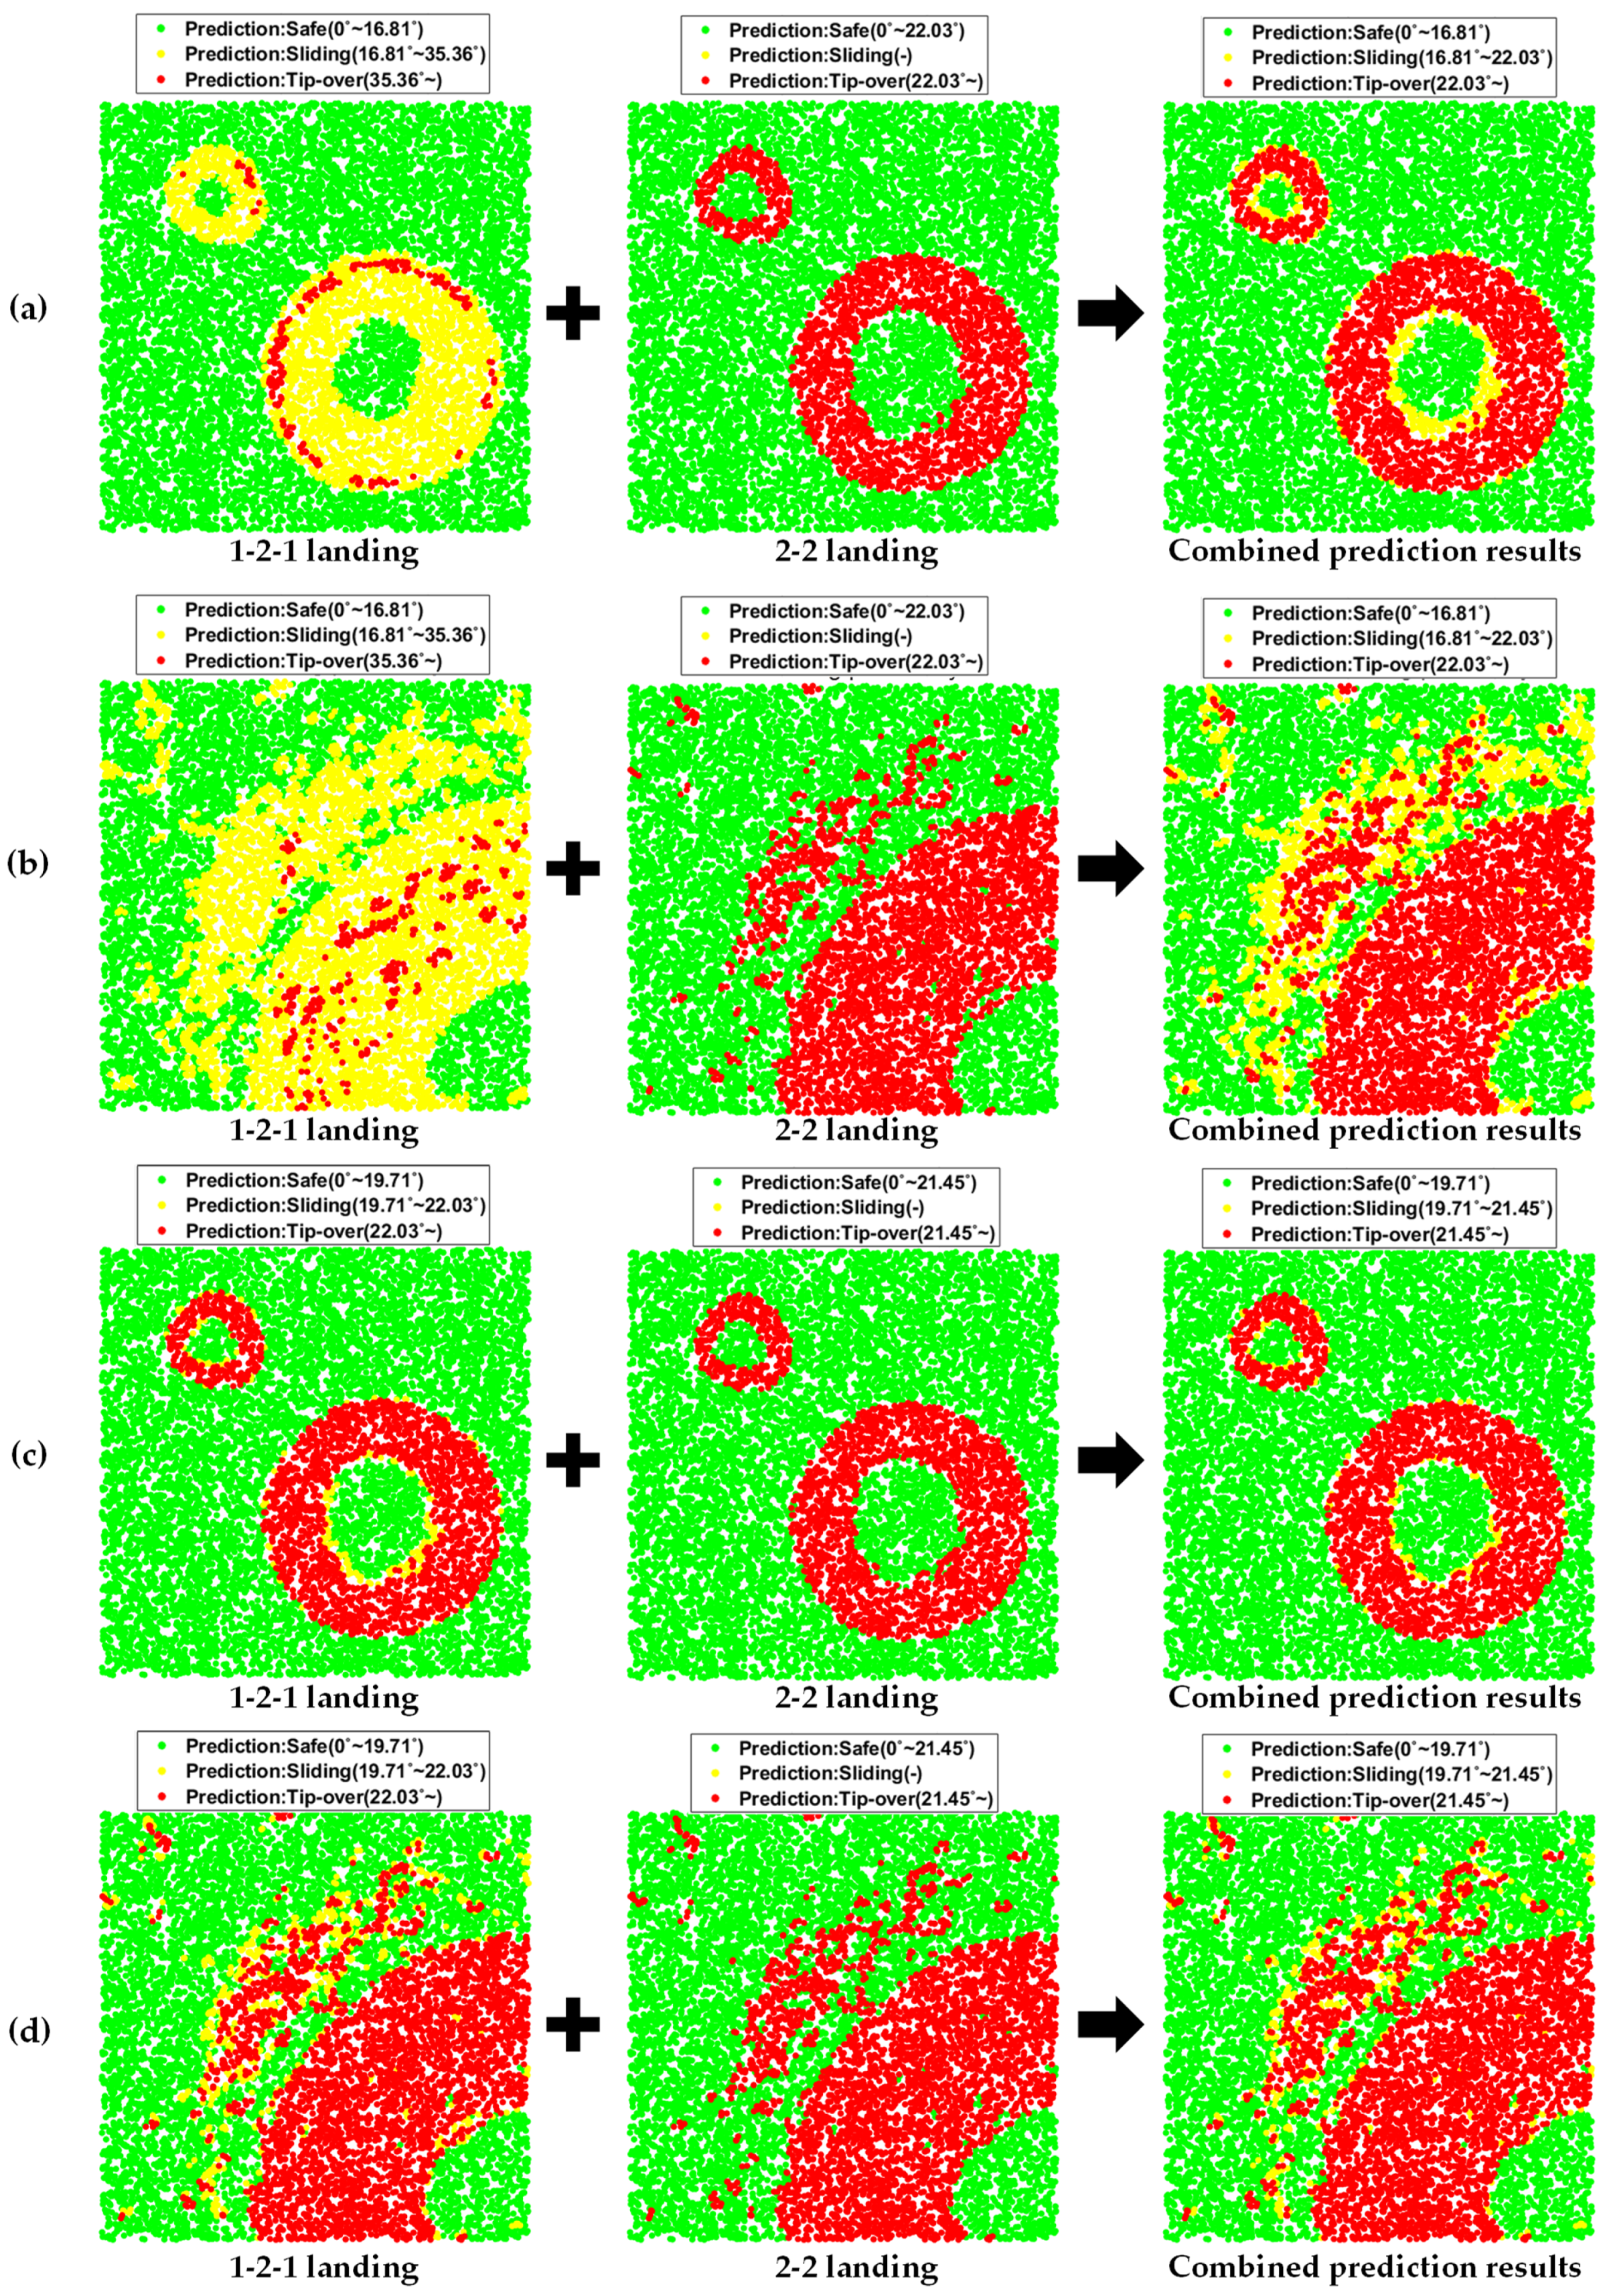
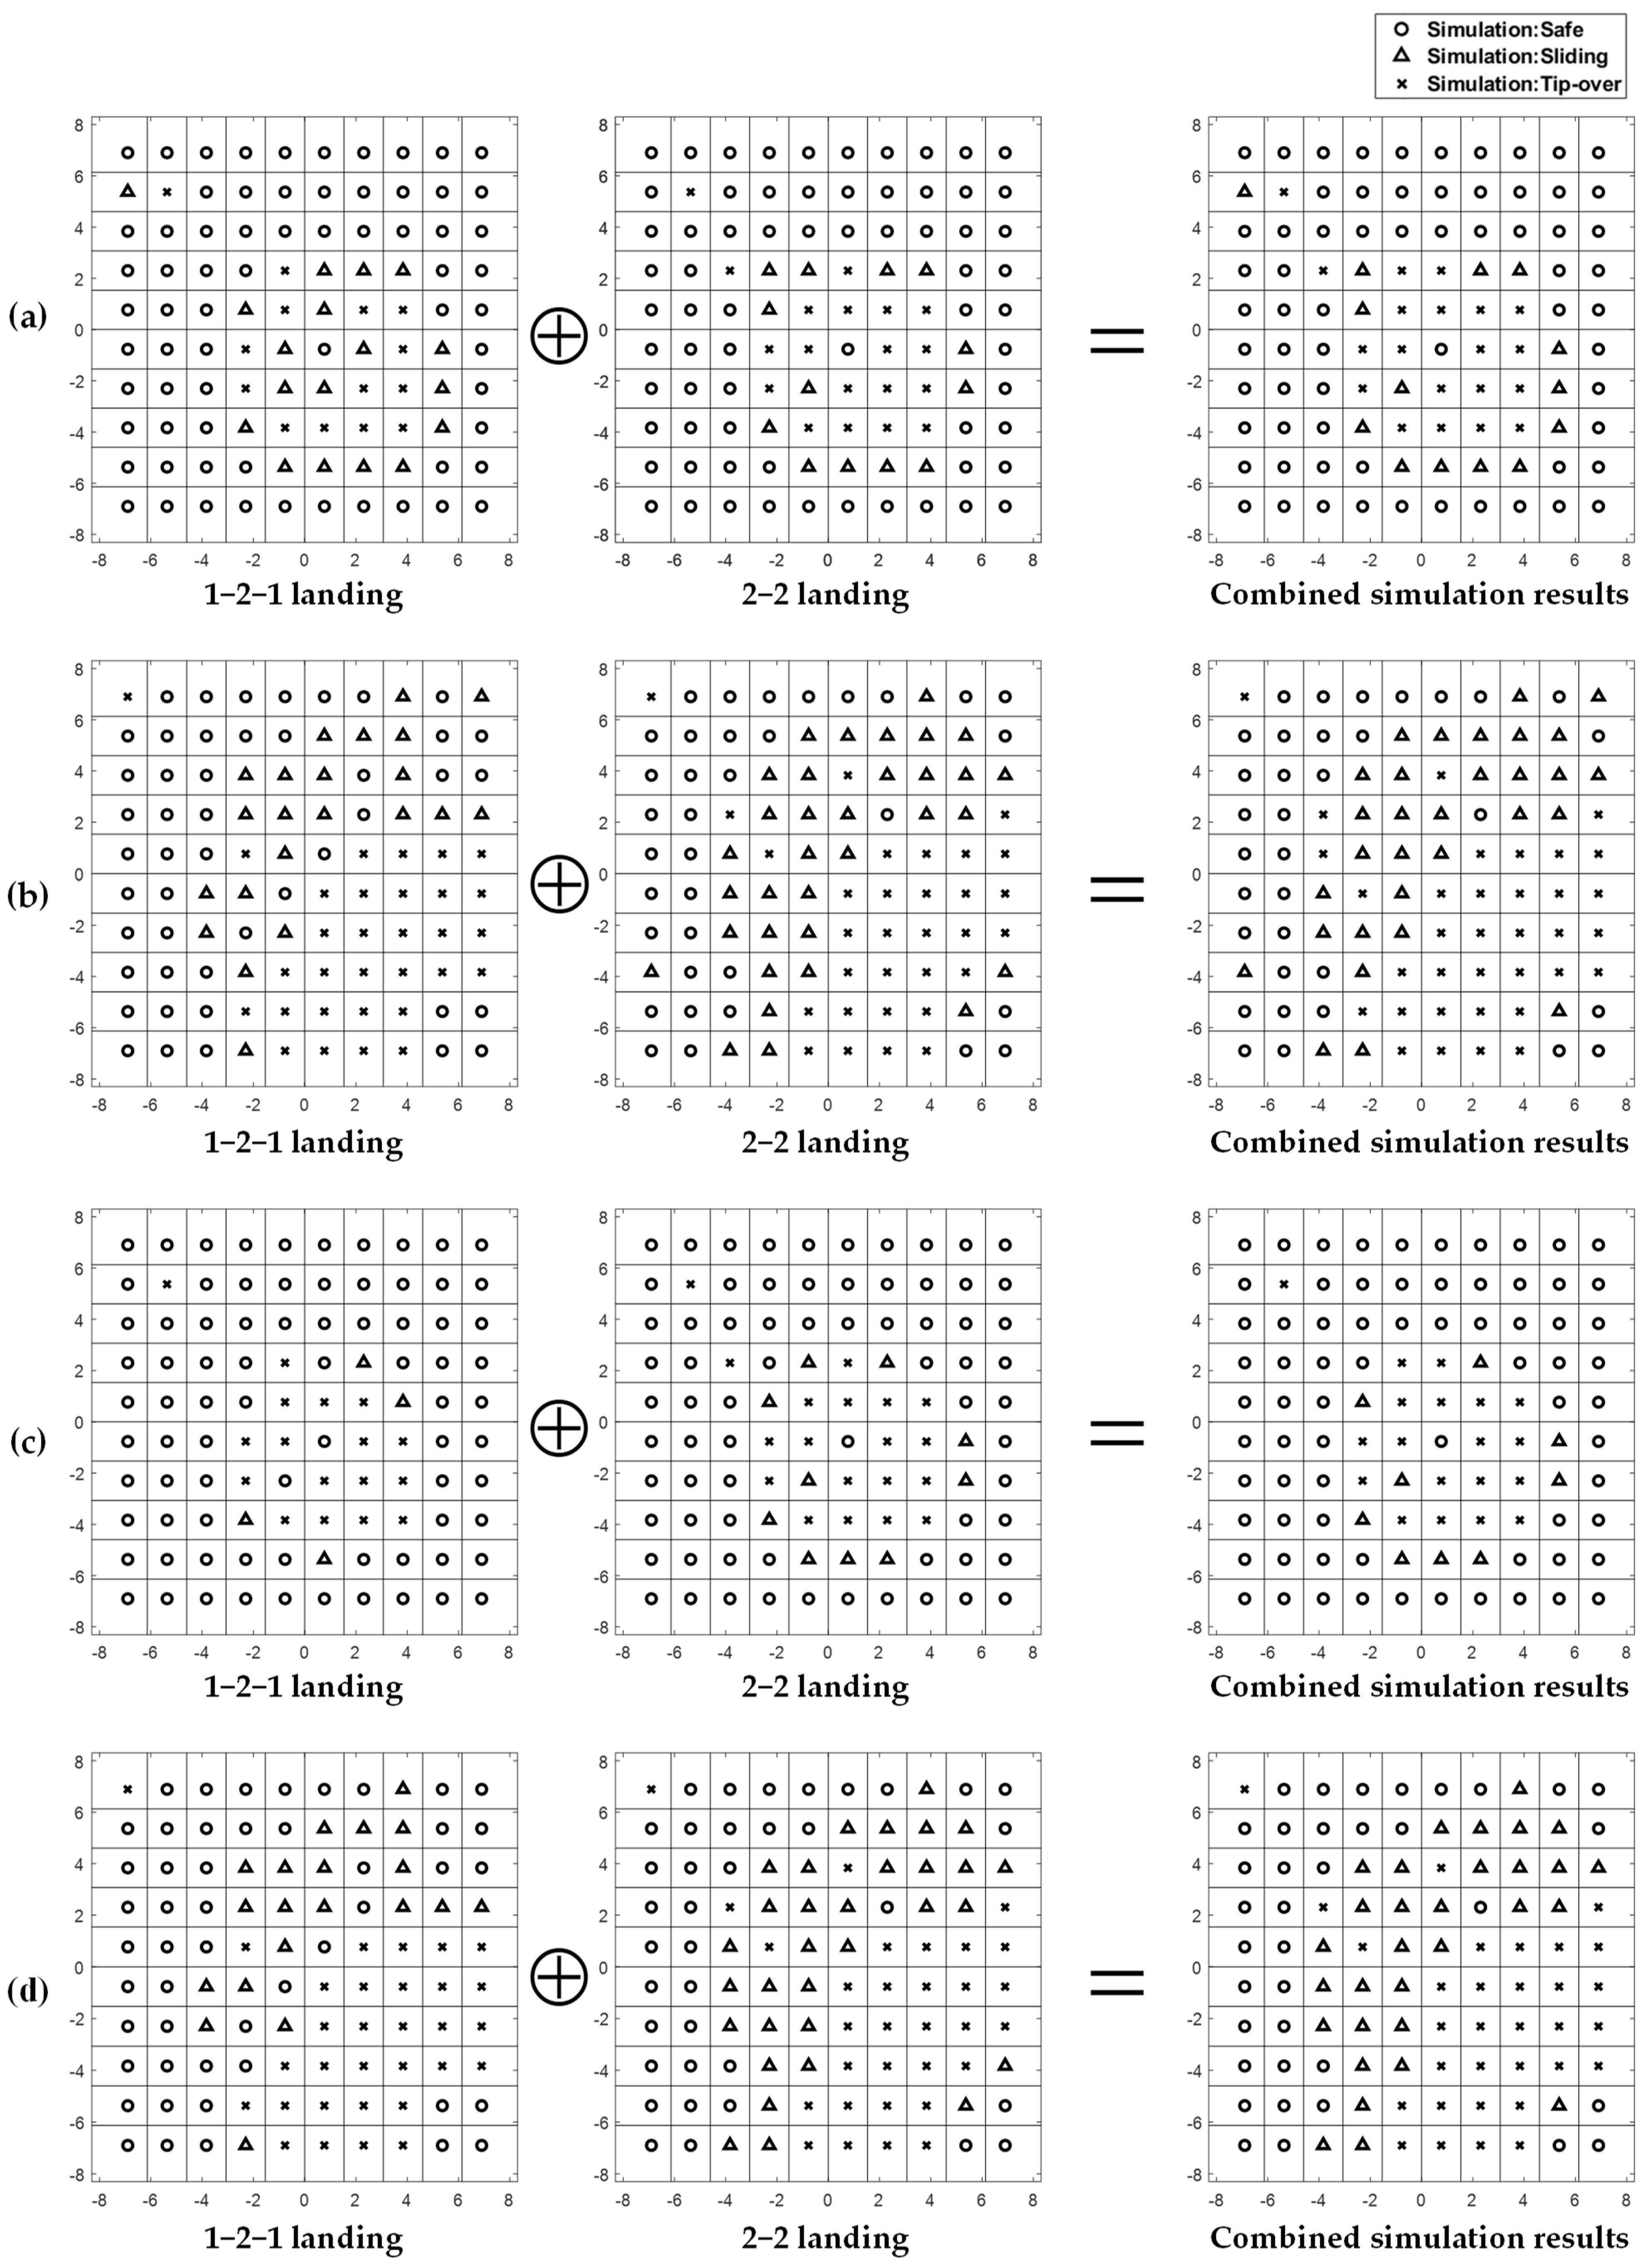
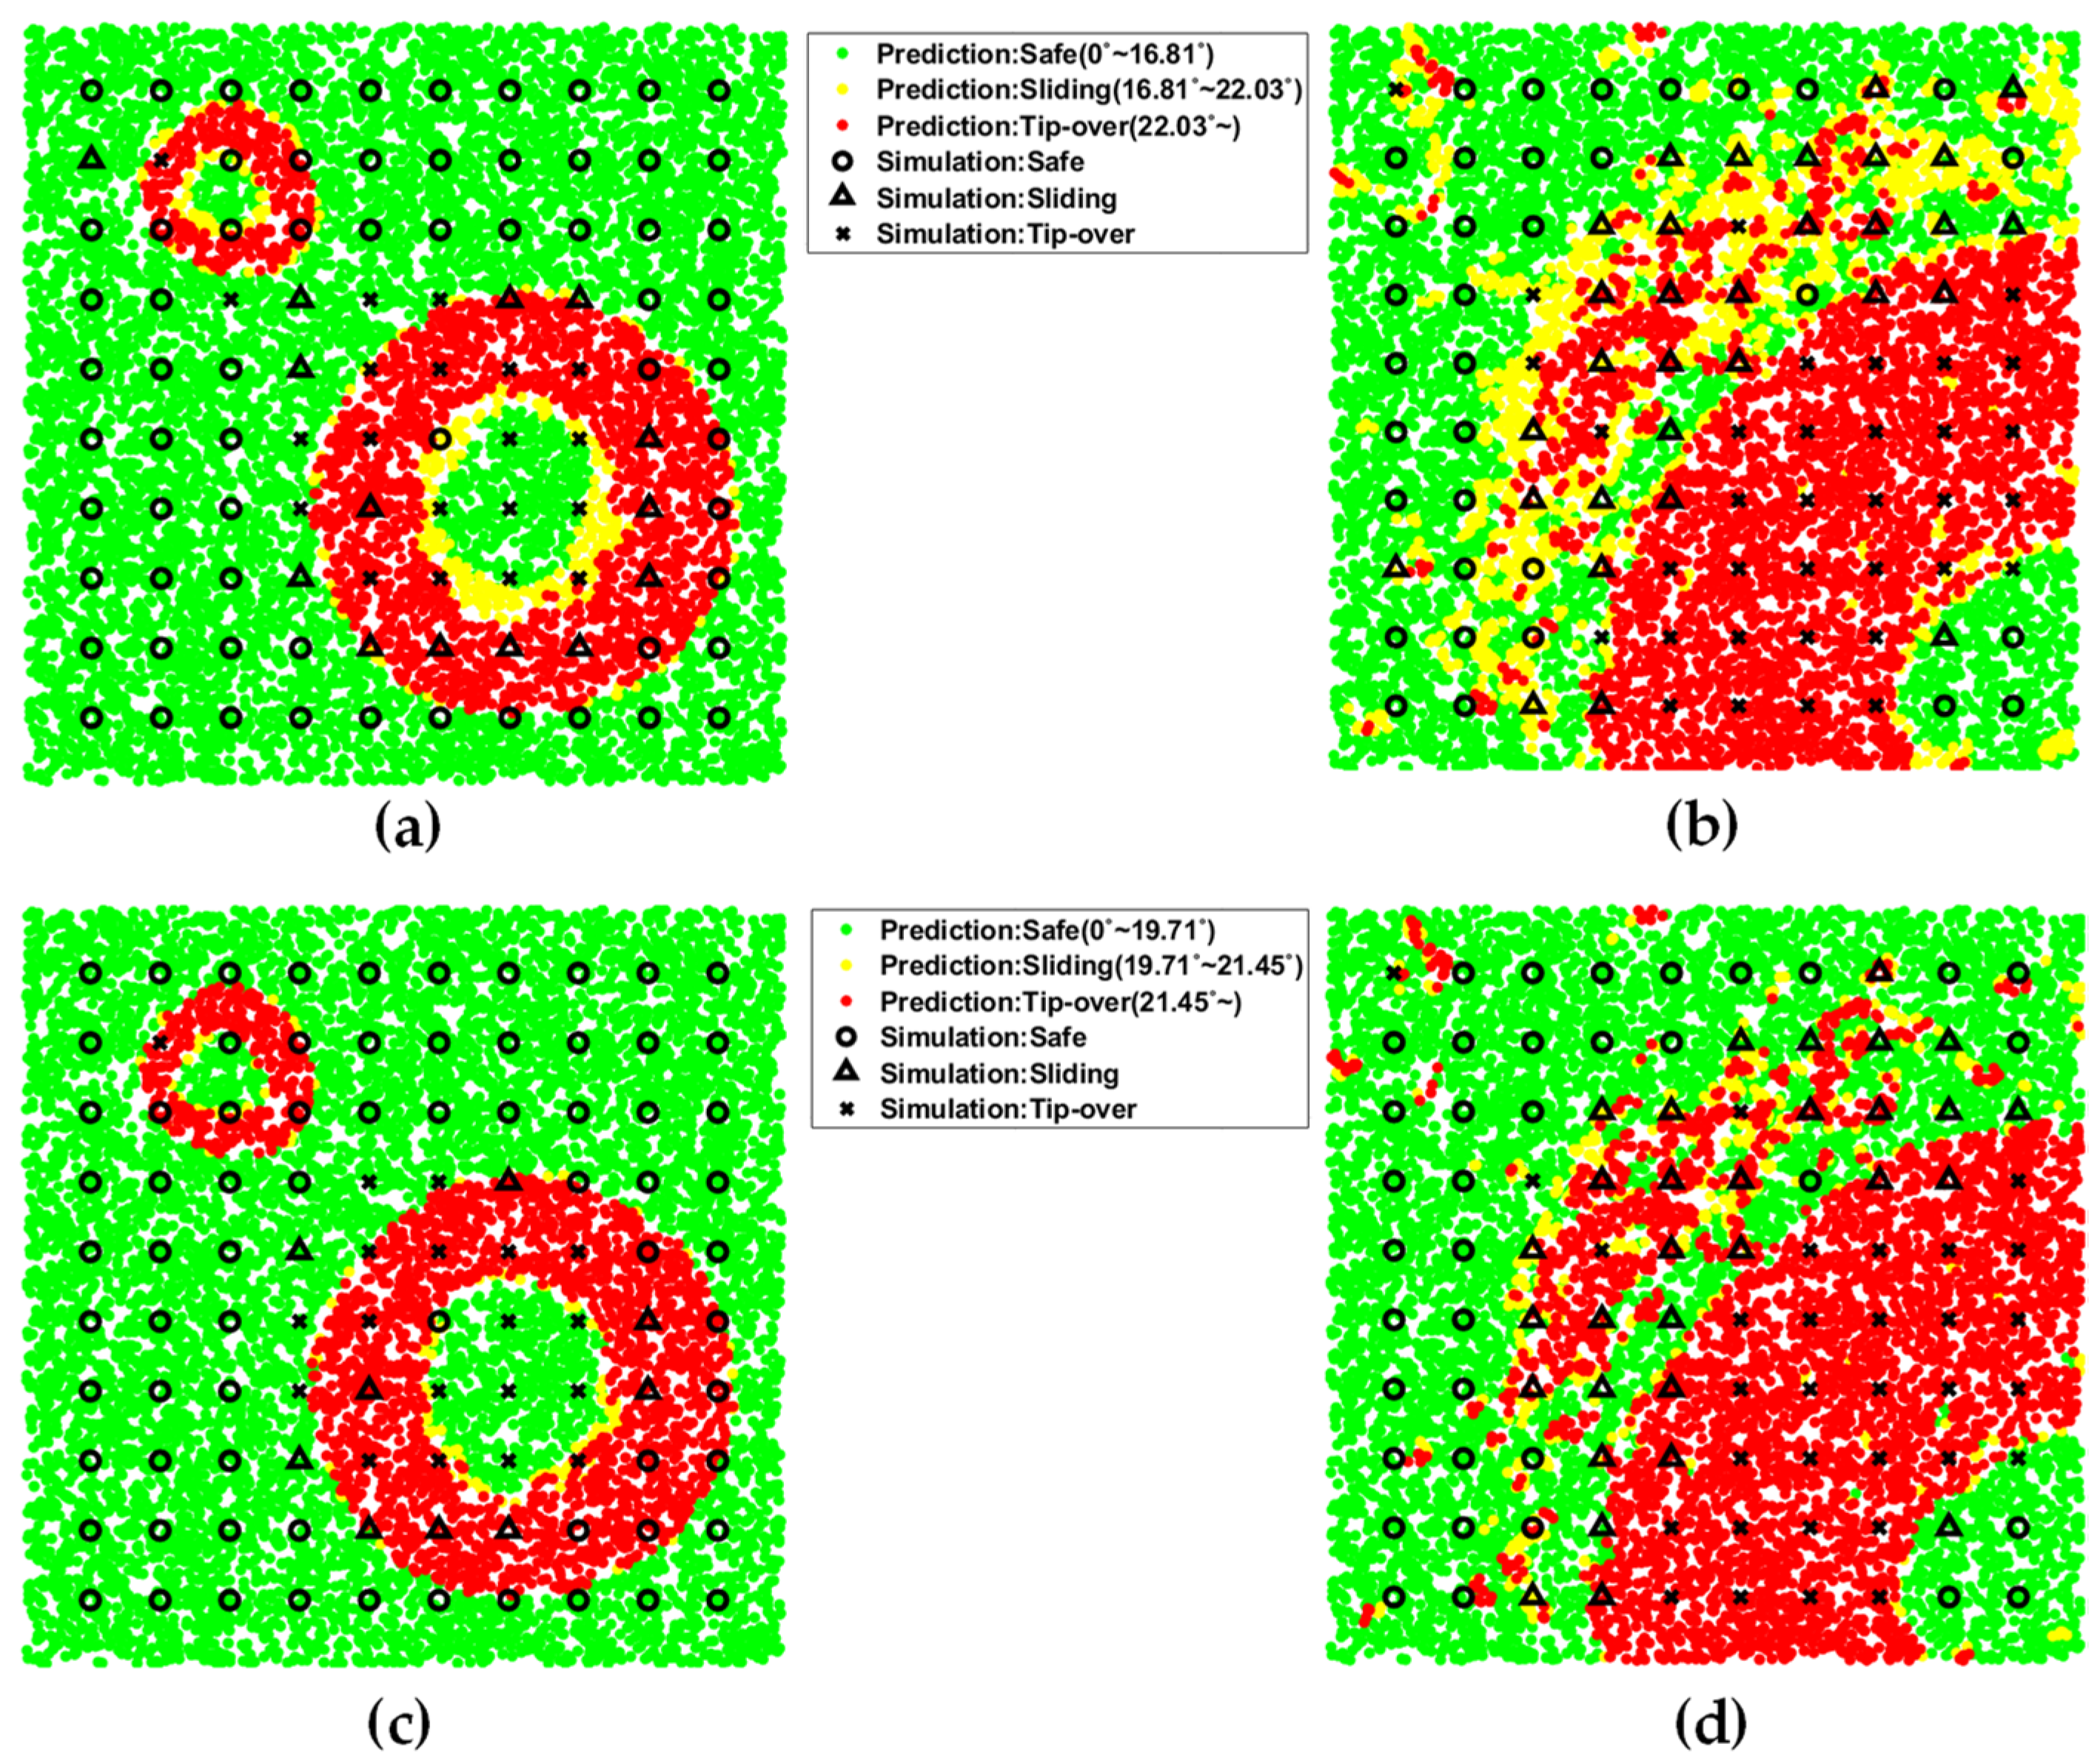
3.4. Prediction and Validation of Landing Stability with Classification Map for Virtual Lunar Surfaces

On the two virtual surfaces, the landing stability was evaluated by Monte Carlo (MC) simulation with 10,000 sample points. For the evaluation of landing stability at arbitrary landing sites, the RSS of the slope angle was taken and was input to the classification map of landing stability, shown in Figure 11. Note that when 10,000 random sample landing sites were given, the computational cost was only 2~3 s with a computer equipped with an Intel(R) Xeon(R) Gold 6248 CPU @ 2.50 GHz and RAM 128 GB.
As seen in Figure 10, green, yellow, and red indicate the prediction results of safe, sliding, and tip-over conditions, respectively. To consider the effects of the landing configurations of the 1-2-1 landing and 2-2 landing simultaneously, we simply merged two prediction results into one by taking the worst case in the prediction results. Thus, the safe landing site occupied 75.6% for zone 1 and 47.3% for zone 2 on the rigid ground. In addition, on the soft ground, the safe landing site occupied 77.9% for zone 1 and 57.2% for zone 2, as shown in Table 3.
We conducted landing dynamics’ simulations with the FE model of the lunar lander again on the virtual lunar surface at 100 landing sites with regular spacing to verify these prediction results. The lander was lifted 2.75 m on the virtual lunar surface with lunar gravity conditions to maintain the vertical touchdown velocity of 3 m/s. A laborious landing simulation for 1-2-1 landing and 2-2 landing was conducted, which required 3 h for one landing simulation. All of the landing simulation results in terms of landing stability are presented in Figure 12. When two simulation results differed, the operator that selected the worst case is defined in Equation (15)
= × = × × = ×
where ‘ ’ indicates safe landing, ‘ ’ indicates sliding, and ‘ × ’ indicates tip-over. The prediction of the landing success rate (P) by the landing dynamics’ simulation was evaluated considering the landing status and the effective area Ai of each landing point, which was obtained by Voronoi tessellation, as shown in Equations (16) and (17).
P = i = 1 n c e l l A i p i A t o t a l
A t o t a l = i = 1 n c e l l A i
where pi is 1 or 0 depending on the landing status.
The comparison results of the prediction and landing dynamics’ simulation are shown in Figure 13 and Figure 14. In the case of zone 1 (see Figure 13a,c and Figure 14a,c), the virtual surface was so smooth that the simulation point in FE simulation could be representative of the neighboring points; thus, the predicted MC simulation results with the classification map of landing stability were quite similar to those of landing dynamics’ simulation on soft and rigid ground conditions. However, in zone 2 (see Figure 13b,d and Figure 14b,d), the virtual surface is locally irregular; hence, a certain simulation point in FE simulation hardly represents the neighboring points, leading to a deviation between prediction and FE simulation. Therefore, we believe that if we can update the inclined flat surface properly for generating a classification map, its prediction results will be enhanced. However, it is another complex issue, thus leaving it for future works.

4. Conclusions

This paper proposed a new method for predicting the landing success rate of a lunar lander with a classification map of landing stability considering the slope angle of the lunar surface as well as soil regolith by landing dynamics’ simulation. To construct a classification map of landing stability, a small, flat lunar surface was considered, and the landing simulation of the lunar lander was conducted according to the slope angle, friction coefficient, and soil/rigid ground. The simulation results were classified into three landing statuses: the safe (=stable), sliding (=unstable), and tip-over (=statically unstable). The results were converted to a classification map of the landing stability with the aid of logistic regression. Finally, the landing stability on virtual lunar surfaces was predicted within a few seconds combined with MC simulation by just referring to the classification map for arbitrary inputs of the friction coefficient, slope angles, and rigid/soft ground. The accuracy of this prediction showed excellent agreement with the landing simulation of lunar landers requiring huge computation costs. In this work, for simplicity, we only considered three variables: the friction coefficient, slope angles, and rigid/soft ground. However, this framework can be extended to more complex situations considering the horizontal and vertical velocity, and initial tilt angle, and so forth, and will be helpful to predict landing stability.

Author Contributions

Investigation, Methodology, Software, Writing—original draft, Y.-B.K.; Writing—review and editing, H.-J.J.; Writing—review and editing, Software, S.-M.P.; Supervision, Conceptualization, Writing—review and editing, J.H.L.; Writing—review and editing, Software, H.-H.L. All authors have read and agreed to the published version of the manuscript.

Funding

This research was supported by the National Research Foundation of Korea (NRF) funded by the Ministry of Science and ICT (NRF-2018M1A3A3A02065478).

Institutional Review Board Statement

Not applicable.

Informed Consent Statement

Not applicable.

Conflicts of Interest

The authors declare no conflict of interest.

References

  1. Voosen, P. NASA to pay private space companies for moon rides. Science 2018, 362, 875–876. [Google Scholar] [CrossRef]
  2. Jia, Y.; Zou, Y.; Ping, J.; Xue, C.; Yan, J.; Ning, Y. The scientific objectives and payloads of Chang’E−4 mission. Planet. Space Sci. 2018, 162, 207–215. [Google Scholar] [CrossRef]
  3. Li, C.; Liu, J.; Ren, X.; Zuo, W.; Tan, X.; Wen, W.; Li, H.; Mu, L.; Su, Y.; Zhang, H. The Chang’e 3 mission overview. Space Sci. Rev. 2015, 190, 85–101. [Google Scholar] [CrossRef]
  4. Li, F.; Ye, M.; Yan, J.; Hao, W.; Barriot, J.-P. A simulation of the Four-way lunar Lander–Orbiter tracking mode for the Chang’E-5 mission. Adv. Space Res. 2016, 57, 2376–2384. [Google Scholar] [CrossRef]
  5. Bhandari, N. Chandrayaan-1: Science goals. J. Earth Syst. Sci. 2005, 114, 701–709. [Google Scholar] [CrossRef] [Green Version]
  6. Sundararajan, V. Overview and technical architecture of India’s Chandrayaan-2 mission to the Moon. In Proceedings of the 2018 AIAA Aerospace Sciences Meeting, Kissimmee, FL, USA, 7–12 January 2018; p. 2178. [Google Scholar]
  7. Epp, C.D.; Smith, T.B. Autonomous precision landing and hazard detection and avoidance technology (ALHAT). In Proceedings of the 2007 IEEE Aerospace Conference, Big Sky, MT, USA, 3–10 March 2007; pp. 1–7. [Google Scholar]
  8. Research on Conceptual Design of Lunar Spacecraft and Core Technologies for Lunar Exploration; KARI: Daejeon, Korea, 2011.
  9. Johnson, A.E.; Klumpp, A.R.; Collier, J.B.; Wolf, A.A. Lidar-based hazard avoidance for safe landing on Mars. J. Guid. Control Dyn. 2002, 25, 1091–1099. [Google Scholar] [CrossRef] [Green Version]
  10. Jung, Y.; Lee, S.; Bang, H. Digital Terrain Map Based Safe Landing Site Selection for Planetary Landing. IEEE Trans. Aerosp. Electron. Syst. 2019, 56, 368–380. [Google Scholar] [CrossRef]
  11. Lee, H.; Choi, H.-L.; Jung, D.; Choi, S. Deep neural network-based landmark selection method for optical navigation on lunar highlands. IEEE Access 2020, 8, 99010–99023. [Google Scholar] [CrossRef]
  12. Mango, D.; Opromolla, R.; Schmitt, C. Hazard detection and landing site selection for planetary exploration using LIDAR. In Proceedings of the 2020 IEEE 7th International Workshop on Metrology for AeroSpace (MetroAeroSpace), Pisa, Italy, 22–24 June 2020; pp. 392–397. [Google Scholar]
  13. Strahan, A.; Johnson, A. Terrain hazard detection and avoidance during the descent and landing phase of the altair mission. In Proceedings of the AIAA Guidance, Navigation, and Control Conference, Toronto, ON, Canada, 2–5 August 2010; p. 7722. [Google Scholar]
  14. Diamoutene, A.; Noureddine, F.; Kamsu-Foguem, B.; Barro, D. Reliability Analysis with Proportional Hazard Model in Aeronautics. Int. J. Aeronaut. Space Sci. 2021, 22, 1222–1234. [Google Scholar] [CrossRef]
  15. Cui, P.; Ge, D.; Gao, A. Optimal landing site selection based on safety index during planetary descent. Acta Astronaut. 2017, 132, 326–336. [Google Scholar] [CrossRef] [Green Version]
  16. Ploen, S.R.; Seraji, H.; Kinney, C.E.; Systems, E. Determination of spacecraft landing footprint for safe planetary landing. IEEE Trans. Aerosp. 2009, 45, 3–16. [Google Scholar] [CrossRef]
  17. Serrano, N.; Seraji, H. Landing site selection using fuzzy rule-based reasoning. In Proceedings of the 2007 IEEE International Conference on Robotics and Automation, Roma, Italy, 10–14 April 2007; pp. 4899–4904. [Google Scholar]
  18. Liu, X.; Li, S.; Jiang, X.; Huang, X. Planetary landing site detection and selection using multilevel optimization strategy. Acta Astronaut. 2019, 163, 272–286. [Google Scholar] [CrossRef]
  19. D’Ambrosio, A.; Carbone, A.; Spiller, D.; Curti, F. PSO-Based Soft Lunar Landing with Hazard Avoidance: Analysis and Experimentation. Aerospace 2021, 8, 195. [Google Scholar] [CrossRef]
  20. Hu, Y.; Xiao, J.; Liu, L.; Zhang, L.; Wang, Y. Detection of Small Impact Craters via Semantic Segmenting Lunar Point Clouds Using Deep Learning Network. Remote Sens. 2021, 13, 1826. [Google Scholar] [CrossRef]
  21. Zang, S.; Mu, L.; Xian, L.; Zhang, W. Semi-Supervised Deep Learning for Lunar Crater Detection Using CE-2 DOM. Remote Sens. 2021, 13, 2819. [Google Scholar] [CrossRef]
  22. Li, Y.; Si, H.; Zong, Y.; Wu, X.; Zhang, P.; Jia, H.; Xu, S.; Tang, D. Application of Neural Network Based on Real-Time Recursive Learning and Kalman Filter in Flight Data Identification. Int. J. Aeronaut. Space Sci. 2021, 22, 1383–1396. [Google Scholar] [CrossRef]
  23. Brémaud, P. Markov Chains: Gibbs Fields, Monte Carlo Simulation, and Queues; Springer Science & Business Media: Berlin/Heidelberg, Germany, 2013; Volume 31. [Google Scholar]
  24. Jeong, H.-J.; Lim, J.H.; Kim, J.-W. Development of a Coarse Lunar Soil Model Using Discrete Element Method. J. Korean Soc. Aeronaut. Space Sci. 2019, 47, 26–34. [Google Scholar]
  25. Oh, M.-H.; Cho, Y.-M.; Lee, H.-J.; Cho, J.-Y.; Hwang, D.-S. Sequential Approximate Optimization of Shock Absorption System for Lunar Lander by using Quadratic Polynomial Regression Meta-model. J. Korean Soc. Aeronaut. Space Sci. 2011, 39, 314–320. [Google Scholar]
  26. Rogers, W.F. Apollo Experience Report: Lunar Module Landing Gear Subsystem; NASA: Washington, DC, USA, 1972.
  27. HexWeb, T. Honeycomb Attributes and Properties; Hexcel Composites: Stamford, CT, USA, 1999. [Google Scholar]
  28. Jeong, H.-J.; Lim, J.H.; Kim, J.-W. Evaluation of Landing Stability of Lunar Lander Considering Various Landing Conditions. J. Korean Soc. Aeronaut. Space Sci. 2018, 46, 124–132. [Google Scholar]
  29. Yang, S.S.; Kang, Y.C.; Son, J.Y.; Oh, M.H.; Kim, J.H.; Cho, J.Y. Optimization of shock absorption system for lunar lander considering the effect of lunar regolith. J. Korean Soc. Aeronaut. Space Sci. 2014, 42, 284–290. [Google Scholar]
  30. Witthoeft, A.; Kim, H. Numerical investigation of earth pressure reduction on buried pipes using EPS geofoam compressible inclusions. Geosynth. Int. 2016, 23, 287–300. [Google Scholar] [CrossRef]
  31. Ramon, R.G.; Boden, R.C.; Mori, O.; Kawaguchi, J.i. Model for Touchdown Dynamics of a Lander on the Solar Power Sail Mission. Master’s Thesis, Luleå University of Technology, Kingston, Jamaica, 2016. [Google Scholar]
  32. Wang, C.; Nie, H.; Chen, J.; Lee, H.P. The design and dynamic analysis of a lunar lander with semi-active control. Acta Astronaut. 2019, 157, 145–156. [Google Scholar] [CrossRef]
  33. Pham, V.L.; Zhao, J.; Goo, N.S.; Lim, J.H.; Hwang, D.-S.; Park, J.S. Landing stability simulation of a 1/6 lunar module with aluminum honeycomb dampers. Int. J. Aeronaut. Space Sci. 2013, 14, 356–368. [Google Scholar] [CrossRef] [Green Version]
  34. Cox, D.R. The regression analysis of binary sequences. J. R. Stat. Soc. Ser. B 1958, 20, 215–232. [Google Scholar] [CrossRef]
  35. Moler, C.; Little, J.; Bangert, S. MATLAB Users’ Guide; University of New Mexico: Albuquerque, NM, USA, 1982. [Google Scholar]
  36. Fisher, Y.; McGuire, M.; Voss, R.F.; Barnsley, M.F.; Devaney, R.L.; Mandelbrot, B.B. The Science of Fractal Images; Springer Science & Business Media: Berlin/Heidelberg, Germany, 2012. [Google Scholar]
  37. Moon, S.; Alexandrov, O.; Wong, U.; Choi, H.-L. Enhancing the Resolution of Digital Elevation Models Using Surface Normal from Planetary Images. Int. J. Aeronaut. Space Sci. 2021, 5, 1243–1250. [Google Scholar] [CrossRef]
Figure 1. Flow chart of landing stability prediction.
Aerospace 08 00380 g001
Figure 2. Lunar lander model: (a) CAD model; (b) FE model.
Aerospace 08 00380 g002
Figure 3. True stress and plastic strain curve of Al-HC.
Aerospace 08 00380 g003
Figure 4. Compressive load and displacement curve of Al-HC.
Aerospace 08 00380 g004
Figure 5. Landing configuration of lunar lander: (a) 1-2-1 landing; (b) 2-2 landing.
Aerospace 08 00380 g005
Figure 6. Classification of stability condition.
Aerospace 08 00380 g006
Figure 7. Parameterization of the lunar lander on the slope of the lunar surface.
Aerospace 08 00380 g007
Figure 8. Classification map of landing stability by logistic regression: (a) 1-2-1 landing on rigid ground; (b) 2-2 landing on rigid ground; (c) 1-2-1 landing on soft ground; (d) 2-2 landing on soft ground.
Aerospace 08 00380 g008
Figure 9. Configuration of ground at touchdown: (a) rigid ground; (b) soft ground (digging effect).
Aerospace 08 00380 g009
Figure 10. Two virtual lunar surfaces: (a) synthetic lunar surfaces of zone 1; (b) FE model of zone 1 (FE mesh not shown); (c) RSS of slope angles of zone 1; (d) synthetic lunar surfaces of zone 2; (e) FE model of zone 2 (FE mesh not shown); (f) RSS of slope angles of zone 2.
Aerospace 08 00380 g010
Figure 11. Combination of two prediction results: (a) zone 1 (rigid ground); (b) zone 2 (rigid ground); (c) zone 1 (soft ground); (d) zone 2 (soft ground).
Aerospace 08 00380 g011
Figure 12. Combination of two landing simulation results: (a) zone 1 (rigid ground); (b) zone 2 (rigid ground); (c) zone 1 (soft ground); (d) zone 2 (soft ground).
Aerospace 08 00380 g012
Figure 13. Prediction of landing success status and validation with FE simulation considering 100 landing sites: (a) zone 1 (rigid ground); (b) zone 2 (rigid ground); (c) zone 1 (soft ground); (d) zone 2 (soft ground).
Aerospace 08 00380 g013
Figure 14. Comparison of landing stability of predictions and landing simulations: (a) zone 1 (rigid ground); (b) zone 2 (rigid ground); (c) zone 1 (soft ground); (d) zone 2 (soft ground).
Aerospace 08 00380 g014
Table 1. Mass properties of the lunar lander.
FE ModelMass [kg]Element TypeNumber of Element
Body35.02Beam (B31)16
Strut (Primary + Secondary)2.96 × 4Truss (T3D2)12
Dummy mass195.08Lumped mass (Mass)1
Footpad0.52 × 4Shell (S3, S4R)328
Total244.02
Table 2. Material properties of Jumunjin sand [30].
ParameterValueRemark
Internal friction angle, ϕd33.6°Results of direct shear test
Cohesion stress [kPa]2.45Results of direct shear test
Relative density, Dr40.67%
Void ratio, e0.751emax = 0.843, emin = 0.617
Shear modulus number, B150For initial loading
Specific gravity, Gs2.64
Dry unit weight [kN/m3], γd14.79
Particle density [kg/m3], ρ1507.64
Depth of soil [m], H0.001~0.04
Poisson’s ratio, v0.39
Initial Young’s modulus [MPa], Ei0.74~4.641 MPa
Table 3. Comparison of landing stability between predictions and landing simulations.
Ground ConditionLanding StatusPrediction
Zone 1Zone 2
Rigid groundSafe76.047.3
Sliding4.016.5
Tip-over20.036.2
Soft groundSafe77.957.2
Sliding1.44.9
Tip-over20.737.9
Computational cost 2 s2 s
Publisher’s Note: MDPI stays neutral with regard to jurisdictional claims in published maps and institutional affiliations.

