Article

A Systematic Methodology for Developing Bowtie in Risk Assessment: Application to Borescope Inspection

Department of Mechanical Engineering, University of Canterbury, Christchurch 8041, New Zealand
*
Authors to whom correspondence should be addressed.
Aerospace 2020, 7(7), 86; https://doi.org/10.3390/aerospace7070086
Submission received: 5 June 2020 / Revised: 23 June 2020 / Accepted: 25 June 2020 / Published: 29 June 2020

Abstract

:
Background—Bowtie analysis is a broadly used tool in risk management to identify root causes and consequences of hazards and show barriers that can prevent or mitigate the events to happen. Limitations of the method are reliance on judgement and an ad hoc development process. Purpose—Systematic approaches are needed to identify threats and consequences, and to ascertain mitigation and prevention barriers. Results—A new conceptual framework is introduced by combining the Bowtie method with the 6M structure of Ishikawa to categorise the threats, consequences and barriers. The method is developed for visual inspection of gas turbine components, for which an example is provided. Originality—Provision of a more systematic methodology has the potential to result in more comprehensive Bowtie risk assessments, with less chance of serious omissions. The method is expected to find application in the broader industry, and to support operators who are non-risk experts but have application-specific knowledge, when performing Bowtie risk assessment.

Graphical Abstract

1. Introduction

The barrier method of risk assessment, more commonly called Bowtie analysis, has been widely adopted in multiple industries. The key concept encapsulated in the method is that of preventative barriers that prevent a hazardous outcome (the ‘top event’) from occurring, and recovery processes that limit the escalation of that event into a larger catastrophe. It is a composition of a fault tree, event tree and barrier concept. The method is especially good at visually representing the event chains from the root cause to the consequence and identifying barriers that are in place, missing or ineffective. Industries in which the Bowtie method is particularly popular include oil and gas [1,2], aviation [3,4,5,6,7], transportation [8,9,10], chemical and process [11,12], mining [2,13], IT [14,15,16], and medical [17,18,19].
In the aviation industry, the safety of the passengers and crew is of utmost priority. To ensure this, maintenance, repair and overhaul (MRO) plays a crucial part. It includes the frequent inspection of the aircraft and its engines after a certain amount of flight hours or cycles, or after an unexpected event occurred, such as a bird strike. In both cases, different means of visual inspection are applied. The aircraft engine is mainly inspected via borescope inspection (BI) and if required via subsequent piece part inspection (PPI). Since the results of such inspections are crucial for the aircraft airworthiness and passenger safety, it is important to understand the inherent risks of the process. A high-level MRO process with the different borescope inspection procedures and related risks is presented in Figure 1.
Previous work showed that Bowtie is a useful tool for such risk assessments, but has some limitations, such as the process of constructing a Bowtie being ad hoc and arbitrary [7]. It highly depends on expert knowledge and the personal preferences and outlook of the analyst [4,20,21,22]. This is problematic because a risk analyst will have different technical and operational insights to a technician. There is a risk of missing important threats, consequences, and barriers. This paper offers a solution by introducing a conceptual framework for a more systematic Bowtie risk assessment for manufacturing and maintenance operations. It achieves this by an integration with the 6M cause-and-effect methodology from Ishikawa [23].

2. Review of Bowtie Development and Structures

2.1. Existing Approaches Constructing a Bowtie Diagram

There are no standards for developing Bowtie diagrams, which results in a variety of different representations and interpretations [22]. However, a generally accepted and widely used approach for constructing a Bowtie diagram is presented in the following. This process aligns with the minimum requirements for a safety management system (SMS) and safety risk assessment introduced by the International Civil Aviation Organization (ICAO) [21]. Since the Bowtie methodology originates from the fault tree and event tree analysis, the diagram could be directly derived from these. In practice, however, the diagram is commonly developed based on brainstorming sessions [24].
A Bowtie diagram may be constructed using a bottom–up or top–down approach [4,25,26]. The latter starts with identification of the hazard, which sets the scope and context of the risk assessment [19,24]. As per the ICAO Safety Management Manual, a hazard is defined as “condition, object, process or activity with the potential of causing harm or damage, including injuries to personnel, damage to equipment, properties or environment, loss of material or reduction in ability to perform a prescribed function” [27].
The next step is defining the top event, which describes the release or loss of control over the hazard. “It has not caused any damage or negative impact yet, but can lead to undesired outcomes if all prevention barriers fail” [7]. The terminology of the ‘top event’ originates form the fault tree analysis. The top event forms the centre of the Bowtie diagram and links the fault tree and event tree. It can be caused by one or multiple threats.
Threats describe causes that can lead to the release of the top event, if all preventative barriers on the threat branch fail. They derive from fault tree analysis (FTA). Once identified, the threats are drawn as branches to the left of the top event.
The release of the hazard can lead to one or multiple consequences. These consequence branches are drawn to the right of the top event. Consequences are potential events or chain of events having a negative impact such as loss of control, damage, or harm. They originate from the event tree analysis (ETA).
Barriers, also referred to as ‘controls’ or ‘layers of protection’, are a means of prevention or mitigation for any negative outcome and can reduce the occurrence likelihood of the latter. Sklet [28] defined safety barriers as “physical and/or non-physical means planned to prevent, control, or mitigate undesired events or accidents”. Depending on their purpose, barriers can be either on the left or on the right side of the Bowtie diagram. Prevention barriers are placed on the threat branches between the causes and the top event. Their function is to prevent the top event and ultimately the release of the hazard [12,18,21]. In contrast, mitigation barriers, also called recovery or protective barriers, aim to reduce the likelihood or minimise the severity of the consequences [29,30]. Thus, these barriers are positioned on the consequence branches between the top even and negative outcomes.
Barriers are not entirely effective or may not be permanently effective. Conditions that have the potential to adversely affect the effectiveness of a barrier are called escalation factors [31]. These factors are depicted as sub-branches from the main barrier path in the Bowtie diagram. To prevent the escalation factors from leading to barrier failure, additional controls, also called escalation factor barriers, are put in place [32]. These are drawn on the sub-branch of the escalation factor they are trying to prevent or mitigate. A generic Bowtie with all its elements is shown in Figure 2 below.
As previously shown, the Bowtie method has elements of fault and event trees, albeit without the quantification or Boolean logic. There have been occasional efforts to re-introduce those features into Bowtie, e.g., in cyber security [14] and the process industry [33]. However, quantification and formalisation of the logic still suffers from the limitation of requiring estimates of probabilities—the provenance of which is as difficult as it originally was for FTA. This is particularly difficult if no historic data is available and must be estimated.

2.2. Categorisations Applied in Bowtie Analysis

Culwick et al. proposed two Bowtie structures [17]. One is a generic structure for general risk assessment, and the other one is an application-specific structure for malignant hyperthermia (MH) susceptibility. The focus for the following discussion is on the generic structure, as this might be transferable to other applications and industries. The generic Bowtie structure introduced by those authors has prompts and examples. For the preventive barriers, these include assessment, optimisation, preparation, planning, checklists, and forcing strategies. Examples given for the barrier controls are monitoring, vigilance, detection, and correction. As a means of recovery, the authors mentioned crisis management, resource and expertise, diagnosis and treatment as possible barrier categories. However, there was no structure or prompts provided for threats and consequences. It was proposed to organise the consequences from the top of the diagram to the bottom based on their severity reaching from ‘no harm’ to ‘severe harm’ respectively. The authors recommended that the Bowtie shall be “constructed by a group of individuals who have an interest in managing the particular hazard” [17]. This raises the question of whether or not an interest in the hazard is sufficient for creating a valid and comprehensive Bowtie risk assessment or if it would be better to have an expert or a group of experts, ideally with an experienced Bowtie facilitator, performing the risk assessment as suggested by CAA and ASEMS [4,22]. In addition to the generic Bowtie elements, the authors recommended consideration of factors influencing the efficacy of controls, namely patient factors, procedural factors, system factors, human factors, and chance factors. These factors are only suitable for the medical industry and were only conditionally transferable to other industries.
Hamzah developed a Bowtie based on a risk assessment matrix [34]. The matrix categorised the consequences into four categories, namely people, assets, environment, and reputation. These categories were used to evaluate the severity of consequences and, subsequently, to determine the risk of the hazard. However, this structure was not used for the development of the Bowtie diagram, but for the severity assessment and quantification.
Another approach was taken by Maragakis et al. [21], who did not provide a categorisation, but a hazard checklist deriving from past events and experience to help quickly identifying hazards. This list grouped hazards into the following categories: natural, technical, economical, ergonomic, and organisational hazards.
CAA UK used the ‘Significant Seven’ safety scenarios to categorise different top events and created a Bowtie for each. However, there was no categorisation suggested for threats, consequences and barriers [4,25].
As part of the “Basic Aviation Risk Standard (BARS) Program”, the Flight Safety Foundation (FSF) performed a Bowtie risk assessment on offshore helicopter operation [35]. Similar to the Significant Seven by CAA UK, the threats were divided into eleven groups, namely: heliport and helideck obstacles, fuel exhaustion, fuel contamination, collision on ground, unsafe ground handling, controlled flight into terrain/water, aircraft technical failure, weather, loss of control, mid-air collision, and wrong deck landing. Furthermore, barriers were divided in organisational, flight operations, and airworthiness controls. This categorisation is particularly detailed and application specific, which makes the transferability to other industries somewhat difficult.
Barriers have been categorised based on their function, characteristics, and origins. Kang et al. [36] distinguished between physical and non-physical barriers and subsequently divided each group into three main categories, based on the work of Neogy [37] and Chevreau [38]. These include technological barriers, organisational barriers, and personnel barriers. Technological barriers can be further divided [18,29,32]. The division of risks into only two categories—‘physical’ and ‘non-physical’, or ‘human behaviour’ and ‘technology related’—is insufficient for a broader categorisation as attempted here. Furthermore, an active and passive classification works well for barriers, but not for threats and consequences.

2.3. General Categorisations and Classifications in Risk Management

No systematic methodology is evident in the Bowtie literature, but there are some in the wider field of risk management. Some originate from the risk breakdown structure (RBS) focusing on project risks, while others derive from root cause analysis (RCA), a tool commonly used after a major, single-event problem occurred [39]. Still others focus on human factors, i.e., risks and conditions that cause humans to err.

2.3.1. Risk Categorisations

The most high-level and generally applicable categorisation of risks in any type of project, business and industry is based on the risk breakdown structure, a risk management tool, which has been broadly applied [40,41,42]. Hall and Hullet [40] proposed three ‘universal risk areas’, namely management risk, external risk, and technological risk, which differ from the four risk types proposed by Tanim et al. [43] comprising strategic, financial, operational, and compliance risks. These may be suitable for threats and particularly for consequences, but not so much for barriers.
The project management perspective of Lester [44] provides four main risk categories, namely organisational, environmental, technical, and financial, with further sub categories of technical, economic, environmental, operational, legal political, cultural, financial, commercial, resource, and security risks. It is one of the more detailed frameworks available.
The risk categorisation scheme of Chung and Zhu [45] includes operational, economic and environmental, strategic, technological and legal risks. This scheme was used to categorise company risks from news articles using a machine-learning algorithm. However, the categorisation emphasises management risks, less so the human involvement.
Industry specific approaches exist, such as a categorisation of airport construction risks into technical, logistical, economical, financial, legal, construction, commercial, social, natural, and legal [46]. In the pharmaceutical and health care industry, risks have been divided into facility, personnel, process, system, and product risks [47]. While these categories may well fit within the relevant industry, they may be less suitable for categorising risks in other areas—similar to the categorisation used in health care (see Section 2.2).
The PEST, also called the STEP framework, is a tool used in market research [48]. The acronym stands for Sociological, Technological, Economic and Political. This categorisation was later enhanced to PESTLE by adding a legal and environmental component. This framework is more common in strategic management or marketing rather than for risk assessment (for an exception, see [49]). This is because the PEST(LE) analysis helps to identify factors in the market that affect the development and viability of an organisation. However, these factors do not necessarily have to be risks or threats, but can also be opportunities. It is evident that many of the above categorisations have strong similarities with the PESTLE framework.

2.3.2. Threat and Root Cause Categorisations

In computer systems, threat can be classified into physical damage, technical failure, natural event, compromise of information, compromise of functions, and loss of essential service [50]. Jouini et al. [51] introduced another classification for threats in information systems. The two main categories are external and internal threats, with both having sub-categories of human, environmental and technological threats.
In Bowtie, the term threat is used to describe root causes. Taproot is a root cause tree dictionary that classifies causes into eight categories, namely equipment difficulty, management system, quality control, procedures, human engineering, communications, training, and work direction [52]. The International Air Transport Association (IATA) uses five categories for the accident root cause classification system including human, organisational, environmental, technical, and insufficient data [53]. This approach covers human factors only in the form of human engineering. Furthermore, equipment difficulty and insufficient data work well for categorising threats or accidents, for which the categorisation from Taproot and IATA was developed. However, it may not work for barriers, since they should prevent or mitigate any negative outcome.
The most common categorisation for root causes originates from the cause and effect diagram, also referred to as ‘Ishikawa’ or fishbone diagram [23,47]. To help identifying the root causes in a manufacturing environment and to break them down, Ishikawa identified six categories starting with the letter M, hence the 6M method. The Ms stand for man (or mind power), machinery, materials, methods, and Mother Nature (or milieu) [47]. Variations exist on the basic idea, using different terminologies [54]. For instance, some used the term ‘environment’ instead of ‘Mother Nature’ or ‘equipment’ instead of ‘machinery’, hence leading to the 5M and 1E categorization [55,56], while others replaced the term ‘manpower’ with ‘people’ resulting in the 5M and 1P approach [57]. Some extended the categorisation to eight Ms by adding ‘management’, ‘money’, and ‘maintenance’ [58]. This categorisation originates from manufacturing and is therefore somewhat limited to its industry. However, the categories can be adjusted as needed.
Different categorisations have been developed to make the cause and effect diagram applicable to other industries. The 8P method (procedures, product, price, people, place, processes, policies, and promotion), for instance, is a common cause categorisation used in the marketing sector, while the 4S (surroundings, suppliers, systems, and skills) is well established in the service sector [55,56,59]. Both imply that a contextualisation may be required to apply a categorisation broadly.

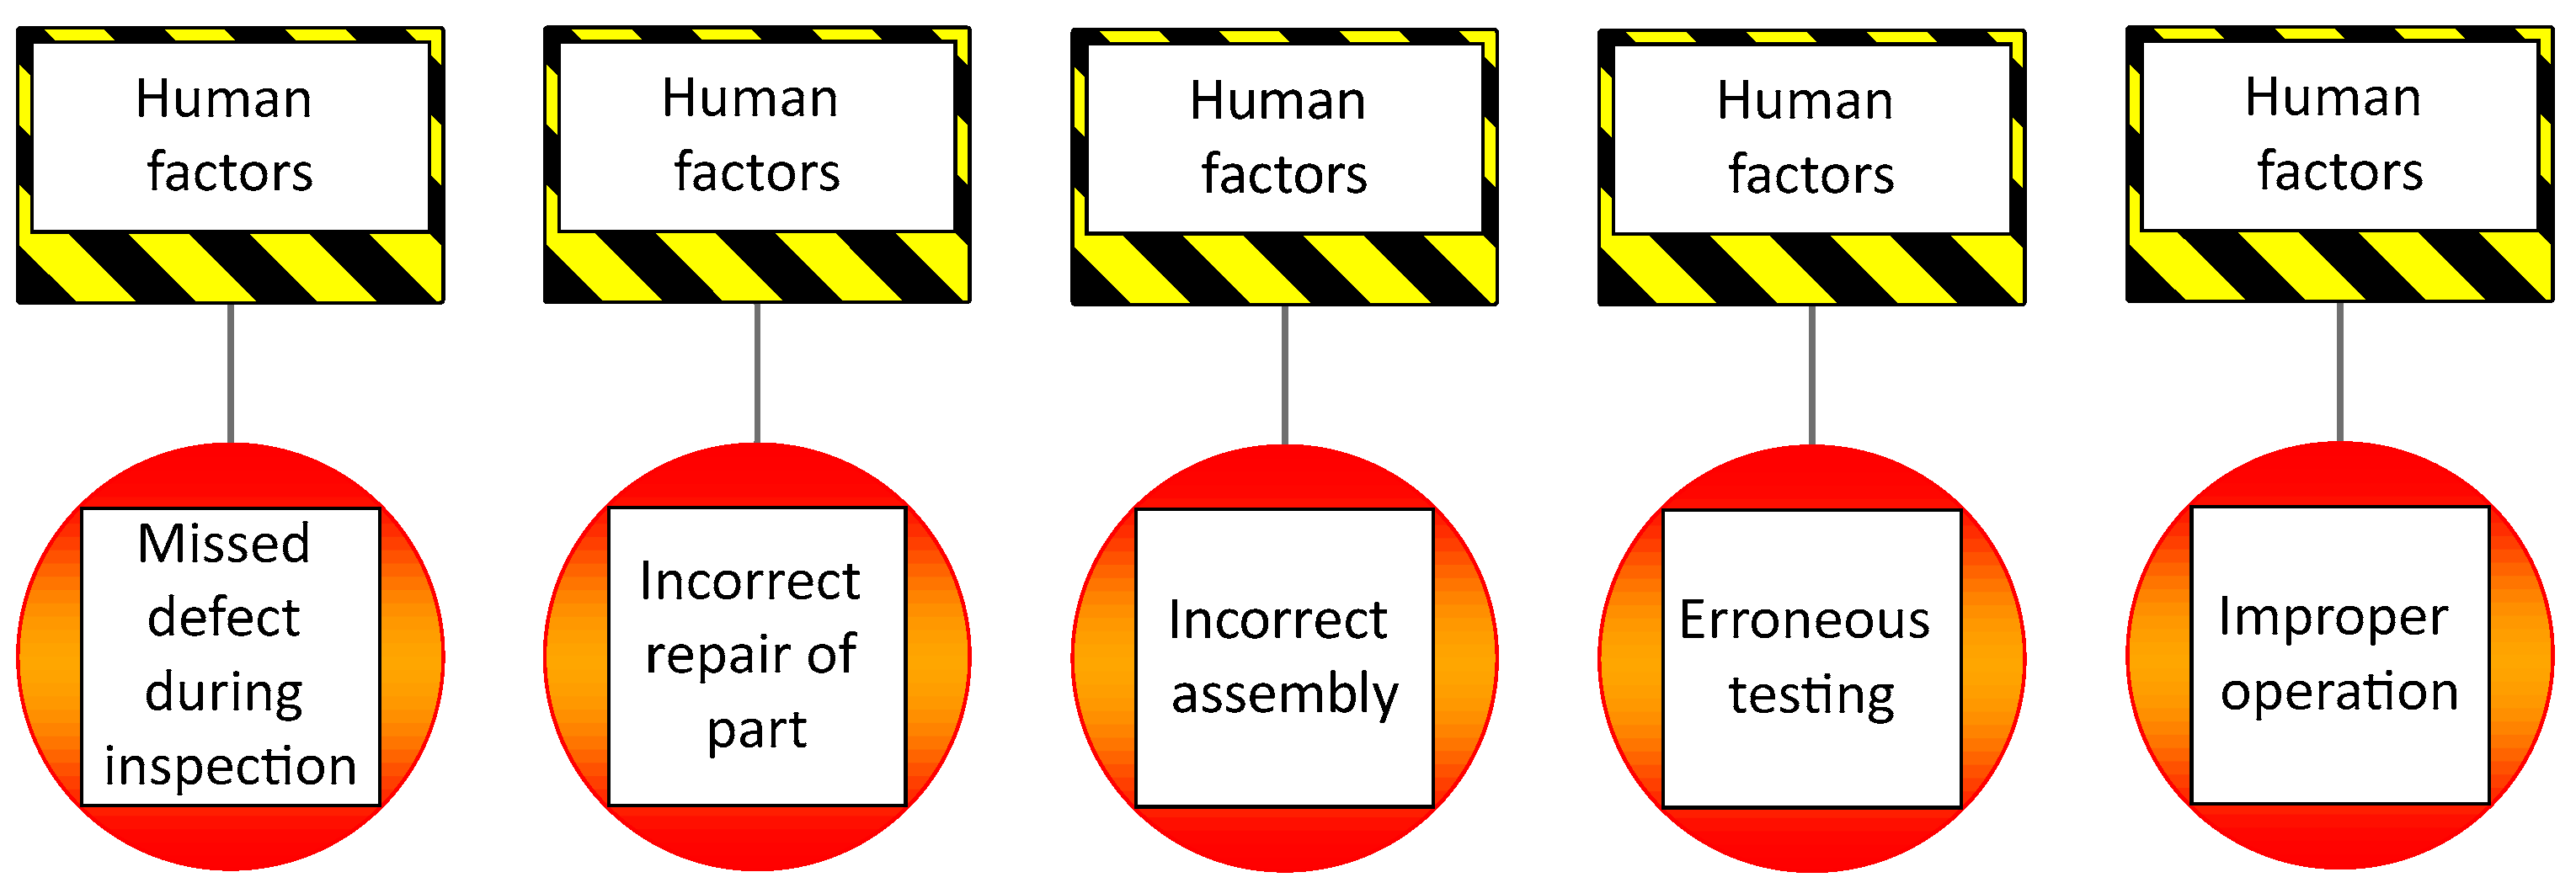
2.3.3. Human Factors Categorisations

In aviation maintenance and inspection environments, errors can be categorised by their root causes including task, environmental, individual, organisational, and social factors [60]. However, most emphasis is on human factors, since it is generally accepted that humans have caused or contributed significantly to aviation incidents and accidents [61,62]. The two most common categorisations for human factors are the SHEL and PEAR models.
The SHEL model is a conceptual framework proposed by Edwards [63] to classify accident causes in aviation. The four categories are Software, Hardware, Environment, and Liveware. This concept was modified later by Hawkins, who added another ‘liveware’ component and presented the SHELL model [64,65]. Most recently, organisational factors were introduced by Chang and Wang making it the SHELLO model [66].
For the field of aviation maintenance, Johnson and Maddox developed the PEAR model, an acronym for People, Environment, Actions, and Resources [67]. It helps in categorising human factors and was first applied by Lufthansa.
Both PEAR and SHELL were developed for human risk factors in aviation. The SHELL model only focuses on interfaces within Human Factors (software–human, hardware–human, environment–human, and human–human) [27]. However, it does not include interfaces between the other factors (hardware-software, hardware-environment, and software-environment). Since we were looking for a categorisation covering risk factors and not only the interfaces between them, the SHELL model was not suitable. Similar, the PEAR model focused only on Human Factors and would not provide the universality needed for our purpose.

2.4. Limitation in the Methods for Bowtie Construction

While several approaches exist for Bowtie construction, there is no standard [22,33]. The two main issues are (i) the lack of a standard methodology for systematically identifying Bowtie elements, and (ii) the subjectivity of the process. The latter relates to the subjectivity of the brainstorming method. These issues are interrelated.
Existing methods focus on the diagram construction and bringing the elements into the characteristic bowtie shape, but not on the identification of these elements, i.e., threats, consequences and barriers. This identification is ad hoc. There is a need for a structured methodology to identify threats and consequences and to ascertain barriers without missing important ones.
There is also inconsistency regarding the hierarchy of the hazard and top event. Although it is commonly accepted that the Bowtie construction starts with identifying the hazard, followed by the top event, the hierarchy of these is inconsistent. Some risk assessments followed the top–down approach, whereby multiple Bowties with different top events for the same ‘umbrella’ hazard were developed, such as the Significant Seven Bowties by CAA UK [4,25]. Others followed the reverse approach and constructed several Bowties with different hazards for the same top event [26]. Still others analysed only one hazard with its top event, whereby the relationship was not problematic [26]. It was found that often the top event is a subjective and pragmatic choice of the risk analyst and that it is rephrased once the Bowtie diagram is completed [19]. This contributes to the inconsistency in the hazard and top event hierarchy.
Most Bowtie diagrams are developed using brainstorming sessions and hence are dependent on the expertise and personal view of the participants and the skills of the facilitator. Although brainstorming encourages creative unbounded thinking, it can be time consuming and sometimes chaotic, which results in an unstructured and incomprehensive approach, and is always subjective. Moreover, the sessions are prone to group dynamics, which can influence the assessment results and may lead to missing important risks [21].

3. Method

3.1. Purpose

The purpose of this research was to develop a systematic methodology for conducting Bowtie risk assessments. The desired attribute of such a methodology is to provide a structure to guide the analyst when identifying the barriers, so that no important threats, consequences or barriers are missed. The area under examination is maintenance engineering, and within that the aviation MRO and inspection operations, specifically visual borescope inspection of aero engine parts. We were especially interested in the risk of missing a defect on a turbine blade.

3.2. Approach

This work is of a theory-building nature. First, we reviewed the literature for candidate approaches to develop and construct a Bowtie diagram. Further, we reviewed different existing systems in the safety and broader risk management field that help identifying and categorising risks, hazards, threats, and root causes. These include general risk approaches, human factors models, and cause and effect classifications. From these we selected one approach, namely 6M, as the basis for the new Bowtie framework.
Next, we resolved the ambiguity in the hazard–top event coupling, and applied the 6M to the Bowtie process. In doing so, we contextualised it to the area under examination. We also addressed the structure of the escalation factors. We identified that strings of escalation factors were often common to different places in the Bowtie, and we proposed making these into modules for better representation.
The method was then applied to the specific case of visual borescope inspection of gas turbine components in an MRO environment. A total of 15 aircraft maintenance inspectors from the industry partner participated. The experience profiles were: five inspectors with more than twenty years of experience in visual inspection, seven inspectors who had worked for over ten years in the field, and three operators with up to ten years of experience. Their certifications included borescope operation and non-destructive testing (NDT). Each was observed independently for approximately 30 min during a real inspection process, and they were asked to articulate the risks and threats of the process, and what barriers were or could be in place to prevent negative outcomes. The specific instructions were:
  • ‘Please describe the inspection process you are performing and the challenges of each step.’
  • ‘What factors influence the inspection process and why are they safety critical?’
  • ‘What are the risks inherent in each process step?’
  • ‘What means of prevention or mitigation are or could be in place to prevent missing a defect during inspection?’
All the operators were familiar with Failure Mode and Effects Analysis (FMEA), and some were also familiar with the Bowtie methodology. Their verbal comments and insights were noted, and subsequently used by the primary author to construct the Bowtie diagrams shown in this paper. Ethics approval was obtained from the University of Canterbury (HEC 2020/08/LR-PS) and permission from the industry partner. The results and limitations of the new approach were then validated by discussion with the two highest certified borescope inspectors (who both held a level 2 certification in borescope inspection, which is the highest certification achievable in the industry), and a human factors and risk analyst for the organisation. They were presented with the Bowtie results and asked to comment. They confirmed the accuracy of the results, commented on the method (they were generally in favour), and made suggestions for improvements (primarily in the precise wording of threats and barriers). For the visualisation of the Bowtie diagrams, the software ‘BowTieXP’ revision 9.2.13 was used [68].

4. Results

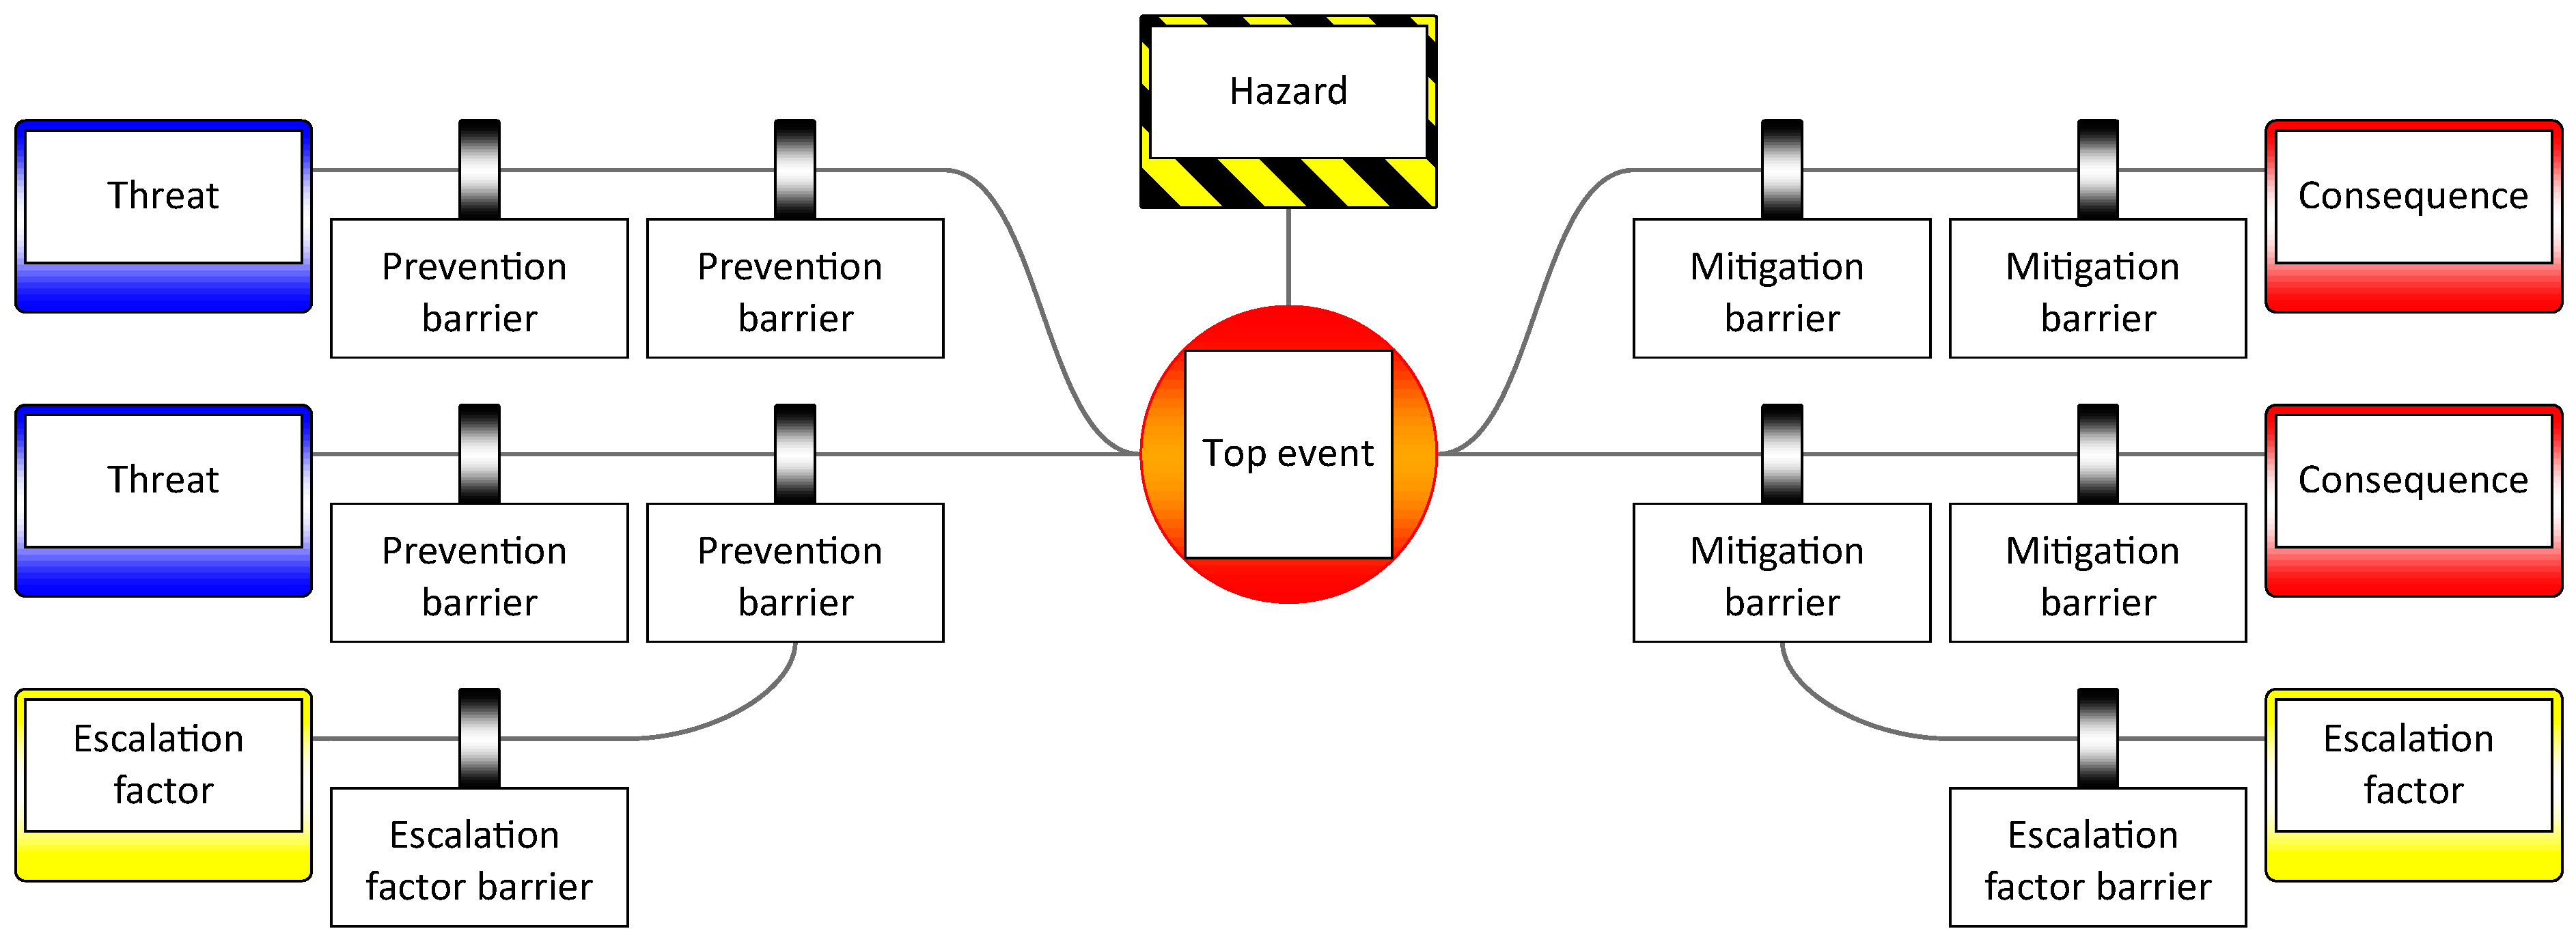
4.1. Consistent Interpretation of Relationship between Hazard and Top Event

Regarding the inconsistency of usage of the hazard and top event, we propose the following categorisation.
Format A: In cases where the scope of analysis is limited to one situation, the correspondence between hazard and the top event is not problematic. If the Bowtie diagram is too large, it may be represented as multiple smaller diagrams, providing the hazard and top event are used in the same way. The case study presented in this paper follows this approach.
Format B: The top event may have multiple hazard dimensions. In which case the top event should be consistent across all the diagrams, while the hazard changes. The hazard thus corresponds to a different contextualisation for the same top event; see Figure 3.
Format C: A hazard may have different top event dimensions. Each dimension may represent a different step in a process. Figure 4 provides an example for human factors in different areas of the maintenance process.
We propose that the Bowtie analyst should decide beforehand how the problem is to be structured, and select one of the above formats, and then use it consistently throughout the analysis. This has the potential to avoid some of the inconsistencies seen in practice.

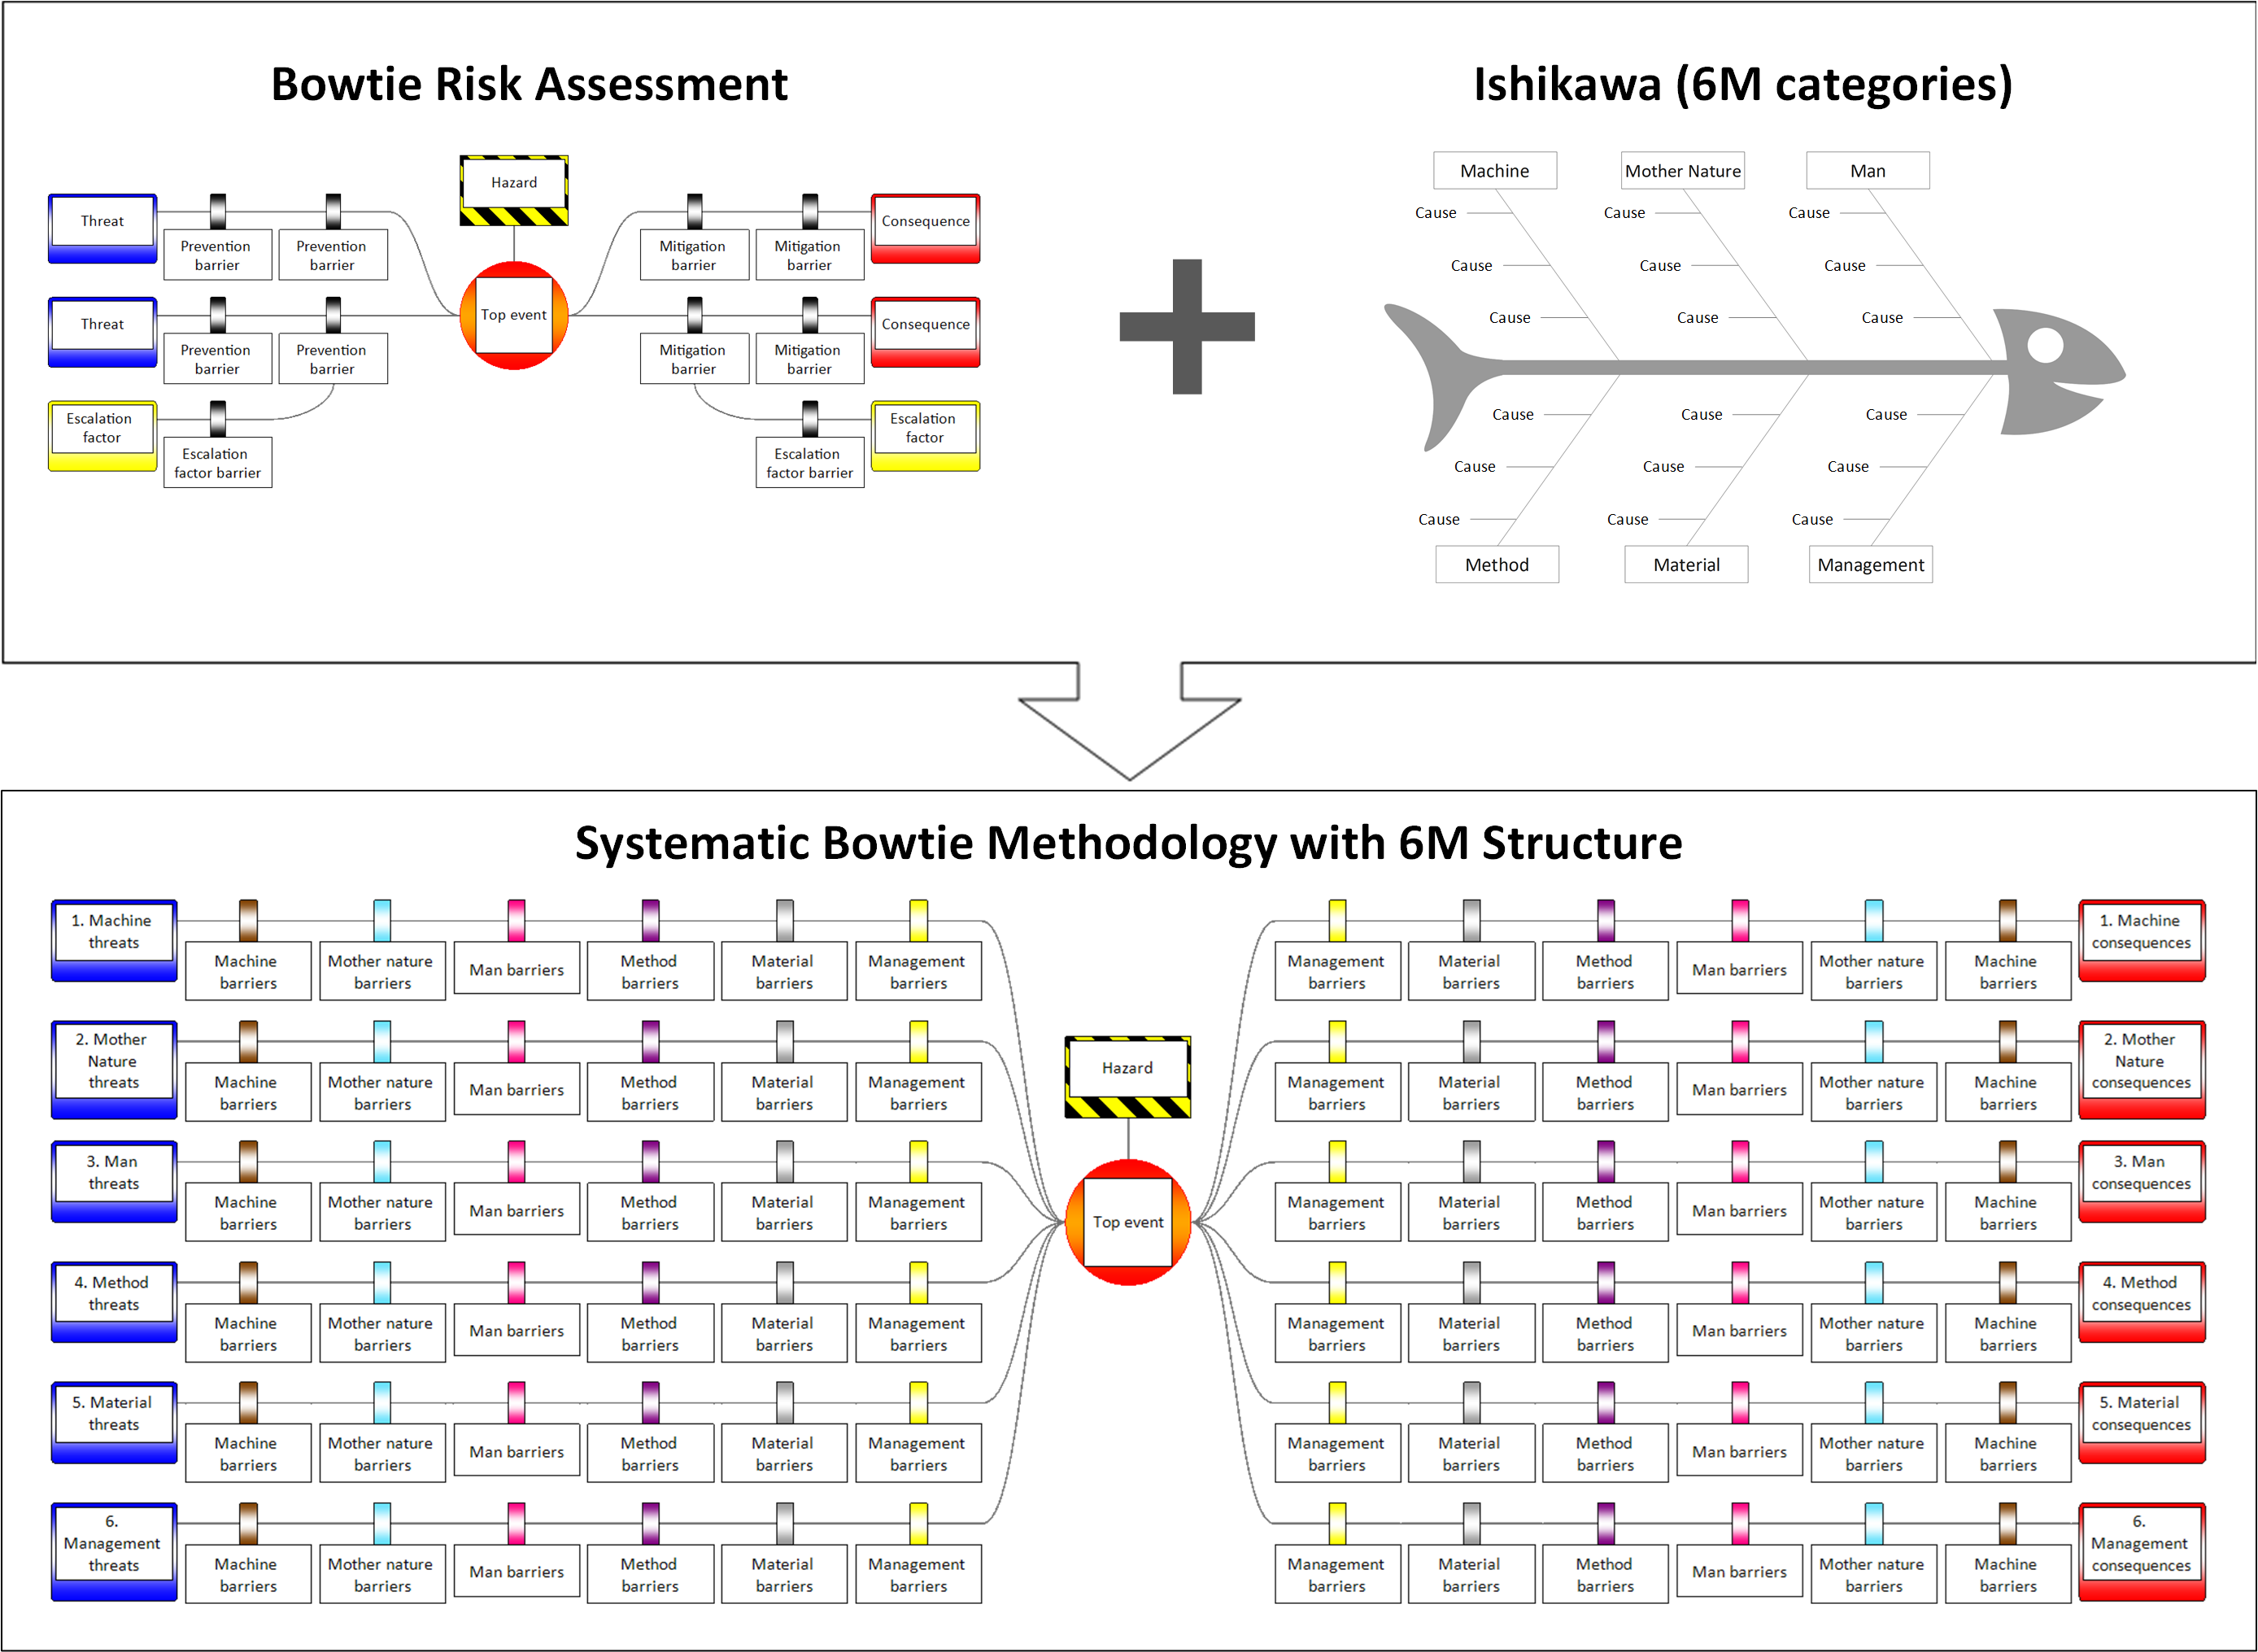
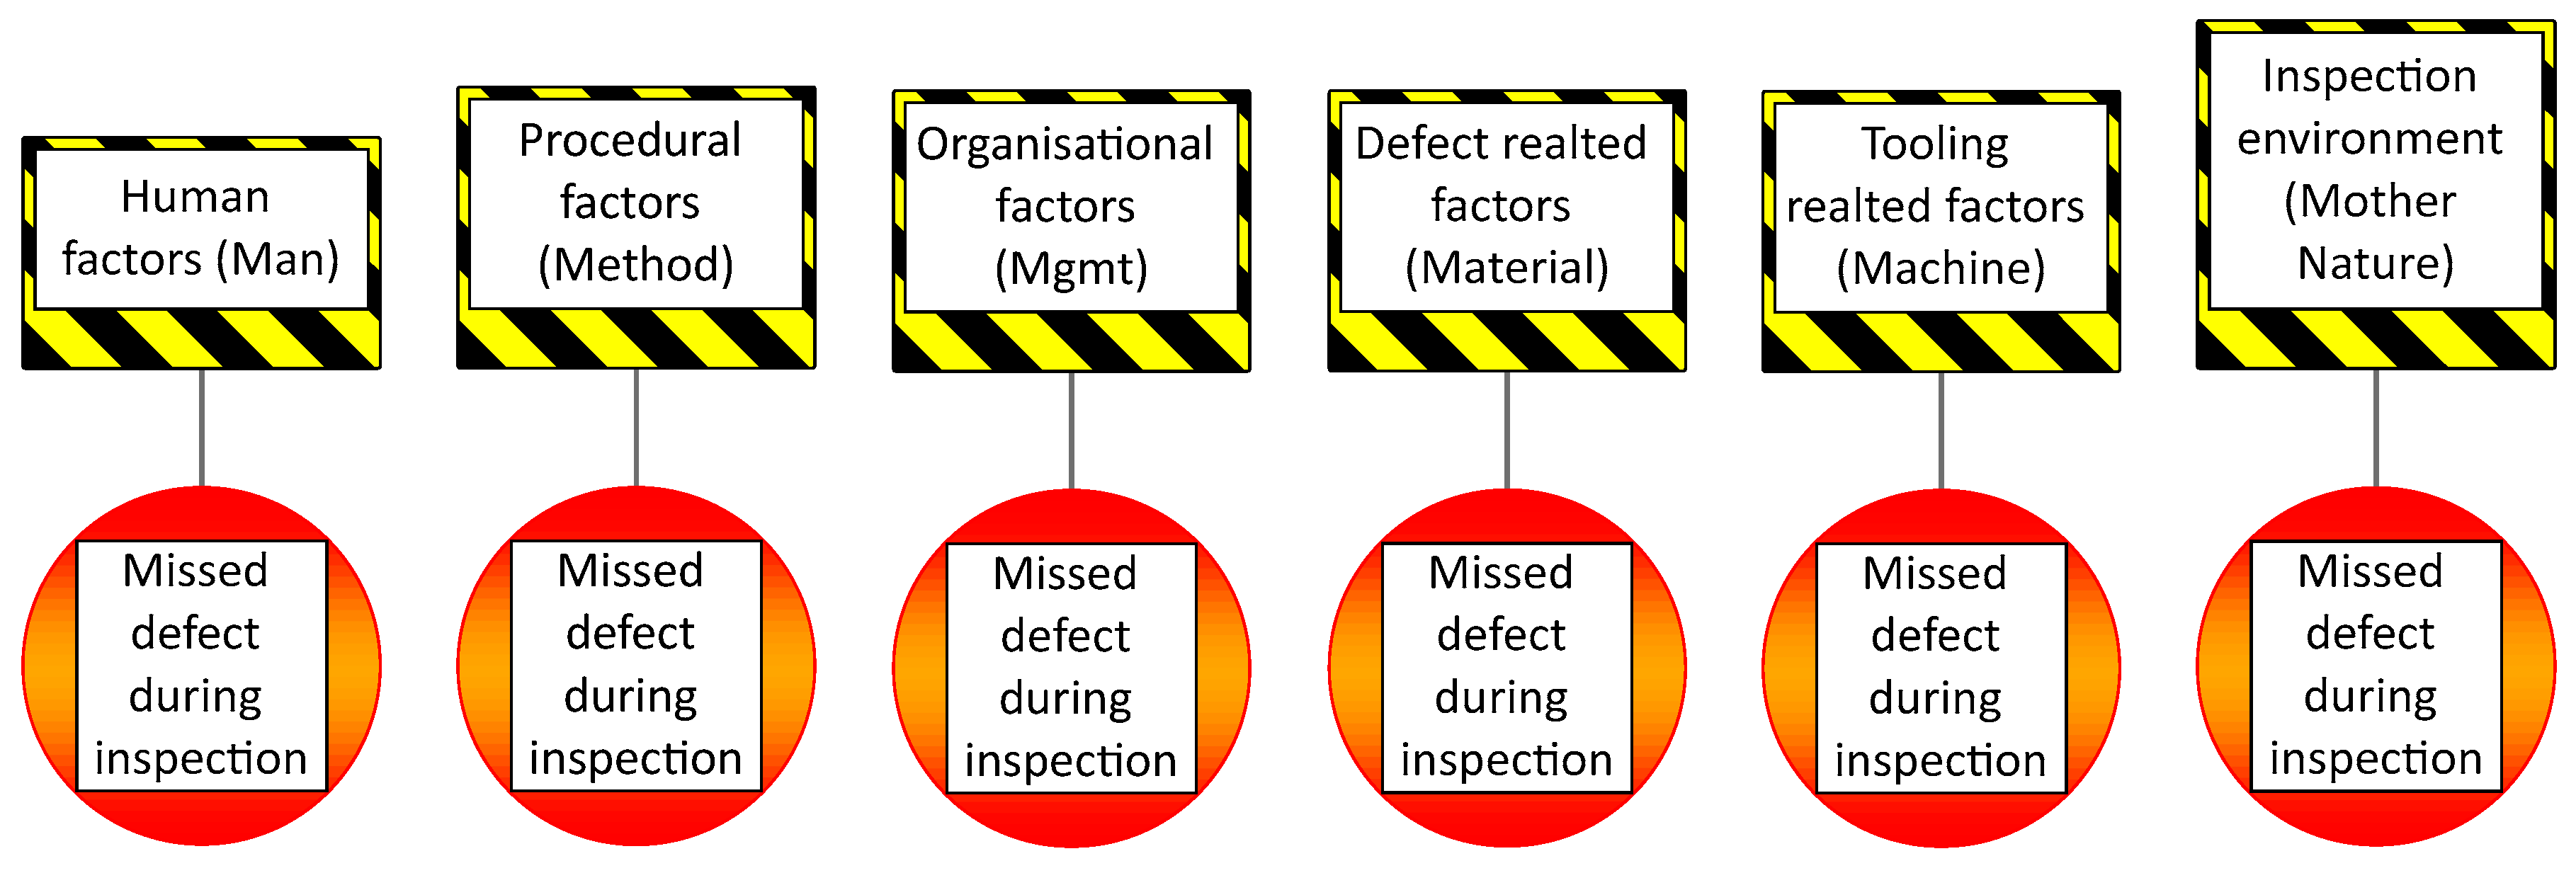
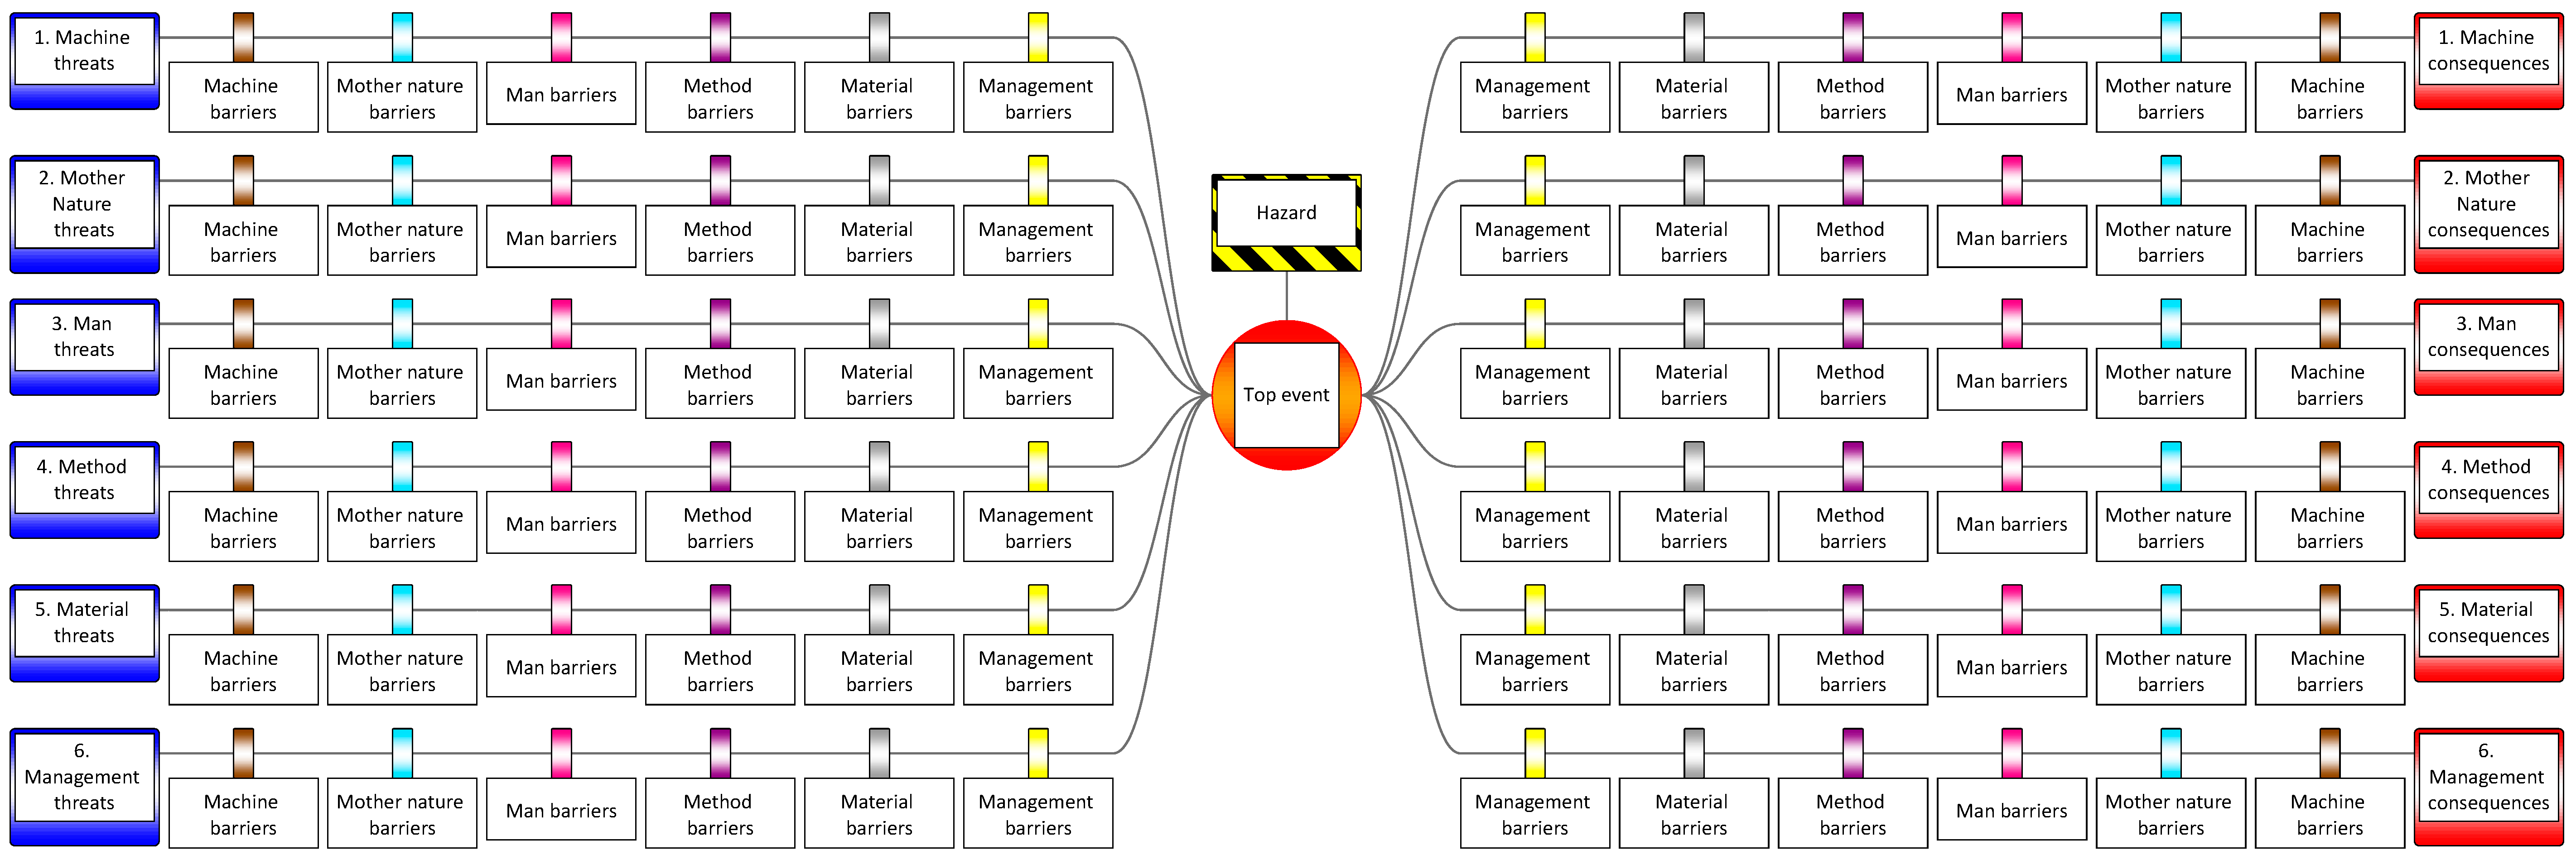
4.2. Proposal to Use 6M Structure

The challenge with selecting the most suitable categorisation was that Bowtie contains different risk elements including hazards, root causes (threats), consequences, barriers and controls. For each of these elements, different approaches and categorisations exist. Some are suitable to categorise risks (causes and effects), but less suitable for categorising barriers. Hence, we decided to choose a risk categorisation that works for both risks (threats and consequences) and means of risk prevention and mitigation (barriers).
The 6M approach was seen as most suitable for the planned research and case study for the following reasons. First of all, the 6M approach was chosen due to the familiarity of the Bowtie and the Ishikawa diagram, with both being a cause and effect diagram. The 6M has already been successfully applied to structure such a diagram [23]. Secondly, it has been successfully applied outside the manufacturing environment such as health care [69,70], management [71], and education [72]. Moreover, the 6M categorisation was well known at our industry partner, as the cause and effect diagram from Ishikawa is part of the measure phase of the DMAIC, a continuous improvement process often used in Six Sigma and know by industry practitioners [73]. The 6M structure can be used for both vertical categorisation of the threats and consequences, as well as horizontal categorisation of barriers.
The 6M aligns with other categorisations presented in the broader literature in Section 2.3 including the five accident categories used by IATA [53], and the four main risk categories by Lester [44]. Both are quite similar and a terminology adjustment, following the ‘category starts with the letter M’ concept, would make these categories match the selected 6M approach.

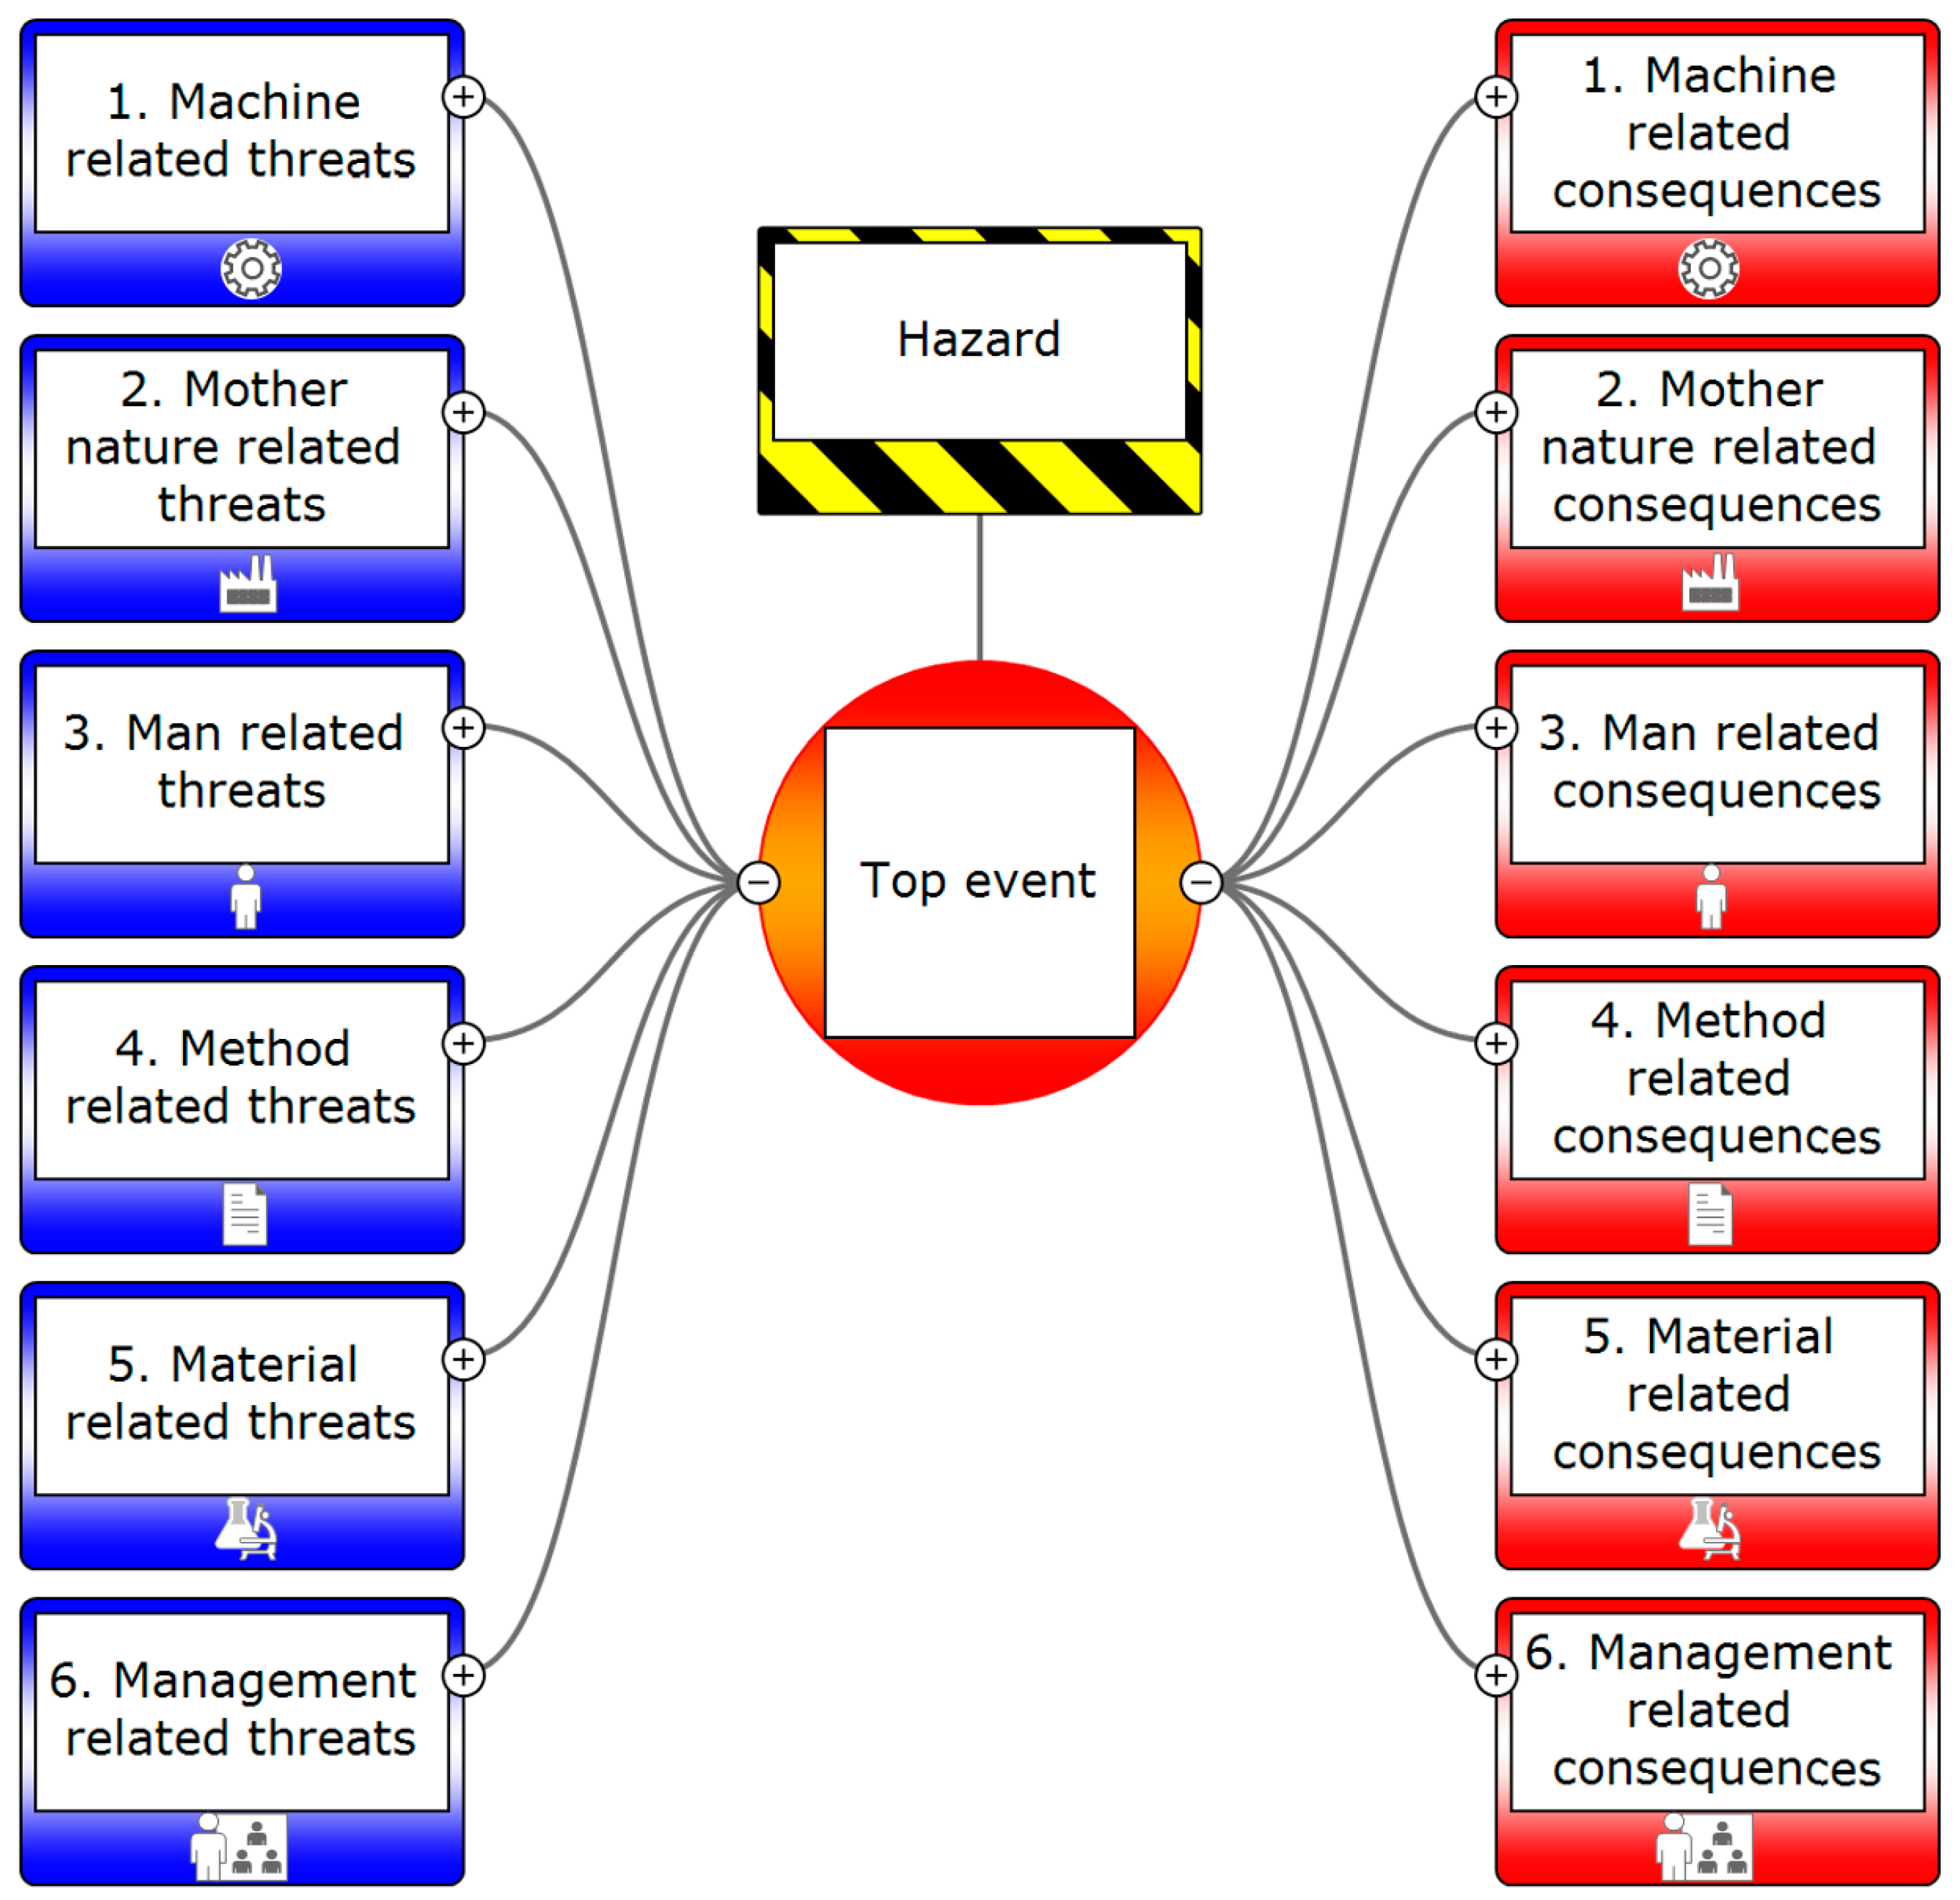
4.3. Integration of 6M with Bowtie (Contextualisation)

The MRO environment differs to the manufacturing environment, and hence the original 6M structure by Ishikawa required modification. The contextualisation was carried out in the light of organisational quality factors that influence the maintenance and inspection result. In a production environment, the measurement category commonly includes the inspection and measurement of the parts to check if they meet the quality requirements. However, in an inspection environment the ‘measurement’ category can overlap with ‘machine’ and ‘method’, since the inspection tool and followed processes would fit into all three categories. The measurement category was therefore less useful to apply in an inspection environment. Instead of the ‘measurement’ category, we included ‘management’, which is one of the additional categories from the 8M approach by Burch et al. [58] and aligns to the work by Gwiazda [74] and Vaanila [73]. This was carried out as it matches the area under investigation being the highly regulated aviation and maintenance industry (see below) [75,76]. Management refers to organisational and regulatory factors. The other category from the 8M we could have chosen was maintenance, but since we wanted to investigate risks in a maintenance environment, maintenance as a threat and a hazard at the same time would have caused problems with the consistency of the Bowtie structure.
In Table 1 below, we demonstrate how the categories and their interpretation may change according to the industry. This is demonstrated based on three examples, namely manufacturing, maintenance and health care. The latter was chosen to demonstrate the integration to a quite different industry.

4.4. Threats and Consequence Structure Using 6M

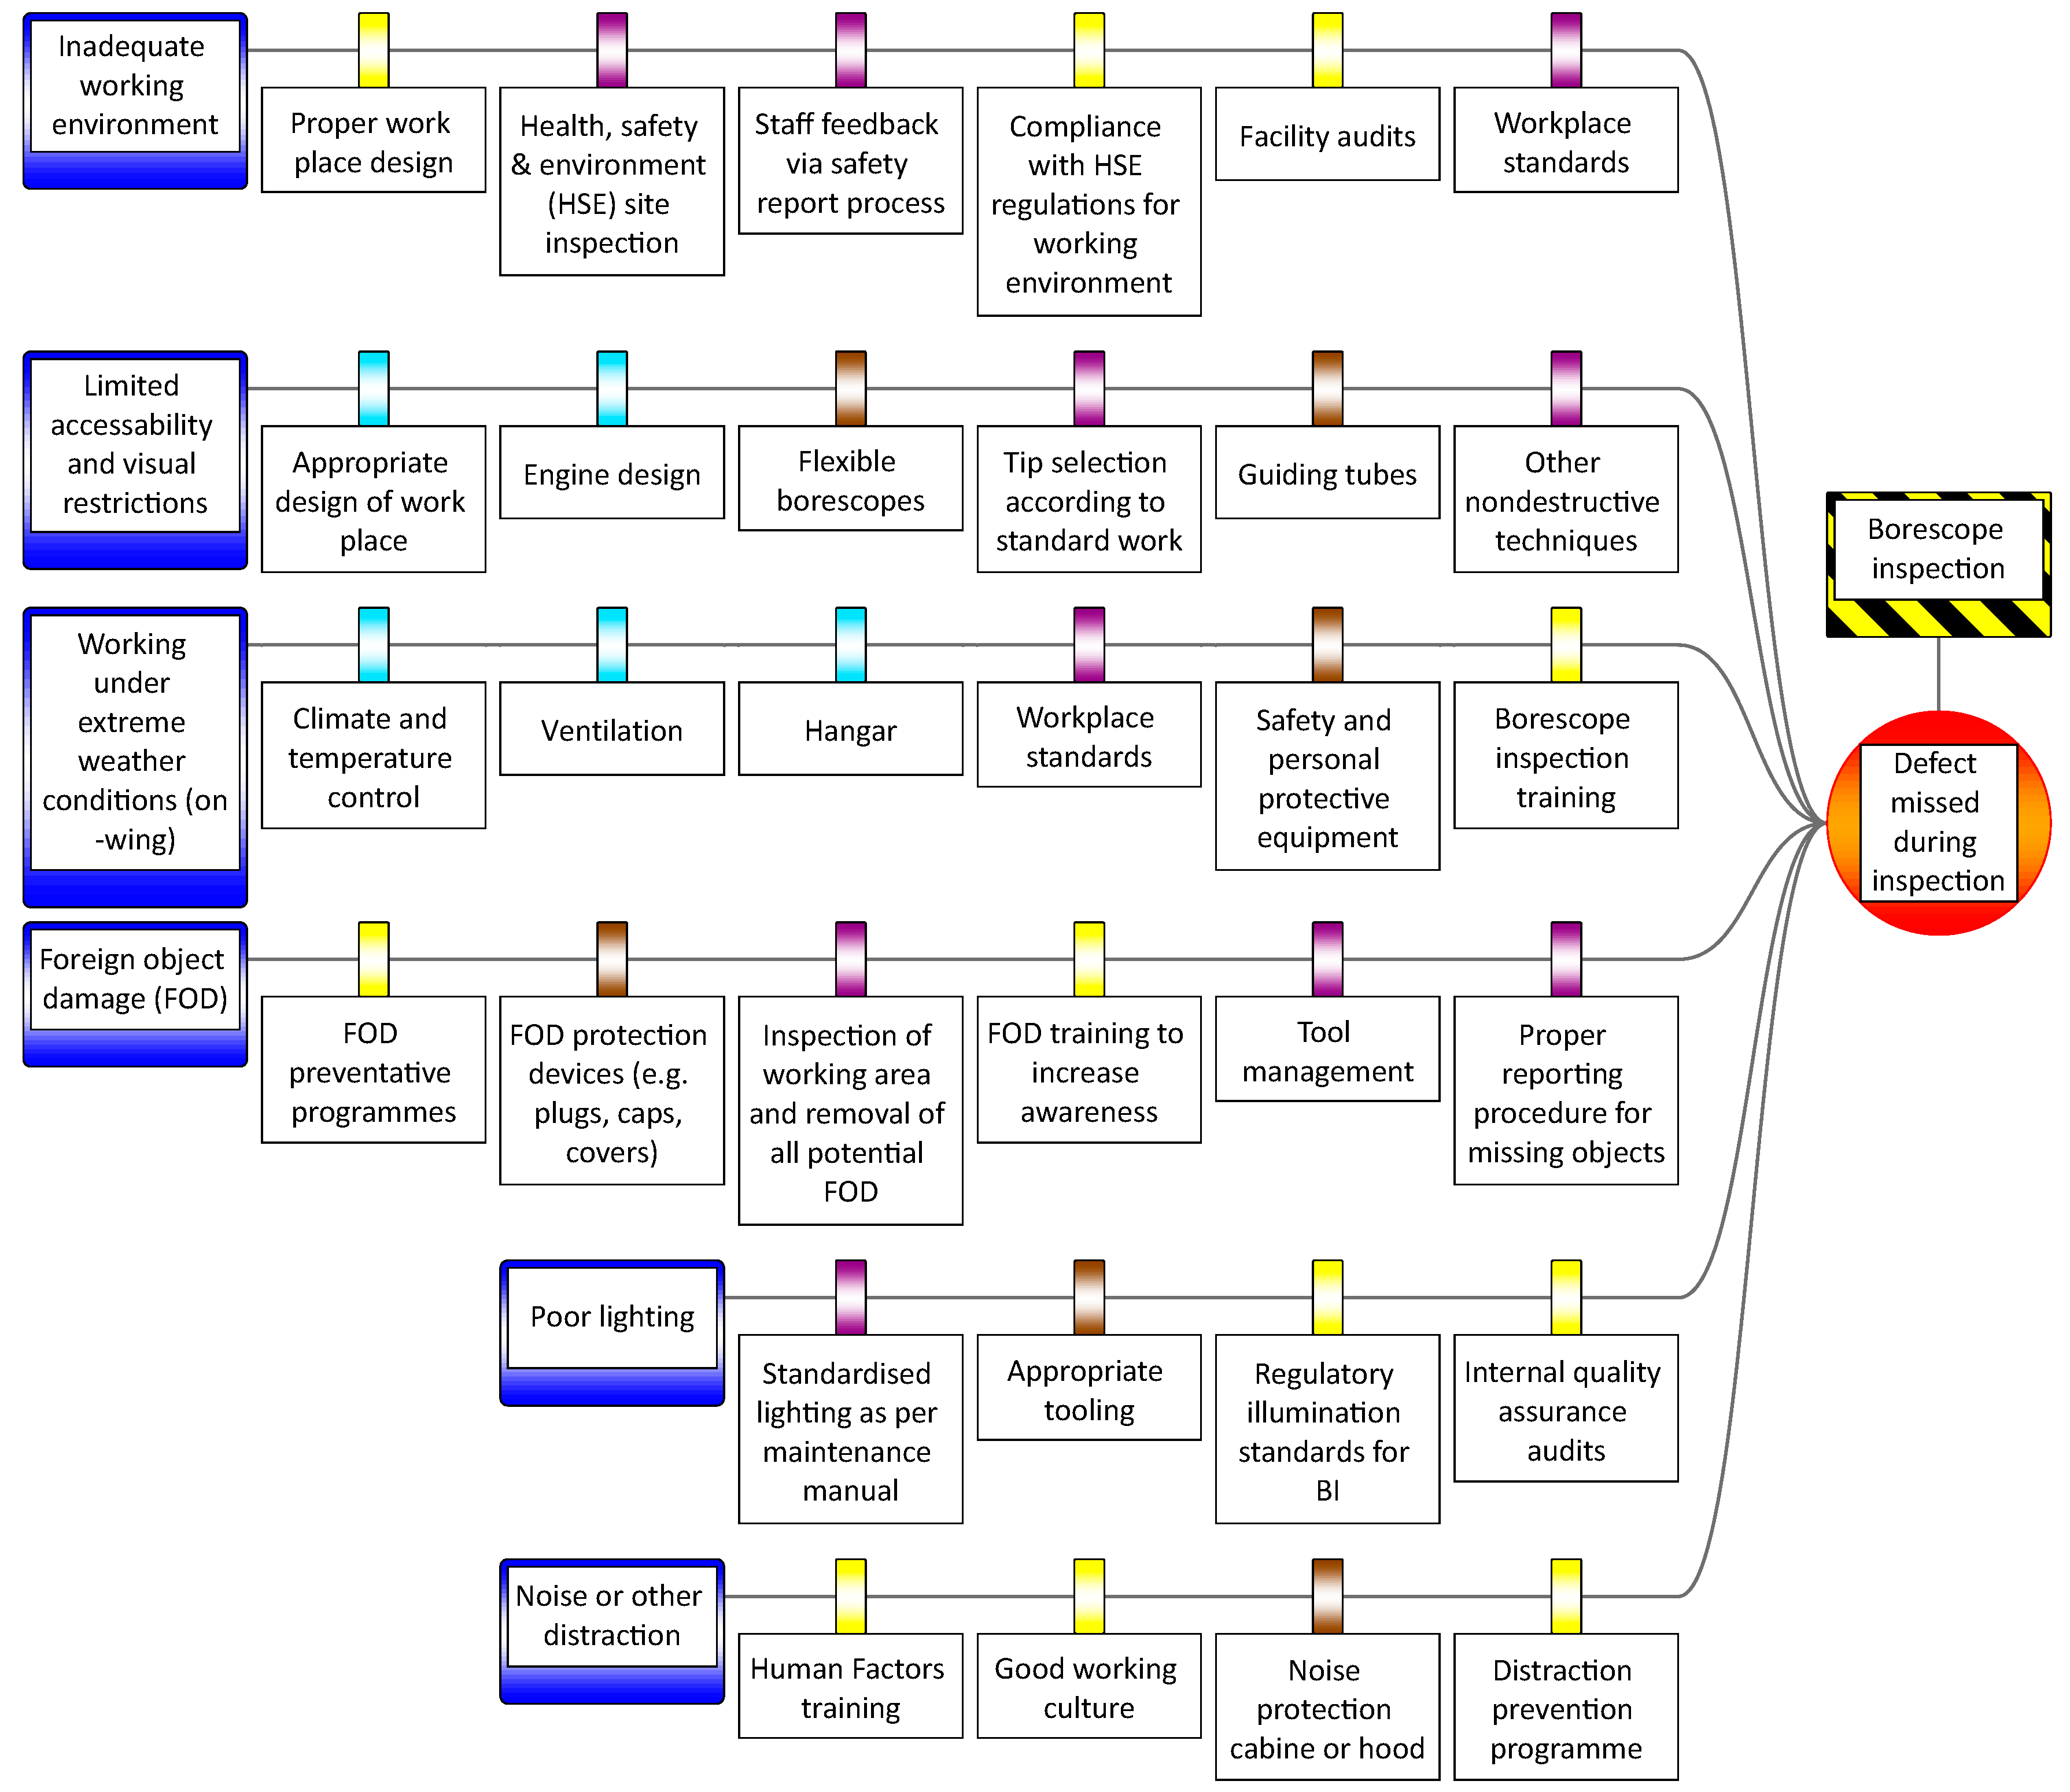
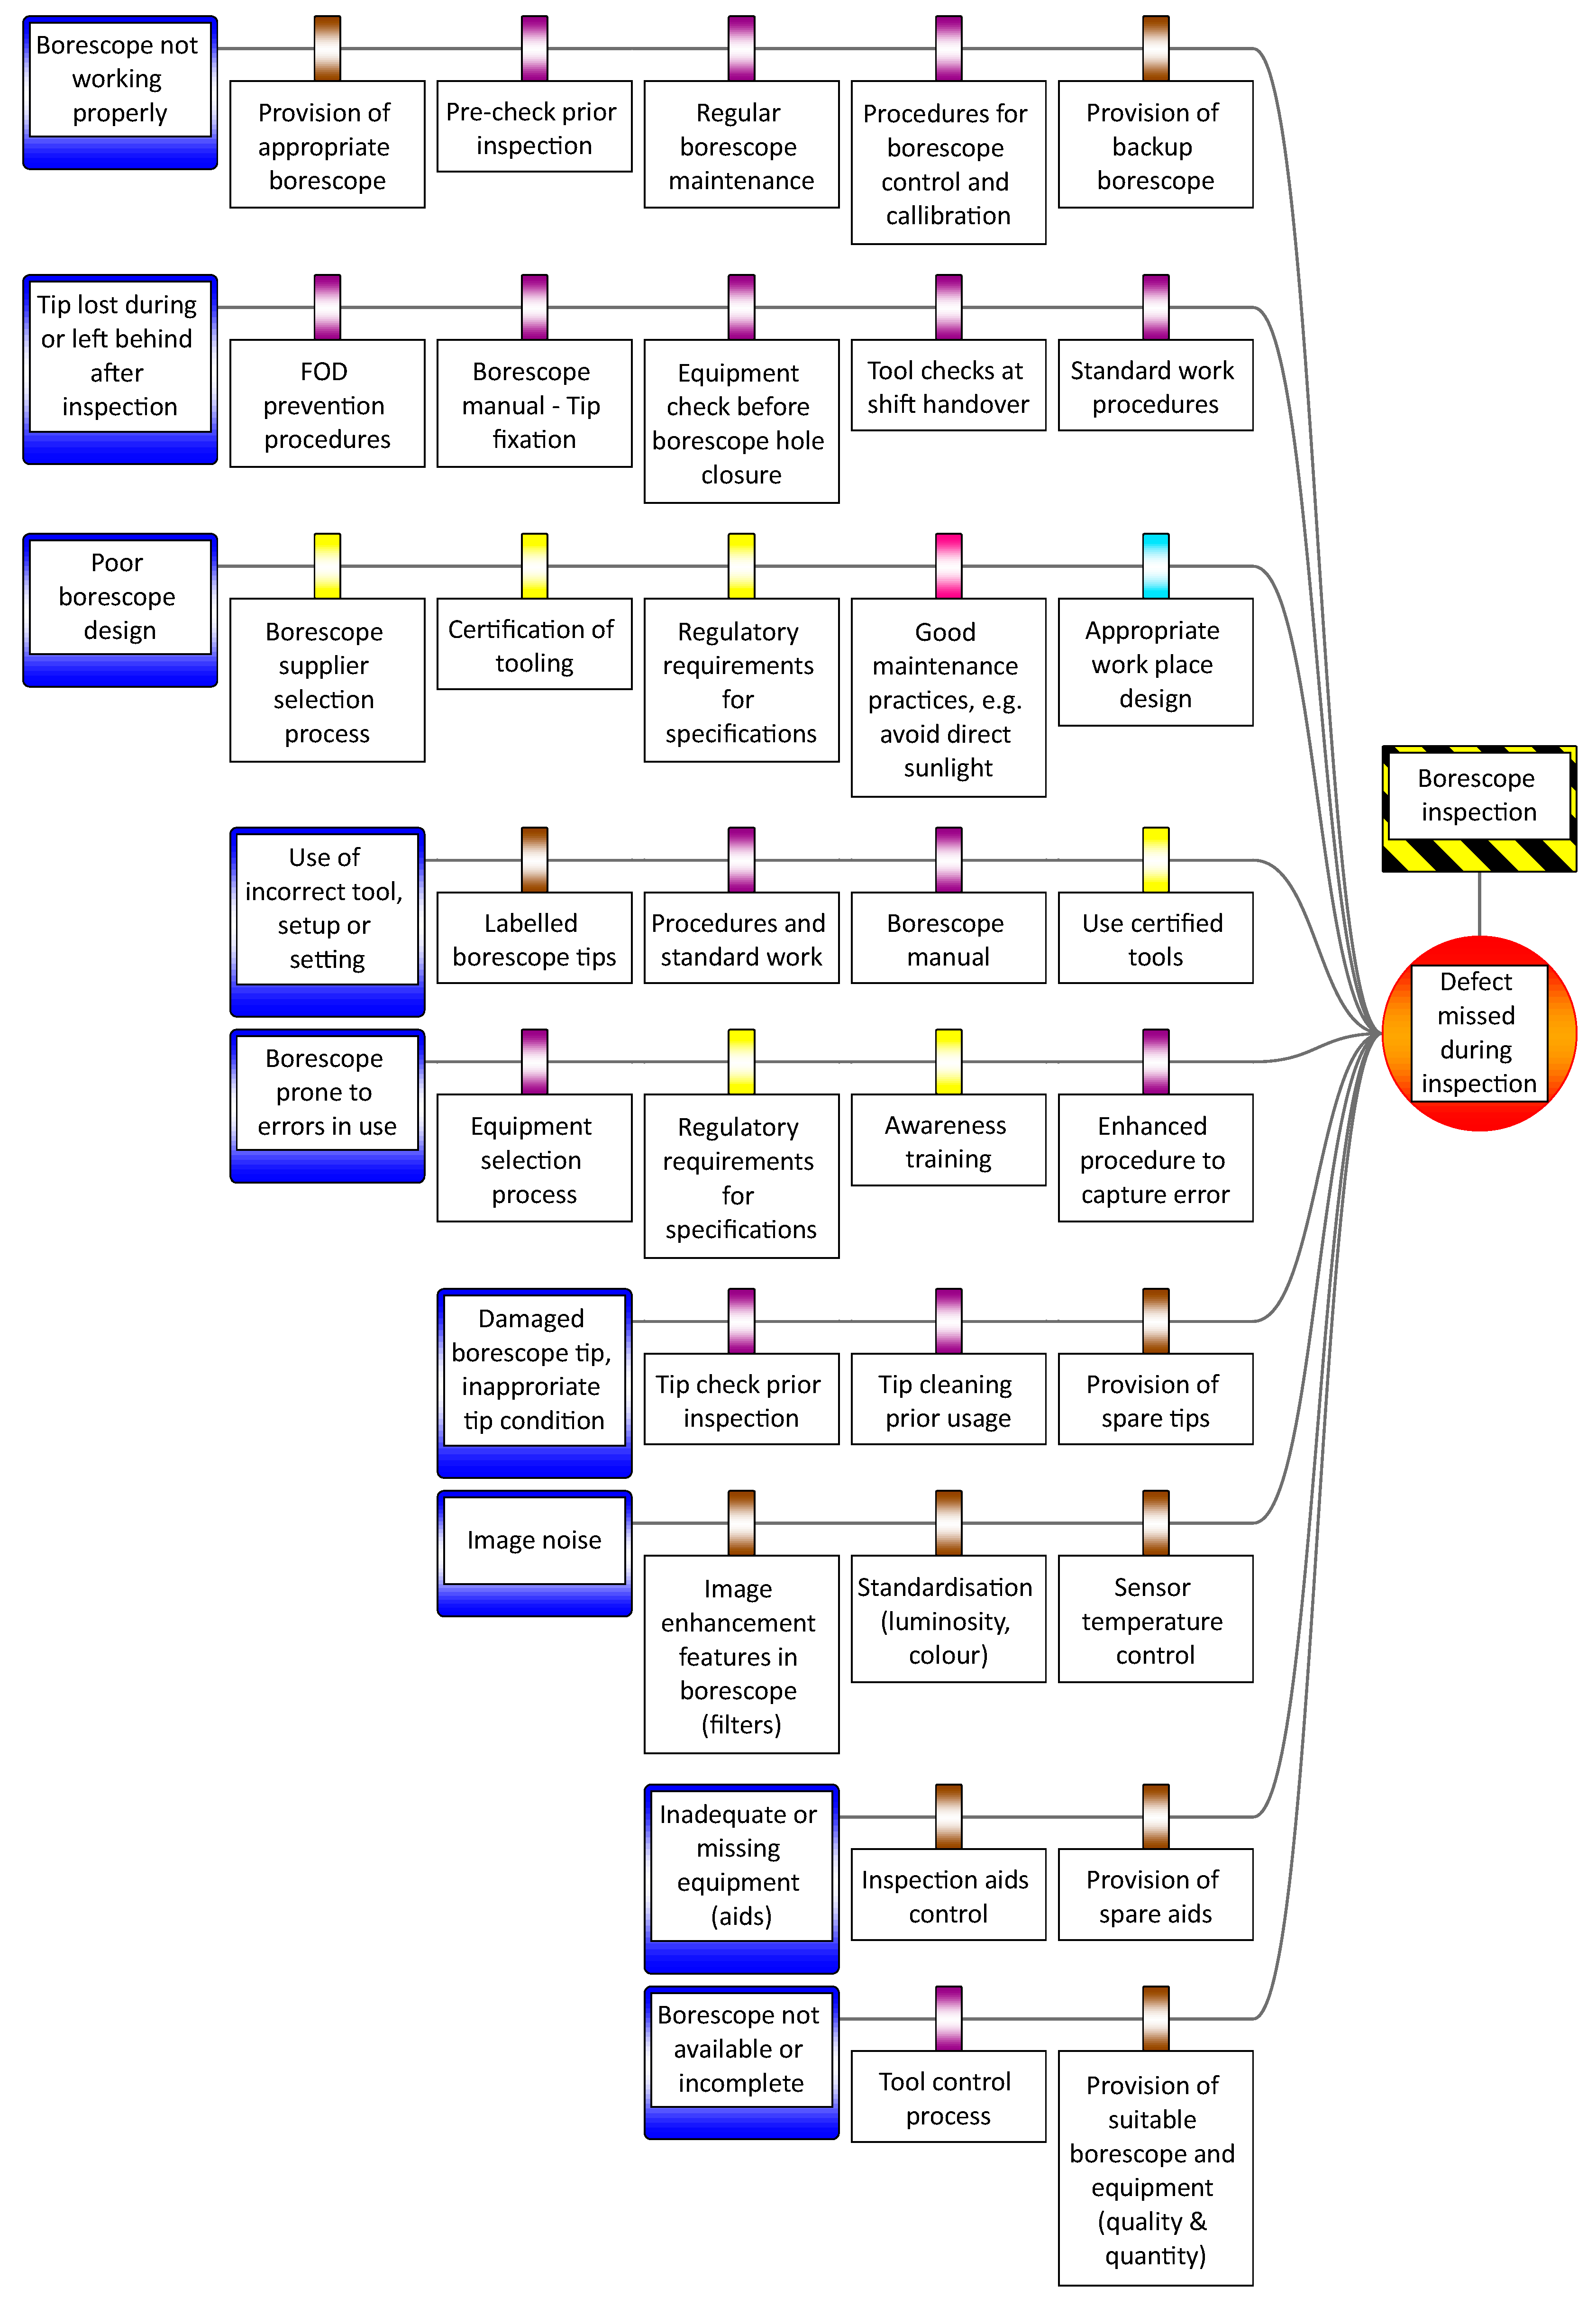
4.4.1. Threat Structure in MRO

We started with integration of the 6M structure for the threats. A description of each category together with an example is given in the Table 2 below.

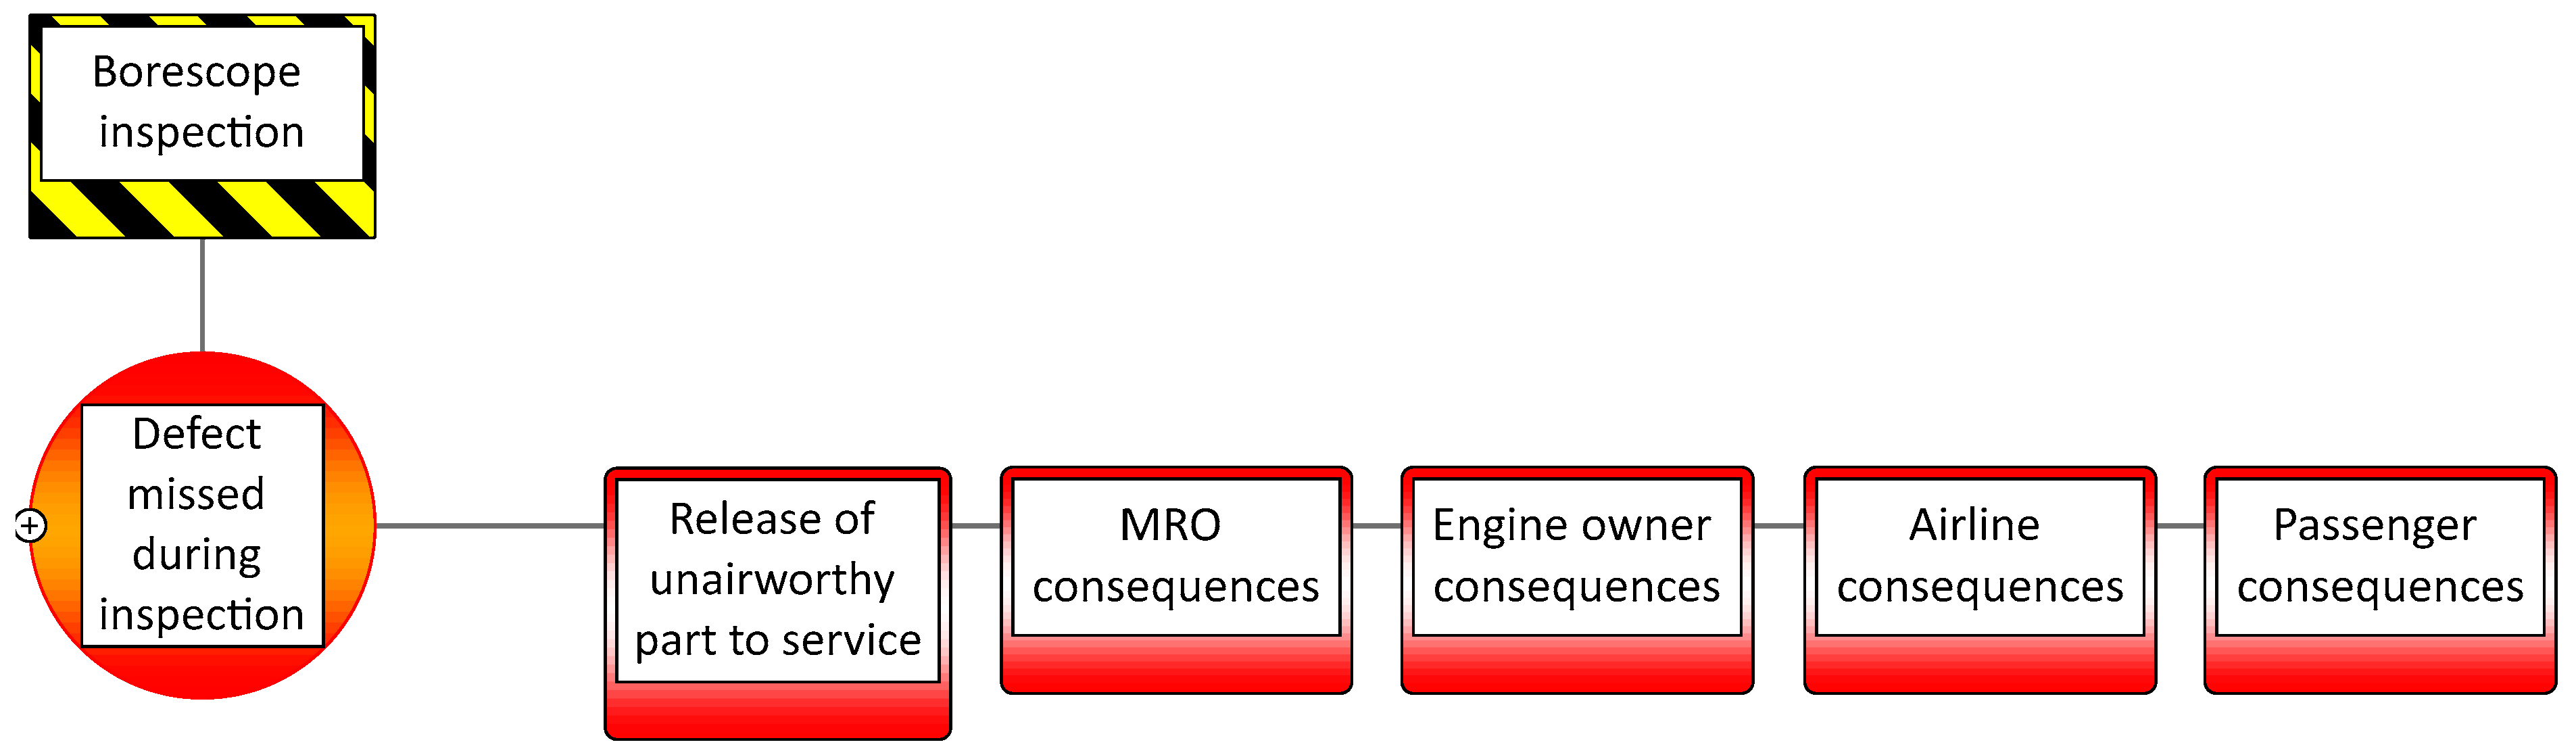
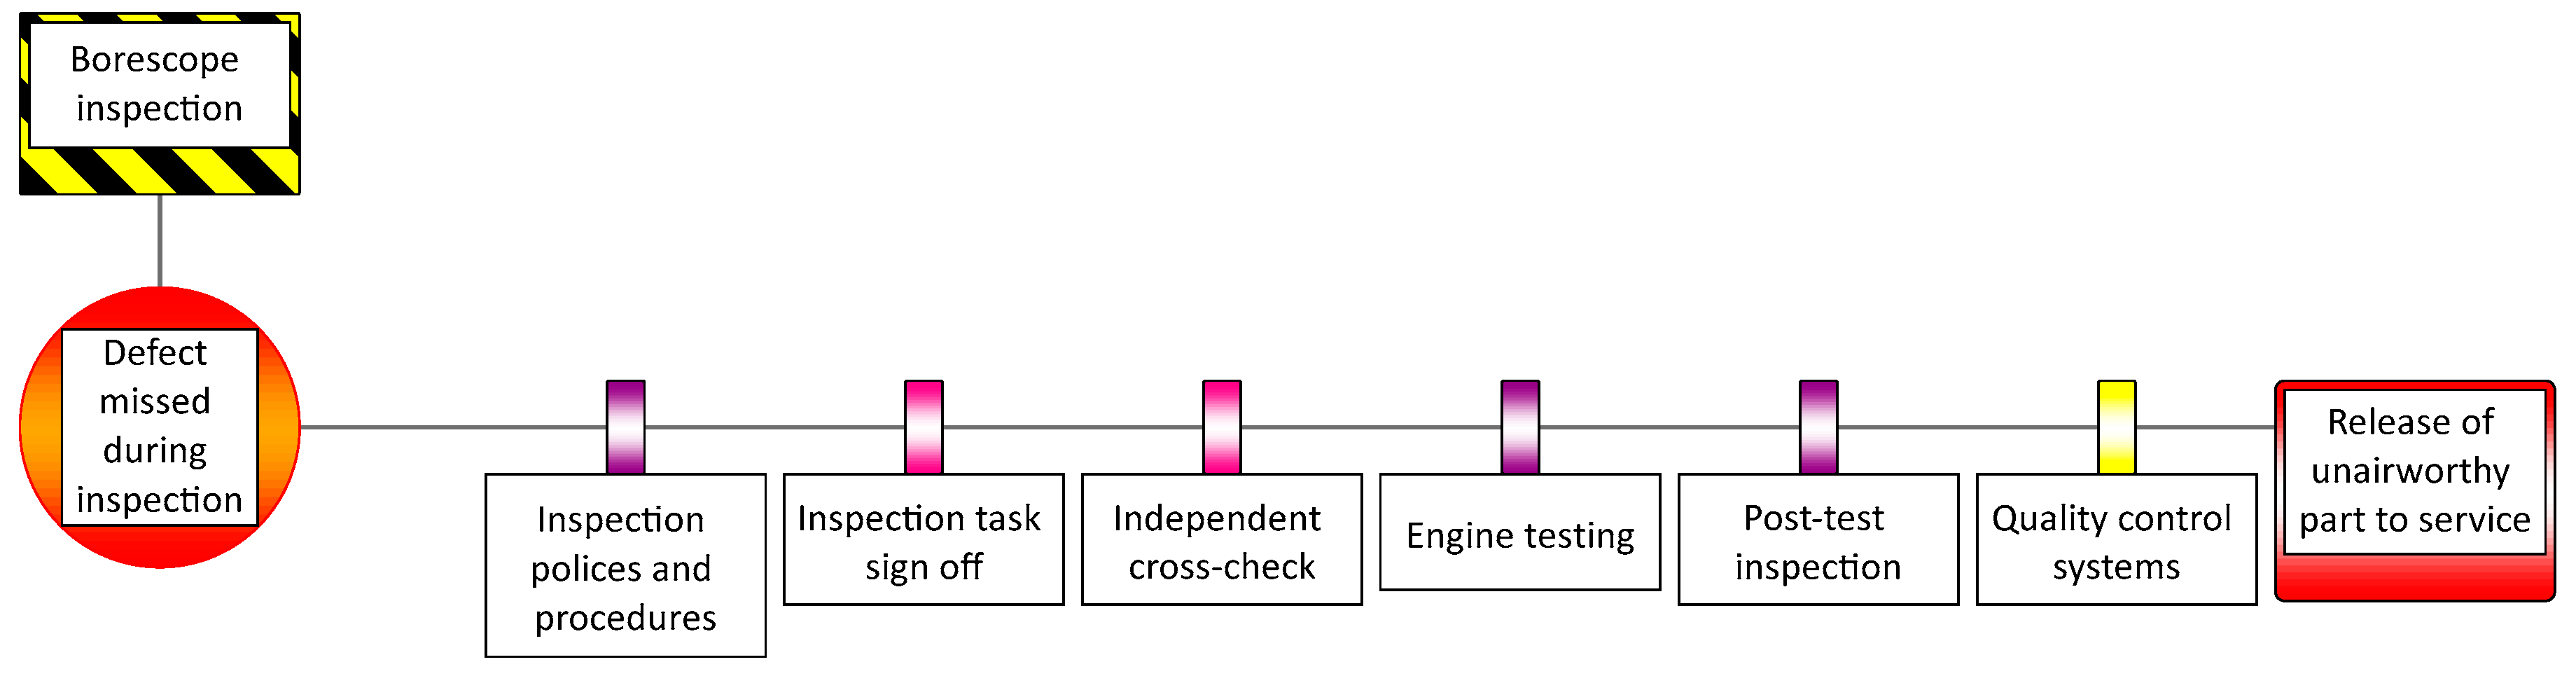
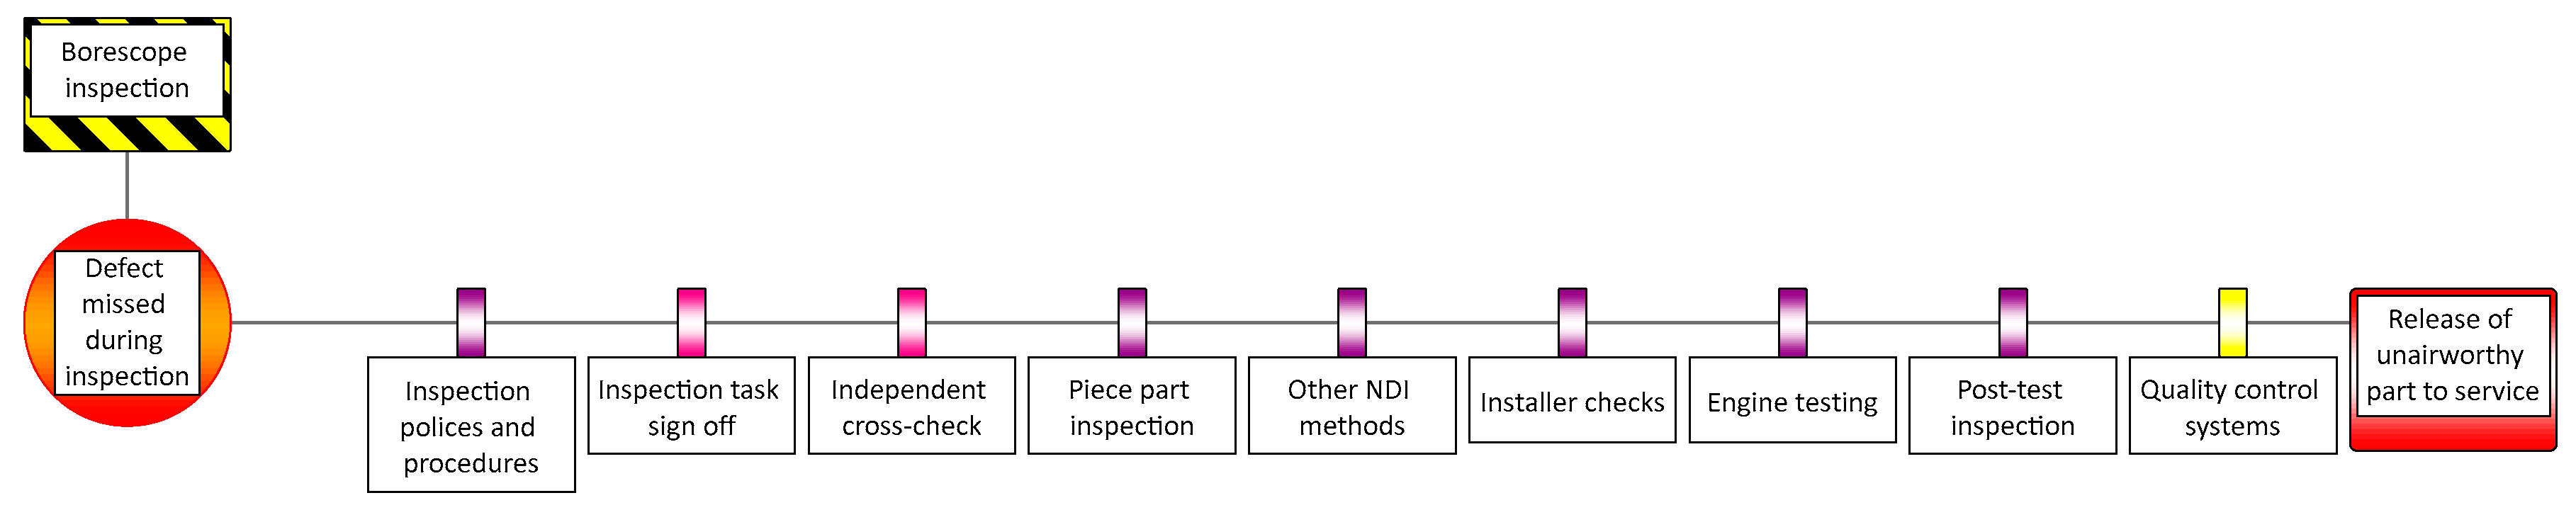
4.4.2. Consequences for Different Stakeholders

There are two main stakeholders in this situation: (i) the MRO service provider, and (ii) the airline company and its passengers. The stakeholders are linked in a cascade of consequences [7]. A missed defect during borescope inspection can propagate from minor consequences for the MRO service provider and engine owner, towards catastrophic consequences for the airline, passengers and cabin crew; see Figure 5. For each link in the consequence chain, a new Bowtie risk assessment can be performed and a diagram drawn, tailored to the focus of the affected stakeholder.

Immediate Consequences for the MRO Service Provider

The consequences for the MRO provider include additional costly and time-consuming repairs or improvement processes, and reputational damage. An overview of possible consequences is given in Table 3 below.

Subsequent Consequences for the Airline

In the airline situation, the effect of a defective part in an engine has a different set of consequences, as shown in Table 4. These can reach from less critical gate returns and flight delays, to engine failure during flight operation with the potential to cause accidents or harm to passengers and cabin crew.

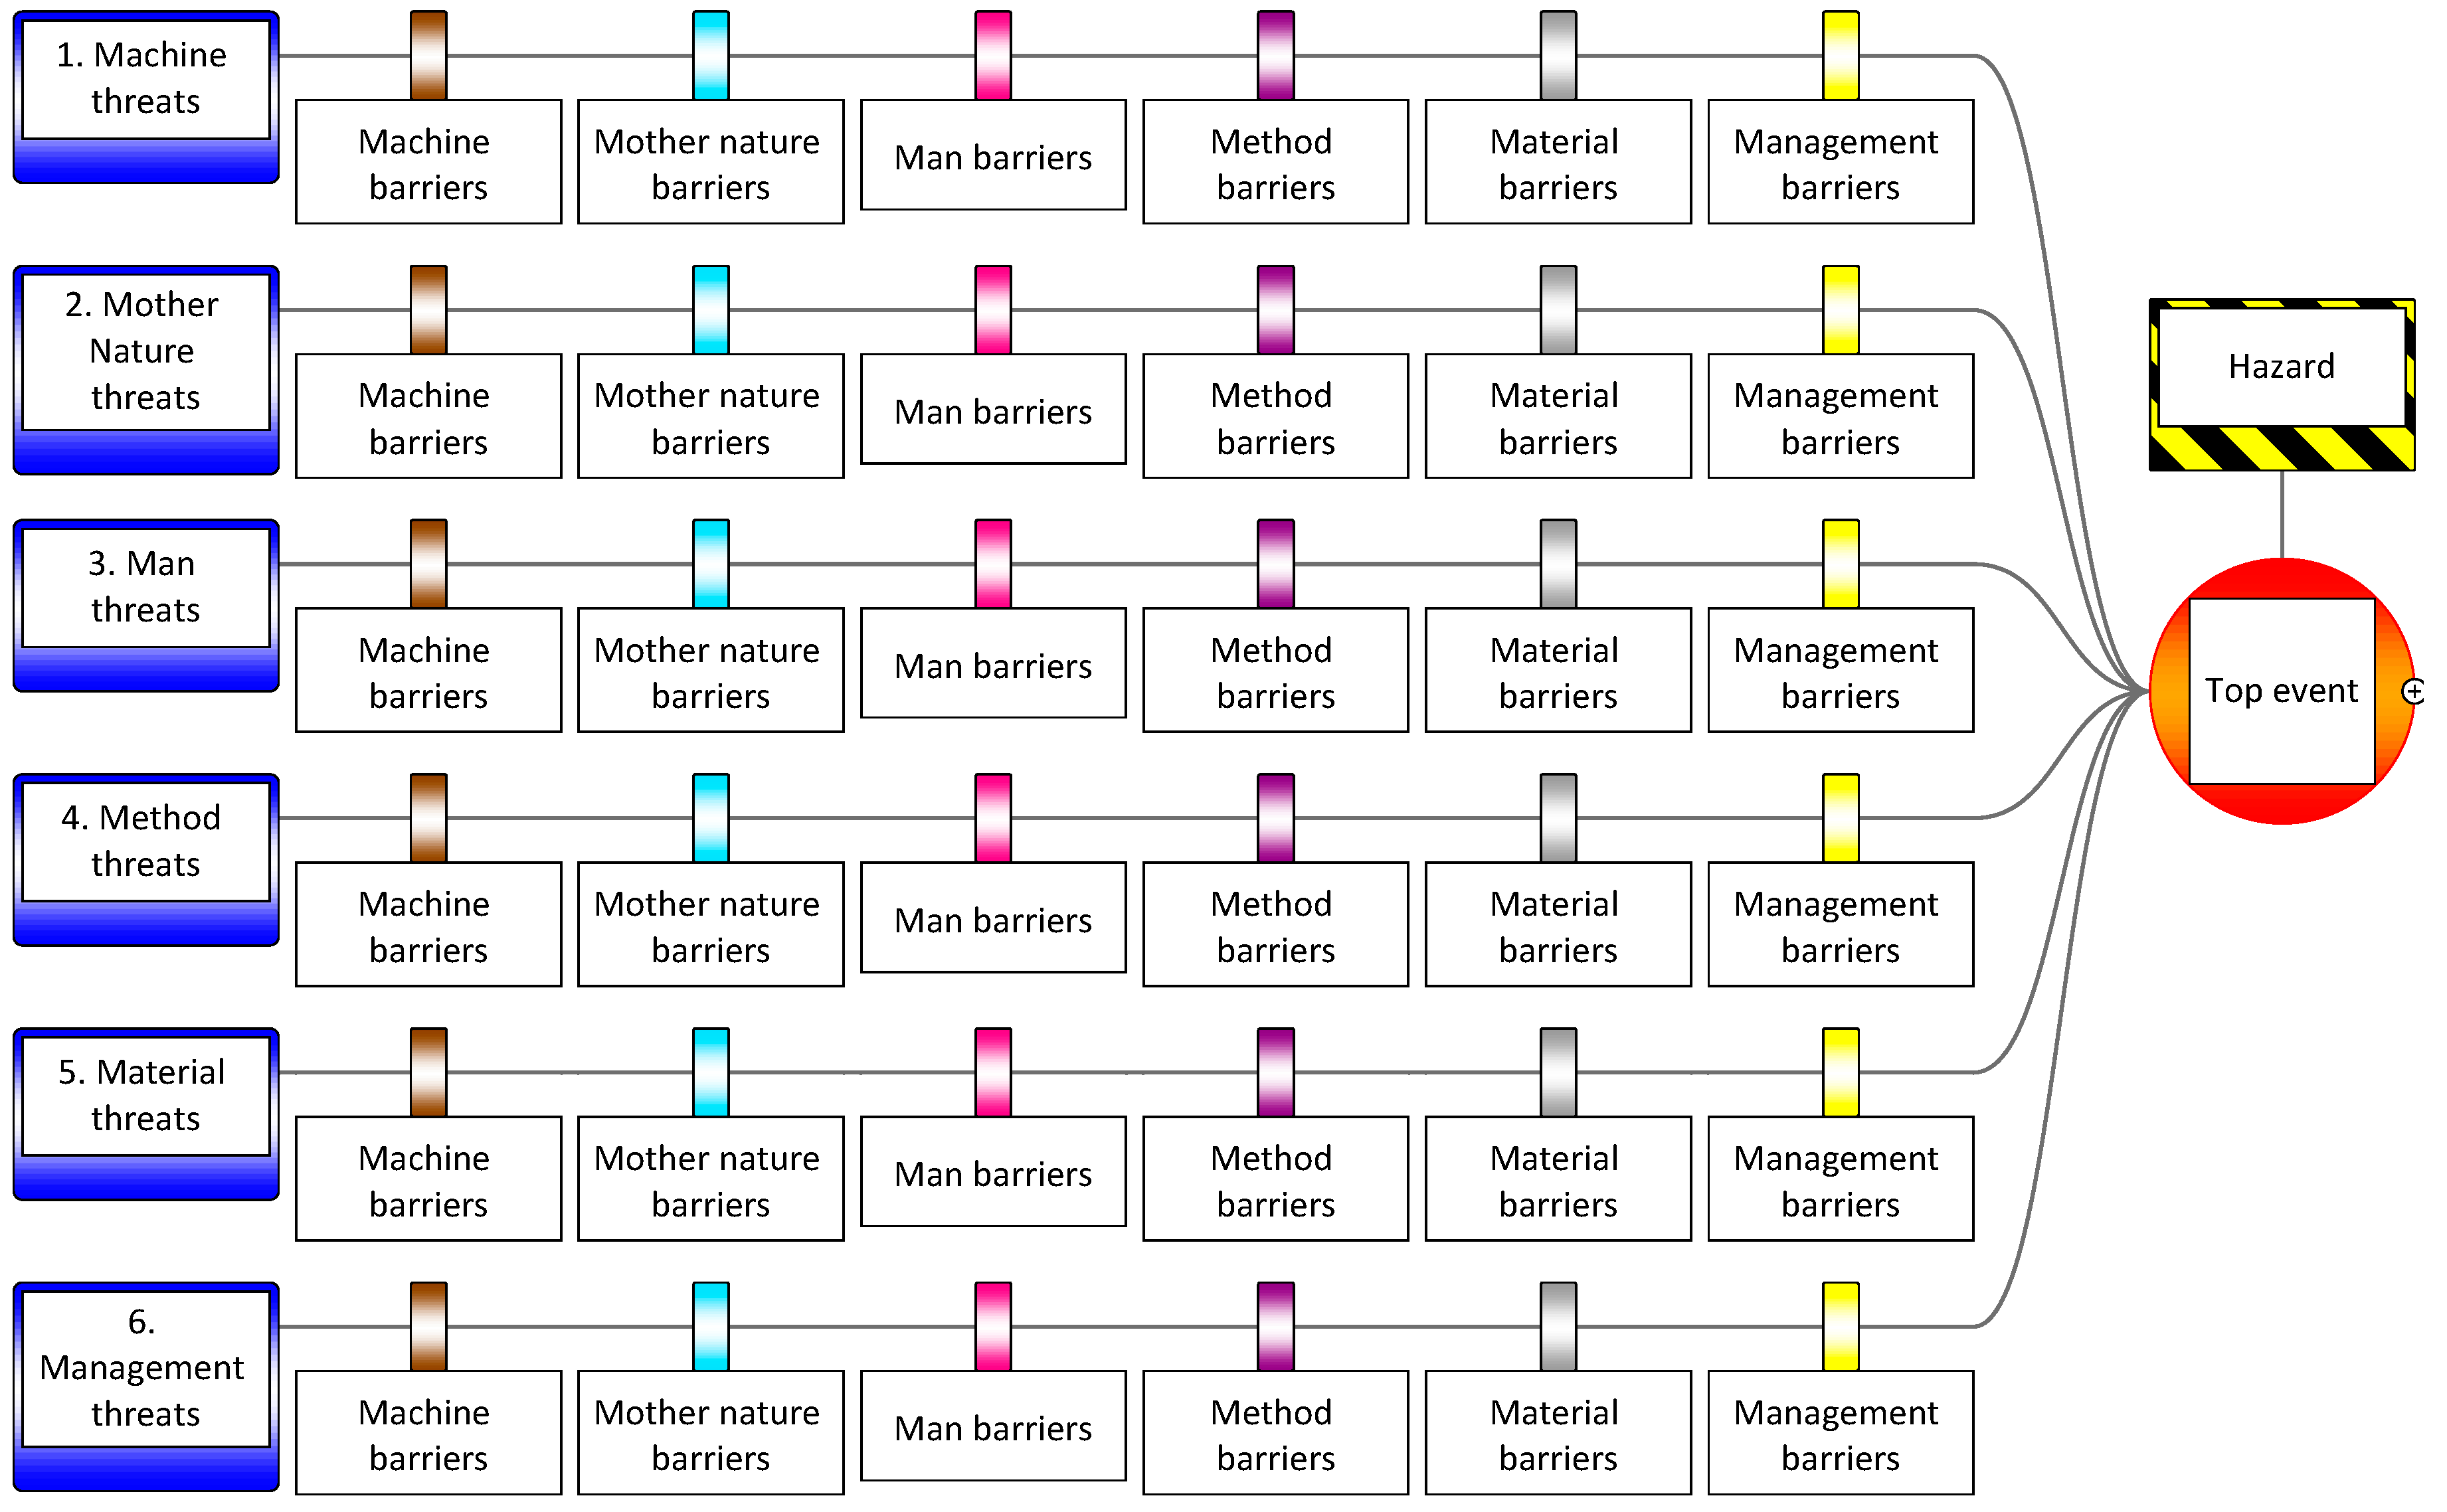
4.4.3. Combined Threat and Consequence Structure Using 6M

The combined threat and consequence structure of the Bowtie diagram applying 6M is presented in Figure 6 below. The diagram illustrates the structure of the concept and that there is no limit for the number of threats in each category. It provides a systematic guide to identify threats and consequences. Furthermore, a threat of an M category does not necessarily result in a consequence of the same category.

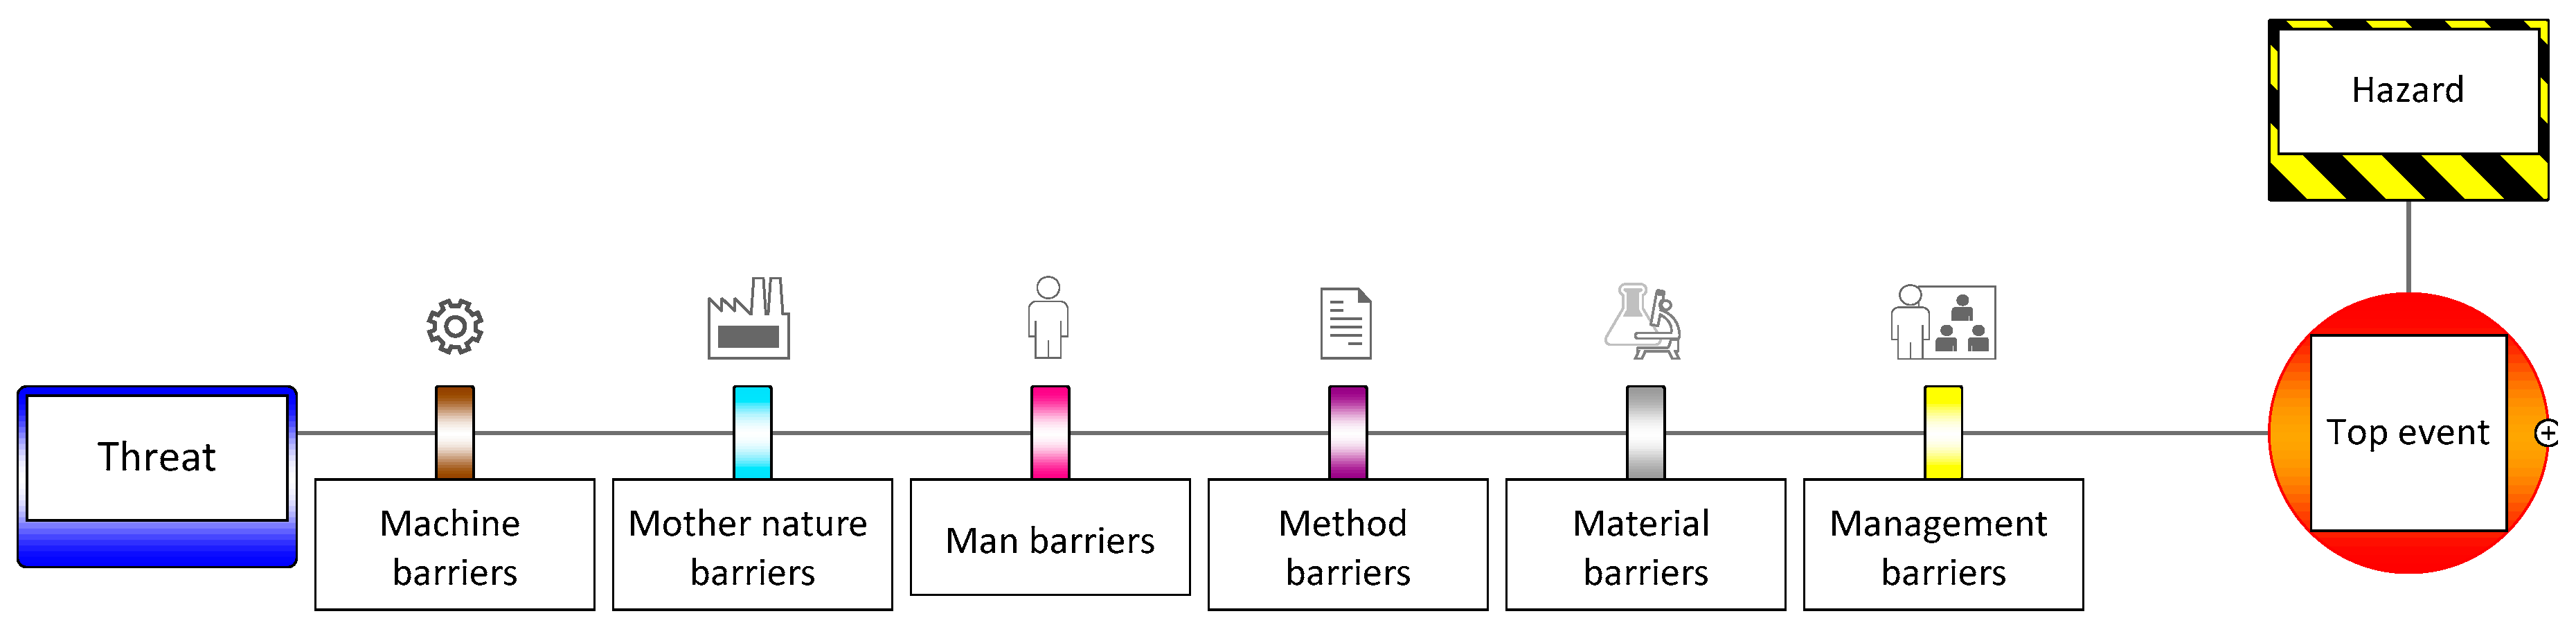
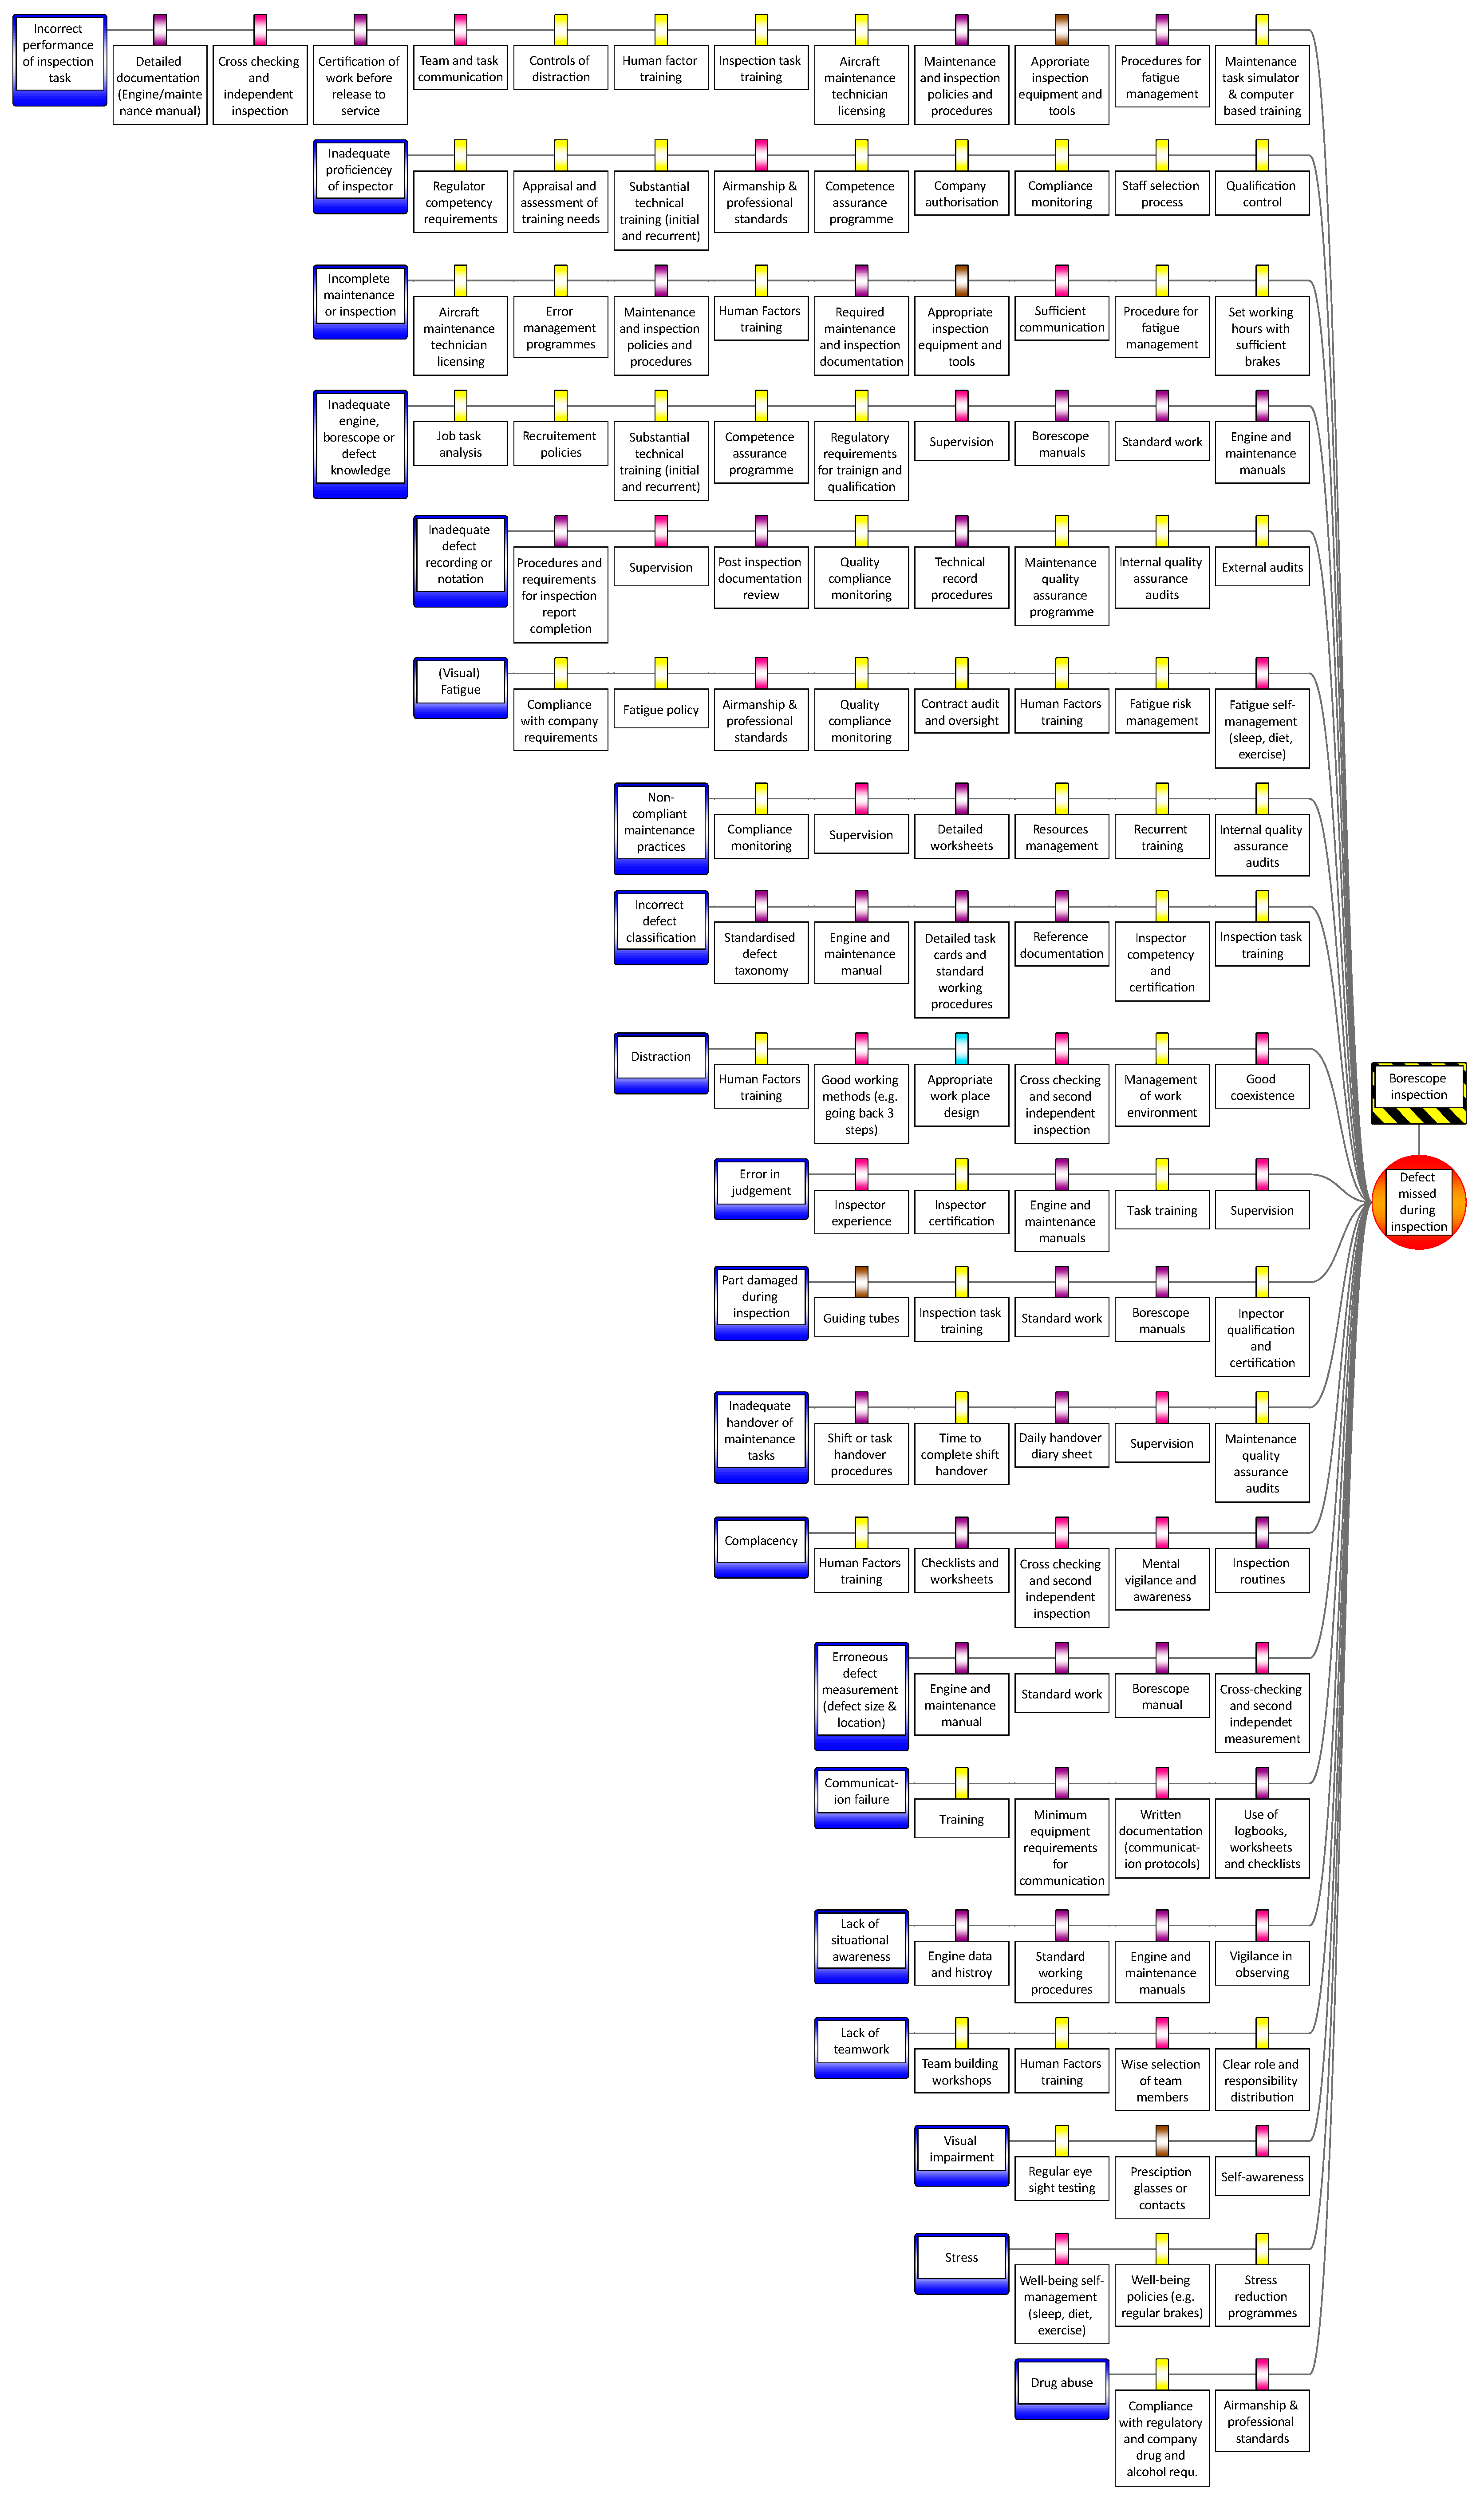
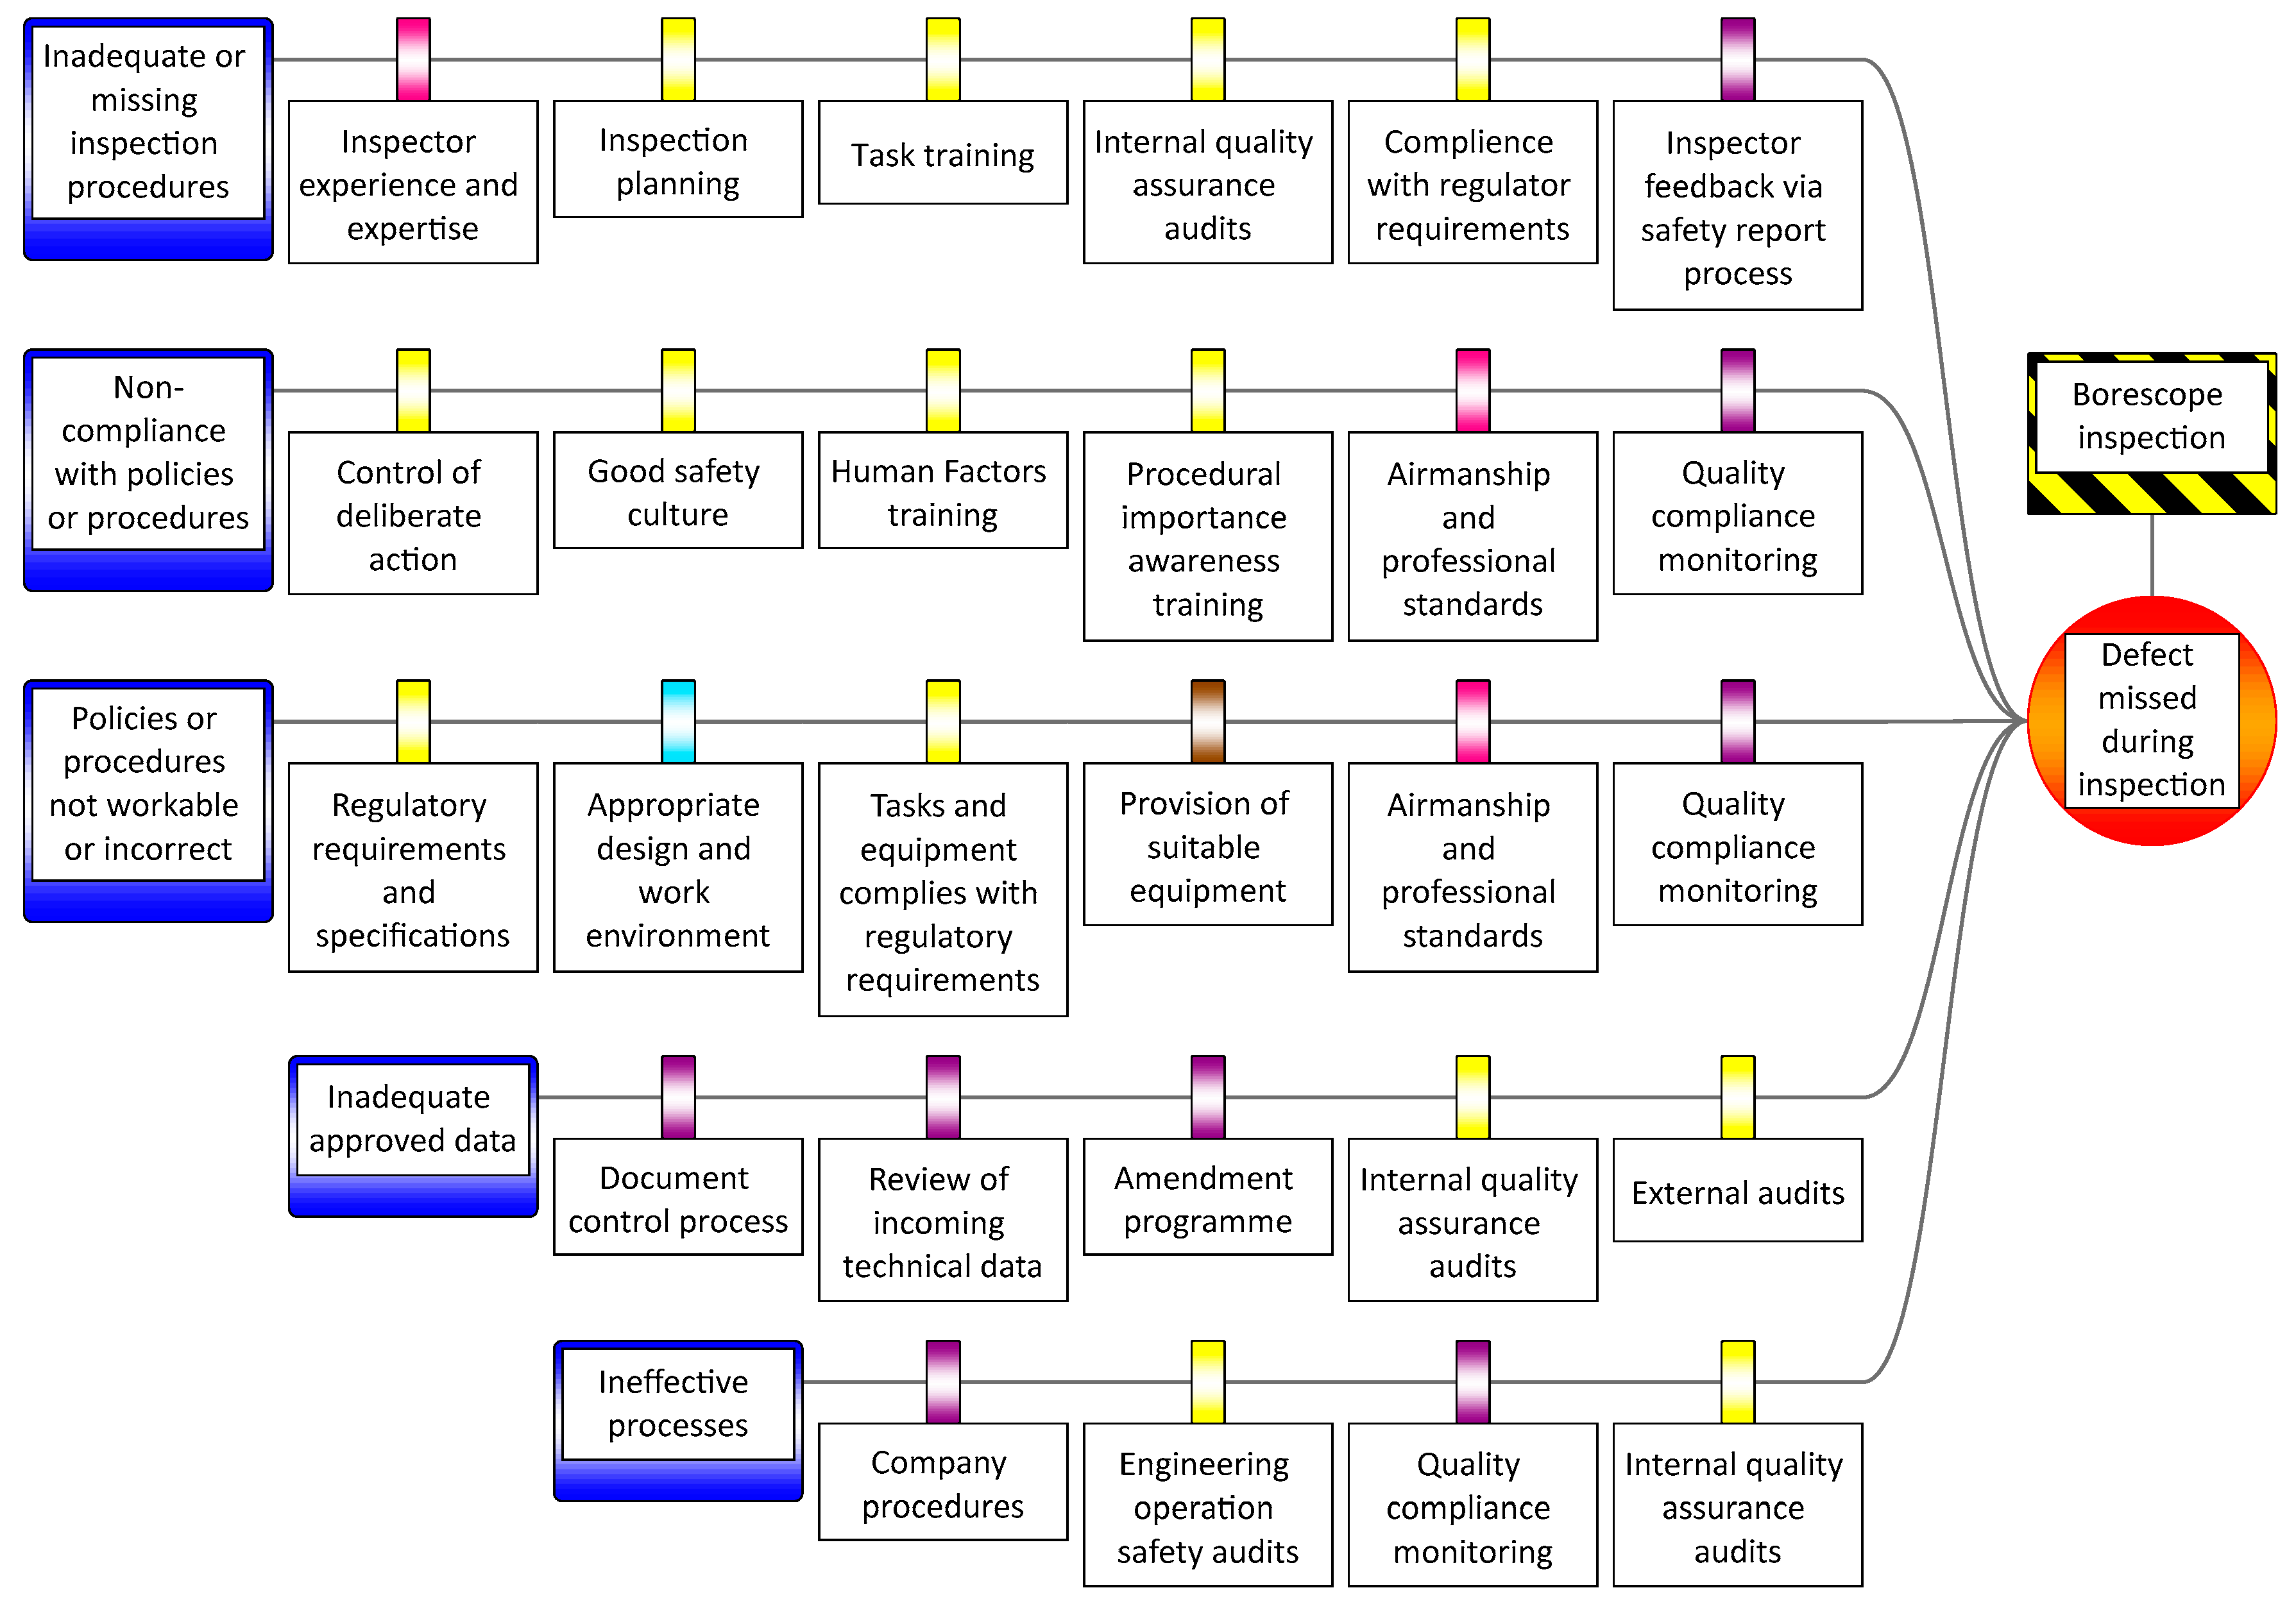
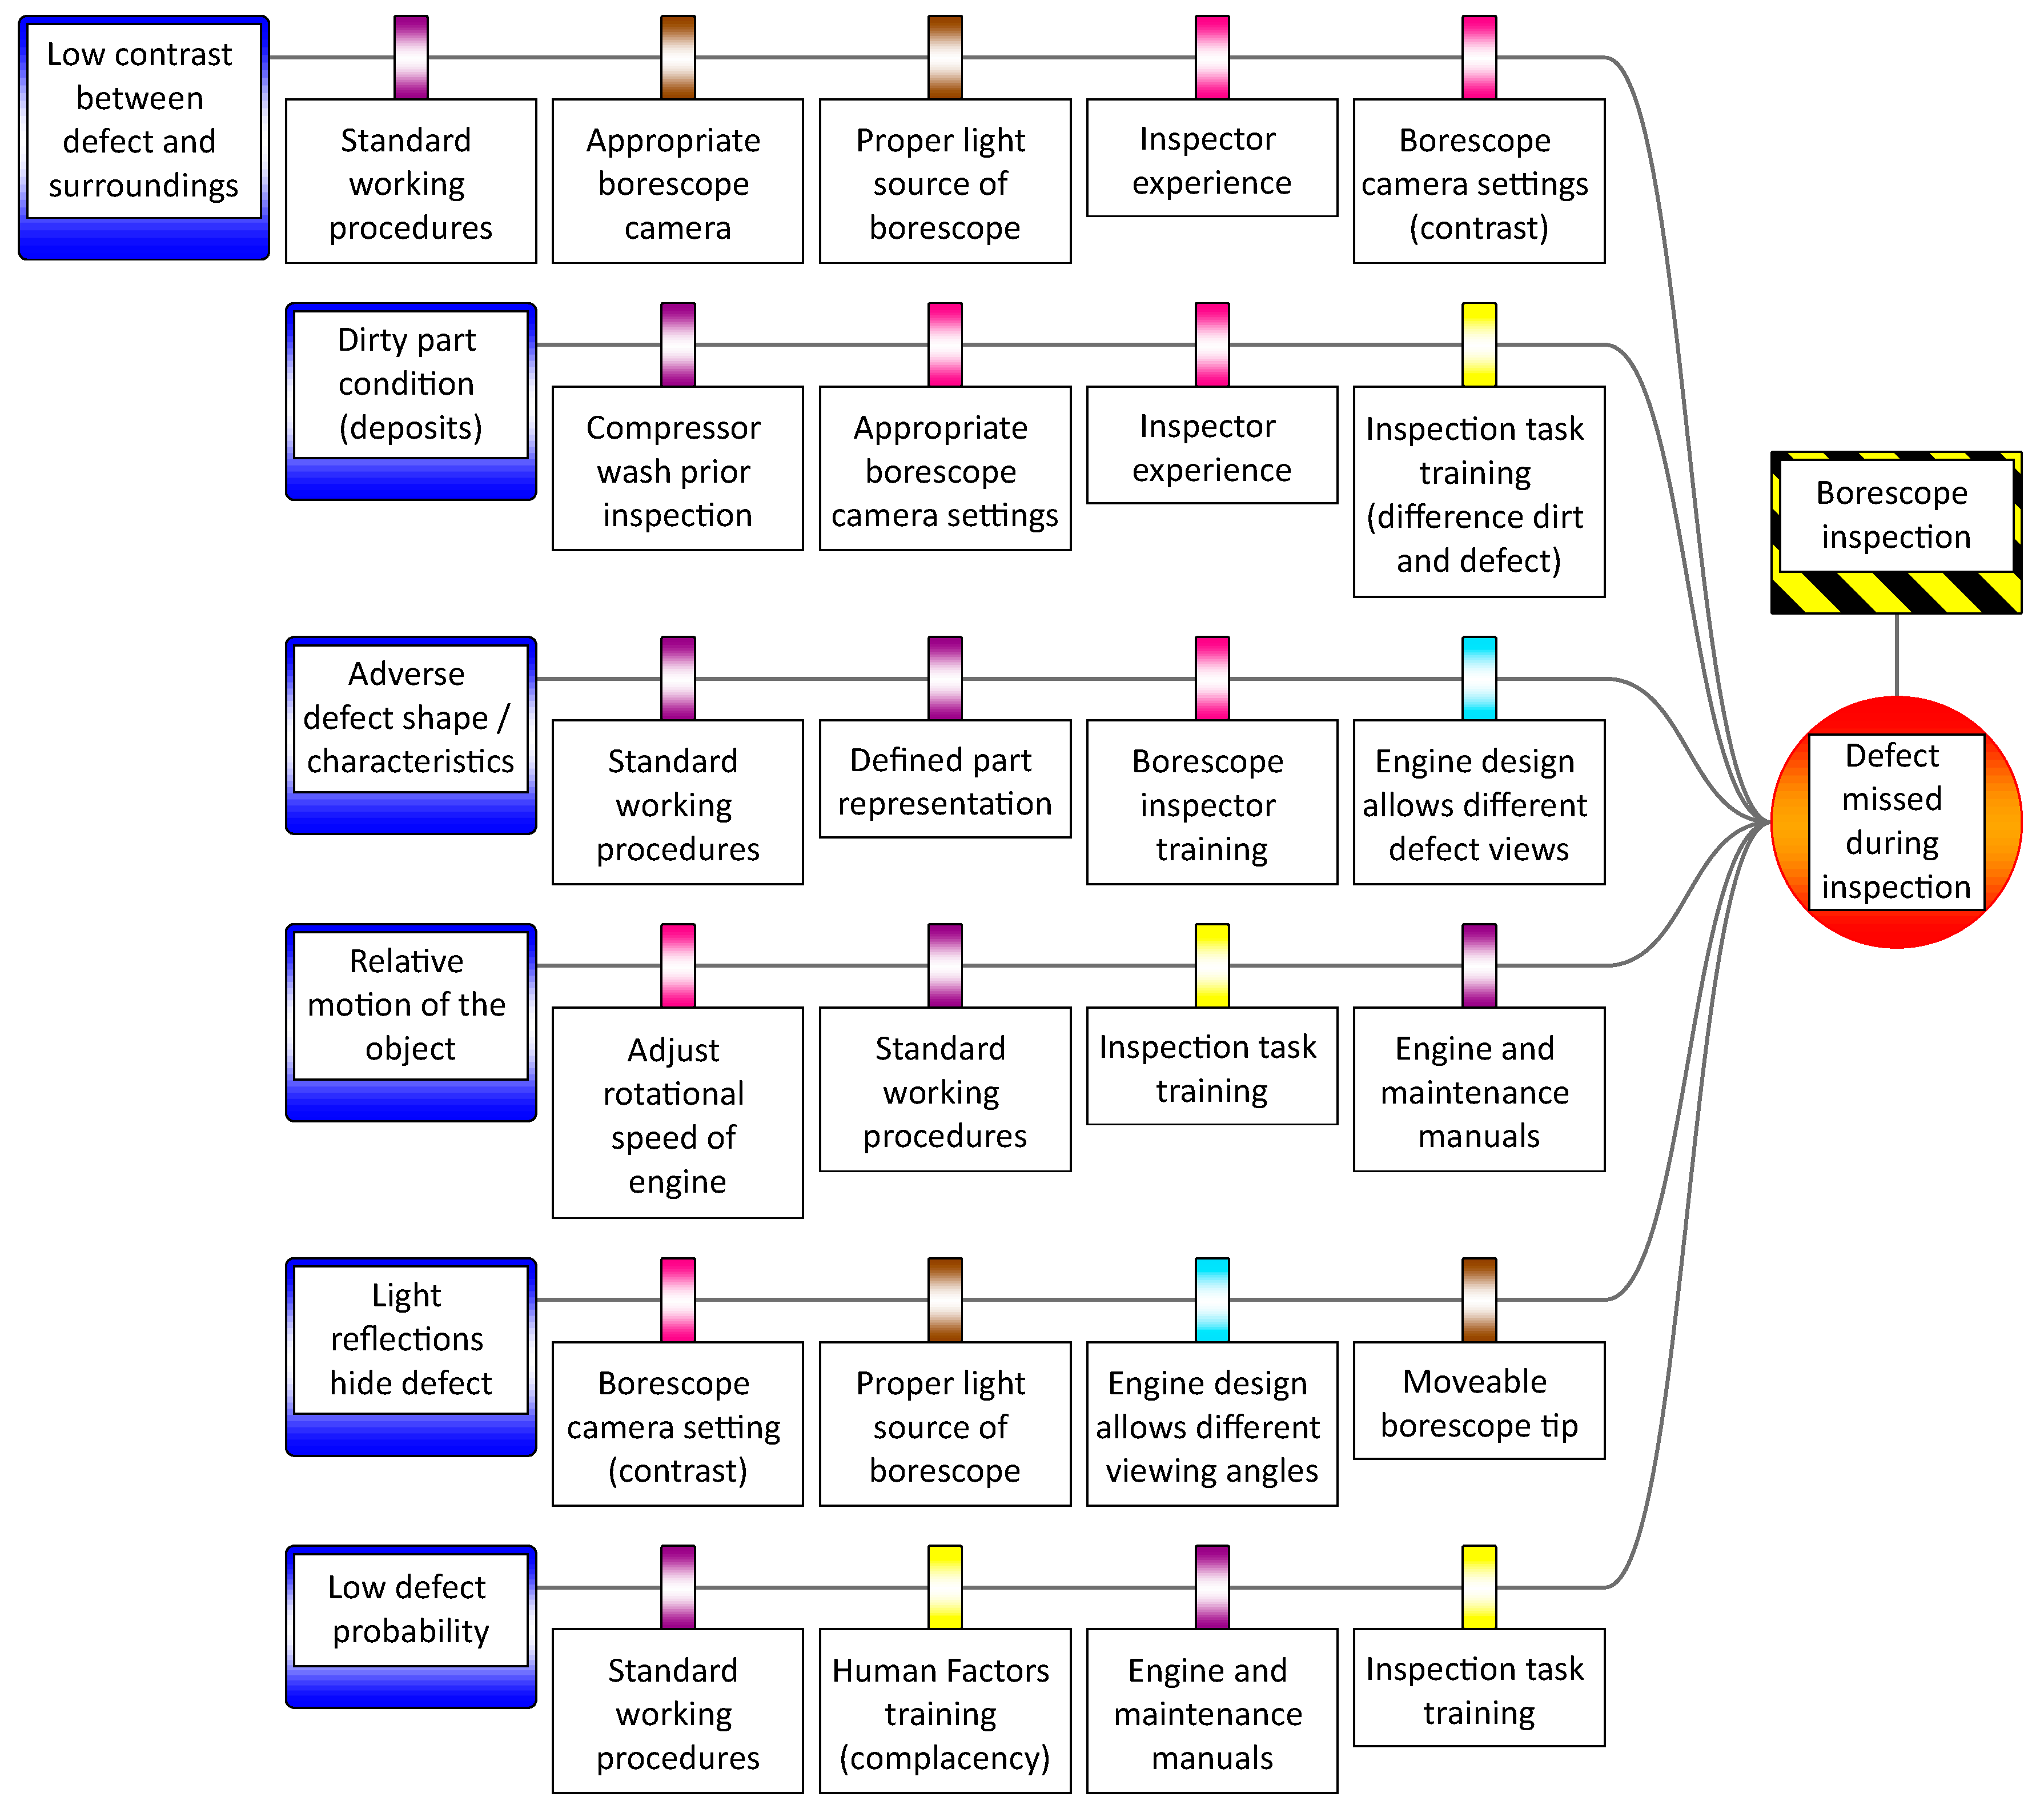
4.5. Barrier Structures Using 6M

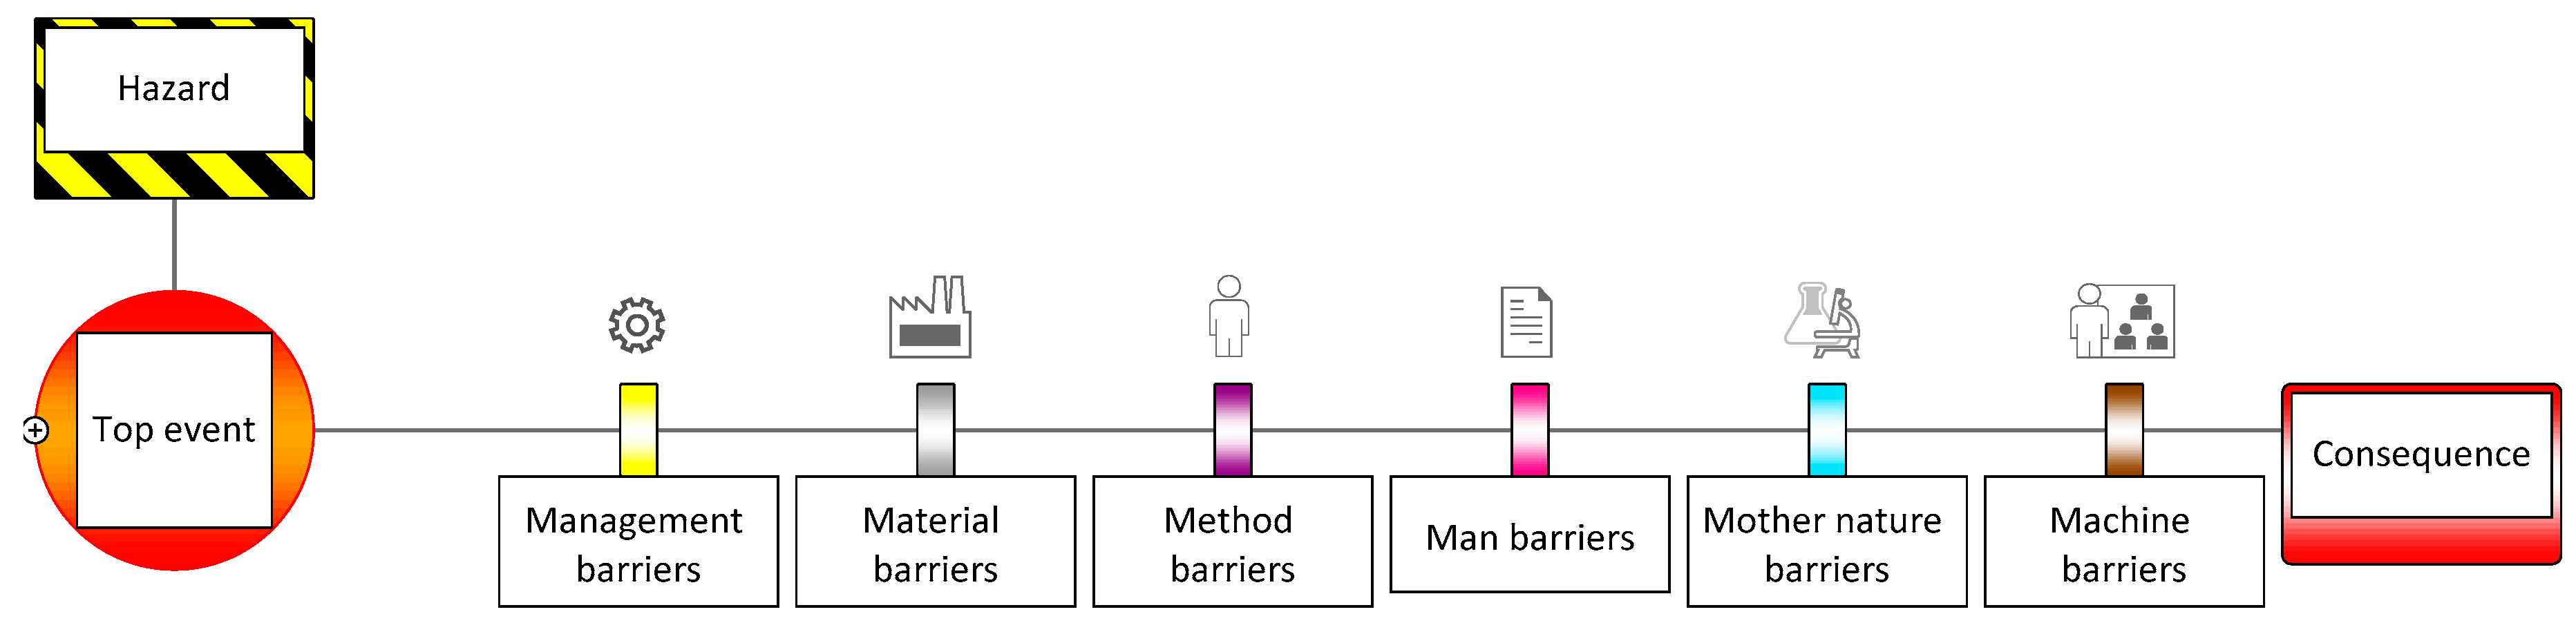
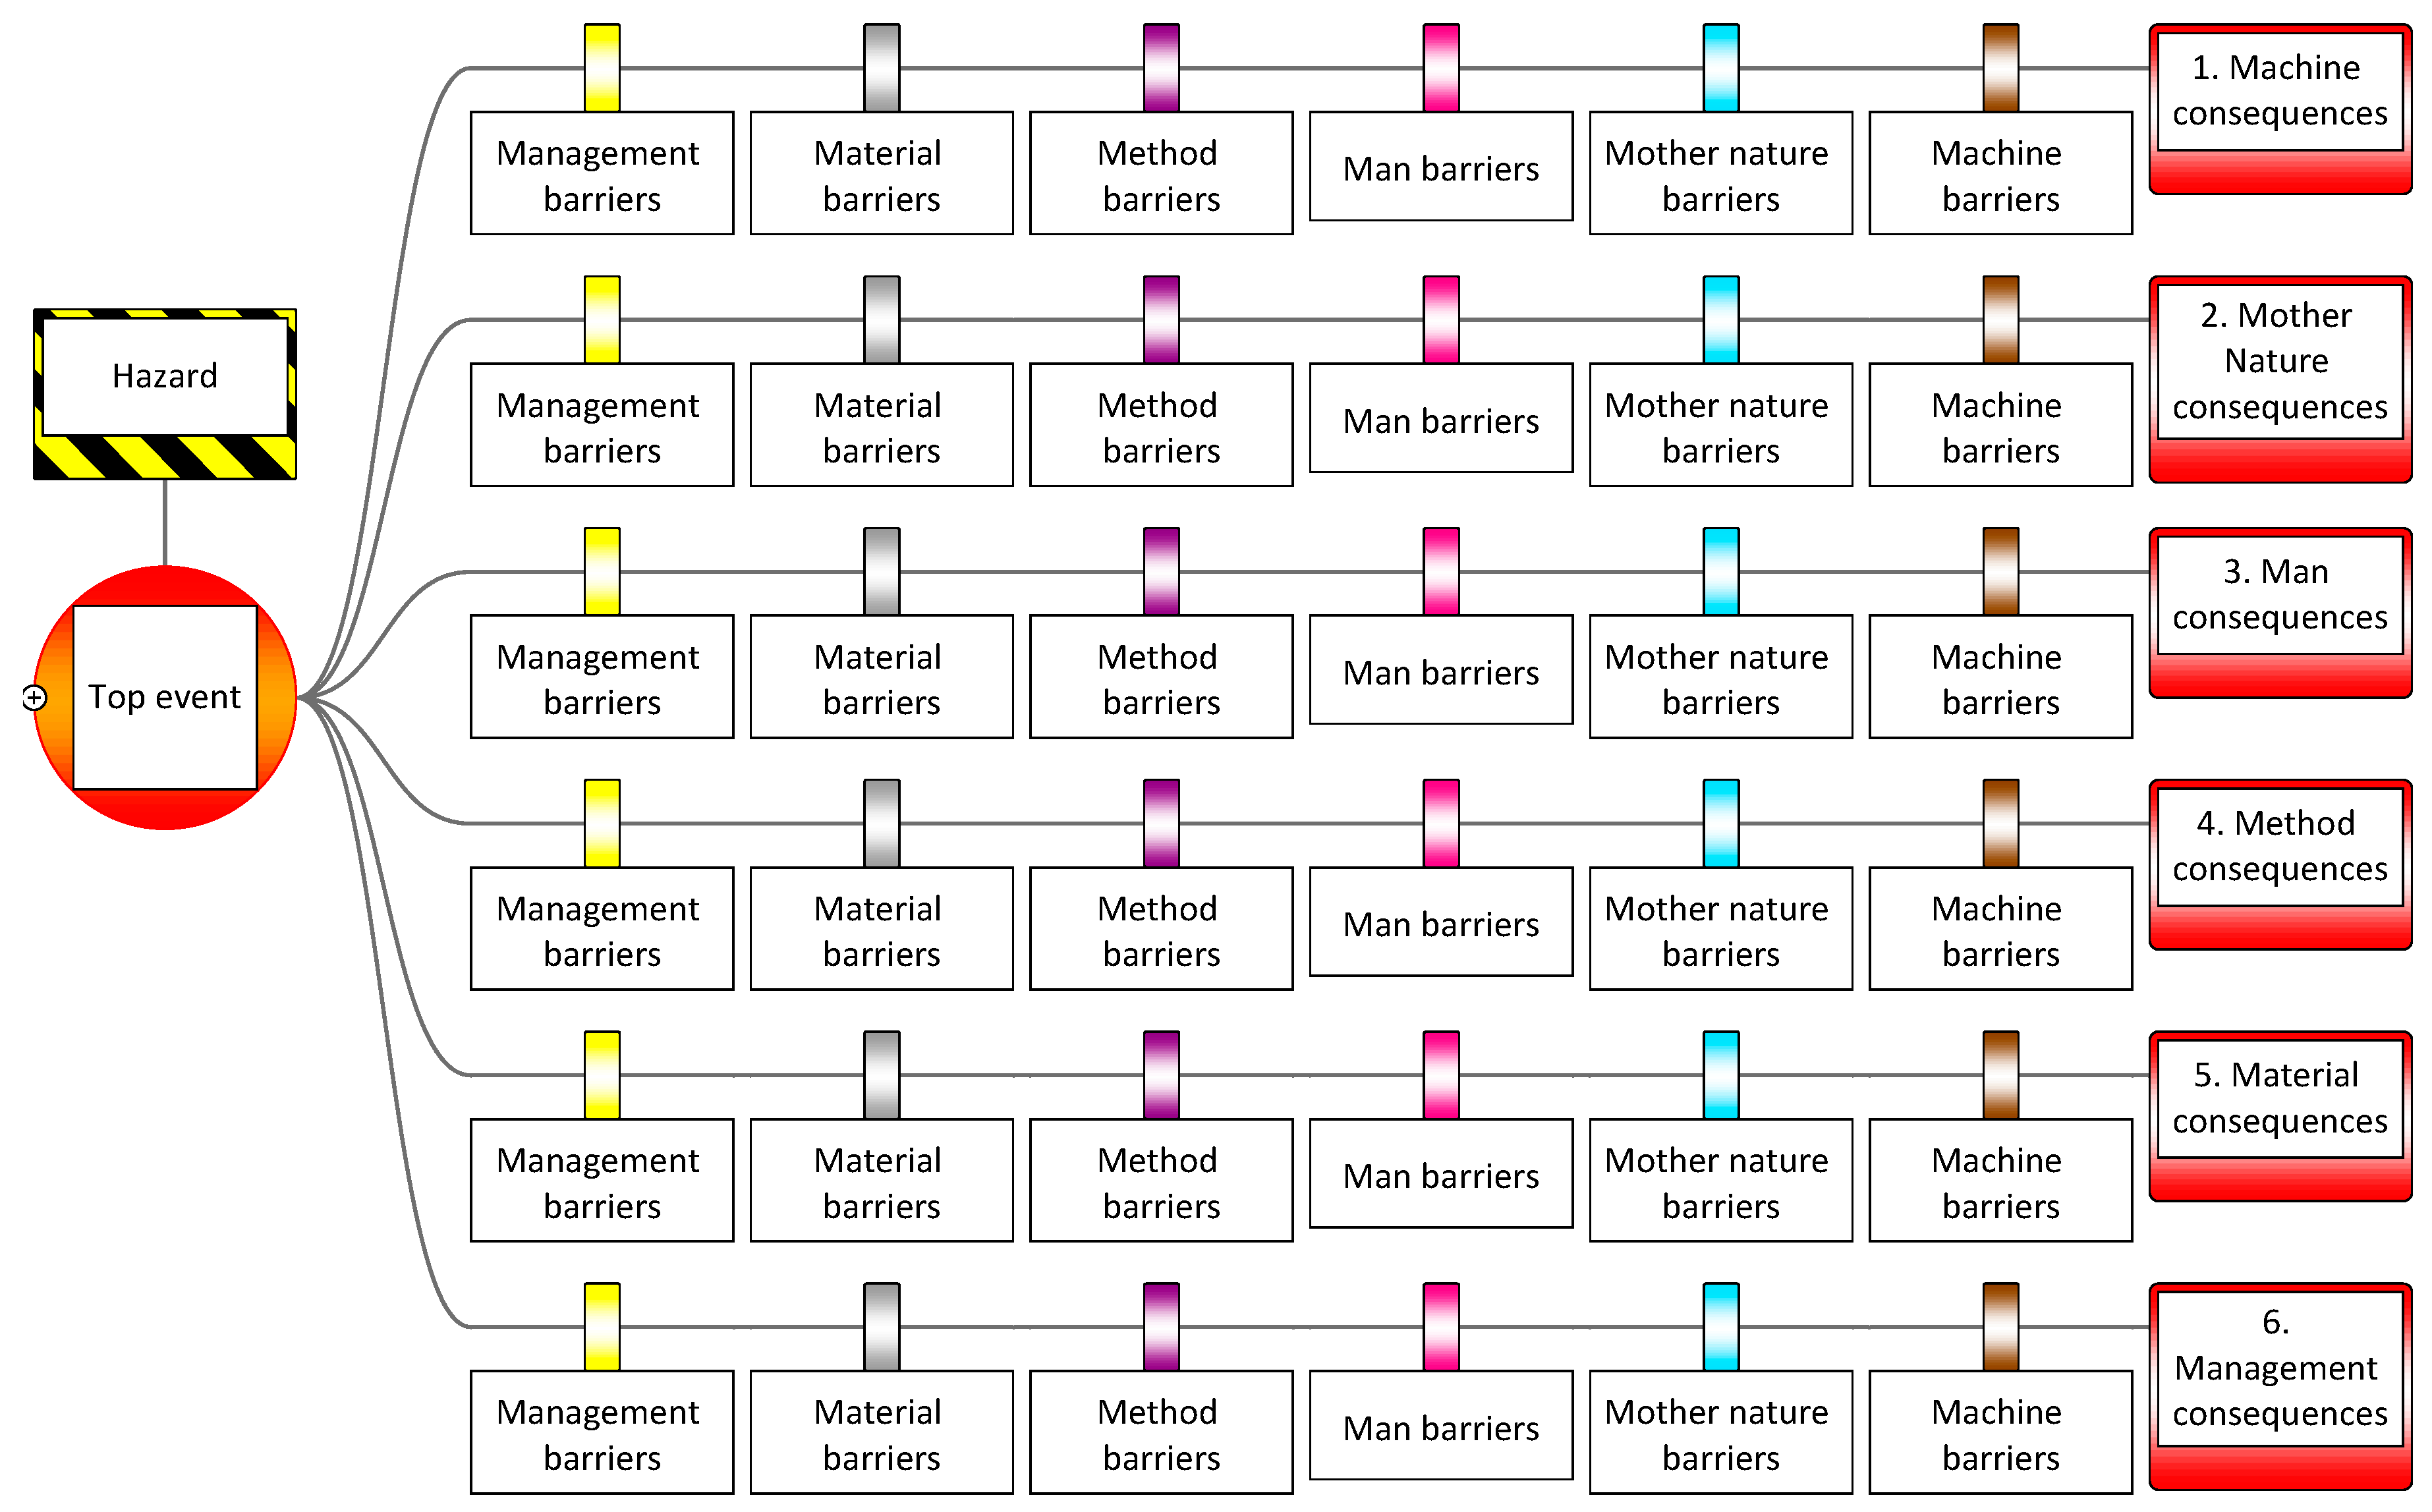
4.5.1. Generic 6M Barrier Structure

One limitation of Bowtie is that barriers are not presented in a time or process following manner [7]. This limitation, however, allows grouping the barriers based on their nature and following the 6M categorisation, without changing the overall Bowtie structure. Providing this 6M structure for barriers supports and structures the brainstorming sessions, which will remain an essential part of the element identification process. The framework is presented below—see Figure 7 and Figure 8—and shows one barrier per category. It should be noted that each of these barriers is a representation for all barriers of its type. There may be threat or consequence paths that have no barriers of one or more 6M categories, whereas they may have multiple barriers of another category. A description and example of each barrier category can be found in Table 5. For more barrier samples please refer to the case study below.

4.5.2. Colour Coding of Barriers

To support the core function of Bowtie, being a communication tool that is easy to understand, we propose colour coding the barriers by 6M category. The colour assignment was to some extent random and did not follow a particular scheme. In addition, each barrier should have a colour that has not been used before for any other element of the Bowtie diagram. The colour assignment of each M category is shown in Figure 7 and Figure 8. If greater emphasis is necessary, either to draw attention to specific categories, or to provide greater clarity for the visually impaired, additional demarcation could be added in the form of a symbol. Some suggested symbols are illustrated in Figure 7 and Figure 8 below, though it should be noted that these have been added manually as this is not currently a feature of the BowtieXP software used here. Alternatively, hatching may be added to the Bowtie elements.

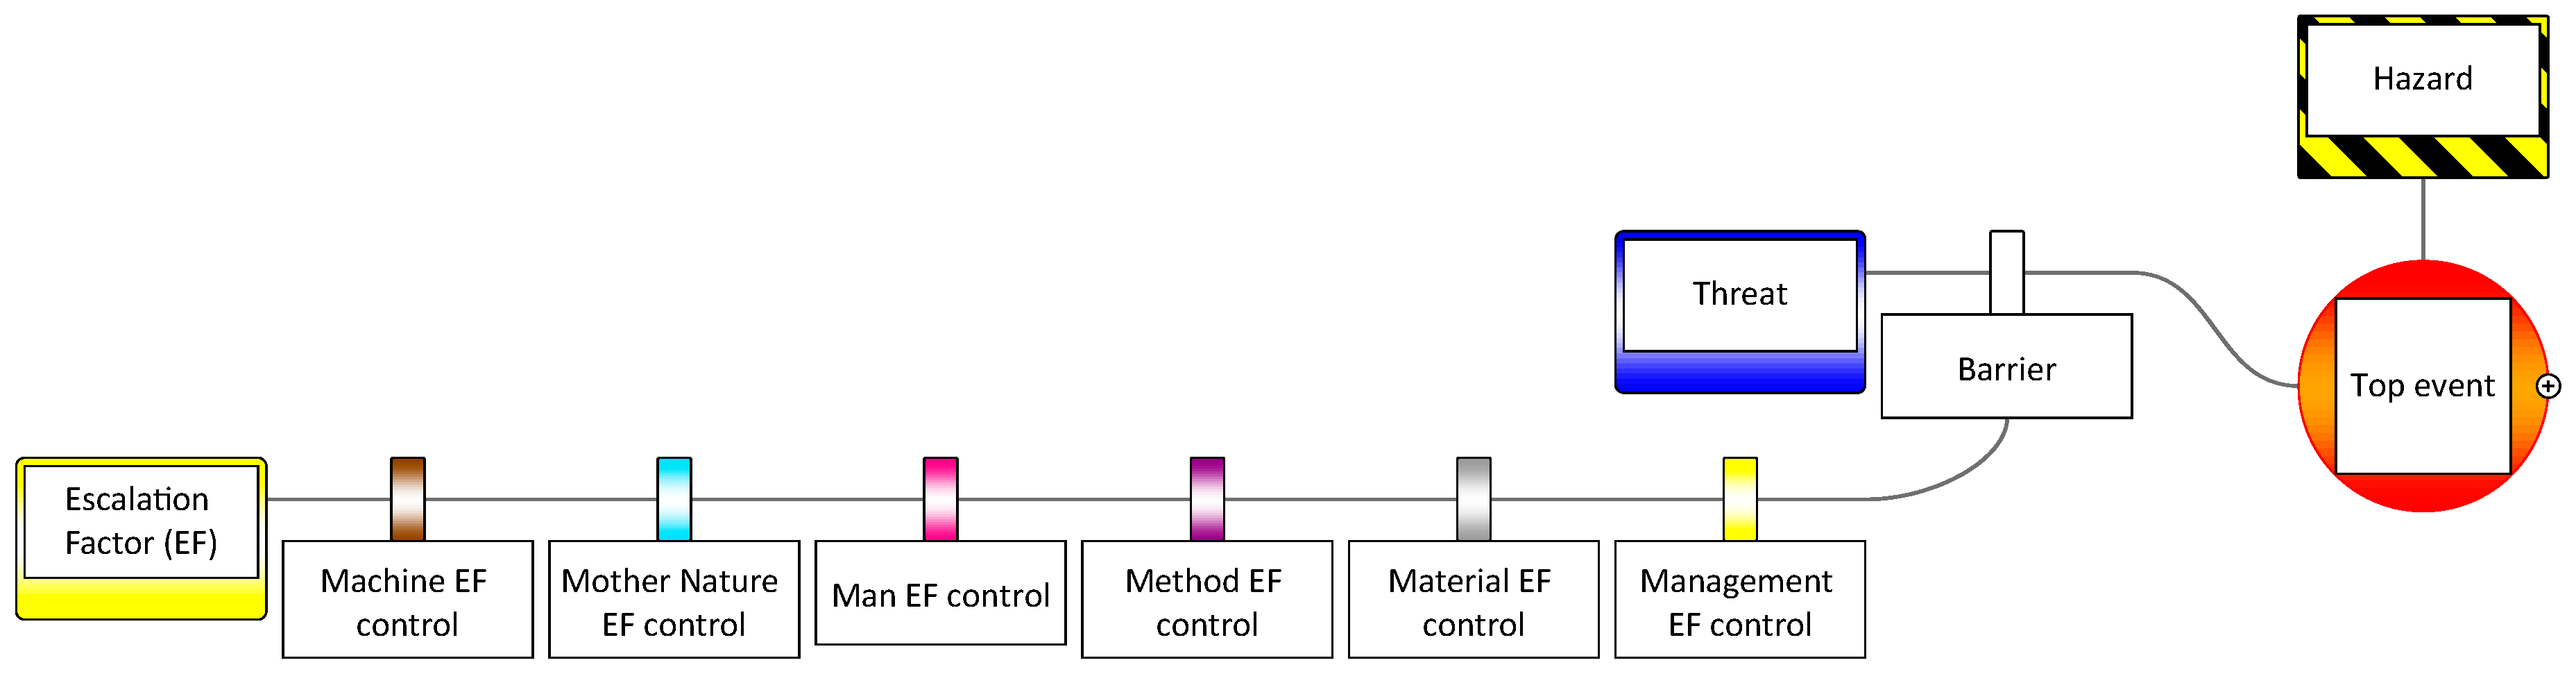
4.5.3. Escalation Factor Paths with a 6M Structure

In principle, the escalation factor path on the prevention and mitigation side of the Bowtie diagram could follow the same 6M structure as demonstrated for the threat and consequence path in Figure 7 and Figure 8. The result would look like Figure 9. After the higher-level structure of the Bowtie has been completed, it may in some situations be necessary to extend the analysis to the escalation factors, and in this case, the methodology proposed here offers a way this may be approached.

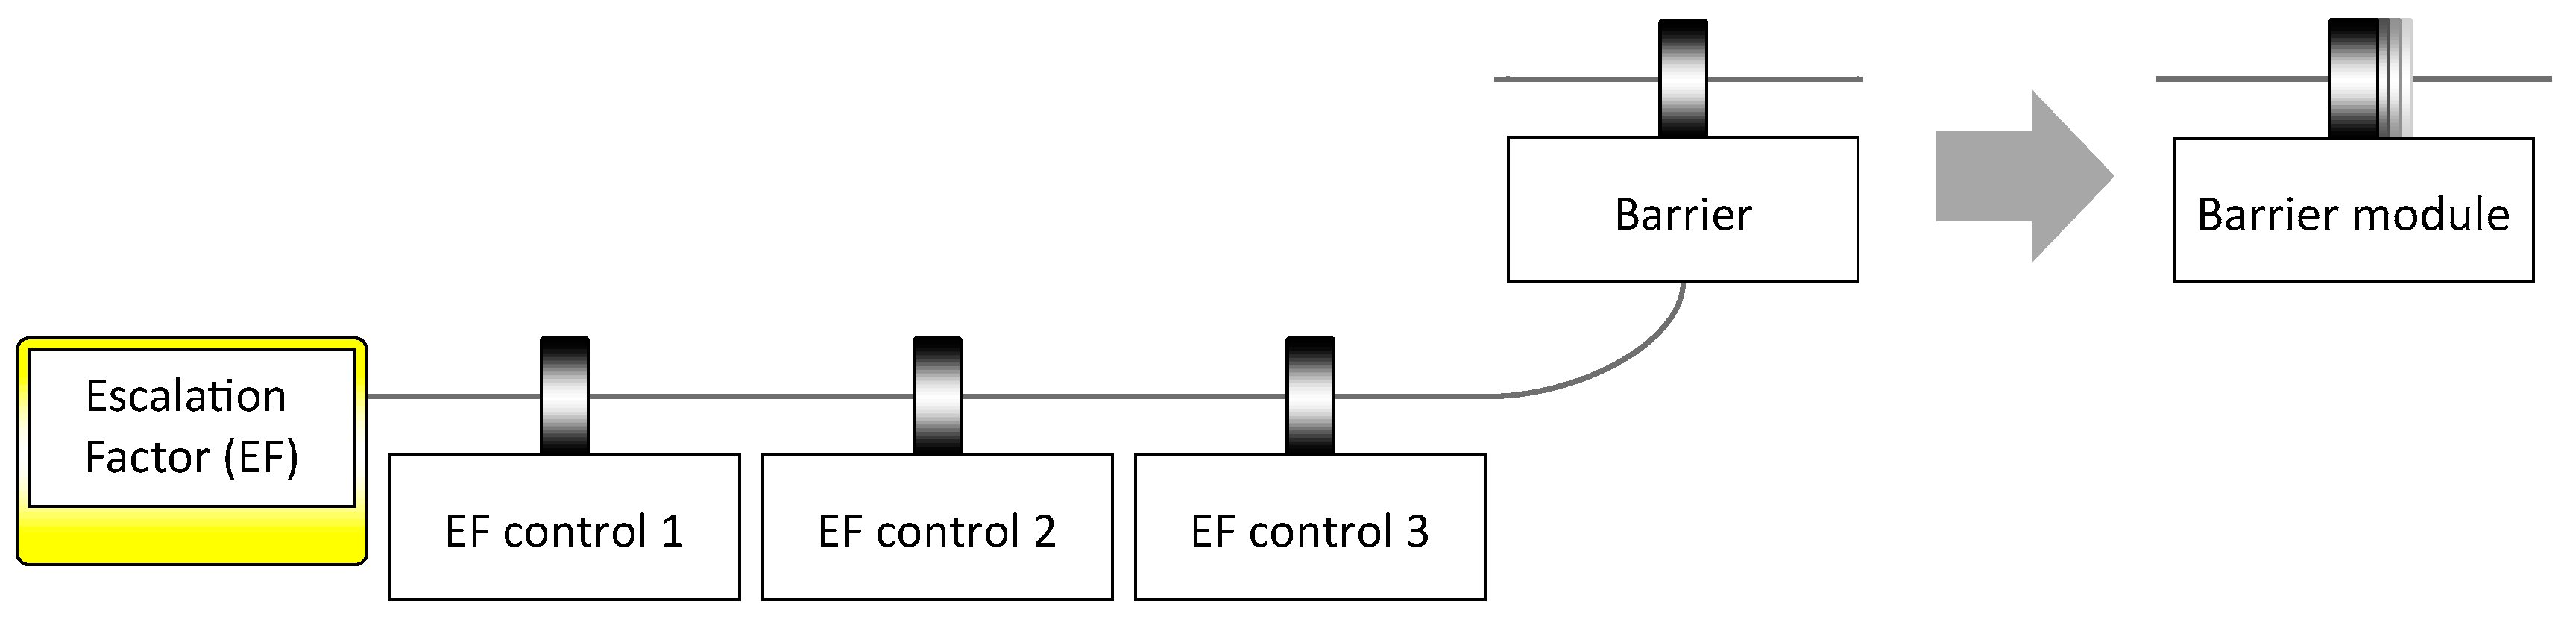
4.5.4. Barrier Modules

Since barriers repeat themselves multiple times along the Bowtie, we propose defining “barrier modules”. This has the potential of making the Bowtie development process more time efficient since not every barrier with its entire escalation factor and escalation factor control path has to be repeated. Furthermore, it tidies up the diagram without diminishing comprehensiveness. A visualisation of the barrier module is presented in Figure 10.
When introducing barrier modules, one limitation might be that all barriers are expected to have the same efficiency. Some barriers (modules) might be repeated because they are of the same nature; their effectiveness in regards to the threat, however, might be different. For example, when considering ‘fire’ being the threat, the extent of the fire might vary significantly, e.g., a burning candleholder, a house fire or a wildland fire. In each case, a fire-extinguishing agent would be a barrier. However, for the small fire, a handheld fire extinguisher might be sufficient, while for a house fire, a fire truck is the right level of prevention, and for a wildland fire, an extinguishing plane may be required. This limitation must be considered when using barrier modules.

4.6. Full Bowtie with a 6M Structure

Combining the 6M structure for threats and consequences from Section 4.4.3, the 6M structure for barriers from Section 4.5.1, and the colour-coding scheme from Section 4.5.2, results in a 6M × 6M matrix structure on both sides of the Bowtie diagram. The full Bowtie structure is shown in Appendix A. For better legibility, both sides of the diagram are presented individually in Figure 11 and Figure 12.

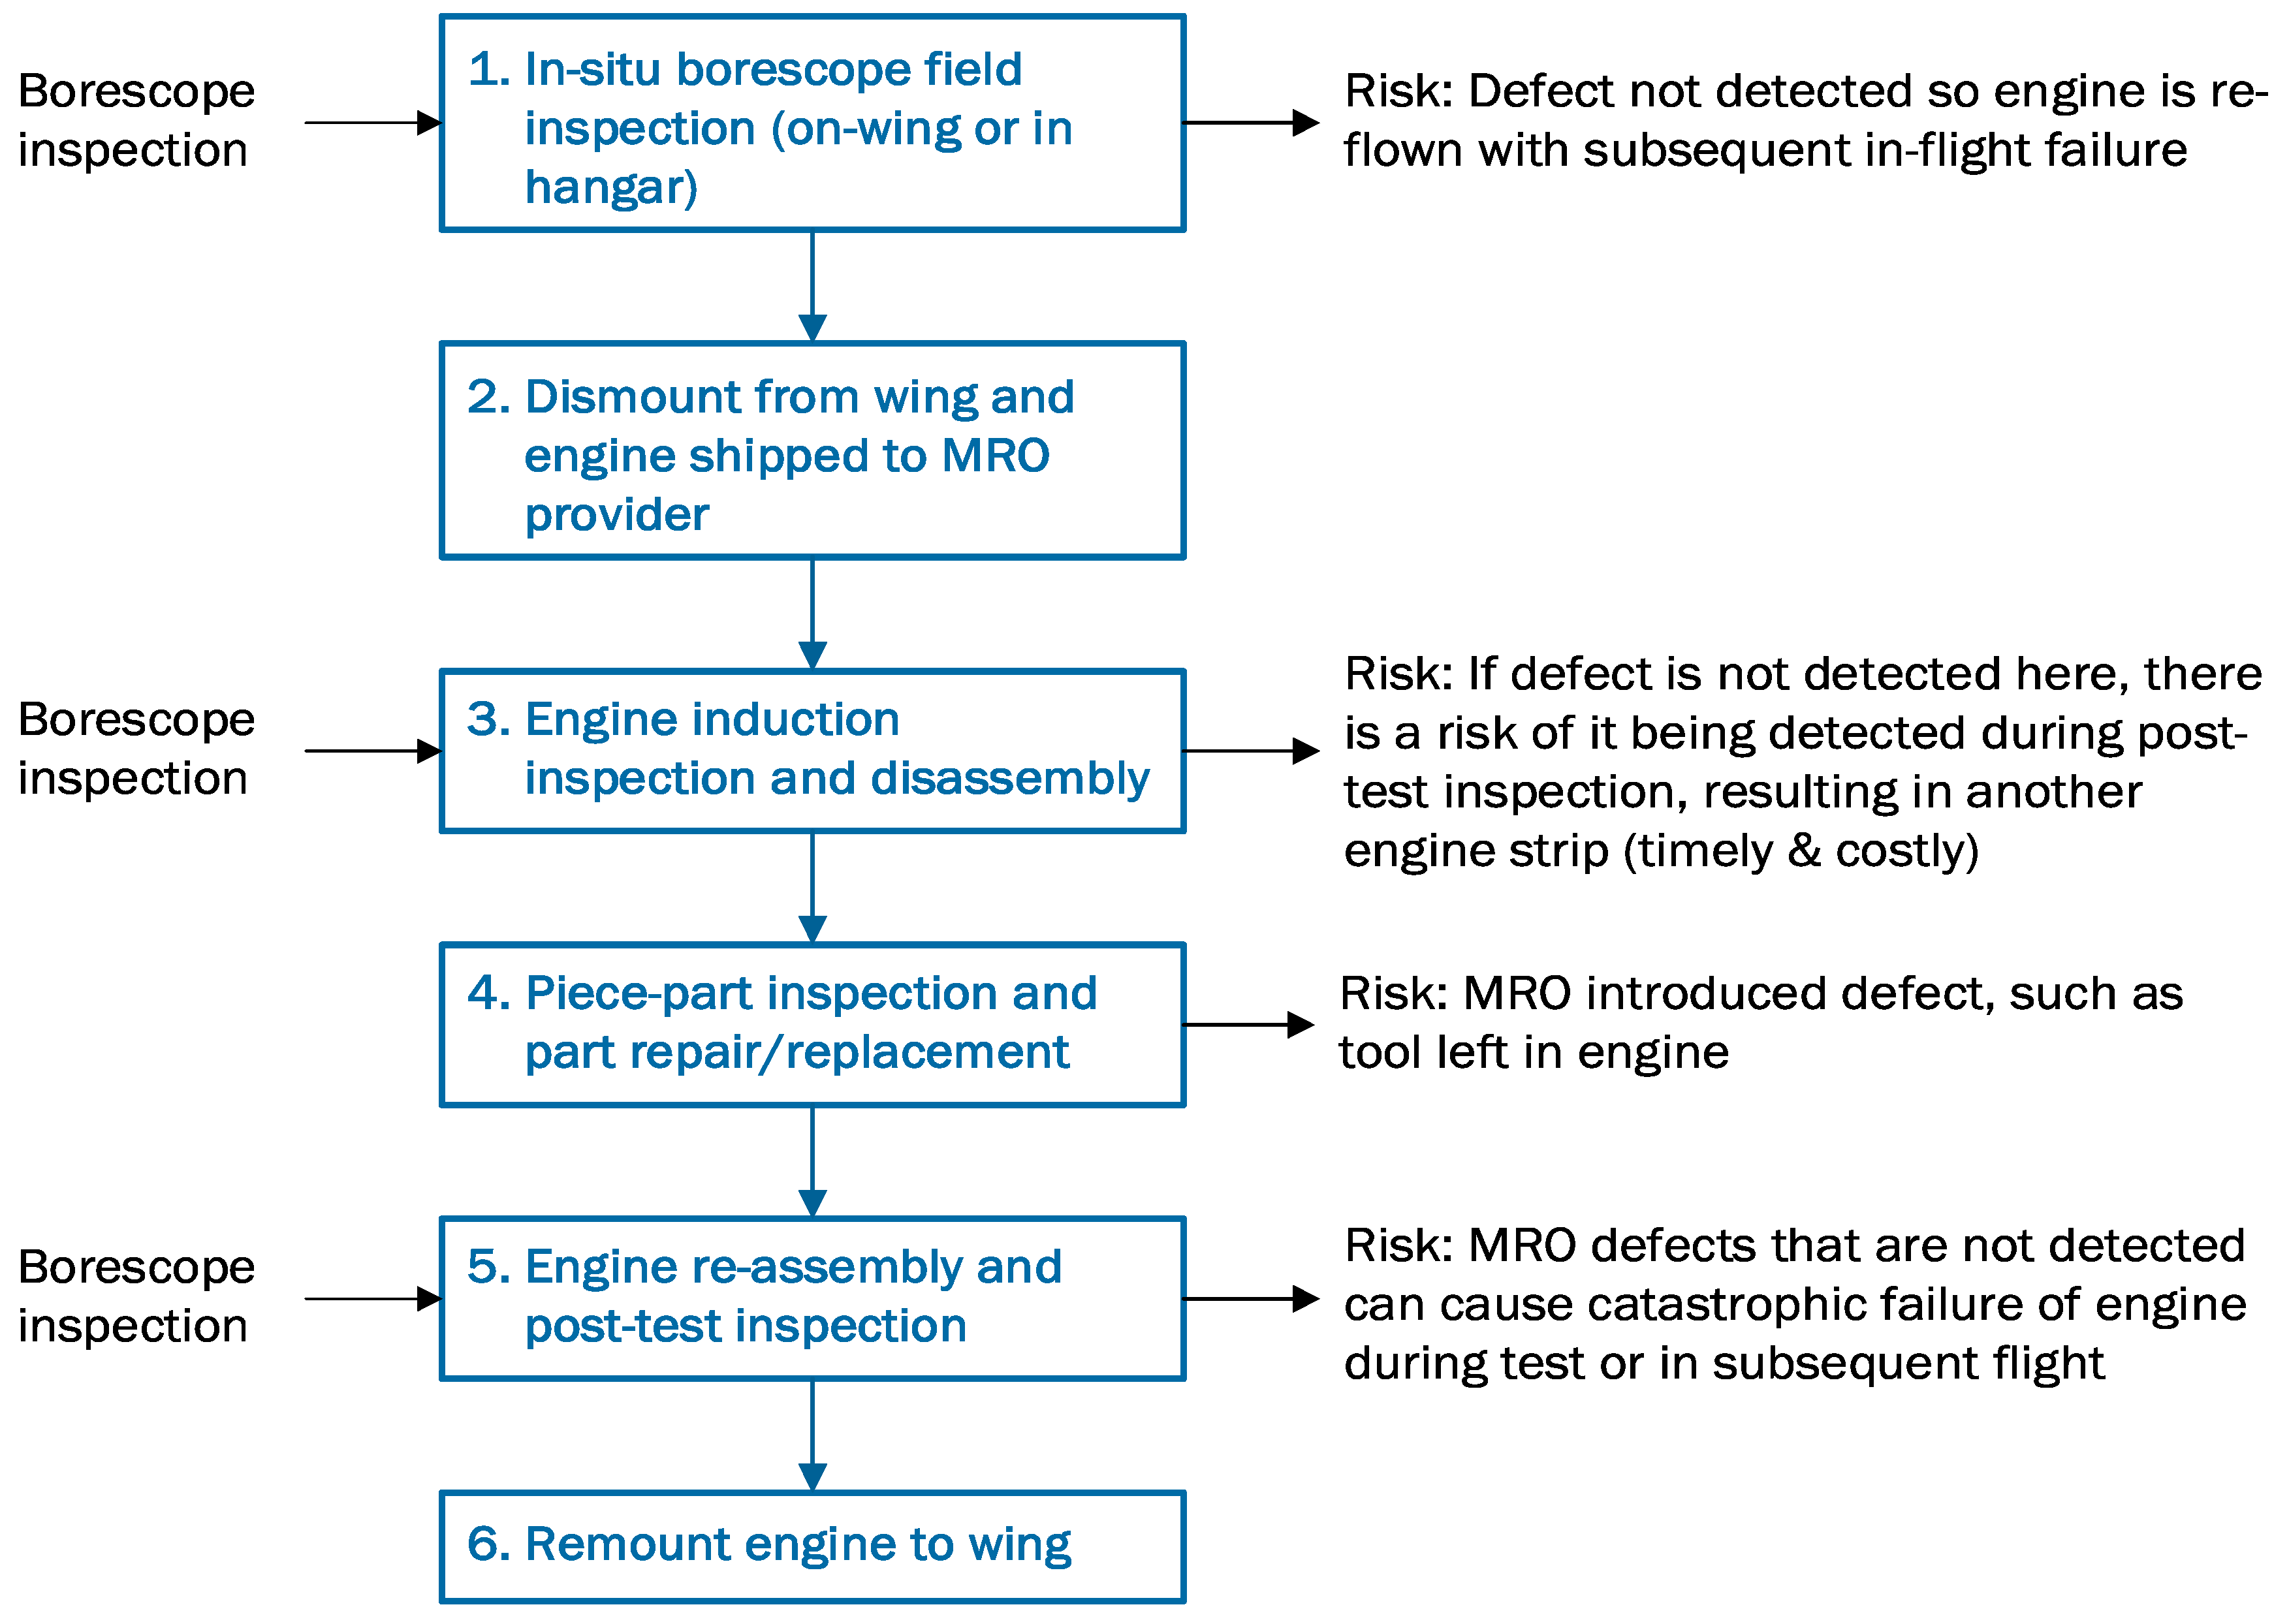
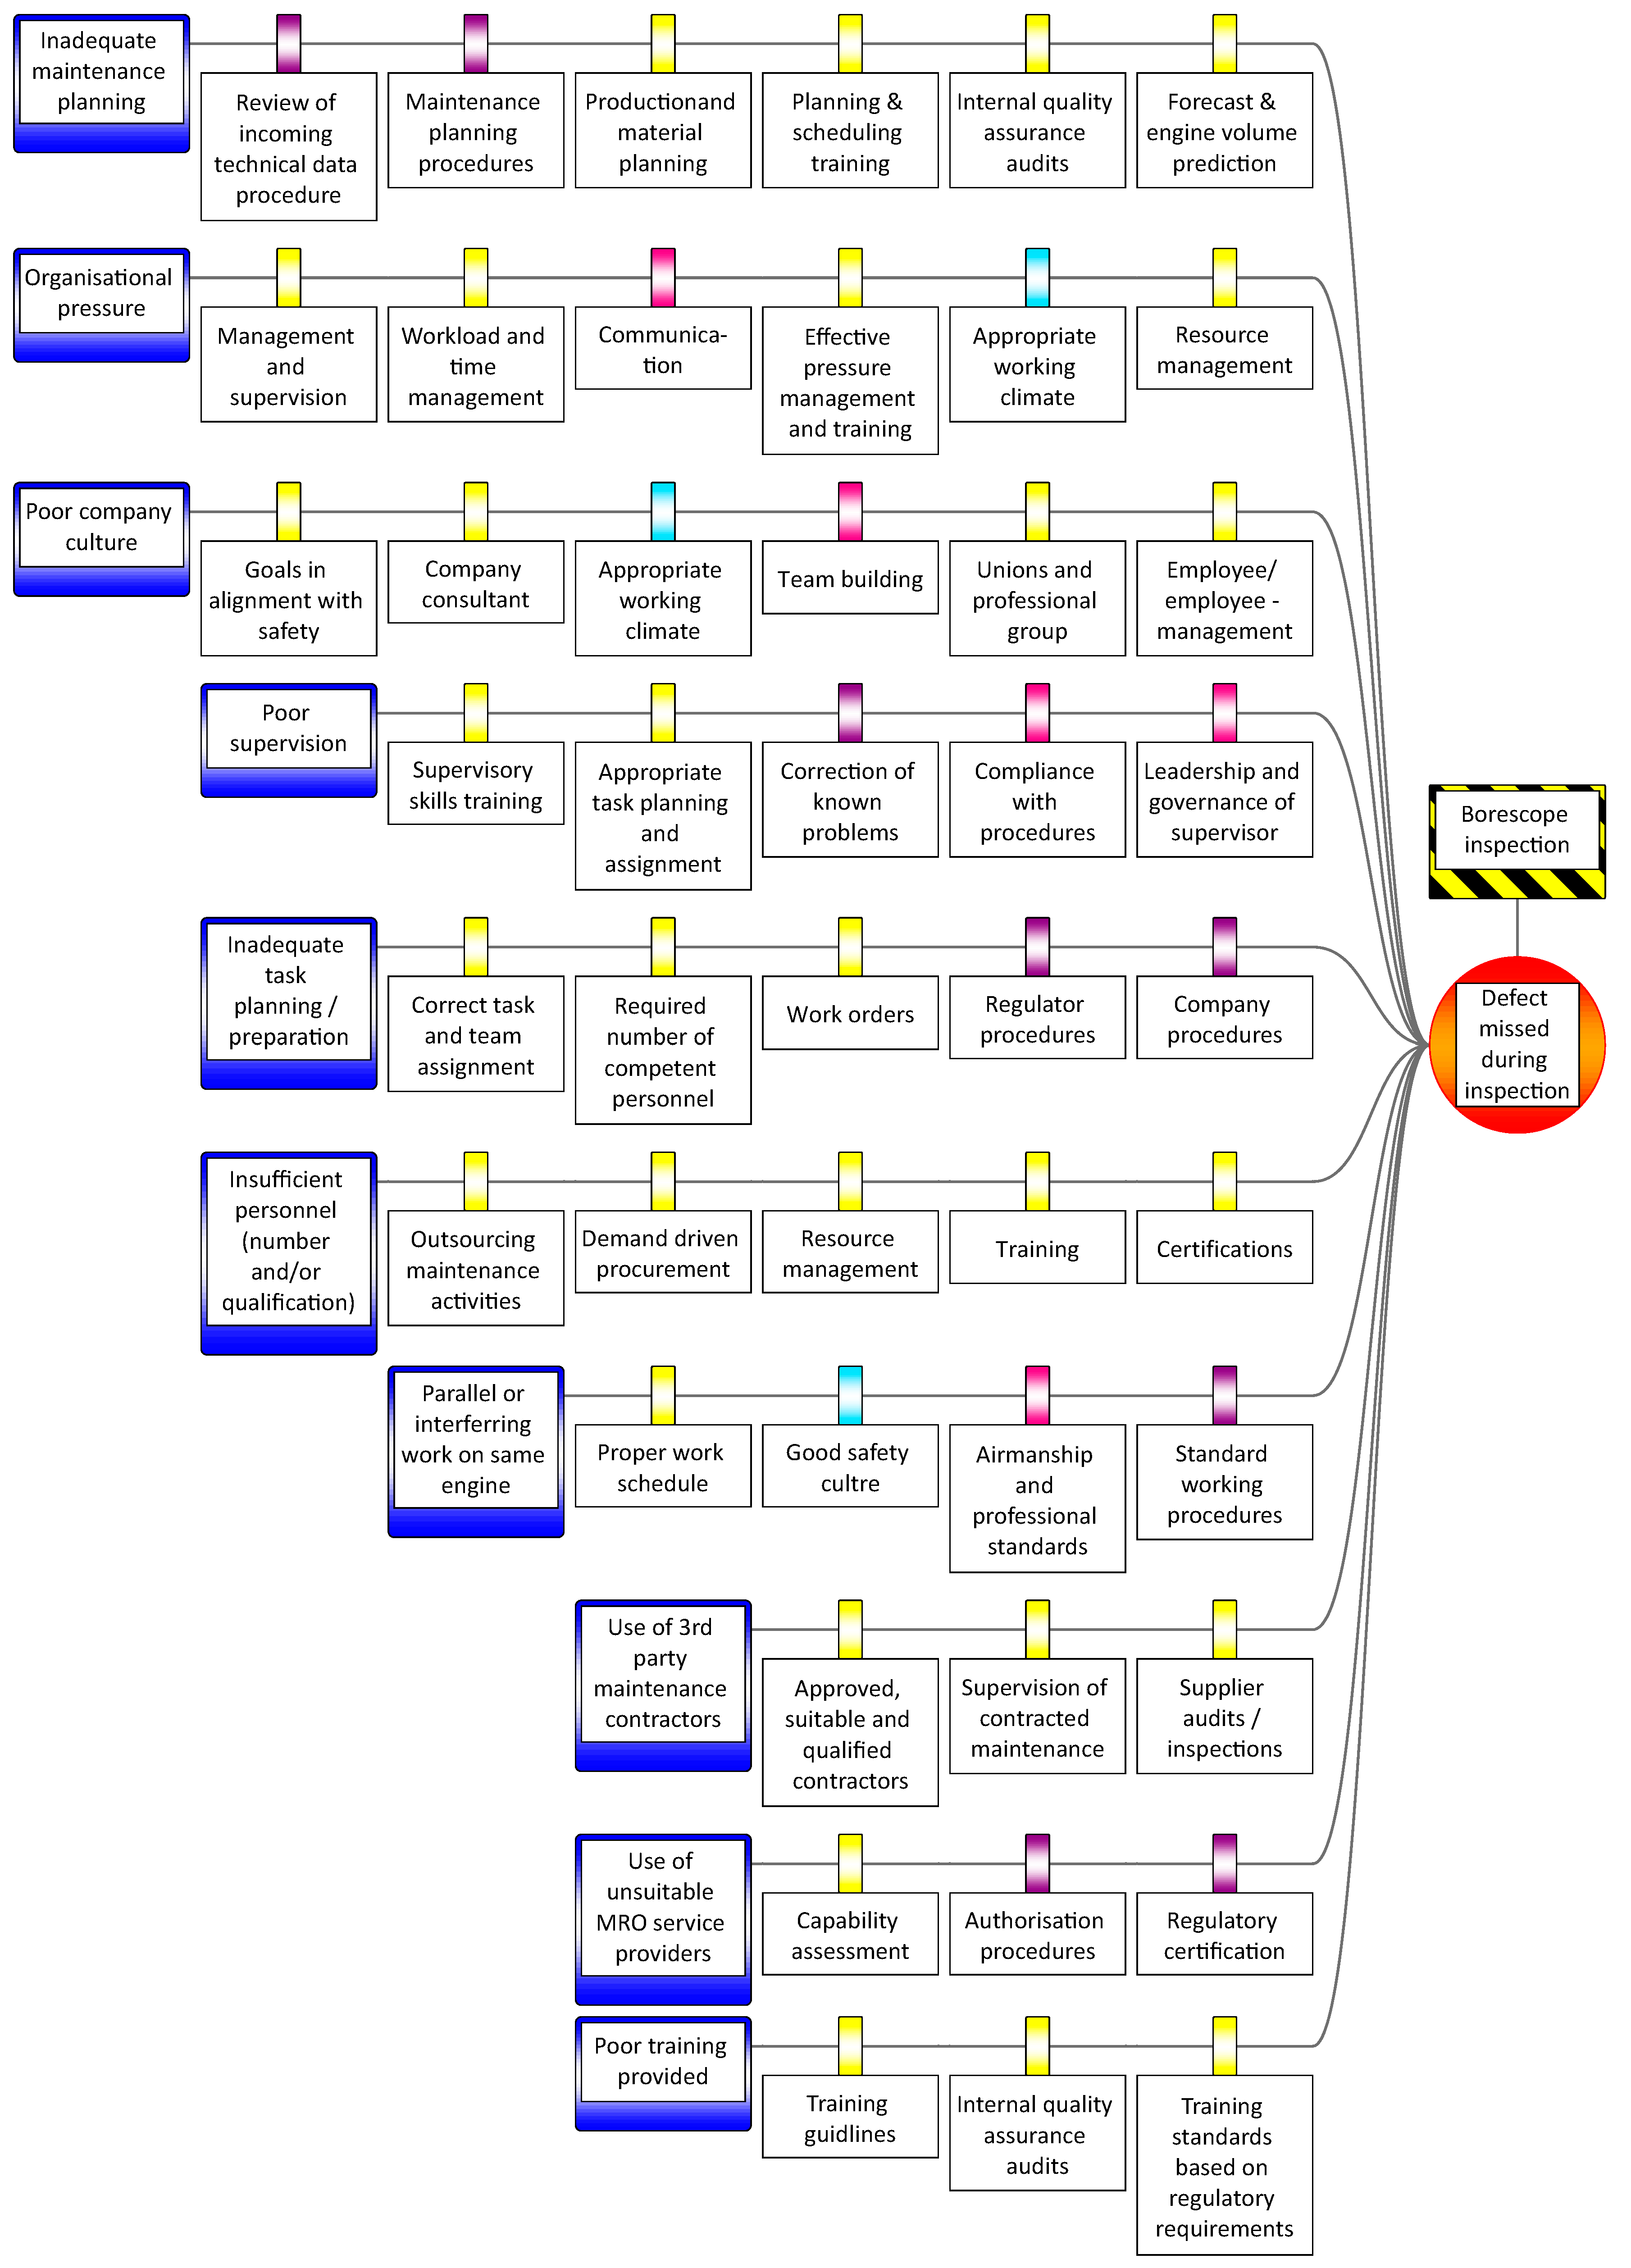
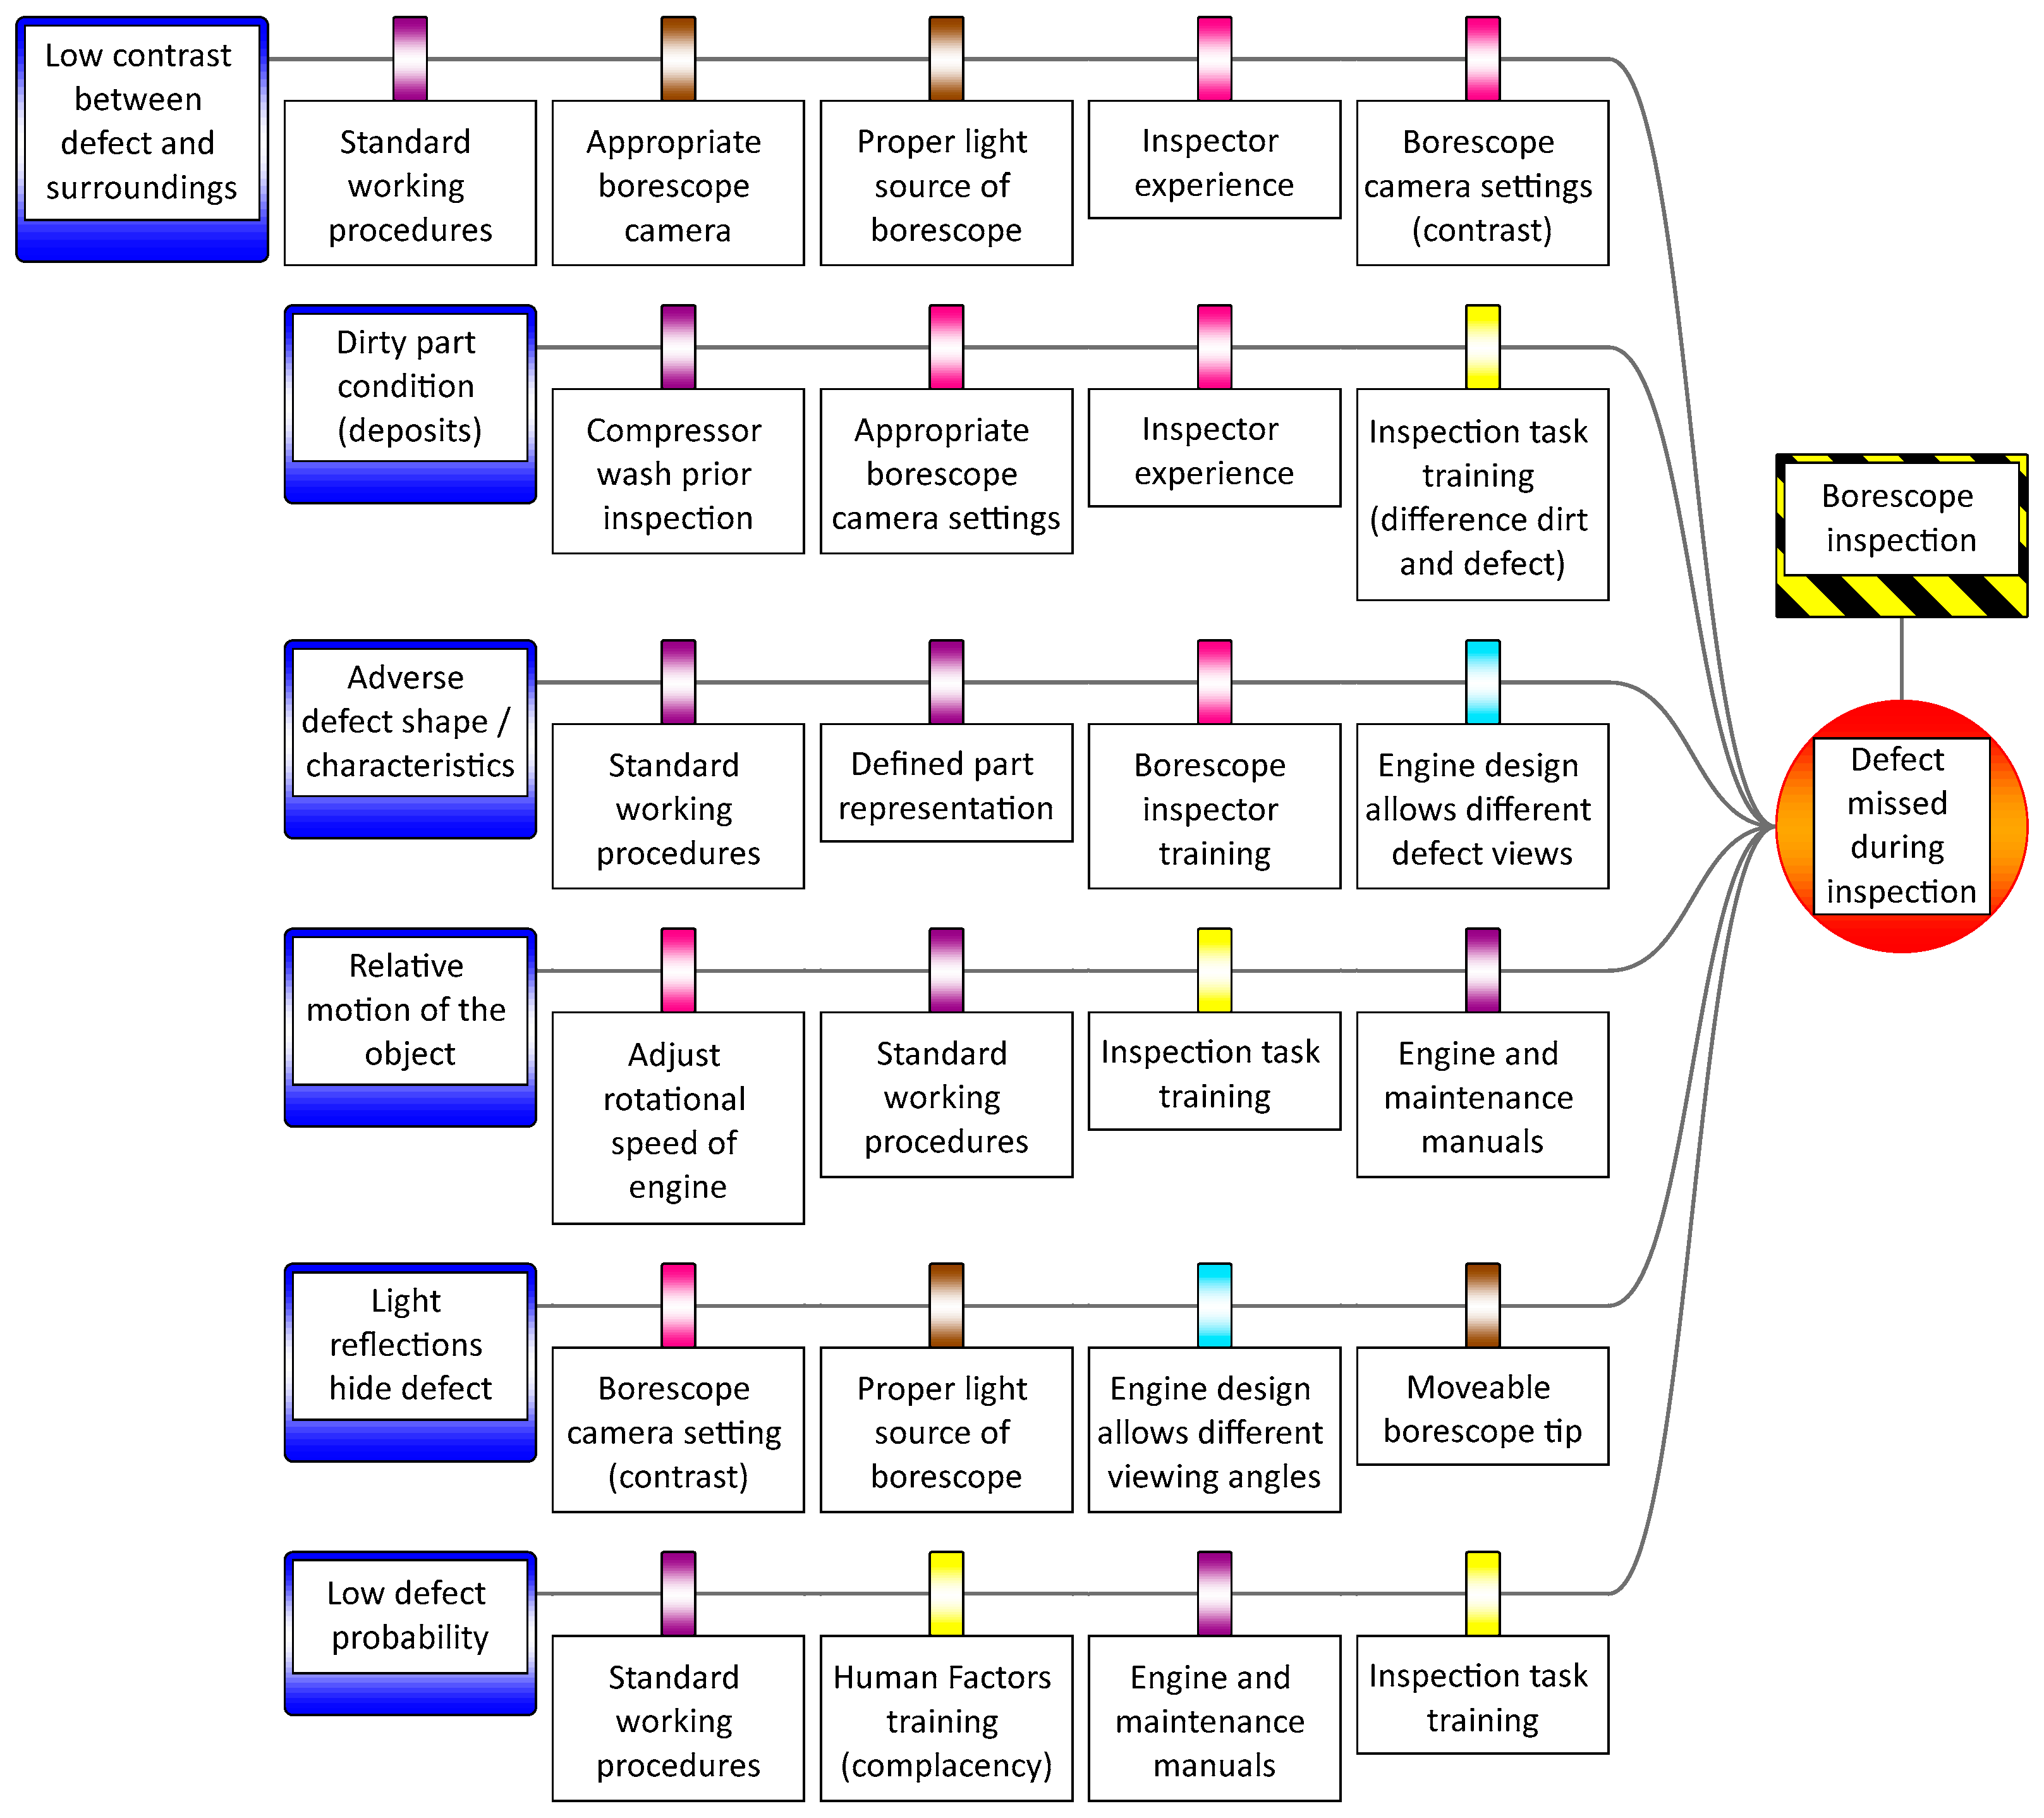
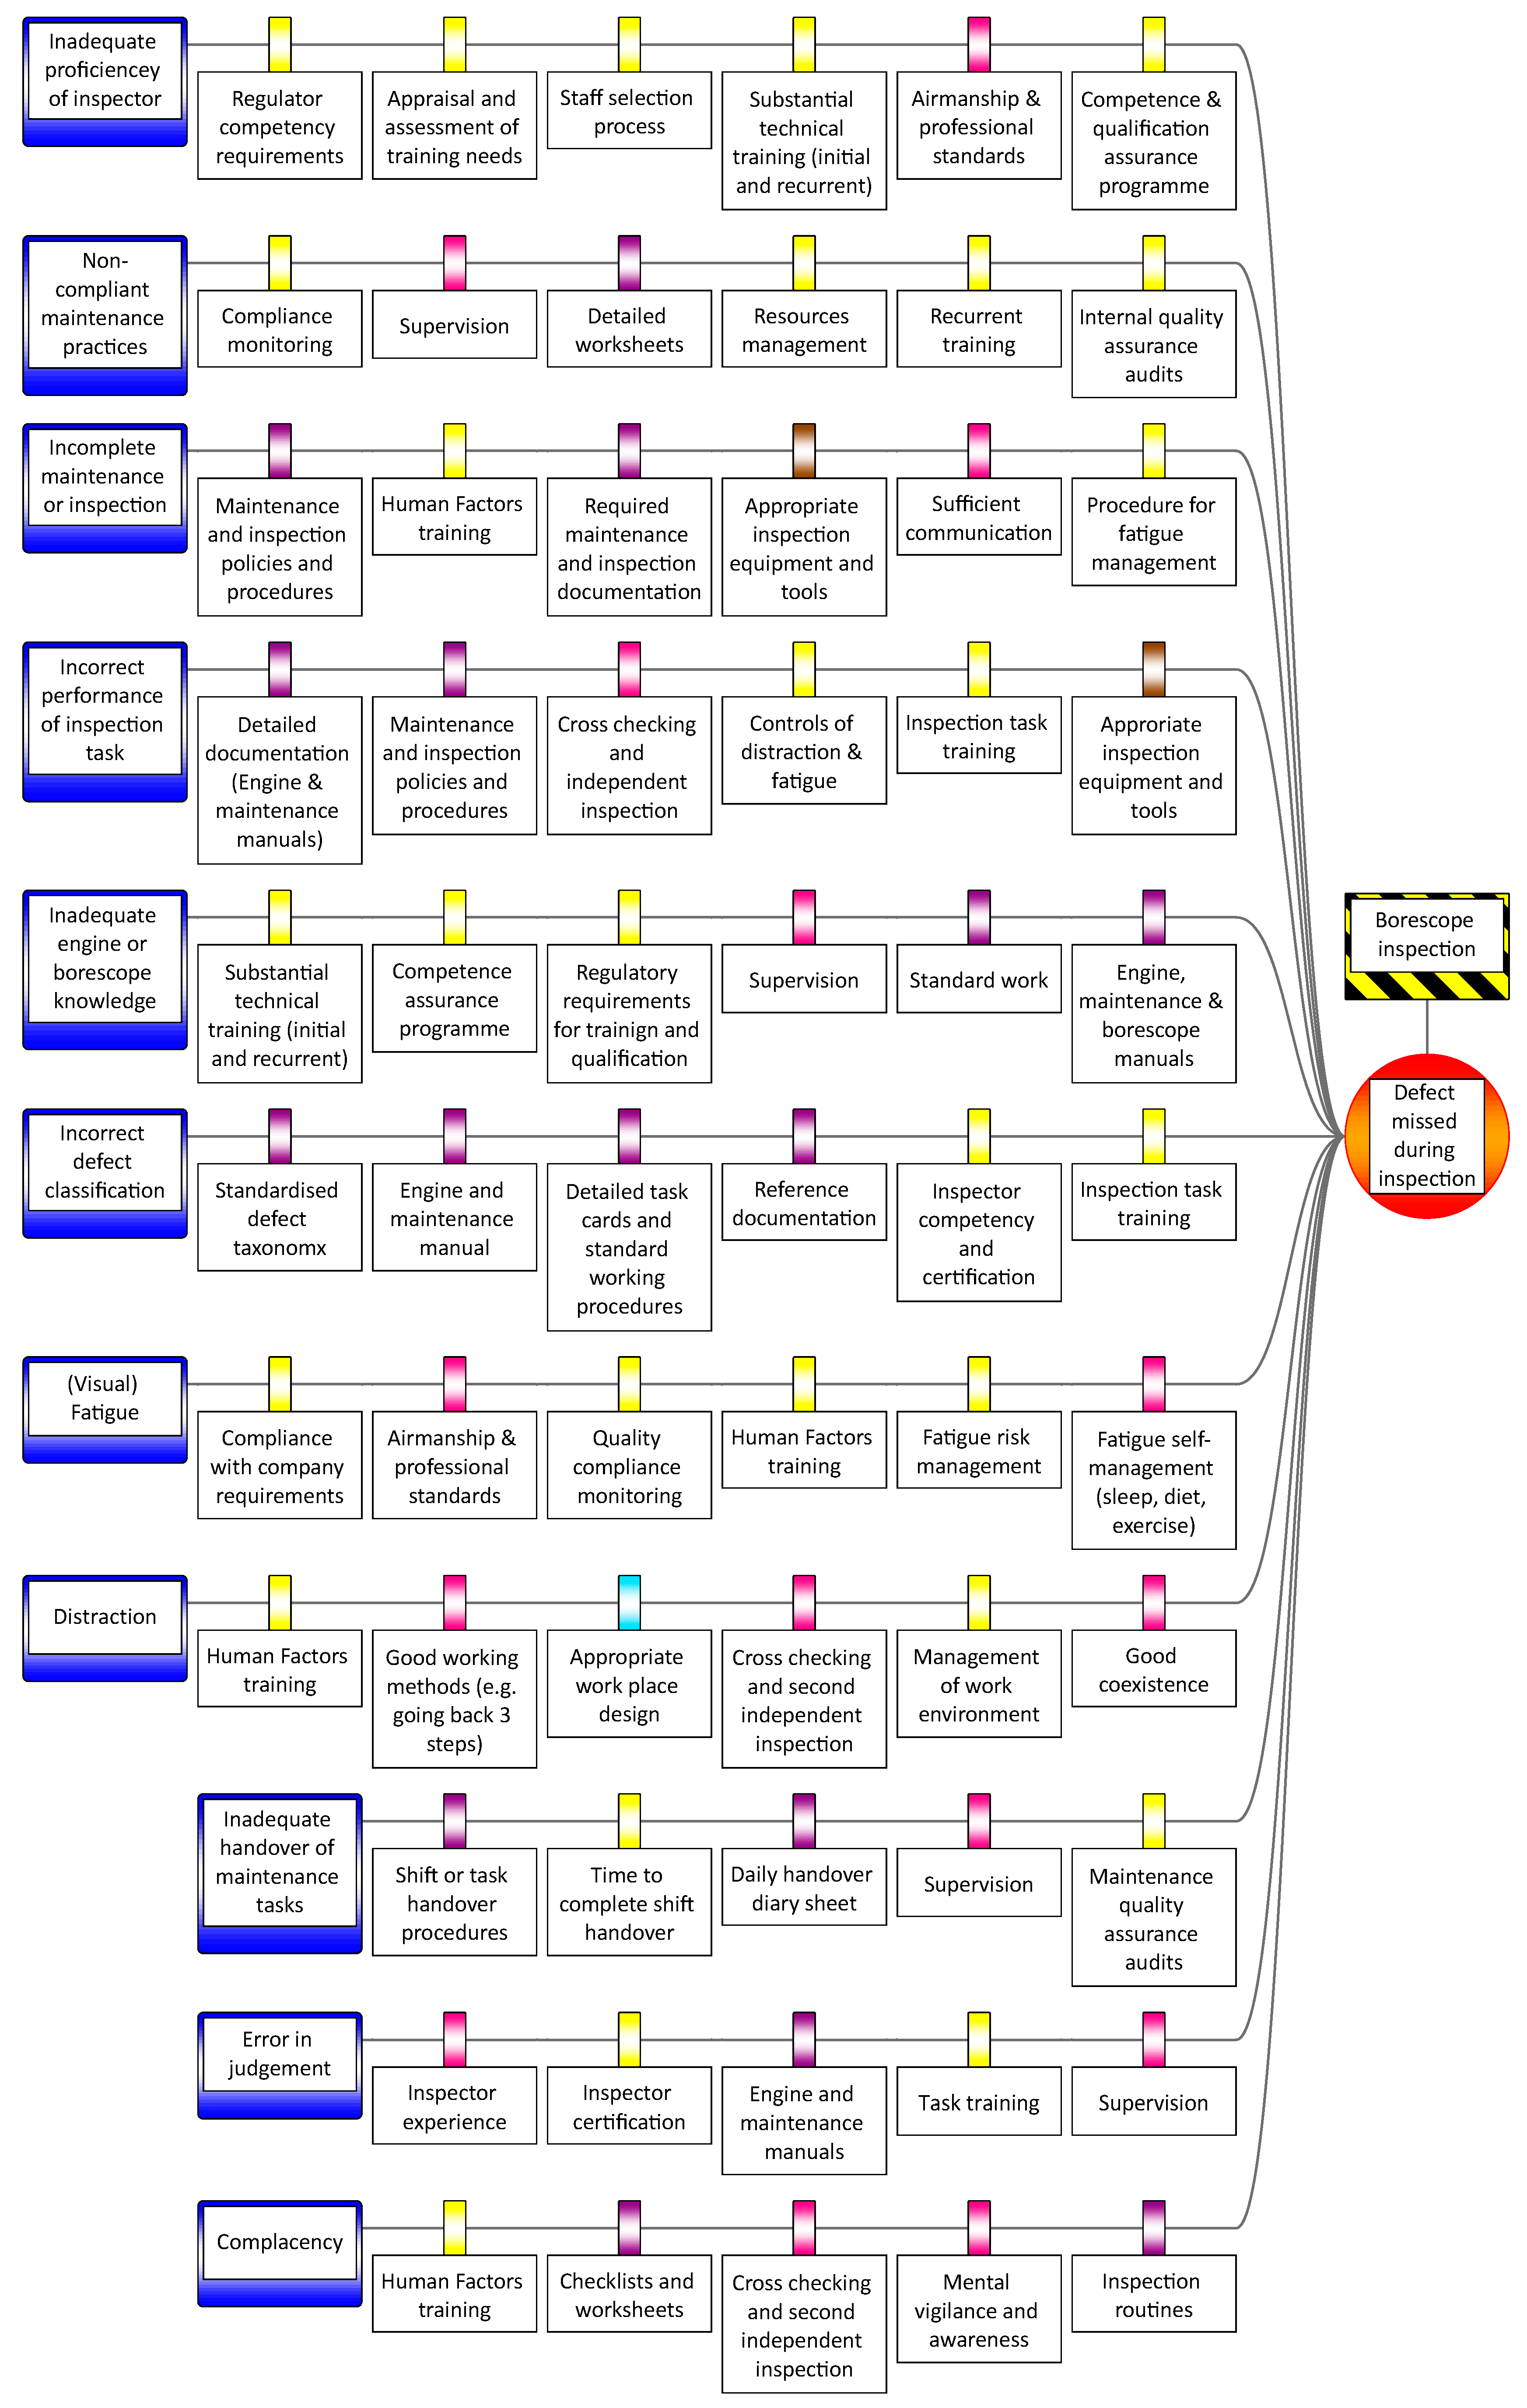
4.7. Application to a Case Study

The conceptual framework was applied to the specific case of visual inspection of aero engine parts in an MRO environment. Borescope inspection plays a crucial part in engine maintenance, since it allows inspecting parts inside the engine for defects, such as nicks, dents, cracks, tears, and fractures, without the need for a costly teardown. Missing such a defect during visual inspection is highly critical for the airworthiness of the engine and passenger safety. Hence, we defined the top event as being the risk of a ‘Defect missed during inspection’. The next step was the identification of the threats, consequences and barriers. We asked each specialist from the maintenance and inspection domain to identify risks inherent in the process of borescope inspection, and what means of prevention and mitigation are or could be in place. The insights were extracted from field notes taken during the observation and the Bowtie diagrams were drawn. It shall be noted that the main emphasis was put on the prevention side, which is common practice in Bowtie application [4,26]. The reason behind this approach is that prevention efforts are more cost-effective and hence more attractive from a management perspective [77].
A general limitation of Bowtie and other root cause diagrams is the scalability and legibility when analysing complex systems, as the diagrams tend get quite large. When using BowtieXP software, there is a function to show and hide different layers of the Bowtie diagram. The layers include: (a) only hazard and top event; (b) hazard, top event, threats and consequence; (c) hazard, top event, threats and consequences with all barriers; (d) hazard, top event, threats, consequences, barriers and escalation factors; (e) threats, consequences, barriers, escalation factors and escalation factor controls. This is helpful when presenting the diagram to an audience who does not need all the details, but without losing any of the data in the background. Unfortunately, this is a manual task and there is no automatism for expanding or condensing Bowtie diagrams, or hiding individual threat or consequence paths. It would be helpful if this feature could be enhanced in future versions of BowtieXP software.
Possibly, multiple threats of the same category can be merged into one ‘higher-level’ threat path (similar to the barrier modules introduced in Section 4.5.4), e.g., summarising fatigue, distraction, and complacency, into a single human factors threat path instead of listing all twelve human factors (HFs) individually. However, this requires that all threats have the same barriers, which often is not the case.
In order to represent the Bowtie diagram of this research in a legible and receptive way, it was divided into six Sub-Bowties based on the M categories. The six Sub-Bowties for the threat side are shown in Figure 13, Figure 14, Figure 15, Figure 16, Figure 17 and Figure 18. The consequence side of the diagram is presented in Figure 19. Additionally, for purposes of illustration, the size of all Bowtie diagrams was somewhat artificially limited to a maximum six barriers per threat and consequence path. This is solely a limitation to provide legible diagrams within the journal constraints.
The full-sized Bowtie diagrams with all barriers can be found in Appendix Figure A2, Figure A3, Figure A4, Figure A5, Figure A6, Figure A7 and Figure A8. For a higher resolution version of the developed diagrams, refer to Supplementary Materials Figures S1–S8.
The categorisation and barrier colour coding were made in collaboration with the risk and management team of our industry partner. The categorisation was based on the responsibility and exerting agency of the threat or barrier. This decision was made after a discussion with the industry experts, about the Bowtie elements that could be placed in more than one category, such as task-related threats. In this particular example, the threat could be placed in the man category since the inspection personnel performs the task. On the other hand, it could also be a method-related threat, since a task is part of a process or procedure. Based on the decision above, we categorised it as a man-related threat, since the human performs the task and human performance is always critical in this industry. It is generally accepted that human errors cause over 70% of all aircraft accidents [78]. Furthermore, 80% of all maintenance errors involve human factors [79]. Hence, it can be expected that the threat paths in the man category will make up the majority of all threats in the Bowtie diagram.
The diagrams produced as part of this research should not be considered comprehensive. We limited the consequence side of the Bowtie to the immediate consequence rather than the full consequence chain.

5. Discussion

5.1. Summary of Outcomes

This work proposes a new methodology for integrating structured frameworks to the Bowtie method. Ishikawa’s 6M approach was chosen to structure the Bowties and the accompanying brainstorming sessions. We showed that a contextualisation of the 6M categories was required for application to a maintenance environment. While constructing the Bowtie diagram, it was found that there is inconsistency and confusion about the hazard and top event relationship. A consistent interpretation was provided to overcome this problem. Furthermore, it was found that there are cascading consequences for different stakeholders. Depending on the focus of the risk analysis and the target audience, there are different consequences, which we demonstrated in this work. Moreover, the visualisation and receptivity of the diagram was improved by assigning different colours to each barrier category, which supports the main purpose of the Bowtie method, i.e., functioning as communication tool. Finally, the proposed conceptual framework was tested by applying it to the specific case of visual borescope inspection of aero engine parts.

5.2. Implications for Practitioners

The proposed structured approach was tested in the aviation maintenance area. However, the method could be applied in other areas within or outside the aviation industry. It might be of particular interest to other high-reliability organisations (HROs), such as oil and gas, nuclear power generation, health care, or wildland firefighting [80,81]. This is supported by the fact that the structured approach could make the development of Bowtie somewhat simpler and hence promote the broader application of Bowtie.
The framework provides non-risk experts with a tool to perform risk assessment. Operators, who may have limited risk management skills but a better knowledge of the system and processes than a risk analyst, might use the tool to identify threats, consequences, and means of prevention and mitigation. The framework encapsulates a wide range of previous known areas relevant to risk assessment and ensures that most common and obvious threats, consequences and barriers are not missed. Furthermore, it enables the analyst to put the emphasis on the threat, consequence, and barrier identification, rather than on the construction of the diagram itself. The conceptual work could also be used to structure the accompanying brainstorming sessions of the Bowtie development process, which has the potential to overcome some of the limitations mentioned in Section 2.4.
The categorisation of threats and consequences may help to better address them by appropriate means. Categorising barriers in turn may help practitioners to gain a better overview of the types of barriers in place and how diverse a threat or consequence path is in terms of barrier types. Furthermore, it may help to identify appropriate and efficient barriers that prevent more than one threat or consequence path, i.e., barriers that occur on multiple paths. This could be beneficial when identifying and eliminating ineffective barriers or barriers that only prevent one path, and rather improve barriers that prevent multiple threats. This brings in a management perspective of barrier prioritisation and investment strategies.
The idea of cascading consequence could allow an organisation to break the complex MRO process down into smaller blocks and perform a risk assessment for each of these process steps with the relevant process experts. This goes along with the previously mentioned practicability of the proposed method by non-risk analysts and may improve the quality of the Bowtie diagrams.

5.3. Limitations of the Work

The proposed methodology may be of limited use when analysing novel systems outside the manufacturing and maintenance industry, where 6M originated. It is important to accept that there is not only one right solution. Every model needs to provide a certain extent of flexibility that enables it to be applicable to the broader industry. The categories need to be tailored to suit the different needs and concerns of the specific industry and organisation that is applying it [82]. This limitation was already addressed and we showed that the categories can be contextualised and adjusted to the area under investigation. It was found that the level of risk assessment plays an important role when contextualising the categories.
In other industries, different categorisations have already been applied such as the ‘8Ps marketing mix’ or the ‘4S cause categories’ in the service industry. Each of these categorisations could theoretically be applied to Bowtie following the principles presented in this paper. It is recommended to use a common approach to avoid arbitrary structures, which would act adversely on the attempt to provide consistency.
As mentioned in the previous section, the approach covers the most common risk areas based on previous experience. However, this involves the risk of missing Bowtie elements that have not previously occurred. The use of strictly defined categories may limit the imagination when identifying threats, consequences, or barriers. Analysts will need to ensure they are not so fixated on the method that they fail to anticipate new threats.
In some cases, the classification is not explicit as threats or barriers may fit into two of the proposed categories. From a risk point of view, it is not essential where and under which category an element is listed, as long as it is listed and brought to attention, so that it can be further analysed. In the case study, we made the decision to categorise the elements based on their nature and exerting agent.
The process of developing a Bowtie diagram following the proposed structure can be time consuming and people may focus too much on trying to fill in all gaps, although it is realistic and acceptable that there is not a threat, consequence, or barrier in each category type for every case.
There is a caveat regarding the Management category. The intent is to represent the operations management, as opposed to management-theory, leadership and vision. Consequently, the management threats shown here are aimed for an audience of operators, who have the operational knowledge to know how the integrity of the work may be compromised. Business executives normally do not know every process in detail and are not risk experts, and hence tend not to create Bowtie diagrams.
While there are many risk assessment methods (e.g., Bowtie, FTA, FMEA, Zonal analysis, and Ishikawa), and they all cope with single threats, they often struggle to represent multiple simultaneous failures. Reason [83] stated that often multiple barriers fail at the same time, which then releases the top event, and ultimately has the potential to cause severe damage or result in a catastrophe. Consequently, any type of method that fixates on identifying root causes has the intrinsic detriment of under-emphasising the temporal relationships of causality between the contributory factors. It is particularly difficult to represent how organisational factors (such as work culture) affect physical failure, since the causal mechanisms are indistinct and perhaps easier to obfuscate [84]. Many enquiries into major disasters focus on the physical root causes and the accident sequence: the organisational root causes are treated differently, are termed ‘contributory factors’, and are not easily representable with some diagrammatic methods. Bowtie analysis is not particularly efficient at representing complex relationships of causality, neither natively nor with the changes proposed in this paper. This is evident in the need to repeatedly represent causal chains on the diagram, hence our suggestion to use modules. It does not readily capture the more abstract organisational factors such as organisational culture and perverse agency [85]. Nonetheless, Bowtie does excel at representing the failings of the operational systems alongside the physical faults. This plus its simple depiction make it an effective communication tool by which operators can build a shared understanding (and hence a local work culture) of how their tasks contribute to a larger good. Hence, we propose that the purpose of any risk analysis tool is to capture sufficient complexity of the real system behaviour as to direct improvement efforts and consolidate work-culture around actions that improve safety outcomes.

5.4. Implications for Future Research

We identify the potential for future research in the following areas. Now that there is a more systematic approach for developing Bowtie, this means that there can be different representations of it, similar to a Gantt chart and a network diagram, which are complementary representations of the same project plan. While the Gantt chart is a visual representation, it can also be expressed as a table. It is conceivable that there could be a similar spreadsheet representation of Bowtie. If so, this may provide a mechanism to add additional information about the likelihoods and frequencies of the threats and the effectiveness of the barriers, and include other application critical factors. In the presented case study, these factors could include defect detectability, engine history, and other influence factors. Furthermore, the spreadsheet has the potential to calculate the risk of each threat and the overall hazard considering these factors.
A user interface could be developed for automated query of the values for the Bowtie elements, i.e., hazard, top event, threats, consequences, barriers, escalation factors and escalation factor barriers, following the proposed structure. These values might be used to automatically generate a starting Bowtie. This has the potential to generate Bowtie diagrams quicker and more efficiently. Moreover, the automation of Bowtie would allow selecting different levels of detail and presenting the most relevant elements for a target audience, or based on the likelihood and impact. This might be carried out by applying different filters in the Bowtie interface and retrieving the data from the spreadsheet accordingly. The generated Bowtie could then be limited to (say) the most important ten threats (highest risk) and the five most effective barriers of each threat and consequence path. This has not only the potential to significantly reduce the size and complexity of the Bowtie diagram, but also to further support a standardised presentation and to highlight the critical elements, where most emphasis should be put on improvement efforts.

6. Conclusions

The purpose of this research was to overcome the arbitrariness of the Bowtie methodology. This work makes several novel contributions by addressing the research purpose. Firstly, it provides a structured way of performing Bowtie analysis and constructing the diagram accordingly by following the 6M approach. This required contextualisation of the 6M categories for application in a maintenance area, which differs to a production environment. Secondly, it was applied to borescope inspection of aero engine parts and extended the risk analysis beyond the tool (borescope device), and included other relevant risks related to methods, management, material, work environment and human factors.

Supplementary Materials

The following are available online at https://www.mdpi.com/2226-4310/7/7/86/s1, Figure S1: Full Bowtie diagram with 6M prevention and mitigation barriers; Figure S2: Management-related threat paths with barriers; Figure S3: Material-related threat paths with barriers; Figure S4: Method-related threat paths with barriers; Figure S5: Man-related threat paths with barriers; Figure S6: Mother Nature-related threat paths with barriers; Figure S7: Machine-related threat paths with barriers; Figure S8: Consequence path with a 6M barrier structure.

Author Contributions

Conceptualization, J.A. and D.P.; methodology, J.A. and D.P.; software, J.A.; formal analysis, J.A. and D.P.; investigation, J.A.; resources, D.P.; data curation, J.A.; writing—original draft preparation, J.A.; writing—review and editing, J.A. and D.P.; visualisation, J.A.; supervision, D.P.; project administration, D.P.; funding acquisition, J.A. and D.P. All authors have read and agreed to the published version of the manuscript.

Funding

This research project was funded by the Christchurch Engine Centre (CHCEC), a maintenance, repair and overhaul (MRO) facility based in Christchurch and a joint venture between the Pratt and Whitney (PW) division of United Technologies Corporation (UTC) and Air New Zealand (ANZ).

Acknowledgments

We sincerely thank staff at the Christchurch Engine Centre for their support and providing insights into visual inspection and risk management. In particular, we thank Tim Coslett, Marcus Wade, Tim Fowler and Allan Moulai.

Conflicts of Interest

J.A. was funded by a PhD scholarship through this research project. The authors declare no other conflicts of interest.

Appendix A

Figure A1 shows the full Bowtie diagram with the 6M structure for threats and consequences, as well as for the colour-coded prevention and mitigation barriers.
Figure A1. Full Bowtie structure with a 6M × 6M matrix on both sides of the diagram.
Aerospace 07 00086 g0a1
Figure A2, Figure A3, Figure A4, Figure A5, Figure A6 and Figure A7 show the Sub-Bowties of the threat side of the Bowtie diagram including all prevention barriers. Figure A8 presents the consequences and the prevention barriers in place.
Figure A2. Machine-related threat paths with barriers.
Aerospace 07 00086 g0a2
Figure A3. Mother Nature-related threat paths with barriers.
Aerospace 07 00086 g0a3
Figure A4. Man-related threat paths with barriers.
Aerospace 07 00086 g0a4
Figure A5. Method-related threat paths with barriers.
Aerospace 07 00086 g0a5
Figure A6. Material-related threat paths with barriers.
Aerospace 07 00086 g0a6
Figure A7. Management-related threat paths with barriers.
Aerospace 07 00086 g0a7
Figure A8. Consequence path with mitigation barriers.
Aerospace 07 00086 g0a8

References

  1. Shahriar, A.; Sadiq, R.; Tesfamariam, S. Risk Analysis for Oil & Gas Pipelines: A Sustainability Assessment Approach using Fuzzy based Bow-Tie Analysis; Elsevier: Amsterdam, The Netherlands, 2012; Volume 25, pp. 505–523. [Google Scholar] [CrossRef]
  2. De Ruijter, A.; Guldenmund, F. The bowtie method: A review. Saf. Sci. 2016, 88, 211–218. [Google Scholar] [CrossRef]
  3. Federal Aviation Administration (FAA). Bow-Tie Analysis. Available online: http://www.hf.faa.gov/workbenchtools/default.aspx?rPage=Tooldetails&subCatId=43&toolID=21 (accessed on 1 October 2018).
  4. Civil Aviation Authority (CAA). Bowtie Risk Assessment Models. Available online: https://www.caa.co.uk/Safety-Initiatives-and-Resources/Working-with-industry/Bowtie/ (accessed on 25 September 2018).
  5. European Aviation Safety Agency (EASA). The European Plan for Aviation Safety (EBAS) 2018–2022; European Aviation Safety Agency: Cologne, Germany, 2018. [Google Scholar]
  6. Civil Aviation Authority (CAA) of New Zealand. Making Safe Aviation Even Safer. In Civil Aviation Authority Sector Risk profile of Medium and Large Aircraft Air Transport; CAA: Wellington, New Zealand, 2017. [Google Scholar]
  7. Aust, J.; Pons, D. Bowtie Methodology for Risk Analysis of Visual Borescope Inspection during Aircraft Engine Maintenance. Aerospace 2019, 6, 110. [Google Scholar] [CrossRef] [Green Version]
  8. Delmotte, F. A Sociotechnical Framework for the Integration of Human and Organizational Factors in Project Management and Risk Analysis. Master’s Thesis, Virginia Tech, Blacksburg, VA, USA, 2003. [Google Scholar]
  9. Brown, K. Review of the South Island Rail Coal Route—MET351-X-REP-001. Available online: www.ltsa.govt.nz/rail/coal-route (accessed on 27 September 2018).
  10. Van Scyoc, K.; Hughes, G. Rail ruminations for process safety improvement. J. Loss Prev. Process Ind. 2009, 22, 689–694. [Google Scholar] [CrossRef]
  11. Papazoglou, I.A.; Bellamy, L.J.; Hale, A.R.; Aneziris, O.N.; Ale, B.J.M.; Post, J.G.; Oh, J.I.H. I-Risk: Development of an integrated technical and management risk methodology for chemical installations. J. Loss Prev. Process Ind. 2003, 16, 575–591. [Google Scholar] [CrossRef]
  12. De Dianous, V.; Fievez, C. ARAMIS project: A more explicit demonstration of risk control through the use of bow–tie diagrams and the evaluation of safety barrier performance. J. Hazard. Mater. 2006, 130, 220–233. [Google Scholar] [CrossRef] [Green Version]
  13. Burgess-Limerick, R.; Horberry, T.; Steiner, L. Bow-tie analysis of a fatal underground coal mine collision. Ergon. Aust. 2014, 10, 1–5. [Google Scholar]
  14. Abdo, H.; Kaouk, M.; Flaus, J.M.; Masse, F. A safety/security risk analysis approach of Industrial Control Systems: A cyber bowtie combining new version of attack tree with bowtie analysis. Comput. Secur. 2018, 72, 175–195. [Google Scholar] [CrossRef] [Green Version]
  15. Bernsmed, K.; Frøystad, C.; Meland, P.H.; Nesheim, D.A.; Rødseth, Ø.J. Visualizing cyber security risks with bow-tie diagrams. In International Workshop on Graphical Models for Security; Springer: Berlin/Heidelberg, Germany, 2017; pp. 38–56. [Google Scholar]
  16. Faulkner, A.; Nicholson, M. Data-Centric Safety: Challenges, Approaches, and Incident Investigation; Elsevier: Amsterdam, The Netherlands, 2020. [Google Scholar]
  17. Culwick, M.D.; Merry, A.F.; Clarke, D.M.; Taraporewalla, K.J.; Gibbs, N.M. Bow-Tie Diagrams for Risk Management in Anaesthesia. Anaesth. Intensive Care 2016, 44, 712–718. [Google Scholar] [CrossRef] [Green Version]
  18. Abdi, Z.; Ravaghi, H.; Abbasi, M.; Delgoshaei, B.; Esfandiari, S. Application of Bow-tie methodology to improve patient safety. Int. J. Health Care Qual. Assur. 2016, 29, 425–440. [Google Scholar] [CrossRef]
  19. Janssen, E. Patient Safety BowTies. Available online: http://www.patientsafetybowties.com/knowledge-base/5-why-bowties-in-healthcare (accessed on 13 February 2020).
  20. Badreddine, A.; Amor, N.B. A Bayesian approach to construct bow tie diagrams for risk evaluation. Process Saf. Environ. Prot. 2013, 91, 159–171. [Google Scholar] [CrossRef]
  21. Maragakis, I.; Clark, S.; Piers, M.; Prior, D.; Tripaldi, C.; Masson, M.; Audard, C. Guidance on Hazard Identification. In Safety Management System and Safety Culture Working Group (SMSWG); European Commercial Aviation Safety Team (ECAST): Cologne, Germany, 2009; pp. 6–8. [Google Scholar]
  22. Acquisition Safety & Environmental Management System (ASEMS). Bow-Tie Diagram. Available online: https://www.asems.mod.uk/content/bow-tie-diagram (accessed on 4 April 2020).
  23. Ishikawa, K. Introduction to Quality Control; Productivity Press: New York, NY, USA, 1990. [Google Scholar]
  24. Lewis, S. Lessons Learned from Real World Application of the Bow-tie Method. In Proceedings of the 6th Global Congress on Process Safety, Antonio, TX, USA, 22–24 March 2010; Available online: https://www.aiche.org/academy/videos/conference-presentations/lessons-learned-real-world-application-bow-tie-method (accessed on 27 October 2018).
  25. Civil Aviation Authority (CAA). CAA ‘Significant Seven’ Task Force Reports. In CAA PAPER 2011/03; CAA: London, UK, 2011. Available online: https://publicapps.caa.co.uk/docs/33/2011_03.pdf (accessed on 25 October 2018).
  26. Joint Industry Program. The BowTie Examples Library. In Joint Industries Project; CGE Risk Management Solutions: Leidschendam, The Netherlands, 2016. [Google Scholar]
  27. International Civil Aviation Organization (ICAO). Safety Management Manual (SMM), 3rd ed.; ICAO: Montreal, QC, Canada, 2012. [Google Scholar]
  28. Sklet, S. Safety barriers: Definition, classification, and performance. J. Loss Prev. Process Ind. 2006, 19, 494–506. [Google Scholar] [CrossRef]
  29. Badreddine, A.; Romdhane, T.B.; HajKacem, M.A.B.; Amor, N.B. A new multi-objectives approach to implement preventive and protective barriers in bow tie diagram. J. Loss Prev. Process Ind. 2014, 32, 238–253. [Google Scholar] [CrossRef]
  30. Jacinto, C.; Silva, C. A semi-quantitative assessment of occupational risks using bow-tie representation. Saf. Sci. 2010, 48, 973–979. [Google Scholar] [CrossRef]
  31. Visser, J.P. Developments in HSE management in oil and gas exploration and production. Saf. Manag. Chall. Chang. 1998, 1, 43–66. [Google Scholar]
  32. Manton, M.; Moat, A.; Ali, W.; Johnson, M.; Cowley, C. Representing Human Factors in Bowties as per the new CCPS/EI Book. In Proceedings of the CCPS Middle East Conference on Process Safety, Sanabis, Bahrain, 10 October 2017. [Google Scholar]
  33. Delvosalle, C.; Fiévez, C.; Pipart, A. ARAMIS Project: Reference Accident Scenarios Definition in SEVESO Establishment. J. Risk Res. 2006, 9, 583–600. [Google Scholar] [CrossRef]
  34. Hamzah, S. Use bow tie tool for easy hazard identification. In Proceedings of the 14th Asia Pacific Confederation of Chemical Engineering Congress, Singapore, 21–24 February 2012. [Google Scholar]
  35. Flight Safety Foundation. Basic Aviation Risk Standard. In Offshore Helicopter Operations; Flight Safety Foundation: Alexandria, VA, USA, 2015. [Google Scholar]
  36. Kang, J.; Zhang, J.; Gao, J. Analysis of the safety barrier function: Accidents caused by the failure of safety barriers and quantitative evaluation of their performance. J. Loss Prev. Process Ind. 2016, 43, 361–371. [Google Scholar] [CrossRef]
  37. Neogy, P.; Hanson, A.; Davis, P.; Fenstermacher, T. Hazard and barrier analysis guidance document. Department of Energy, Office of Operating Experience Analysis and Feedback, Report No. EH-33; Springer: Berlin/Heidelberg, Germany, 1996. [Google Scholar]
  38. Chevreau, F.R.; Wybo, J.L.; Cauchois, D. Organizing learning processes on risks by using the bow-tie representation. J. Hazard. Mater. 2006, 130, 276–283. [Google Scholar] [CrossRef]
  39. Wilson, P.F. Root Cause Analysis: A Tool for Total Quality Management; Quality Press: Milwaukee, WI, USA, 1993. [Google Scholar]
  40. Hall, D.; Hulett, D.; Graves, R. Universal Risk Project—Final Report; PMI Risk SIG: Newtown Township, PA, USA, 2002. [Google Scholar]
  41. Rose, K.H. A Guide to the Project Management Body of Knowledge (PMBOK® Guide), 5th ed.; Project Management Institute: Hampton, VA, USA, 2013; Volume 44. [Google Scholar]
  42. Hillson, D. Use a risk breakdown structure (RBS) to understand your risks. In Proceedings of the project Management Institute Annual Seminars & Symposium, San Antonio, TX, USA, 3–10 October 2002. [Google Scholar]
  43. Tanim, M.M.Z. Risk Management in International Business Handbook; 2019. [Google Scholar]
  44. Lester, A. Project Management, Planning and Control: Managing Engineering, Construction and Manufacturing Projects to PMI, APM and BSI Standards; Elsevier Science & Technology: Saint Louis, UK, 2013. [Google Scholar]
  45. Chung, W.; Zhu, M. Risk Assessment Based on News Articles: An Experiment on IT Companies. In Proceedings of the International Conference on Information Systems (ICIS 2012), Orlando, FL, USA, 16–19 December 2012. [Google Scholar]
  46. Deshpande, P. Study of Construction Risk Assessment Methodology for Risk Ranking. In Proceedings of the International Conference on Education, E Learning and Life Long Learning, Kuala Lumpur, Maleysia, 16–17 November 2015. [Google Scholar]
  47. Sandle, T. Approaching Risk Assessment: Tools and Methods; Newsletter; Global Biopharmaceutical Resources Inc.: Clarksburg, MD, USA, 2012; Volume 1, pp. 1–23. [Google Scholar]
  48. Kurian, G.T. The AMA Dictionary of Business and Management; AMACOM: Nashville, TN, USA, 2013. [Google Scholar]
  49. Pons, D. Strategic Risk Management: Application to Manufacturing. Open Ind. Manuf. Eng. J. 2010, 3, 13–29. [Google Scholar] [CrossRef] [Green Version]
  50. International Organization for Standardization (ISO). Information Technology. In Security Techniques—Information Security Management Systems Requirements; Joint Technical Committee ISO/IEC JTC1. Subcommittee SC 27; International Organization for Standardization (ISO): Geneva, Switzerland, 2013. [Google Scholar]
  51. Jouini, M.; Ben, L.; Ben Arfa Rabai, L.; Aissa, A. Classification of security threats in information systems. Procedia Comput. Sci. 2014, 32, 489–496. [Google Scholar] [CrossRef] [Green Version]
  52. Paradies, M. TapRoot—Root Cause Tree Dictionary; System Improvements, Inc.: Knoxville, TS, USA, 2015; Volume 9. [Google Scholar]
  53. International Air Transport Association (IATA). Safety Report; International Air Transport Association (IATA): Geneva, Switzerland; Montreal, QC, Canada, 2006. [Google Scholar]
  54. Liliana, L. A new model of Ishikawa diagram for quality assessment. In IOP Conference Series: Materials Science and Engineering; IOP Publishing: Bristol, UK, 2016; Volume 161, p. 012099. [Google Scholar]
  55. Radziwill, N. Creating Ishikawa (Fishbone) Diagrams With R. Softw. Qual. Prof. 2017, 20, 47–48. [Google Scholar]
  56. Hristoski, I.; Kostoska, O.; Kotevski, Z.; Dimovski, T. Causality of Factors Reducing Competitiveness of e-Commerce Firms. Balk. Near East. J. Soc. Sci. 2017, 3, 109–127. [Google Scholar]
  57. Eckes, G. Six Sigma for Everyone; John Wiley & Sons: Hoboken, NJ, USA, 2003. [Google Scholar]
  58. Burch, R.F.; Strawderman, L.; Bullington, S.F. Global corporation rollout of ruggedised handheld devices: A Lean Six Sigma case study. Total Qual. Manag. Bus. Excell. 2016, 27, 1–16. [Google Scholar] [CrossRef]
  59. Bradley, E. Reliability Engineering: A Life Cycle Approach; CRC Press: Boca Raton, FL, USA, 2016. [Google Scholar]
  60. See, J.E. Visual Inspection: A Review of the Literature; Sandia National Laboratories: Albuquerque, NM, USA, 2012.
  61. Wiegmann, D.A.; Shappell, S.A. A Human Error Approach to Aviation Accident Analysis: The Human Factors Analysis and Classification System; Routledge: London, UK, 2017. [Google Scholar]
  62. U.S. Department of Transportation. FAA-H-8083-32A, Federal Aviation Administration (FAA) Session. In Aviation Maintenance Technician Handbook—Powerplant; FAA: Washington, DC, USA, 2018; Volume 2. [Google Scholar]
  63. Wiener, E.; Nagel, D. Human Factors in Aviation; Academic Press Limited: London, UK, 1988. [Google Scholar]
  64. Gong, L.; Zhang, S.; Tang, P.; Lu, Y. An integrated graphic–taxonomic–associative approach to analyze human factors in aviation accidents. Chin. J. Aeronaut. 2014, 27, 226–240. [Google Scholar] [CrossRef] [Green Version]
  65. Said, M.; Mokhtar, A. Significant human risk factors in aviation maintenance. Sains Hum. 2014, 2, 31–34. [Google Scholar]
  66. Chang, Y.H.; Wang, Y.C. Significant human risk factors in aircraft maintenance technicians. Saf. Sci. 2010, 48, 54–62. [Google Scholar] [CrossRef]
  67. Johnson, W.; Maddox, M. A PEAR shaped model for better human factors. Cat Mag. 2007, 2, 20–21. [Google Scholar]
  68. CGE Risk. BowtieXP; CGE Risk: Leidschendam, The Netherlands, 2019. [Google Scholar]
  69. Wilken, M.; Hüske-Kraus, D.; Klausen, A.; Koch, C.; Schlauch, W.; Röhrig, R. Alarm Fatigue: Causes and Effects. In Proceedings of the GMDS, Oldenburg, Germany, 17–21 September 2017; pp. 107–111. [Google Scholar]
  70. Wong, K.C. Using an Ishikawa diagram as a tool to assist memory and retrieval of relevant medical cases from the medical literature. J. Med. Case Rep. 2011, 5, 120. [Google Scholar] [CrossRef] [Green Version]
  71. Hessing, T. 6M’s in Six Sigma (Six Ms or 5Ms and one P or 5M1P). Available online: https://sixsigmastudyguide.com/six-ms-6ms-or-5ms-and-one-p-5m1p/ (accessed on 15 February 2020).
  72. Boca, G.D. 6M in Management Education. Procedia Soc. Behav. Sci. 2015, 182, 4–9. [Google Scholar] [CrossRef] [Green Version]
  73. Vaanila, T. Process Development Using the Lean Six Sigma Methodology: Case: Oy AGA Ab, Linde Healthcare. Bachelor’s Thesis, HAMK Häme University of Applied Sciences, Hämeenlinna, Finland, 2015. [Google Scholar]
  74. Gwiazda, A. Quality tools in a process of technical project management. J. Achiev. Mater. Manuf. Eng. 2006, 18, 439–442. [Google Scholar]
  75. Levine, M.E. Alternatives to regulation: Competition in air transportation and the Aviation Act of 1975. J. Air Law Commer. 1975, 41, 703. [Google Scholar]
  76. Eceral, T.Ö.; Köroğlu, B.A. Incentive mechanisms in industrial development: An evaluation through defense and aviation industry of Ankara. ProcediaSoc. Behav. Sci. 2015, 195, 1563–1572. [Google Scholar] [CrossRef] [Green Version]
  77. Fraser, J.; Simkins, B. Enterprise Risk Management: Today’s Leading Research and Best Practices for Tomorrow’s Executives; John Wiley & Sons: Hoboken, NJ, USA, 2010; Volume 3. [Google Scholar]
  78. Rankin, W. MEDA Investigation Process. In Boeing Commercial Aero; Boeing: Chicago, IL, USA, 2007. [Google Scholar]
  79. Federal Aviation Administration (FAA). Addendum: Chapter 14—Human Factors (PDF). In Published Separately from Aviation Maintenance Technician Handbook FAA-H-8083-30; FAA: Washington, DC, USA, 2018. [Google Scholar]
  80. Christianson, M.K.; Sutcliffe, K.M.; Miller, M.A.; Iwashyna, T.J. Becoming a high reliability organization. Crit Care 2011, 15, 314. [Google Scholar] [CrossRef] [PubMed] [Green Version]
  81. Sutcliffe, K.M. High reliability organizations (HROs). Best Pract. Res. Clin. Anaesthesiol. 2011, 25, 133–144. [Google Scholar] [CrossRef]
  82. The Institute of Operational Risk (IOR). Risk Categorisation. Available online: https://www.ior-institute.org/sound-practice-guidance/risk-categorisation (accessed on 2 May 2020).
  83. Reason, J. Human Error; Cambridge university press: Cambridge, UK, 1990. [Google Scholar]
  84. Pons, D. Pike river mine disaster: Systems-engineering and organisational contributions. Safety 2016, 2, 21. [Google Scholar] [CrossRef] [Green Version]
  85. Ji, Z.; Pons, D.; Pearse, J. Why do workers take safety risks?—A conceptual model for the motivation underpinning perverse agency. Safety 2018, 4, 24. [Google Scholar] [CrossRef] [Green Version]
Figure 1. Maintenance, repair and overhaul (MRO) process with borescope inspection procedures and risks.
Aerospace 07 00086 g001
Figure 2. Generic structure of a Bowtie diagram.
Aerospace 07 00086 g002
Figure 3. Consistent top event with multiple hazard dimensions.
Aerospace 07 00086 g003
Figure 4. Hazard investigation with different top events.
Aerospace 07 00086 g004
Figure 5. Cascading consequences with different stakeholders.
Aerospace 07 00086 g005
Figure 6. Bowtie with threats and consequences structured based on the 6M approach.
Aerospace 07 00086 g006
Figure 7. Threat path with coloured barrier categories.
Aerospace 07 00086 g007
Figure 8. Consequence path with coloured barrier categories.
Aerospace 07 00086 g008
Figure 9. Escalation factor path with coloured barrier categories.
Aerospace 07 00086 g009
Figure 10. Potential visualisation of barrier modules encapsulating escalation factors and its controls.
Aerospace 07 00086 g010
Figure 11. Threat side of the Bowtie diagram with 6M prevention barrier structure.
Aerospace 07 00086 g011
Figure 12. Consequence side of the Bowtie diagram with 6M mitigation barrier structure.
Aerospace 07 00086 g012
Figure 13. Management-related threat paths with barriers.
Aerospace 07 00086 g013
Figure 14. Material-related threat paths with barriers.
Aerospace 07 00086 g014
Figure 15. Method-related threat paths with barriers.
Aerospace 07 00086 g015
Figure 16. Man-related threat paths with barriers.
Aerospace 07 00086 g016
Figure 17. Mother Nature-related threat paths with barriers.
Aerospace 07 00086 g017
Figure 18. Machine-related threat paths with barriers.
Aerospace 07 00086 g018
Figure 19. Consequence path with barriers.
Aerospace 07 00086 g019
Table 1. Contextualisation of the 6M categories to different industries.
CategoryManufacturingMaintenanceHealth Care
1st MMethod (workflow and production processes and procedures)Method (maintenance processes and procedures)Method (surgery or medical treatment procedures)
2nd MMan (operator human factors)Man (inspector human factors)Man (personnel human factors)
3rd MMother Nature (Production environment and facilities)Mother Nature (maintenance environment and facilities)Mother Nature (hospital and GP facilities)
4th MMachine (manufacturing machinery)Machine (repair machinery and inspection tools)Machine (surgery equipment and tools)
5th MMaterial (manufactured product)Material (maintained product)Material (used product, e.g., medicine and aids)
6th MMeasurement (quality control and maintenance)Management (MRO organisation and regulators)Man (patient)
Table 2. The 6M categories for threats with description and example.
6M CategoryThreat Description and Example
1. Machine-related threatsMachine or tools not working properly, e.g., faulty borescope
2. Mother Nature-related threatsPoor inspection environment, e.g., poor lighting
3. Man-related threatsHuman error or failure, e.g., misinterpretation of the defect
4. Method-related threatsLack of standard processes and procedures, e.g., incorrect, outdated or no standard working procedures
5. Material-related threatsPoor condition of the part, e.g., deposit on blade hides defect
6. Management threatsPoor operational management, e.g., time pressure leads to rushed inspection
Table 3. The 6M categories for immediate consequence for the MRO service provider with description and example.
6M CategoryConsequence Description and Example
1. Machine-related consequencesDamage to machinery, e.g., damaged borescope
2. Mother Nature-related consequencesAdverse effect on MRO environment, e.g., damage of test cell or facility
3. Man-related consequencesConsequences for employees, e.g., additional training or certification needed
4. Method-related consequencesChanges of methods required, e.g., revision of standard work protocols and subsequent re-training of staff
5. Material-related consequencesAdditional part preparation, e.g., water jet wash
6. Management consequencesReputational consequences, e.g., degradation of engine shop status
Table 4. The 6M categories for subsequent consequences for the airline with description and example.
6M CategoryConsequence Description and Example
1. Machine-related consequencesDamage to the engine or aircraft, e.g., uncontained engine failure
2. Mother Nature-related consequencesContamination of airport or nature after engine failure, e.g., debris from engine falls from aircraft
3. Man-related consequencesHarm to passengers and cabin crew, e.g., fatality
4. Method-related consequencesNew procedures, e.g., additional checks before flight operation
5. Material-related consequencesMaterial failure, e.g., propagation of a defect leads to part separation (FOD)
6. Management consequencesReputational or financial consequences for airline, e.g., compensation for causing harm
Table 5. The 6M categories for prevention and mitigation barriers with example.
6M CategoryBarrier Description and Example
1. Machine-related barriersMachinery and inspection tool-related barriers, e.g., backup tools availability
2. Mother Nature-related barriersWork environmental barriers (external and internal environment, e.g., appropriate work place design
3. Man-related barriersOperator or inspector-related barriers, e.g., airmanship, self-awareness, and experience
4. Method-related barriersPrevention and mitigation processes and procedures, e.g., standard working procedures
5. Material-related barriersMaterial-related barriers
6. Management barriersOperational management-based barriers, e.g., provision of appropriate training

