Remote and Feedback Control of the Flap Angle in a Wind Tunnel Test Model by Optical Measurement


Abstract
:1. Introduction
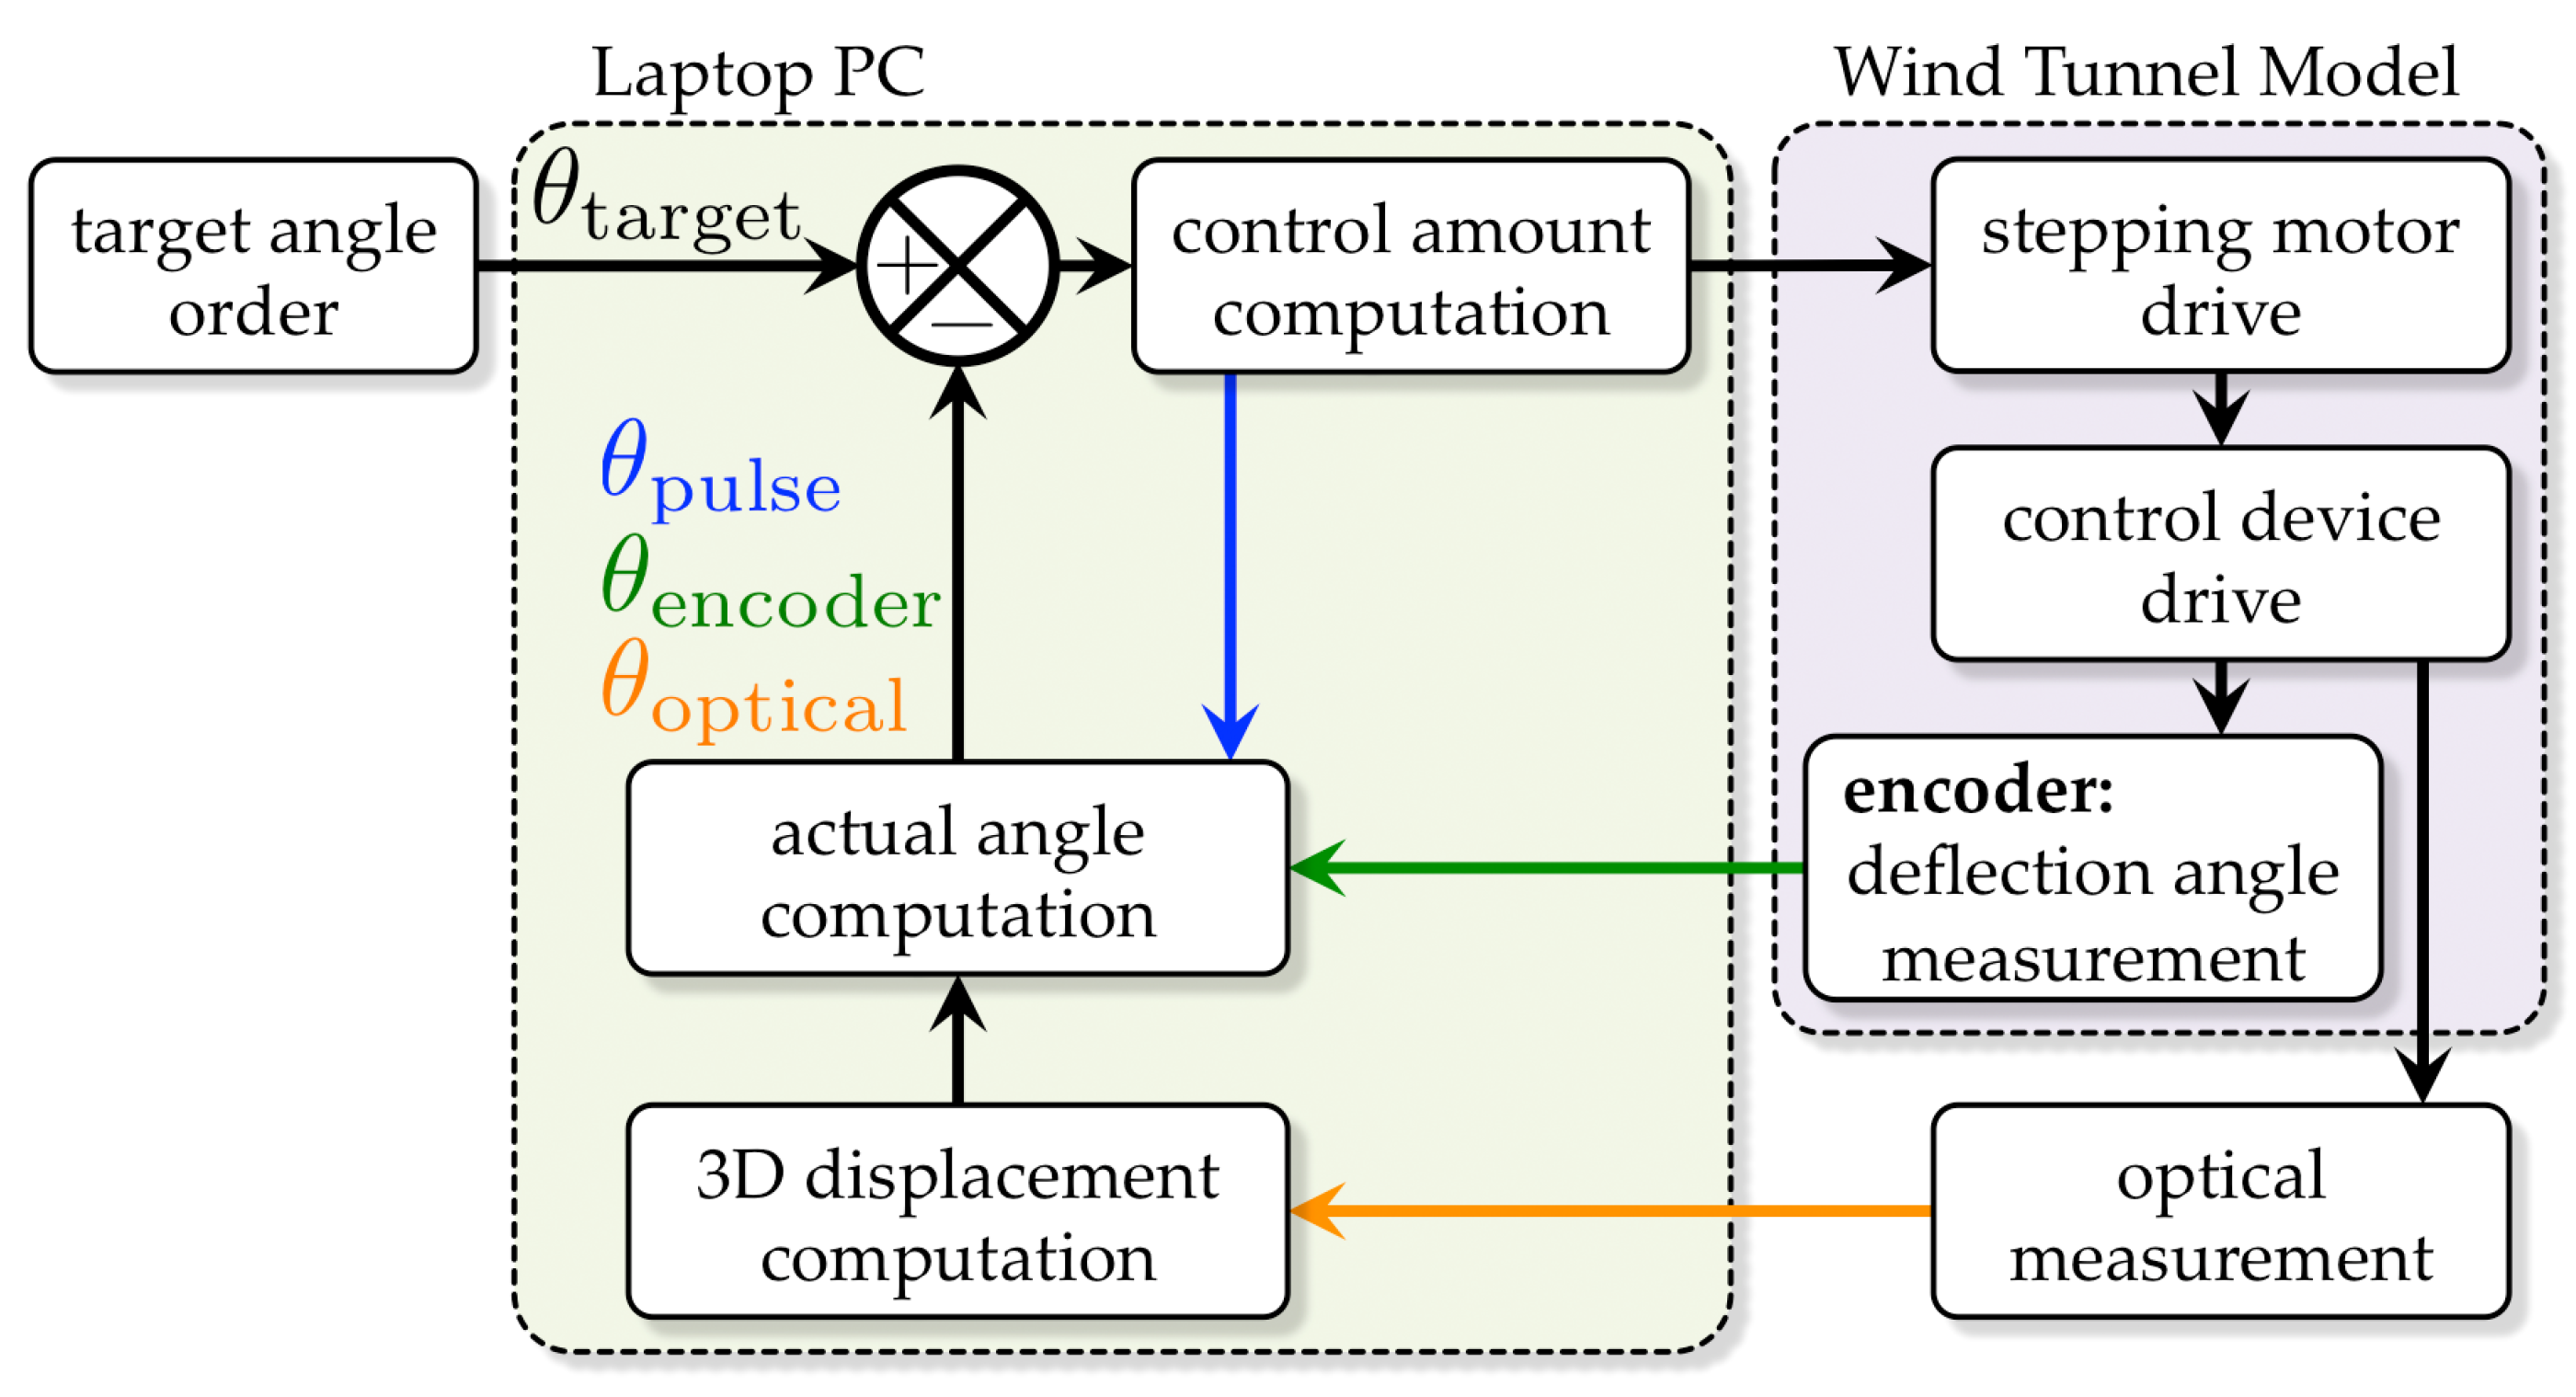
2. Feedback Control System Using Optical Measurement Technology
- Camera calibration: Calibration is conducted to define parameters related to camera position and attitude. We employed stereo camera calibration, which is one function in MathWorks, MATLAB’s Computer Vision System Toolbox (“Camera Calibration Toolbox for Matlab” available online at http://www.vision.caltech.edu/bouguetj/calib_doc/ [retrieved 30 March 2018]). Three images can estimate parameters required for MathWorks’ function, but we have been using at least 50 images this time to diminish errors after calibration.
- Marker detection: We affixed 15 circular markers on the flap (three in the chordwise direction times five in the spanwise direction) to gain their coordinates. A photographed image detected a circular shape in the prescribed radius range as a marker; we numbered them and computed their barycentric coordinates. We mutually collated two sets of the barycentric coordinates calculated from the images taken by the two cameras and derived the 3D coordinates of the markers.
- Derivation of the flap angle: The 3D coordinate data set of the detected markers formed planes using adjacent three points; we assessed the normal vectors of those planes. We computed the flap angle with the difference from the reference flap angle of 0 degrees. Note that we decomposed normal vectors in three axial directions; we utilized only two vectors orthogonal to the flap hinge line for measuring the flap angle.
3. System Configuration
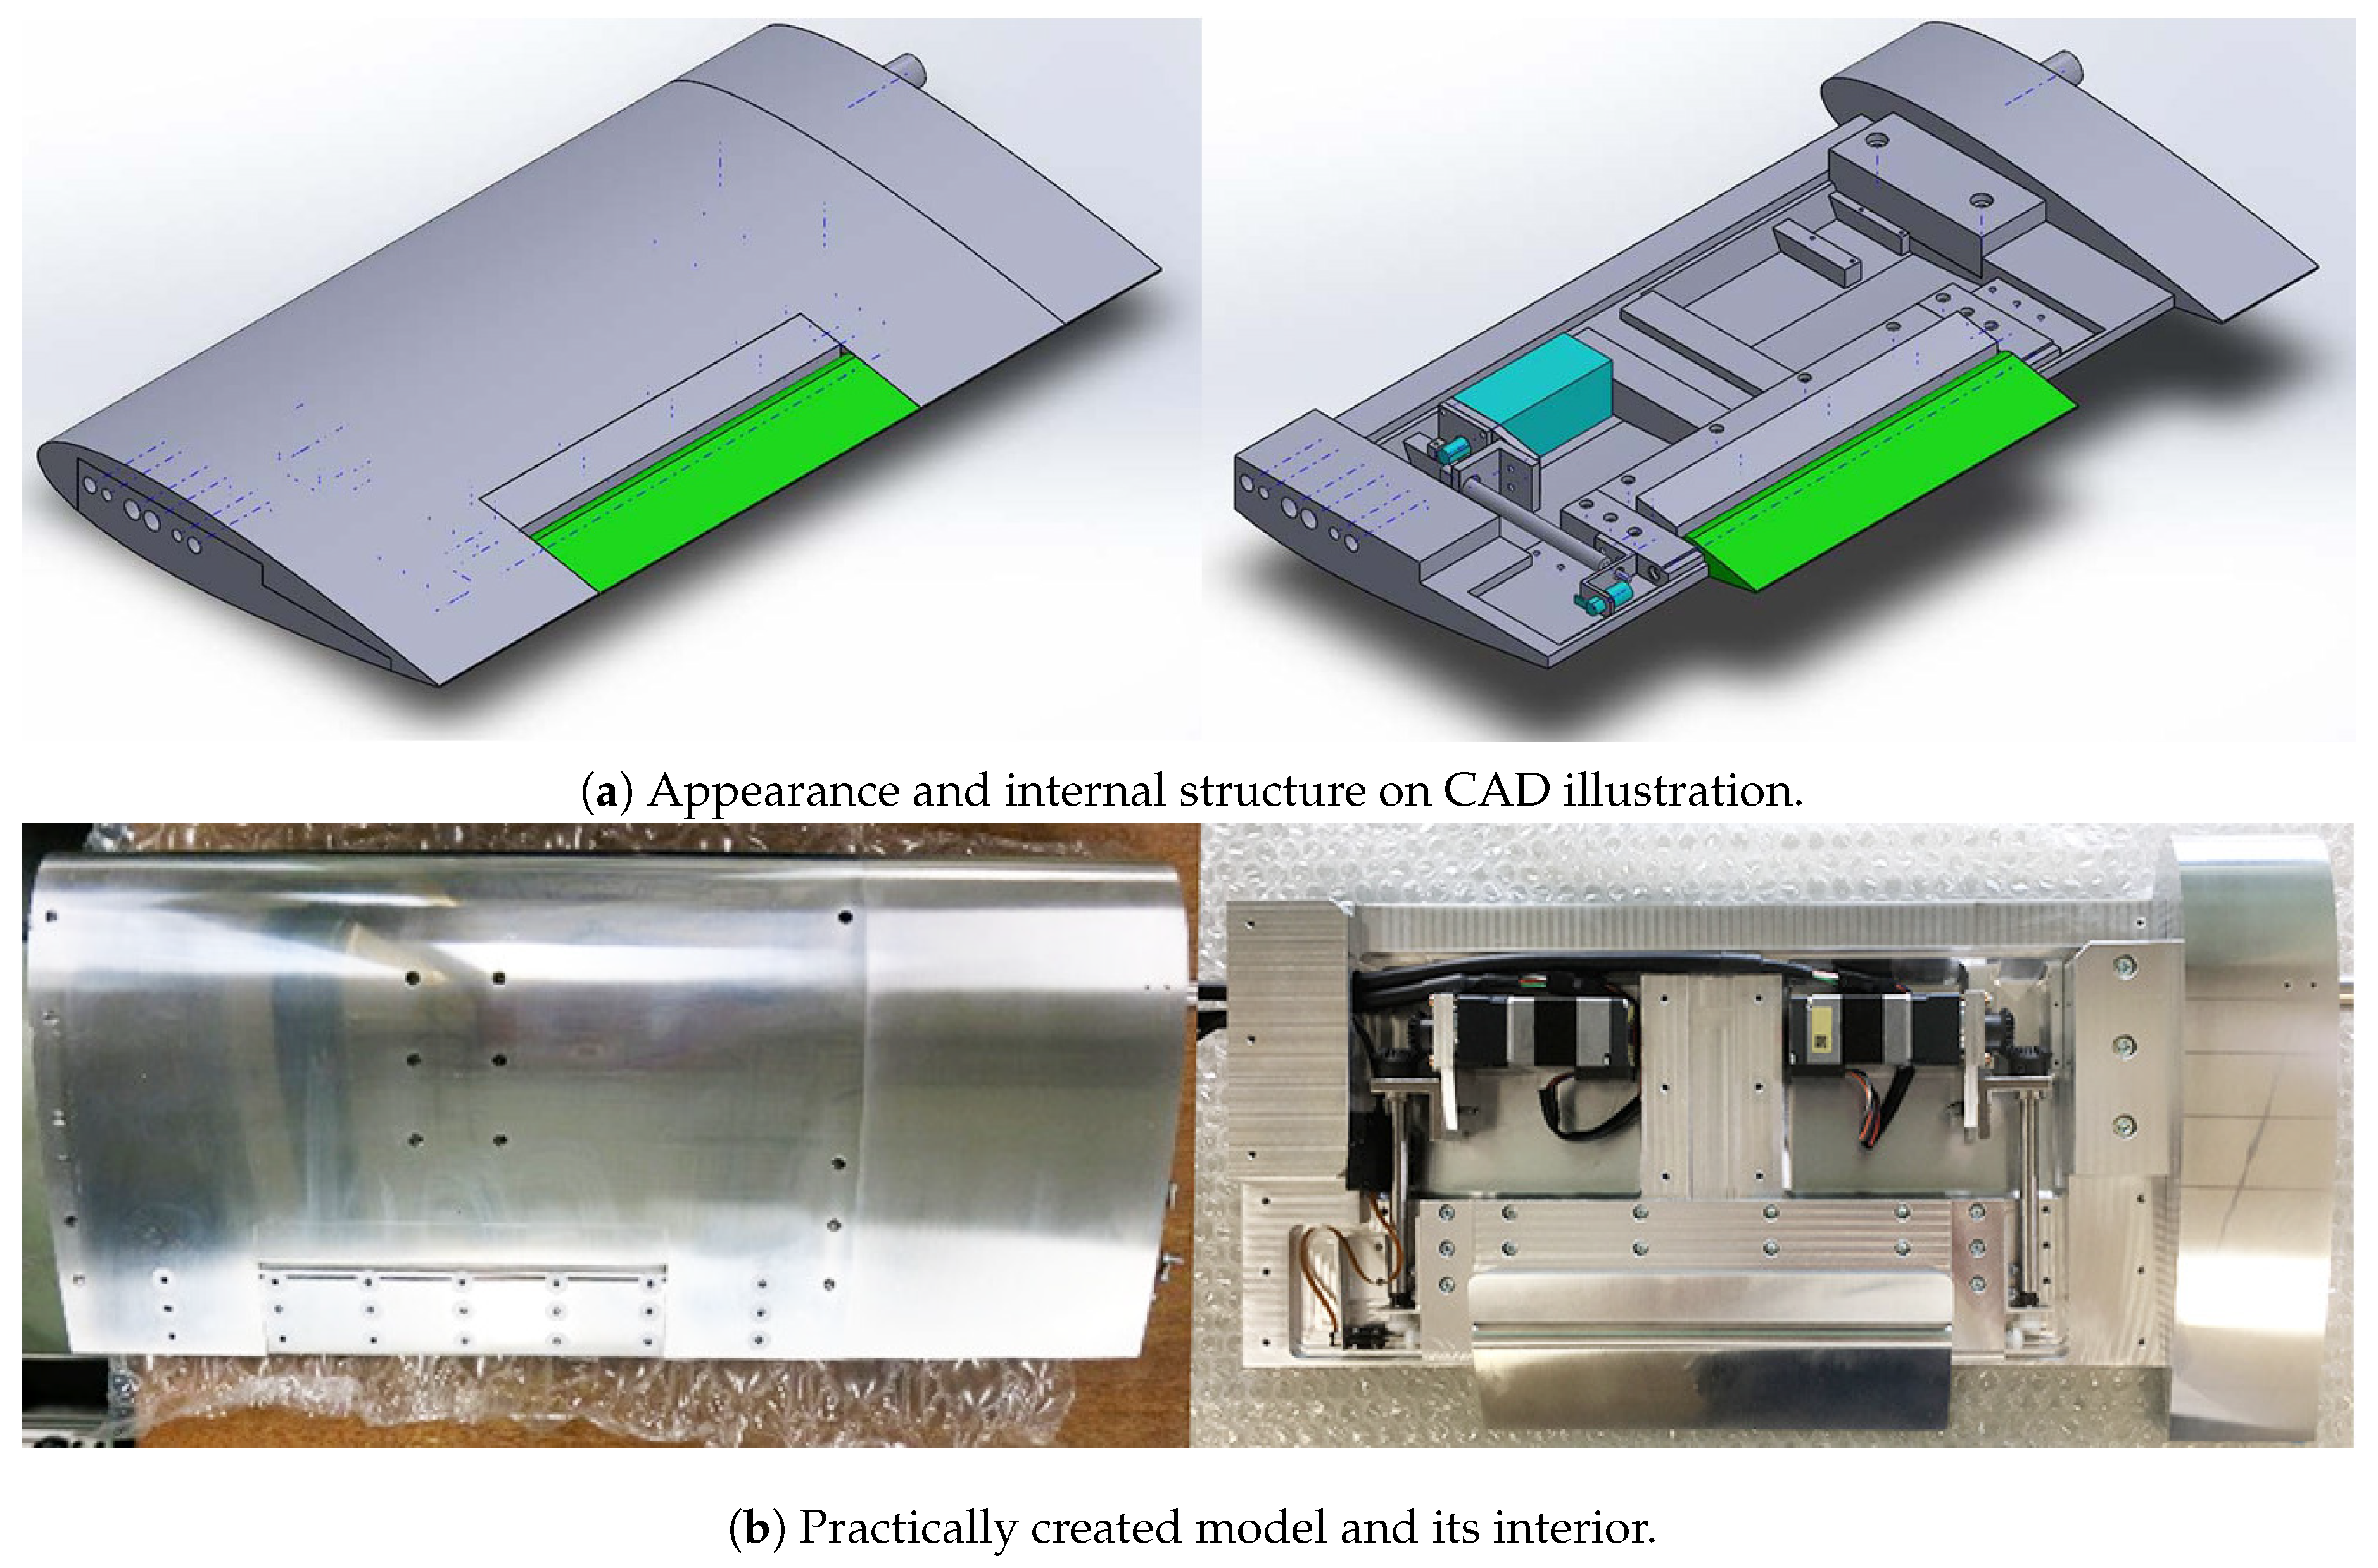
3.1. Wind Tunnel Test Model
- Stepping motor: ARM24SAK made by Oriental Motor Co., Ltd. (Tokyo, Japan). We selected an actuator driven by two stepping motors. This motor works through a pulse input; the resolution is 0.0036 degrees. The rotation speed is 70 rpm. For precise positioning of the flap, the backlash was prevented by rotating the two motors in pairs and rotating in opposite directions for the operating axis each other. The motor adopts harmonic gears; the speed reduction ratio is 100.
- Encoder: MAS-3-4096N1 made by MicroTech Laboratory Inc. (Sagamihara, Kanagawa-prefecture, Japan). To mechanically measure the rotation angle of the operating axis directly, we installed a small encoder whose resolution is the catalog value of 0.088 degrees.
3.2. Instruments for Optical Measurement
- Camera: We used Manta G-1236B made by Ad Science Inc. (Funabashi, Chiba-prefecture, Japan). This gigabit ethernet camera has a SONY IMX304 CMOS progressive sensor; the resolution is 4112 × 3008 dpi.
- Lighting device: A Xenon light source made by Hamamatsu Photonics K. K. (Hamamatsu, Shizuoka-prefecture, Japan). Light sources are necessary for taking images in the wind tunnel. We selected them based on past experimental reports in JAXA.
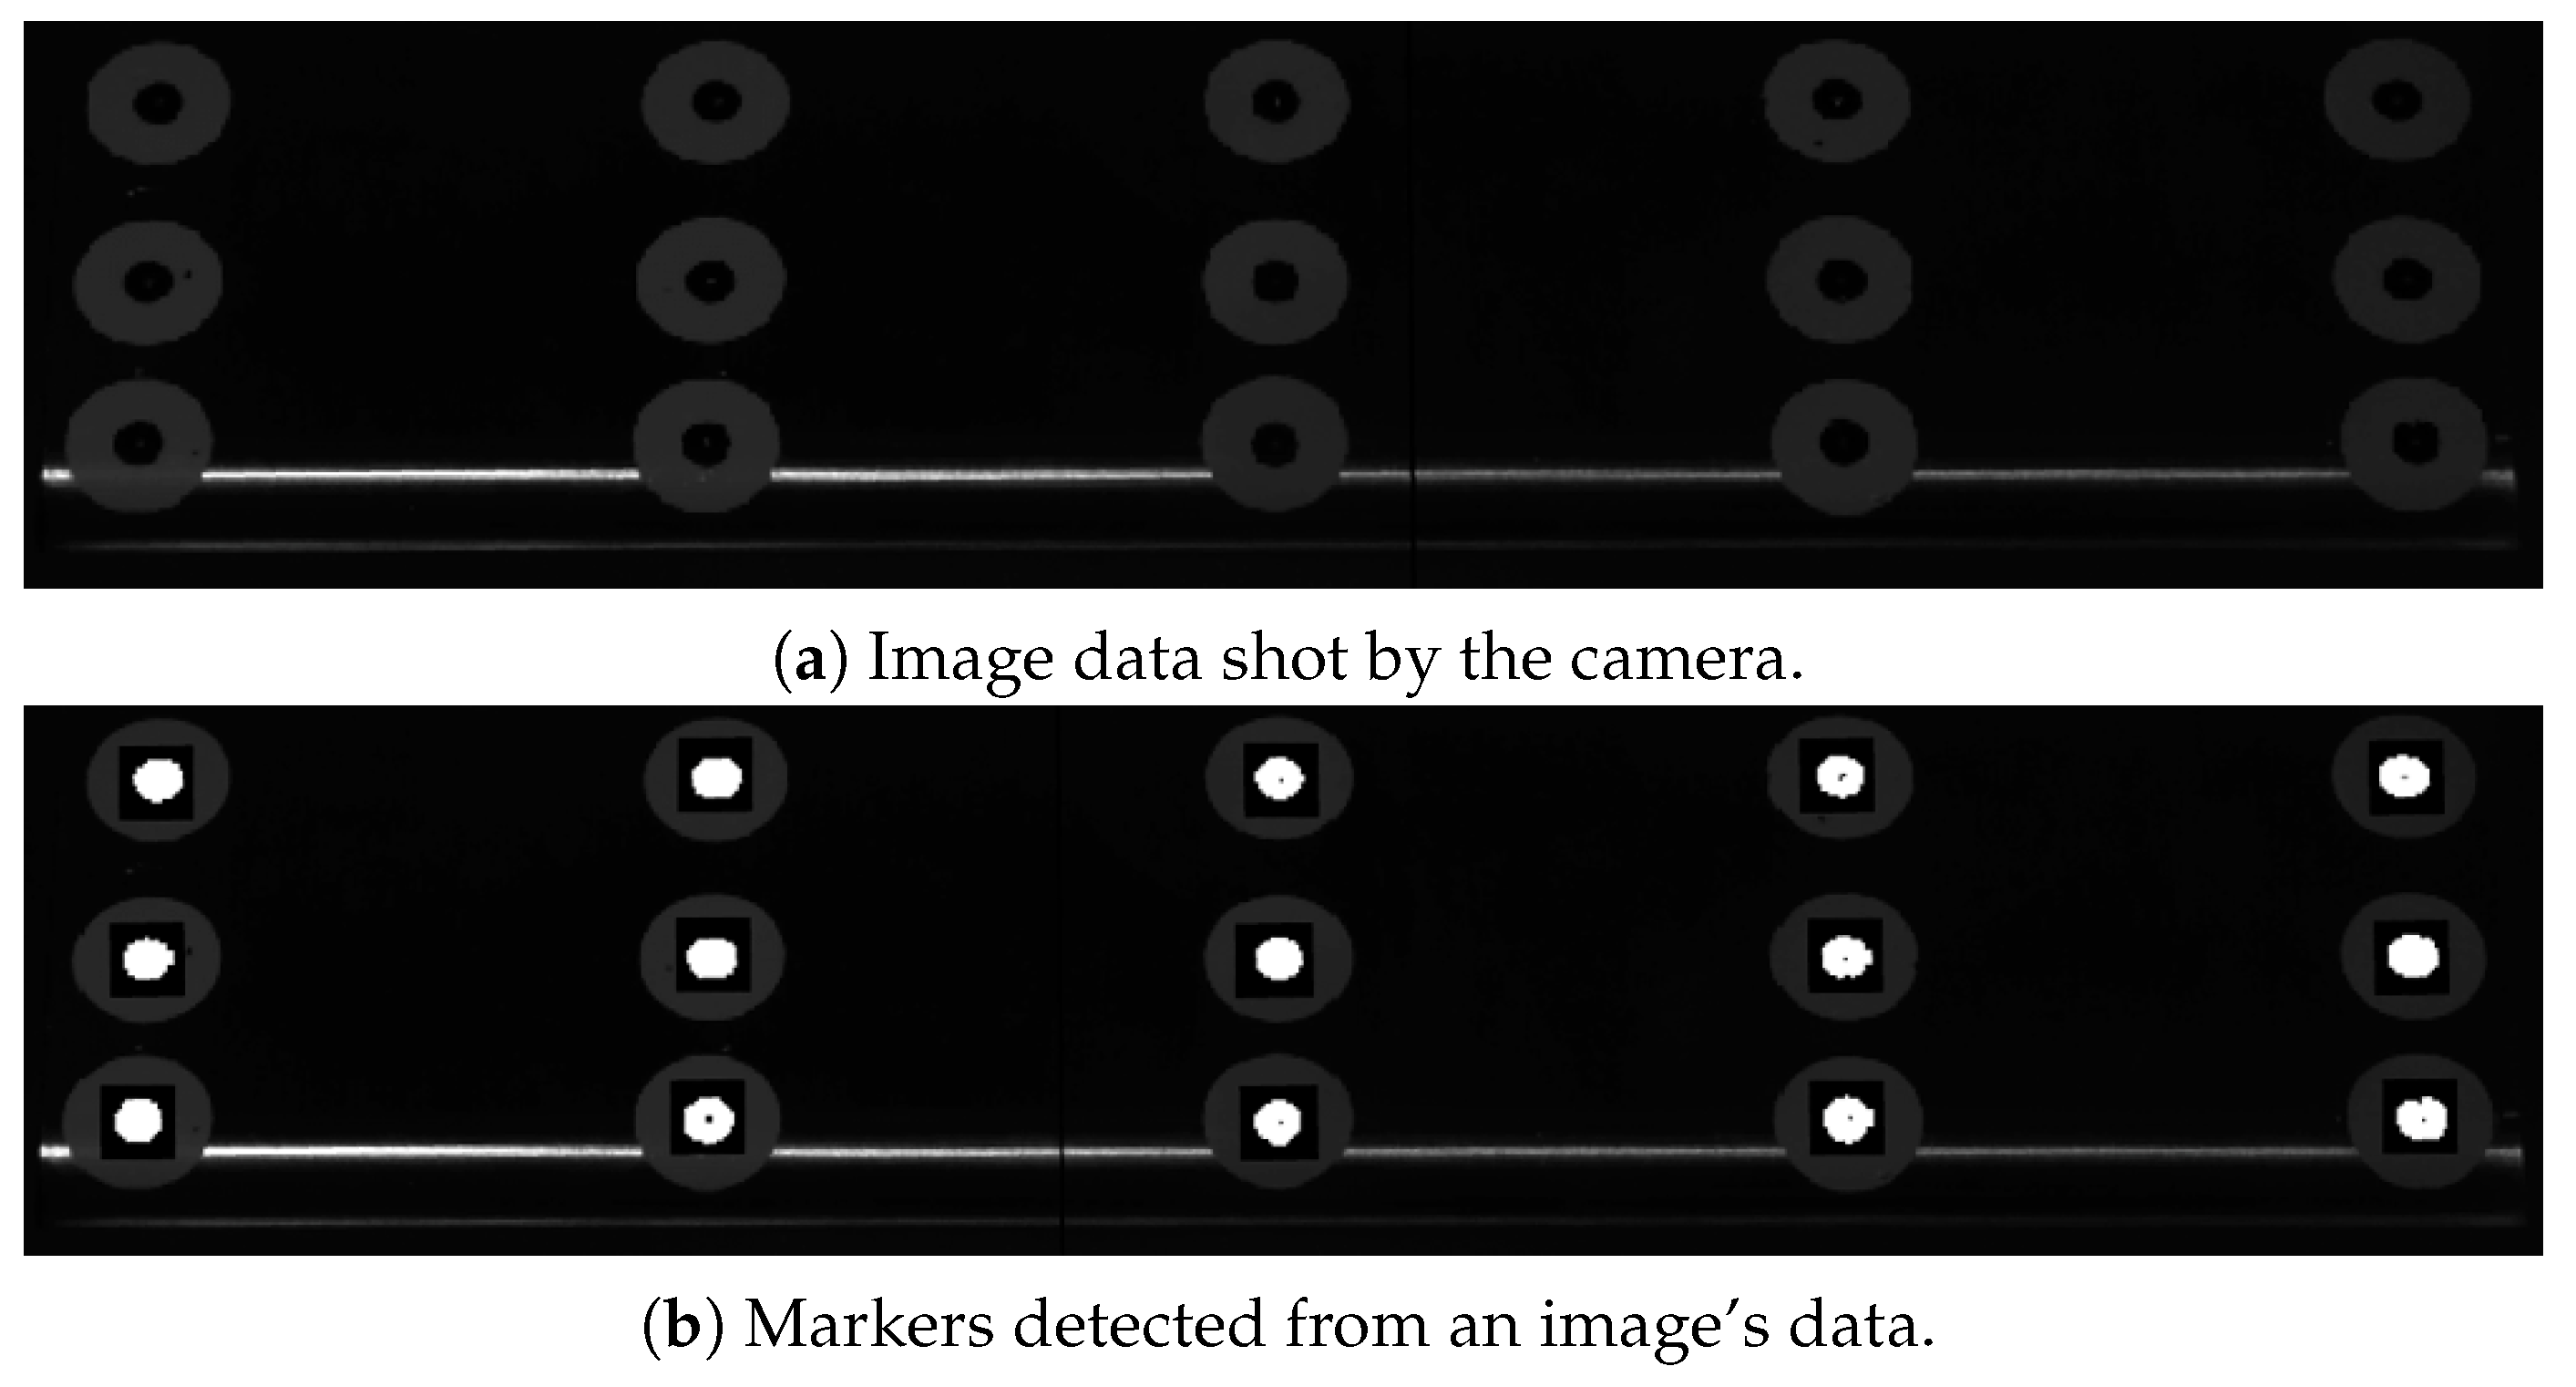
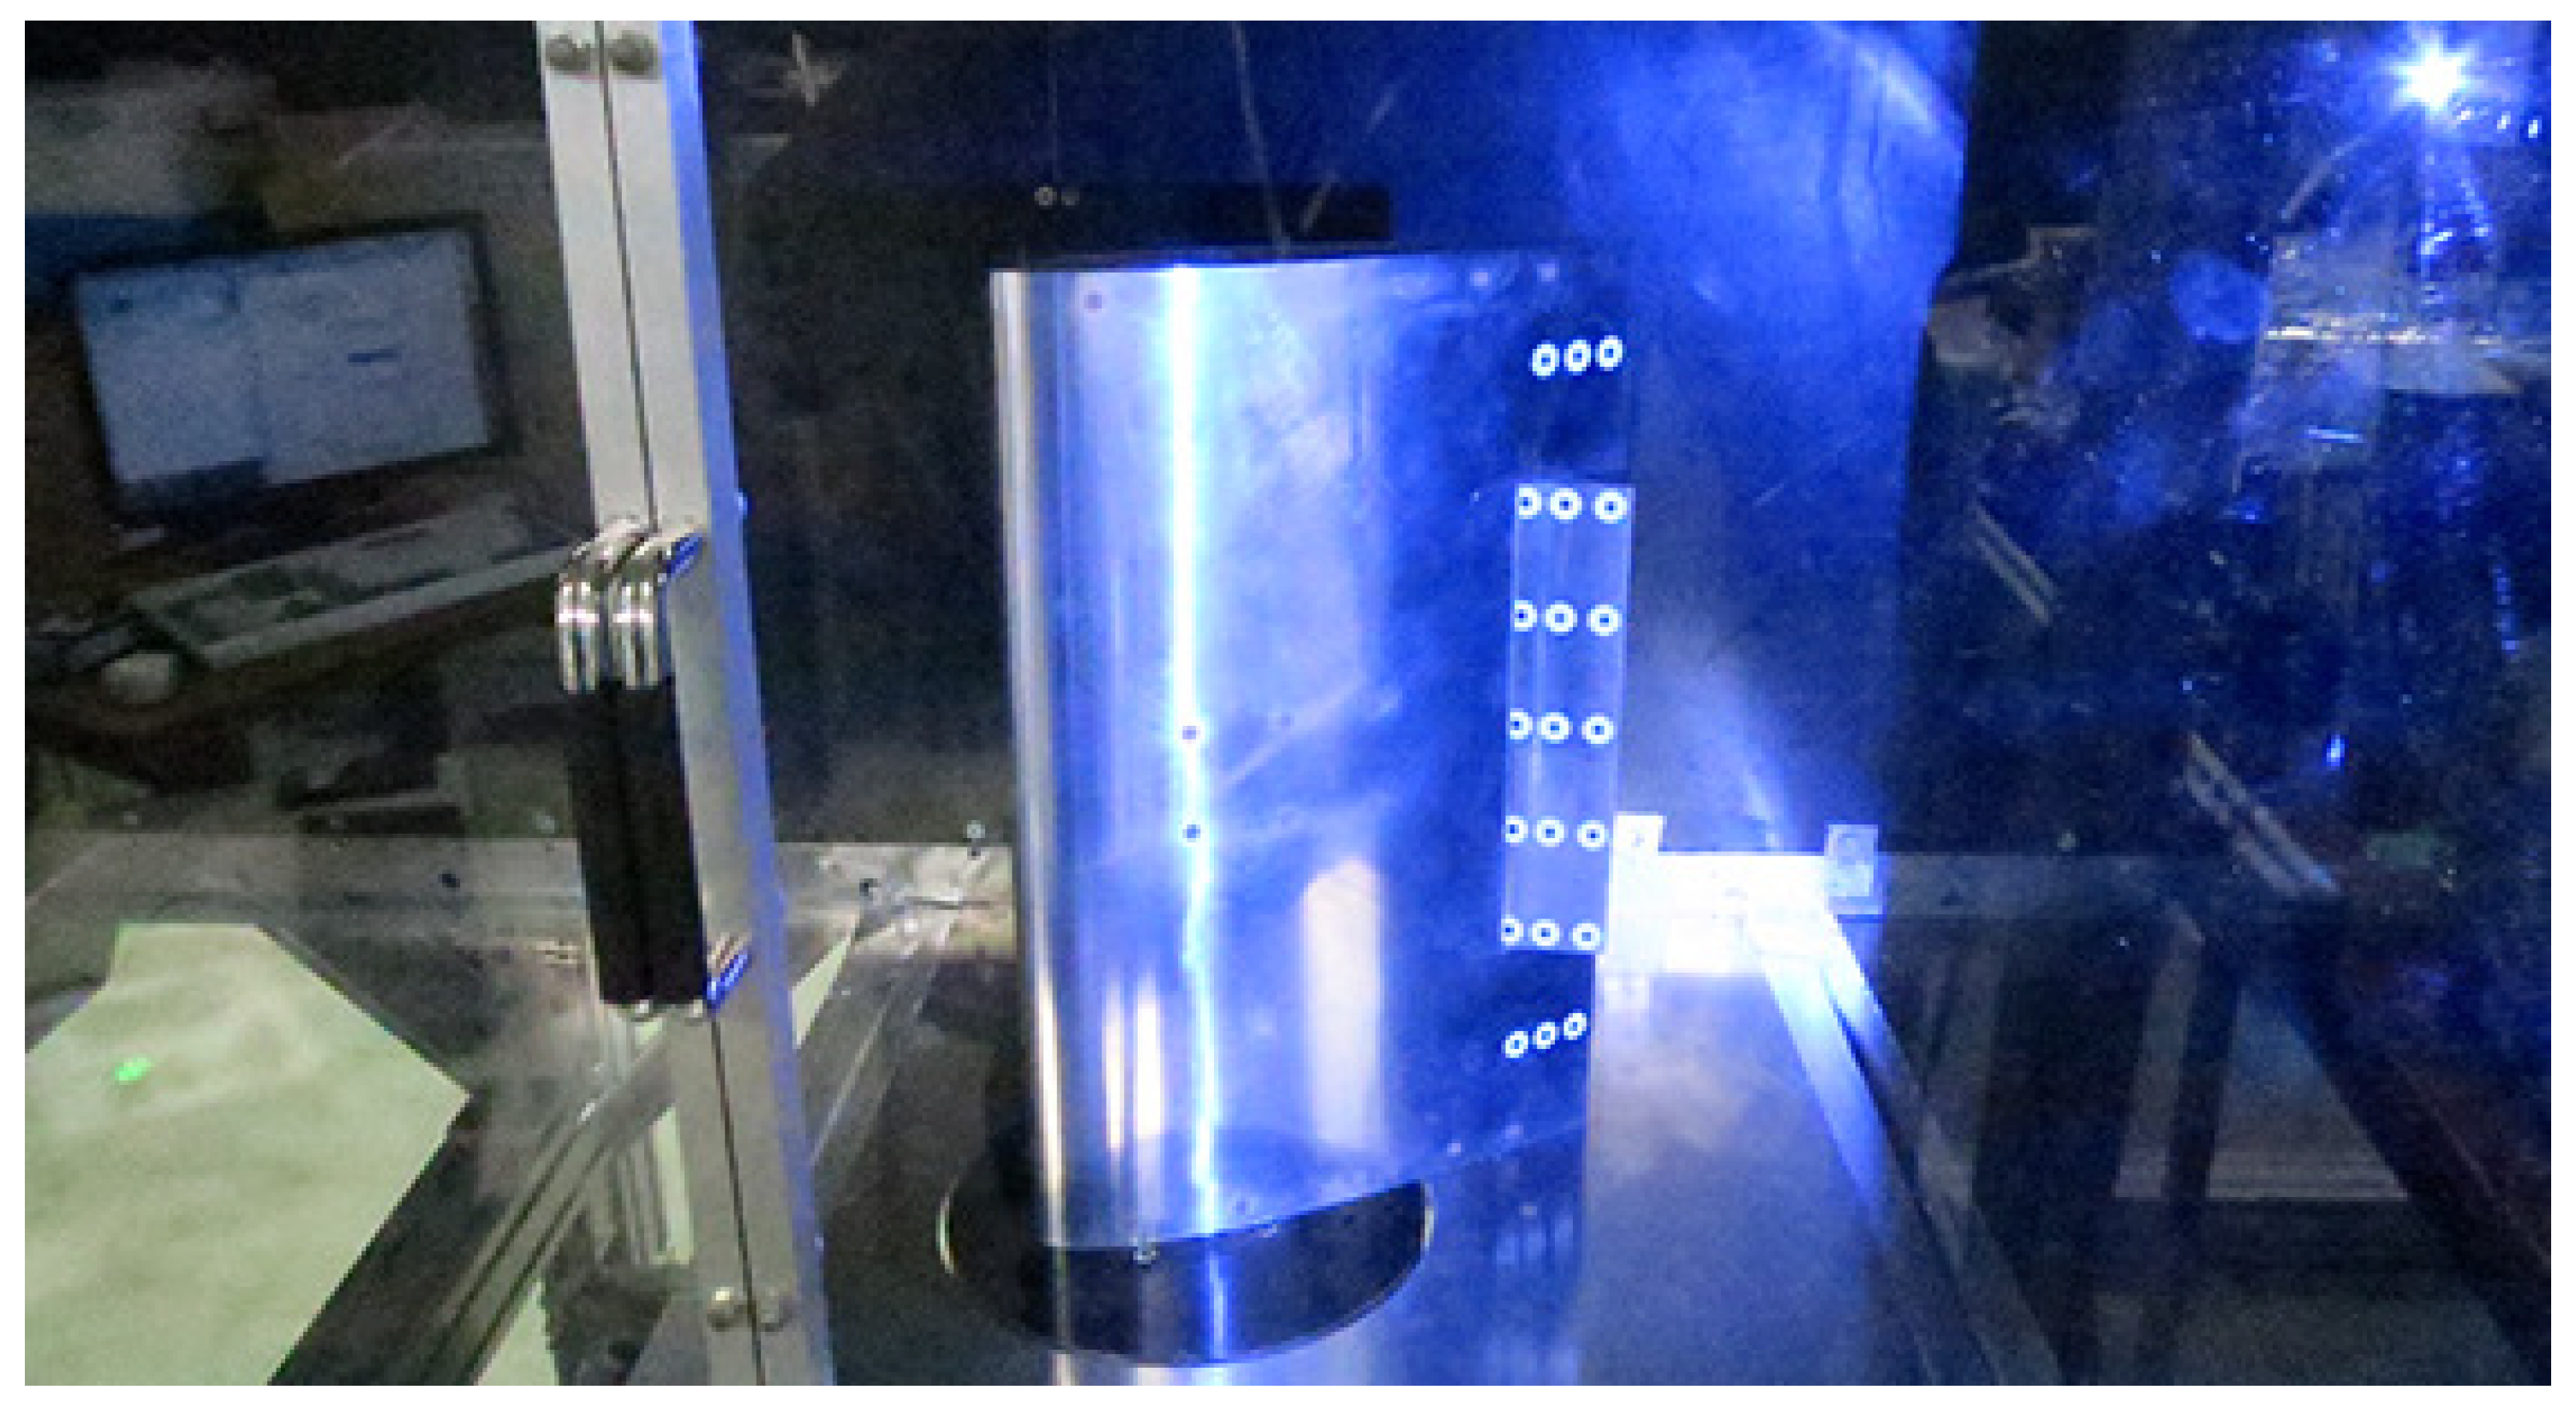
- Marker: We attached markers for optical measurement to the model surface with dual layers. The first layer uses white seals with a diameter of 16 mm; the second layer utilizes black transfer markers with of 8 mm. Although the first layer is not always necessary, we used it to improve the recognition rate. As shown in Figure 4, we can explicitly detect the markers from the model image data.
3.3. Instruments for Aerodynamic Measurement
- Three-component force detector: We adopted LMC-3520A-500N made by NISSYO-ELECTRIC-WORKS CO., LTD. (Tokyo, Japan). A DC amplifier DSA-100B amplifies the voltage output from the detector; the secondary calibrator CAL-100-3B calibrates it. Both pieces of equipment are made by NISSYO-ELECTRIC-WORKS CO., LTD., too.
- Pressure scanner: We utilized an Intelligent Pressure Scanner 9016 made by Pressure Systems, Inc. (Hampton, VA, USA).
- I/O device: We accepted two: NI USB-6501 to input encoder binary data and NI USB-6216BNC to output stepping motor pulse. National Instruments Co. (Austin, TX, USA) manufactures both devices.
4. Performance Test Results for Remote and Feedback Control by Optical Measurement
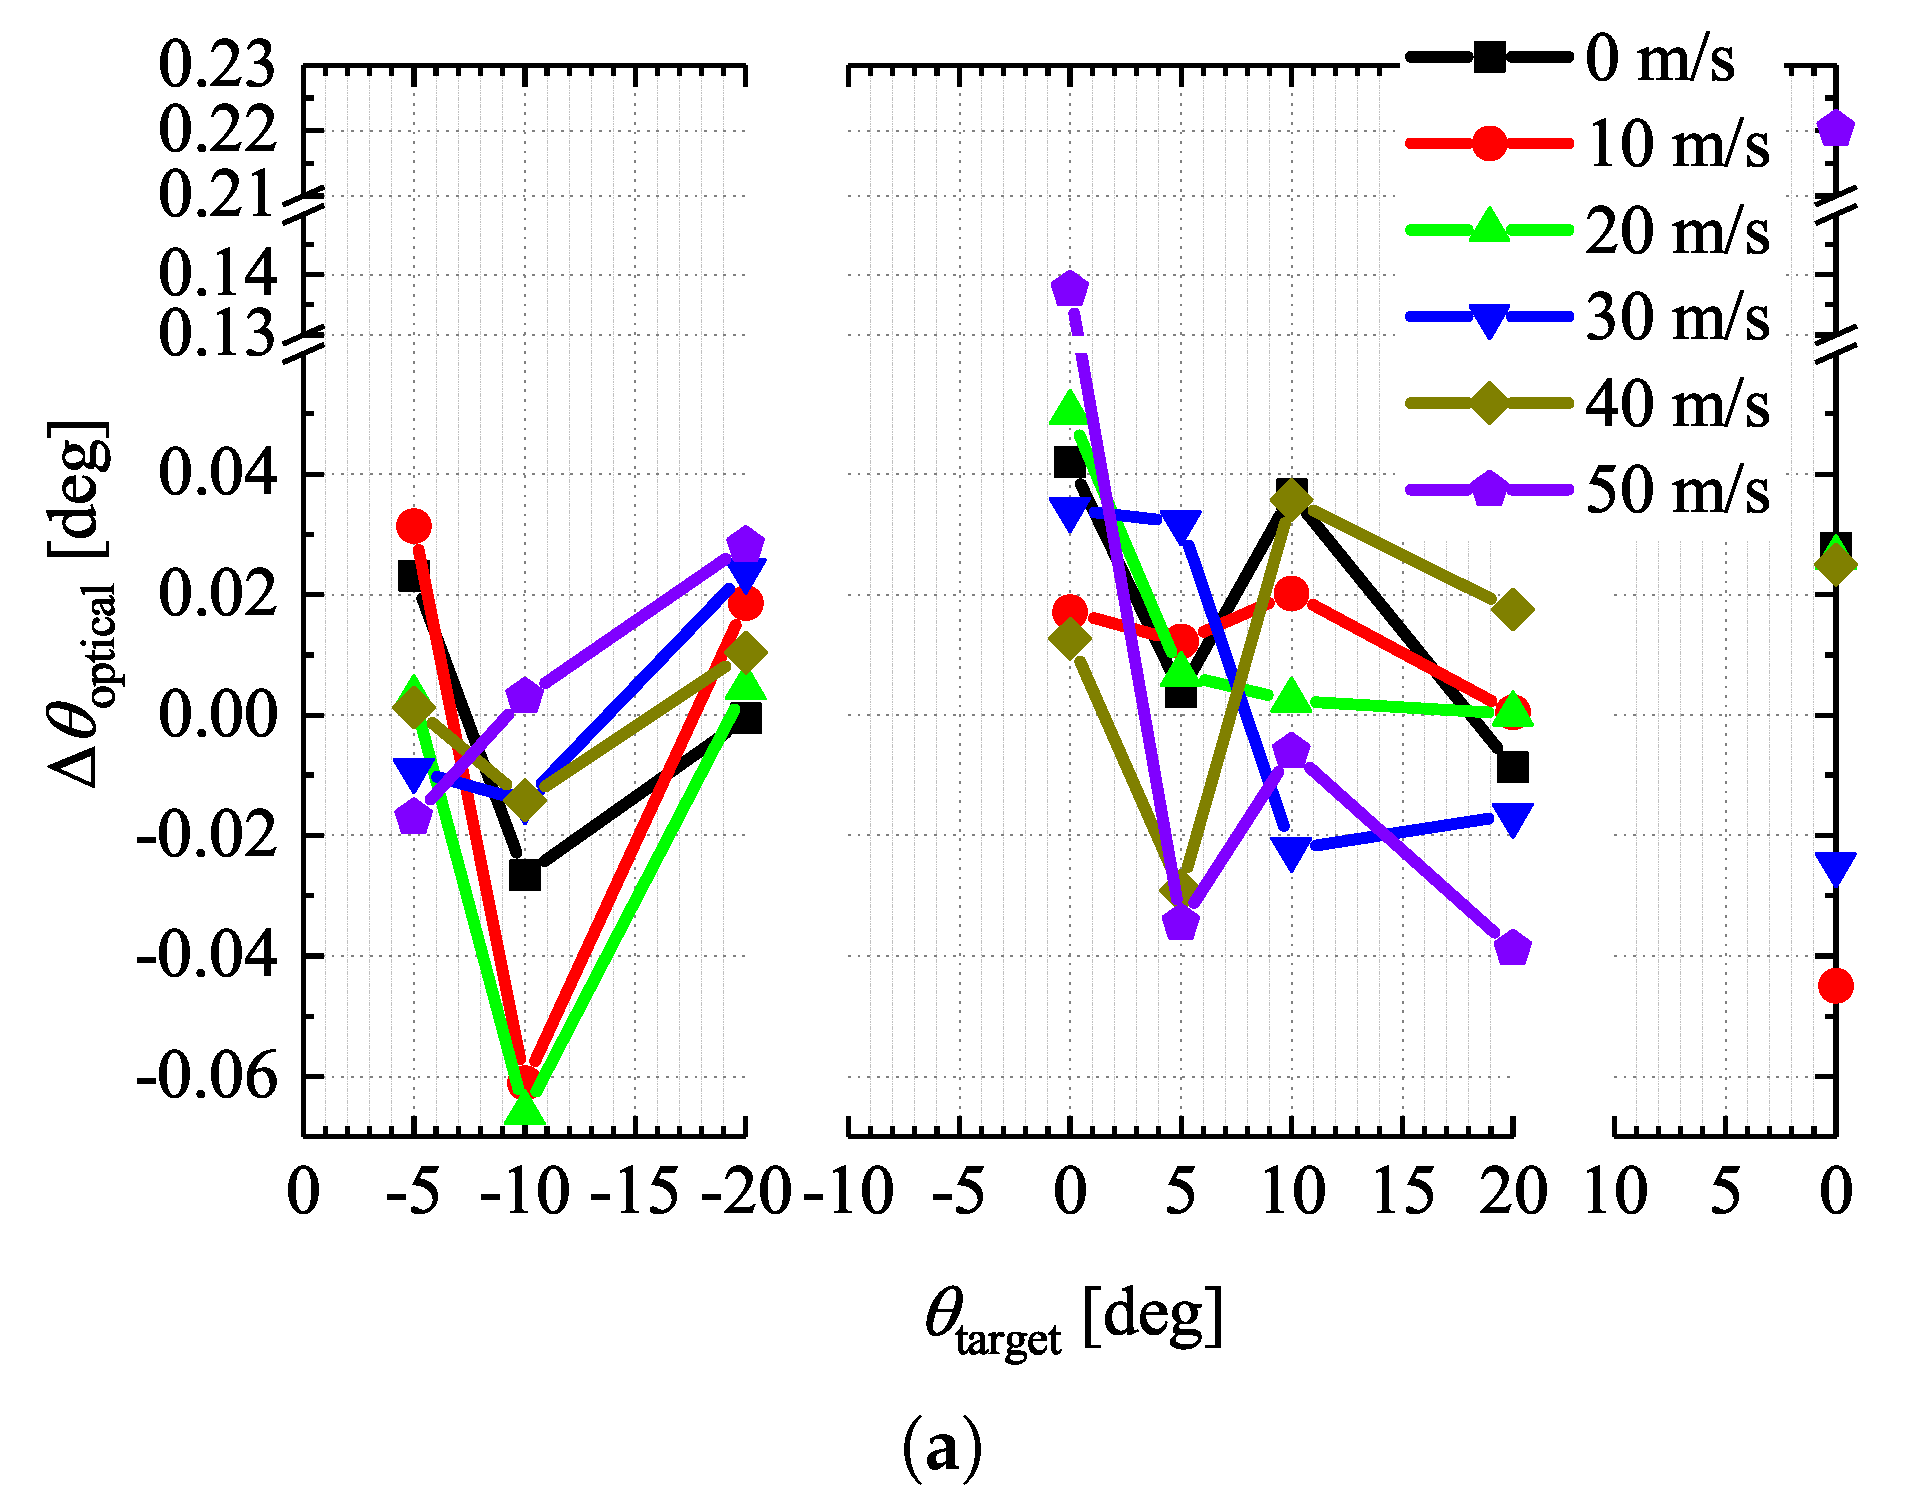
- The result in Figure 6a does not depend on any mechanical characteristics, such as the encoder resolution and the stepping motor’s play. Thus, final errors by are small.
- Several results succeeded in inhibiting in the order of . If we arrange the current convergence criterion given by Equation (2) more strictly, final errors by can decline further.
- The controlled actuator speed is roughlyexcept for 40 and 50 m/s wind velocity. Note that t denotes the time required for control. Thus, a unit time of roughly at least 5.0 s/degrees is requisite for actuator rotations in the feedback control by . It takes time to control because we need the time to earn flap angles via optical measurement (obtaining the image with the cameras, detecting the markers, and computing flap angles).
- The feedback control by rigorously measures the minute movement prompted by the system’s play and the deformation of the wind tunnel model, so it takes long to converge using ; the convergence of becomes more troublesome as the wind speed is boosted. Since we cannot eliminate the mechanical play of the actuator, it is impossible in principle to make zero.
- Due to the above reason, the number of times of control is inevitably necessary for positioning near . Thereupon, regardless of the wind speeds, the recurrence of the control by rises. Moreover, the number of control times around abruptly grows under conditions at 40 m/s or more flow velocities, but optical measurement technology does not induce this issue. As the wind velocity gains, the aerodynamic force matures stronger; the wind tunnel test model becomes liable to deform.
5. Conclusions
Author Contributions
Acknowledgments
Conflicts of Interest
Appendix A. Attempt at Measuring Aerodynamic Three Coefficients


| Case # | Angle of Attack of the Main Wing (deg) | Wind Speed (m/s) | Sweep Range of the Flap (deg) |
|---|---|---|---|
| 1 | 0 | 20 | from 0 to 40 |
| 2 | 0 | 40 | from 0 to 40 |
| 3 | 21 | 20 | from −40 to 45 |

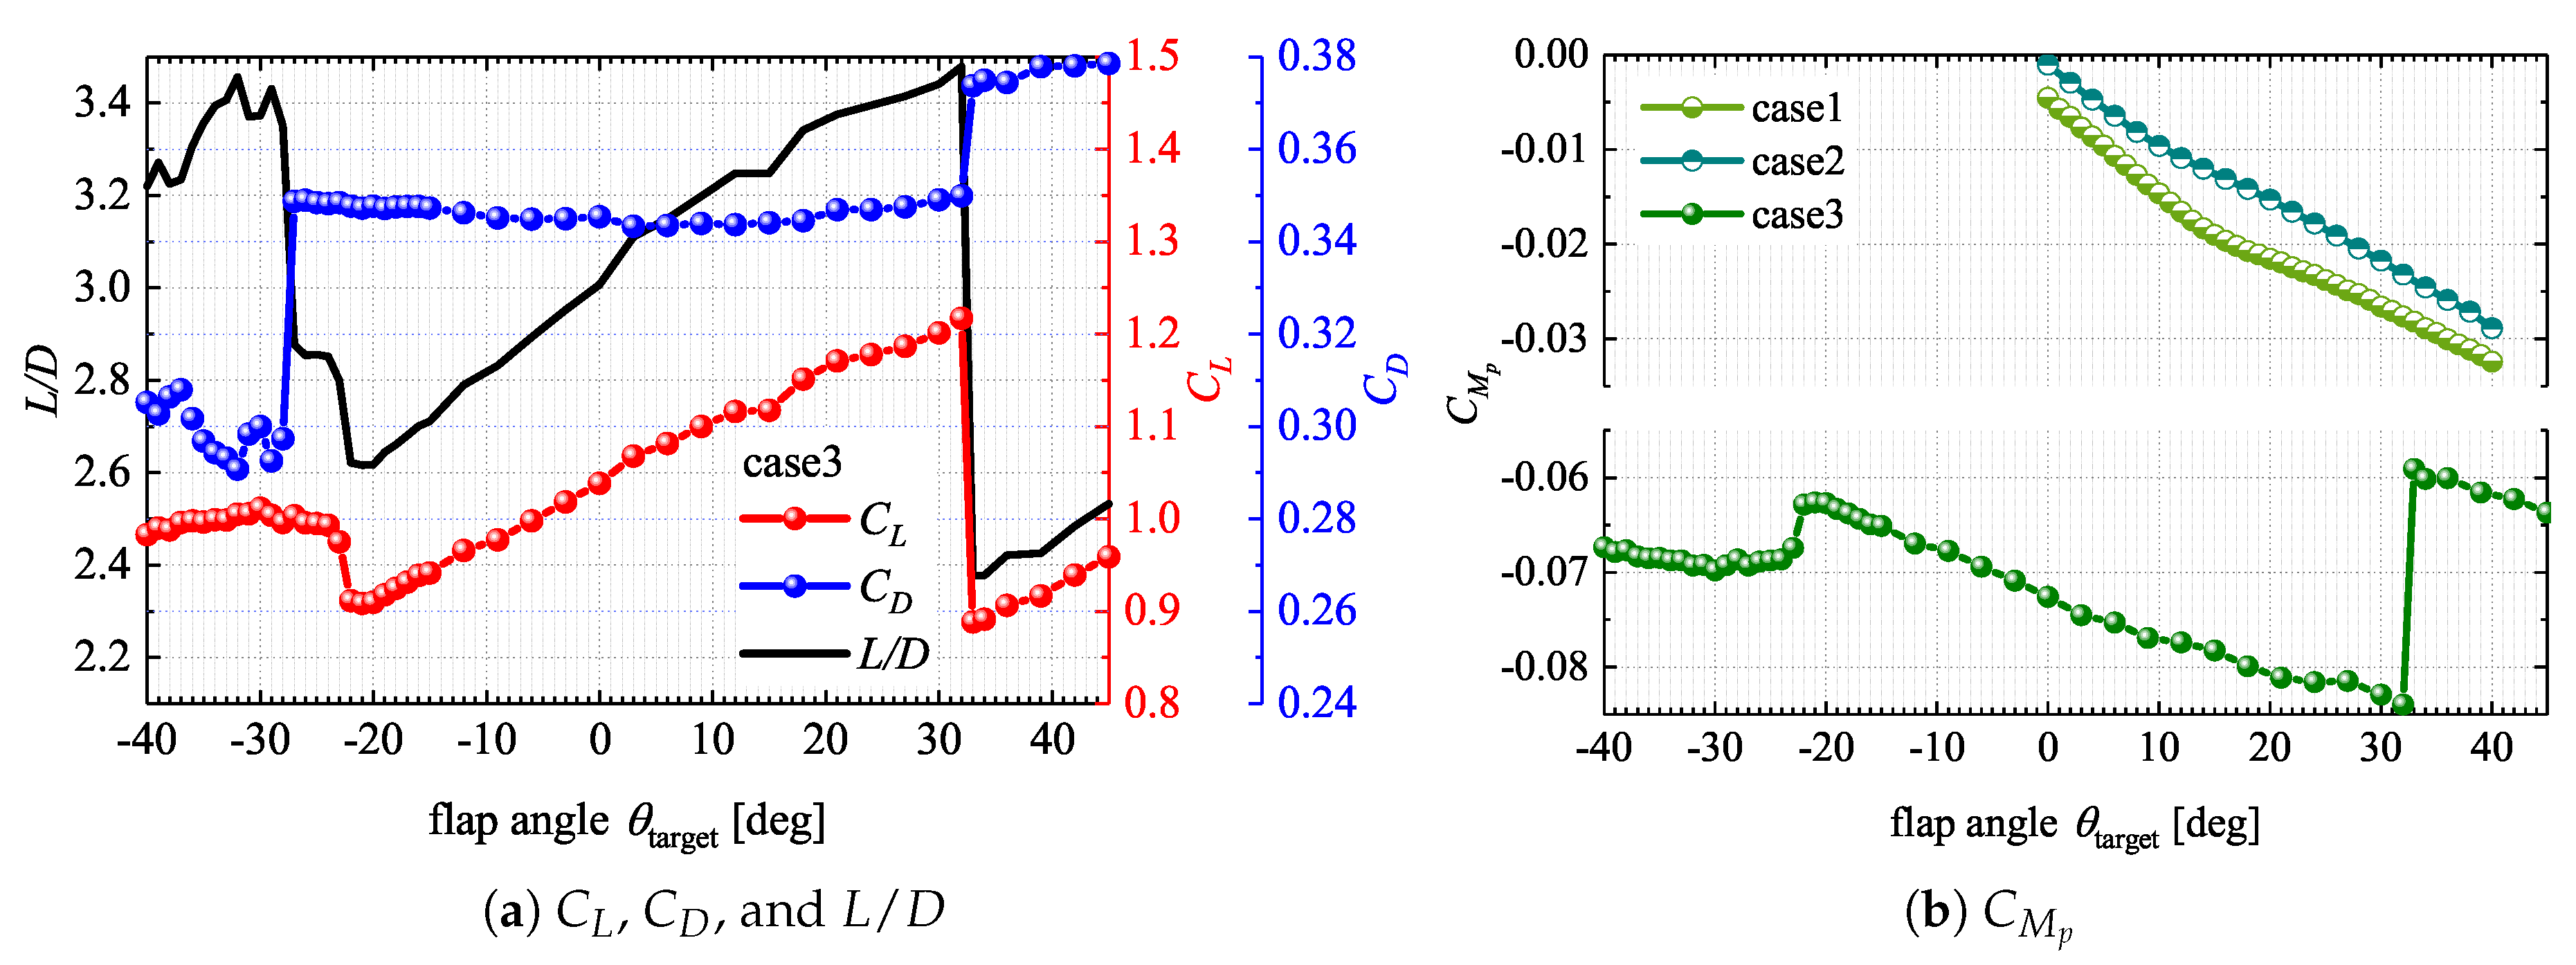
- (i)
- A separation that occurs on the main wing upper surface interferes with the flap.
- (ii)
- Since the flap is lying down, it entirely goes inside the separation that arises on the main wing.
- (iii)
- Since we set 21 degrees for the angle of attack of the main wing, the flap is horizontal at of degrees. over 21 degrees commences activating the flap; the lift gains linearly.
- (iv)
- The flap works as a spoiler because the flap is 54 degrees or more for the uniform stream.
References
- van Dam, C.P. The Aerodynamic Design of Multi-Element High-Lift Systems for Transport Airplanes. Prog. Aerosp. Sci. 2002, 38, 101–144. [Google Scholar] [CrossRef] [Green Version]
- Rogers, M.M. Progress towards the CFD Vision 2030; NASA Technical Reports ARC-E-DAA-TN60442; NASA: Washington, DC, USA, 2018.
- Mavriplis, D.J. Progress in CFD Discretizations, Algorithms and Solvers for Aerodynamic Flows; AIAA Paper 2019-2944 on the AIAA Aviation 2019 Forum; AIAA: Reston, VA, USA, 2019. [Google Scholar] [CrossRef]
- Chawner, J.R.; Taylor, N.J. Progress in Geometry Modeling and Mesh Generation toward the CFD Vision 2030; AIAA Paper 2019-2945 on the AIAA Aviation 2019 Forum; AIAA: Reston, VA, USA, 2019. [Google Scholar] [CrossRef]
- Rumsey, C.L.; Slotnick, J.P.; Long, M.; Stuever, R.A.; Wayman, T.R. Summary of the First AIAA CFD High-Lift Prediction Workshop. J. Aircr. 2011, 48, 2068–2079. [Google Scholar] [CrossRef]
- Rumsey, C.L.; Slotnick, J.P. Overview and Summary of the Second AIAA High-Lift Prediction Workshop. J. Aircr. 2015, 52, 1006–1025. [Google Scholar] [CrossRef] [Green Version]
- Rumsey, C.L.; Slotnick, J.P.; Sclafani, A.J. Overview and Summary of the Third AIAA High-Lift Prediction Workshop. J. Aircr. 2018, 56, 621–644. [Google Scholar] [CrossRef]
- Adrian, R.J. Particle-Imaging Techniques for Experimental Fluid Mechanics. Ann. Rev. Fluid Mech. 1991, 23, 261–304. [Google Scholar] [CrossRef]
- McLachlan, B.G.; Bell, J.H. Pressure-Sensitive Paint in Aerodynamic Testing. Exp. Therm. Fluid Sci. 1995, 10, 470–485. [Google Scholar] [CrossRef]
- Gregory, J.W.; Asai, K.; Kameda, M.; Liu, T.; Sullivan, J.P. A Review of Pressure-Sensitive Paint for High-Speed and Unsteady Aerodynamics. Proc. Inst. Mech. Eng. Part G J. Aerosp. Eng. 2008, 222, 249–290. [Google Scholar] [CrossRef]
- Bergmann, A.; Huebner, A.; Loeser, T. Experimental and Numerical Research on the Aerodynamics of Unsteady Moving Aircraft. Prog. Aerosp. Sci. 2008, 44, 121–137. [Google Scholar] [CrossRef]
- Bergmann, A. Modern Wind Tunnel Techniques for Unsteady Testing—Development of Dynamic Test Rigs. In Hermann Schlichting—100 Years. Notes on Numerical Fluid Mechanics and Multidisciplinary Design; Springer: Berlin/Heidelberg, Germany, 2009; Volume 102, pp. 59–77. [Google Scholar] [CrossRef]
- Ulrich, A.; Akkerman, E.; Kotschote, J.; Villa, A. Remotely Controlled Movable Surface Motorization of an Industrial Used Wind Tunnel Model; AIAA Paper 2010-4338 on the 27th AIAA Aerodynamic Measurement Technology and Ground Testing Conference; AIAA: Reston, VA, USA, 2010. [Google Scholar]
- Smith, C.A. Wind Tunnel Model Measuring System and Method. US 8,783,098 B2, 22 July.
- Ternoy, F.; Dandois, J.; David, F.; Pruvost, M. Overview of Onera Actuators for Active Flow Control. AerospaceLab 2013, 6, 1–14. [Google Scholar]
- Asai, K.; Amao, Y.; Iijima, Y.; Okura, I.; Nishide, H. Novel Pressure-Sensitive Paint for Cryogenic and Unsteady Wind-Tunnel Testing. J. Thermophys. Heat Transf. 2002, 16, 109–115. [Google Scholar] [CrossRef]
- Nakakita, K.; Kurita, M.; Mitsuo, K.; Watanabe, S. Practical pressure-sensitive paint measurement system for industrial wind tunnels at JAXA. Meas. Sci. Technol. 2006, 17, 359–366. [Google Scholar] [CrossRef]
- Watanabe, S.; Kato, H.; Kwak, D.Y.; Shirotake, M.; Rinoie, K. Stereoscopic PIV measurements of leading edge separation vortices on a cranked arrow wing. Meas. Sci. Technol. 2004, 15, 1079–1089. [Google Scholar] [CrossRef]
- Kato, H.; Koike, S.; Nakakita, K. Time-Resolved Stereoscopic PIV Measurement of Unsteady Wingtip Flowfield; AIAA Paper 2012-0035; AIAA: Reston, VA, USA, 2012. [Google Scholar] [CrossRef]
- Nakakita, K. Simultaneous Visualization of Transonic Buffet on a Rocket Faring Model Using Unsteady PSP Measurement and Schlieren Method. In Proceedings of the The 31st International Congress on High-Speed Imaging and Photonics, Osaka, Japan, 7–10 November 2016. [Google Scholar] [CrossRef]


| Part | Dimensions (mm) |
|---|---|
| Main wing chord length | 250 |
| Main wing span length (configuration supported on one side) | 390 |
| Main wing span length (configuration supported on both sides) | 550 |
| Flap chord length | 50 |
| Flap span length | 200 |
© 2020 by the authors. Licensee MDPI, Basel, Switzerland. This article is an open access article distributed under the terms and conditions of the Creative Commons Attribution (CC BY) license (http://creativecommons.org/licenses/by/4.0/).
Share and Cite
Chiba, K.; Komatsu, T.; Kato, H.; Nakakita, K. Remote and Feedback Control of the Flap Angle in a Wind Tunnel Test Model by Optical Measurement. Aerospace 2020, 7, 11. https://doi.org/10.3390/aerospace7020011
Chiba K, Komatsu T, Kato H, Nakakita K. Remote and Feedback Control of the Flap Angle in a Wind Tunnel Test Model by Optical Measurement. Aerospace. 2020; 7(2):11. https://doi.org/10.3390/aerospace7020011
Chicago/Turabian StyleChiba, Kazuhisa, Tatsuro Komatsu, Hiroyuki Kato, and Kazuyuki Nakakita. 2020. "Remote and Feedback Control of the Flap Angle in a Wind Tunnel Test Model by Optical Measurement" Aerospace 7, no. 2: 11. https://doi.org/10.3390/aerospace7020011