Article

A Novel Control Allocation Method for Yaw Control of Tailless Aircraft

by
Thomas R. Shearwood
1,*,
Mostafa R. A. Nabawy
1,
William J. Crowther
1 and
Clyde Warsop
2
1
Department of Mechanical, Aerospace and Civil Engineering, University of Manchester, Manchester M13 9PL, UK
2
BAE Systems Air, Filton, Bristol BS34 7QW, UK
*
Author to whom correspondence should be addressed.
Aerospace 2020, 7(10), 150; https://doi.org/10.3390/aerospace7100150
Submission received: 17 September 2020 / Revised: 8 October 2020 / Accepted: 13 October 2020 / Published: 19 October 2020
(This article belongs to the Special Issue Aircraft Modeling for Design, Simulation and Control)

Abstract

:
Tailless aircraft without vertical stabilisers typically use drag effectors in the form of spoilers or split flaps to generate control moments in yaw. This paper introduces a novel control allocation method by which full three-axis control authority can be achieved by the use of conventional lift effectors only, which reduces system complexity and control deflection required to achieve a given yawing moment. The proposed method is based on synthesis of control allocation modes that generate asymmetric profile and lift induced drag whilst maintaining the lift, pitching moment and rolling moment at the trim state. The method uses low order models for aerodynamic behaviour characterisation based on thin aerofoil theory, lifting surface methodology and ESDU datasheets and is applied to trapezoidal wings of varying sweep and taper. Control allocation modes are derived using the zero-sets of surrogate models for the characterised aerodynamic behaviours. Results are presented in the form of control allocations for a range of trimmed sideslip angles up to 10 degrees optimised for either maximum aerodynamic efficiency (minimum drag for a specific yawing moment) or minimum aggregate control deflection (as a surrogate observability metric). Outcomes for the two optimisation objectives are correlated in that minimum deflection solutions are always consistent with efficient ones. A configuration with conventional drag effector is used as a reference baseline. It is shown that, through appropriate allocation of lift based control effectors, a given yawing moment can be produced with up to a factor of eight less aggregate control deflection and up to 30% less overall drag compared to use of a conventional drag effector.

1. Introduction

Current performance and operational requirements for low observable aircraft drive the design towards finless low aspect ratio flying wing configurations with a leading edge sweep between 45–60 degrees [1,2,3]. Yaw control is typically provided through laterally asymmetric deployment of drag-based aerodynamic control effectors in the form of spoilers or split elevons [4]. Whilst these devices are effective, there is a significant increase in required design effort and system complexity due to the strong pitch, roll and yaw coupling of these controls [5,6,7]. Furthermore, deployment of non-conformal surfaces to produce drag may have a significant impact on the observability of the platform [8,9]. Due to the use of multiple and diverse flight control effectors for redundancy reasons, the system is overactuated and there are typically many different actuation solutions to achieve a given control effect [10,11,12,13]. Hence, a key design problem is assigning appropriate control allocation using some or all of these controls to meet overall performance objectives.
Several previous studies have developed control strategies for wing-tip drag devices which attempt to minimise secondary control effects. Qu et al. [14] investigated the use of drag devices that are modulated about a permanently partially open state using computational fluid dynamics (CFD) simulations. This method showed little pitch and roll coupling at low angles of attack and improved the linearity of the control. However, the use of permanently deflected controls increases signature and reduces aerodynamic performance of the aircraft. Löchert et al. [1] investigated several forms of wing-tip drag devices and tip aligned spoilers using CFD simulations and experimental testing. They showed that folding wing-tips and spoilers at the wing-tips both produce significant cross-coupling, particularly in the roll axis. For a split elevon design at the wing tip, the cross coupling is significantly reduced; however, control surface deflections needed to meet lateral control effectiveness requirements were large (up to 45 degrees). Huber et al. [15] performed experimental tests on a split elevon located inboard of the wing-tip. These experiments showed a significant roll-yaw coupling with control surface deflection in contrast to results presented in [1]. It is, hence, evident that the secondary control effects of split elevons are sensitive to the spanwise location of the control surface.
There are a few studies that examine more unconventional methods for generating yawing moments on tailless aircraft. Yue et al. [16] explored the use of asymmetrically deployed telescopic wings. However, the influence on rolling moment was an order of magnitude greater than the yawing moment, limiting the usefulness of the concept. Xu et al. [17] explored the use of active flow control using synthetic jets to cause asymmetry in the leading edge vortex system. Again, the yaw control output of the method was very small compared to rolling and pitching moment.
As an alternative method of directional control, several studies have considered the use of asymmetries in induced drag to produce yawing moments [18,19,20,21]. These studies have demonstrated the potential of using changes in the lift distribution to induce laterally asymmetric drag whilst simultaneously achieving requirements for pitching and rolling moments. However, these studies have predominantly focused on identifying optimal lift distributions based upon results from lifting line analysis. Whilst useful theoretically, achieving these lift distributions in practice would require continuous spanwise control of twist or camber. Studies have demonstrated the possibility of achieving this continuous control through morphing structures [22,23], however this method of control significantly increases the control system complexity.
The current study explores the use of drag from lift based effectors only, to provide yaw control on a finless flying wing aircraft. The limitation to lift based effectors in the form of devices that locally change the effective camber of the wing is significant. These devices are necessarily already present as primary controls for pitch and yaw, and that the observability impact of these controls can be mitigated more easily than for non-conformal controls such as split elevons and spoilers [24]. Furthermore, there is an opportunity to achieve a given level of yaw control effectiveness at a lower overall level of airframe drag. The physical premise of the approach is based primarily on the exploitation of changes in induced drag generated by the lift effector. The lift effector will also have an impact on local profile drag, but, for a well implemented design, this will be significantly smaller than the change in induced drag [25]. The problem is posed in the form of allocation of lift based effectors to achieve a given level of yawing moment with zero coupling in pitching moment and rolling moment. The yawing moment correlates directly with trimmed sideslip angle for a given level of static directional stability. A novel contribution of the work lies in the development of appropriate low order aerodynamic modelling tools and mathematical techniques to identify control allocation modes that can be used to synthesise control inputs against different performance targets.
Section 2 provides background aerodynamic theory to the problem. The development of the control allocation method is described in Section 3 and the results of example cases are presented in Section 4. Finally concluding comments are provided in Section 5.

2. Theoretical Background

The induced drag on a section of a finite wing is a product of the lift and induced angle of attack at that section, both of which are functions of the circulation distribution. Thus asymmetric circulation distributions will produce an asymmetric induced drag distribution and hence net yawing moment. However, modifying the circulation distribution will also have an effect on the lift, pitching moment and rolling moment. A method is, therefore, required to identify changes in the load or circulation distribution that are able to create a change in yawing moment but with negligible cross coupling with pitch and roll.
As an example, consider the simple case of a straight untapered wing with the moment reference point at the aerodynamic centre. Since the lift acts at the moment reference, the lift is decoupled from the pitching moment and the effect of the circulation distribution on pitch can be neglected. Consider the existence of one symmetric and one asymmetric circulation distribution that both give the same overall lift and zero rolling moment. By definition, the yawing moment due to induced drag will be zero for the symmetric distribution but finite for the asymmetric distribution. An example solution of this type is shown in Figure 1. The spanwise integrals of both the symmetric and the asymmetric distributions are equivalent such that the lift coefficients produced are equal, and the integral of the product of circulation and spanwise location with respect to the spanwise location ( Γ η d η ) in each case is equal to zero such that the rolling moment is zero. Note that the asymmetric circulation distribution shown is an arbitrary solution out of an infinite set of possible solutions.
Although the solution for the circulation distribution in this form may appear trivial, for swept wings and wings of low aspect ratio, evaluating the unperturbed distribution is analytically complex because simple techniques such as lifting line analysis are invalid. Furthermore, for practical cases, the circulation distribution may only be modified over discrete spanwise locations dictated by the location of control surfaces, which creates an analytical challenge.

3. Method

3.1. Wing Aerodynamic Models

To allow the control allocation studies to be undertaken as part of preliminary design studies, a computationally inexpensive method of analysing the aerodynamic effects of asymmetric control surface deflections is required. Several low-order methods were compared (see Appendix A for a detailed comparison) and from these Multhopp’s Lifting Surface (LS) model [26] was selected as the most applicable.

3.2. Validation of Model Predictions Due to Control Surface Deflection

To validate the applicability of the selected model, model predictions were compared to experimental data from Stenfelt and Ringertz [27]. The experimental data provide information on the yawing moment due to opposing surface deflection on the same side of a tailless aircraft at zero degrees angle of attack. Whilst there is no imposed requirement to maintain trim on other axes, it provides a useful validation case nevertheless.
The yawing moment generated by the surface deflections is shown in Figure 2. A positive deflection is defined as the outer control surface Trailing Edge Up (TEU) and inner surface Trailing Edge Down (TED). The solid red line on the plot shows the total drag from deflecting the control surfaces. This comprises the induced drag contribution from the LS model and the profile drag contribution modelled based on ESDU 06014 [28]. Note that throughout this paper all yawing moments are represented as an equivalent sideslip angle of trim (i.e., the ratio of yawing moment to the yawing moment with respect to sideslip derivative C n C n β ). The value of C n β is evaluated using the LS model with the assumption of linear aerodynamics. Wherever this metric is used, it is normalised with the yawing moment due to sideslip derivative applicable to the geometry presented.
For positive deflections, our predicted total drag agrees well with the experimental data, following the lower bound of the experimental uncertainty. However, for negative deflections, the model over predicts the yawing moment generated. This is because TED outer control surface deflections promote spanwise flow over the outer control surface, reducing the control effectiveness [15]. Despite this effect, it can be seen that for deflections less than six degrees the predicted yawing moment is within the experimental uncertainty. As the aim of the study is to minimise the control surface deflection required to generate a specific yawing moment, this is unlikely to limit the applicability of the model. However, results where the outer control surface is deflected greater than six degrees TED should be treated with caution.

3.3. Control Allocation

The aim of the control strategy developed in this paper is to achieve a specific sideslip demand without any change in overall lift from the trim state, whilst maintaining trim in pitch and roll. Achieving such aim sounds a normal practice and indeed has been previously attempted as a pure control allocation problem (e.g., in [29]). However, to the best of our knowledge, identifying a control allocation strategy for a flying wing configuration based on a mode shaping approach has not been attempted before. As such, we here propose a novel control allocation strategy based on the calculation of a combination of control deflection mode shapes to generate a given yawing moment with zero pitch and rolling moment.
To calculate the control surfaces deflections required, a method is developed based upon the null space (zero set) of a control derivative matrix, similar to that developed by Fruchter [30]. Fruchter’s method is aimed at identifying a stable gain strategy for a control system by finding the zero-set (or null space) of a linear system. Here, we extend the application of Fruchter’s approach to an aerodynamic context so that the output of the null space calculation identifies aerodynamic outputs. This is a novel way of dealing with control surface effects through allowing a suite of control surface deflections to be described as mode shapes; linear combinations of which have no effect on lift, pitching moment or rolling moment but are laterally asymmetric to induce a yawing moment on the wing. A summary of the whole method is shown in Figure 3 and described thereafter.
The first step in the process is to select a set of control surface deflections. Here we use Latin hypercube sampling as this sampling method ensures a well distributed set of control surface deflections are evaluated [31]. From these control surface deflections, the sectional lift and pitching moment coefficients can be calculated using thin aerofoil theory [32]. By using a fundamental theory such as thin aerofoil theory rather than experimental data, we ensure that the conclusions of this study are robust to an arbitrary aerofoil choice. However, as thin aerofoil theory makes an assumption of linear aerodynamics we must restrict the control surface deflections to the range 10 to 10 . Nevertheless, this restriction does not conflict with the overall aim to reduce the control surface deflection required for a given yawing moment. Furthermore, thin aerofoil theory is not able to capture any change in profile drag due to the control surface deflection. Therefore, a semi-empirical method from ESDU 06014 [28] is used to predict the change in profile drag. The planform profile drag is calculated using ESDUW02.04.02 [33], assuming a laminar flow for generality. This gives a profile drag coefficient, C D 0 = 0.002 for all planforms investigated in Section 4.
Using the calculated sectional characteristics, the lifting surface model selected in Section 3.1 (see also selection process and discussion in Appendix A) is used to model the aerodynamic forces and moments on the 3D wing. A response function of the control surface deflections is then fit to the predicted force and moment coefficients using response surface methodology [34]. This allows for a more computationally efficient modelling of the aircraft response to control inputs whilst retaining the accuracy of the underlying models. These functions are calculated using least squares regression and take the form:
C L = B 0 + i = 1 N B i δ i
C m = C 0 + i = 1 N C i δ i
C l = D 0 + i = 1 N D i δ i
C D = E 0 + i = 1 N E i δ i + i = 1 N 1 j = i + 1 N F i , j δ i δ j + i = 1 N G i δ i 2
C n = S 0 + i = 1 N S i δ i + i = 1 N 1 j = i + 1 N T i , j δ i δ j + i = 1 N U i δ i 2
These equations describe the lift ( C L ), drag ( C D ), pitching moment ( C m ), rolling moment ( C l ) and yawing moment ( C n ) in terms of the control surface deflection ( δ ) and response function coefficients (BG, S-U). In all cases, examined these fits have a coefficient of determination ( r 2 ) of unity. Conveniently, the three quantities that must be maintained are a linear function of the control surface deflections (i.e., lift, pitch and roll). Taking the requirement that the aircraft must be in trim, Equations (1)–(3) may be written as the following linear system:
0 C m 0 0 = B 1 B 2 B N C 1 C 2 C N D 1 D 2 D N δ 1 δ 2 δ N
0 C m 0 0 = R δ
The left hand side of Equation (7) describes the trim state of the aircraft. On the right hand side, Row 1 specifies the change in lift, Row 2 specifies the change in pitching moment and Row 3 specifies the change in rolling moment, all with respect to control surface deflection. As for a stable aircraft with no control surface deflection, there will be a nose down pitching moment ( C m 0 ); this is included on the LHS to ensure the aircraft is longitudinally trimmed.
As this system is over-defined for all cases with two or more control surfaces on each semi-span, there are an infinite number of solutions to this system. As such, we here only consider the case of three control surfaces on each semi-span (six in total) as this provides a representative case for analysis.
To define a control strategy which allows the generation of a yawing moment we must first calculate the control surface deflection array, δ , for the trim state denoted as ( δ 0 ). To find this, Equation (7) is solved in a least squares sense with the additional constraint that the control surface deflections are symmetric about the aircraft centreline ( y = 0 ), as a symmetric lift distribution will produce symmetric induced drag.
To find the additional control surface deflection required to generate a yawing moment, we use the null space of the matrix, R (i.e., solutions of δ which satisfy R δ = 0 ). The number of null space vectors (unique solutions) is determined by the degree to which matrix R is rank deficient. Each of the null space vectors can be thought of as analogous to a mode shape (i.e., Eigen vector of the system). Any linear combination of these modes will ensure that the constraints of lift, pitching moment and rolling moment are satisfied but will produce an asymmetric load distribution. As an example, the modes of an untapered straight wing with three control surfaces on each semi-span are shown in Figure 4.
Next, the null space matrix, n , is formed by assembling the null space vectors as the columns of n . This can then be multiplied by a vector of gains ( k ) such that the deflection can be written as a function of the gains:
δ = δ 0 + nk
In doing this, the N unknown deflections are reduced to N-3 unknown gains, and the constraints on lift, pitching moment and rolling moment are implicitly satisfied. This is computationally significant as the size of the problem is reduced and trim conditions are always satisfied. For example, in the cases presented in this paper for three control surfaces on each semi-span, this reduces the number of unknowns from six to three. An example code used to compute n is included in the supplementary materials to this paper.
Substituting Equation (8) into Equations (4) and (5) yields equations for the yawing moment and drag in terms of k ; however, unlike those for lift, pitching moment and rolling moment, the combination of modes is non-linear. These are quadratic equations with linear interactions between the modes.
As for all cases with more than two control surfaces on each wing, there is more than one unique solution of k to generate a given yawing moment. To select a control strategy, one must select a quantity to optimise. In this study, we consider two possible objectives relevant to the problem in hand; however, the method remains unchanged if other objective(s) are of greater significance to a designer.
The first objective is the aerodynamic efficiency of generating a yawing moment (denoted as X), and defined in Equation (9) as the drag coefficient for a specific yawing moment. The second objective considered in this study is the area exposed in the normal plane by the control surface deflection (denoted as Y), and defined in Equation (10) as the sum of the surface area of each control surface multiplied by the sine of its deflection angle.
X = C D ( k ) | C n
Y = i = 1 N A i sin ( δ i ( k ) ) | C n
The solution for k where X or Y is minimised for a given yawing moment is both analytically complex and specific to the metric selected, a theoretical solution is therefore not pursued. To find the optimum value of k , we evaluate C n ( k ) , C D ( k ) and δ ( k ) across the range of gains ( k ) which produces control surface deflections of up to 10 .
To find the optimum strategy (i.e., the optimum k as a function of C n ), we first decompose the range of yawing moments required to trim between 0 and 10 of sideslip into M discrete values. It is then possible to represent the value of the gain k 1 in terms of the desired yawing moment and the remaining gains by rearranging the function C n ( k ) to k 1 = f ( C n , k 2 N ). We then decompose the remaining gains k 2 N into P discrete values which are evaluated to calculate k 1 , X and Y. From this, the minima in X or Y is selected as the optimum gain. Note that this method requires the evaluation of M P N 4 points. As a reference of computational efficiency, evaluation for the case of N = 6, M = 500 and P = 1000 on a standard laptop with a 2.4 GHz core i5 processor takes 17 s.
As an example, the surfaces of constant yawing moment for a straight, untapered wing with three control surfaces on each semi-span are calculated and shown in Figure 5. Over the range evaluated, in all cases, there is a single minima in the drag coefficient. For all geometries analysed throughout this work, there was only one minima.
There are two regions for each sideslip angle shown which correspond to the positive and negative solutions for k 1 . The leftmost region (corresponding to the positive solution in this case) reduces in size as the required yawing moment increases and is less aerodynamically efficient. The rightmost region is both more aerodynamically efficient and stable in size as the yawing moment increases. The iso-surfaces do not change significantly with angle of attack but are specific to the planform geometry.

4. Results and Discussion

4.1. Wing Geometries

As the simplest case for which an optimum control strategy needs to be found, the results in this section are presented for three control surfaces on each semi-span. In addition to being the simplest, this setup of control surfaces is representative of that found on many tailless aircraft designs [35]. Control strategies are evaluated at yawing moments required to trim at a sideslip angle of 0 up to 10 , at an angle of attack of 4 , for wings with a quarter chord sweep of 0, 30 and 45 degrees with taper ratios of 0.2 and 1. In all cases analysed within this section the trim at sideslip is statically stable. In all cases, the longitudinal static margin is set to 5% of the mean aerodynamic chord, a typical value for flying wing configurations. This provides a representative range over which the proposed method could be comprehensively judged.
For all cases investigated below, all the control surfaces on each semi-span have a length of 10% span and are 20% of the local chord. Control surfaces are positioned at η = 0.5 , 0.7 and 0.9 measured to the outboard edge. This is taken as a representation of typical arrangement of control surfaces on a tailless aircraft [35]. By fixing the size and location of the control surfaces, the problem size is restricted to allow reasonable investigation. Note that there is no limitation in the method to prevent analysis of less conventional geometries and control surface positions.
The optimum control strategy is calculated in terms of the aerodynamic efficiency (X) and aggregate control deflection (Y) as defined in Section 3.3. To provide a reference case for comparing the usefulness of the obtained results from the proposed method, each of the two metrics is compared to the same geometry where the outer control surface is replaced with a Split Drag Rudder (SDR) using a bias angle of 20 as defined by Qu et al. [14]. To calculate the performance of the SDR, the LS model was adapted with the change in sectional lift and profile drag due to the SDR taken from ESDU 14004 [36] and 96026 [37], respectively. Note that ESDU 14004 (used for evaluation of lift and rolling moment due to the SDR) does not allow for small deflections below 12 degrees for this arrangement; therefore, the selection of the bias angle value of 20 fits within this applicability range. More importantly, it allows for a possible improvement in low speed performance due to reduced coupling shown by Qu et al. [14].

4.2. Unswept Wing

The optimum control strategy for unswept wings is shown in Figure 6. Figure 6a,b shows results for optimising aerodynamic efficiency using X as an objective, whereas Figure 6c,d shows results for optimising aggregate control deflection using Y as an objective. In all cases, the x-axis is represented in terms of a given sideslip angle which in turn implies a target yawing moment.
For the untapered wing, the control strategies are broadly similar; the starboard wing acts as a distributed split drag rudder [14] with one control surface deflecting down and the others up. The difference between the two strategies is that for the maximum aerodynamic efficiency optimisation the port wing is not actuated to reduce the change in drag, whereas the optimisation to minimise the exposed area makes more use of these surfaces.
For the tapered wing, the strategies for each optimisation function differ. For minimising the aggregate deflection the strategy is broadly similar to the untapered wing. However, for minimising the total drag, the outer control surface is deflected TEU. This is because the effectiveness of the outer control surface is reduced because of the reduced chord, therefore the optimiser uses the more effective centre control surface to reduce the total drag. Figure 7 demonstrates that despite the total drag comprises 58% profile drag, the yawing moment is generated almost exclusively (greater than 99%) by induced drag.
Figure 8 shows the result of each of the optimisation functions for each of the control strategies compared to a SDR. Several interesting observations can be made from this demonstration. First, it is clear that for both tapered and untapered planforms either optimisation strategy gives similar results for the aerodynamic efficiency ratio, X / X S D R . This is to be expected as minimising the exposed area of the control surfaces will also minimise the profile drag contribution. Second, for the untapered planform only, both optimisations yield similar results in terms of the aggregate control deflection ratio ( Y / Y S D R ); however, for the tapered case, the aggregate control deflection is marginally improved (i.e., decreased) by minimising Y. Finally, given that the y-axes are normalised with respect to the performance metric for the SDR, the performance impact of the proposed method can be directly assessed: Figure 8a shows that this method uses approximately 30% less drag than a SDR to produce the same yawing moment for the untapered wing and 10% less for the tapered wing. Figure 8b shows a clear performance benefit in terms of the reduction in the area exposed in the normal plane as this reduction varies between approximately 30% at high yawing moments up to around 80% at low yawing moments. This reduction suggests a favourable effect in aggregate control deflection.

4.3. Thirty Degree Sweep

Increasing the quarter chord sweep to 30 degrees does not significantly change the control significantly for the untapered wing (Figure 9). For the tapered wing, the deflections required are reduced compared to the unswept wing. Examining the control strategy in any of the cases shown in Figure 9, it can be seen that the yawing moment is primarily generated by the outboard two control surfaces on the starboard wing.
Similar to the finding for the zero sweep case, Figure 10 shows that in all cases with 30 degree sweep the yawing moment is generated almost exclusively by induced drag. Note that, the induced drag contribution to the total drag within the case of untapered, unswept wing was still a major contribution but the introduction of sweep made this contribution even more significant. The change from the unswept wing is because of the increased load at the wingtips which improves the control surface effectiveness. This also explains the reduced benefit to the control strategy for the tapered wing, as the taper reduces the magnitude of the lift at the tips. However, in practice, it is undesirable to have such high loads at the wing tips and the introduction of twist may reduce this benefit. Interestingly despite the increase in the induced drag contribution to the total drag, the induced drag contribution to the yawing moment is roughly similar to that of the unswept case. This is because the profile drag contributions are small and almost symmetric about the aircraft centreline.
Figure 11 shows the result of each of the optimisation functions for each of the control strategies when normalised to the SDR case. Again for ( X / X S D R ), the SDR is approximately 40% less efficient for the same yawing moment for the untapered wing and 10% less efficient for the tapered wing. In the case of the 30 degree swept wing, the difference in aggregate control deflection ( Y / Y S D R ) is small between the two optimisation methods but still shows a significant benefit compared to the SDR with improvements in aggregate control deflection of at least 40%. For the tapered wing when compared to the unswept case, there is now a small aggregate control deflection benefit at higher yawing moments as the deflections on the port wing are reduced. There is also a reduced aggregate control deflection for the untapered wing across the entire range of yawing moments analysed.

4.4. Forty-Five Degree Sweep

Further increasing the sweep from 30 degrees to 45 degrees has a large impact on the control strategies (Figure 12). The most significant change in increasing the sweep is the increased deflections on the port wing; this is due to the increased coupling, particularly in pitch, due to the increased sweep.
In all cases, in Figure 12, the crux of the control strategy is to deflect the two outer control surfaces of the starboard wing in opposing directions to generate induced drag on the outer sections. Figure 13 shows that, whilst induced drag remains a significant contributor to the yawing moment, the relative contribution of induced drag to the total drag is increased relative the cases of unswept and 30 degree swept wing. This is due to the port surface deflections required to maintain trim because of the increased coupling introduced by the greater sweep angle.
Figure 14 shows the results of the optimisation functions for each control strategy and a comparison to the SDR. The result trends for the aerodynamic efficiency ( X / X S D R ) are very similar to the unswept and 30 degree swept cases. Unlike the previous two cases (i.e., unswept and 30 degree sweep), there is only a marginal benefit in terms of aggregate control deflection ( Y / Y S D R ) as the two methods (i.e., optimising aerodynamic efficiency or aggregate control deflection) produce very similar results. For small yawing moments, there is a large benefit in aggregate control deflection compared to the SDR, however this reduces as the yawing moment increases. For the wing planforms considered here, the SDR starts to show a benefit in terms of aggregate control deflection for sideslip angles to trim over around eight degrees.

5. Conclusions

This work considers exploiting asymmetries in induced drag distribution on a wing as a primary mechanism by which a required yawing moment can be generated. The presented analysis shows that, for trapezoidal wings, it is possible to generate yawing moments to trim up to 10 of sideslip using only the conventional trailing edge controls. For all cases analysed, the maximum control deflection did not reach the limit of 10 suggesting that it is possible to achieve yawing moments in excess of this. This is achieved through a novel method that can define a control strategy to produce laterally asymmetric drag with no change in the overall lift, pitching moment and rolling moment. The proposed method identifies ‘control allocation mode shapes’ based upon the zero-sets of surrogate aerodynamic formulation that is originally based on a range of aerodynamic tools to evaluate the required aerodynamic characteristics including thin aerofoil theory, lifting surface theory and ESDU data sheets. Combinations of these obtained control allocation mode shapes as a function of a required yawing moment could then be optimised against different objectives to define an adequate control strategy. In this work, we have shown that by using a linear combination of the aerodynamic mode shapes, complex control deflections can be defined as function of a small number of gain parameters. This would allow for simple control laws governing the optimum gains as a function of yawing moment to be implemented with little computational expense on the aircraft. This control authority in yaw is useful for designers to explore the removal of vertical stabilising surfaces. Furthermore there is a significant reduction in the aggregate control deflection impact when compared to the case of an SDR, showing the benefit of this proposed method over conventional solutions in terms of both control deflection and drag. This method of control allocation can be applied to any control effector, including fluidic devices, provided the force and moment response can be linearised with respect to the control variable.
The method developed herein was applied into a range of simple untwisted trapezoidal wing planforms. This includes unswept and moderately swept wings and taper ratios of 1 and 0.2. The planform which is best able to achieve the minimum aggregate control deflection and total drag was the wing with the quarter chord sweep of 30 degrees. This was due to a favourable tradeoff between the positive effects of sweep increasing the effectiveness of the outboard control surfaces and the negative effect of increasing the coupling between pitch and roll. For all cases analysed in this paper, introducing taper both improved the aerodynamic efficiency and reduced the aggregate control deflections when producing a yawing moment. As in practice low observable aircraft are generally designed to have moderately swept with a low taper ratio, this is favourable for low observable designs.
We proposed two optimisation objectives for control allocation, maximum aerodynamic efficiency defined in terms of minimising the total drag to achieve a given yawing moment and minimum aggregate control deflection defined in terms of minimising the total projected surface area to achieve a given yawing moment. Our analysis suggests that the most beneficial is to optimise for aggregate control deflection by reducing the exposed area in the normal plane. This is because both optimisation objectives proposed produced results with negligible differences in terms of aerodynamic efficiency. This is to be expected as reducing the area exposed will also reduce the contribution of profile drag. To better interpret our results, we normalised the obtained performances with respect to those of a SDR case. In all demonstrations considered herein, the aerodynamic efficiency of the SDR was inferior to the induced drag modulation method presented. However, the aggregate control deflection benefit is clear in that the aggregate area exposed in the normal plane can be reduced by up to a factor of eight by using the presented method.

Supplementary Materials

The following are available online at https://www.mdpi.com/2226-4310/7/10/150/s1.

Author Contributions

Conceptualisation, T.R.S., M.R.A.N., W.J.C. and C.W.; methodology, T.R.S.; software, T.R.S. and M.R.A.N.; validation, T.S.; formal analysis, T.R.S., M.R.A.N., W.J.C. and C.W.; writing—original draft preparation, T.S.; writing—review and editing, M.R.A.N., W.J.C. and C.W.; supervision, M.R.A.N., W.J.C. and C.W.; project administration, M.R.A.N. and W.J.C.; and funding acquisition, M.R.A.N., W.J.C. and C.W. All authors have read and agreed to the published version of the manuscript.

Funding

Part of this work was joint funded by the UK Engineering and Physical Sciences Research Council (EPSRC) and BAE Systems, who are funding the doctoral studies of an author, Thomas Shearwood.

Conflicts of Interest

The authors declare no conflict of interest.

Abbreviations

The following abbreviations are used in this manuscript:
RCSRadar Cross Section
TEUTrailing Edge Up
TEDTrailing Edge Down
SDRSplit Drag Rudder

Appendix A. Model Selection

Appendix A.1. Overview

Three models were selected for assessment: A Lifting Line Theory (LLT) modified for sweep effects [38], Vortex Lattice Method (VLM) [39] and Multhopp’s Lifting Surface (LS) [26]. To assess the applicability of these models to the geometries studied within this paper the lift distribution, lift magnitude and induced drag magnitude predictions were selected as metrics for assessment. This is because, if the lift distribution is correct and the model is predicting the correct induced drag, then the moments, which are integral functions of the distribution, will also be correct.
We consider cases of both straight and swept wings. For the straight wing, the three models are compared against predictions from classical lifting line theory [40] as it provides the most convenient analytical solution for such wing geometry (no sweep and the aspect ratio is above three [41,42,43,44]). For the swept wing case, the models were compared against available experimental data from a 45 degree swept wing of aspect ratio 5 [45]. It is expected that all models will perform well for the straight wing. For the swept wing, it is expected that the surface methods (i.e., VLM and lifting surface) will outperform the LLT methods.

Appendix A.2. Straight Rectangular Wing

The lift distribution and lift curve slope predictions of each of the three models are compared against those from the classical LLT (Figure A1). The classical LLT solution adopted here is based on Glauert’s method which adopts a Fourier series solution. As expected all models predict both the distribution and magnitude of lift well. It is worth noting that both surface methods under predict the lift cure slope compared to the classical LLT; however, this under-prediction is well noted within the literature (see, for example, [32]). Note that the lift distribution in this demonstration is evaluated at an angle of attack of 4.2 for consistency with the swept wing case in the following section where experimental data were available at this angle of attack value. However, same conclusions will be obtained if any other angle of attack value is used.
Figure A1. (a) Lift distribution prediction at α = 4.2 and (b) lift curve slope for AR5 straight wing. All methods considered predict the shape of the lift distribution well, however both lifting surface and VLM predict a slightly lower lift curve slope.
Aerospace 07 00150 g0a1
The quantity of greatest importance to this method is the prediction of induced drag shown in Figure A2. The modified LLT model by Phillips and Snyder [38] matches the classical LLT in terms of induced drag coefficient as a function of both angle of attack and lift. The VLM and LS methods both also predict the induced drag well as a function of the lift coefficient. Therefore, for an unswept wing, any of the models considered would be suitable.
Figure A2. Induced drag coefficient as a function of angle of attack (a) and lift coefficient (b). The results of the modified LLT match those from the classical LLT, as would be expected. Whilst the induced drag predictions for the LS and VLM appear to under predict the induced drag as a function of angle of attack, it can be seen that this is due to the lower lift prediction shown in Figure A1. As a function of lift coefficient, the induced drag coefficient prediction from the LS model agrees well with the LLT prediction, whilst VLM slightly over predicts the induced drag coefficient.
Aerospace 07 00150 g0a2

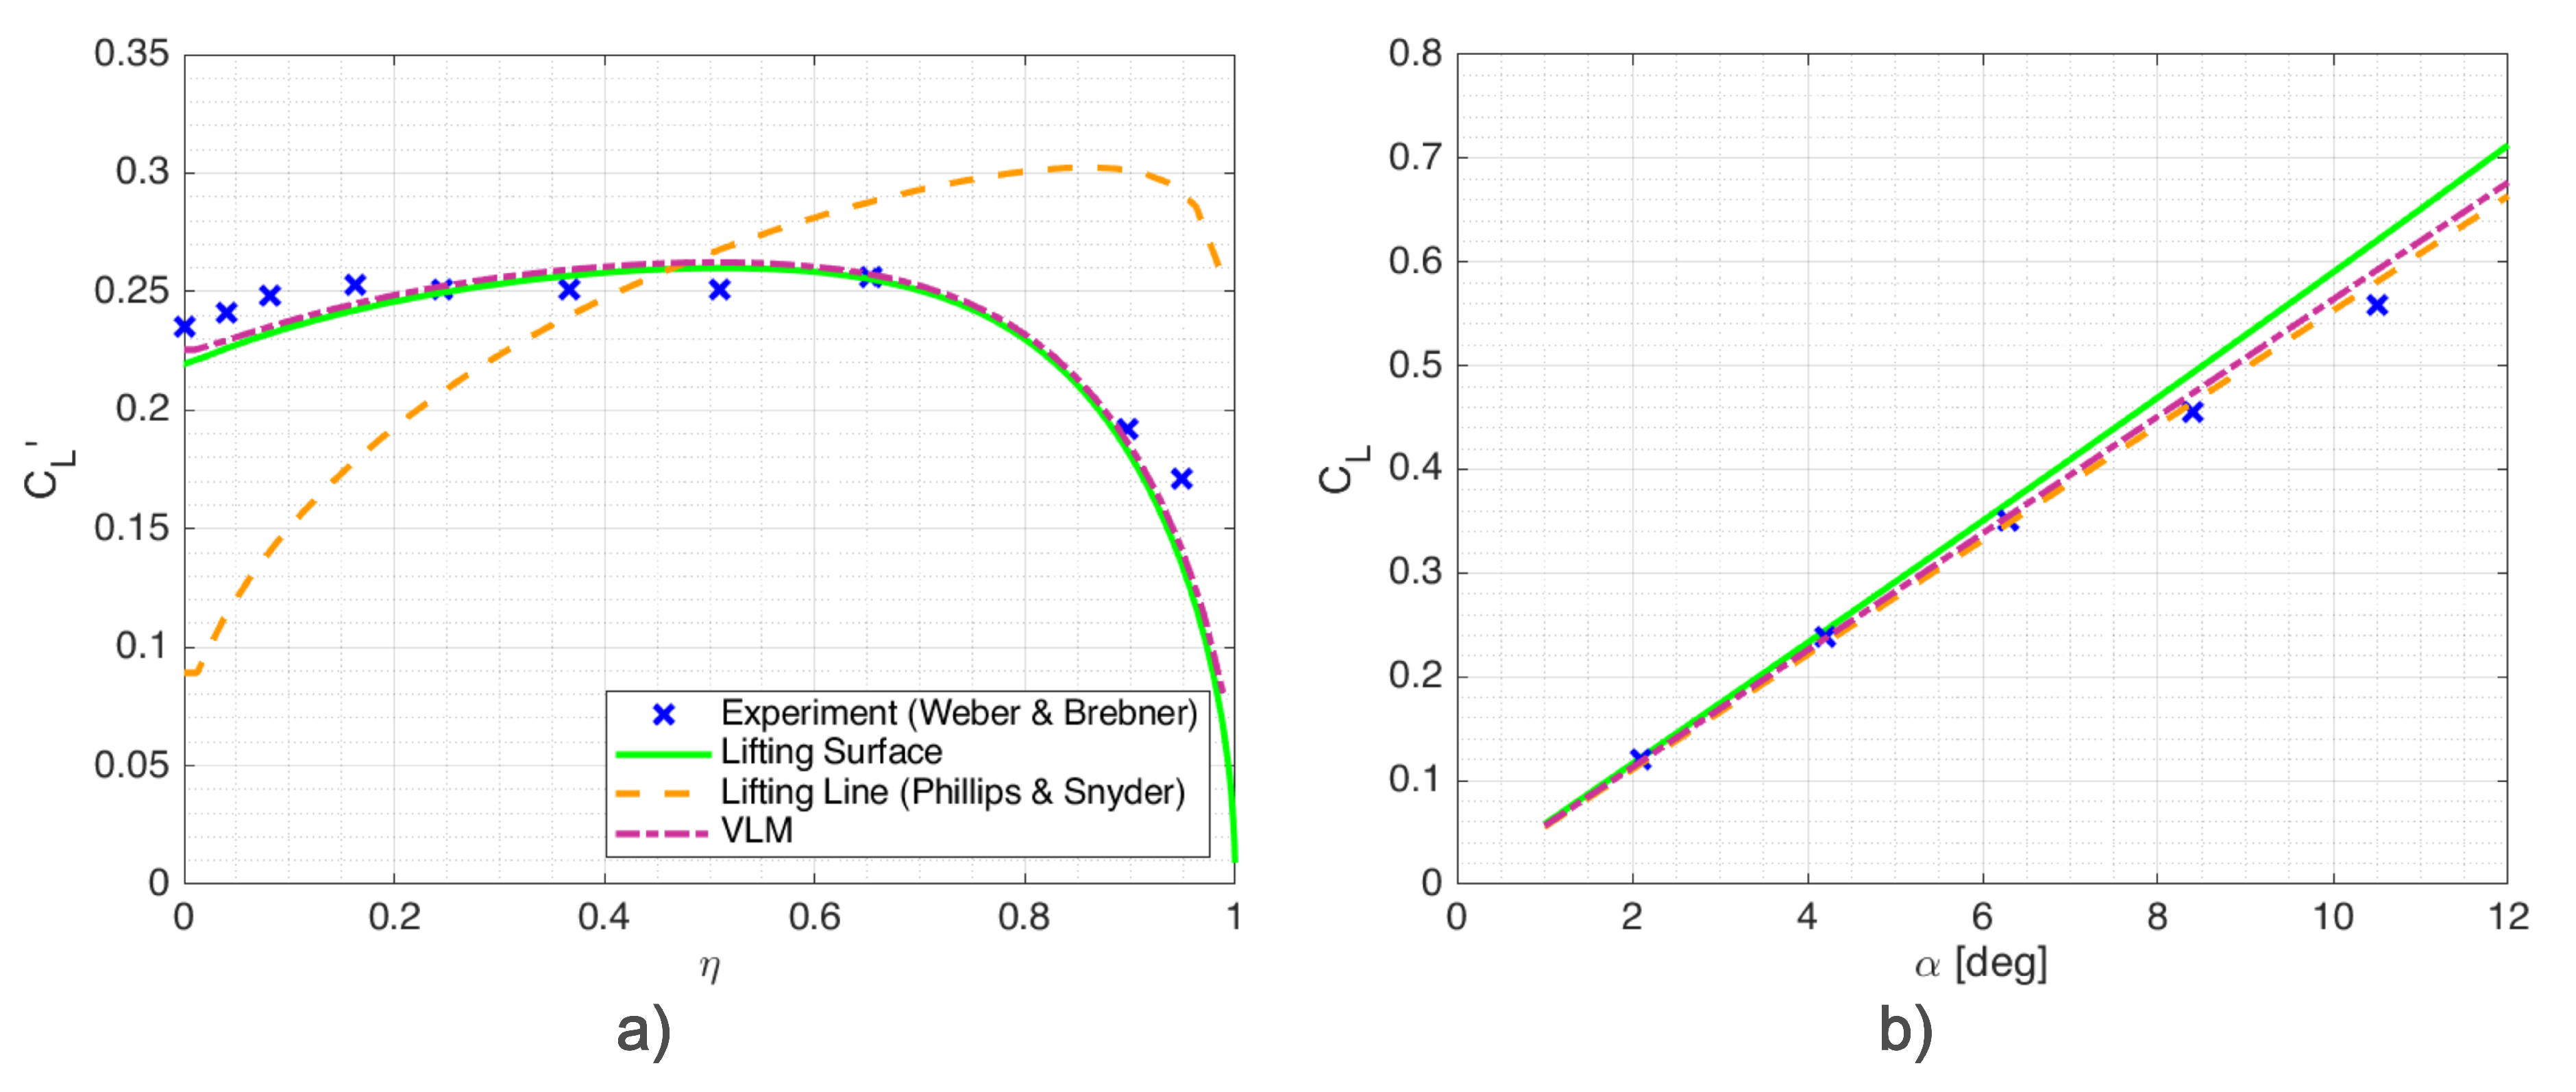
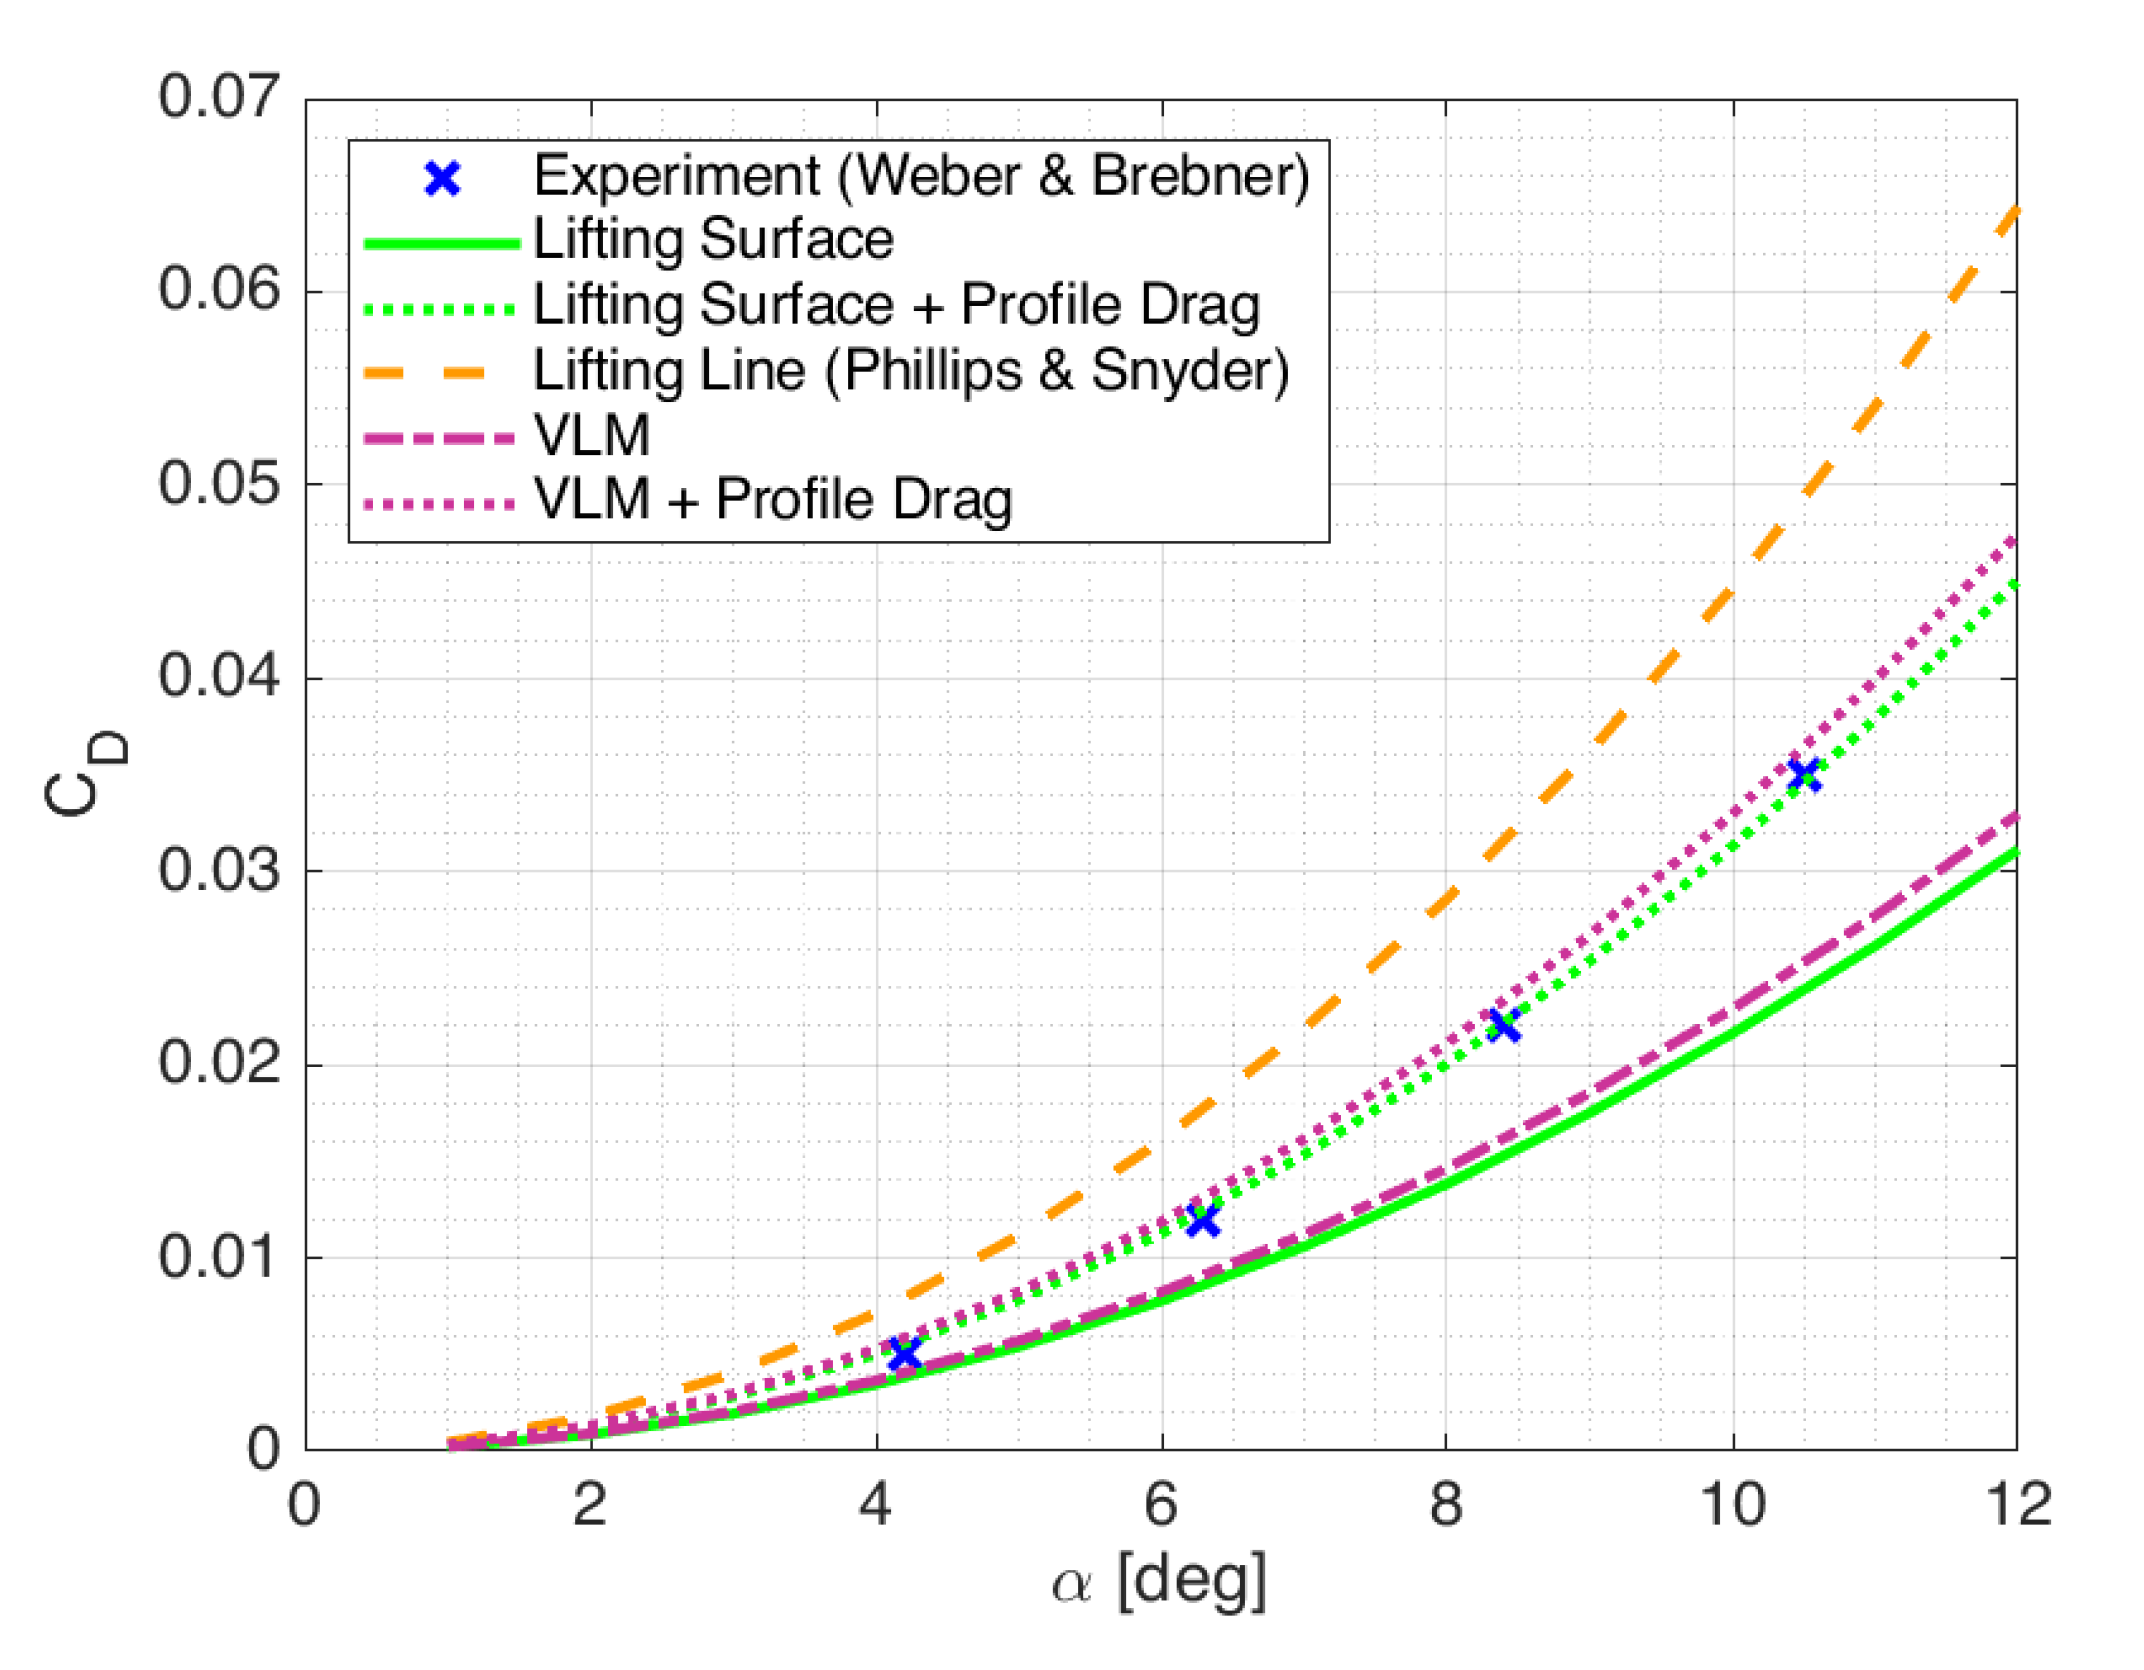
Appendix A.3. Forty-Five Degree Swept, Untapered Wing

The classical LLT is known to fail in accurate prediction of the lift distribution for wings swept above 30 degrees [32]. As such, here we compare the three selected models against available experimental data [45] for spanwise distribution and the integral quantities of lift and drag for an untapered wing with 45 degree sweep and an aspect ratio of 5.
Figure A3 shows the spanwise lift distribution and lift curve slope for each of the models compared with the experimental data. The modified lifting line model predicts the overall lift coefficient well, however the distribution is significantly shifted to the outboard sections. When combined with control surface deflections this distribution will lead to significant errors in the aerodynamic moments, therefore the modified lifting line is not suitable for the aims of our present study. Both surface methods agree well with the experimental data in both the lift distribution and lift curve slope.
When comparing the drag predicted by each of the models in Figure A4 it can be seen that both surface models under predict the drag. This is expected as all these models are inviscid. However, when adding the profile drag contribution of the RAE101 aerofoil section used for the experiment a good agreement with the experimental results is found for the lifting surface model with the VLM slightly over predicting the total drag. The greater accuracy and reduced dependency on the discretisation of the geometry of the lifting surface method makes it our favourable model choice for use in this study.
Figure A3. (a) Spanwise lift distribution at 4.2 degrees and (b) lift curve slope for the low order methods considered. All methods predict the lift curve slope well enough, however the modified lifting line model skews the lift to the outboard sections of the wing. For our analysis purposes, this would lead to large errors in the predicted induced drag and aerodynamic moments.
Aerospace 07 00150 g0a3
Figure A4. Drag prediction comparison. Compared to the experimental data, the modified LLT predicts higher induced drag than the total drag measured in the experiment. The LS and VLM models appear to under predict the total drag compared to the experiment. This is expected as they only evaluate the induced drag component. As such, when adding the profile drag contribution of the RAE101 aerofoil used for the experiment, the predicted drag coefficient is in good agreement for the LS model, and is slightly over predicted for the VLM model.
Aerospace 07 00150 g0a4

References

  1. Löchert, P.; Huber, K.C.; Ghoreyshi, M.; Allen, J. Control device effectiveness studies of a 53 swept flying wing configuration. Experimental, computational, and modeling considerations. Aerosp. Sci. Technol. 2019, 1, 105319. [Google Scholar] [CrossRef] [Green Version]
  2. Grellmann, H. B-2 aerodynamic design. In Proceedings of the Aerospace Engineering Conference and Show, Los Angeles, CA, USA, 13–15 February 1990. [Google Scholar] [CrossRef]
  3. Denisov, V.; Shkadov, L.; Chernyshev, S. The Flying Wing Concept—The Challenge for the Future. In Proceedings of the AIAA International Air and Space Symposium and Exposition: The Next 100 Years, Dayton, OH, USA, 14–17 July 2003; pp. 1–11. [Google Scholar] [CrossRef]
  4. Tomac, M.; Stenfelt, G. Predictions of stability and control for a flying wing. Aerosp. Sci. Technol. 2014, 39, 179–186. [Google Scholar] [CrossRef]
  5. Rajput, J.; Zhang, W.G.; Qu, X.B. A Differential Configuration of Split Drag-Rudders with Variable Bias for Directional Control of Flying-Wing. In Applied Mechanics and Materials; Engineering Providing of Industrial Development; Trans Tech Publications: Zurich, Switzerland, 2014; Volume 643, pp. 54–59. [Google Scholar] [CrossRef]
  6. Li, Z.J.; Ma, D.L. Control characteristics analysis of split-drag-rudder. In Applied Mechanics and Materials; Engineering Providing of Industrial Development; Trans Tech Publications: Zurich, Switzerland, 2014; Volume 472, pp. 185–190. [Google Scholar] [CrossRef]
  7. Hong, W.J.; Ma, D.L. Influence of Control Coupling Effect on Landing Performance of Flying Wing Aircraft. In Applied Mechanics and Materials; Engineering Providing of Industrial Development; Trans Tech Publications: Zurich, Switzerland, 2016; Volume 829, pp. 110–117. [Google Scholar] [CrossRef]
  8. Li, Z.; Yong, C.; Duo, L. Multi-effectors distribution of flying wing with stealthy optimization. In Proceedings of the 2017 36th Chinese Control Conference (CCC), Dalian, China, 26–28 July 2017; pp. 2864–2869. [Google Scholar] [CrossRef]
  9. Paterson, J. Overview of Low Observable Technology and Its Effects on Combat Aircraft Survivability. J. Aircr. 1999, 36, 380–388. [Google Scholar] [CrossRef]
  10. Härkegård, O.; Glad, S.T. Resolving actuator redundancy—Optimal control vs. control allocation. Automatica 2005, 41, 137–144. [Google Scholar] [CrossRef]
  11. Zhang, N.; Wang, L.; Li, F. Research on multi-task command allocation method for flying wing aircraft. In IOP Conference Series: Materials Science and Engineering; IOP Publishing: Bristol, UK, 2020. [Google Scholar] [CrossRef]
  12. Zhang, N. Research on Command Allocation Method for Flying Wing Aircraft. In IOP Conference Series: Materials Science and Engineering; IOP Publishing: Bristol, UK, 2020. [Google Scholar] [CrossRef]
  13. Handelman, D.A.; Stengelj, R.F. Combining Expert System and Analytical Redundancy Concepts for Fault-Tolerant Flight Control. J. Guid. 1989, 12, 39–45. [Google Scholar] [CrossRef]
  14. Qu, X.; Zhang, W.; Shi, J.; Lyu, Y. A novel yaw control method for flying-wing aircraft in low speed regime. Aerosp. Sci. Technol. 2017, 69, 636–649. [Google Scholar] [CrossRef]
  15. Huber, K.C.; Vicroy, D.D.; Schuette., A.; Huebner, V. UCAV model design and static experimental investigations to estimate control device effectiveness and S&C capabilities. In Proceedings of the 32nd AIAA Applied Aerodynamics Conference, Atlanta, GA, USA, 16–20 June 2014; pp. 1–20. [Google Scholar]
  16. Yue, T.; Zhang, X.; Wang, L.; Ai, J. Flight dynamic modeling and control for a telescopic wing morphing aircraft via asymmetric wing morphing. Aerosp. Sci. Technol. 2017, 70, 328–338. [Google Scholar] [CrossRef]
  17. Xu, X.; Zhou, Z. Analytical study on the synthetic jet control of asymmetric flow field of flying wing unmanned aerial vehicle. Aerosp. Sci. Technol. 2016, 56, 90–99. [Google Scholar] [CrossRef]
  18. Keidel, D.; Fasel, U.; Ermanni, P. Control Authority of a Camber Morphing Flying Wing. J. Aircr. 2020, 1–10. [Google Scholar] [CrossRef]
  19. Guiler, R.; Huebsch, W. Wind tunnel analysis of a morphing swept wing tailless aircraft. In Proceedings of the AIAA Applied Aerodynamics Conference, Toronto, ON, Canada, 6–9 June 2005; Volume 2, pp. 946–959. [Google Scholar] [CrossRef]
  20. Hunsaker, D.F.; Montgomery, Z.S.; Joo, J.J. Control of Adverse Yaw During Roll for a Class of Optimal Lift Distributions. In Proceedings of the AIAA Scitech 2020 Forum, Orlando, FL, USA, 6–10 January 2020; pp. 1–24. [Google Scholar] [CrossRef]
  21. Richter, J.; Hainline, K.; Louis, S.; Agarwal, R.K.; Richter, J.; Hainline, K. Examination of Proverse Yaw in Bell-Shaped Spanload Aircraft Examination of Proverse Yaw in Bell-Shaped Spanload Aircraft; Mechanical Engineering and Materials Science Independent Study; Washington University: St. Louis, MO, USA, 2019. [Google Scholar]
  22. Montgomery, Z.S.; Hunsaker, D.F.; Joo, J.J. A Methodology for Roll Control of Morphing Aircraft. In Proceedings of the AIAA Scitech 2019 Forum, San Diego, CA, USA, 7–11 January 2019. [Google Scholar] [CrossRef]
  23. Gamble, L.L.; Inman, D.J. Yaw Control of a Smart Morphing Tailless Aircraft Concept. Adv. Sci. Technol. 2016, 101, 127–132. [Google Scholar] [CrossRef]
  24. Phillips, E.; Jentzsch, M.; Menge, M.; Heinritz, C.; Taubert, L.; Forster, M.; Wygnanski, I.; Ladd, J. NATO AVT-239 Task Group: On the Use of Active Flow Control (AFC) on Tailless Aircraft Models to Affect their Trim and Control. In Proceedings of the AIAA Scitech 2019 Forum, San Diego, CA, USA, 7–11 January 2019. [Google Scholar] [CrossRef]
  25. Cusher, A.A.; Gopalarathnam, A. Drag reduction on aircraft configurations with adaptive lifting surfaces. Aerosp. Sci. Technol. 2014, 34, 35–44. [Google Scholar] [CrossRef]
  26. Multhopp, H. Methods for Calculating the Lift Distribution of Wings (Subsonic Lifting-Surface Theory); Technical Report; Ministry of Supply: London, UK, 1955. [Google Scholar]
  27. Stenfelt, G.; Ringertz, U. Lateral Stability and Control of a Tailless Aircraft Configuration. J. Aircr. 2009, 46, 2161–2164. [Google Scholar] [CrossRef]
  28. ESDU. Zero-Lift Drag Coefficient Increment Due to Full-Span Plain Flaps; ESDU: London, UK, 2006. [Google Scholar]
  29. Oppenheimer, M.W.; Doman, D.B. A method for including control effector interactions in the control allocation problem. In Proceedings of the AIAA Guidance, Navigation and Control Conference and Exhibit, Hilton Head, SC, USA, 20–23 August 2007; Volume 1, pp. 1074–1083. [Google Scholar] [CrossRef] [Green Version]
  30. Fruchter, G.; Srebro, U.; Zeheb, E. On Several Variable Zero Sets and Application to MIMO Robust Feedback Stabilization. IEEE Trans. Circuits Syst. 1987, 34, 1208–1220. [Google Scholar] [CrossRef]
  31. Stein, M. Large sample properties of simulations using latin hypercube sampling. Technometrics 1987, 29, 143–151. [Google Scholar] [CrossRef]
  32. Robinson, A.; Laurmann, J.A. Wing Theory; Cambridge University Press: Cambridge, UK, 1956. [Google Scholar]
  33. ESDU. Drag of a Smooth Flat Plate at Zero Incidence; ESDU: London, UK, 2000. [Google Scholar]
  34. Myers, R.H. Response Surface Methodology: Process and Product Optimization Using Designed Experiments; Wiley Series in Probability and Mathematical Statistics; Applied Probability Section; Wiley: New York, NY, USA, 2016. [Google Scholar]
  35. Lei, W.; Lixin, W. Reconfigurable Flight Control Design for Combat Flying Wing with Multiple Control Surfaces. Chin. J. Aeronaut. 2012, 25, 493–499. [Google Scholar] [CrossRef] [Green Version]
  36. ESDU. Lift and Rolling Moment Due to Spoilers on Wings at Subsonic Speeds with Trailing-Edge Flaps Undeployed; ESDU: London, UK, 2015. [Google Scholar]
  37. ESDU. Drag and Yawing Moment Due to Spoilers; ESDU: London, UK, 2015. [Google Scholar]
  38. Phillips, W.F.; Snyder, D.O. Modern Adaptation of Prandtl’s Classic Lifting-Line Theory. J. Aircr. 2000, 37, 662–670. [Google Scholar] [CrossRef]
  39. Katz, J.; Plotkin, A. Low Speed Aerodynamics; Cambridge University Press: Cambridge, UK, 1991; p. 351. [Google Scholar] [CrossRef]
  40. Prandtl, L. Applications of Modern Hydrodynamics to Aeronautics; Technical Report; NACA: Washington, DC, USA, 1922. [Google Scholar] [CrossRef]
  41. Schlichting, H. Aerodynamics of the Airplane; McGraw-Hill: New York, NY, USA, 2018. [Google Scholar]
  42. Nabawy, M.R.A.; ElNomrossy, M.M.; Abdelrahman, M.M.; ElBayoumi, G.M. Aerodynamic shape optimisation, wind tunnel measurements and CFD analysis of a MAV wing. Aeronaut. J. 2012, 116, 685–708. [Google Scholar] [CrossRef] [Green Version]
  43. Nabawy, M.R.A.; Crowthe, W.J. A Quasi-Steady Lifting Line Theory for Insect-Like Hovering Flight. PLoS ONE 2015, 10, e0134972. [Google Scholar] [CrossRef] [PubMed] [Green Version]
  44. Ahmed, M.R.; Abdelrahman, M.M.; ElBayoumi, G.M.; ElNomrossy, M.M. Optimal wing twist distribution for roll control of MAVs. Aeronaut. J. 2011, 115, 641–649. [Google Scholar] [CrossRef]
  45. Weber, J.N.; Brebner, G.G.; Kuchemann, D. Low-Speed Tests on 45.deg Swept-Back Wings; Technical Report; Aeronautical Research Council: London, UK, 1958. [Google Scholar]
Figure 1. Two different load distributions that produce the same lift and no rolling moment but different levels of induced drag. Solid line, symmetric elliptical loading; dashed line, equivalent distribution tailored to produce a net yawing moment through laterally asymmetric induced drag.
Aerospace 07 00150 g001
Figure 2. Comparison of predicted yawing moment against experimental results for opposing deflections of dual surfaces on the starboard wing. Positive deflection is outer control surface TEU and inner control surface TED (see inset). For positive deflection, the sideslip trim closely follows the lower bound on the uncertainty from the experiment. However, for negative deflections, the yawing moment is over predicted for defection greater than six degrees ( δ > 6 ). This is due to the reduction in effectiveness of the outer control surface due to the increasing influence of spanwise flow.
Aerospace 07 00150 g002
Figure 3. Process flow of control allocation method.
Aerospace 07 00150 g003
Figure 4. Visualisation of null space vectors for an untapered straight wing. Any linear combination of the three modes will ensure that the constraints on lift, pitching moment and rolling moment are satisfied whilst producing a yawing moment. Defections are exaggerated for clarity.
Aerospace 07 00150 g004
Figure 5. Iso-surfaces of constant yawing moment for an untapered straight wing. For each sideslip angle case presented. Left-hand plots show the values of k to attain the given sideslip angle and the centre and right-hand plots show the results of the optimisation functions X and Y, respectively.
Aerospace 07 00150 g005
Figure 6. Deflection required to generate yawing moment to trim at a given sideslip angle, β t r i m , for a straight wing with objectives of maximising aerodynamic efficiency (a,b) and minimising aggregate control deflection (c,d) for a taper ratio 0.2 (a,c) and 1 (b,d). Dashed lines represent port surfaces and solid lines are for starboard surfaces. Positive deflections are defined as trailing edge down. For visualisation purposes, insets show deflections required to trim at one, five and eight degrees of sideslip.
Aerospace 07 00150 g006
Figure 7. Relative contribution of the induced drag to the total drag (a) and the yawing moment (b) for unswept wing. In all cases, the induced drag is responsible for over 99% of the yawing moment produced by this method. This is despite the total drag comprising 58% profile drag.
Aerospace 07 00150 g007
Figure 8. Optimisation functions aerodynamic efficiency (a) and aggregate control deflection (b) objectives for an unswept wing normalised by the same metrics for a SDR. Variations are shown up to a given sideslip trim angle of 10 degrees.
Aerospace 07 00150 g008
Figure 9. Deflection required to generate yawing moment to trim at sideslip for a 30 degree swept wing with objectives of maximising aerodynamic efficiency (a,b) and minimising aggregate control deflection (c,d) for a taper ratio 0.2 (a,c) and 1 (b,d). Dotted lines indicate port surfaces and solid lines are starboard surfaces, positive deflections trailing edge down. Inset shows deflections required to trim at one, five and eight degrees of sideslip.
Aerospace 07 00150 g009
Figure 10. Relative contribution of the induced drag to the total drag (a) and the yawing moment (b) for the 30 degree swept wing. In all cases, the induced drag is responsible for over 99% of the yawing moment produced by this method and induced drag is responsible for approximately 42% of the total drag.
Aerospace 07 00150 g010
Figure 11. Optimisation functions aerodynamic efficiency (a) and aggregate control deflection (b) objectives for a 30 degree swept wing normalised by the same metrics for a SDR. Variations are shown up to a given sideslip trim angle of 10 degrees.
Aerospace 07 00150 g011
Figure 12. Deflection required to generate yawing moment to trim at sideslip for a 45 degree swept wing for objectives of maximising effectiveness (a,b) and minimising aggregate control deflection (c,d) with taper ratios 0.2 (a,c) and 1 (b,d). Dotted lines indicate port surfaces and solid lines are starboard surfaces, positive deflections trailing edge down. Inset shows deflections required to trim at one, five and eight degrees of sideslip.
Aerospace 07 00150 g012
Figure 13. Relative contribution of the induced drag to the total drag (a) and the yawing moment (b) for the 45 degree swept wing. In all cases, the induced drag is responsible for over 99% of the yawing moment produced by this method. This is despite the total drag comprising over 50% profile drag.
Aerospace 07 00150 g013
Figure 14. Optimisation functions aerodynamic efficiency (a) and aggregate control deflection (b) objectives for a 45 degree swept wing normalised by the same metrics for a SDR. Variations are shown up to a given sideslip trim angle of 10 degrees.
Aerospace 07 00150 g014
Publisher’s Note: MDPI stays neutral with regard to jurisdictional claims in published maps and institutional affiliations.

