1. Introduction
Hybrid rockets are currently the focus of countless aerospace propulsion projects worldwide. Possibly the most prominent example is Virgin Galactic Ltd.’s hybrid rocket-powered spaceplane, “SpaceShipTwo”, which is projected to begin commercial operations this year (FY2019) [
1]. The attention on hybrid rocket development is justified by the logistical cost savings and risk reduction during operations of hybrid rockets compared to their liquid bi-propellant and solid rocket counterparts [
2,
3]. One potential use for the current state-of-the-art hybrid rockets is as apogee kick motors, which will alleviate satellite operators from relying solely on piggy-backing on larger satellite buses to destinations beyond geostationary transfer orbit (GTO), thus reducing launch wait times, and increasing freedom of movement to desired orbital placements.
Kuo and Chiaverini summarize the advantages of hybrid rockets for upper-stage use as having high specific impulse, throttling capability, safe manufacturing, and low cost [
4] (p. 632). These attributes are especially attractive when considering the application of hybrid rockets as apogee kick motors. Jens et al. reported extensively on the concept of a hybrid rocket-powered apogee kick motor for placing CubeSats into deep space [
5,
6,
7]. A key aspect of their proposed design is the storage of gaseous oxygen at very high pressures—roughly 50 MPa—to keep the storage volume at a minimum. Thus, one major technical limitation to such a vehicle is the maximum size and cost of the pressure vessels necessary to store the oxidizer. In the case where payloads larger than CubeSats are desired, it may be advantageous to have a vehicle that uses an oxidizer that can be stored as a liquid to avoid the requirement for large and expensive pressure vessels.
Heister and Wernimont elaborate on the practicality of hybrid rockets for space applications which demand storable oxidizers, highlighting nitrous oxide (N
2O) for its low toxicity and self-pressurization ability [
8]. To clarify the self-pressurizing ability of N
2O, values for density,
ρ, in kg/m
3 and vapor pressure,
Pv, in Pa are plotted as functions of temperature in
Figure 1 based on data from the National Institute of Standards and Technology (NIST) online database [
9]. The main conclusion that can be drawn from this figure is that N
2O can be self-pressurized as a liquid with densities ranging from 700 kg/m
3 to 900 kg/m
3 at pressures ranging from 4 MPa to 6 MPa for a range of temperatures typically permissible to satellite operators—roughly 280 K to 300 K.
Many noteworthy hybrid rocket demonstrations in recent years have been achieved in part by taking advantage of the self-pressurizing ability of N
2O. These include the aforementioned SpaceShipTwo, as well as its predecessor vehicle, SpaceShipOne [
10], the highly successful Stuttgart University student-based hybrid sounding rocket, HEROS 3, reported by Kobald et al. [
11], the rocket test sled trials of Muroran Institute of Technology reported by Nakata et al. [
12], the small launch vehicles of TiSPACE Inc. reported by Chen and Wu [
13], as well as the sounding rockets of Space Forest Ltd. reported by Gamal et al. [
14]. However, it is also important to point out that N
2O can be pressurized above its vapor pressure to increase the flow rate capability of, and prevent two-phase flow within, the feed system. For example, Whitmore et al. used helium to pressurize a liquid N
2O feed system for closed-loop throttling and thrust control [
15]. Similarly, the Peregrine sounding rocket project of NASA, Stanford University, and SPG Inc. reported by Zilliac et al. used helium to pressurize an N
2O reservoir to slightly above the vapor pressure [
16]. The current research uses a similar feed system, which will be described in detail in the Materials and Methods section.
There are two distinct fuel design strategies used in the aforementioned N
2O hybrid rocket projects to achieve high thrust-to-weight ratios. One strategy is to use non-liquifying fuels with multiple ports and/or chambers to increase the burning surface area and/or create a vortex-like flow field. This is true for SpaceShipOne/Two, and the hybrid rockets reported by Chen and Wu, and Whitmore et al. in [
1,
13,
15]. The other strategy is to use liquefying fuels with a single port, in which case the entrainment of liquid droplets from the surface of the melting fuel leads to high burning rates. This is true for the hybrid rockets reported by Kobald et al., Gamal et al., and Zilliac et al. in [
11,
14,
16]. In a 5 kN thrust-class sounding rocket launch reported by Nagata et al., the former strategy was employed with great success using a high-density polyethylene (HDPE) fuel of the Cascaded Multistage Impinging-jet (CAMUI) design and liquid oxygen as the oxidizer [
17]. With a characteristic exhaust velocity,
c∗, efficiency,
η∗, of 99% and a sustained acceleration during launch of 4 G to 5 G, the major concern of this development project shifted to nozzle thermochemical erosion. The tests in follow-on research to investigate nozzle erosion consistently showed values of
η∗ greater than 95%. Furthermore, the mass “equivalent” regression rates, based on the fuel grain outer dimensions and mass consumption rates, reached values upwards of 3 mm/s, which is comparable to or exceeding that of liquefying propellants [
18]. The main drawback of using a CAMUI-type fuel, or something similar in nature, is the rigor involved in the fuel design itself. It can be said that the main benefit of using liquefying fuels in place of geometrically complex fuels, like CAMUI, is the simplicity of the single port fuel design that can be used. Mazzetti et al. make a strong argument on behalf of hybrid rockets in general, but specifically for liquefying fuel-based hybrid rockets because of the combination of the high fuel regression rate and fuel design simplicity [
19].
In the context of designing an apogee kick motor, achieving a high thrust-to-weight ratio becomes less critical than in the context of a planetary launch vehicle. For example, to achieve a transfer from GTO to Mars orbit, a change in velocity of roughly 1200 m/s is required. Even at a constant acceleration of only 1 G, this apogee kick would require only a two-minute burn time. Thus, it can be said that achieving a high specific impulse, low manufacturing costs, and minimal combustion oscillations is more important in the development of an apogee kick motor than improving the fuel regression rate. In fact, Jens et al. selected the non-liquefying fuel, polymethyl methacrylate (PMMA), over a liquefying wax fuel for their hybrid rocket apogee kick motor development specifically to prevent acceleration from exceeding 3 G [
5].
In the fiscal year of 2018, the authors of this paper began the development of a hybrid rocket apogee kick motor in collaboration with the Japanese Institute of Space and Astronautical Science (JAXA/ISAS) that will be capable of transporting small satellites (less than 100 kg) from GTO to lunar orbits and beyond. Nitrous oxide (N2O) was selected to be the oxidizer for its long-term storability, non-toxicity, non-corrosiveness, low cost, widespread commercial availability, self-pressurizing ability, and successful role in the numerous projects mentioned in the previous paragraphs. High-density polyethylene (HDPE) was also selected for its non-toxicity, low cost, and widespread commercial availability, as well as for its mechanical strength and heritage in the development of the CAMUI-type hybrid rocket by the authors and their predecessors.
The propellant combination, N
2O/HDPE, has mostly gone overlooked in previous research due to the heavy focus on the development of launch vehicles with high thrust-to-weight ratios. The latest version of the SpaceShipTwo engine may be an exception to this claim; however, the details of the current propellant combination have not been made public yet. The two previous publications that were closely related to the proposed work were an experimental study conducted by Doran et al. on a laboratory-scale N
2O/HDPE hybrid rocket [
20], and a numerical study of nozzle thermochemical erosion conducted by Bianchi and Nasuti [
21]. Doran et al. reported
η∗ values ranging from 90% to 95%, and a weak correlation between fuel regression rates—ranging from 0.4 mm/s to 0.6 mm/s—and oxidizer port mass flux. Bianchi and Nasuti predicted that the erosion rate of graphite is 0.06 mm/s when the equivalence ratio is close to 1 and the pressure is 1 MPa. Moreover, they demonstrated that as a general trend among all propellant combinations, the erosion rate decreases with an increasing equivalence ratio and is linearly dependent on pressure.
The results of Doran et al. and Bianchi and Nasuti serve as a valuable starting point for this research, but there are some reasons why this information is inadequate for our purposes. Doran et al.’s experiments had combustion times in the range of 5 s to 7 s, which is too short of a span to determine if the fuel regression correlations will remain true in time, yet long enough to introduce uncertainty due to the time-averaging of nonlinear terms needed for the correlations. For example, test 42 from Doran et al.’s study shows a duration of 5.9 s with an initial port diameter of 13.4 mm and an average regression rate of 0.76 mm/s. This means the oxidizer port mass flux decreased by roughly 40% during the test, which for this test would account for a span of almost 100 kg/m2-s. Also, Doran et al. supplied N2O to the motor as a gas, whereas it is crucial for the purposes of this study to supply the oxidizer as a liquid. Bianchi and Nasuti’s results will prove to be consistent with this study, but they are only valid when the nozzle throat temperature has reached a steady state.
Due to the lack of previous work on the propellant combination of N
2O/HDPE, the authors found it necessary to conduct basic research to form empirical correlations for the fuel regression rate,
c∗, efficiency,
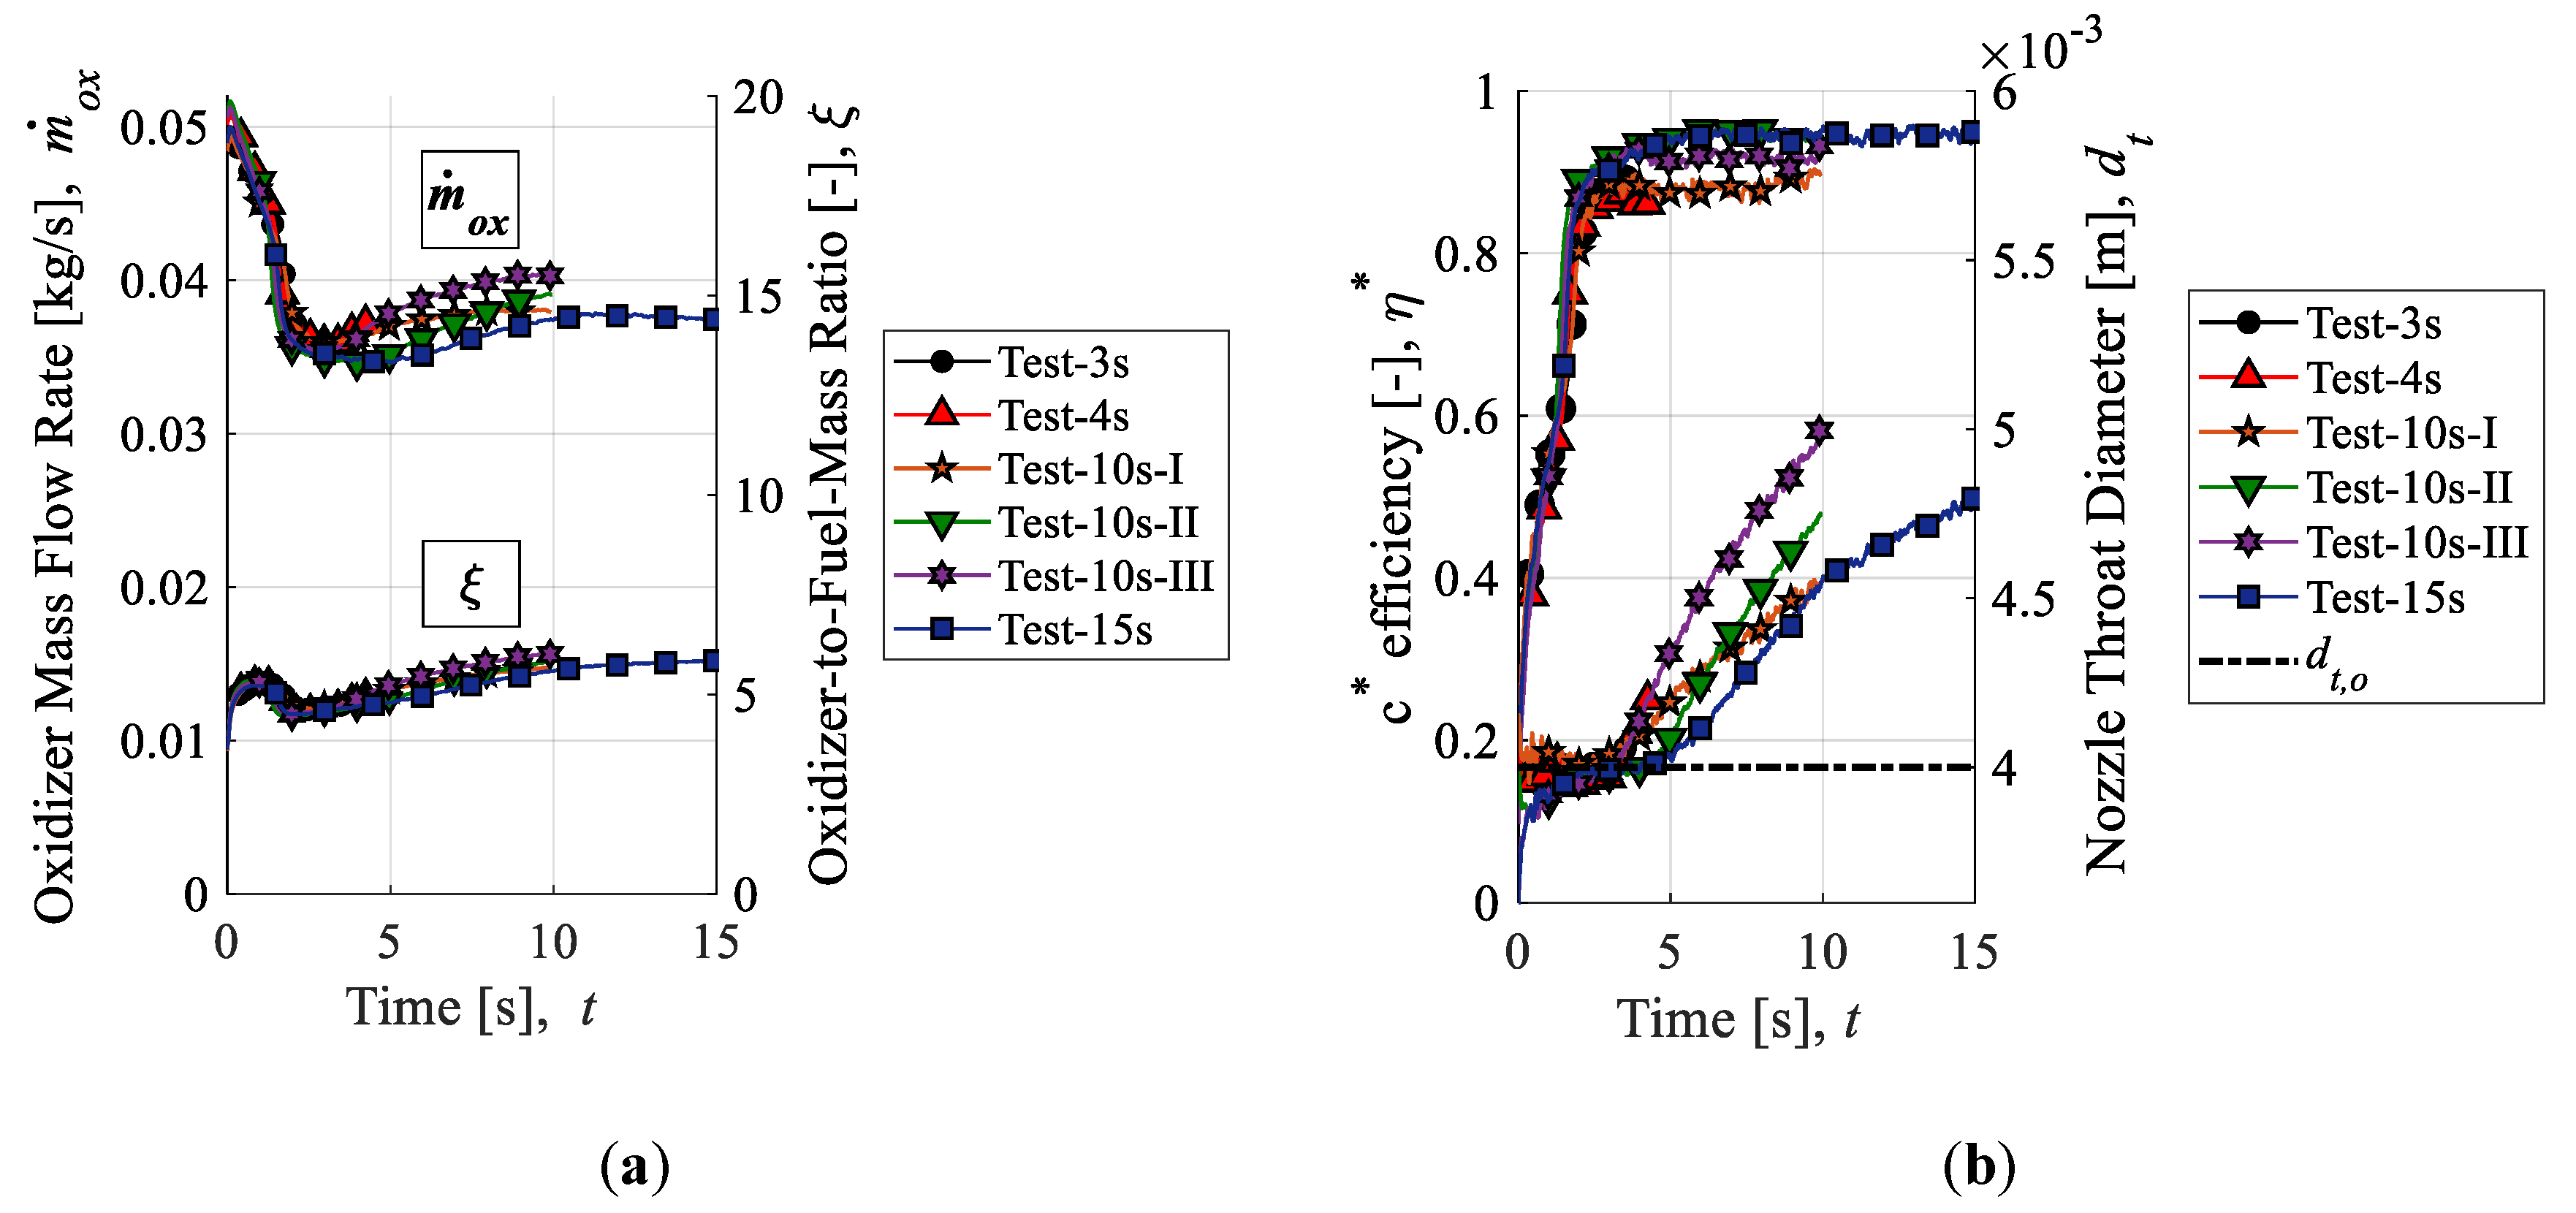
η∗, and nozzle erosion for the first time. Of the multitude of measurement techniques introduced in previous research, the latest versions of the data reduction methods referred to as ballistic reconstruction techniques appeared to offer the most effective means of pursuing this research in a cost-effective and expedient way. In general, ballistic reconstruction techniques only require some combination of the following commonly measured experimental values: (1) Oxidizer mass flow rate,
; (2) chamber pressure,
Pc; (3) thrust,
F; (4) overall fuel mass consumed, Δ
Mfu; and (5) final nozzle throat diameter,
dt,f. This means that the same measurement equipment can be used regardless of fuel design, configuration, or scale. This is done by using either the
c∗ equation, thrust equation, or both, in an iterative algorithm to determine instantaneous values of the oxidizer-to-fuel mass ratio,
ξ;
c∗ efficiency,
η∗; thrust correction factor,
λ; and, recently, nozzle throat area,
At. Wernimont and Heister, and Nagata et al. introduced ballistic reconstruction techniques, which used the
c∗ equation to determine fuel mass consumption under the assumption that
η∗ is constant and nozzle throat erosion is negligible [
22,
23]. Carmicino and Sorge, and Nagata et al. alleviated the need to treat
η∗ as a constant by measuring thrust and incorporating the thrust equation [
24,
25]. Most recently, Kamps et al. combined these works, incorporating both the
c∗ and thrust equations, and treating
η∗ as a constant in order to determine the history of the nozzle throat area in an effort to investigate nozzle throat erosion [
26]. This ballistic reconstruction technique was titled “Nozzle Throat Reconstruction Technique” or “NTRT,” and was later used in a follow-on study by Kamps et al., which demonstrated how to use the results of the NTRT with thermocouple measurements from within the nozzle to determine the wall temperature history at the nozzle throat [
27]. This follow-on technique was titled the “Throat Temperature Reconstruction Technique” or “TTRT.”
Unfortunately, reconstruction techniques, such as the NTRT, have a region where multiple solutions exist for the results of
ξ, typically when hybrid rocket tests are conducted in fuel-rich conditions. Nagata et al. [
25] and Saito et al. [
28] demonstrated that approximations for
c∗ can be used to overcome this problem in the data reduction of hybrid rocket firing tests using oxygen. However, as will be evident in the following section, these approximations are not suitable when using N
2O as the oxidizer because the region of multiple solutions that exists is too large. The objective of this research is to further develop the experimental methodology introduced by Kamps et al. so that the analysis of tests conducted under the propellant combination of N
2O/HDPE yields results for the histories of fuel consumption, nozzle erosion, and characteristic exhaust velocity efficiency regardless of the oxidizer-to-fuel-mass ratio. The purpose of this research is to lay the groundwork for effectively conducting basic combustion research in the development of a hybrid rocket apogee kick motor using N
2O as the oxidizer and non-liquefying fuels, such as HDPE, as the fuel.
2. Materials and Methods
Kamps et al. recently introduced a method, titled the “Nozzle Throat Reconstruction Technique (NTRT),” for determining both
At and
ξ histories through the data reduction of commonly measured experimental values with the aim of enabling hybrid rocket researchers to accurately and cost-effectively investigate nozzle erosion experimentally [
26]. The two governing equations of this method are the thrust equation shown by (1), and the characteristic exhaust velocity equation shown by (2):
Here, the thrust,
F, is in N and the theoretical characteristic exhaust velocity,
, is in m/s. The term,
λ, is the dimensionless thrust correction factor,
is the propellant mass flow rate in kg/s,
ue is the nozzle exit velocity in m/s,
Pe and
Pa are the nozzle exit pressure and atmospheric pressure in Pa, and
At and
Ae are the nozzle throat area and exit area in m
2. The thrust correction factor,
λ, accounts for the momentum losses due to non-one-dimensionality and non-isentropicity of flow, as well as the momentum losses in the axial direction due to the divergence angle of the nozzle exit. The propellant mass flow rate can be shown in terms of the oxidizer-to-fuel-mass ratio according to Equation (3):
where the subscript, “
ox”, indicates that the mass flow rate term is a property of the “oxidizer” only.
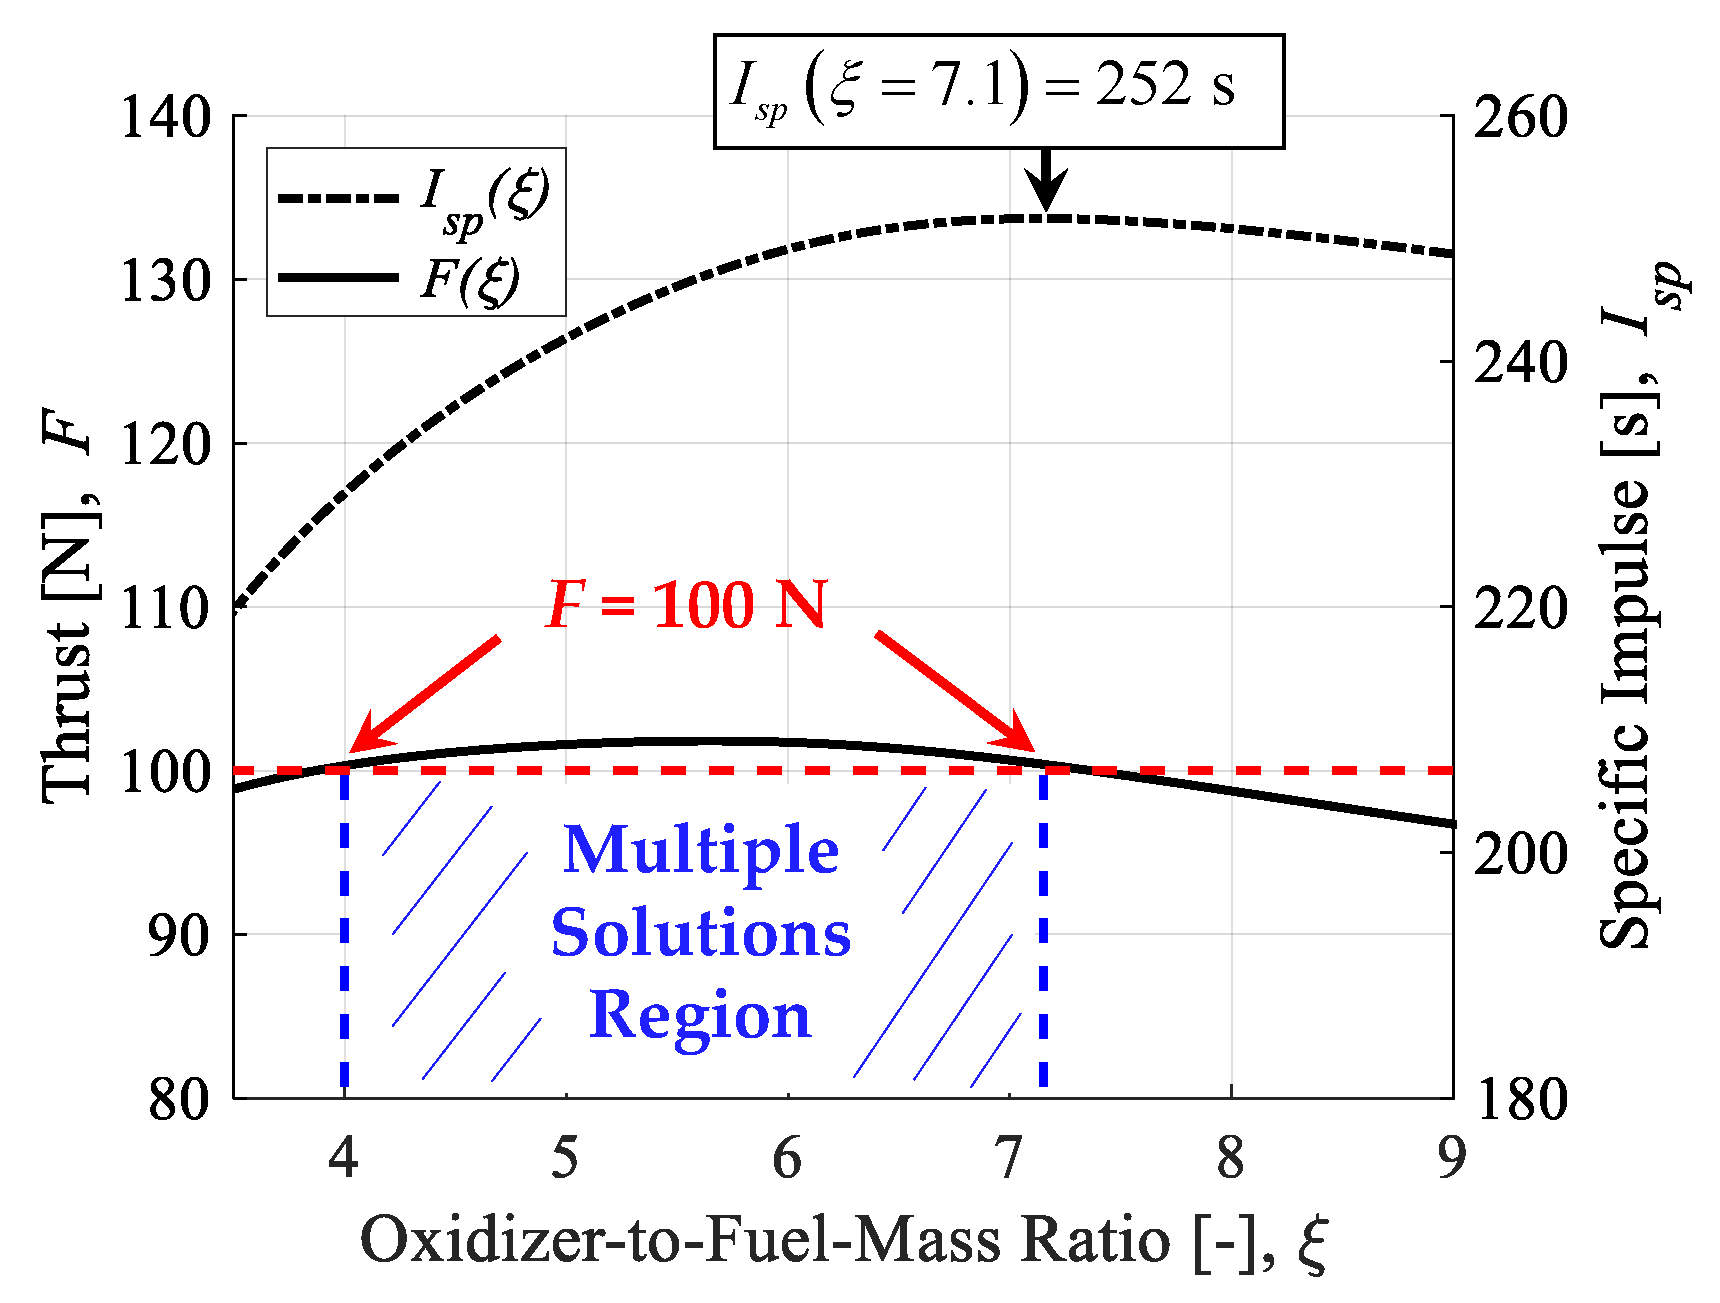
When the propellant combination of N2O/HDPE is used, there exists a region of multiple solutions of ξ where maximum specific impulse can be achieved.
This is shown by breaking down the calculation of the thrust equation. The value of
Pe is calculated implicitly from Equation (4):
and
ue is calculated explicitly from Equation (5):
where
γ, the specific heat ratio of combustion gas, is calculated using the NASA Chemical Equilibrium with Applications (CEA) computer program as a function of
Pc and
ξ [
29]. Although it is not a problem in the tests conducted in this study, it is worth noting that Equations (4) and (5) are not valid if shocks occur in the nozzle, which is possible in ground tests where the chamber pressure is relatively low.
Figure 2 plots
F as a function of
ξ for the case where
dt is 4 mm,
Pc is 4.7 MPa, and
is 36 g/s—which is representative of the tests conducted in this study. Here, the efficiency terms,
η∗ and
λ, were assumed to be 1 (i.e., 100%). The range of
ξ from 4.0 to 7.1 results in roughly the same value for thrust. Specific impulse,
Isp, has also been plotted in
Figure 2 to show that optimal performance is achieved when
ξ is roughly equal to 7. This is important because in a typical hybrid rocket, the value of
ξ increases in time. Thus, for the goal of maximizing
Isp in long duration firing tests, it may be advantageous to begin operations in the multiple solutions region of
ξ. Furthermore, from the vantage point of nozzle erosion prevention, it is advantageous to operate with the smallest value of
ξ that is possible [
21].
In previous data reduction methods, such as the NTRT, data are analyzed separately for each firing test conducted, with no cross-over of data between tests. However, in this research, a different approach is taken. The concept of the method employed in this paper is to include an additional experimental input in the governing set of equations of the NTRT, allowing for an additional output, and avoiding the issue of multiple solutions arising from the thrust equation’s dependency on ξ. More precisely, the value for overall fuel mass consumption, ΔMfu, which is a constant value input to the original NTRT, will be replaced by a fuel mass consumption history, mfu. Thus, η∗ can be solved at every time, rather than be treated as a constant. Since the outputs of the data reduction method in this research are in effect the same as the NTRT, the method in this paper will be referred to as “NTRT plus” or “NTRT+.”
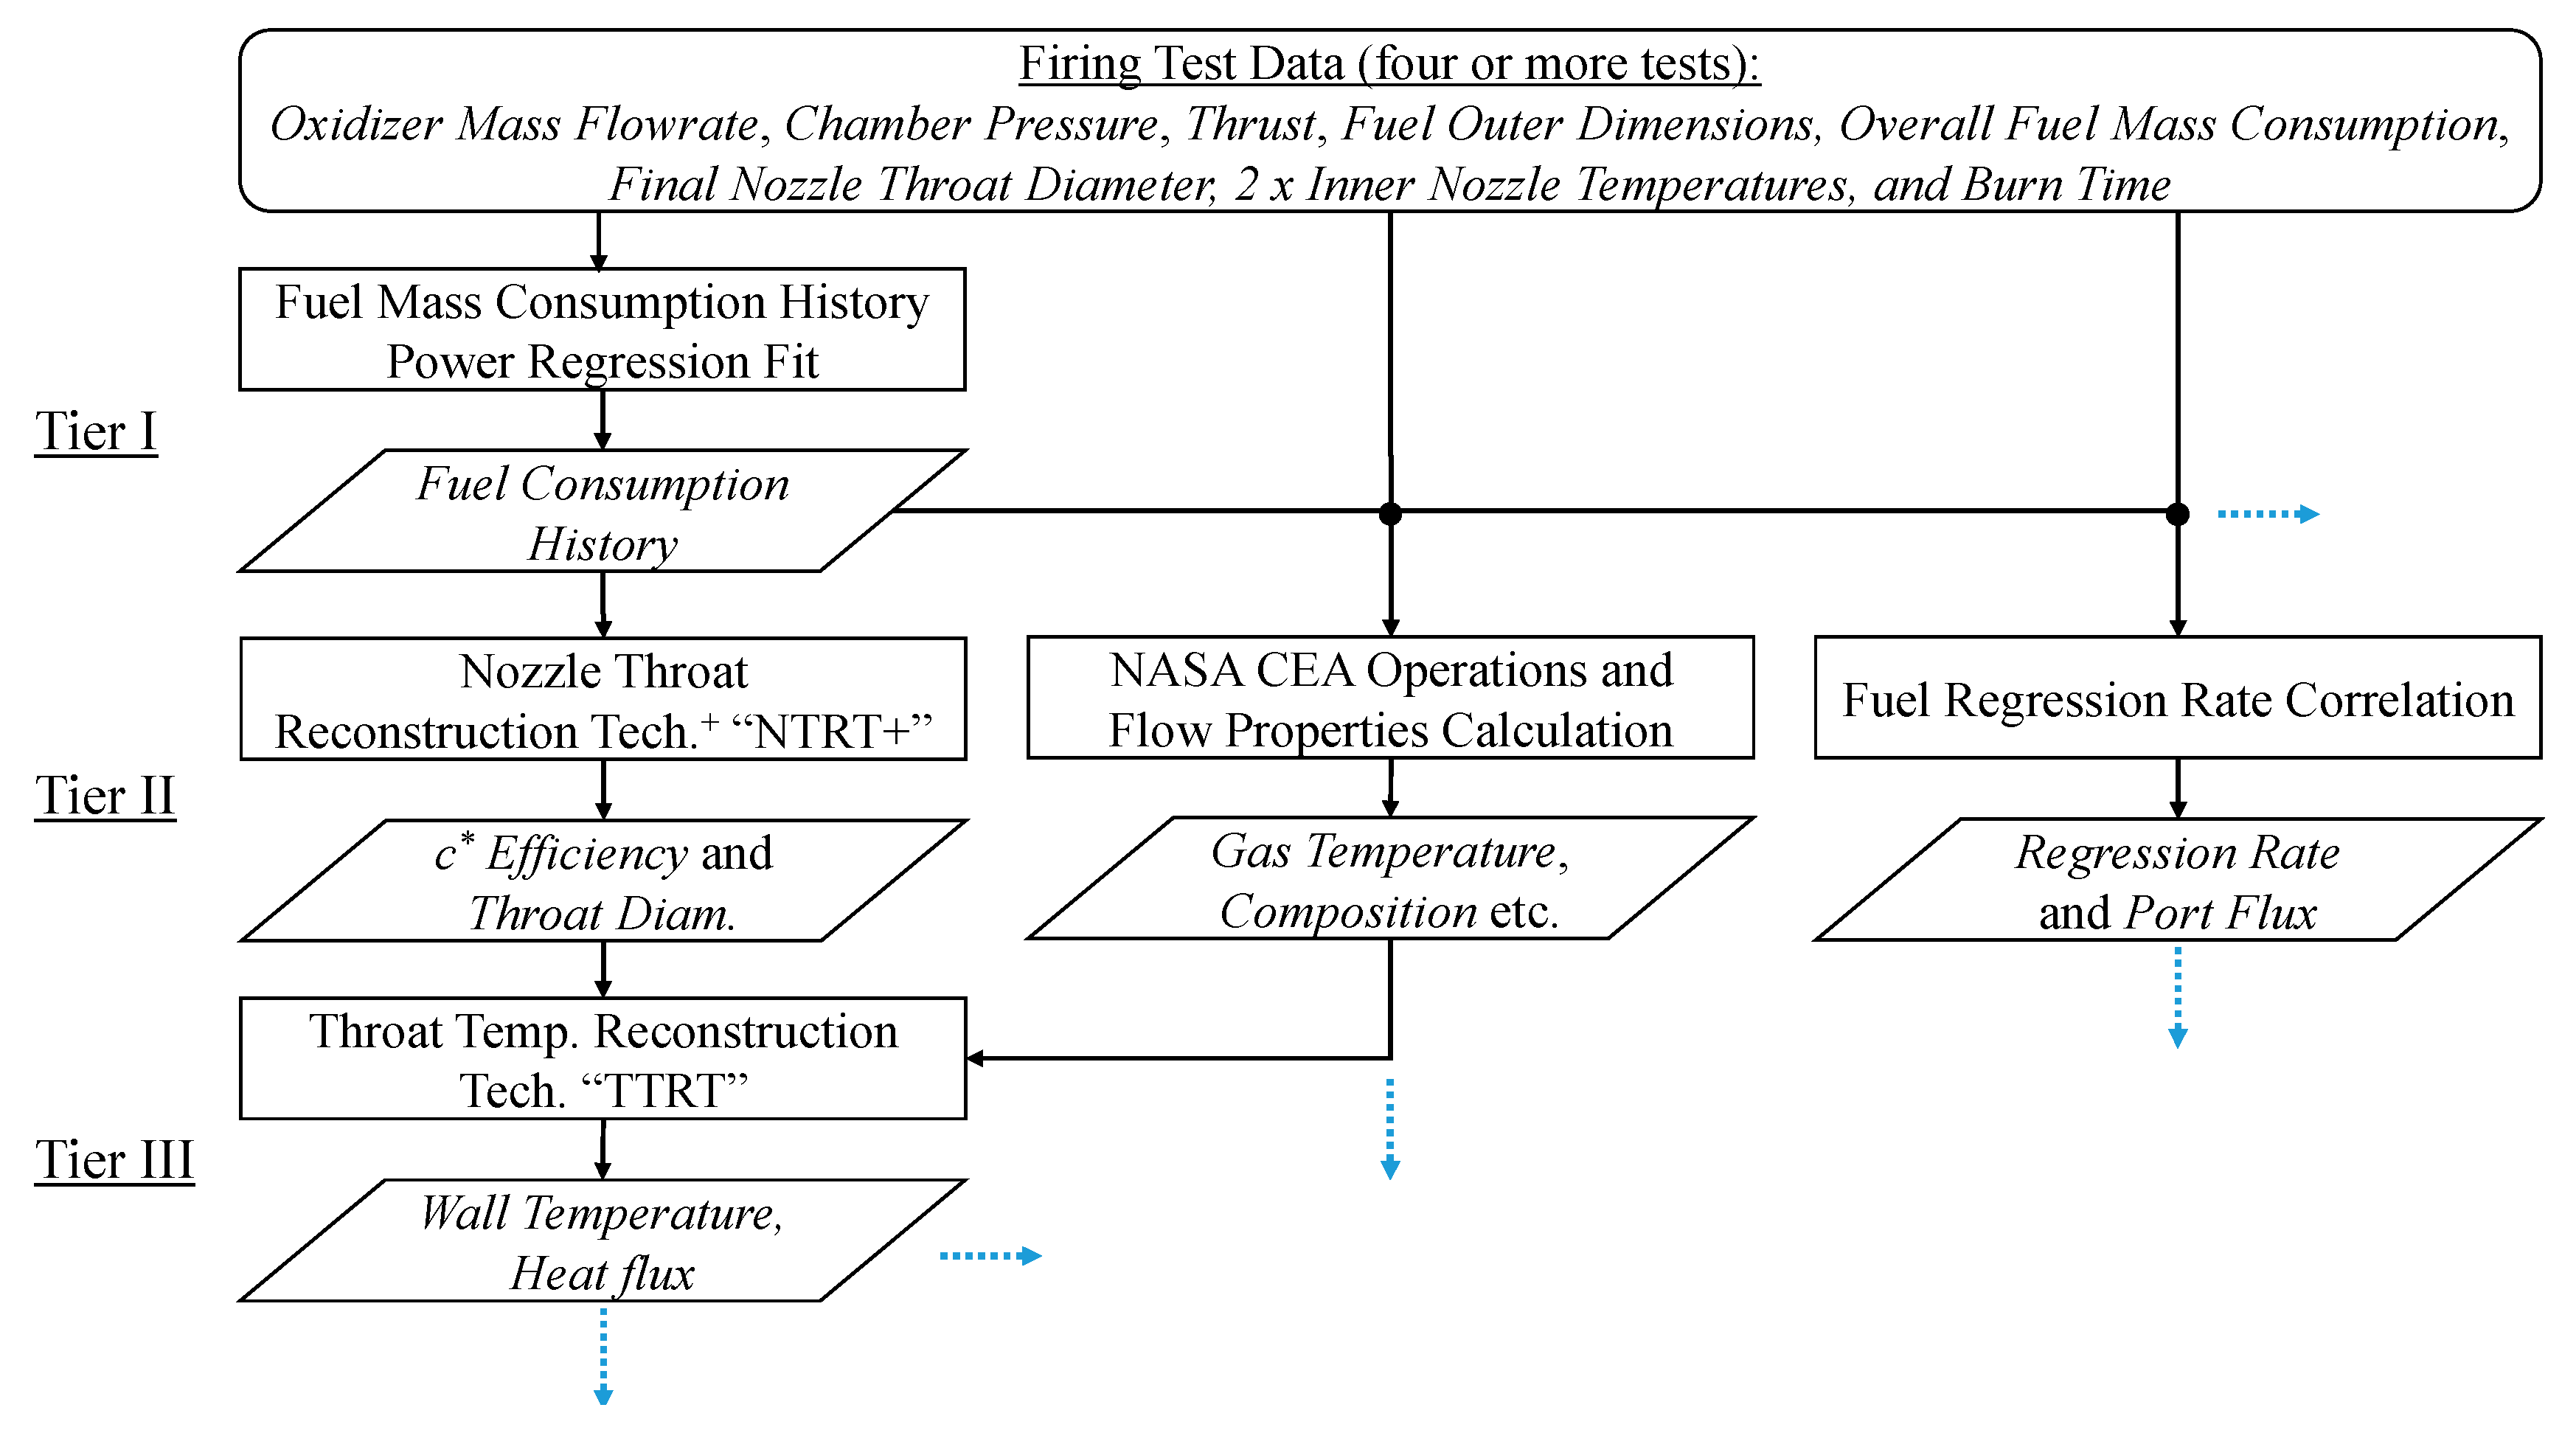
The operational flow of the comprehensive data reduction procedure used in this research is shown in
Figure 3. Data reduction steps are separated into “tiers” based on the information flow between operations. First, a firing test is repeated multiple times, varying only the combustion time between tests. In this way, a trendline can be determined that describes the overall fuel mass consumption progression between tests. This trendline is the only “tier I” operation. It is crucial that there is a clear agreement with the fuel mass consumption history trendline and the overall fuel mass consumption values determined through direct measurement in each test separately. With the fuel mass consumption history determined, it is possible to run all “tier II” operations: The NTRT+, NASA CEA, and fuel regression rate correlation operations. Finally, in this paper, the only “tier III” operation carried out is a simplification of the TTRT, which is used to determine the nozzle throat wall temperature histories.
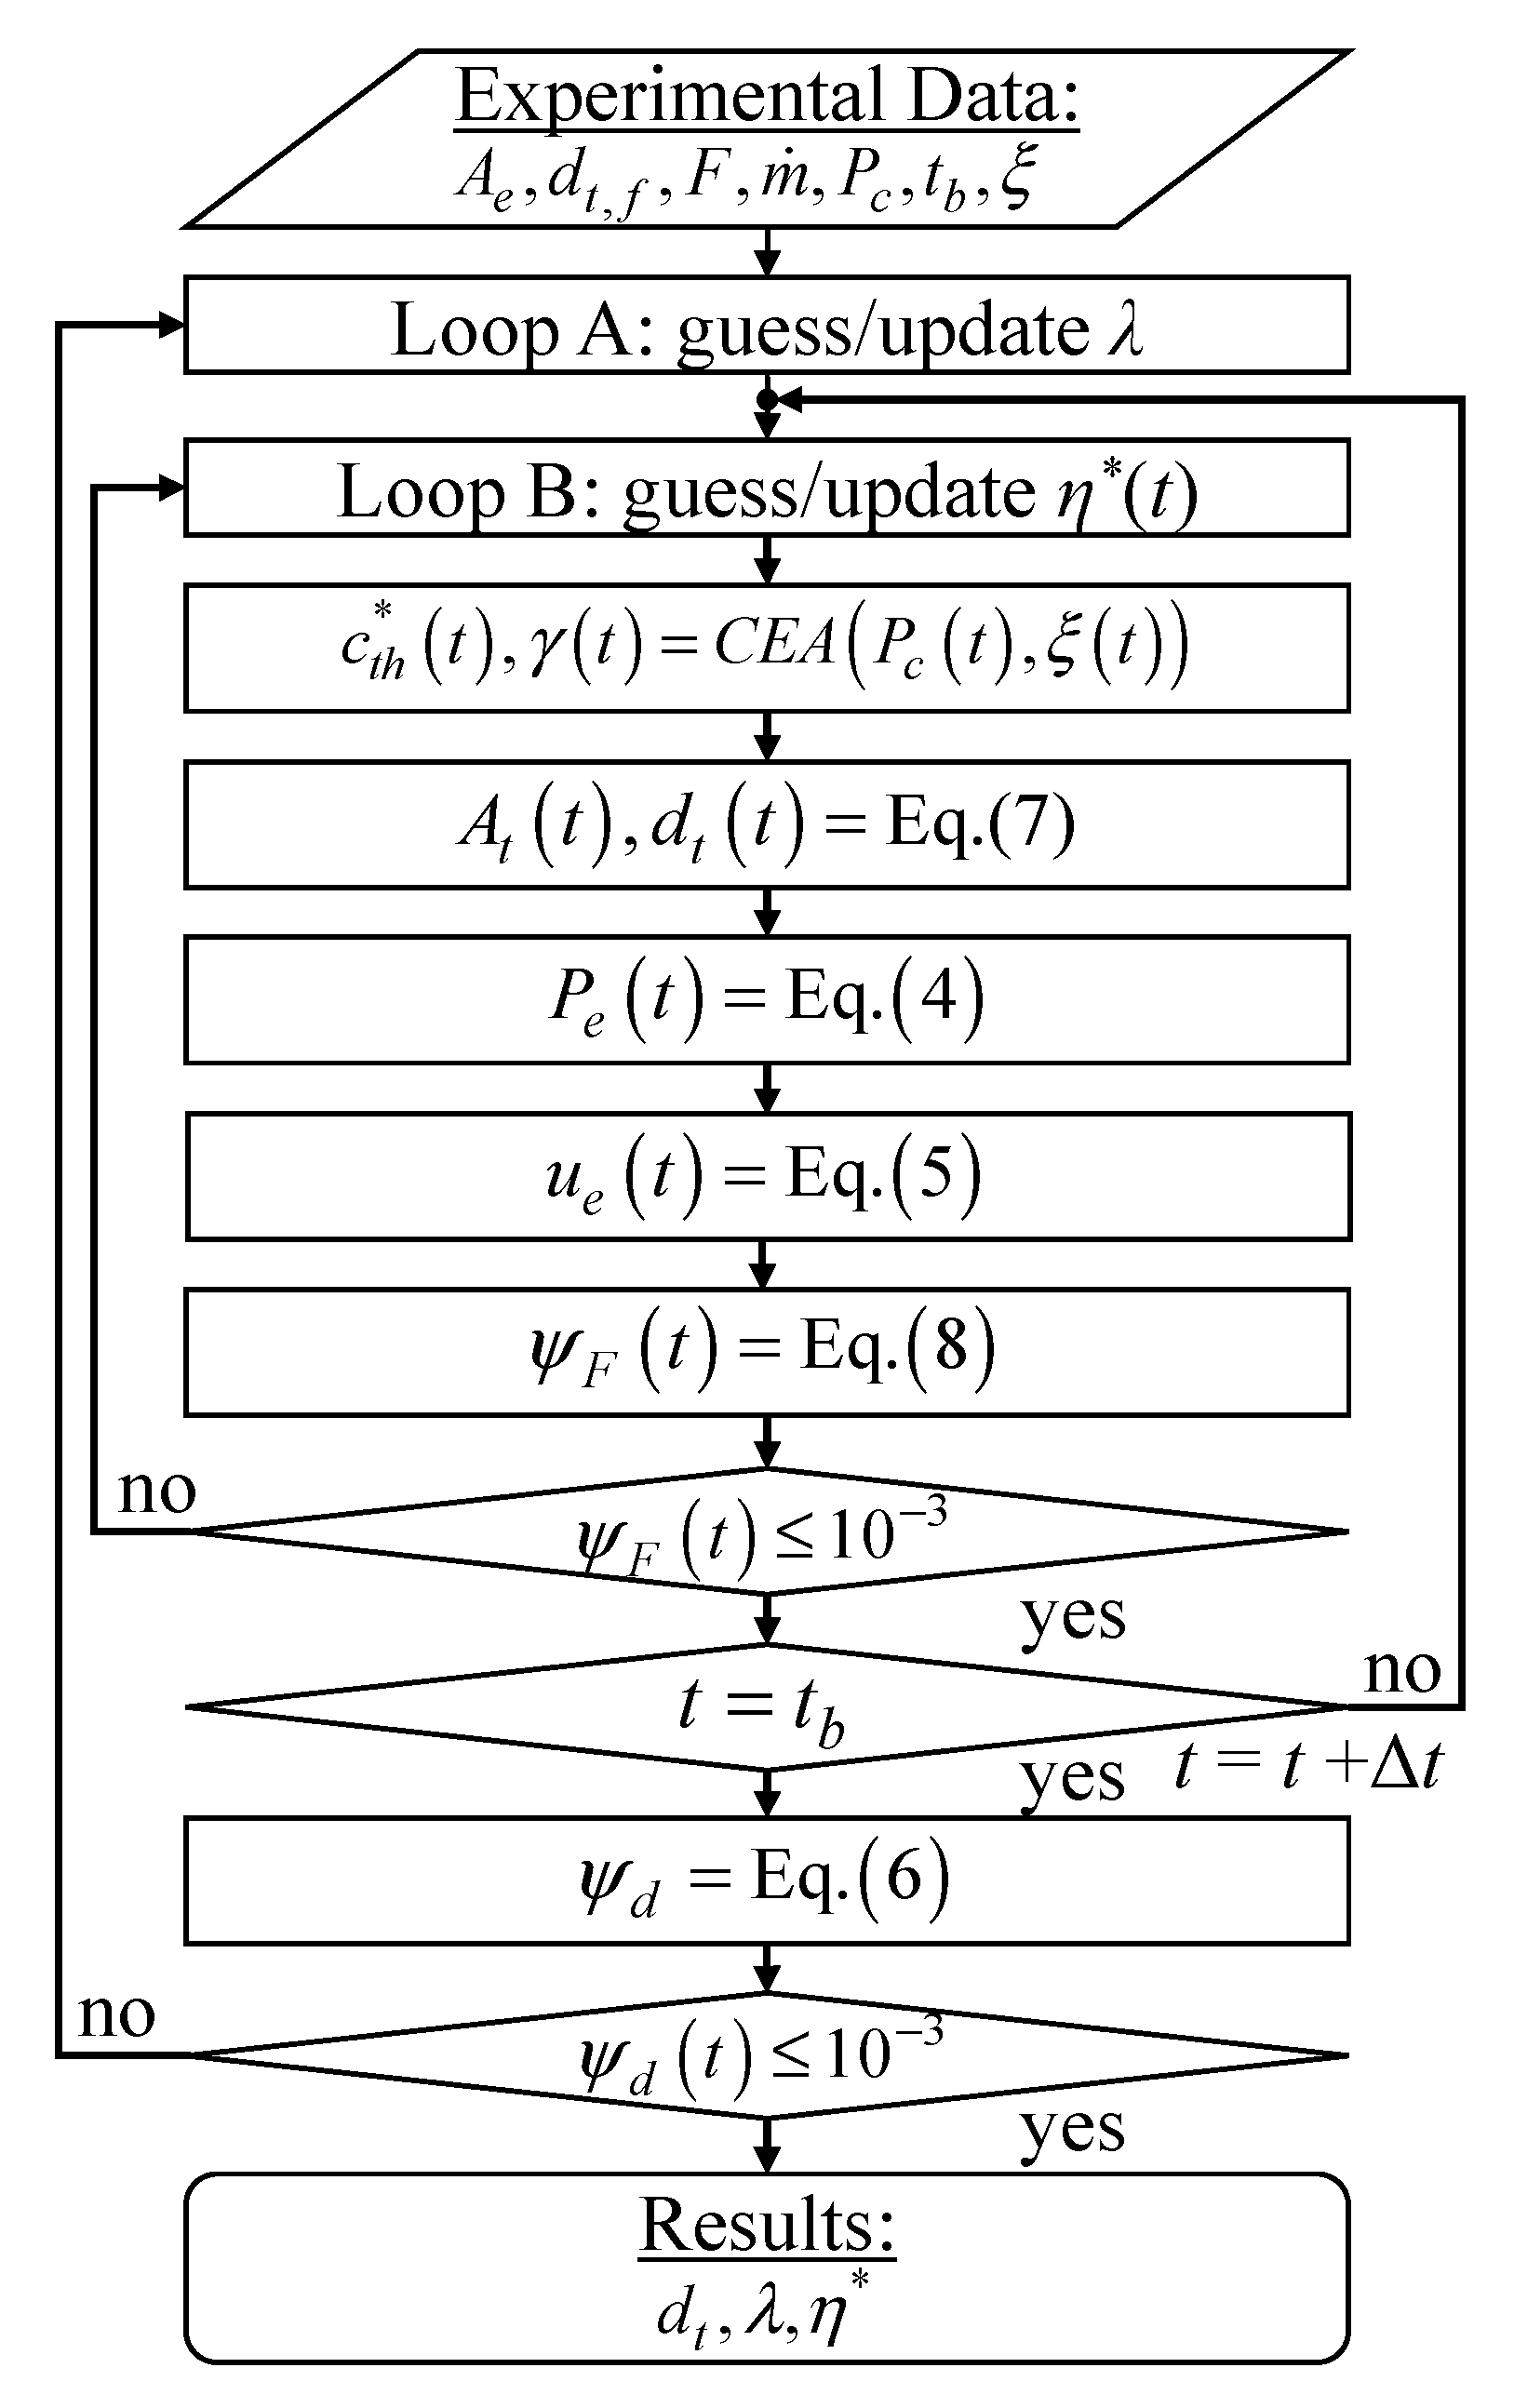
Although the set of governing equations for the NTRT+ is essentially the same as the original NTRT, the algorithm is significantly different. The computational flow of the NTRT+ is shown in
Figure 4. There are two iterative loops: Loop A and loop B. Loop A iterations are conducted only once to solve for
λ. Loop B iterations are conducted at every time step to solve for the
η∗ history. Convergence of loop A depends on reducing the final throat diameter residual,
ψd, to zero, according to Equation (6):
were
dt(
tb) is the calculated value for the nozzle throat diameter at the end of the firing duration. The calculated nozzle throat diameter history is backed out of the value for the nozzle throat area,
At, which is determined by rearranging the terms in Equation (2), as shown by Equation (7):
The value of
λ is iterated until the nozzle throat diameter calculation matches the known value at the end of the firing test. Convergence of loop B depends on reducing the thrust residual,
ψF, to zero, according to Equation (8):
The value of
η∗ is iterated until the thrust calculation matches the measured value at that time.
The most common adaptation of Marxman et al.’s diffusion-limited regression rate model, first introduced in [
30], will be used for the analysis in this study. This model is shown by Equation (9):
where
is in m/s,
a and
n are empirical constants,
Gox is in kg/m-s
2, and
rfu is the fuel port radius in m. Two methods of fuel regression rate correlations are compared in this study. In both cases, the concept behind the correlations is to run tests under the same oxidizer mass flow rate, varying only the combustion time. As the fuel burns, the port diameter will increase and the oxidizer port mass flux will decrease accordingly. This is different than the traditional approach of limiting the combustion time and varying the oxidizer mass flow rate to vary the oxidizer port mass flux. With that in mind, the correlation procedure remains essentially the same. The more conventional correlation procedure is to use only the endpoint data (i.e., changes in value before and after firing) for fuel mass consumption and the measurement of the oxidizer mass flow rate. This method is referred to as the “endpoint” method. By separating the variables of the port radius,
rfu and time,
t, Equation (9) can be integrated as follows in Equation (10):
where Δ
t represents the sampling rate of the experimental measurement history in s, and
tb is the burn time in s. Burn time is defined as the duration of time from the moment the (gauge) chamber pressure reaches 10% of the maximum value to the time at the aft-bisector of the pressure drop at the end of burning. This designation is outlined in [
31] (p. 459), and was used in [
26,
27]. The fuel port radius in Equation (9) is calculated based on the fuel mass,
Mfu, fuel density,
ρfu, and the outer diameter and length of the fuel,
Dfu and
Lfu¬, according to Equation (11):
where
rfu,
Dfu, and
Lfu are in m,
Mfu is in kg, and
ρfu is in kg/m
3. The constant,
a, is determined by using the least-squares method (for a given value of
n) on Equation (10), and the exponent,
n, is determined by finding the value that maximizes the correlation of determination (i.e.,
R2) of the results of
a. The second fuel regression correlation method attempted in this paper simply considers the solution to Equation (11) for all times, and performs the least-squares method directly on Equation (9). This is possible because we can integrate the fuel mass consumption history trendline from the tier I operations to determine the history of
Mfu.
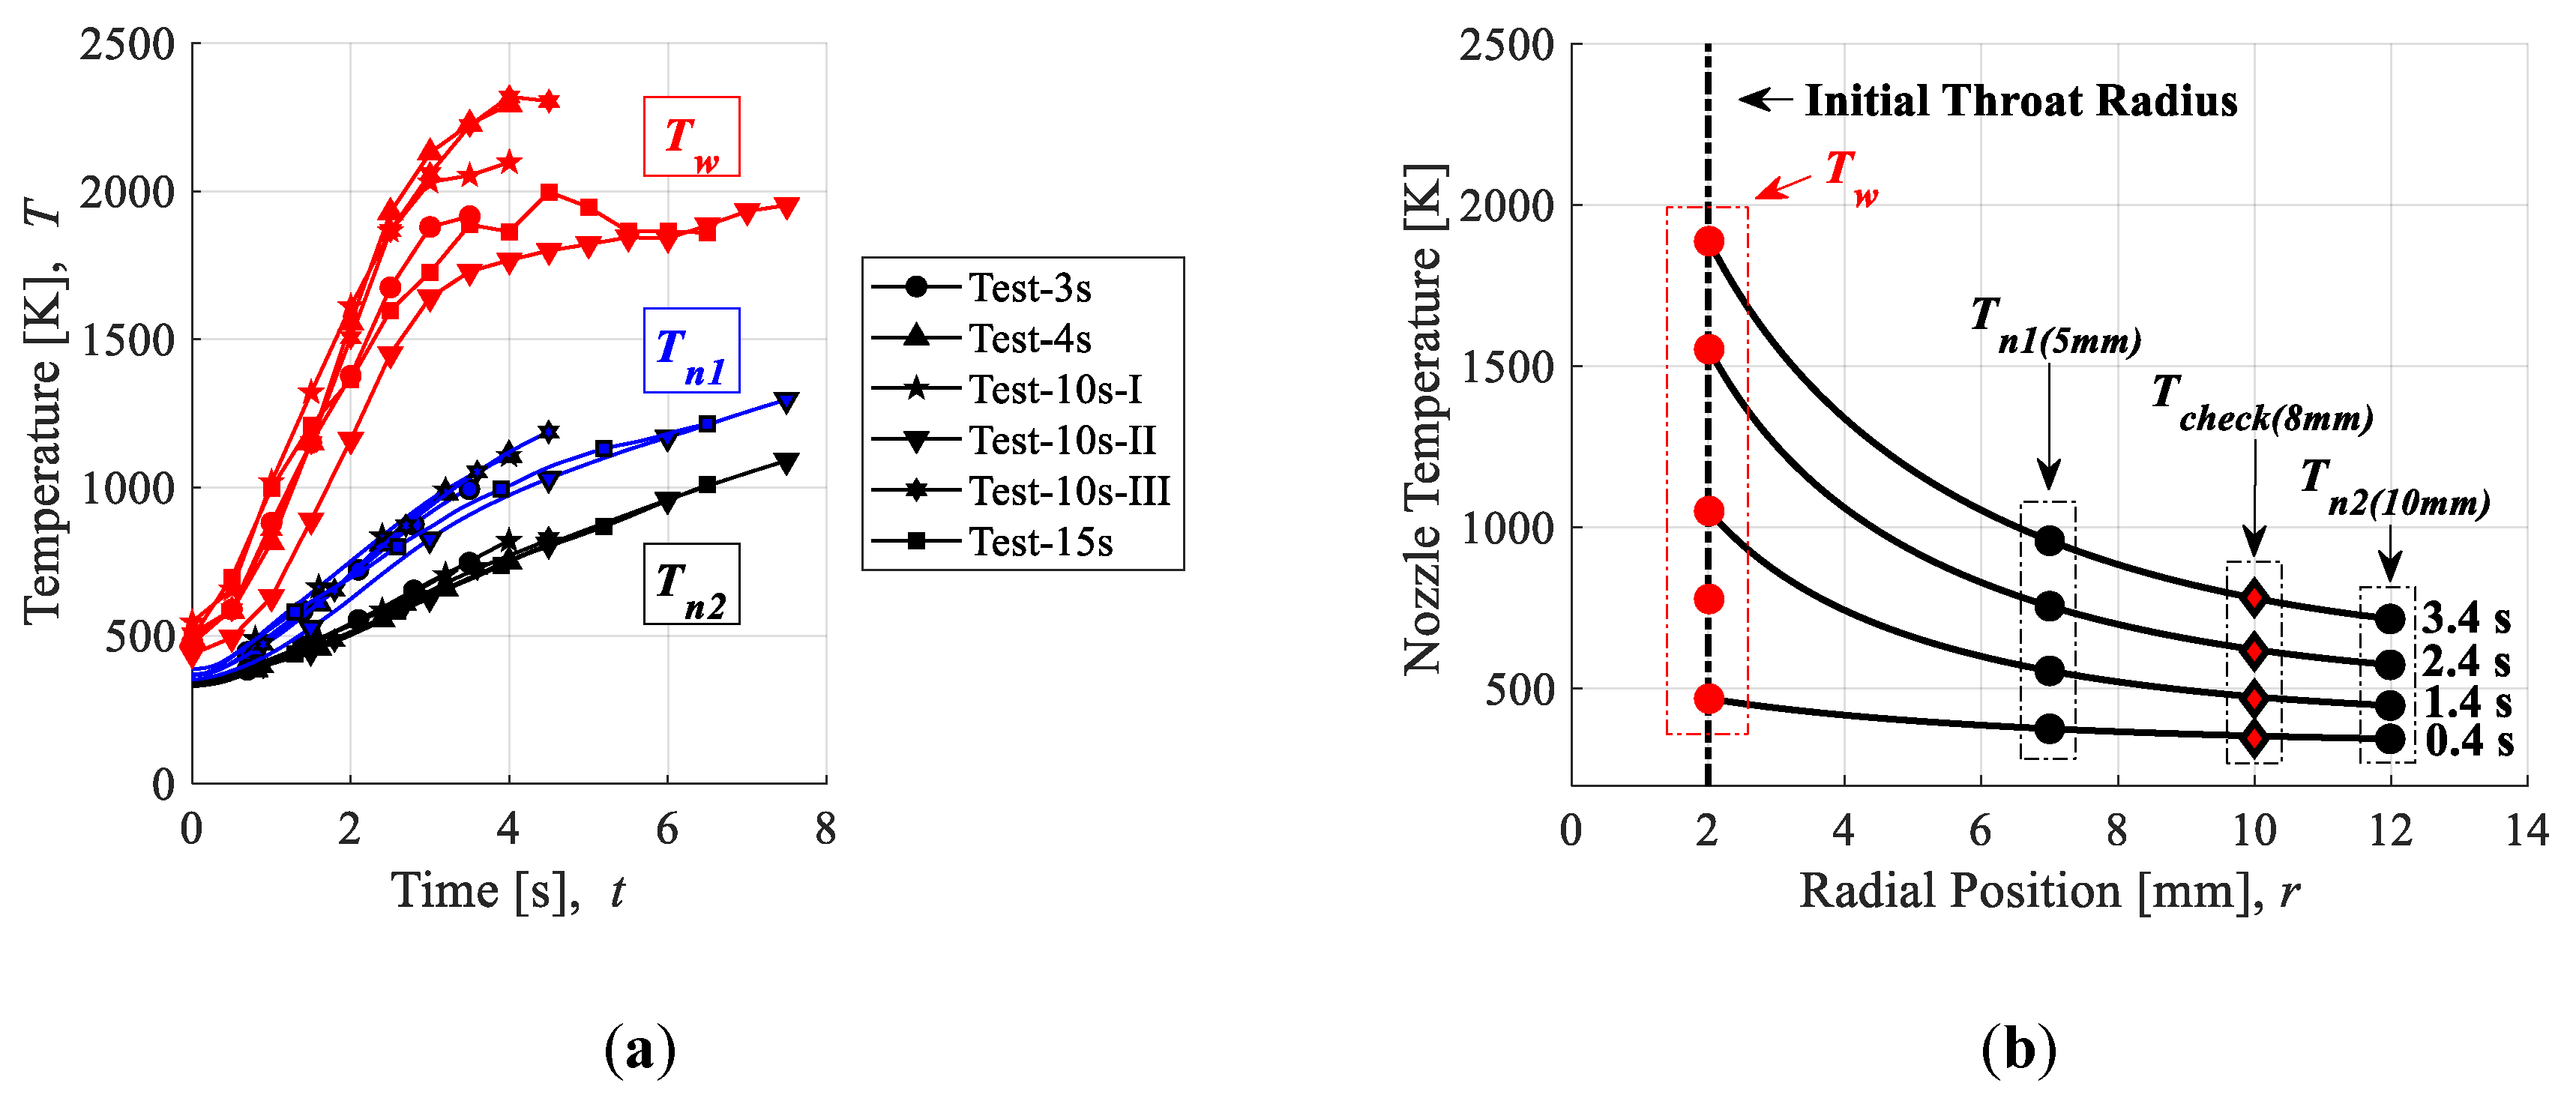
The Throat Temperature Reconstruction Technique, or TTRT, employed in this study is a simplification of the method introduced in [
27]. A single iterative loop solves for the nozzle throat wall temperature history,
Tw. Convergence of the TTRT depends on reducing the thermocouple temperature residual,
ψT, to zero:
Here,
Tn1 is the temperature at the position of the thermocouple placed closest to the nozzle throat in K. In general, the governing differential equation for 1D conductive heat flux in cylindrical coordinates reduces to Equation (13) by assuming a negligibly small axial temperature gradient and no internal heat generation:
Here,
α is thermal diffusivity of the nozzle in m
2/s,
T is the local instantaneous temperature in K, and
r is the radial position from the centerline of the nozzle in m. Approximating the partial derivatives in Equation (13) by the first term of the Taylor series expansions near the points of interest, consolidating terms, and rearranging yields the following finite difference equation:
where Δ
t is the time step, subscript
i specifies the radial node index, and superscript
j represents the time index. Note that the thermal properties of graphite,
k and
α, are treated as functions of temperature, as described in the following paragraph, but this behavior is approximated by using the solution of the temperature profile from the previous time step. With one temperature boundary set as the nozzle throat wall temperature,
Tw, and the other set as the nozzle thermocouple measurement temperature,
Tn2, we can solve for the temperature distribution history within the nozzle according to Equation (15):
A mesh size of Δ
r = 10
−5 m and a time step of Δ
t = 0.5 s was used for the calculations in this study.
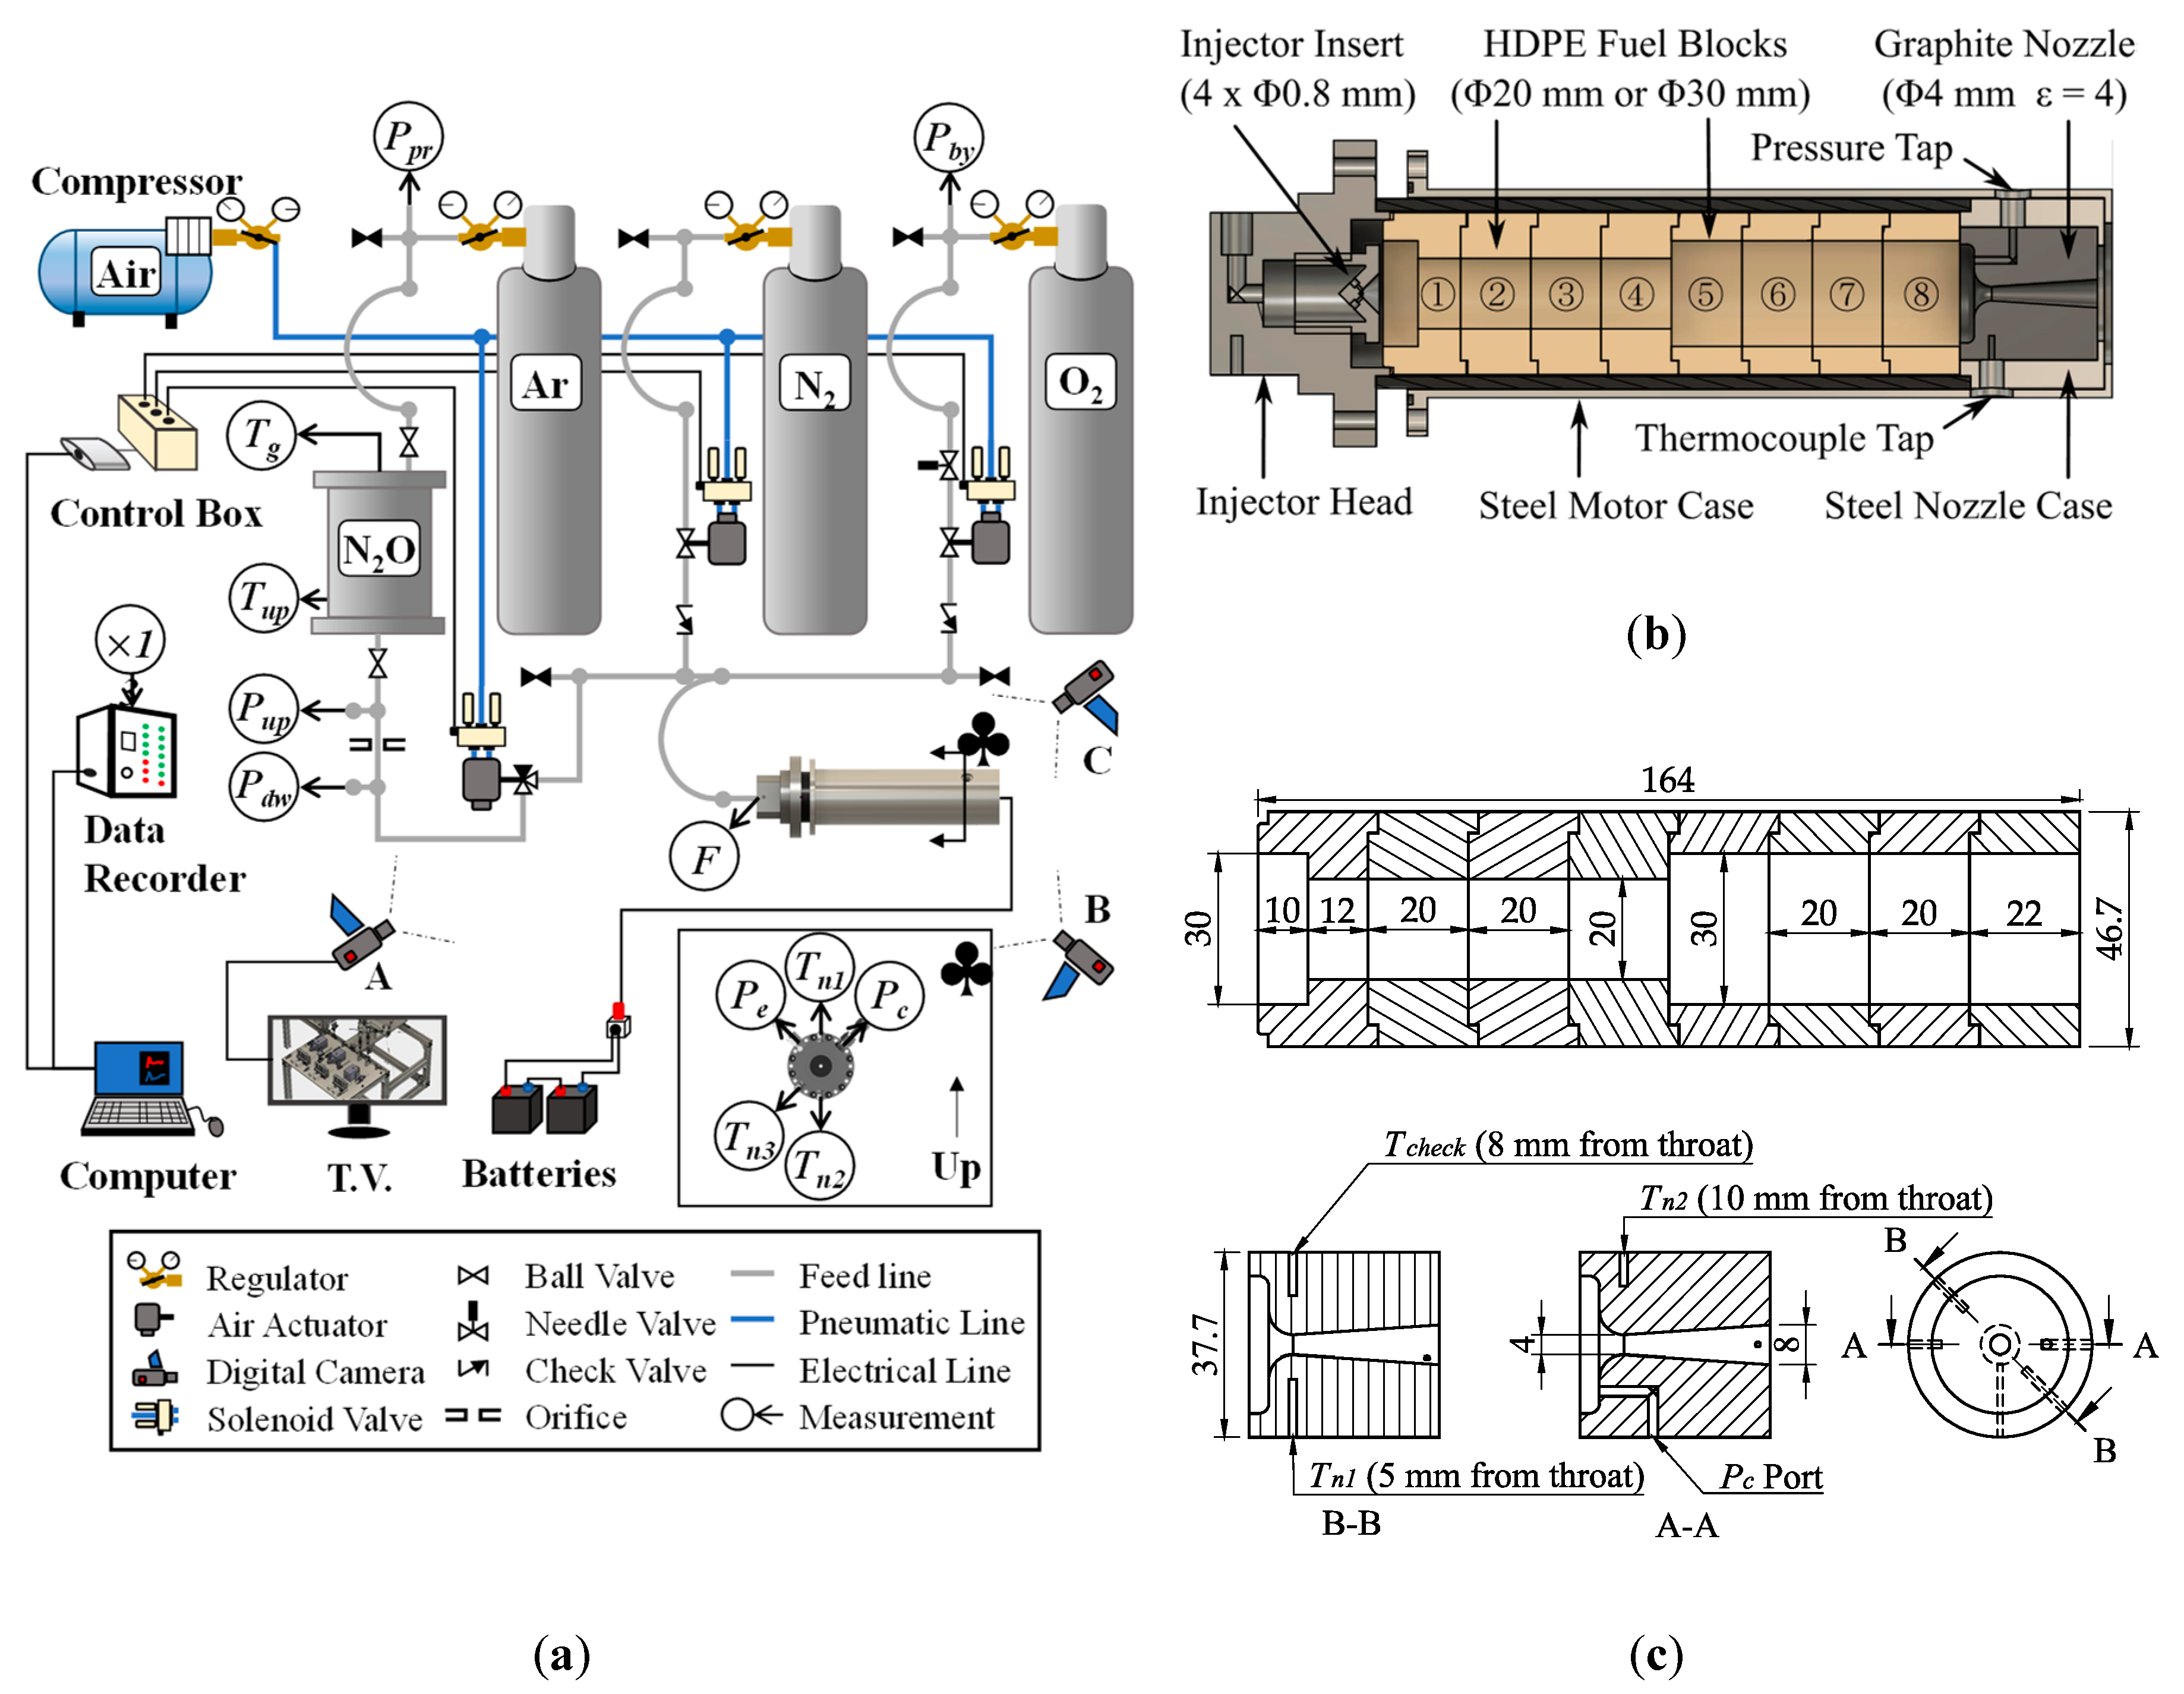
Static firing tests were carried out on a 100 N-thrust class motor. Depictions of the test setup, motor assembly, and fuel and nozzle schematics are shown in
Figure 5a–c, respectively. The test setup consisted of three fluid supply lines in parallel: A main oxidizer line with an Ar gas tank and an N
2O reservoir; a purge gas line with an N
2 gas tank; and an ignition assist oxidizer line with an O
2 gas tank. The flow in each line was controlled using a Swagelok pneumatic ball valve operated by an SMC solenoid valve. Solenoid valve operations were controlled in LABVIEW7. The N
2O in the reservoir, which was stored at outdoor atmospheric temperature (≈290 K), was pressurized to 7.6 MPa using Ar gas to ensure that it remained in a liquid phase until injection into the combustion chamber. The oxidizer mass flow rate was determined by measuring the pressure drop across an orifice plate with an orifice diameter of 1 mm located between the N
2O reservoir and the motor. The equation used to calculate oxidizer mass flow rate is (16):
where the oxidizer mass flow rate is in kg/s,
Cor is a dimensionless orifice flow coefficient determined experimentally to be 0.92,
dor is the orifice hole diameter in m (i.e., 0.001 m),
ρox is the oxidizer density in kg/m
3, and
Pup and
Pdw are the pressure upstream and downstream of the orifice in Pa, respectively. Note that the density of N
2O is a function of temperature, and was calculated based on the following equation determined from the NIST database [
9]:
where, in this case,
T is the temperature of N
2O in °C.
All tests were conducted using polyethylene (formula: C
2H
4) with a density of 955 kg/m
3 as the fuel. Fuel grains were assembled from multiple short cylindrical fuel blocks, which allowed for a pseudo-one-dimensional evaluation of the fuel mass consumption. As is shown in
Figure 5b,c, the initial fuel port diameter of the first four blocks (blocks ①–④) was 20 mm and that of the last four blocks (blocks ⑤–⑧) was 30 mm. The step-increase in port diameter between blocks ④ and ⑤ was used to force a disturbance in the boundary layer and improve mixing. After assembly, fuel grains were loaded into glass fiber-reinforced plastic (GFRP) insulating tubes and sealed in a steel motor case. An impinging-type injector with 4 × 0.8 mm holes at a convergence angle of 45° was used to promote atomization. The nozzles used in all tests were manufactured using the same grade of isotropic graphite, Tokyo Tokai Carbon Ltd. G347. The density and thermal conductivity at atmospheric conditions are listed by the manufacturer to be
ρn = 1850 kg/m
3 and
k = 116 W/m-K, respectively [
32]. The temperature dependency of these and other properties of G347 graphite is not specified by the manufacturer, and so values were referenced from previous research on similar graphite. An empirical correlation of data for thermal conductivity,
k, based on
Figure 1 in [
33] yields Equation (18):
and an empirical correlation of data for specific heat,
cp, based on
Figure 1 in [
34] yields Equation (19):
where
k is in W/m-K,
cp is in J/kg-K, and
T is in K. The initial nozzle throat diameter,
dt,o, was 4 mm in all tests, and the nozzle exit diameter,
de, was 8 mm in all, but one test. The nozzle exit diameter in a single test was lowered to 6 mm to examine the effect of the nozzle expansion ratio,
ε, on the nozzle throat erosion history and thrust correction factor. Thus, in all tests, with the exception of one,
ε is 4, and in one test,
ε is 2.25. There are three thermocouple measurement ports at the nozzle throat plane. The initial radial distances from the thermocouple measurement points to the throat are 5 mm, 8 mm, and 10 mm, as shown in
Figure 5c.
The three digital cameras labeled “A”, “B”, and “C” in
Figure 5 were used to monitor key components of the test apparatus at all times. These cameras were displayed on a T.V. located in a concrete bunker near the test stand. The T.V., computer, control box, and batteries were operated from a desk within the bunker. A depiction of the test sequence using screenshots from camera “B” (see
Figure 5a) is shown in
Figure 6. In all tests, ignition was achieved by sending an electrical current through a coil of nichrome wire affixed to the lip of the first fuel block using 1 g of an epoxy gunpowder mixture: 0.8 g epoxy and 0.2 g gunpowder. Wire leads were fed through the nozzle exit and attached to a DC voltage source. A test section of wire and nichrome coil was attached in series to the main ignition line to allow for a visual confirmation that the current was large enough to heat the nichrome wire. Nichrome wire was heated for 10 s before actuating the oxidizer supply valve and initiating the firing test. Ignition was first achieved using 2 s of a flow of 1 g/s of gaseous oxygen (O
2) to ensure heating and gasification of fuel. After two seconds of O
2 ignition, the O
2 line was closed, and the main oxidizer (N
2O) line was opened. Firing tests were shut down by closing the N
2O line and opening the N
2 purge line. The chamber was purged with N
2 for a minimum of 30 s, both to extinguish the combustion of fuel and to cool the nozzle to less than 500 K for handling.
As required for the NTRT+ and TTRT, multiple dynamic and static measurements were taken during the experiments conducted in this study. Pressures were measured using KYOWA DCS-10 MPa and KYOWA DCS-5 MPa pressure sensors with rated accuracies of ±40 kPa and ±28 kPa, respectively. Thrust was measured using a KYOWA LMB-A-200N load cell with a rated accuracy of ±3.5 N. These instruments were calibrated by the manufacturer such that the rated accuracies account for uncertainty due to nonlinearity, hysteresis, low-temperature conditions, and external loading. Nozzle temperatures were measured using RC Pro k-type thermocouples rated up to a temperature of 1100 °C, which exhibited a response time of 0.3 s. Dynamic measurements were recorded at 200 Hz using DCS-100A series software, and later filtered using a 20-point moving average. The reason for applying a moving average was to reduce the presence of oscillations in the reconstructed nozzle throat erosion histories. The uncertainty introduced by applying such moving averages is much smaller than the precision limits of the sensors used, and therefore will not be addressed in detail in this paper (refer to [
26]). Initial and final nozzle throat diameter measurements,
dt,o and
dt,f, were taken by the image analysis of digital photographs of the nozzle before and after firing. A length scale was established by placing a plaque of 1 mm-spacing grid paper next to the nozzle being photographed. The nozzle throat diameter was computed based on the area of the lighted region at the throat using ImageJ software [
35].
Uncertainty in the experimental measurements of thrust, pressure etc. propagates through the tiers of the comprehensive data reduction operations. The details of this process can be summarized by Equation (20), which expresses the overall uncertainty,
Uy, in some operational output,
y, as a function of the inputs,
xi:
Here, the
Uxi terms on the right-hand side represent the uncertainties in the
xi measurements. The partial derivative terms in Equation (20) represent the sensitivity of the reconstructed solution to each input. Since the algorithms in most of the data reduction operations are coupled non-linear problems, the partial derivative terms in Equation (20) are approximated as (21):
Here, the numerator is the change in value of solution
y given that the input parameter,
xi, has been perturbed by the amount of 1% of the nominal value.


