Article

Probabilistic Safety Assessment for UAS Separation Assurance and Collision Avoidance Systems

1
Department of Mechanical Engineering, University of North Dakota, Grand Forks, ND 58202, USA
2
School of Engineering, Aerospace Engineering and Aviation, RMIT University, Bundoora, VIC 3083, Australia
*
Author to whom correspondence should be addressed.
Aerospace 2019, 6(2), 19; https://doi.org/10.3390/aerospace6020019
Submission received: 6 September 2018 / Revised: 17 January 2019 / Accepted: 17 January 2019 / Published: 14 February 2019
(This article belongs to the Special Issue Civil and Military Airworthiness: Recent Developments and Challenges)

Abstract

:
The airworthiness certification of aerospace cyber-physical systems traditionally relies on the probabilistic safety assessment as a standard engineering methodology to quantify the potential risks associated with faults in system components. This paper presents and discusses the probabilistic safety assessment of detect and avoid (DAA) systems relying on multiple cooperative and non-cooperative tracking technologies to identify the risk of collision of unmanned aircraft systems (UAS) with other flight vehicles. In particular, fault tree analysis (FTA) is utilized to measure the overall system unavailability for each basic component failure. Considering the inter-dependencies of navigation and surveillance systems, the common cause failure (CCF)-beta model is applied to calculate the system risk associated with common failures. Additionally, an importance analysis is conducted to quantify the safety measures and identify the most significant component failures. Results indicate that the failure in traffic detection by cooperative surveillance systems contribute more to the overall DAA system functionality and that the probability of failure for ownship locatability in cooperative surveillance is greater than its traffic detection function. Although all the sensors individually yield 99.9% operational availability, the implementation of adequate multi-sensor DAA system relying on both cooperative and non-cooperative technologies is shown to be necessary to achieve the desired levels of safety in all possible encounters. These results strongly support the adoption of a unified analytical framework for cooperative/non-cooperative UAS DAA and elicits an evolution of the current certification framework to properly account for artificial intelligence and machine-learning based systems.

1. Introduction

While a steady growth of manned aviation has driven the advancement of communication, navigation and sensing (CNS) technologies to support a denser airspace exploitation, various technological and regulatory challenges have affected the development of autonomous separation assurance and collision avoidance (SA&CA) capabilities for unmanned aircraft systems (UAS). Surveillance systems such as transponders, traffic collision avoidance system (TCAS), and automatic dependent surveillance-broadcast (ADS-B) are conceived to support the in-flight SA&CA while also incorporating, to the extent possible, the pilot’s situational assessment, training, experience, and aircraft capabilities. The detect and avoid (DAA) function in a non-segregated UAS operational context, however, demands transitions from the pilot’s decision-making to a fully autonomous decision-making, which is one of the largest challenges faced by the UAS sector today. An accurate performance modelling of current airborne surveillance technologies for maintaining SA&CA without the pilot onboard is critical to evaluate and certify the criteria of equivalent level of safety in the UAS platform. The International Civil Aviation Organization (ICAO) outlined successive steps towards the integration of UAS in controlled airspace as well as into the aerodrome areas, which are identified in the Aviation System Block Upgrades (ASBU) [1]. The United States (US) Federal Aviation Administration (FAA) also provisioned to integrate UAS into the National Airspace System (NAS) in two different phases [2,3,4]. Phase 1 incorporates rural, Class Golf (G) airspace and is compatible with agricultural, mapping and survey applications, whereas phase 2 comprises controlled airspace that requires technologies to maintain safe separation from cooperative and non-cooperative air traffic [5]. The European Commission’s Directorate General for Mobility and Transport (DG MOVE), the European Defence Agency (EDA), the European Aviation Safety Agency (EASA), and the Single European Sky Air Traffic Management (ATM) Research (SESAR) Joint Undertaking (SJU) are also stepping up the efforts to safely accommodate UAS into the European aviation and ATM system [6]. In parallel with these government and industry-led initiatives, the aerospace research community has been continuously working on several challenges of integrating UAS into non-segregated airspaces including separation thresholds and methods for small UAS [7,8], UAS encounter modelling and collision avoidance [9,10,11], 3D obstacle avoidance strategies for UAS [12,13,14,15] dynamic model augmentation [16], Global Navigation Satellite Systems (GNSS) integrity augmentation for UAS [17], surveillance sensor integration in the UAS platform [18,19] and well-clear boundary models for UAS DAA [20,21,22,23,24].

1.1. Detect and Avoid (DAA) Safety Assessment

Although adequate performance standards were established for various surveillance equipment, to date the impacts of surveillance system failures in terms of separation degradation, specifically in the UAS platform, have not been defined. Moreover, traditional radar and Mode-A/C transponder technologies show inherent deficiencies in different airspace and equipage scenarios especially in the presence of high air traffic densities [25,26,27,28,29,30,31,32,33]. The failure modes for different cooperative sensors such as Mode S, TCAS, ADS-B are well defined and safety assessments have been carried out on the individual surveillance sensor considering functions in the manned aircraft. While the availability of ATM deconfliction service provides mitigation to these faults when available, the risk is still notably higher when considering highly autonomous UAS operations. The FAA conducted a safety assessment on the TCAS application in the unmanned platforms [34,35,36]. A thorough probabilistic safety assessment has been carried out on ADS-B system considering both the ground and airborne segment in [37]. Safety assessment of the surveillance sensor failure in the UAS platform was carried out in [38] with an encounter analysis considering the unmanned aircraft platform only. A simplified model is developed in [39] to assess and predict the risk associated with a given UAS operation. In [40], the authors provided a framework that consists of a target level of safety (TLS) approach using an event tree format to develop specific SAA effectiveness standards based on UAS weight and airspace class combinations. The provision of certified autonomous DAA capabilities is an indispensable milestone for the certification of UAS for safe non-segregated and beyond line of sight (BLOS) operations. This is a widely recognized issue in the aerospace research community but to date, despite the extensive efforts, the various proposed DAA approaches have not satisfactorily addressed the overall safety risks. In this paper, a comprehensive safety assessment is conducted considering the sensitivities, failures and degraded operations of systems and components of the overall DAA architecture. Both qualitative and quantitative analysis are performed to identify and derive the risks of different component failure in both airborne and ground control platform using probabilistic safety assessment.
Probabilistic safety assessment is a technique to quantify risk measures numerically by identifying the specific events that lead to hazards [41]. Fault tree analysis (FTA) relates the logical relationship between component failures which are the basic failures and their contributions to the system failures and the importance analysis provides the importance ranks of the components to the overall risk. Therefore, the combination of these two techniques provides an overall approach to determine the impacts of individual sensor failure as well as the significance of individual risk contributors. In particular, a case study for ADS-B as a candidate technology to support DAA is addressed in this paper. The safety analysis indicates the validity of ADS-B for cooperative approach providing a pathway for certification of the unified framework. Section 2 describes the unified analytical framework and overall DAA architecture and Section 3 outlines the assessment methodology. The risk measure and importance analysis are presented in Section 4. A case study of ADS-B as a cooperative surveillance means in specified UAS flight envelope is illustrated in Section 5 and Section 6 contains the discussion of overall findings.

2. Unified Analytical Framework and DAA Architecture

In recent research [42,43], a unified analytical framework has been proposed, and a novel methodology is demonstrated to integrate the data provided by cooperative systems (reliance on own and intruder aircraft avionics) and non-cooperative sensors (reliance on own aircraft avionics only). 
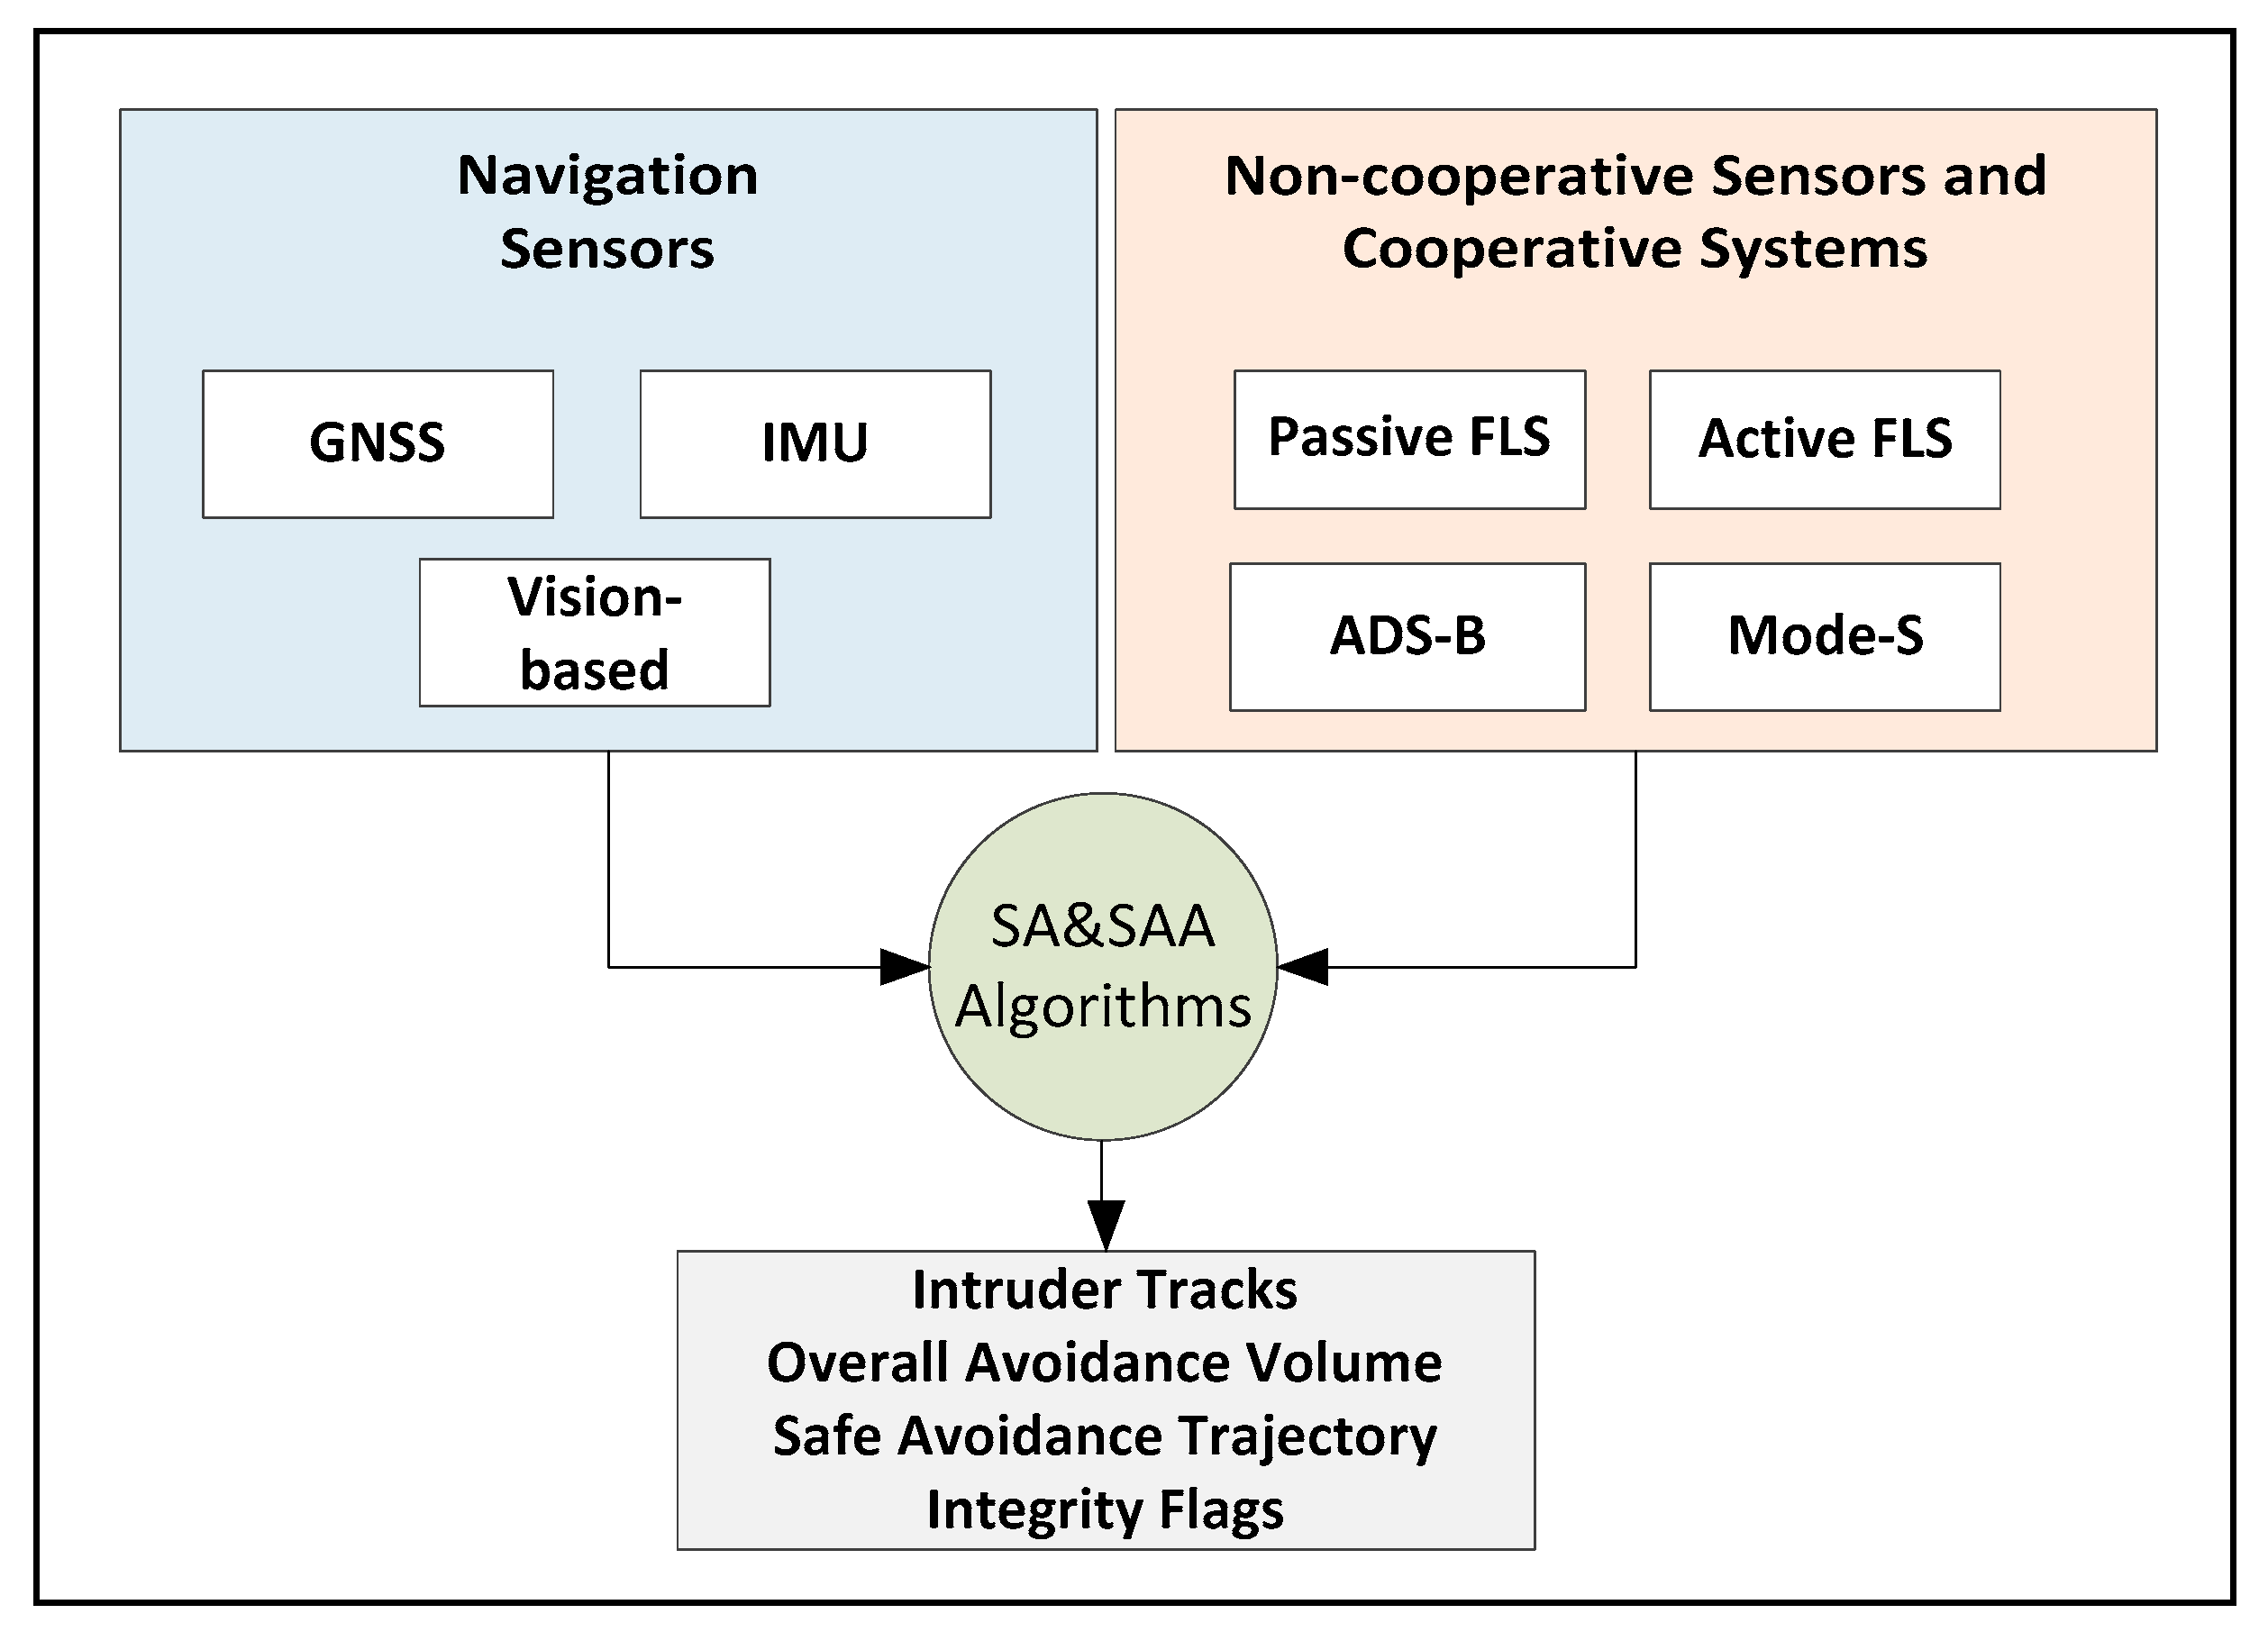
Figure 1 illustrates the conceptual top-level architecture of the proposed DAA system, which uses active and passive forward-looking sensors (FLS) in addition to ADS-B and Mode-S transponders. Navigation data is extracted from GNSS, inertial measurement units (IMU) and vision-based sensors.
State-of-the-art active and passive FLS include visual/infrared cameras, RADAR and LIDAR. Mode S transponders are cooperative surveillance employ ground components and an airborne transponder. Mode S has been designed as an evolutionary addition to the Air Traffic Control Radar Beacon System (ATCRBS) [44] for the provision of enhanced surveillance and communication capability which is required for the automation of air traffic control. TCAS was developed as a back-up airborne collision avoidance system (ACAS) which provides vertical maneuvering guidance to the pilot in the event of a possible collision threat [45]. ADS-B is a system that periodically transmits its state vector including horizontal and vertical position, and velocity as well as some other intent information [
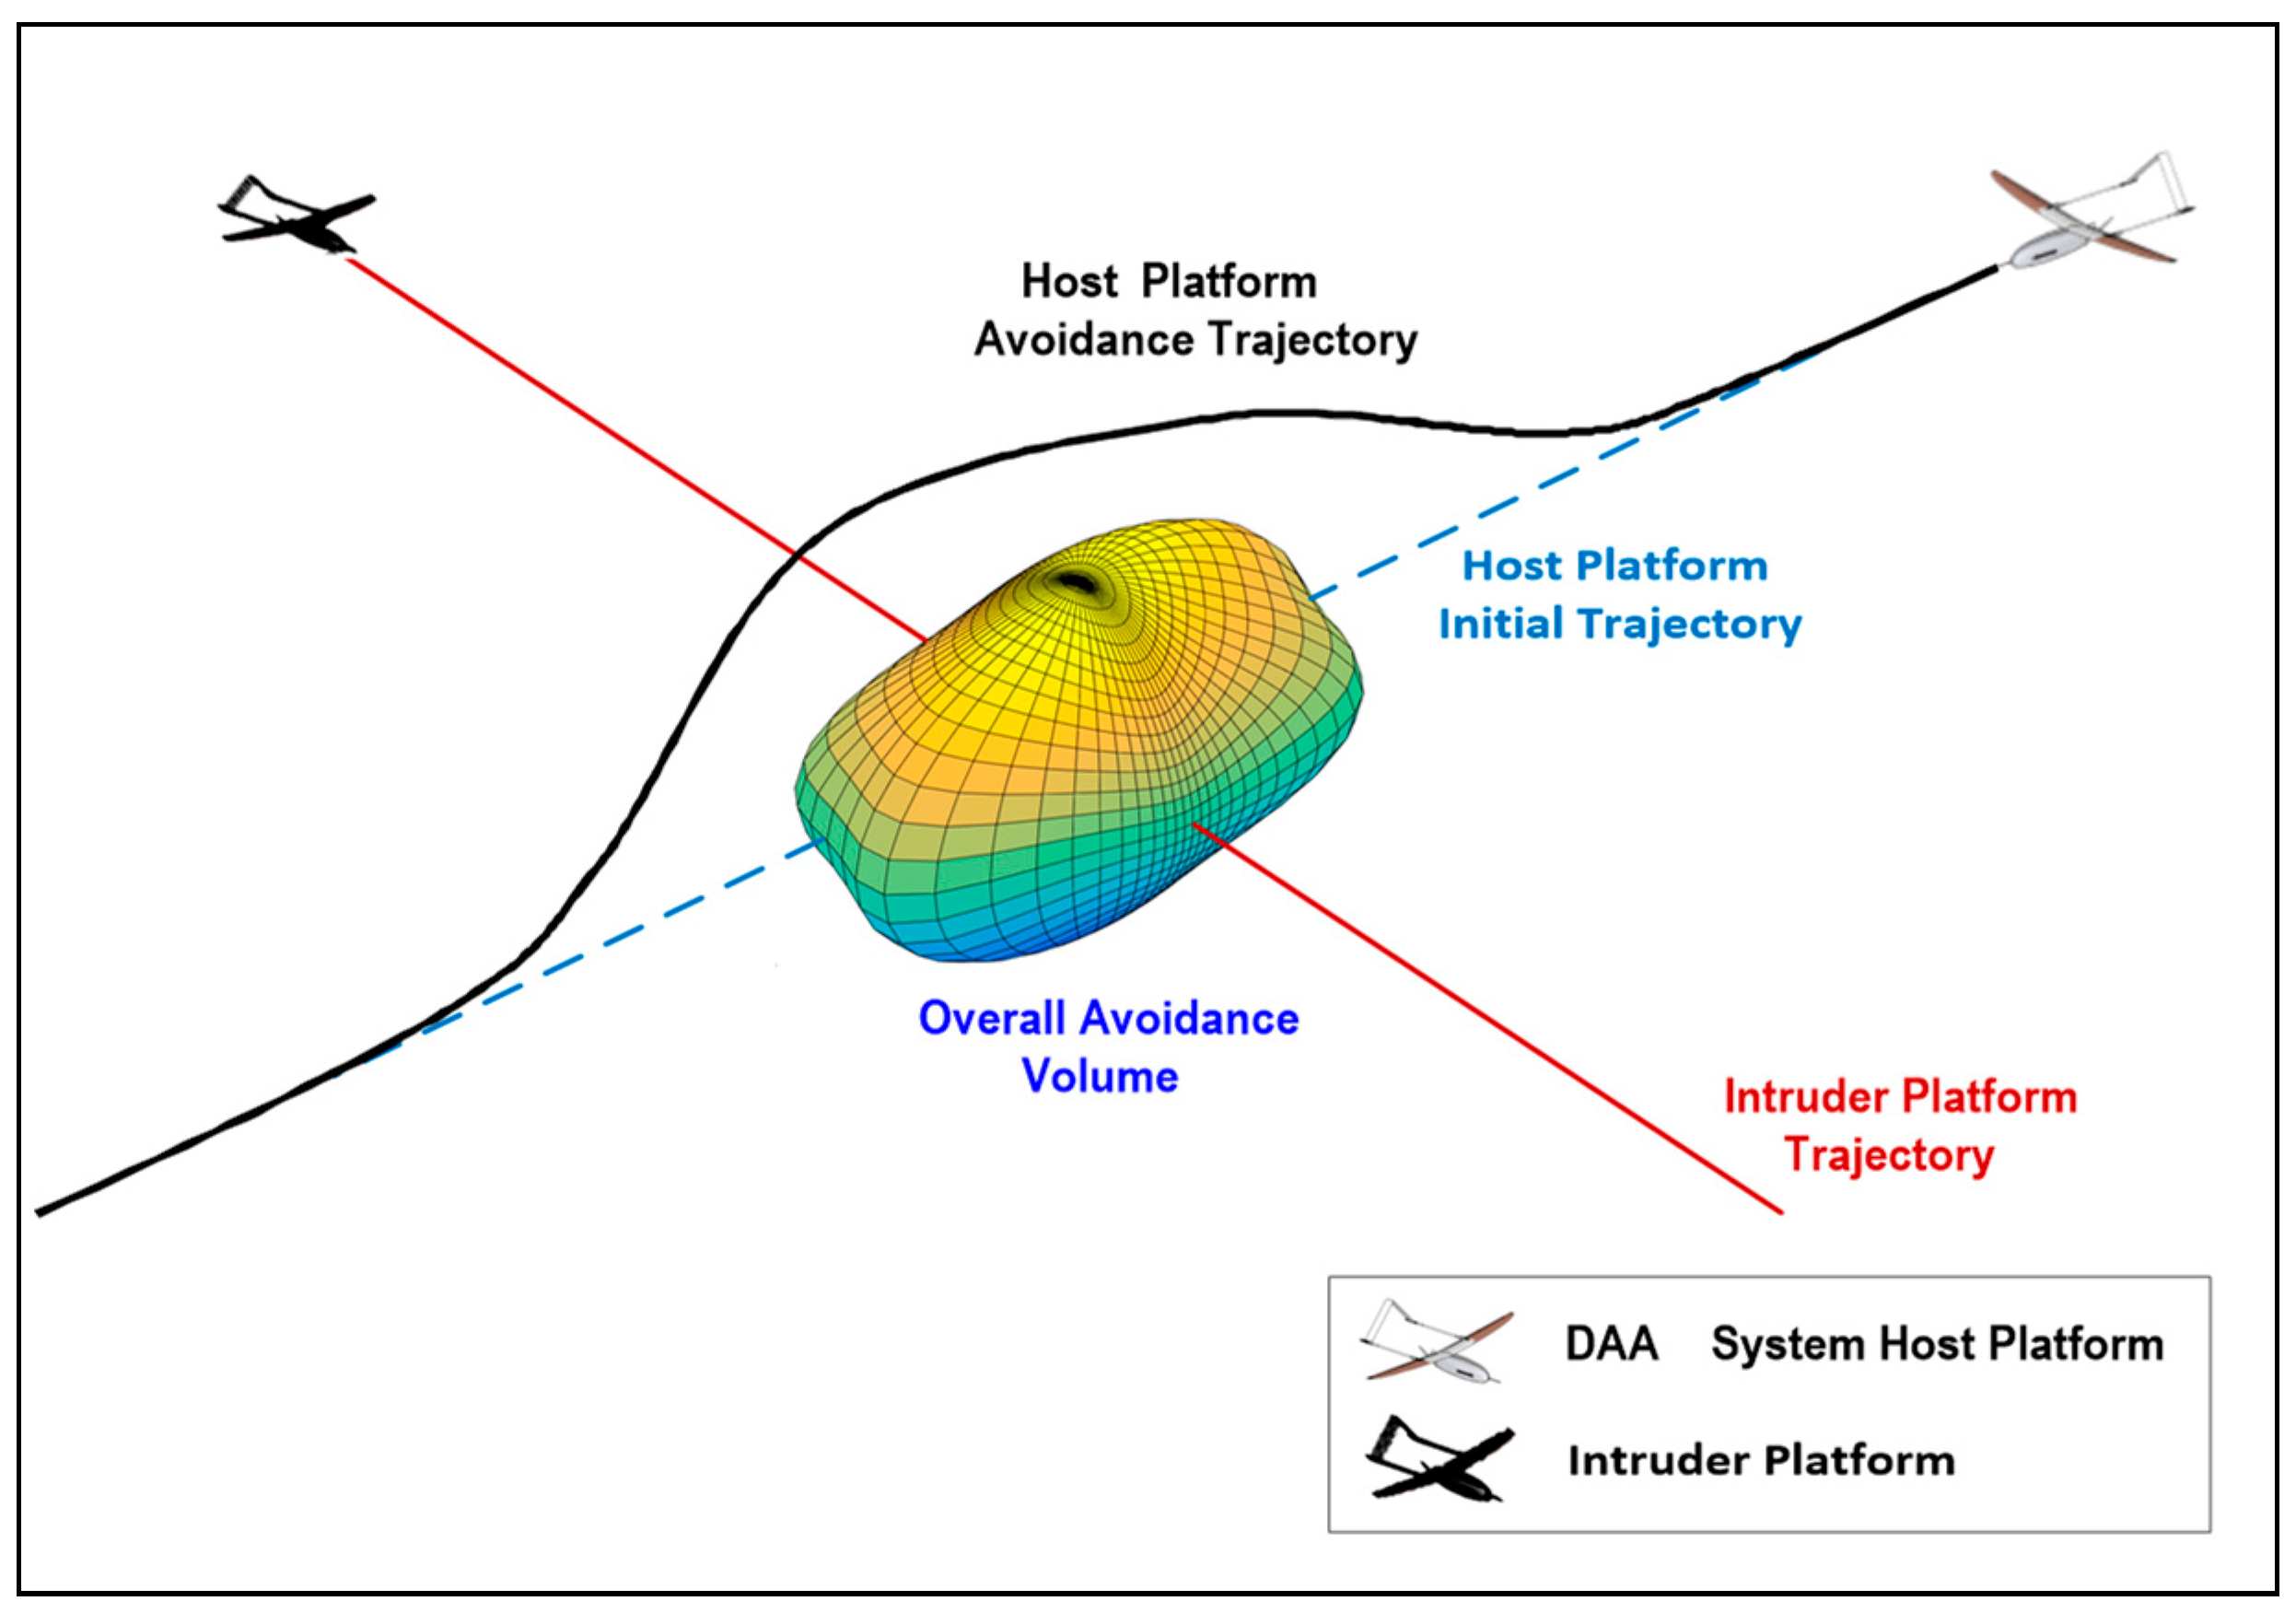
46]. The system comprises two separate components, ADS-B Out and ADS-B In. ADS-B is called dependent surveillance as it requires that the aircraft state vector and additional information be derived from the on-board navigation equipment. It is automated in the sense that it doesn’t need pilot or controller input to transmit information. Cooperative/non-cooperative tracking data and host platform navigation data are processed using a dedicated algorithm within the central DAA processor onboard the UAS to produce avoidance volumes in the airspace surrounding each conflicting intruder/obstacle track. This algorithm ensures the rigorous mathematical treatment of the errors affecting the state measurements (correlated and uncorrelated measurements) and accounts for the host–obstacle relative dynamics, with due consideration for the environmental conditions (wind, turbulence, etc.) affecting the aircraft dynamics. A conceptual representation of this approach for the case of a single aerial encounter is depicted in Figure 2.
In particular, the figure shows both the overall avoidance volume and the optimal avoidance trajectory, which is computed by a real-time trajectory optimization algorithm. If the original trajectory of the DAA system host platform intersects the calculated avoidance volume, a risk of collision (RoC) flag is generated [47,48]. This RoC flag initiates the real-time trajectory optimization process and the associated steering commands are provided to the aircraft flight controls.

DAA Reference Architecture

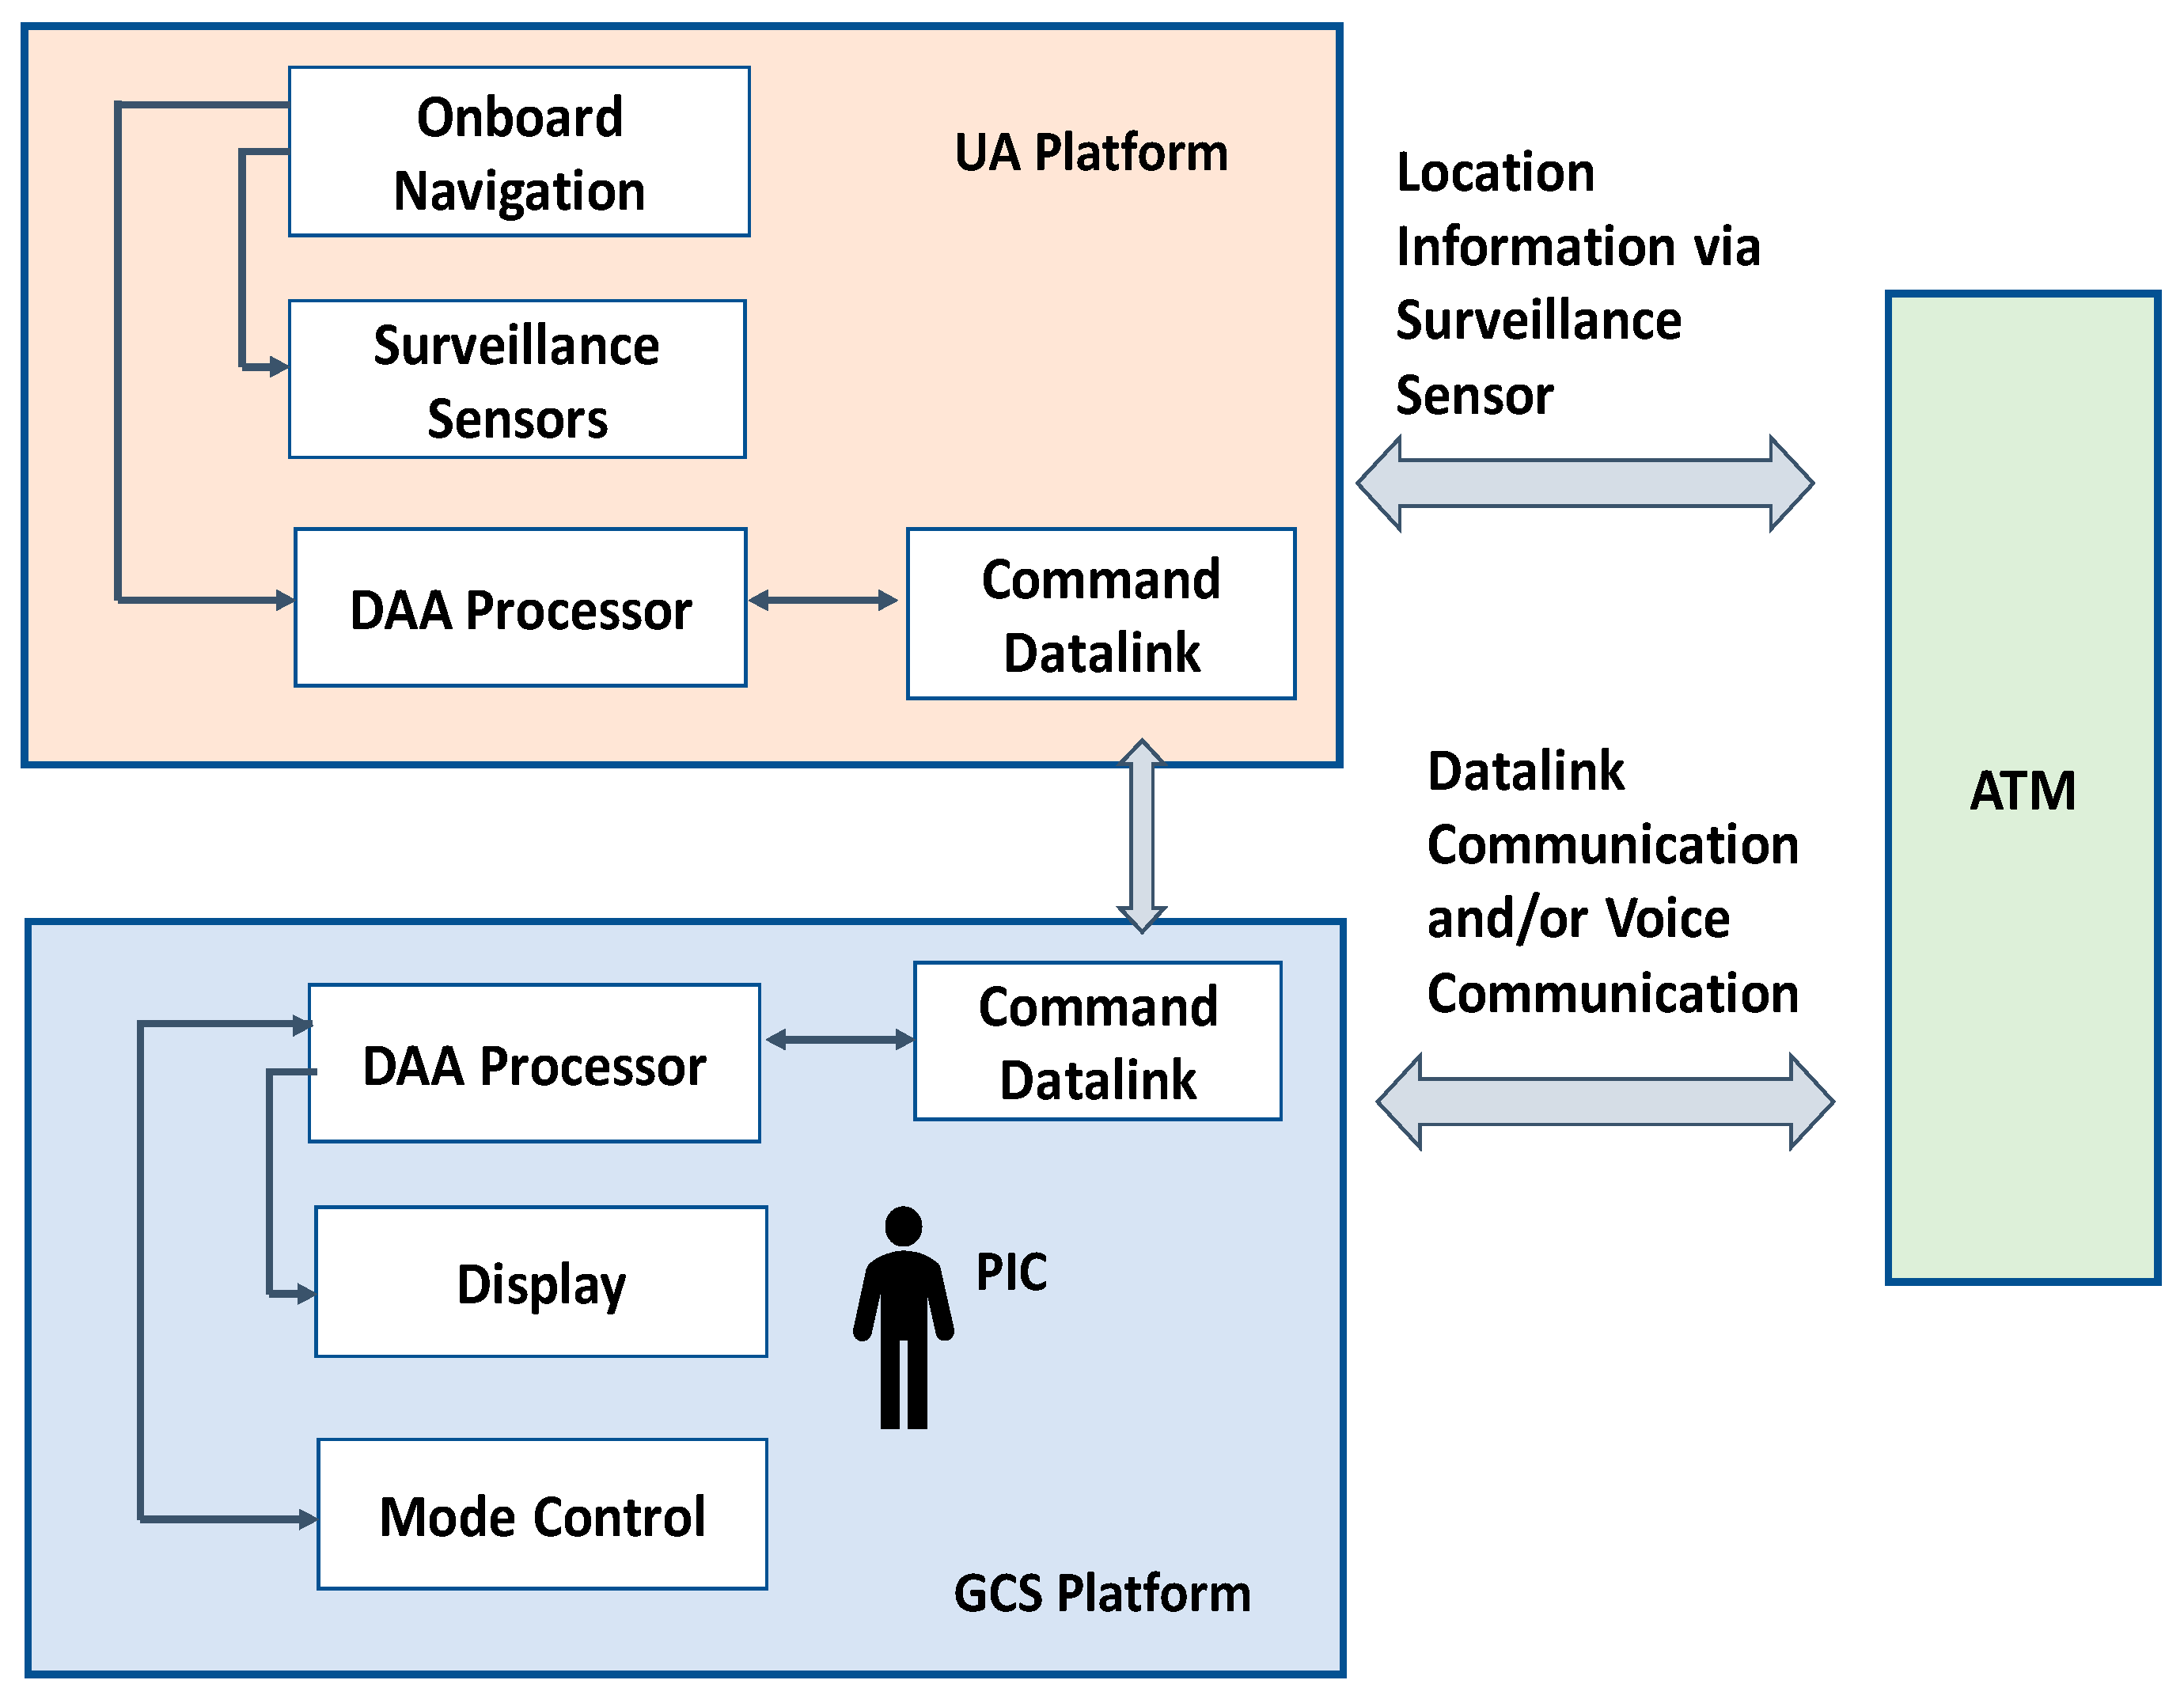
The components of the UAS DAA system are partly located onboard the unmanned aircraft (UA) platform and partly in its ground control station (GCS). In particular, all non-cooperative sensors and cooperative surveillance systems as well as autonomous collision avoidance functions are installed onboard, whereas all the human–machine interfaces (HMI) are integrated in the GCS. Both the UA and the GCS are equipped with Command and Control (C2) data link transceivers to transmit the data from the UA platform to GCS and commands from GCS to UA platform. The UAS pilot-in-command (PIC) manning the GCS is responsible for the safe operation of the UAS and for executing ATM directives unless they pose a hazard to the UAS. Figure 3 provides a simplified schematic diagram of the overall DAA system architecture.
The UA platform includes four major elements namely the surveillance components, DAA processor, onboard navigation system, and the C2 datalink. The state-of-the-art of cooperative surveillance sensors include Active Mode S surveillance, TCAS II, and ADS-B. The non-cooperative surveillance sensors comprise Radar, Light Detection and Ranging (LIDAR), cameras such as thermal camera, infrared cameras etc. Air-to-air radar systems operate in the C, X, or Ku-frequency bands of the aeronautical radio navigation spectrum (ARNS) [49]. Usage of a frequency will be depending on the type of operation. LIDAR is another prominent surveillance sensor which shows great promise for non-cooperative UAS collision avoidance [50]. LIDAR is a remote sensing technology that scans the environment and the 3D image of the environment is constructed from the individual distance points within an aggregate of points gathered during the scanning process. Some different laser scanning techniques are available to steer the beam and achieve very wide fields of vision (FoV). Although current LIDAR systems are still of considerable size, weight, power and cost (SWaP-C), considerable progresses are being made thanks to their extensive usage in the autonomous driving domain. The availability of advanced cameras and development of vision-algorithms made them popular for use in the unmanned platform especially in low altitude operation. These non-cooperative sensors complement other on-board airborne surveillance sensors by providing detection of non-cooperative traffic.
The equipage of surveillance sensors depends on the type of unmanned aircraft system, the airspace and the certification. According to DO-365 [49] which was developed by Special Committee-228 [51], UA surveillance equipment will minimally include:
  • active Mode S surveillance that use 1030/1090 MHz frequencies;
  • ADS-B In to detect the broadcast directly from the intruder aircraft ADS-B Out or through ADS-R or TIS-B channel;
  • air-to-air radar system to detect the non-cooperative traffic.
This equipage is referred to as Class 1 DAA system. The Class 2 DAA system will include TCAS II along with class 1 DAA system. As for the manned aircraft TCAS serves to improve the pilot’s awareness of other air traffic, in UAS it would be serving the PIC [35] and no maneuvers will be initiated automatically only on this guidance.
The UA onboard processor receives onboard navigation sensor data, data from onboard active surveillance airborne to detect transponder equipped intruders, ADS-B receiving equipment to detect ADS-B equipped intruders, and radar data to detect non-cooperative intruders. The intruder data received by multiple sensors are then processed by the UA processor. From the intruder state and intent data, the UA processor initially evaluates the intended track of the intruder. The initial track and other information are then sent to the command and non-payload communications datalink for transmission to the GCS. The ATM can locate the UAS via ADS-B out messages and Active Mode S transponder. At all times, PIC can maintain communication with ATM via datalink or voice communication. In the GCS, the processor receives prioritized track data and DAA status data from the UA platform and DAA mode control commands from the GCS control. It then processes the data and forwards the information to the DAA display. The mode control is the interface between the PIC, the UA, and GCS DAA processors. The command functions are executed through this interface and then sent to the GCS processors and then via data link to UA platform. The command is then executed by the UA platform. In order to obtain the certification, surveillance sensors need to provide equivalent level of safety as of manned aircraft. This include providing surveillance support suitable for the entire operational flight envelope. The UA operational flight envelope may include five phases; namely takeoff, climb, cruise, descent and landing where the takeoff and landing phase will require low altitude flying and ground roll. The takeoff and landing may take place on airport and a separate launch/recovery zone. Due to the different traffic mix at each altitude, different flight dynamics characteristics and different conflict geometries characterizing each phase, the safety-criticality of DAA sensors and systems will likely change as a function of the flight phase. The unified analytical framework and the associated DAA system safety analysis allows to either define the safely flyable envelope as a function of the available sensors and their reliability or to identify the sensors and their required reliability as a function of the desired safe envelope.

3. Safety Assessment Methodology

As already mentioned in Section 1.1, the qualitative analysis involved in the FTA methodology lists all the possible combinations of factors, normal events and component failures resulting in a top event, whereas the quantitative evaluation allows to determine the probability of failure of the top event from the failure probability values of basic events that propagated up through the fault tree. The reliability data or the failure rate of the components is crucial for FTA and is obtained from component manufacturers (typically in the form of mean time between failures—MTBF) and/or from the literature, including among others Aviation Standard Documents by RTCA, FAA and Eurocontrol [37,49,52,53,54,55,56]. The basic events represent component failures and the logic gates dictate how faults of the particular component within the system can combine to result in the failure in the top event.
In this study, FaultTree++ from isograph [57] is utilized to carry out the safety assessment and calculate the top-level event probabilities. Before constructing the fault tree, based on the system overview provided in Section 2, intermediate events leading to failure in onboard DAA capability are identified. We note that the navigation and guidance functionality failures have not been presented in detail as this would be beyond the scope of the article, except for the subsystems on which DAA components directly depend such as onboard Global Positioning System (GPS) and barometric altimeter. The symbols that are used to create the fault tree are illustrated in Table 1.
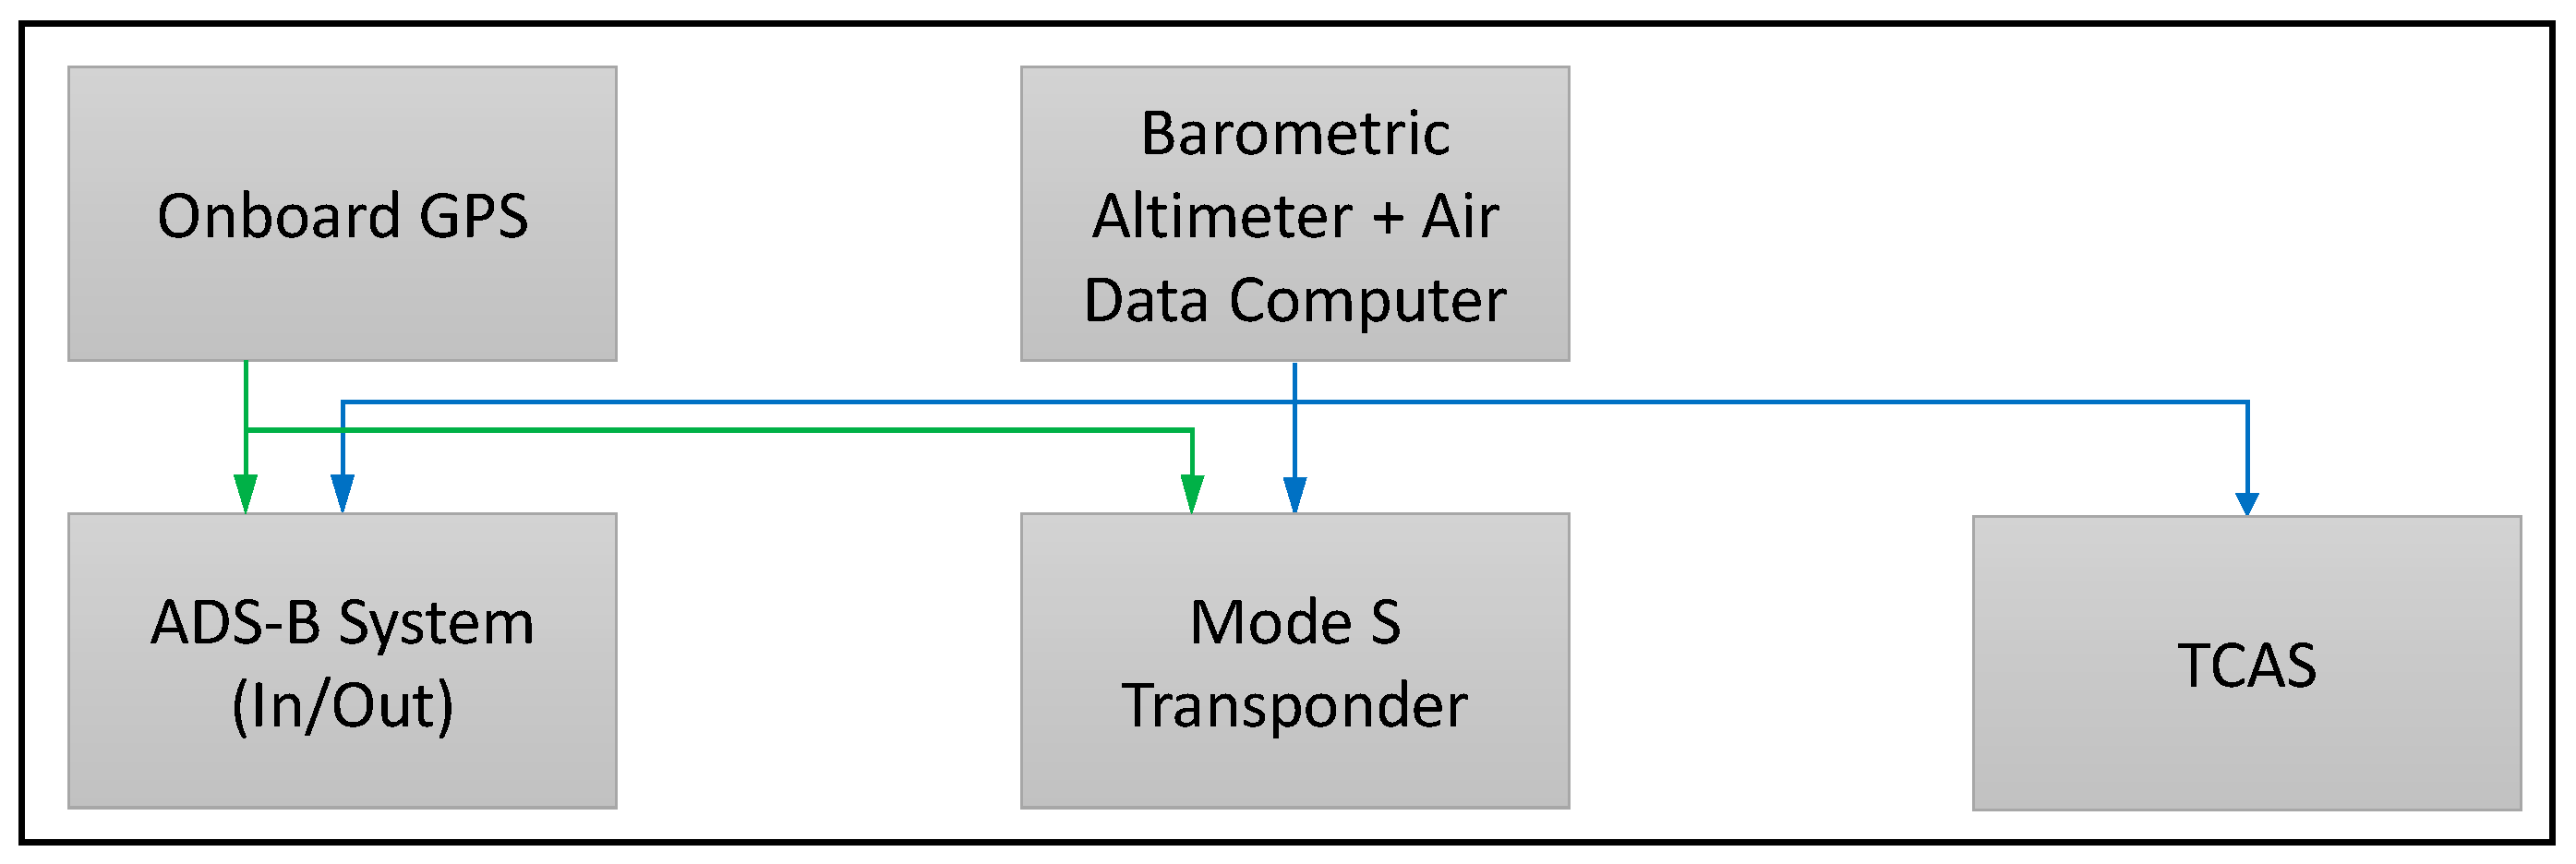
In order to identify the basic events that lead to the failure of the onboard surveillance sensors, complete knowledge of the complex architecture of each of the sensors along with the understanding of integrated navigation and communication system components is required. This is because some onboard state data are fed into multiple surveillance sensors and some of them share same transponder datalink. For example, barometric altimeter data is used by both Active Mode S and the ADS-B Out system. Hence, error in the barometric altimeter will affect both systems. Figure 4 illustrates the dependency between onboard navigation and surveillance systems in a high-level architecture.
To properly capture failures that affect multiple systems, the common cause failure (CCF) analysis is utilized. The CCF is a failure event that affects multiple components or functions [58]. In CCF analysis, there are two relevant factors: the root cause, which is a single failure event, and the coupling factor. The coupling factor describes the dependency of multiple systems on a common data source. While calculating the overall risk for surveillance system failure, it is crucial to take care of the CCF because, as shown in the architecture in Figure 4, some of the basic events affect a multiple surveillance system at the same time. The most commonly-used method to account for CCF is the beta factor method [59,60]. To calculate the failure rate due to common causes, the beta factor is simply multiplied by the component failure rate. In essence, the beta factor simply represents the percentage of component failures that are due to common causes. A beta factor of 0.05 is chosen for this analysis based on the literature and the International Electrotechnical Commission (IEC) method checklist.
In this work, the contribution of individual failure events to their related system failure are determined based on the specific functional dependencies. For example, while in the event of ADS-B out failure, the ownship is not locatable by other platforms through ADS-B, it still can detect intruder traffic with a working ADS-B In. Hence, the detection capability will not be compromised due to the failure of ADS-B out system and can still avoid intruders. Therefore, only the failure in traffic detection capability is considered in the DAA functionality. The ownship surveillance function failure, referred to as a failure in ownship locatability function, is deduced in a different tree. Figure 5, Figure 6 and Figure 7 illustrate the DAA capability failure considering the function of traffic detection and avoid capability and Figure 8, Figure 9, Figure 10, Figure 11 and Figure 12 demonstrate the failure in ownship locatability function.
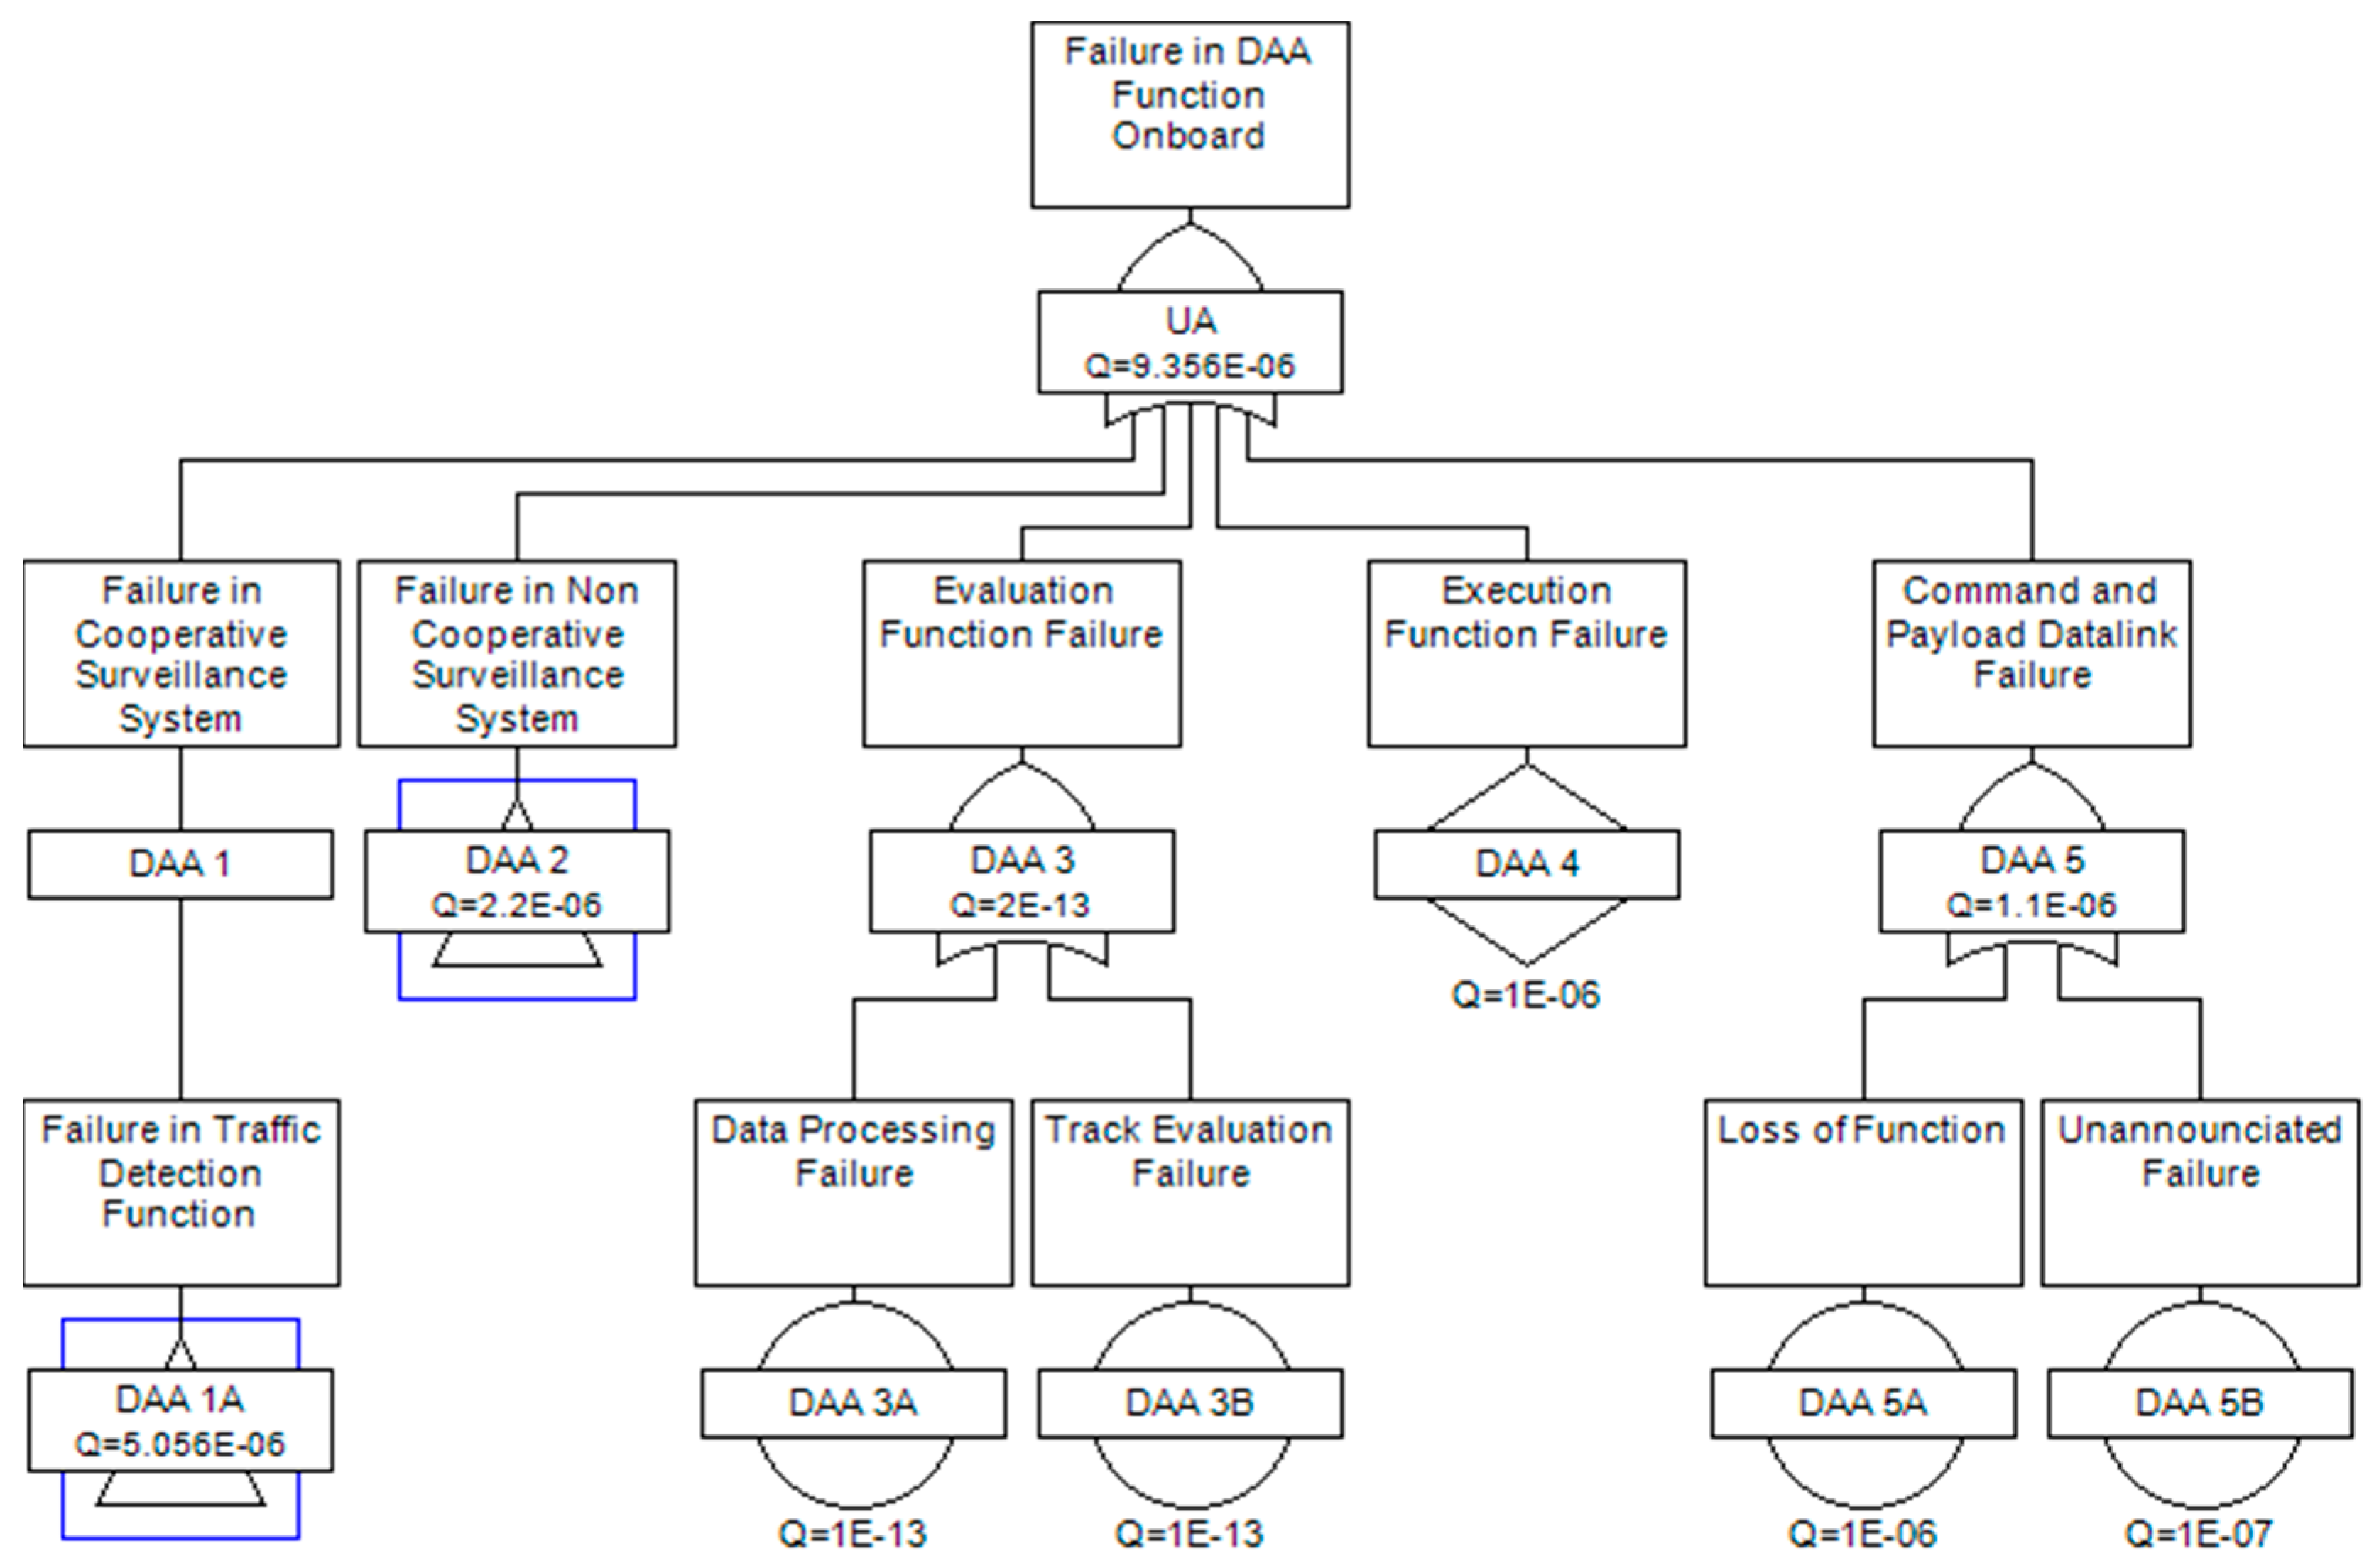
As depicted in Figure 5, the failure in DAA capability onboard can be the result of five alternative events. Three of them are intermediate events: DAA 1A-failure in traffic detection function by cooperative sensors, DAA 2-failure on non-cooperative sensors and DAA 3-evaluation function failure. DAA 1A and DAA 2 are transferred to separate trees and illustrated in Figure 6 and Figure 7. The evaluation function failure traces the data processing function failure which indicates the failure in multi-sensor data fusion and the track evaluation failure indicates the failure probability of intruder track evaluation. The execute function failure is the failure probability to execute appropriate maneuvers as commanded. DAA 5 is the failure of the data link that is used to transfer data and receive command from the ground control station.
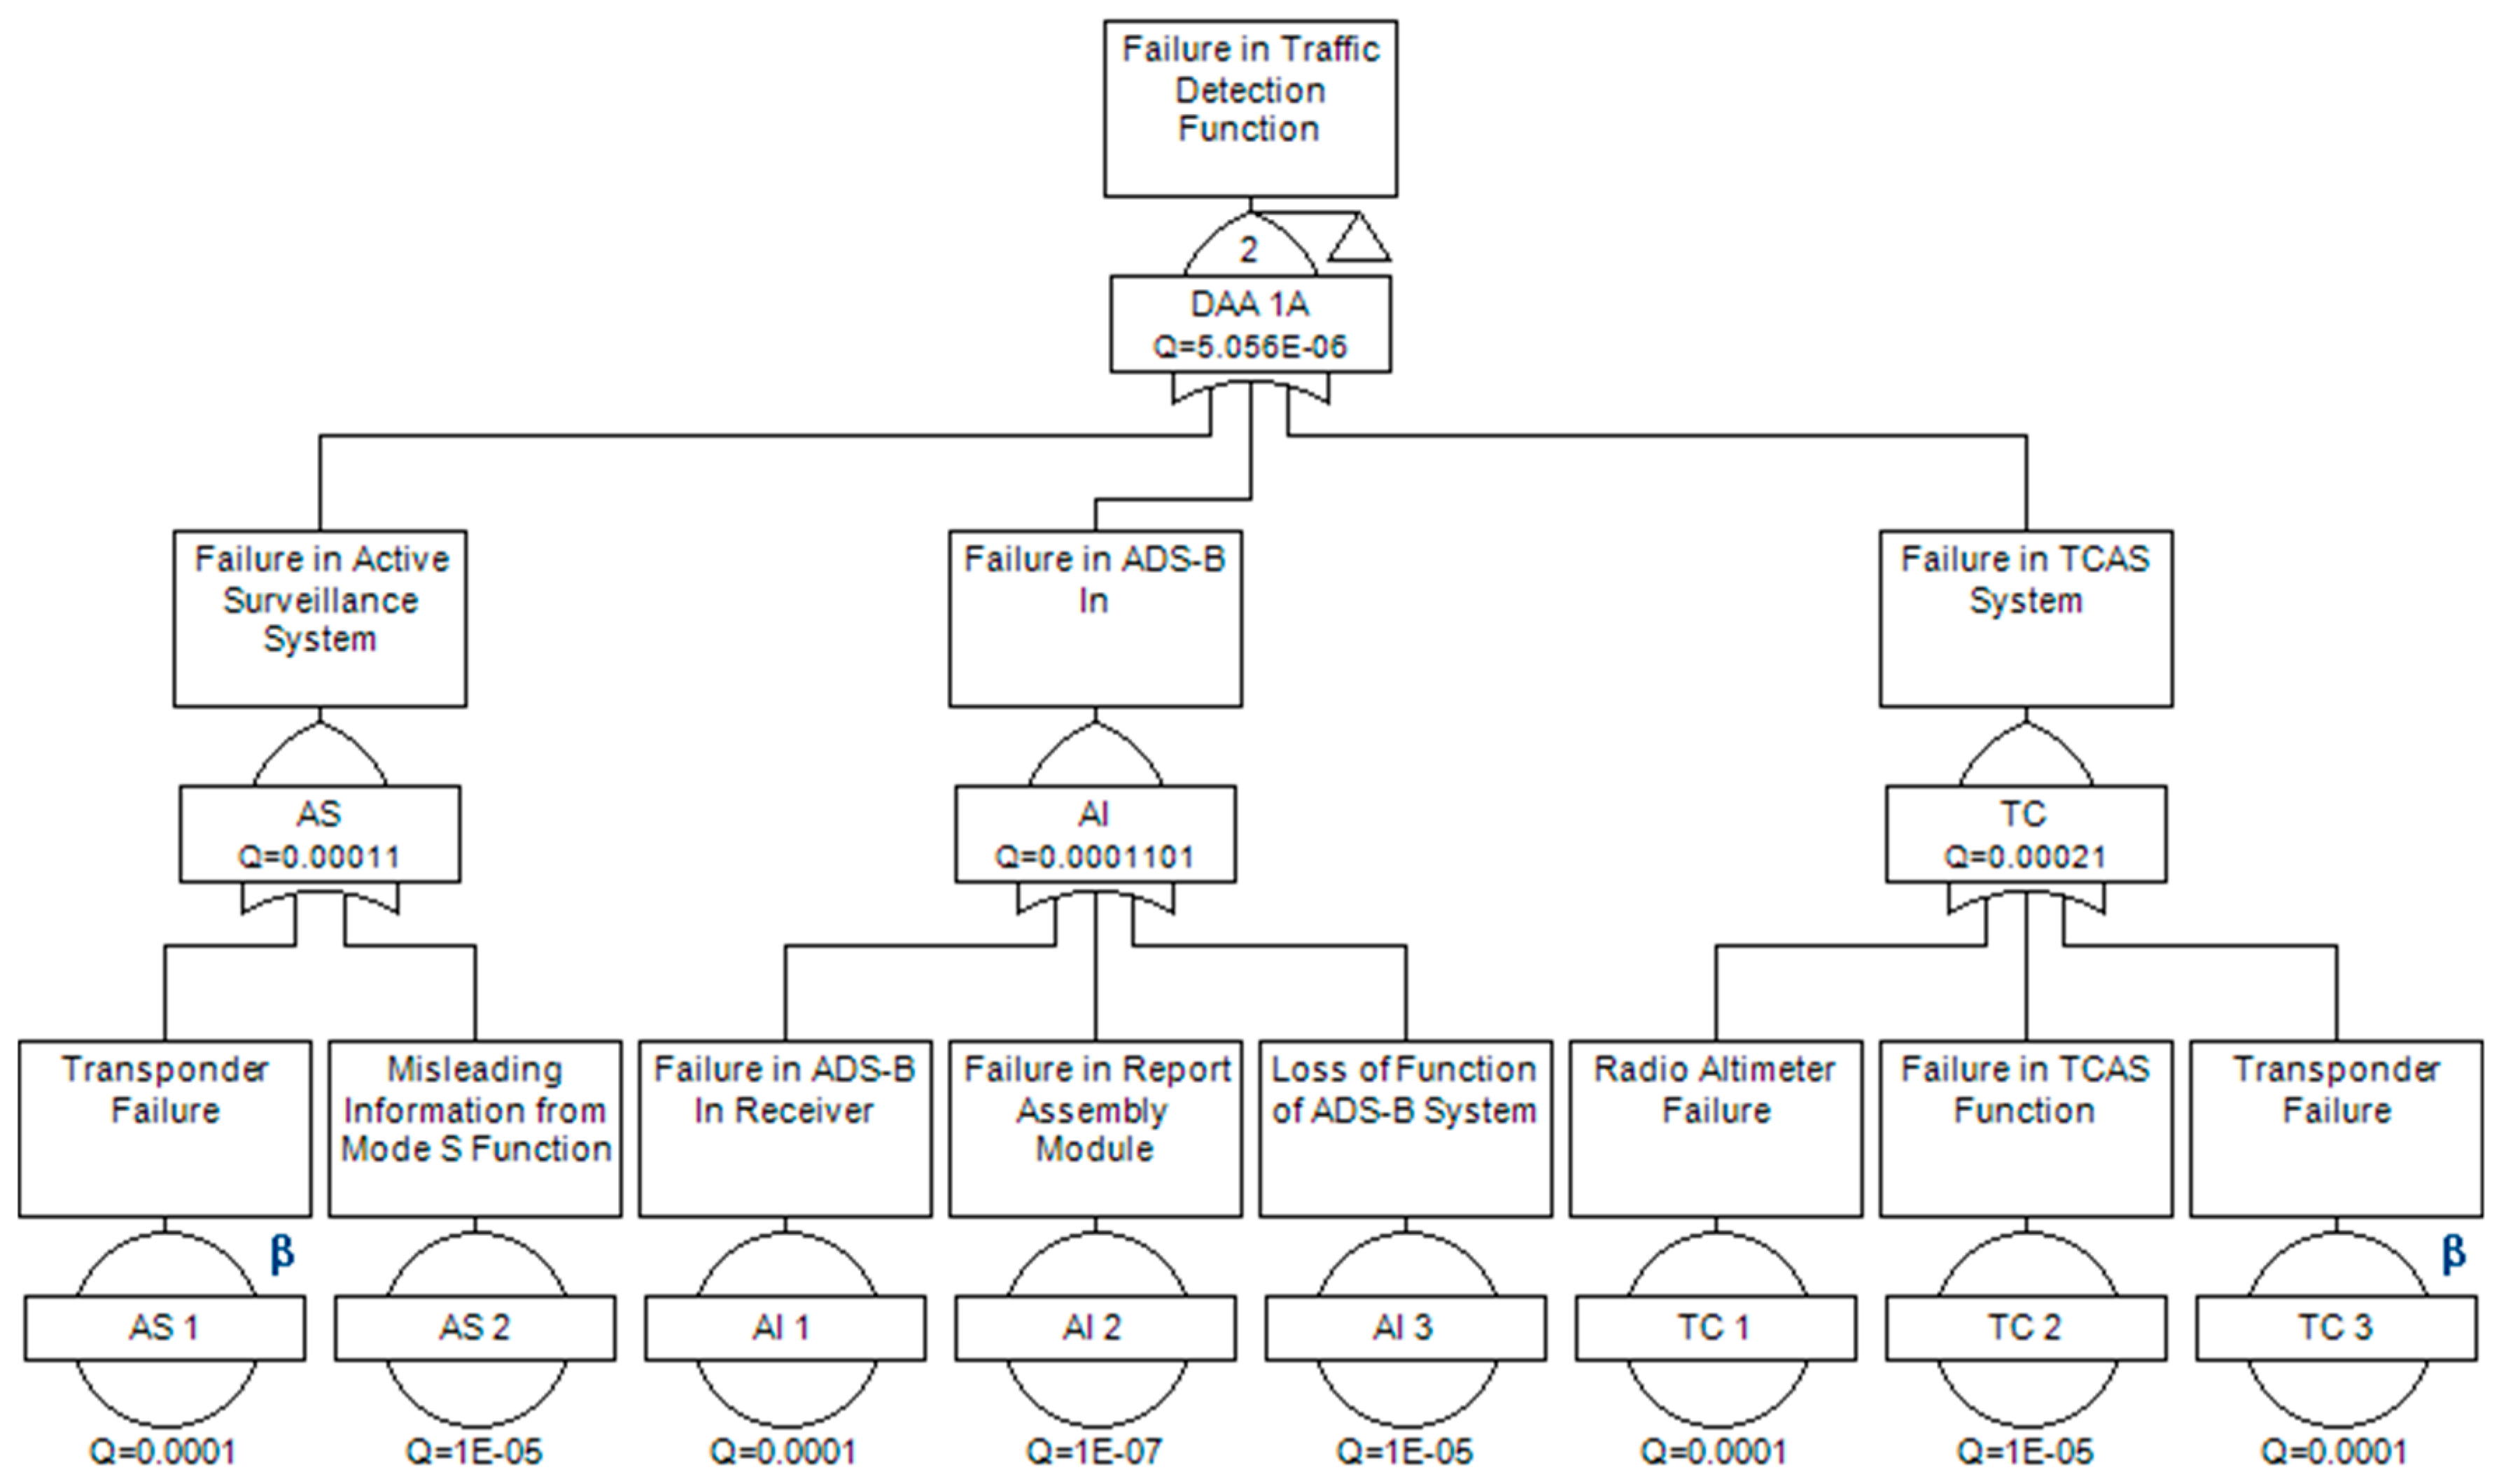
Figure 6 outline the intermediate events DAA 1A. As stated earlier, this subtree specifies the failure probability of traffic detection function by cooperative surveillance. In this work, a voting OR gate is utilized to calculate the failure probability of DAA 1. VOTING OR indicates that the event will occur of k out of n events occur. In the fault tree presented in Figure 6, the DAA occurs if two out of three surveillance sensors failed to detect a traffic. VOTING OR gate is considered to account the current equipage scenario for unmanned as well as manned aircraft system. Using a universal AND gate would give a lower failure rate whereas using a universal OR gate would provide a higher failure rate than in an actual encounter scenario. For example, if onboard active surveillance system and TCAS system fails and the intruder which can be manned or unmanned, is not equipped with ADS-B, in spite of having a working ADS-B In ownship will fail to detect the intruder. Also, it is considered that without any catastrophic power failure onboard or without any external attack three systems will not be down at the same time. Thus, VOTING OR encompasses all the scenarios.
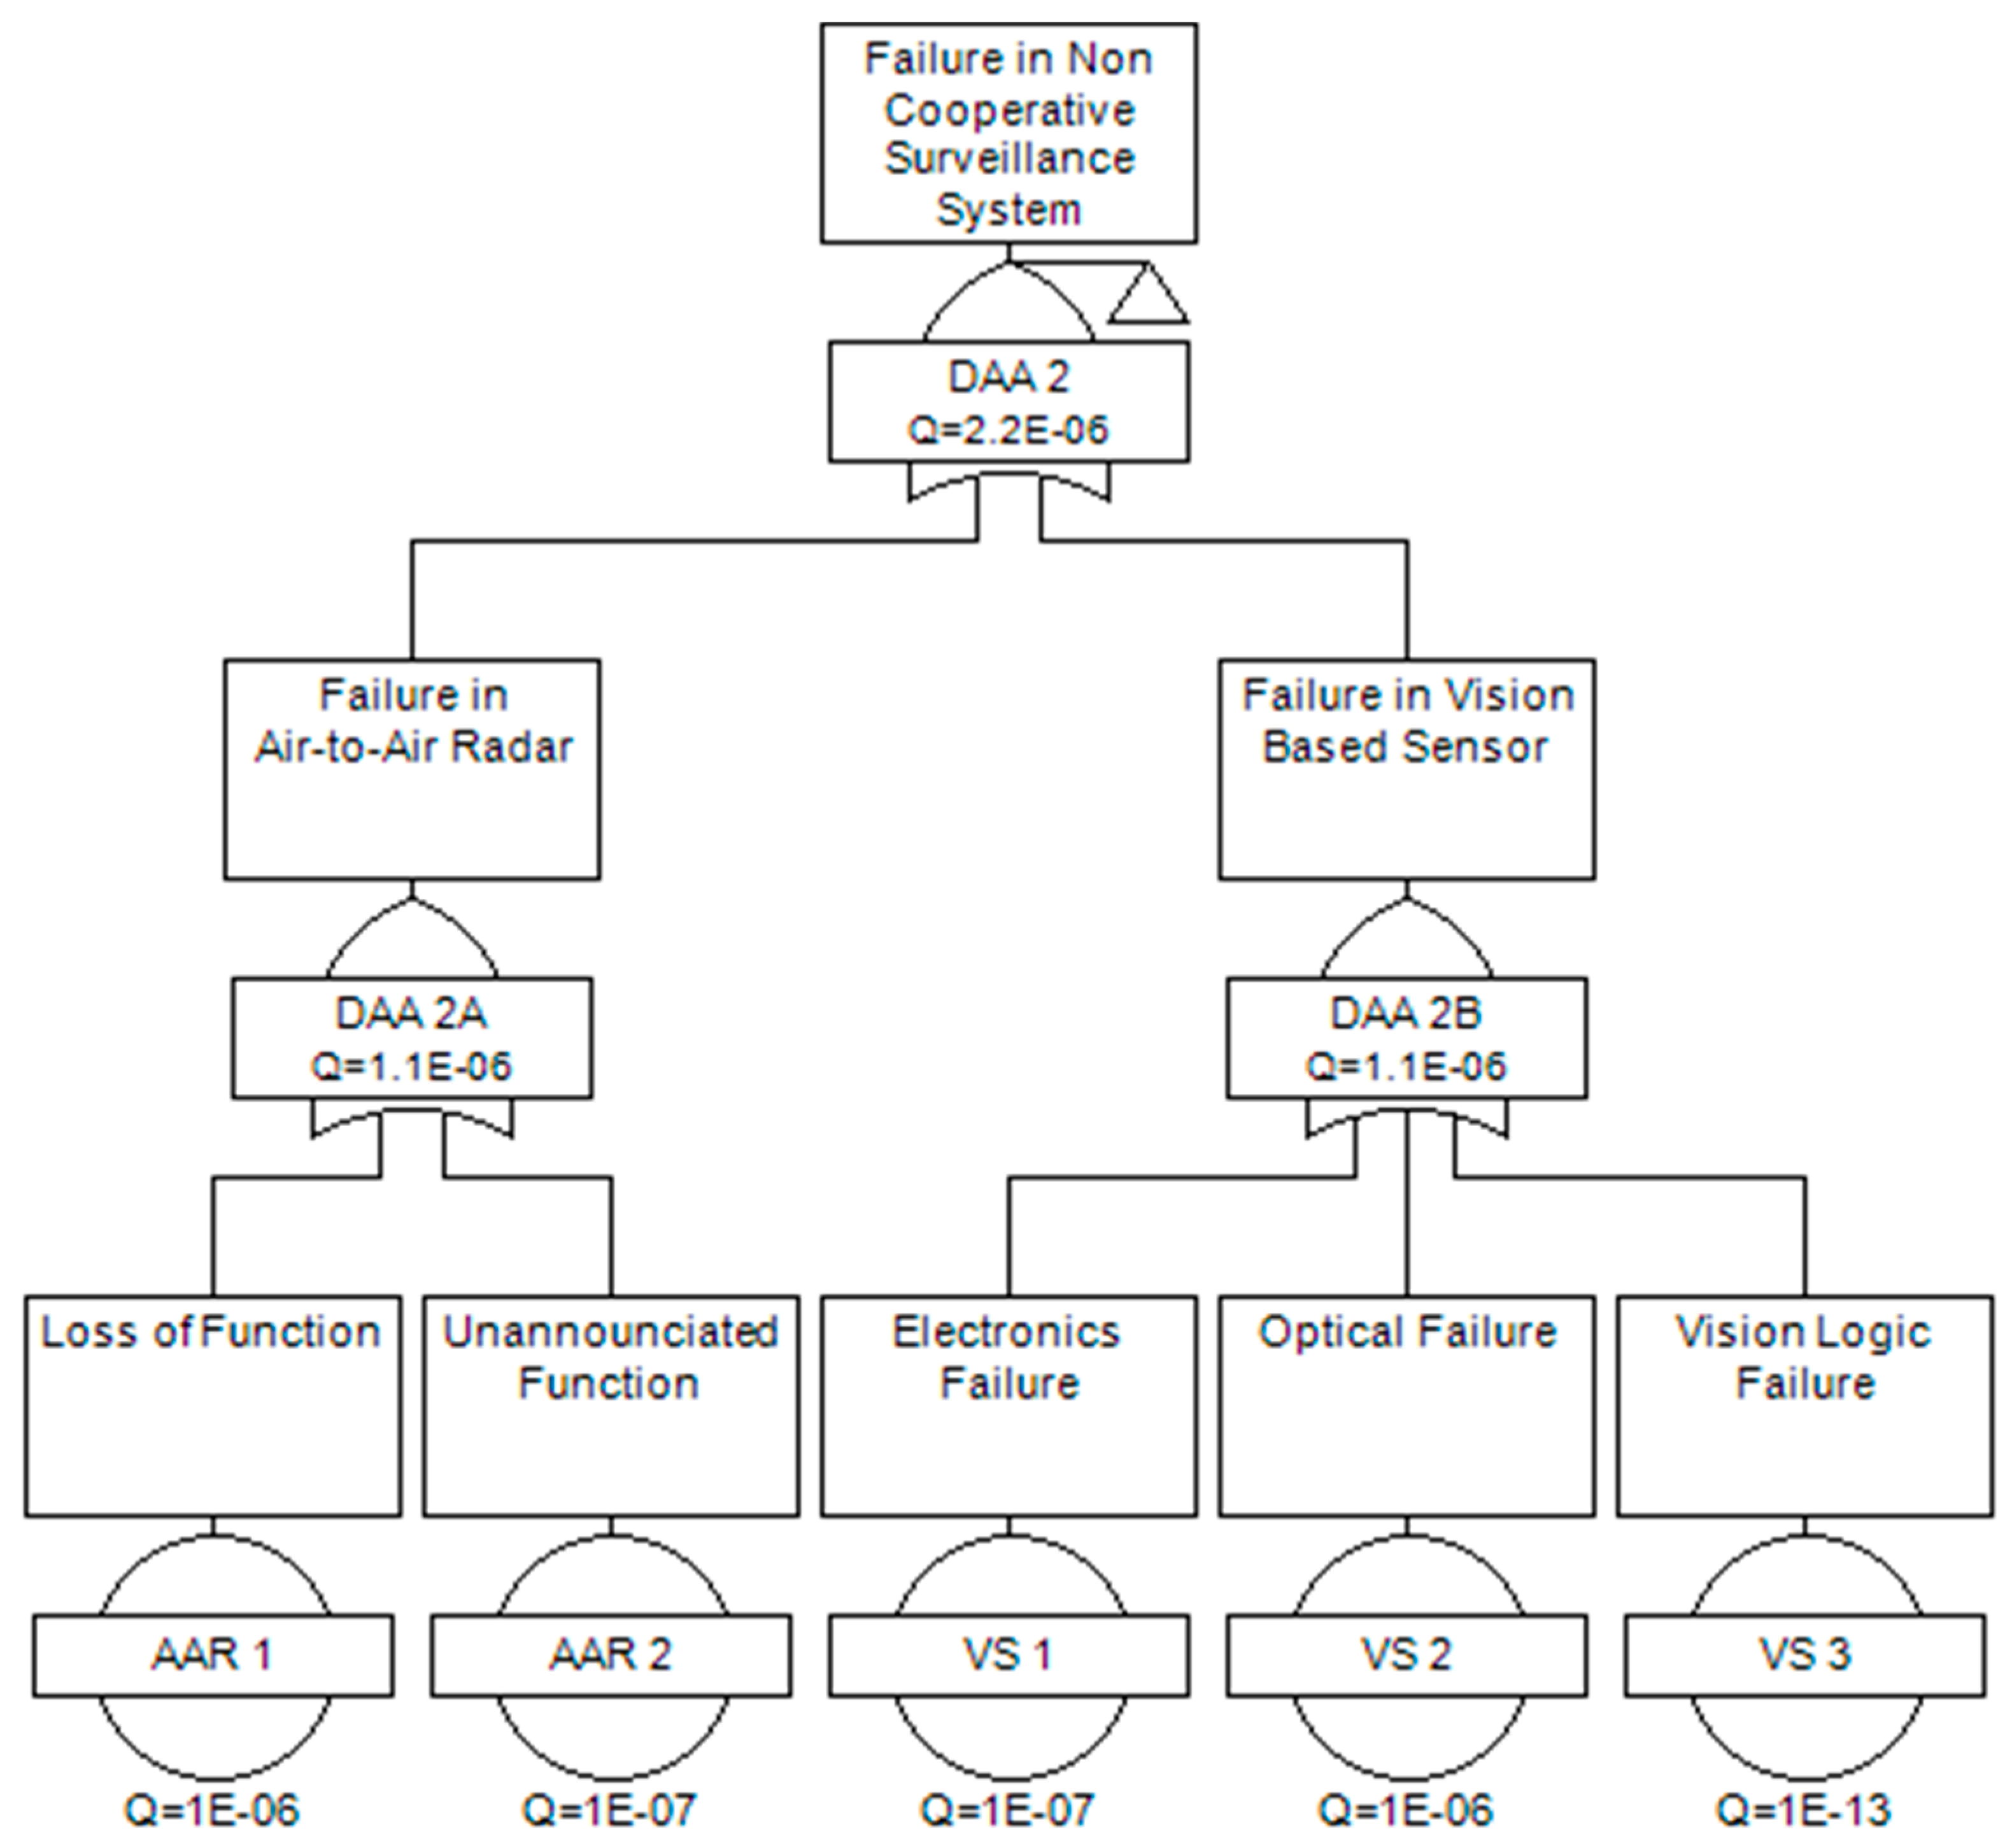
Figure 7 presents the intermediate event DAA 2-failure in non-cooperative sensor which is the result of two alternatives sensors failure: one is air-to-air radar failure, and another is vision-based sensor failure. While tracing the events for vision-based sensor, a component wise failure probability is adopted as the component is assumed to be acquired off the shelf with a specified MTBF.
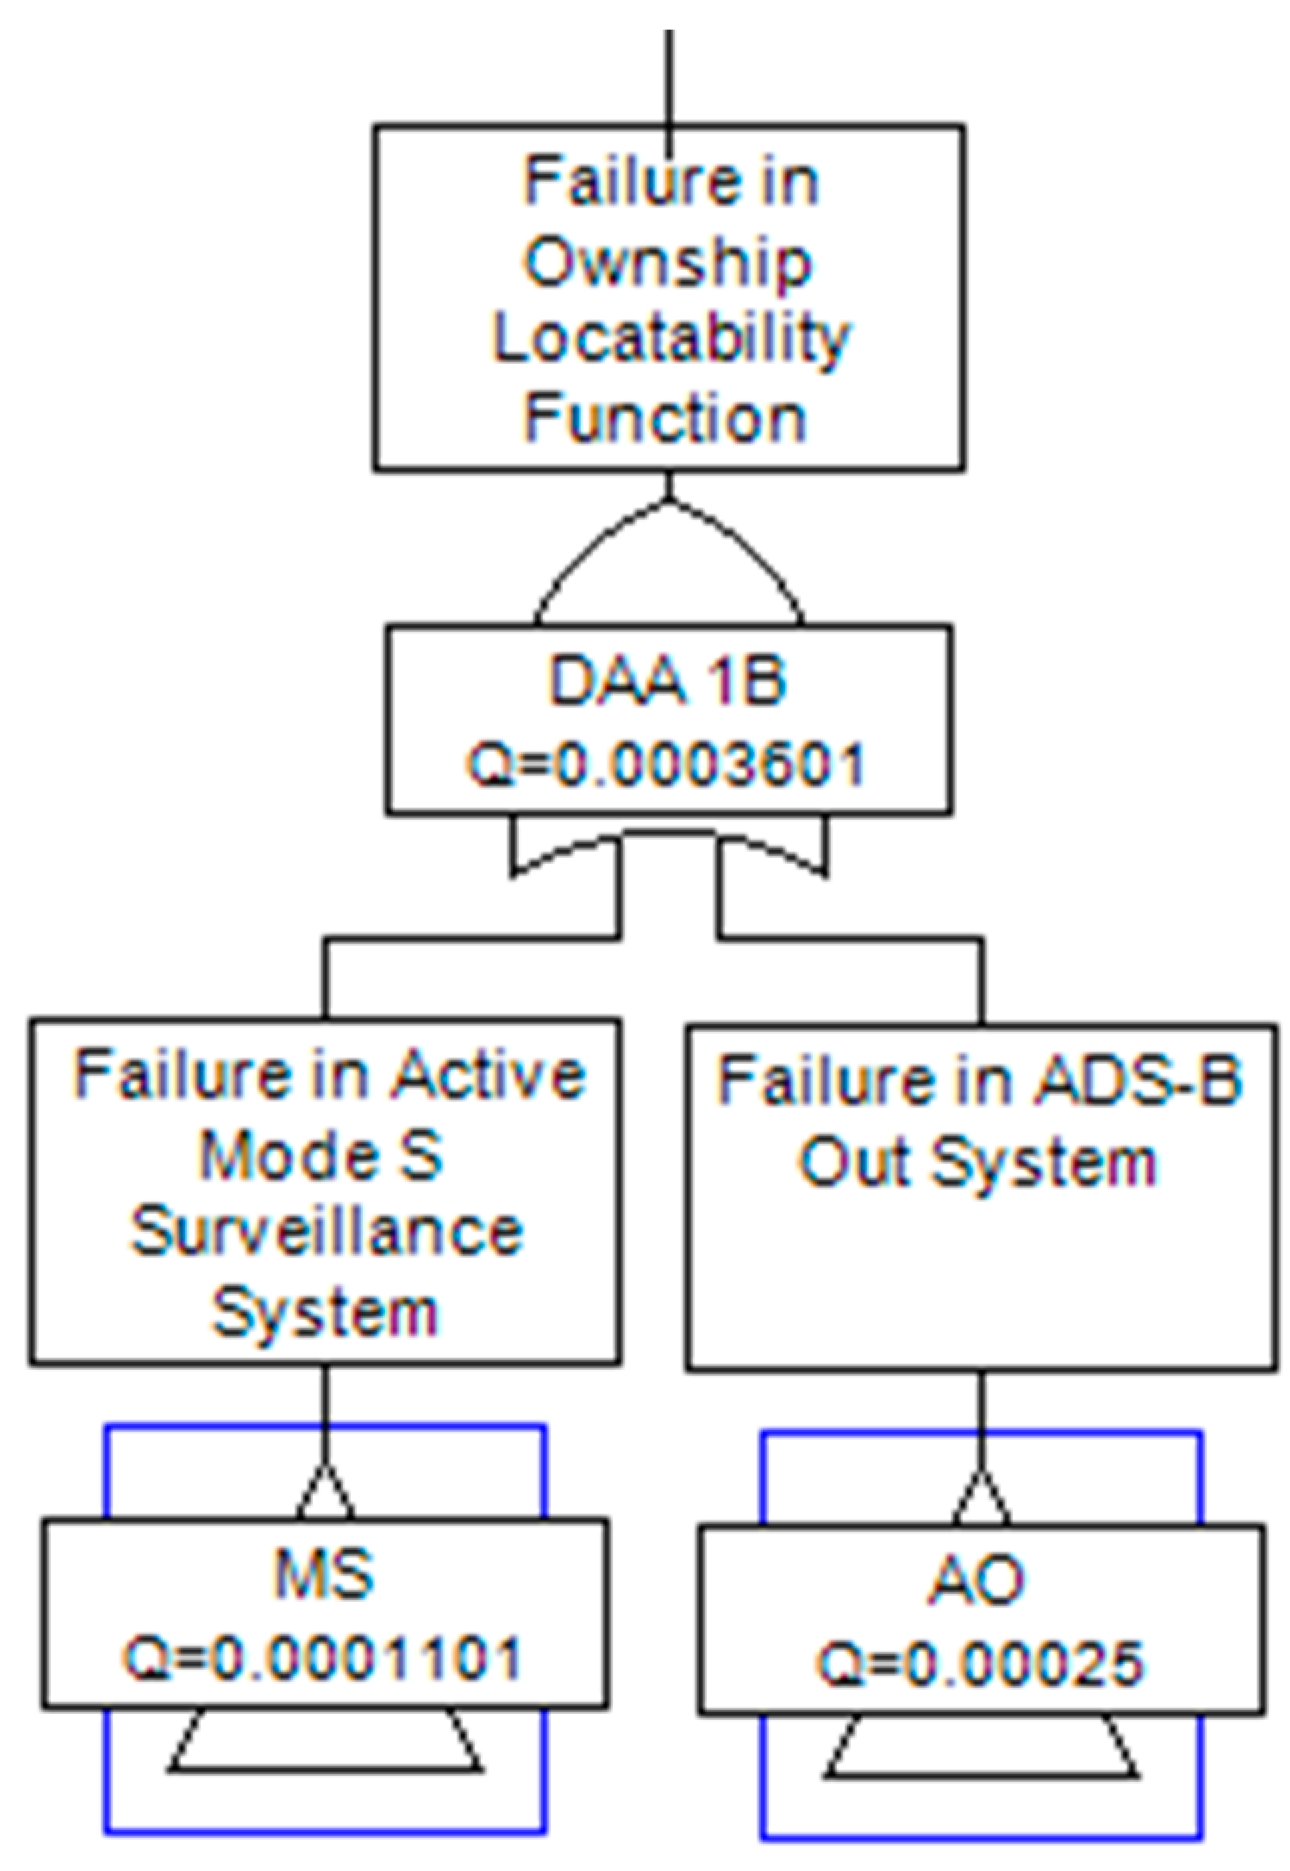
As stated earlier, a separate fault tree is constructed to determine the failure in ownship locatability function due to failure of cooperative surveillance system. Figure 8, Figure 9, Figure 10, Figure 11 and Figure 12 illustrate the faults trees of main event and intermediate events. As detailed in 
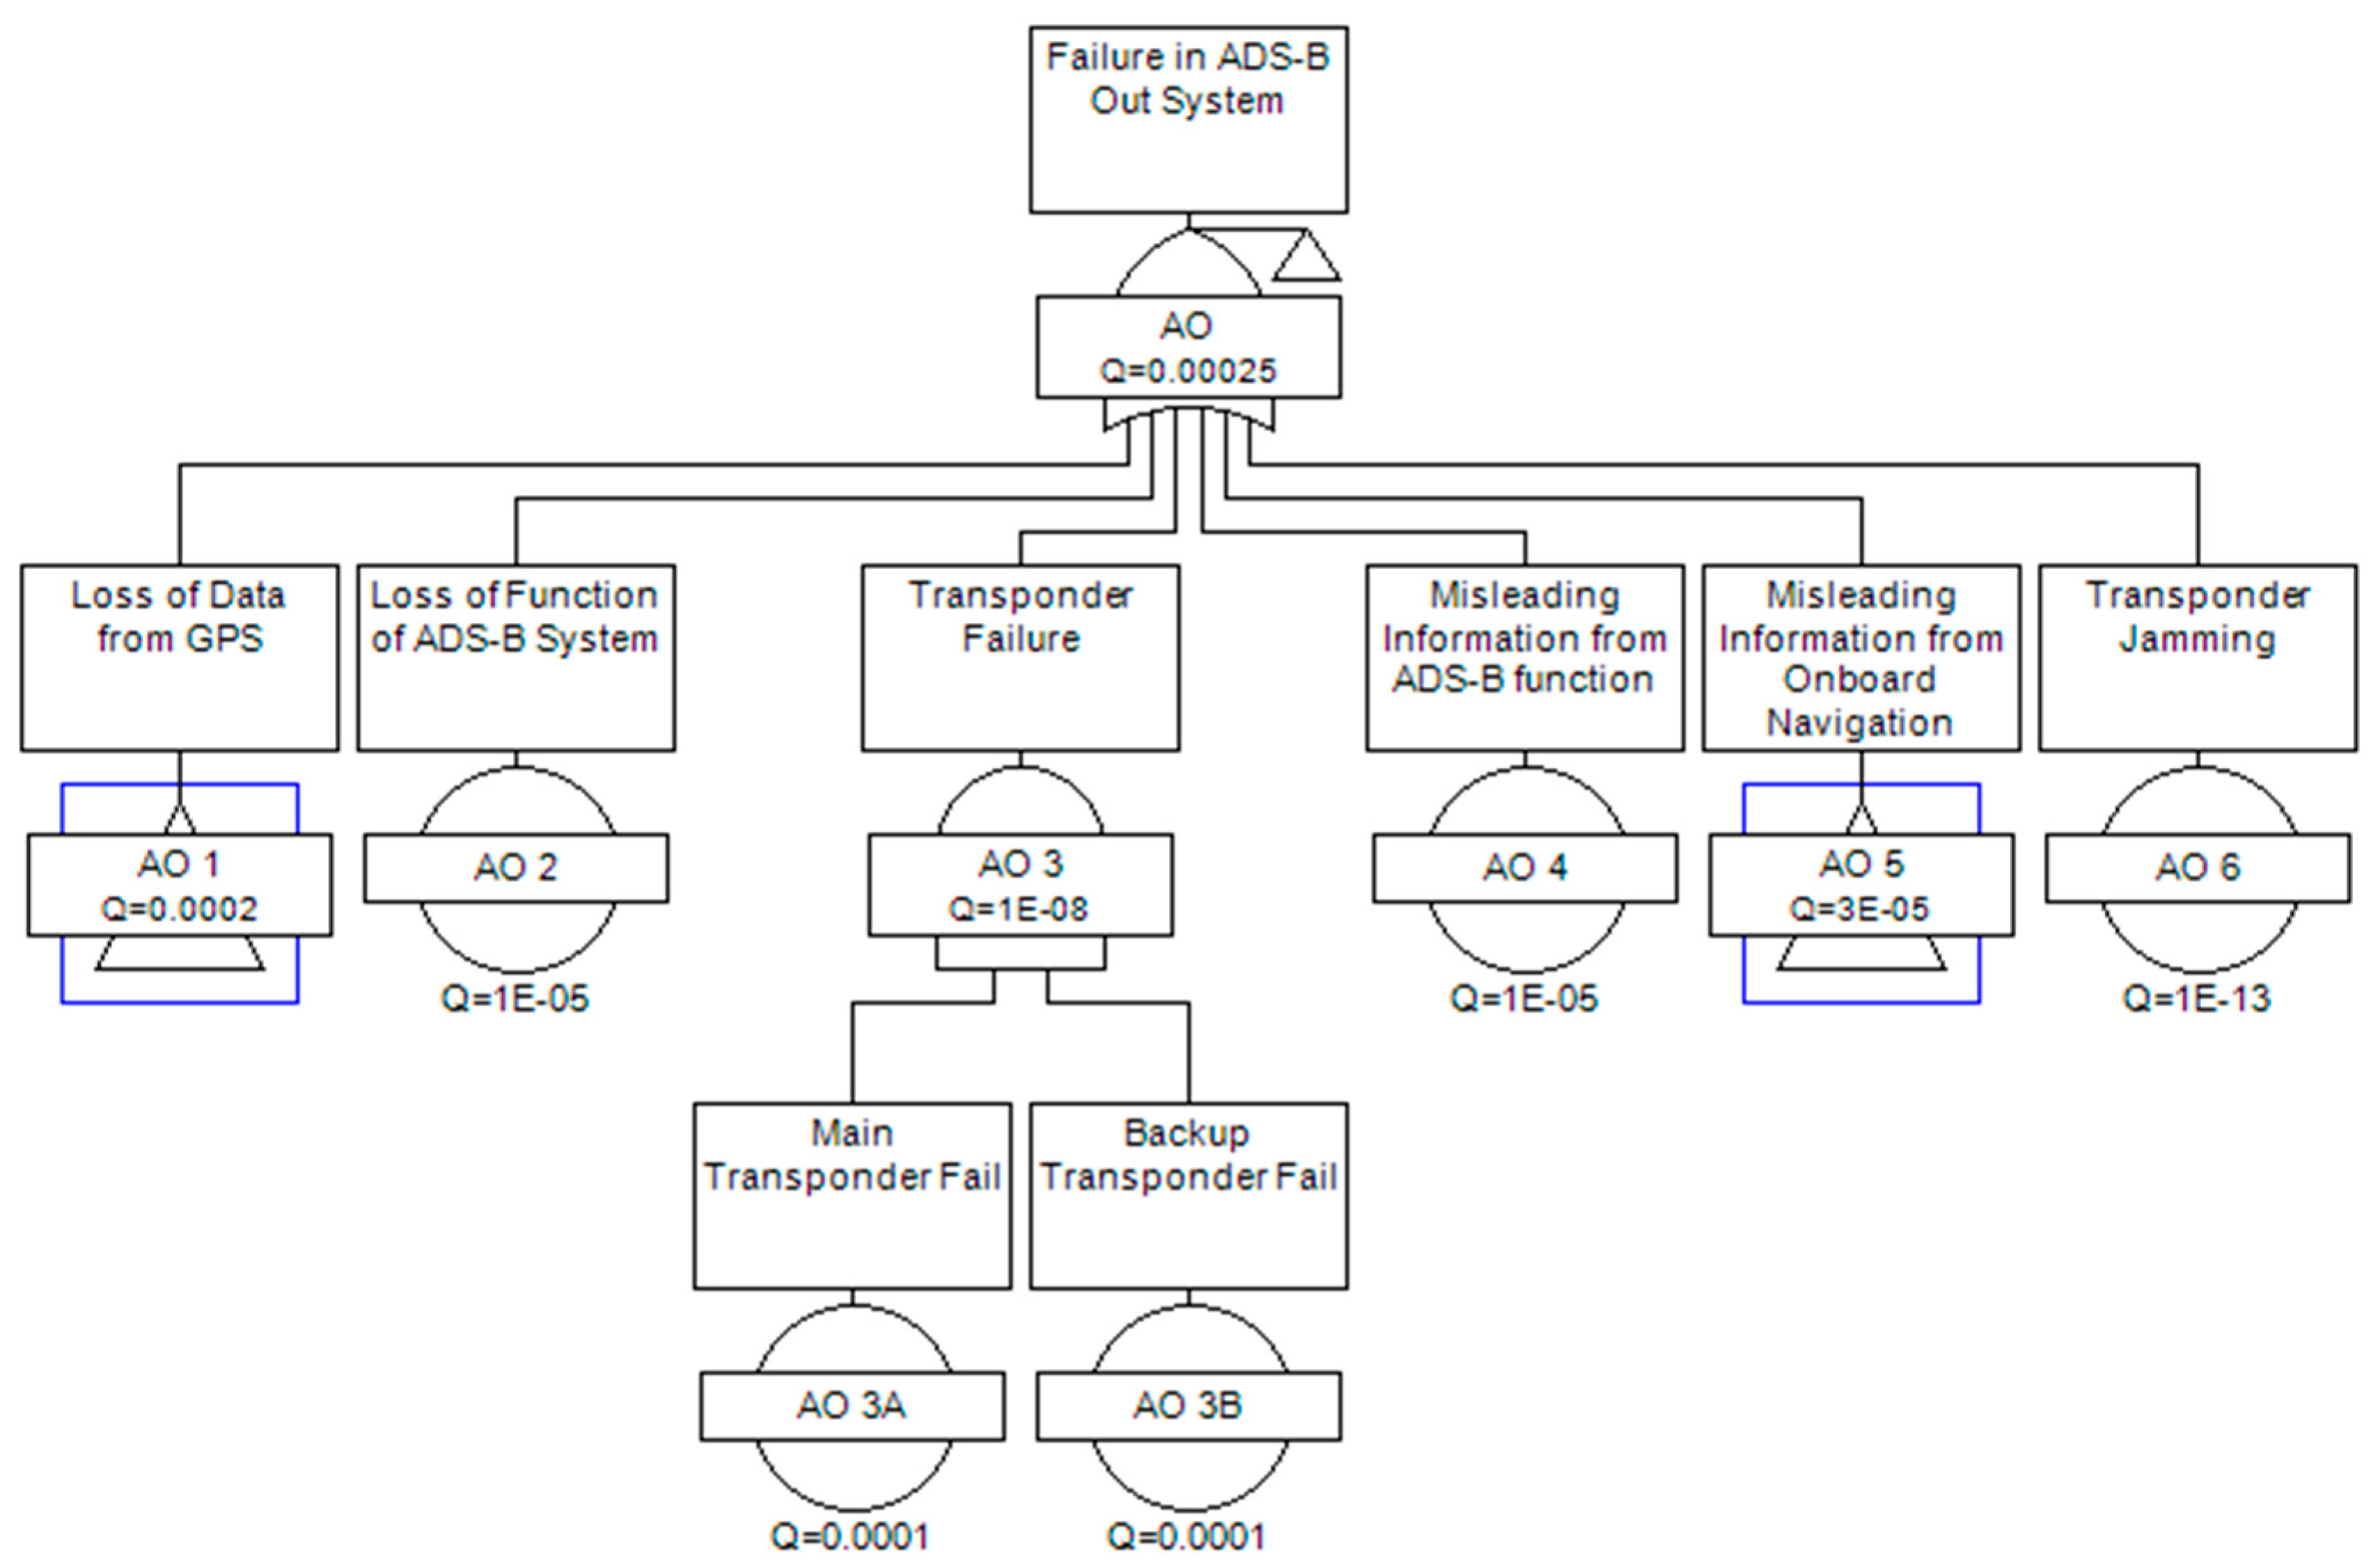
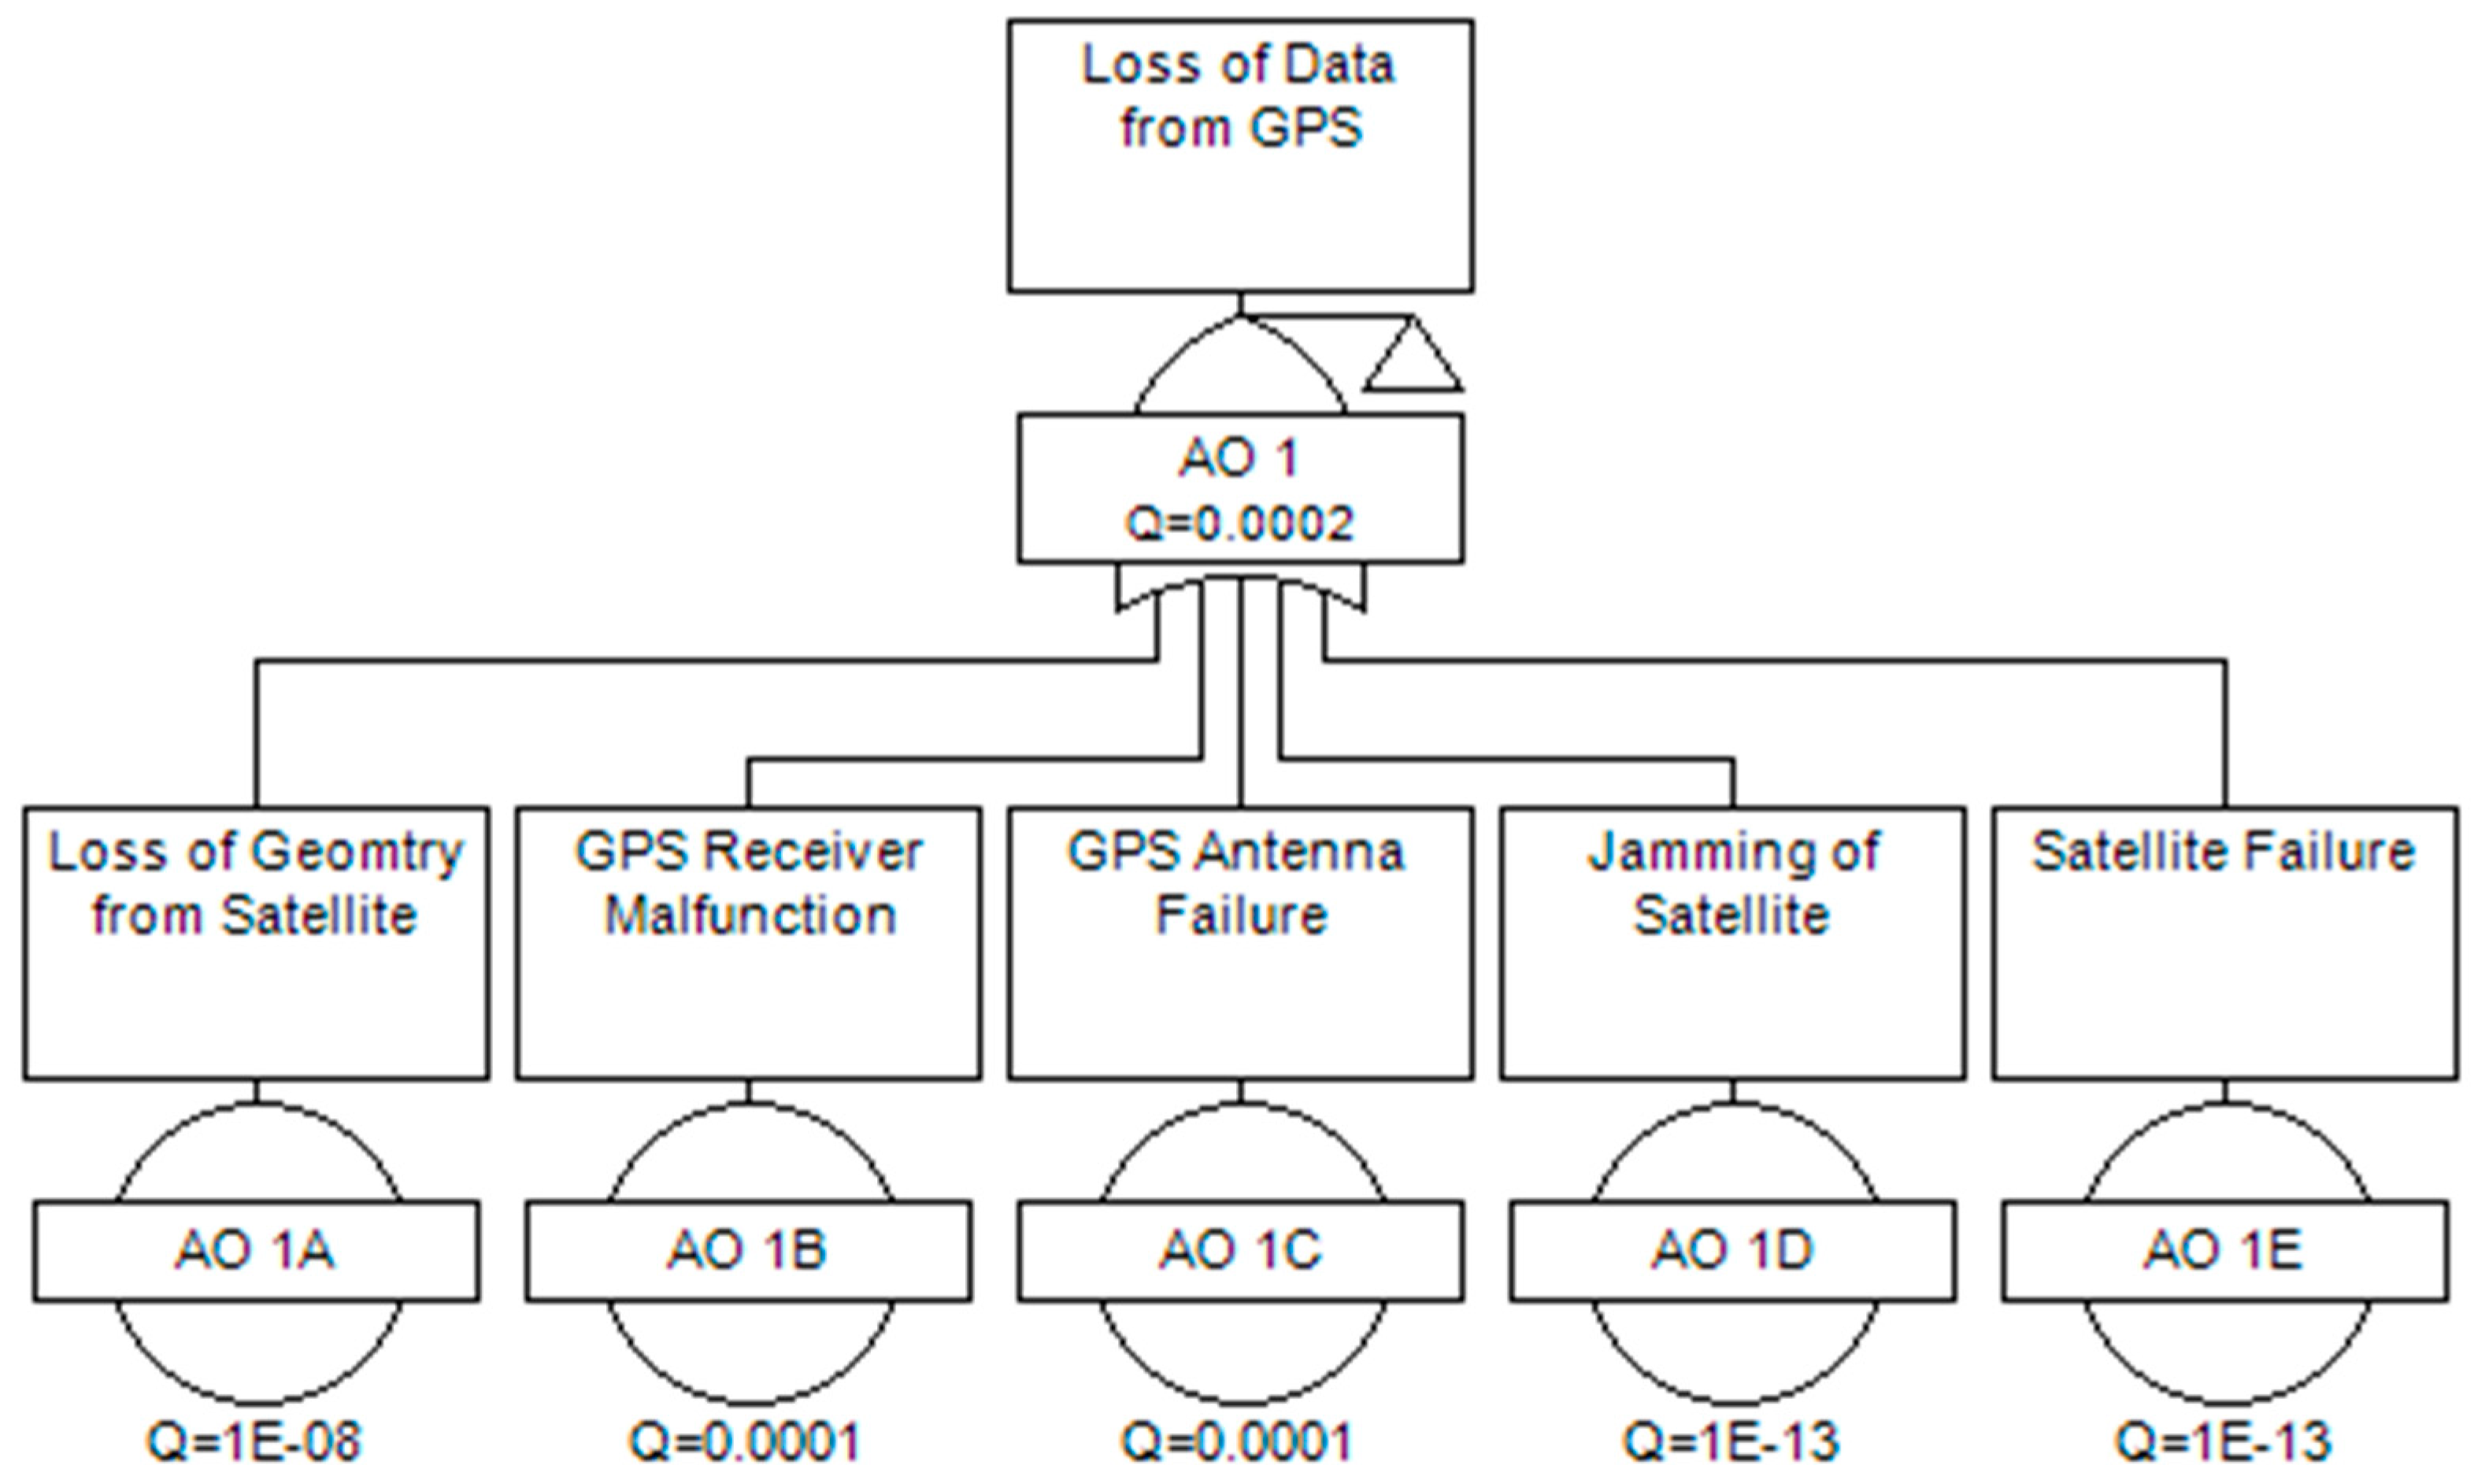
Figure 8, the failure in cooperative surveillance function occurs if either Mode S or ADS-B out failed. This is a conservative choice that assumes mixed equipage requirements. The ownship ADS-B out system depends on the onboard satellite navigation and pressure altimeter. Figure 9 and 
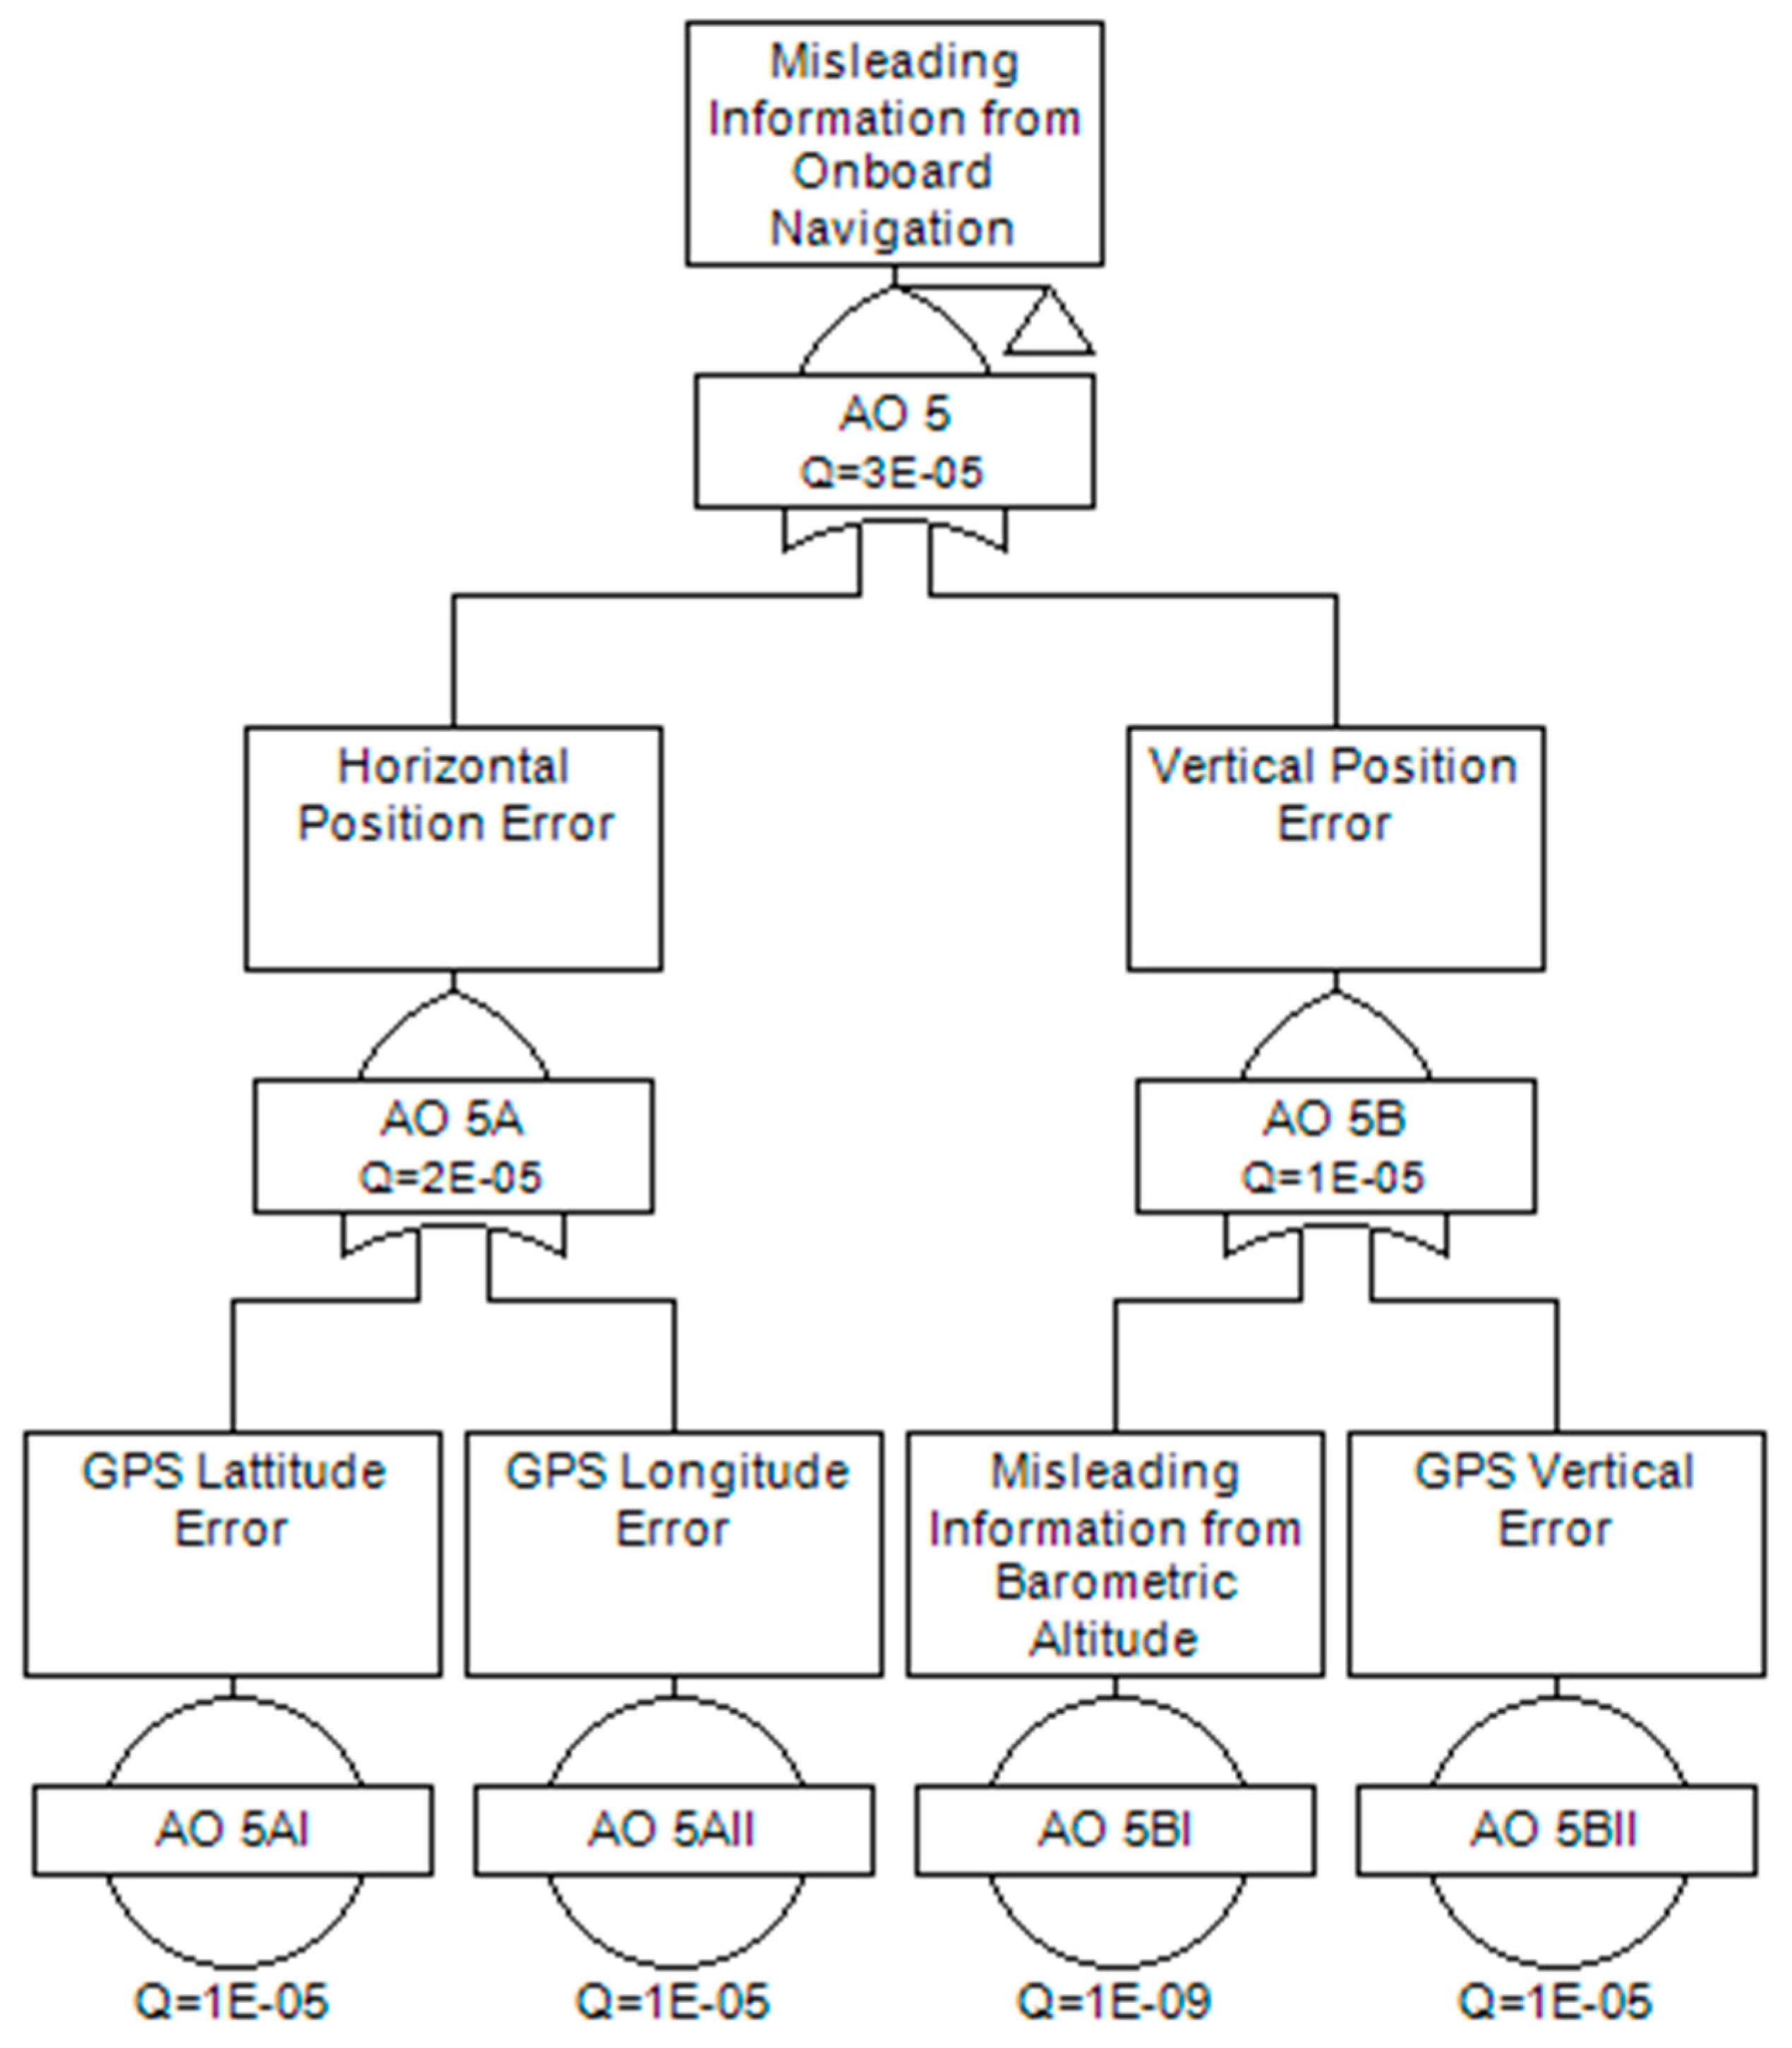
Figure 10 present the transferred trees from the ADS-B out; Figure 10 outlines the failure in ADS-B due to onboard satellite navigation loss and 
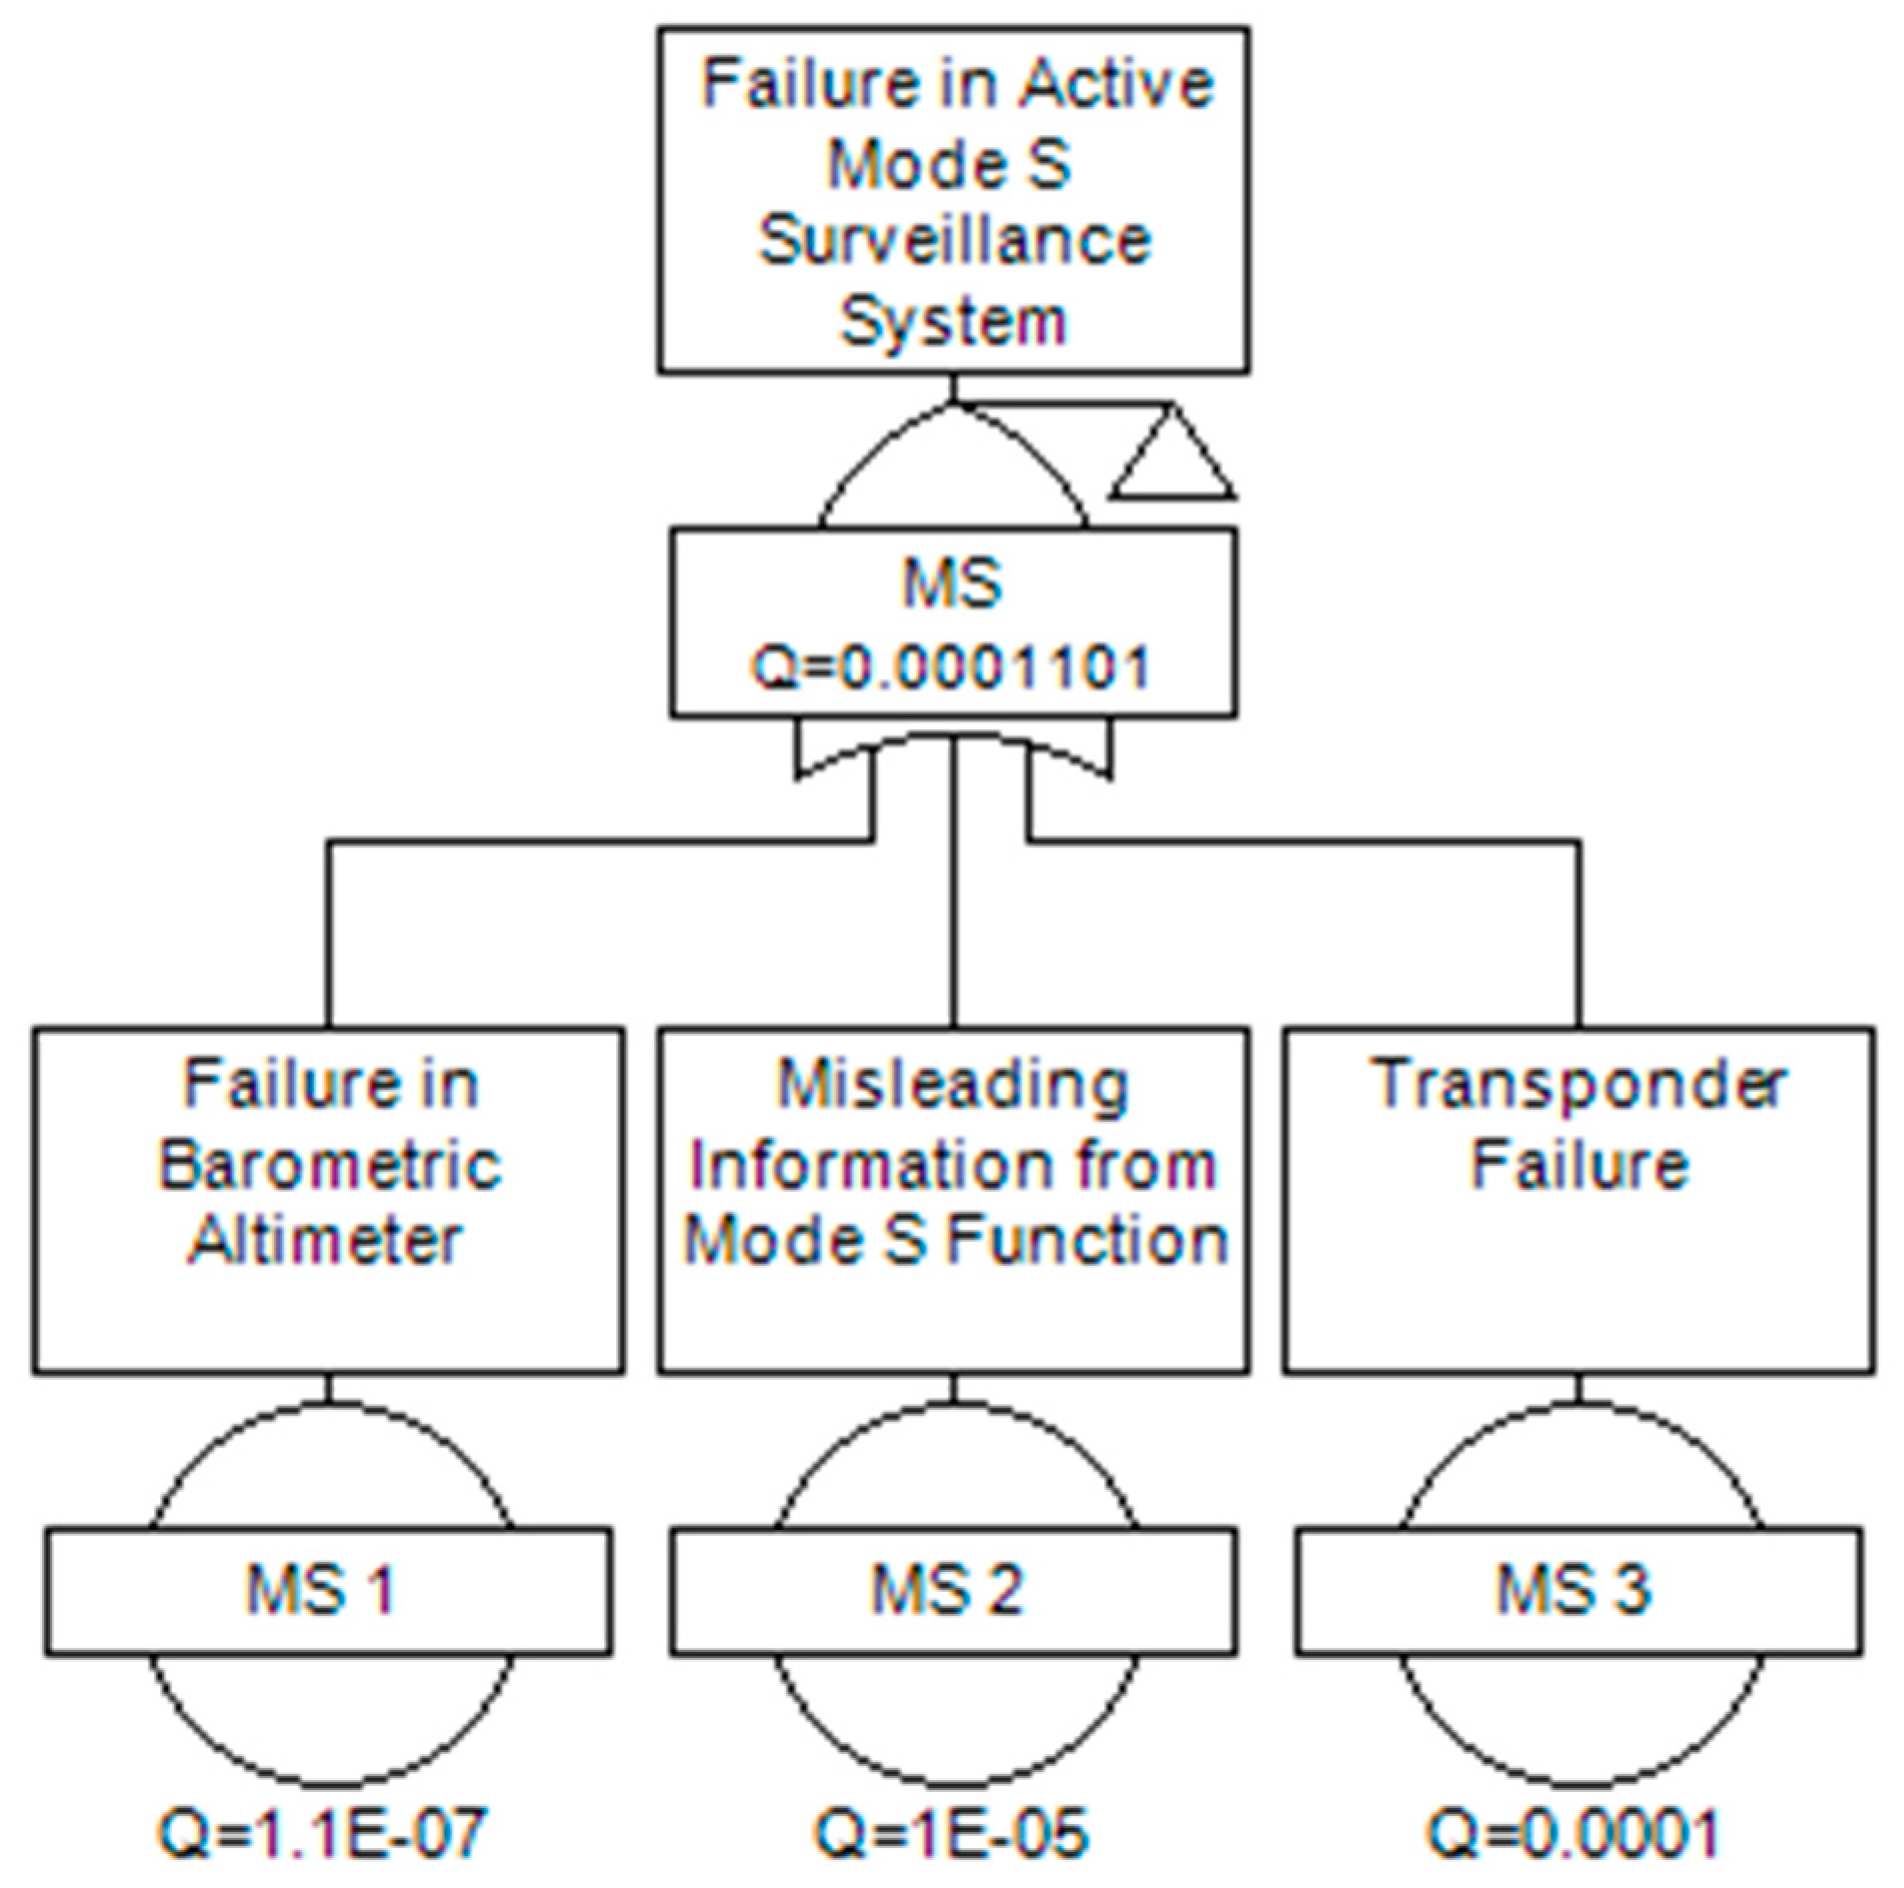
Figure 11 outlines the failure due to corrupted data from navigation sources. Finally, Figure 12 shows the fault tree for Mode S surveillance only.
The reliability data for the basic events used in the fault tree are extracted from the literature, aviation standard documents and Original Equipment Manufacturer (OEM) and presented in Table 2.
For the failure probability value of command datalink and air to air radar, the value is taken from technical standard orders, which state the loss of function (air to air radar and command datalink) cannot be greater than 1 × 10 6 per fight hour and unannounciated failure can be greater than 1 × 10 7 per flight hour. Although vision-based sensors are widely accepted as a means of UAS non-cooperative surveillance, so far, no specific technical standard defined the reliability requirements for DAA-grade vision sensors. Hence, the vision sensor failure is deduced considering its main component and the reliability data for airborne electronics / optical instruments during nominal condition is considered in the study.

4. Result and Analysis

Based on the FTA presented in Section 3, two different further analyses have been carried out in this study. In Section 4.1, we present the results related to the top events failure and the system availability that can be calculated from it. In the second analysis, the results of which are presented in Section 4.2, the importance measure is discussed, which relates the component significance to the top event failure.

4.1. System Availability

For the safety assessment in this study, a general model is used, which considers the failure probability as constant across the lifespan of the component. Denoting basic failure probability as Q i with i = 1…n and the top event failure as Q, assuming all basic events are independent, the model can be expressed as:
Q ( t ) = f ( Q 1 ( t ) ,   Q 2 ( t ) ,     Q n ( t ) )
This implies that if the state of each component in the fault tree is known at time t, then the state of the top event can also be determined regardless of what has happened up to time t. The top event probability is calculated by logically tracing the failure of basic events. Q(t), the probability of the hazard/top event occurrence is also known as the risk measure or unavailability [52]. Thus, the availability of the system can be obtained as:
O p e r a t i o n a l   A v a i l a b i l i t y = 1 Q ( t )
The failure in the DAA capability onboard deduced in Figure 5 is 9.356 × 10 6 , which implies operational availability of higher than 99.99%. For the fault tree presented in Figure 5, two most important intermediate events are failure in cooperative and non-cooperative surveillance sensor failure. Table 3, Table 4 and Table 5 summarize the results of intermediate events fault trees.
From the results presented in Table 4, the probability of cooperative surveillance system traffic detection capability is in order of 10 6 which can be referred to as remote [65]. From Figure 12 it can be seen that Mode S has the lowest failure probability where TCAS has most likely to failure (referred to Figure 6). Also, in Figure 6 it is also illustrated that ADS-B In failure probability is intermediate between Mode S and TCAS system. For all of three systems, the operational availability is higher than 99.9%. The failure in non-cooperative surveillance is also in the order of 10 6 as detailed in Table Table 5, but the value is lower than that of surveillance sensor failure. The lower level fault trees are generated based on the very basic reliability data and need future work to incorporate system specific information.
The failure of the cooperative surveillance to successfully locate ownship to intruder as well as ATM is deduced in a separate tree. This way the impact of particular system failure does not affect the failure of certain functionality. Table 6 summarizes the results.
Comparing Table 4 and Table 6, it can be noted that the surveillance system may fail to locate ownship more than it may fail to detect the intruder. This may occur because any misleading information or loss of data from intruder aircraft was not considered, while the ownship surveillance sensor are bound to corrupted data error from onboard navigation.

4.2. Importance Measure

A component or cut set’s contribution to the top event occurrence is termed as importance [66]. Importance measures of the basic events are associated with the risk-significance and safety-significance of the related components. They are normally used to rank the system’s components with respect to their contribution to the reliability and availability of the overall system. In this study, three different importance measures are used to quantify the risks. The first one is the Fussell–Vessely factor (F–V). The Fussell–Vessely factor measures the overall percent contribution of cut sets containing a basic event of interest to the total risk.
F V = ( P r o b a b i l i t y   o f   t o p   e v e n t   d u e   o n l y   t o   c u t s e t s   o f   i n t e r e s t ) ( P r o b a b i l i t y   o f   t o p   e v e n t )
The second one is Risk Reduction Worth (RRW), a measure of the change in risk of the system when the system component is perfect, or failure probability is zero. This measure helps to identify the components that are the best candidates to improve for overall safety.
R R W = ( P r o b a b i l i t y   o f   t o p   e v e n t ) ( P r o b a b i l i t y   o f   t o p   e v e n t   w i t h   c o m p o n e n t   f a i l u r e   p r o b a b i l i t y = 0 )
The third factor is risk achievement worth (RAW) measure of the increase in risk when a system is unavailable. Mathematically,
R A W = ( p r o b a b i l i t y   o f   t o p   e v e n t   w i t h   c o m p o n e n t   f a i l u r e   p r o b a b i l i t y = 1 ) ( p r o b a b i l i t y   o f   t o p   e v e n t )
Table 7 summarizes the importance analysis for each of platform failure and ranked them according to their significance on the total failure.
The F–V value for DAA 1 failure in cooperative surveillance system is higher than all the events indicating that it contributes most to the system failure. Any improvement in the reliability of DAA 1 will decrease the risk with RRW = 2.176. Failure in non-cooperative surveillance system is the second highest effect on the DAA failure. The ability of airborne processor is rigid, and the failure of processor is considered extremely improbable, therefore its contribution is minimal to the DAA failure. Table 8 summarize the importance measure value for the fault tree presented in Figure 8.
The results summarize in Table 8, depicts that Mode S failure affects and contribute more to the overall system failure. This can also be concluded from the failure probability value of each system. The failure probability was higher for mode S surveillance than the ADS-B Out system.

5. Pathway to DAA Certification: ADS-B Suitability

DAA systems capable of consistently and reliably performing equally or exceed the see-and-avoid performance of a human pilot are indispensable to mitigate the risks associated with possible errors/failures in the command and control (C2) loops involving the remote pilot and to support safe autonomous operations. Previous undertakings in the domain only managed to establish the safety cases for UAS operating within the line-of-sight (LOS) of their pilots or segregated from other traffic and well clear of public infrastructure and major urban settlements. For BLOS operation and safe integration of UAS in non-segregated airspace, the provision of certified autonomous DAA capabilities is an indispensable milestone. The current LOS operations/segregated airspace constraints are preventing further exploitations of UAS technology and impeding many practical uses. For instance, the use of UAS to survey large areas, to deliver essential goods in remote locations and to provide communication services over wide geographic regions, to name a few, all require non-segregated BLOS operational capabilities. From the FTA carried out in this study, the system availability is greater than 99.98% for both ADS-B Out and ADS-B In systems. The availability of ADS-B In system is solely based on the host platform and any failure or malfunction from the intruder platform is not considered. The Minimum Aviation System Performance Standards for ADS-B [67] specify the availability of ADS-B to be greater than 99.9% if used as primary means of surveillance and greater than 95% if used as supplementary means of surveillance. The Civil Aviation Certification Authority (CASA) in Australia has mandated using ADS-B for aircraft flying above FL285 and also for Instrument Flight Rule (IFR) traffic as specified in CAO 20.18. The FAA also mandated all the general aviation aircraft to be equipped with ADS-B within 2020 [68]. Although the failure of the ADS-B system (1.2 × 10
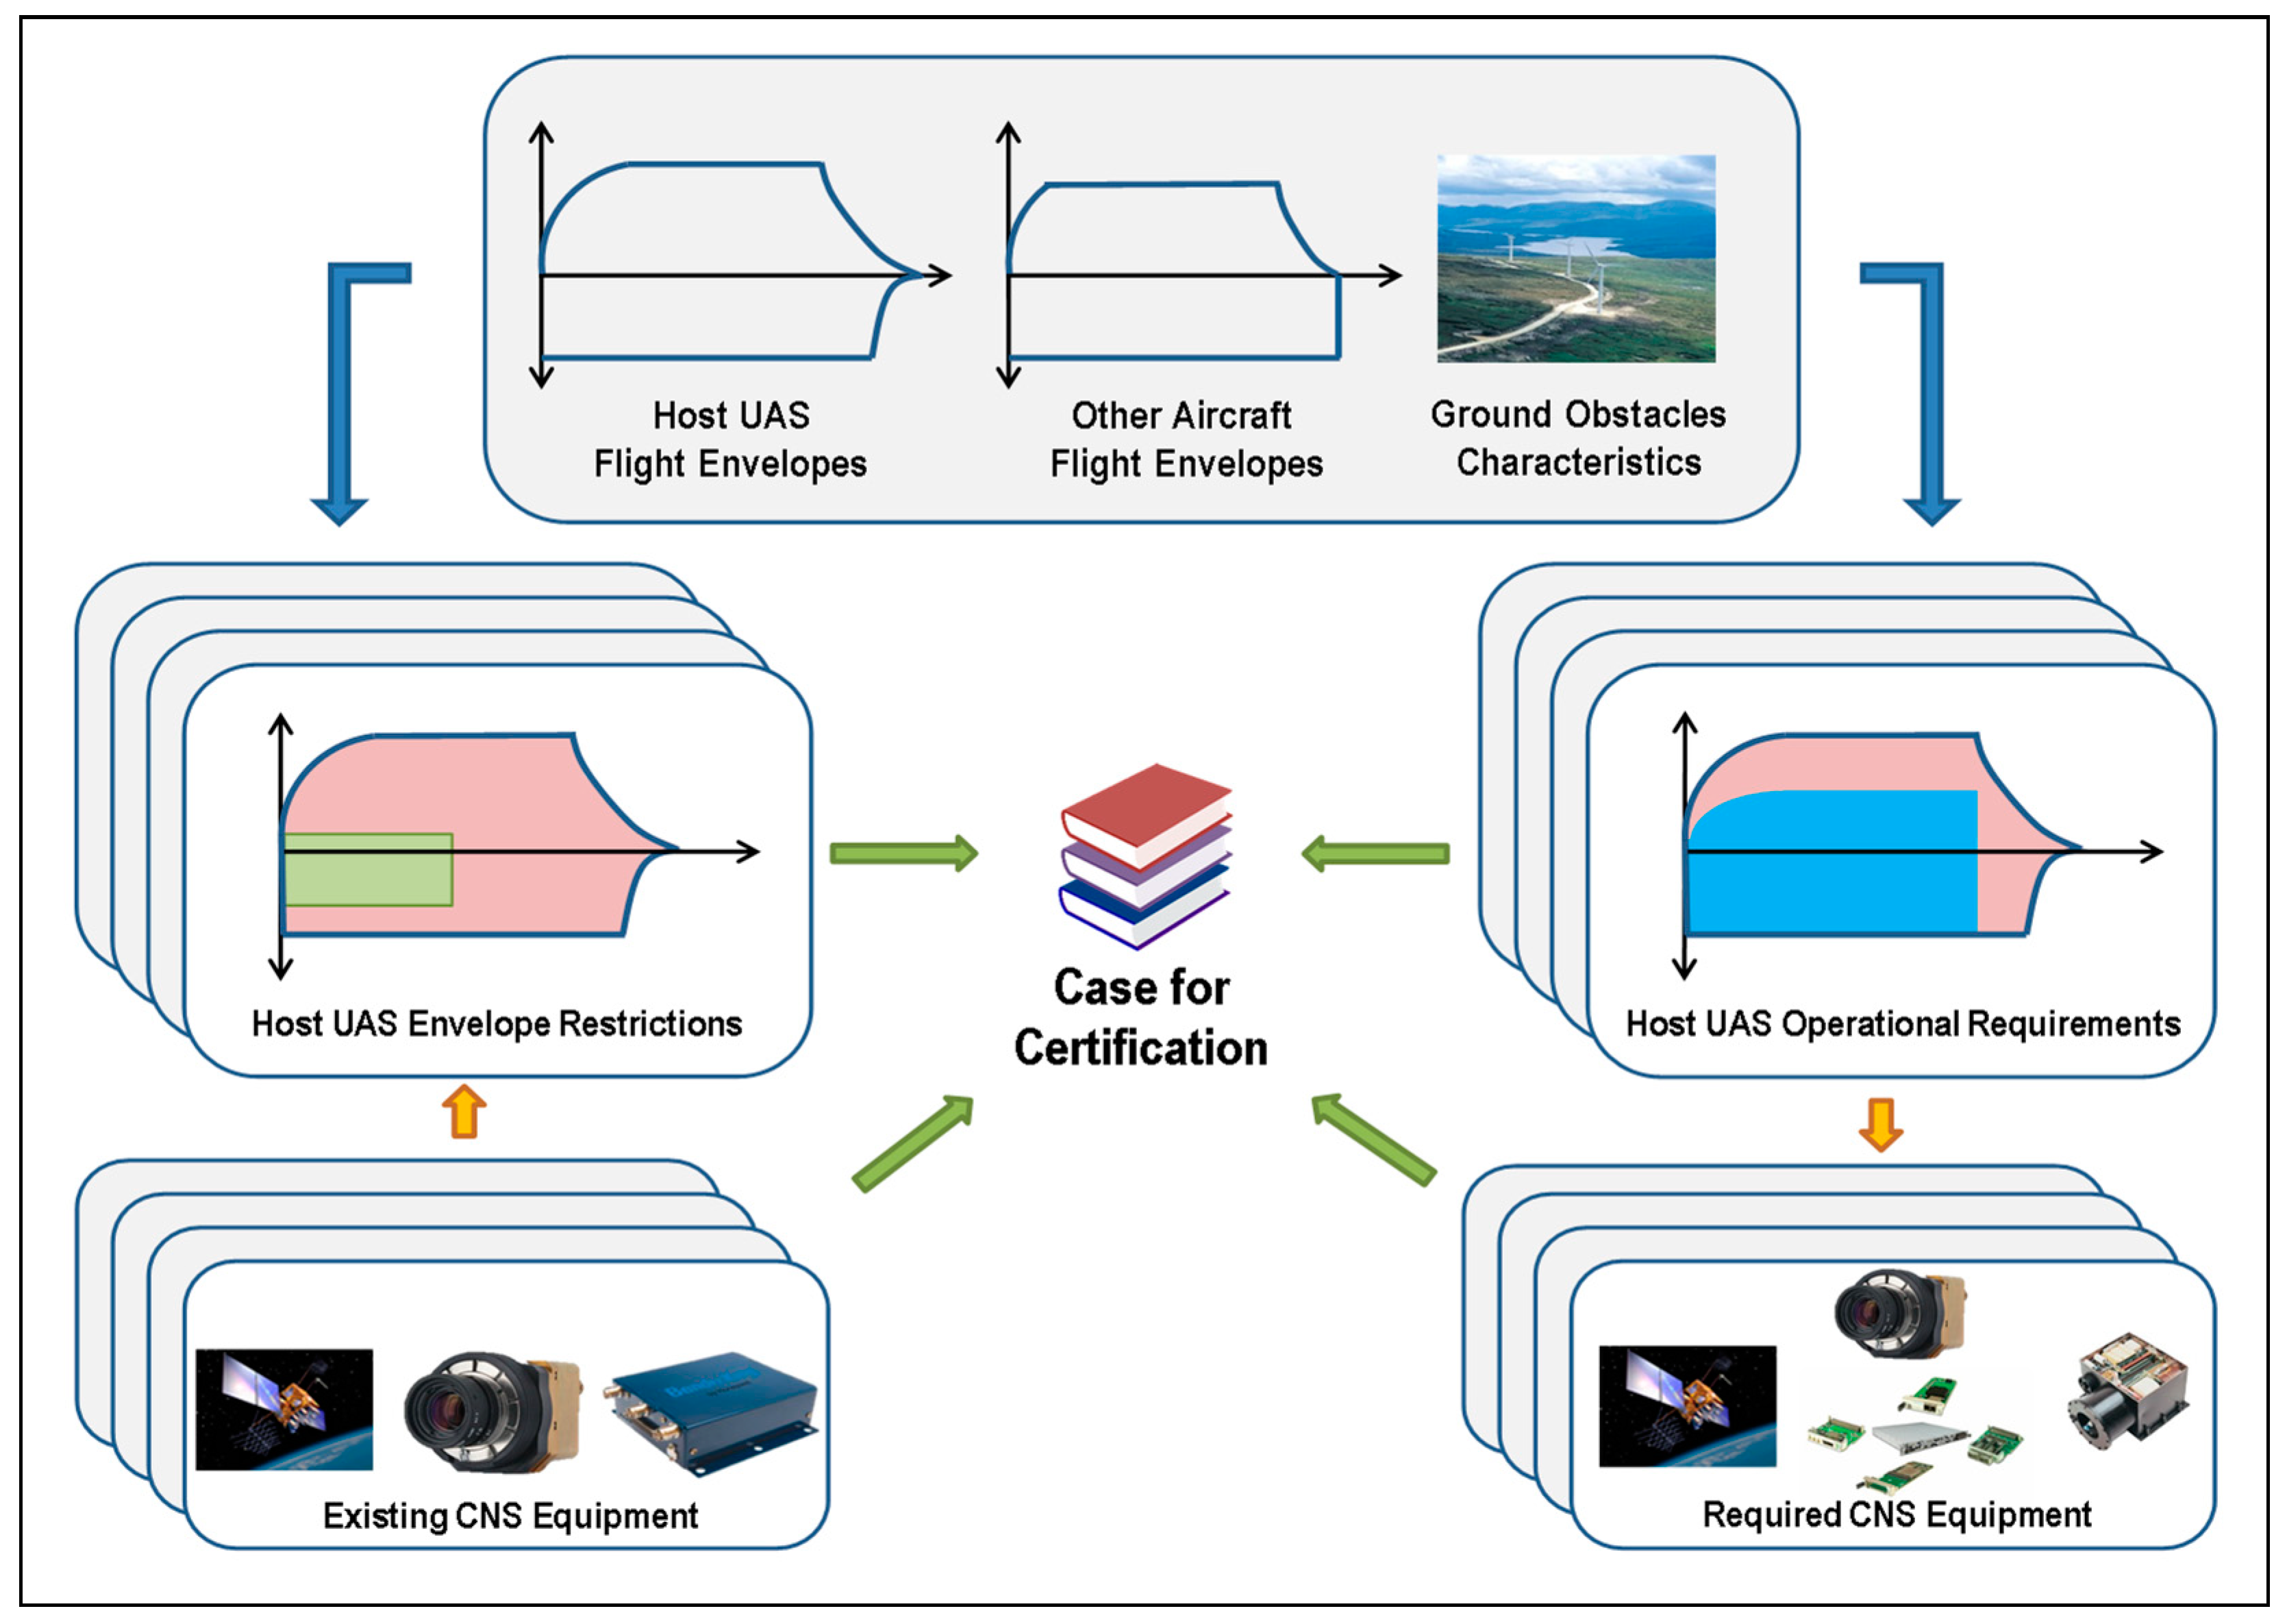
⁻³) is lower comparative to other surveillance sensors, researcher working on DAA capability concluded that only an adequate exploitation of multi-sensor architecture will potentially meet the safety requirements in all flight phases. Therefore, depending on the operational flight envelope ADS-B data shall be fused with other cooperative and non-cooperative surveillance data. Therefore, ADS-B systems can be used as a cooperative sensor especially in the airspace with IFR traffic allowing the safe operation of unmanned platforms in non-segregated airspace. The mathematical approach proposed in the unified framework allows us to determine the safe-to-fly portions of the host UAS operational flight envelope based on the avionics sensors/systems available onboard or, alternatively, to identify the required sensors/systems required for operating in a certain predefined portion of the host UAS operational flight envelope. Figure 13 conceptually depicts the two-way certification approach.
In particular, considering the nominal flight envelopes of the host UAS/intruders and the characteristics of the on-board sensors/systems, the algorithms will determine the applicable safety envelope restrictions. Conversely, based on a predefined (required) flight envelope and on the intruder dynamics, the algorithms will allow an identification of the specific avionics sensors/systems that must be integrated in the UAS. This approach will lay the foundations for the development of an airworthy DAA capability and a pathway for manned/unmanned aircraft coexistence in all classes of airspace.
Moreover, the research community determined that only the exploitation of machine learning and artificial intelligence technologies will allow to develop a DAA capability that can perform reliably with the predicted levels of traffic density and the infinite combination of possible encounter characteristics, which already exceed the cognitive capabilities of human operators. This has been the chosen path, for instance, in the development of the ACAS-Xa variant. However, the current regulatory framework does not cater for the certification of non-deterministic behavior avionics systems, hence significant evolutions will be required to the framework [69], which shall also account for the ever-increasing air-ground functional integration as part of the so-called CNS+A (i.e., CNS/ATM and Avionics) paradigm, which demands that cohesive safety certification requirements are adopted for both airborne and ground-based systems [69,70].

6. Conclusions

The reliability of UAS DAA systems based on ADS-B and other cooperative/non-cooperative sensors was analyzed in this paper. The unified analytical framework has been utilised for the mathematical fusion of navigation and tracking errors, supporting the development of low SWaP-C DAA systems exploiting cooperative and non-cooperative surveillance technologies. The paper also briefly discussed the need for an evolution of the certification framework to accommodate the adoption of non-deterministic systems and to encompass the ever-increasing functional integration between airborne and ground-based systems. The analysis highlighted the safety significance and importance of the onboard surveillance equipment. The cooperative surveillance system failure contributes most to the DAA capability failure. Another important finding is that for the cooperative surveillance system, the failure in ownship surveillance capability is higher than the failure in traffic detection capability. The adequacy of ADS-B as a cooperative surveillance system for conventional one-to-one encounters was also discussed. The calculated failure probability is in the order of 10−6, which is remote. Although the severity analysis has not been included in this study, the implications of the failure will depend on the airspace characteristics. In particular, in uncontrolled airspace, where ATM deconfliction service is not available or limited, the consequences will be likely more severe than in controlled airspace. Additionally, the severity also depends on the intruder equipage, as inadequate maneuvers can be initiated due to CNS performance limitations in the intruder platform. Hence, depending on airspace and UAS performance characteristics, specific avionics sensors/systems will have to be integrated. In conclusion, ADS-B has a good potential to be utilized as the main cooperative system especially in airspace with IFR traffic. Further evaluation will have to consider intruder equipage failures as well as different airspace and conflict scenarios. This future work will prompt an evolution of the conventional probabilistic safety assessment methodology.

Author Contributions

Conceptualization, R.S. and A.T.; Methodology and Formal Analysis, A.T.; Investigation, R.S. and A.T.; Writing-Original Draft Preparation, A.T. and A.G.; Writing-Review and Editing, R.S. and A.G.; Supervision, R.S.

Funding

This research received no external funding.

Conflicts of Interest

The authors declare no conflict of interest.

References

  1. 2016-2030 Global Air Navigation Plan. Available online: https://www.icao.int/airnavigation/documents/ganp-2016-interactive.pdf (accessed on 18 July 2018).
  2. U.S. Army Unmanned Aircraft System Roadmap 2010–2035. Available online: https://www.army.mil/article/37470/us_army_roadmap_for_unmanned_aircraft_systems_2010_2035 (accessed on 18 July 2018).
  3. Unmanned Aircraft Systems Integration in the National Airspace System. Available online: https://www.nasa.gov/centers/armstrong/news/FactSheets/FS-075-DFRC.html (accessed on 18 July 2018).
  4. Ribeiro, L.; Giles, S.; Katkin, R.; Topiwala, T.; Minnix, M. Challenges and opportunities to integrate UAS in the National Airspace System. In Proceedings of the IEEE 2017 Integrated Communications, Navigation and Surveillance Conference (ICNS), Herndon, VA, USA, 18–20 April 2017; pp. 6C3-1–6C3-13. [Google Scholar]
  5. Avionics. Integrating UAS in the NAS. Available online: https://www.aviationtoday.com/2013/08/01/integrating-uas-in-the-nas/ (accessed on 18 July 2018).
  6. EASA. Partners Step Up Efforts to Address the Integration of Drones into European Airspace. Available online: https://www.easa.europa.eu/newsroom-and-events/news/partners-step-efforts-address-integration-drones-european-airspace (accessed on 18 July 2018).
  7. Wood, D. Collision Avoidance System and Method Utilizing Variable Surveillance Envelope. U.S. Patent 10,125,918, 17 April 2002. [Google Scholar]
  8. Mullins, M.; Holman, M.W.; Foerster, K.M.; Kaabouch, N.; Semke, W. Dynamic Separation Thresholds for a Small Airborne Sense and Avoid System. In AIAA Infotech @ Aerospace Conference; American Institute of Aeronautics and Astronautics: Reston, VA, USA, 2013. [Google Scholar] [CrossRef]
  9. Smith, A.; Coulter, D.; Jones, C. UAS Collision Encounter Modeling and Avoidance Algorithm Development for Simulating Collision Avoidance. In AIAA Modeling and Simulation Technologies Conference and Exhibit; American Institute of Aeronautics and Astronautics: Reston, VA, USA, 2008. [Google Scholar]
  10. Smith, A.; Harmon, F. UAS Collision Avoidance Algorithm Minimizing Impact on Route Surveillance. In AIAA Guidance, Navigation, and Control Conference; American Institute of Aeronautics and Astronautics: Reston, VA, USA, 2009. [Google Scholar]
  11. Seo, J.; Kim, Y.; Kim, S.; Tsourdos, A. Collision Avoidance Strategies for Unmanned Aerial Vehicles in Formation Flight. IEEE Trans. Aerosp. Electron. Syst. 2017, 53, 2718–2734. [Google Scholar] [CrossRef]
  12. De Crescenzio, F.; Persiani, F.; Miranda, G.; Bombardi, T. 3D Obstacle Avoidance Strategies for UASs (Uninhabited Aerial Systems) Mission Planning and Re-Planning. In The 26th Congress of ICAS and 8th AIAA ATIO; American Institute of Aeronautics and Astronautics: Reston, VA, USA, 2008. [Google Scholar]
  13. Yang, X.; Alvarez, L.M.; Bruggemann, T. A 3D Collision avoidance strategy for UAVs in a non-cooperative environment. J. Intell. Robot. Syst. 2013, 70, 315–327. [Google Scholar] [CrossRef]
  14. Sabatini, R.; Richardson, M.; Bartel, C.; Shaid, T.; Ramasamy, S. A Low-cost vision based navigation system for small size unmanned aerial vehicle applications. J. Aeronaut. Aerosp. Eng. 2013, 2. [Google Scholar] [CrossRef]
  15. Sanfourche, M.; Delaune, J.; Besnerais, G. Perception for UAV: Vision-based navigation and environment modeling. Aerosp. Lab J. 2012, 1–19. Available online: http://www.aerospacelab-journal.org/sites/www.aerospacelab-journal.org/files/AL04-04_1.pdf (accessed on 18 July 2018).
  16. Cappello, F.; Bijjahalli, S.; Ramasamy, S.; Sabatini, R. Aircraft dynamics model augmentation for RPAS navigation and guidance. J. Intell. Robot. Syst. 2017, 1–15. [Google Scholar] [CrossRef]
  17. Sabatini, R.; Moore, T.; Hill, C. GNSS avionics-based integrity augmentation for RPAS detect-and-avoid applications. In Proceedings of the Fourth Australasian Unmanned Systems Conference (ACUS 2014), Melbourne, Australia, 15–16 December 2014. [Google Scholar] [CrossRef]
  18. Sabatini, R.; Rodríguez, L.; Kaharkar, A.; Bartel, C.; Shaid, T.; Zammit-Mangion, D. Low-cost navigation and guidance systems for unmanned aerial vehicles—Part 2: Attitude determination and control. Annu. Navig. 2013, 20. [Google Scholar] [CrossRef]
  19. Cappello, F.; Ramasamy, S.; Sabatini, R. A low-cost and high performance navigation system for small RPAS applications. Aerosp. Sci. Technol. 2016, 58, 529–545. [Google Scholar] [CrossRef]
  20. Stephen, P.; Cook, S.P.; Brooks, D.; Cole, R.; Hackenberg, D.; Raska, V. Defining Well Clear for Unmanned Aircraft Systems. In AIAA Infotech@Aerospace; American Institute of Aeronautics and Astronautics: Reston, VA, USA, 2015. [Google Scholar] [CrossRef]
  21. Walker, D. FAA Position on Building Consensus Around the SaRP Well-Clear Definition; RTCA Inc.: Washington, DC, USA, 2014. [Google Scholar]
  22. Johnson, M.; Mueller, E.R.; Santiago, C. Characteristics of a well clear definition and alerting criteria for encounters between UAS and manned aircraft in class E airspace. In Proceedings of the 11th USA/Europe Air Traffic Management Research and Development Seminar (ATM2015), Lisbon, Portugal, 23–26 June 2015. [Google Scholar]
  23. Cone, A.C.; Thipphavong, D.P.; Lee, S.M.; Santiago, C.; Langley, N.; Jack, D.P.; Group, A.A.; Vincent, M.J.; Group, A.A.; Myer, R.R. UAS Well Clear Recovery against Non-Cooperative Intruders using Vertical Maneuvers. In Proceedings of the 17th AIAA Aviation Technology, Integration, and Operations Conference, Denver, CO, USA, 5–9 June 2017; pp. 1–17. [Google Scholar] [CrossRef]
  24. Monk, K.J.; Roberts, Z. Maintain and Regain Well Clear: Maneuver Guidance Designs for Pilots Performing the Detect-and-Avoid Task. In Proceedings of the 8th International Conference on Applied Human Factors and Ergonomics (AHFE 2017), Los Angeles, CA, USA, 17–21 July 2017. [Google Scholar]
  25. Syd Ali, B.; Majumdar, A.; Ochieng, W.Y.; Schuster, W.; Chiew, T.K. A causal factors analysis of aircraft incidents due to radar limitations: The Norway case study. J. Air Transp. Manag. 2015, 44–45, 103–109. [Google Scholar] [CrossRef]
  26. Hammer, J.; Calgaris, G.; Llobet, M. Safety analysis methodology for ADS-B based surveillance applications. In Proceedings of the 7th USA/Europe Air Traffic Management Research and Development Seminar, Barcelona, Spain, 2–5 July 2007; pp. 1–11. [Google Scholar]
  27. Ali, B.S.; Ochieng, W.Y.; Zainudin, R. An analysis and model for Automatic Dependent Surveillance Broadcast (ADS-B) continuity. GPS Solut. 2017, 1–14. [Google Scholar] [CrossRef]
  28. Ali, B.S.; Ochieng, W.; Majumdar, A.; Schuster, W.; Kian Chiew, T. ADS-B system failure modes and models. J. Navig. 2014, 67, 995–1017. [Google Scholar] [CrossRef]
  29. Syd Ali, B.; Schuster, W.; Ochieng, W.; Majumdar, A. Analysis of anomalies in ADS-B and its GPS data. GPS Solut. 2016, 20, 429–438. [Google Scholar] [CrossRef]
  30. Semke, W.; Allen, N.; Tabassum, A.; McCrink, M.; Moallemi, M.; Snyder, K.; Arnold, E.; Stott, D.; Wing, M. Analysis of radar and ADS-B influences on aircraft detect and avoid (DAA) systems. Aerospace 2017, 4, 49. [Google Scholar] [CrossRef]
  31. Allen, N.; Tabassum, A.; Semke, W. Data abnormalities and drop outs in North Dakota air traffic control radar. In Proceedings of the 2017 IEEE/AIAA 36th Digital Avionics Systems Conference (DASC), St. Petersburg, FL, USA, 16–21 September 2017; pp. 1–9. [Google Scholar]
  32. Tabassum, A.; Allen, N.; Semke, W. ADS-B message contents evaluation and breakdown of anomalies. In Proceedings of the 2017 IEEE/AIAA 36th Digital Avionics Systems Conference (DASC), St. Petersburg, FL, USA, 16–21 September 2017; pp. 1–8. [Google Scholar]
  33. Tabassum, A.; Semke, W. UAT ADS-B data anomalies and the effect of flight parameters on dropout occurrences. Data 2018, 3, 19. [Google Scholar] [CrossRef]
  34. Billingsley, T.B. Safety Analysis of TCAS on Global Hawk Using Airspace Encounter Models; Massachusetts Institute of Technology: Cambridge, MA, USA, 2006. [Google Scholar]
  35. Federal Aviation Administration (FAA). Evaluation of Candidate Functions for Traffic Alert and Collision Avoidance System II (TCAS II) On Unmanned Aircraft System (UAS); FAA: Washington, DC, USA, 2011.
  36. MITRE System Safety Study of Minimum TCAS II; Federal Aviation Administration: Washington, DC, USA, 1983; 376p.
  37. Ali, B.S.; Ochieng, W.Y.; Majumdar, A. ADS-B: Probabilistic safety assessment. J. Navig. 2017, 70, 887–906. [Google Scholar] [CrossRef]
  38. Snyder, K. UAS Surveillance Criticality Final Report; Federal Aviation Administration: Washington, DC, USA, 2016.
  39. Lum, C.W.; Waggoner, B. A Risk Based Paradigm and Model for Unmanned Aerial Systems in the National Airspace. In Proceedings of the 2011 Infotech@Aerospace Conference, St. Louis, MI, USA, 29–31 March 2011. [Google Scholar]
  40. Melnyk, R.; Schrage, D.; Volovoi, V.; Jimenez, H. Sense and avoid requirements for unmanned aircraft systems using a target level of safety approach. Risk Anal. 2014, 34, 1894–1906. [Google Scholar] [CrossRef] [PubMed]
  41. Nusbaumer, O. Introduction to Probabilistic Safety Assessments (PSA); Leibstadt NPP: Leibstadt, Switzerland, 2017. [Google Scholar]
  42. Ramasamy, S.; Sabatini, R.; Gardi, A. A unified approach to separation assurance and collision avoidance for flight management systems. In Proceedings of the 2016 IEEE/AIAA 35th Digital Avionics Systems Conference (DASC), Sacramento, CA, USA, 25–29 September 2016; pp. 1–8. [Google Scholar]
  43. Ramasamy, S.; Sabatini, R.; Gardi, A. A unified analytical framework for aircraft separation assurance and UAS sense-and-avoid. J. Intell. Robot. Syst. Theory Appl. 2017, 1–20. [Google Scholar] [CrossRef]
  44. Orlando, V.A. The Mode S Beacon Radar System. Linc. Lab. J. 1989, 2, 345–362. [Google Scholar]
  45. International Civil Aviation Organization (ICAO). Airborne Collision Avoidance System (ACAS) Manual; ICAO: Montreal, QC, Canada, 2006. [Google Scholar]
  46. Guidance Material on Comparison of Surveillance Technologies (GMST); International Civil Aviation Organization Asia and Pacific: Bangkok, Thailand, 2007.
  47. Sabatini, R.; Moore, T.; Hill, C. A New Avionics-Based GNSS Integrity Augmentation System: Part 1—Fundamentals. J. Navig. 2013, 66, 363–384. [Google Scholar] [CrossRef]
  48. Sabatini, R.; Moore, T.; Hill, C. A New Avionics-Based GNSS Integrity Augmentation System: Part 2—Integrity flags. J. Navig. 2013, 66, 501–522. [Google Scholar] [CrossRef]
  49. RTCA-SC-228 Draft Detect and Avoid (DAA) Minimum Operational Performance Standards for Verification and Validation; NASA: Washington, DC, USA, 2015.
  50. Sabatini, R.; Gardi, A.; Richardson, M.A. LIDAR Obstacle Warning and Avoidance System for Unmanned Aircraft. Aerosp. Sci. Technol. 2016, 55, 344–358. [Google Scholar]
  51. RTCA. SC-228, Minimum Operational Performance Standards for Unmanned Aircraft Systems. Available online: https://www.rtca.org/content/sc-228 (accessed on 22 July 2018).
  52. Wide Area Multilateration Report on EATMP TRS 131/04 Version 1.1; National Aerospace Laboratory (NLR): Amsterdam, The Netherlands, 2005.
  53. Bromberg, B.G.; Hill, R.D. Reliability of airborne electronic components. Proc. IRE 1953, 41, 513–516. [Google Scholar] [CrossRef]
  54. Final Report for Software Service History and Airborne Electronic Hardware Service Experience in Airborne Systems; Federal Aviation Administration: Washington, DC, USA, 2016.
  55. Kornecki, A.; Liu, M. Fault tree analysis for safety/security verification in aviation software. Electronics 2013, 2, 41–56. [Google Scholar] [CrossRef]
  56. Technical Standard Order: Detect and Avoid (DAA) Systems; FAA TSO-C211; Federal Aviation Administration: Washington, DC, USA, 2017.
  57. Isograph. Fault Tree Analysis Software. Available online: https://www.isograph.com/software/reliability-workbench/fault-tree-analysis-software/ (accessed on 18 July 2018).
  58. Stott, J.E.; Britton, P.T.; Ring, R.W.; Hark, F.; Hatfield, G.S. Common Cause Failure Modeling: Aerospace vs. Nuclear. Available online: https://ntrs.nasa.gov/archive/nasa/casi.ntrs.nasa.gov/20100025991.pdf (accessed on 18 July 2018).
  59. Sun, W. Determination of Beta-factors for Safety Instrumented Systems. Master’s Thesis, Norwegian University of Science and Technology, Trondheim, Norway, June 2013. [Google Scholar]
  60. Amjad, Q.M.N.; Zubair, M.; Heo, G. Modeling of common cause failures (CCFs) by using beta factor parametric model. In Proceedings of the 2014 International Conference on Energy Systems and Policies (ICESP), Islamabad, Pakistan, 24–26 November 2014. [Google Scholar] [CrossRef]
  61. European Organisation for the Safety of Air Navigation. Generic Safety Assessment for ATC Surveillance Using Wide Area Multilateration; Edition Number: 5.0; EUROCONTROL: Brussels, Belgium, 2008. [Google Scholar]
  62. Technical Standard Order; TSO-C212; Federal Aviation Administration: Washington, DC, USA, 2017.
  63. Kritzinger, D. Aircraft System Safety: Assessments for Initial Airworthiness Certification; Woodhead Publishing: Cambridge, UK, 2016; ISBN 0081009321. [Google Scholar]
  64. Martin Marietta Aerospace. Laser Reliability Prediction; National Technical Information Service: Springfield, VA, USA, 1975.
  65. Federal Aviation Administration (FAA). FAA System Safety Handbook, Chapter 3: Principles of System Safety; FAA: Washington, DC, USA, 2000.
  66. Gomez Cobo, A. Importance Measures. In Proceedings of the Workshop on “PSA Applications”, Sofia, Bulgaria, 7–11 October 1996; pp. 17–27. [Google Scholar]
  67. RTCA Minimum Aviation System Performance Standards for Automatic Dependent Surveillance Broadcast (ADS-B); RTCA, Inc: Washington, DC, USA, 2006.
  68. Federal Aviation Administration. General Aviation ADS-B Rebate Program—Frequently Asked Questions. Available online: https://www.faa.gov/nextgen/equipadsb/rebate/faq/ (accessed on 18 May 2018).
  69. Kistan, T.; Gardi, A.; Sabatini, R. Machine learning and cognitive ergonomics in air traffic management: Recent developments and considerations for certification. Aerospace 2018, 5, 103. [Google Scholar] [CrossRef]
  70. Batuwangala, E.; Kistan, T.; Gardi, A.; Sabatini, R. Feature article: Certification challenges for next-generation avionics and air traffic management systems. IEEE Aerosp. Electron. Syst. Mag. 2018, 33, 44–53. [Google Scholar] [CrossRef]
Figure 1. Conceptual high-level detect and avoid (DAA) system architecture adapted from [43].
Aerospace 06 00019 g001
Figure 2. Conceptual depiction of the proposed DAA approach (single aerial encounter).
Aerospace 06 00019 g002
Figure 3. Simplified schematic diagram of the overall DAA system architecture.
Aerospace 06 00019 g003
Figure 4. Top-level data flow diagram showing the dependencies between onboard navigation and surveillance systems.
Aerospace 06 00019 g004
Figure 5. Fault tree for failure in DAA capability. The failure subtrees for DAA 1A and DAA 2 are detailed in the following figures.
Aerospace 06 00019 g005
Figure 6. Fault subtree for cooperative surveillance (traffic detection).
Aerospace 06 00019 g006
Figure 7. Fault subtree for non-cooperative surveillance.
Aerospace 06 00019 g007
Figure 8. Fault subtree for cooperative surveillance (ownship locatability). The subtrees for failure in automatic dependent surveillance-broadcast (ADS-B) Out and failure in Mode S surveillance are presented in the following figures.
Aerospace 06 00019 g008
Figure 9. Fault subtree for ADS-B Out system.
Aerospace 06 00019 g009
Figure 10. Fault subtree for the loss of Global Positioning System (GPS) data, partially adopted from [37].
Aerospace 06 00019 g010
Figure 11. Fault subtree for misleading navigation information.
Aerospace 06 00019 g011
Figure 12. Fault subtree for Mode S failure.
Aerospace 06 00019 g012
Figure 13. Two-way approach to certification.
Aerospace 06 00019 g013
Table 1. Fault tree symbols used in this study and their significance.
SymbolNameSignificance
Aerospace 06 00019 i001Basic EventAn initiating event to which reliability model is associated.
Aerospace 06 00019 i002Undeveloped EventAn event that cannot be developed further or for which the reliability data cannot be found.
Aerospace 06 00019 i003TransferIndicates a transfer continuation to a subtree.
Aerospace 06 00019 i004AND GateIndicates the occurrence of all the input events cause the output event to occur.
Aerospace 06 00019 i005OR GateIndicates the occurrence of either input event causes the output event to occur.
k out of n
Aerospace 06 00019 i005
VOTING OR GateIndicates the output event occurs if a certain number of the input events occur.
Table 2. Failure probability associated to the basic events.
Basic EventsDescriptionFailure Probability, q
DAA 3AData Processing Failure 1 × 10 13 as in [61]
DAA 3BTrack Evaluation Failure 1 × 10 13 as in [61]
DAA 4Execution Function Failure 1 × 10 6 as in [49]
DAA 5ACommand Datalink Failure (Loss of Function) 1 × 10 6 as in [49]
DAA 5BCommand Datalink Failure (Unannounciated Failure) 1 × 10 7 as in [49]
AS 1/TC-3/AO 3A /AO 3B/MS-3Transponder Failure (Main/Backup) 1 × 10 4 as in [61]
AS 2/MS-2Misleading Information from Mode S Function 1 × 10 5 as in [38]
AI 1Failure in ADS-B In Receiver 1 × 10 4 as in [37]
AI 2Failure in Report Assembly Module 1 × 10 7 as in [37]
AI 3/AO 2Loss of Function of ADS-B System 1 × 10 5 as in [38]
TC 1Failure in Radio Altimeter 1 × 10 4 as in [38]
TC 2Failure in Traffic Collison Avoidance System (TCAS) Function 1 × 10 5 as in [36]
AAR 1Air-to-Air Radar (Loss of Function) 1 × 10 7 as in [62]
AAR 2Air-to-Air Radar (Unannounciated Function) 1 × 10 6 as in [62]
VS 1Electronics Failure 1 × 10 7 as in [63]
VS 2Optical Failure 1 × 10 6 as in [64]
VS 3Vision Logic Failure (Data processing failure) 1 × 10 13 as in [61]
AO 4Misleading Information from ADS-B Function 1 × 10 5 as in [38]
AO 6Transponder Jamming 1 × 10 13 as in [37]
AO 1ALoss of Geometry from Satellite 1 × 10 8 as in [37]
AO 1BGPS Receiver Malfunction 1 × 10 4 as in [37]
AO 1CGPS Antenna Failure 1 × 10 4 as in [37]
AO 1DJamming of Satellite 1 × 10 13 as in [37]
AO 1ESatellite Failure 1 × 10 13 as in [37]
AO 5AI/AO 5AIIHorizontal Position Error (Latitude/Longitude) 1 × 10 5 as in [38]
AO 5BIMisleading Information from Barometric Altimeter 1 × 10 9 as in [63]
AO 5BIIGPS Vertical Error 1 × 10 5 as in [38]
MS 1Failure in Barometric Altimeter 1.1 × 10 7 as in [63]
Note: the acronyms used in the Basic Events column are defined in Figure 5, Figure 6, Figure 7, Figure 8, Figure 9, Figure 10, Figure 11 and Figure 12.
Table 3. Result summary for DAA capability fault tree analysis (FTA) as per Figure 5.
FunctionFailure ProbabilityOperational Availability
Failure in Cooperative System (Traffic Detection Function), DAA 1 5.056 × 10 6 0.999994944
Failure in Non-cooperative Surveillance System, DAA 2 2.2 × 10 6 0.9999978
Command Datalink Failure, DAA 5 1.1 × 10 6 0.9999989
Execution Function Failure, DAA 4 1 × 10 6 0.999999
Evaluation Function Failure, DAA 3 2 × 10 13 ~1
Table 4. Result summary for the cooperative surveillance (traffic detection function) FTA as per Figure 6.
FunctionFailure ProbabilityOperational Availability
Failure in Active Surveillance System, AS0.000110.99989
Failure in ADS-B In, AS0.00011010.9998899
Failure in TCAS system, TC0.000210.99979
Table 5. Result summary for the non-cooperative surveillance FTA as per Figure 7.
FunctionFailure ProbabilityOperational Availability
Failure in Air-to-Air Radar, DAA 2A 1.1 × 10 6 0.9999989
Failure in Vision Based Sensor, DAA 2B 1.1 × 10 6 0.9999989
Table 6. Result summary for ADS-B Out system FTA as per Figure 8.
FunctionFailure ProbabilityOperational Availability
Failure in Active Surveillance, MS0.00036010.9996399
Failure in ADS-B Out, AO0.000250.99975
Note: the acronyms MS and AO are consistent with Figure 5, Figure 6, Figure 7, Figure 8, Figure 9, Figure 10, Figure 11 and Figure 12 and Table 2.
Table 7. Risk measure and importance analysis for the DAA capability FTA as per Figure 5.
EventsF–VRRWRAW
DAA 10.54042.176 1.069 × 10 4
DAA 20.23511.307 1.069 × 10 4
DAA 3 2.683 × 10 8 1 1.069 × 10 4
DAA 40.10691.12 1.069 × 10 4
DAA 50.111.133 1.069 × 10 4
Table 8. Risk measure and importance analysis for the ADS-B Out System FTA as per Figure 8.
EventsF–VRRWRAW
MS0.69423.12 1.341 × 10 4
AO0.30582.211 1.341 × 10 4
Note: the acronyms MS and AO are consistent with Figure 5, Figure 6, Figure 7, Figure 8, Figure 9, Figure 10, Figure 11 and Figure 12 and Table 2.

