Article

Bowtie Methodology for Risk Analysis of Visual Borescope Inspection during Aircraft Engine Maintenance

Department of Mechanical Engineering, University of Canterbury, Christchurch 8041, New Zealand
*
Author to whom correspondence should be addressed.
Aerospace 2019, 6(10), 110; https://doi.org/10.3390/aerospace6100110
Submission received: 5 July 2019 / Revised: 24 September 2019 / Accepted: 24 September 2019 / Published: 2 October 2019
(This article belongs to the Special Issue Civil and Military Airworthiness: Recent Developments and Challenges)

Abstract

:
Background—The inspection of aircraft parts is critical, as a defective part has many potentially adverse consequences. Faulty parts can initiate a system failure on an aircraft, which can lead to aircraft mishap if not well managed and has the potential to cause fatalities and serious injuries of passengers and crew. Hence, there is value in better understanding the risks in visual inspection during aircraft maintenance. Purpose—This paper identifies the risks inherent in visual inspection tasks during aircraft engine maintenance and how it differs from aircraft operations. Method—A Bowtie analysis was performed, and potential hazards, threats, consequences, and barriers were identified based on semi-structured interviews with industry experts and researchers’ insights gained by observation of the inspection activities. Findings—The Bowtie diagram for visual inspection in engine maintenance identifies new consequences in the maintenance context. It provides a new understanding of the importance of certain controls in the workflow. Originality—This work adapts the Bowtie analysis to provide a risk assessment of the borescope inspection activity on aircraft maintenance tasks, which was otherwise not shown in the literature. The consequences for maintenance are also different compared to flight operations, in the way operational economics are included.

1. Introduction

The inspection of parts is critical to the safety and quality of aerospace hardware. There is value in better understanding the risks of the inspection process itself. The inappropriate diagnosis of part condition may have significant engineering, cost, and safety implications.
Understanding and controlling inspection risks is an important component of the organisational risk management process. A method with particular relevance to procedural risks is the Bowtie analysis. Bowtie analysis was first applied to accident investigation in the oil and gas industry, and was quickly applied to other high-reliability organisations (HROs) including aviation, mining, and nuclear energy [1,2].
The risk assessment approach is named Bowtie, due to the diagram’s distinctive shape, reminiscent of the dress bowtie [1]. The diagram is a combination of a fault tree analysis (FTA), event tree analysis (ETA), and barrier analysis (BA) [3]. Hence, the Bowtie is also known as a barrier diagram.
In recent years, Bowtie was increasingly adopted by other industries after the benefits of the method were recognised. Today, Bowtie is applied to several industries including oil and gas [1,4], aviation [5,6,7,8], chemical [9,10], defence [11], banking [12], healthcare [2,13], marine [14], mining [1,15], nuclear energy [16], transportation [17,18], and road safety [19].
The current paper extends the Bowtie method to visual inspection tasks during aircraft engine maintenance, repair, and overhaul (MRO). This is worth doing because the existing MRO processes tend to be arranged around conventional notions of manufacturing quality such as standardised work procedures. Nonetheless, it is impossible to standardise all processes; there is always an element of personal approach to the work and, hence, variability. This is especially evident where workers are required to exercise judgement in the inspection processes, e.g., deciding whether or not to scrap a turbine blade. There are a variety of human errors that may occur, along the lines of slips, lapses, mistakes, and violations [20]. Consequently, there is a need to find ways to create in workers an awareness of the critical factors that contribute to success and failure of the aerospace hardware. A similar issue arises in other areas of aerospace, especially commercial aircraft operations where standard procedures exist, and are further supplemented by Bowtie analysis for training purposes. In the same way, there is value in developing Bowtie models for MRO, to assist in training workers and sensitising them to the consequences of their work.
Borescope inspection was chosen as the particular situation under examination, as it is one of the main means of defect detection in aircraft engine maintenance. Defects that stay undetected have the potential to cause severe damage to the engine or aircraft, and result in accidents and fatalities [21]. The reliable assessment of part condition is essential. It is crucial to understand risks associated with the inspection process, as well as the barriers that can prevent or recover the outcomes. A better understanding and targeted management of those risks has the potential to contribute towards improved airworthiness and aviation safety.

2. Review of the Bowtie Method

2.1. Historical Origins

The exact origin of the Bowtie remains to be fully clarified, but it was first mentioned in 1979 in the lecture notes of a hazard analysis class presented by Imperial Chemical Industries at the University of Queensland, Australia [22]. It is accepted that the first company to integrate the Bowtie method as a risk management tool was the Royal Dutch Shell Group in the early 1990s in response to the Piper Alpha oil and gas platform explosion in the North Sea (1988) and after the introduction of the Seveso Directive [23,24,25]. This new risk analysis and assessment approach was developed as the main component of the “hazard, effect, and management process” (HEMP) and was communicated internally by Shell as a “Bowtie diagram” [25].
The Seveso Directive used a “methodology for the identification of major accident hazards” (MIMAH) to investigate the disaster of accidental toxic dioxin release in Seveso, Italy (1976). Bowtie was used as the basis for the MIMAH methodology. A major achievement of the Seveso Directive includes legislations by the European Union to prevent major accidents and to limit their outcomes [2,26,27].

2.2. Methodological Parents

There were different preceding risk assessment methods that provided the context for the Bowtie to emerge, namely, fault tree analysis (FTA), event tree analysis (ETA), cause consequence analysis (CCA), and barrier analysis (BA) [1].

2.2.1. Fault Tree Analysis

The fault tree analysis as a method has two applications. Most commonly, it is used during the system design and development stage to predict and prevent future problems. The second application of FTA is for accident investigation, whereby FTA helps to identify and analyse the root-causes contributing through different failure paths to the critical event, which is often referred to as the “top event” (loss of control or failure) [28]. Probabilities can be assigned to the causes, and the top event probability can be computed by employing Boolean logic, which allows the FTA to be quantified [1,29].
This method was developed by Bell Laboratories in 1962 for the United States (US) Air Force to determine the reliability of the intercontinental Minuteman missile launch control system [30,31]. Later, Boeing adopted, improved, and applied the method for civil aircraft design and for hazard identification. Today the fault tree analysis is used to analyse high-hazard safety systems in nuclear power plants, aerospace, and defence [32].
The key benefit of FTA is the graphical representation of complex relationships between various failure paths and combinations of possible outcomes [33]. The structured and logical approach enables quantification of all possible root-causes. Another benefit of the FTA is that it may be used to predict future failures, and also to diagnose past failures. However, the limitations include the difficulty of quantifying probabilities, inaccuracy in case of scarce or insufficient data, uncertainty in covering all failure modes, and incorporating partial failures, including external environmental effects, and including human behavioural effects (procedures and human error) [33,34].

2.2.2. Event Tree Analysis

It is understood that event trees were developed during the WASH-1400 nuclear power plant safety study (around 1974) as a condensed, alternative diagram to fault trees, as using the latter would have led to very large and cumbersome diagrams [35].
While fault trees that start with identifying causes lead to the top event, event trees, in contrast, take a single initial event (top event) and analyse all possible system failure paths leading to consequences caused by the initiating event. A probability can be assigned to each path and, thus, the probability of different consequences can be calculated, which makes the method qualitatively applicable. The risk calculation can be done before an accident to determine possible consequences or after an accident for investigation purposes to identify functional failures of the system. Typical applications of event trees are transportation and nuclear power plants [29,36].
Similar to the FTA, the benefits of the ETA lie in the graphical representation of the failures and the sequence of events. Multiple failure paths can be analysed, and cause–effect relationships can be displayed with their dependencies expressed. Furthermore, it allows probability assessment and detection of insufficient countermeasures [33,37].
A limitation of the ETA is that it analyses only one initiation event at a time. Hence, it is not an effective method when multiple events must occur simultaneously, as it would result in redundant branches. Since the ETA uses binary logic, it is difficult to represent situations with uncertainties such as human or environmental factors. Complex events can be expressed, but they lead to massive and highly complex diagrams. At the same time, simplifying the diagram can lead to missed subtle dependencies [33,38].

2.2.3. Cause Consequence Analysis

The cause consequence analysis was developed in 1971 at Riso Laboratories in Denmark, to reveal accidents in complex nuclear installations [39]. It connects the causes and consequences through a so-called “critical or top event”, combining two diagrams. Firstly, a cause diagram leading to the top event is a traditional fault tree. Secondly, the consequence diagram is an event sequential diagram that tries to find potential outcomes of the top event [1,39]. The CCA aims to determine the probability of each consequence using FTA logic. It is recognised as the predecessor of the Bowtie method [40].
Among the benefits of the CCA are the visual presentation of complex cause–consequence relationships, the structured method for probability assessment, and the incorporation of system dependencies in the risk evaluation. Furthermore, it enables the representation of time-sequenced events and the analysis of multiple outcomes. A drawback of the CCA is that only one initiating event at a time can be evaluated [41]. Hence, several diagrams are needed when analysing multiple critical events. Since CCA uses a top-down approach, there is the risk that a high-level event or hazard is missed.

2.2.4. Barrier Analysis

Barrier analysis is a system safety assessment method to identify hazards and to evaluate any controls that can prevent the event occurring. The first application of systematic safety barriers was the hazard–barrier–target model developed by Haddon in 1973 [42]. The barrier approach was used to express means of control in systems with a hazardous energy source, which could potentially lead to damage to either equipment or personnel. Later, Reason introduced his Swiss-cheese metaphor (1990) [20]. This concept often has multiple barriers (cheese slices), such that, if one fails, the next one may stop the event. The holes in the slices symbolise the inherent ineffectiveness of the barriers. When the holes of all slices align, it is the moment when all barriers fail and the control of the situation is lost, and undesired consequences may occur [1,20,33,43].
Most recent, Sklet worked on barrier models and came up with a definition widely used by practitioners. He defines safety barriers as “physical and/or non-physical means planned to prevent, control, or mitigate undesired events or accidents” [44].
Even though the barrier concept is mainly qualitative, studies by Duijm and Goossens showed that barriers can be quantified by combining weighted factors and a rating system. Each barrier is then scored based on its safety performance measures, i.e., effectiveness, reliability, consistency, and other criteria [45].
Currently, BA is more broadly used for any process where a controlled state should be maintained, including areas of quality, safety, security, and health.
The BA is simple to understand as it visually represents the barriers that are in place, as well as the absence of any barrier which could have prevented or mitigated an undesired event to occur. The BA directly results in recommendations for where to implement additional barriers or to improve or maintain existing barriers.
A limitation of the original BA is its incomprehensiveness as a sole risk assessment tool, as it does not identify human errors and hardware failures that are not directly associated with hazardous energy sources [46]. However, it can be easily combined with other methods.
The BA may lead to linear thinking and is, therefore, highly subjective, which makes it difficult to reproduce, in particular, for non-obvious and complex causes, as there is a risk of confusing causes and countermeasures (barriers).

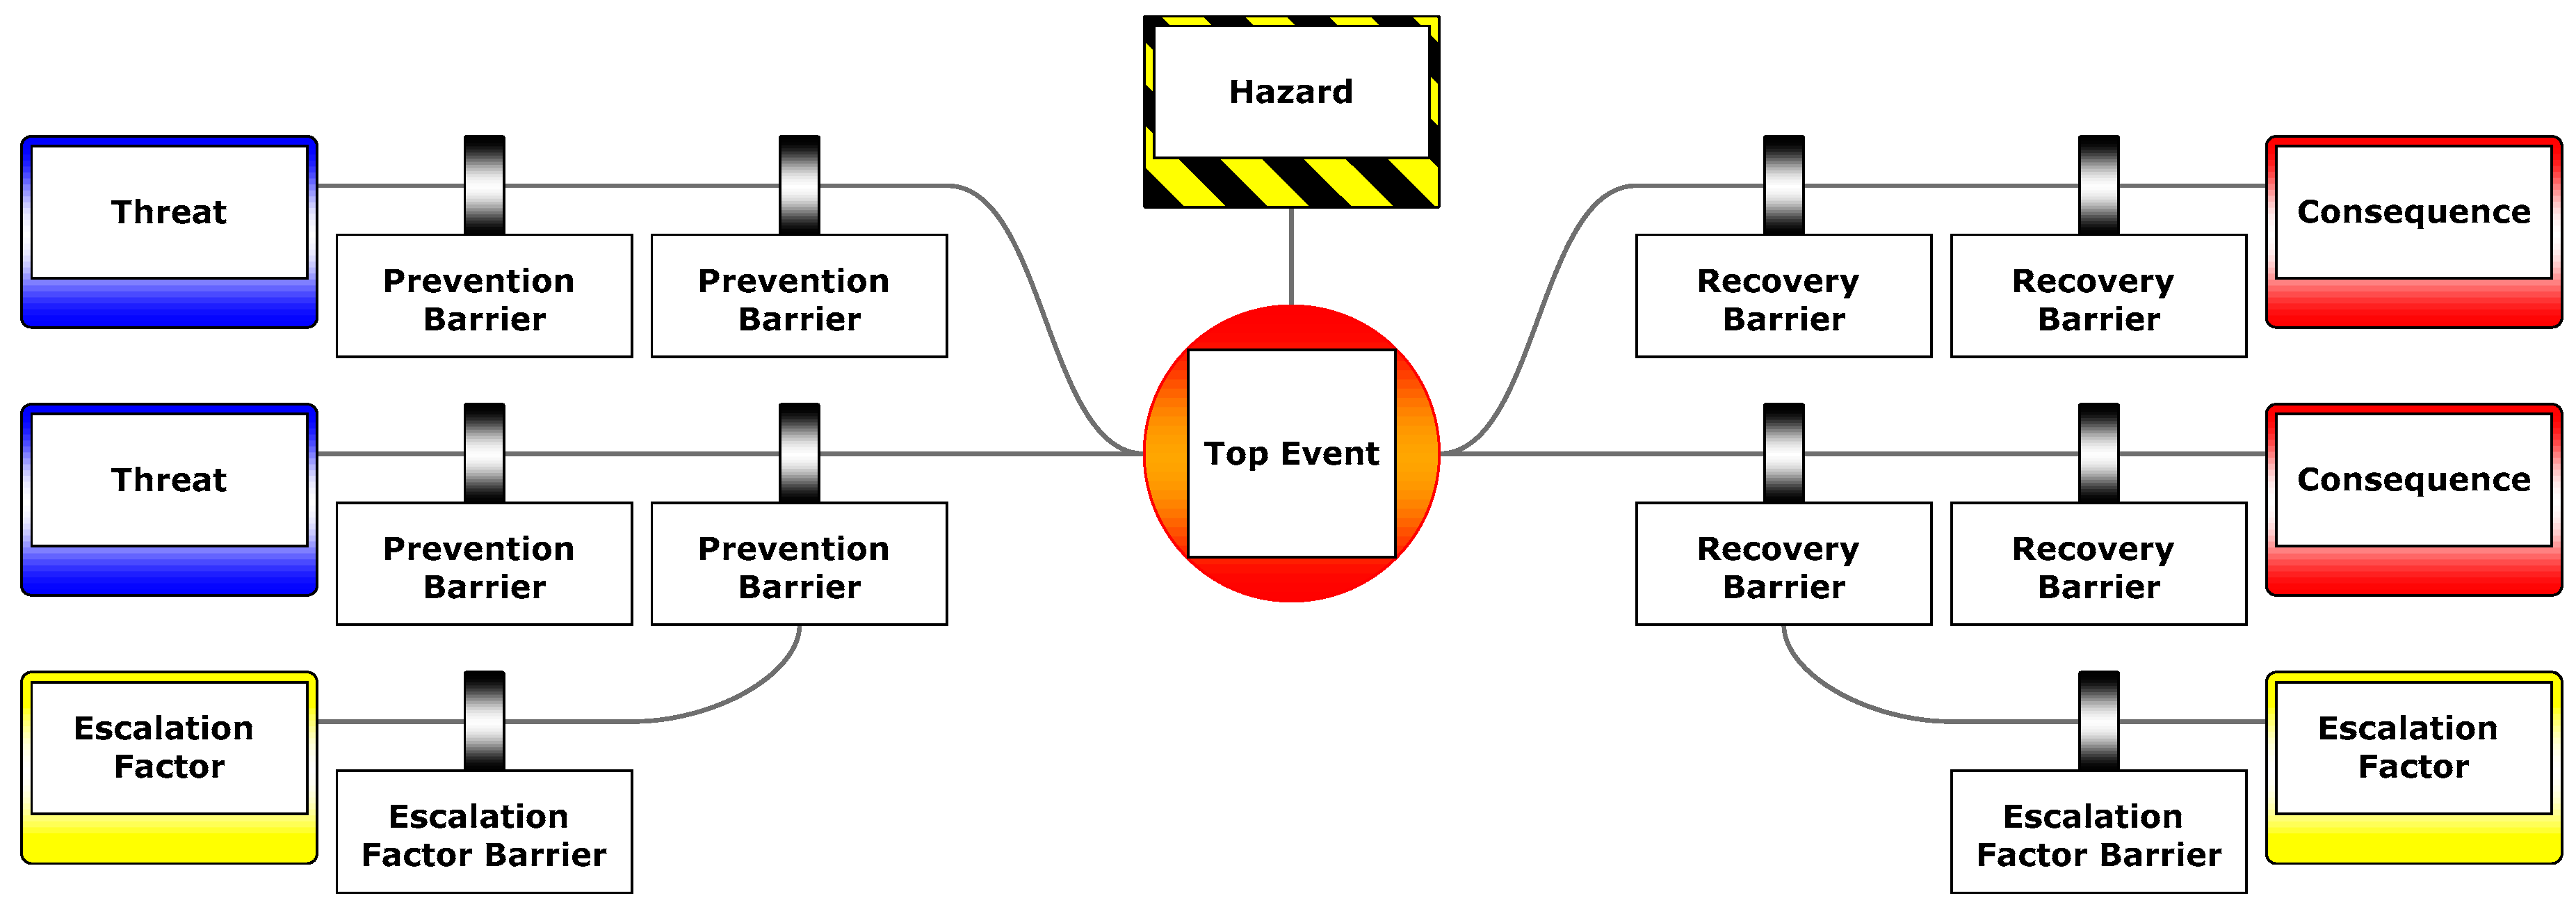
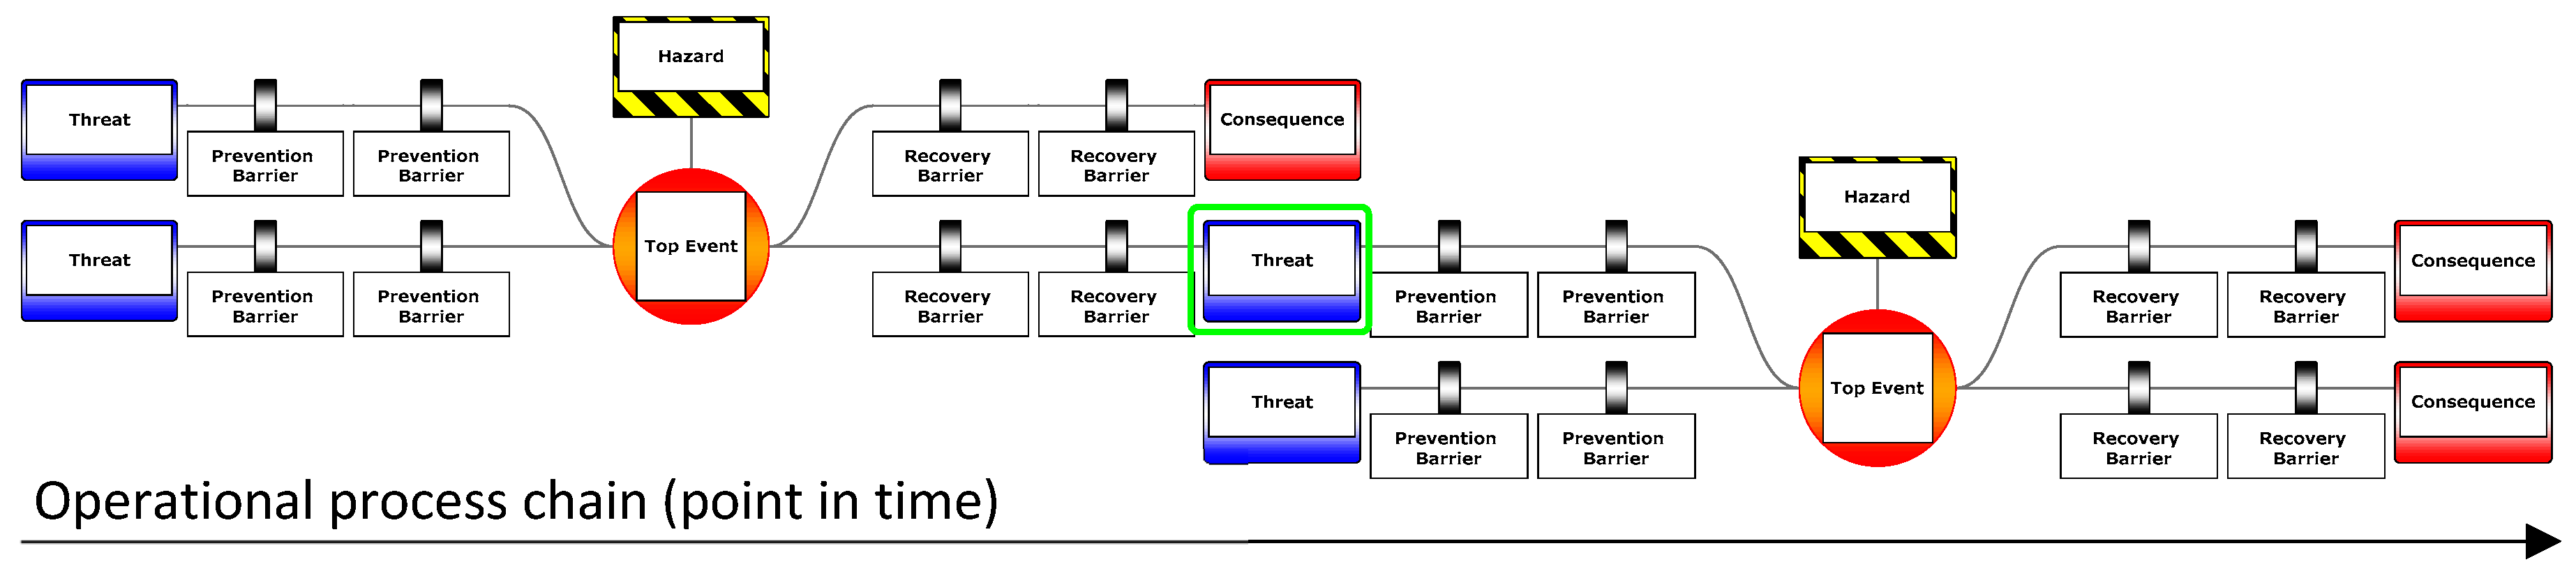
2.3. Principles of Bowtie Analysis

The Bowtie method combines features of the above methods. It includes a simplified FTA and ETA, without the logic symbols, and combines them based on the CCA approach, through single cause–consequence relationships. The functional blocks of these other methods are replaced with barriers, which are placed on both sides of the diagram to prevent or mitigate any undesired outcomes. The structure is laid out horizontally, whereas those other charts are vertical, and this results in the characteristic shape with the central knot and, hence, the Bowtie name.
There is no standardised terminology for the different elements of a Bowtie, which often causes confusion. The definitions below originate from the United Kingdom Civil Aviation Authority (UK CAA), the European Aviation Safety Agency (EASA), and the Federal Aviation Administration (FAA) [5,6,7]. This coincides with the terminology used by Shell, where the method was first applied [23].
Hazard: A hazard is defined as condition, object, or activity that can potentially cause harm or damage, including injuries to personnel, damage to equipment, properties, or environment, or reduced ability to perform an action as intended.
Top Event: The top event is the moment when the controlled state of a hazard is lost. It is yet to cause any damage or negative impact, but can lead to undesired outcomes if all prevention barriers fail. The term “top event” is derived from the fault tree analysis, where the critical event is on the top.
Threats: Threats describe initiating events that can potentially cause, through several pathways, the occurrence of the identified top event if all safety barriers fail. There can be one or multiple threats leading to the top event.
Consequences: Consequences are potential outcomes or a chain of outcomes resulting from the release of the top event, directly resulting in loss of control or damage if all mitigation barriers fail.
Barriers: Barriers, which are also called controls or layers of protection, are measures that prevent or mitigate undesired outcomes or reduce the likelihood of their occurrence, as well as maintaining the desired state. Derived from the fault tree and event tree analysis, the barriers can be categorised based on their location in the Bowtie diagram and their function. Prevention barriers are located on the left side of the Bowtie diagram, between the threat and top event. They eliminate the threat entirely or prevent the top event from occurring and, consequently, they prevent the hazard from being released. When the top event is reached, mitigation barriers become effective and reduce the likelihood of the consequences to occur, or limit the severity of the undesired consequences [10,13,47]. These barriers are located between the top event and the consequences.
Escalation Factors and Escalation Factor Barriers: Safety barriers are not 100% effective, as well as having inherent and temporary weaknesses. In Bowtie, the conditions influencing the effectiveness are called escalation factors [47], degradation factors [48], or barrier decay mechanisms [49], and are depicted using branches from the main path barrier. Once the escalation factors are determined, the next step is to identify barriers that are in place to manage the escalation factors. Those barriers are called escalation factor barriers or degradation factor safeguards [48]. In the Bowtie diagram, those barriers are placed between the escalation factor and the affected barrier on the main threat path.
Figure 1 shows the schematic structure of a Bowtie diagram with all elements.

3. Methodology

3.1. Purpose

The purpose of this research was to identify the risks occurring in visual inspection tasks during aircraft engine maintenance in an MRO environment. This is a very different situation to aircraft operations, and, while there is substantial literature including Bowtie analysis for operations [5,6,7,8], there is a paucity for MRO applications. The questions that arose include how the Bowtie analysis could be used in aviation maintenance, and what the difference of Bowtie is in aircraft operation. In particular, there is a need for understanding the multiple factors that influence the visual inspection and how those can be controlled by prevention. Furthermore, it is crucial to understand the consequences that can occur and how these can be mitigated in the case of the top event release. This goes beyond the most obvious worst-case scenarios, i.e., incidents, accidents, and fatalities.
It should be noted that Bowtie analysis and diagrams vary depending on the area under investigation and the target audience. Where operations are complex, it can be helpful to divide work streams into smaller pieces and perform risk analysis for each individually. Bowtie analysis is typically performed for a specific, usually critical, step in a complex operation chain. However, since all the process steps are linked together, Bowties can also be linked together. In BowtieXP this is realised by chaining Bowties to represent the full operation and process chain. In this context, it is important to understand that a Bowtie element can be both a threat and a consequence at the same time, depending on the operational environment the risk analysis is performed. For example, a consequence in the manufacturing environment (e.g., a defective part) can be a threat in the subsequent maintenance Bowtie diagram. A generic Bowtie chain is shown in Figure 2, and the common element is highlighted. In this research, the Bowtie diagrams were created for the MRO environment only and were not chained together.
The specific case under examination is borescope inspection, particularly the impact of hardware factors. Borescope inspection is a technique to visually inspect the inside of an aircraft engine, while avoiding a costly tear-down. It enables the evaluation of engine parts for their airworthiness and operability, which is critical for aircraft reliability and safety. The borescope tool is an optical instrument with a built-in camera and light source, which displays the image live on a screen. The borescope inspection occurs either with the engine on the wing, or when the engine is first presented to the MRO. The latter is called an induction inspection. There is also a post-test borescope inspection that occurs after re-assembly and testing as a last step before returning the engine to the aircraft.

3.2. Approach

The specific industry under observation was the Christchurch Engine Centre (CHCEC). This is an MRO facility with 470 staff, maintaining over 140 IAE V2500 engines per year. The borescope inspection tasks were not limited to in-house induction and post-test inspection, but also included on-wing inspection at the customer’s premises. Hence, inspectors had considerable experience.
Initially, we examined the open literature on Bowties applied to visual inspection and aviation maintenance in general. However, nothing relevant was found; hence, it was necessary to start from scratch. Our approach was based on the “AS9110 Quality Maintenance Systems—Requirements for Maintenance Organizations” standard [50]. Firstly, the hazard and top event were identified. We framed this in terms of the worker perspective, specifically wording it in such a way as to be aligned with the role, and recruiting personal motivation and pride in workmanship. We did this because the primary audience for the Bowtie is the worker. Hence, the top event was “inappropriate diagnosis of part condition”.
We then identified the consequences in the MRO environment. These are not identical to the aircraft operation perspective. Next, we constructed the threat branches and added prevention barriers. Subsequently, escalation factors and escalation factor barriers were added.
These constructions were based on discussion with 15 aircraft maintenance technicians (AMTs) and through observation of their activities. Three AMTs had up to 10 years work experience in the field, seven had more than 10 years, and five had more than 20 years. Their certifications ranged from non-destructive testing (NDT) operator to borescope operator and borescope video reviewer. The barriers of the main threat paths and the escalation path were inferred based on engineering knowledge. This part of the process was consistent with the approach suggested by Lewis [51]. Threats and consequences were identified by the individual AMTs, recorded in field notes by the researcher, and subsequently grouped into the various categories shown in the results. The Bowties were constructed using BowTieXP software revision 9.2.13 [52].
We then validated the Bowties by discussing them with the most experienced inspection expert at our industry partner (borescope operator with level 2 certification, which is the highest certification available in the field). A consensus was reached on the structure of each Bowtie.

4. Results

4.1. Identification of Top Event

The top event that was identified in the Bowtie analysis was “inappropriate diagnosis of part condition”. For further explanation of the top event, borescope inspection for engine blade defects was used as a specific example. Safety critical defects include cracks, nicks, dents, tears, etc. [21].
There are several scenarios that could lead to an inappropriate diagnosis of the part condition. These include the following:
  • Defect missed: If the inspector misses a defect that exceeds the tolerance limits. In the terminology of the confusion matrix, this is known as a true negative.
  • Defect falsely detected: The inspector finds something and declares it as defective despite it being within the tolerance level or detecting a non-existent defect. This is called a false positive as it was incorrectly rejected. For example, deposit on an airfoil could be incorrectly identified as pitting or corrosion [21].
  • Indication mis-located: Engine blades are divided into multiple areas, so-called airfoil zones. Each zone has a different tolerance level in terms of the size of defect and the number of defects per blade or blade set (stage). A defect that is localised in zone B, which may be acceptable for the zone B tolerance, is not necessarily acceptable for zone A. Consequently, a blade that is incorrectly identified as airworthy could be released to service. In the contrary case, a defect is incorrectly identified as being unairworthy in zone A, while actually located in zone B and, hence, is scraped unnecessarily.
  • Defect forgotten before decision is made: This might happen when the inspector examines the full blade stage in one full run and later revisits the defective blades. If no marker is set or the inspector gets distracted for some reason, he might forget the defect and not go back to check.
It was found that the threats and prevention barriers, as well as the consequences and mitigation barriers, were nearly identical for all those scenarios. Hence, one combined Bowtie was developed instead of four duplicated ones, which only differed in the top event.

4.2. Consequences

Consequences are generally characterised by damage. While the Bowtie method is well established, existing applications in the aviation industry are focused on the aircraft operation and the “significant seven”. These describe a range of significant safety scenarios, namely, loss of control, runway excursion, controlled flight into terrain, runway incursion, airborne conflict, ground handling, and fire, which were analysed by CAA applying Bowtie [6,53]. The consequences for MRO, however, are somewhat different.
We identified that the consequences in the MRO context include not only the safety of the aircraft passengers and the potential for fatalities, but also the operational economics. These economic damages could affect the MRO service provider, the engine owner, or the airline. The identified economic and technical perspectives include the following:
  • Gate returns and air turn-backs;
  • Reputation damage;
  • Fines and litigations;
  • Reduced part lifetime;
  • Shortened cycle time;
  • Premature engine shop visit;
  • Financial loss;
  • Airworthy parts scrapped;
  • Release of an unairworthy part to service;
  • Severe damage to engine and/or aircraft;
  • Fatality, accident, incident.
It was noticed that consequences may appear in a chronological or procedural order and can be divided into immediate, subsequent, or final consequences. In this work, the immediate consequences for “inappropriate diagnosis of the part condition” were the “release of an unairworthy part into service” and “scrapping of an airworthy part” (Figure 3). The latter had only financial loss as a subsequent consequence, whereas the consequences for the release of an unairworthy part were much greater and included the examples shown in the list above. As the work stream under examination was “borescope inspection”, we made this the hazard label. This is because borescope can be an activity that can potentially cause harm or damage if not performed properly.
The Bowtie method cannot express this chronological consequence path and, hence, this could not be visualised with the BowtieXP software. We applied image editing software to modify the Bowtie diagram manually. The result is shown in Figure 4.

4.3. Threats

When evaluating the threats of incorrect diagnosis of the part condition, seven main threats arose. The Bowtie software allows one to add a description to each threat. However, this is not displayed in the diagram. Hence, we prepared the list shown in Table 1 below and added a short description with a typical example to each of the threats.
The table represents what we think is the right level of detail for the borescope inspection Bowtie, without detailing each failure mode. Factors that had the same or similar barriers to prevent the top event from occurring were grouped as main treats.
The threat side of the Bowtie is shown in Figure 5.

4.4. Barriers and Escalation Factors

For each threat and consequence branch, barriers were added to the Bowtie diagram. The barriers were a combination of current existing barriers from the MRO site of our industry partner and our own knowledge. Subsequently, escalation factors and escalation factor controls were added, showing the aspects that influence the effectiveness of the main barriers.
Since the main target of risk management is the prevention of the top event, most Bowties focus on the prevention, rather than the recovery side. Hence, we emphasised the prevention side. Nonetheless, the main recovery barriers and its escalation factors, as well as the escalation factor barriers, are presented.
To reduce the complexity of the diagram, only the two immediate consequences are displayed on the right side of the Bowtie diagram. The threat side of the Bowtie is shown in Figure 6, and the consequence side is illustrated in Figure 7. Since the Bowtie diagram could not be adjusted in the BowtieXP software in order to present it in a legible way, we applied manual image processing to split the original Bowtie into its single threat and consequence paths. The full Bowtie with all barriers, escalation factors, and escalation factor barriers can be found in Figure A1, Figure A2, Figure A3, Figure A4 and Figure A5 (Appendix A). For a higher- resolution version of those figures, please see Supplementary Materials S1–S5.

5. Discussion

5.1. Summary of Outcomes

While the Bowtie method is well known in the aviation industry, it is only applied to significant accident scenarios, named the “significant seven”. However, there is no mention of the method being applied in other high-risk and error-prone areas of the complex aviation system, such as aircraft and engine maintenance—at least there is nothing published in the research literature. This paper investigated the adaptability of the Bowtie method to the maintenance, repair, and overhaul environments and analysed how it differs in principle from the conventional Bowtie used in aircraft operation.
We showed that it is possible to reconceptualise the consequence component of the Bowtie to include organisational economics and the adverse effects on the organisation in whichever dimensions those occur. We propose that, in general, it could be worthwhile to identify the consequences that are consistent with the organisational purpose—which is evident in vision, value, and mission statements. This is because employees already understand these concepts, at least in the sense that these factors are important for the survival of the organisation. In this way, the Bowtie consequences might be explicitly aligned with the organisational purpose, and in turn this may provide a coherent rationale and motivation to the operator to engage with the quality and safety systems.

5.2. Implications for Practitioners

There are several potential uses for the Bowtie, for inspection and for applying Bowtie to aviation maintenance.
Firstly, the presented Bowtie is particularly useful for borescope inspection, which creates awareness of the relevance of visual inspection in aircraft maintenance. It helps the inspectors to understand the risks and how they can be prevented or minimised. Furthermore, it provides a better understanding as to which specific barriers are in place and why it is important to maintain them. For example, when training courses are held frequently, workers can visually see their impact and why they are crucial from a risk management perspective. It demonstrates the importance of complying with organisations risk management strategies. Additionally, it enables them to identify missing or ineffective barriers, and demonstrate where resources have the greatest impact and, hence, should be invested. This insight can also be used for investment recommendations to executive management, which applies the aforementioned organisational economics, as implementing and improving barriers is costly and can affect the overall profitability.
Generally speaking, the Bowtie approach can be used for teaching purposes and to create awareness of the importance of risk management, demonstrating the risk strategies of the company, highlighting weaknesses in risk management, and supporting the safety culture of the company.
The Bowtie analysis and the development of the diagram demand a detailed risk and hazard assessment. This process promotes improved understanding and has the possibility to gain new insights, which can be exploited on a company level, in other areas of the engine maintenance process, or even within the broader maintenance industry. It may also be valuable outside the MRO industry for aircraft operators, as it highlights the importance of operational economics and how it can be added into Bowtie analysis.
As originally intended, the Bowtie can be used as a tool for communicating within the different management levels in an organisation. Depending on the required level of detail needed for a specific audience, different levels of a Bowtie can be created to align with the needs of that specific department. It also offers the opportunity to use Bowtie as a tool to express one’s concerns for a lacking process and how it could be improved by implementing additional barriers or improving the existing ones.

5.3. Limitations of the Work

There are several limitations to the applied Bowtie methodology. Depending on the audience, the Bowtie may have not the right level of detail. Some tend to be too generic, whereas others tend to be too specific. However, both can be valid depending on the audience that the Bowtie addresses. For example, the borescope manufacturer or the inspector requires more specific details compared to the upper management. Therefore, there will always be a struggle in providing the right level of detail, which can only be handled either by developing multiple Bowties for the same top event, which means double the work, or the more detailed paths could potentially be hidden when presenting to a higher audience.
When developing the Bowtie for visual inspection, we realised that some barriers, including their escalation factors and escalation factor barriers, were repeated on nearly every single threat branch. This resulted in a more complex-looking Bowtie diagram, which can lead to the loss of the main purpose of using a Bowtie, which is its effectiveness as a communication tool.
Even though Bowtie generally allows for quantification of the top event and its consequences, we found it challenging because of the scarcity of historical data [54]. While the idea of accumulating data from multiple sources such as audits, accident reports, and statistics over a period of time is attractive [55], it is not altogether certain how this might be achieved, since data for extremely rare events are often not reliable or applicable, making probability and failure rate assignments difficult.
In the case of visual inspection, data were not available and, therefore, we had to ask industry experts for their opinions. When talking to these experts, who were inspectors, they were able to name many factors that they could identify as influential to the inspection result. However, as they are inspectors and not system risk analysts, they were not able to provide us with realistic estimates for the frequency of a threat occurrence and how likely a barrier was to fail. The same problem would occur when calculating the impact of the escalation factors. Even with estimates, a Bowtie does not account for the accuracy and the certainty of those estimates (probability of failure on demand) or the extent of influence that escalation factors have on the barrier. As a result, the presented Bowtie is not quantified, until we can develop a strategy to account for the limitations.
Borescope inspection is performed at multiple stages in the maintenance process. These stages include on-wing inspection, induction inspection, and post-test inspection. Due to the different environments, engine conditions, and performance at different times, the factors vary between inspection types, despite it all existing under the borescope inspection umbrella. Some mitigation barriers are only present when the Bowtie is used for induction inspection. On the other hand, in the case of a post-test inspection, the same barriers will not be present, since they already passed from a process perspective. These barriers are namely the “engine test” and the “post-test borescope inspection”. This paper presented the Bowtie analysis for induction inspection, since this is the inspection where most defects are found, which decides whether or not to strip down the engine. Hence, for on-wing and post-test inspection, the presented Bowties are only partially applicable and need further adjustment.
The strength of using Bowtie lies in its visual representation of threats, barriers, and consequences [56]. Nonetheless, the method has limited possibilities of representing the chronological order of the barriers, i.e., representing barriers that take place simultaneously (from a process point of view) and barriers that are process-wise in series.
Similar to the barriers, it was found that there is a chronological order of consequence. Since BowtieXP only allows one consequence per branch, it was not possible to show the consequence event chain and, hence, only the subsequent or the last event of this chain could be displayed. In practice, it tends to be the most propagated outcome in the consequence path, which is ultimately the worst-case scenario. This is purposely done to create awareness and highlight the level of risk in each task that an aircraft maintenance technician performs, which could potentially lead to severe damage to the engine, aircraft, passengers, airliner, or MRO provider. We bypassed this limitation using image editing to manually sequence the immediate and final consequences for the inappropriate diagnosis of part condition.
Lastly, a Bowtie cannot show sub-interactions and correlations; for example, multiple escalation factors must occur at the same time to degrade the barrier. Furthermore, it does not account for the severity of the top event and consequences if multiple threats release the top event at the same time. This causes a fixed mindset that threats, barriers, and escalation factors are always independent and cannot aggravate each other.

5.4. Implications for Future Research

After applying Bowtie to visual inspection in the MRO industry, we identified the need for future research. The first two points address the problem of representing the chronological order of threats, barriers, and consequences, followed by the need for a more structured and standardised Bowtie approach.
Firstly, a Bowtie has no possibility of presenting causational paths of the threat development. Equally, there is no option to present the consequence development path. One way to bypass this limitation is by connecting the Bowties in chronological sequence. In the presented case which used “inappropriate diagnosis of part condition” as the top event, the direct consequence would be the release of an unairworthy part or the scrapping of an airworthy part. Both consequences would form the threats for the subsequent Bowtie, and the new consequences are chronologically subsequent. However, since Bowtie diagrams are viewed individually, the subsequent and ultimate consequences are not visible. Hence, we introduced a new way of representing the consequence chain, which could be used similarly for the threat development path. This could be further investigated and potentially be added as a feature in the software.
Secondly, barriers could be chronologically expressed by adding a second dimension to the barriers. Barriers that prevent the top event at the same point in time could be grouped together. Barriers or barrier groups that prevent the top event at different points in time or in a subsequent process step could be displayed separately.
A third opportunity for future research could be to address some of the unsystematic aspects of Bowtie creation. Our experiences in constructing the above Bowtie suggested that there is a need for a structured approach for Bowtie construction. Existing methods tend to be ad hoc, and they rely on the existing knowledge of the analyst. Possible ways to address this may include introducing the 6M’s, PEAR, SHELL, or similar risk categorisations to the current Bowtie model.
An obstacle for developing a Bowtie is the lack of a generic structure. While the Bowtie diagram itself has a characteristic shape and common elements, there is still little standardisation in terms of how to identify threats and barriers. There are different ways of performing a Bowtie analysis. The most common one is based on expert knowledge. However, this is subjective and based on the perspective of the risk analysis expert rather than that of the operator. In an accident scenario, the Bowtie is developed by investigators who investigate which barriers are in place, which ones failed, and why. However, when developing a new system or analysing an existing one prior to an incident or accident occurrence, there is no standardised framework provided. As each Bowtie and its top event are unique, the process of Bowtie analysis is ad hoc. This provides potential for further research to develop an approach for systematically developing a Bowtie without fully relying on expert knowledge and availability, and ultimately simplifying the Bowtie method, while reducing the current ad hoc approach.
The development of a Bowtie diagram is time-consuming and strenuous, particularly for top events with many possible threats and long threat branches. Some barriers and their escalation factor sub-branches are often repeated in the threat branches, and this makes the method cumbersome. The focus and energy, however, should be on the critical thinking and analysis process, rather than the drawing of the diagram. Future research could focus on a simplified process of creating Bowtie diagrams, which has the potential to further increase its application across industries.
This could potentially be the solution for another limitation of Bowtie, i.e., the static representation of the specific point in time when the risk analysis was performed and when the Bowtie was created. Bowties lack the adaptability to changes in the system. Changes could include the implementation of additional barriers, barrier efficiency and effectiveness improvements, or organisational changes. Some attempts were made to update and monitor Bowties in real time, enabling a more dynamic risk assessment [57,58]. An automated approach for the Bowtie generation would support this approach.

6. Conclusions

The purpose of this research was to identify the risks occurring in visual inspection tasks during aircraft engine maintenance in an MRO environment. This work makes several novel contributions towards solving this problem. Firstly, it provides a method for using the Bowtie analysis on aircraft maintenance tasks—this required a reconceptualisation of the consequences, which are different compared to flight operations. They include not only the safety of the aircraft passengers and the potential for fatalities, but also the operational economics. Secondly, it provides a detailed analysis of the risks associated with borescope inspection and the barriers that can prevent or mitigate those risks, which were otherwise not shown in the literature.

Supplementary Materials

The following are available online at https://www.mdpi.com/2226-4310/6/10/110/s1: Figure S1: Threat side of Bowtie with prevention barriers; Figure S2: Threat side of Bowtie with prevention barriers, escalation factors, and escalation factor barriers; Figure S3: Consequence side of Bowtie with recovery barriers; Figure S4: Consequence side of Bowtie with recovery barriers, escalation factors, and escalation factor barriers; Figure S5: Full Bowtie with all components.

Author Contributions

Conceptualization, J.A. and D.P.; methodology, J.A. and D.P.; software, J.A.; validation, J.A. and D.P.; formal analysis, J.A. and D.P.; investigation, J.A.; resources, D.P.; data curation, J.A.; writing—original draft preparation, J.A.; writing—review and editing, J.A. and D.P.; visualization, J.A.; supervision, D.P.; project administration, D.P.; funding acquisition, D.P.

Funding

This research project was funded by the Christchurch Engine Centre (CHCEC), a maintenance, repair, and overhaul (MRO) facility based in Christchurch, and a joint venture between the Pratt and Whitney (PW) division of United Technologies Corporation (UTC) and Air New Zealand (ANZ).

Acknowledgments

We sincerely thank staff at the Christchurch Engine Centre for their support and providing insights into visual inspection and risk management. In particular, we want to thank Tim Coslett, Marcus Wade, and Paul McMaster.

Conflicts of Interest

J.A. was funded by a PhD scholarship funded by the Christchurch Engine Centre (CHCEC). The authors declare no other conflicts of interest.

Appendix A. Bowtie Analysis for Borescope Induction Inspection

Figure A1 shows the threat side of the Bowtie diagram with prevention barriers. For a higher-resolution version, please see the online Supplementary Materials.
Figure A1. Threat side of the Bowtie diagram with prevention barriers.
Aerospace 06 00110 g0a1
Figure A2 shows the threat side of the Bowtie diagram with prevention barriers, escalation factors, and escalation factor barriers. It is apparent that the disadvantage of Bowtie can be a massive diagram, which is barely legible. Hence, we segmented the diagram into sub-diagrams—one for each threat path.
Figure A2. Threat side of the Bowtie diagram with prevention barriers, escalation factors, and escalation factor barriers.
Aerospace 06 00110 g0a2
Figure A2a–g show the extracts from the Bowtie diagram presented in Figure A2.
Aerospace 06 00110 i001
Figure A2a. “Damaged borescope tip or inappropriate tip condition” threat path.
Aerospace 06 00110 i002
Figure A2b. “Use of incorrect tool, set-up, or setting” threat path.
Aerospace 06 00110 i003
Figure A2c. “Borescope not working properly” threat path.
Aerospace 06 00110 i004
Figure A2d. “Inadequate engine or borescope knowledge” threat path.
Aerospace 06 00110 i005
Figure A2e. “Tip lost during or left behind after inspection” threat path.
Aerospace 06 00110 i006
Figure A2f. “Borescope not available or set incomplete” threat paths.
Aerospace 06 00110 i007
Figure A2g. “Inadequate or missing equipment (aids)” threat paths.
Figure A3 shows the consequence side of the Bowtie diagram with recovery barriers.
Figure A3. Consequence side of the Bowtie diagram with recovery barriers.
Aerospace 06 00110 g0a3
Figure A4 shows the consequence side of the Bowtie diagram with recovery barriers, escalation factors, and escalation factor barriers.
Figure A4. Consequence side of the Bowtie diagram with recovery barriers, escalation factors, and escalation factor barriers.
Aerospace 06 00110 g0a4
Figure A5 shows the complete Bowtie result with all elements. This figure only serves the purpose of illustrating the characteristic shape, which may have been lost in the previous diagrams, as these were edited to improve the legibility. For a higher-resolution version, please see the online Supplementary Materials.
Figure A5. Complete Bowtie result with all elements.
Aerospace 06 00110 g0a5

References

  1. De Ruijter, A.; Guldenmund, F. The bowtie method: A review. Saf. Sci. 2016, 88, 211–218. [Google Scholar] [CrossRef]
  2. Culwick, M.D.; Merry, A.F.; Clarke, D.M.; Taraporewalla, K.J.; Gibbs, N.M. Bow-Tie Diagrams for Risk Management in Anaesthesia. Anaesth. Intensive Care 2016, 44, 712–718. [Google Scholar] [CrossRef] [PubMed] [Green Version]
  3. Tang, Y.; Jing, J.; Zhang, Z.; Yang, Y. A Quantitative Risk Analysis Method for the High Hazard Mechanical System in Petroleum and Petrochemical Industry. Energies 2017, 11, 14. [Google Scholar] [CrossRef]
  4. Shahriar, A.; Sadiq, R.; Tesfamariam, S. Risk analysis for oil & gas pipelines: A sustainability assessment approach using fuzzy based bow-tie analysis. J. Loss Prev. Process Ind. 2012, 25, 505–523. [Google Scholar]
  5. Federal Aviation Administration (FAA). Bow-Tie Analysis. Available online: http://www.hf.faa.gov/workbenchtools/default.aspx?rPage=Tooldetails&subCatId=43&toolID=21 (accessed on 1 October 2018).
  6. Civil Aviation Authority (CAA). Bowtie Risk Assessment Models. Available online: https://www.caa.co.uk/Safety-Initiatives-and-Resources/Working-with-industry/Bowtie/ (accessed on 23 January 2019).
  7. European Aviation Safety Agency (EASA). The European Plan for Aviation Safety (EBAS) 2018–2022. Available online: https://www.easa.europa.eu/sites/default/files/dfu/EPAS_2018-2022%20v2.2.8%20for%20MB.pdf (accessed on 23 January 2019).
  8. Civil Aviation Authority (CAA) of New Zealand. Making Safe Aviation Even Safer. Civil Aviation Authority Sector Risk Profile of Medium and Large Aircraft Air Transport. Available online: https://www.caa.govt.nz/assets/legacy/Safety_Reports/srp-large.pdf (accessed on 25 September 2018).
  9. Papazoglou, I.A.; Bellamy, L.J.; Hale, A.R.; Aneziris, O.N.; Ale, B.J.M.; Post, J.G.; Oh, J.I.H. I-Risk: Development of an integrated technical and management risk methodology for chemical installations. J. Loss Prev. Process Ind. 2003, 16, 575–591. [Google Scholar] [CrossRef]
  10. De Dianous, V.; Fiévez, C. ARAMIS project: A more explicit demonstration of risk control through the use of bow–tie diagrams and the evaluation of safety barrier performance. J. Hazard. Mater. 2006, 130, 220–233. [Google Scholar] [CrossRef] [PubMed]
  11. Gifford, M.; Gilbert, S.; Barnes, I. The Use of Bow-tie Analysis in OME Safety Cases. In Proceedings of the Equipment Safety Assurance Symposium (ESAS), Bristol, UK, 2003. [Google Scholar]
  12. Patrick, M.C.; Martin, D. Safety First–Scenario Analysis under Basel II. 2006, Volume 29, p. 2010. Available online: https://www.researchgate.net/publication/228882614_Safety_first-scenario_analysis_under_Basel_II (accessed on 23 January 2019).
  13. Abdi, Z.; Ravaghi, H.; Abbasi, M.; Delgoshaei, B.; Esfandiari, S. Application of Bow-tie methodology to improve patient safety. Int. J. Health Care Qual. Assur. 2016, 29, 425–440. [Google Scholar] [CrossRef]
  14. Cormier, R.; Elliott, M.; Rice, J. Putting on a bow-tie to sort out who does what hy in the complex arena of marine policy and management. Sci. Total Environ. 2019, 648, 293–305. [Google Scholar] [CrossRef]
  15. Burgess-Limerick, R.; Horberry, T.; Steiner, L. Bow-tie analysis of a fatal underground coal mine collision. Ergon. Aust. 2014, 10, 1–5. [Google Scholar]
  16. Khakzad, N.; Khan, F.; Paltrinieri, N. On the application of near accident data to risk analysis of major accidents. Reliab. Eng. Syst. Saf. 2014, 126, 116–125. [Google Scholar] [CrossRef]
  17. Delmotte, F. A sociotechnical framework for the integration of human and organizational factors in project management and risk analysis. Master’s Thesis, Virginia Tech, Blacksburg, VA, USA, September 2003. [Google Scholar]
  18. Van Scyoc, K.; Hughes, G. Rail ruminations for process safety improvement. J. Loss Prev. Process Ind. 2009, 22, 689–694. [Google Scholar] [CrossRef]
  19. Brown, K. Review of the South Island Rail Coal Route—MET351-X-REP-001. Available online: www.ltsa.govt.nz/rail/coal-route (accessed on 25 January 2019).
  20. Reason, J. Human Error; Cambridge University Press: Cambridge, UK, 1990. [Google Scholar]
  21. Aust, J.; Pons, D. Taxonomy of Gas Turbine Blade Defects; MDPI Aerospace: Basel, Switzerland, 2019. [Google Scholar]
  22. Joy, J.; Griffiths, D. National Minerals Industry Safety and Health Risk Assessment Guide; Minerals Industry Safety and Health Centre, University of Queensland: St Lucia, Australia, 1979. [Google Scholar]
  23. Primrose, M.J.; Bentley, P.D.; van der Graaf, G.C.; Sykes, R.M. The HSE Management System in Practice-lmplementation. Presented at the SPE Health, Safety and Environment in Oil and Gas Exploration and Production Conference, New Orleans, Louisiana, 1 January 1996; Available online: https://doi.org/10.2118/35826-MS (accessed on 25 January 2019).
  24. Gower-Jones, A.D.; van der Graaf, G.C.; Milne, D.J. Application of Hazard and Effects Management Tools and links to the HSE Case. Presented at the SPE Health, Safety and Environment in Oil and Gas Exploration and Production Conference, New Orleans, Louisiana, 1 January 1996; Available online: https://doi.org/10.2118/36031-MS (accessed on 24 January 2019).
  25. Zuijderduijn, C.J. Risk management by shell refinery/chemicals at Pernis. Available online: http://www.microkat.gr/microrisk2001/paper_Zuijderduijn.html (accessed on 24 January 2019).
  26. Seveso II Directive—Council of the European Union. Council Directive 96/82/EC on the Control of Major-Accident Hazards Involving Dangerous Substances. Available online: http://ec.europa.eu/environment/seveso/index.htm (accessed on 11 October 2018).
  27. Delvosalle, C.; Fiévez, C.; Pipart, A. ARAMIS Project: Reference Accident Scenarios Definition in SEVESO Establishment. J. Risk Res. 2006, 9, 583–600. [Google Scholar] [CrossRef]
  28. De Souza, G.F.M. Thermal Power Plant Performance Analysis; Springer: Berlin, Germany, 2012. [Google Scholar]
  29. Crawley, F.; Tyler, B. Hazard Identification Methods; Inst of Chemical Engineers (IChemE): London, UK, 2003. [Google Scholar]
  30. Ericson, C.A. Fault tree analysis. In Proceedings of the 17th International System Safety Conference, Orlando, FL, USA, 16–21 August 1999. [Google Scholar]
  31. Watson, H.A. Launch Control Safety Study; Bell Telephone Laboratories: Murray Hill, NJ, USA, 1961. [Google Scholar]
  32. Xing, L.; Amari, S.V. Fault Tree Analysis. In Handbook of Performability Engineering; Misra, K.B., Ed.; Springer: London, UK, 2008; pp. 595–620. [Google Scholar]
  33. Ericson, C.A. Hazard Analysis Techniques for System Safety; Wiley: Hoboken, NJ, USA, 2005. [Google Scholar]
  34. Fouladvand, S.; Ghiaci, P.; Shahriari, M. Fault Tree Analysis, Strengths and Weaknesses. In Proceedings of the Inbternational Symposium on Occupational Safety and Hygiene, Guimarães, Portugal, 11–12 February 2010. [Google Scholar]
  35. Rasmussen, N.C. Reactor Safety Study: An Assessment of Accident Risks in US Commercial Nuclear Power Plants; U.S. Nuclear Regulatory Commission: Washington, DC, USA, 1975.
  36. Rubin, O.; Dahlberg, R. A Dictionary of Disaster Management; Oxford University Press: Oxford, UK, 2017. [Google Scholar]
  37. Clemens, P.L.; Simmons, R.J.; Cincinnati, O. System Safety and Risk Management: A Guide for Engineering Educators. In Lesson II Risk Assessment Matrix. NIOSH Instructional Module; US Department of Health and Human Services: Cincinnati, OH, USA, 1998. [Google Scholar]
  38. Rausand, M.; Høyland, A. System Reliability Theory: Models, Statistical Methods, and Applications; John Wiley & Sons: Hoboken, NJ, USA, 2004. [Google Scholar]
  39. Nielsen, D.S. The Cause/Consequence Diagram Method as a Basis for Quantitative Accident Analysis; Risø National Laboratory: Roskilde, Denmark, 1971. [Google Scholar]
  40. Cardwell, G. The application of the Four Essentials Bow Tie Diagram to enhance business success. Total Qual. Manag. Bus. Excell. 2008, 19, 37–45. [Google Scholar] [CrossRef]
  41. Harms-Ringdahl, L. Guide to Safety Analysis for Accident Prevention; IRS Riskhantering: Stockholm, Sweden, 2013. [Google Scholar]
  42. Haddon, W., Jr. Energy damage and the ten countermeasure strategies. Hum. Factors 1973, 15, 355–366. [Google Scholar] [CrossRef]
  43. Marvin, R. Risk Assessment: Theory, Methods, and Applications; John Wiley & Sons, Inc.: Hoboken, NJ, USA, 2011. [Google Scholar]
  44. Sklet, S. Safety barriers: Definition, classification, and performance. J. Loss Prev. Process Ind. 2006, 19, 494–506. [Google Scholar] [CrossRef]
  45. Duijm, N.J.; Goossens, L. Quantifying the influence of safety management on the reliability of safety barriers. J. Hazard. Mater. 2006, 130, 284–292. [Google Scholar] [CrossRef]
  46. Ericson, C.A. System Safety Terms and Concepts. In Concise Encyclopedia of System Safety; John Wiley & Sons: Hoboken, NJ, USA, 2011; pp. 16–455. [Google Scholar]
  47. Visser, J.P. Developments in HSE management in oil and gas exploration and production. In Safety Management: The Challenge of Change; Hale, A., Baram, M., Eds.; Pergamon: Amsterdam, The Netherlands, 1998; pp. 43–66. [Google Scholar]
  48. Manton, M.; Moat, A.; Ali, W.; Johnson, M.; Cowley, C. Representing Human Factors in Bowties as per the new CCPS/EI Book. In Proceedings of the CCPS Middle East Conference on Process Safety, Sanabis, Bahrain, 9–11 October 2017. [Google Scholar]
  49. Trbojevic, V.M.J.H.; Report, S.E.R. Optimising hazard management by workforce engagement and supervision. Health Safety Exec. 2008, 637, 2008. [Google Scholar]
  50. SAE International. Aerospace Standard AS 9100 Quality Management Systems—Requirements for Aviation Maintenance Organizations; SAE International: Warrendale, PA, USA, 2012. [Google Scholar]
  51. Lewis, S. Lessons Learned from Real World Application of the Bow-tie Method. In Proceedings of the 6th Global Congress on Process Safety, San Antonio, TX, USA, 22–24 March 2010; Available online: https://www.aiche.org/academy/videos/conference-presentations/lessons-learned-real-world-application-bow-tie-method (accessed on 15 February 2019).
  52. CGE Risk BowtieXP.Software; Version 9.2.13; CGE Risk: Leidschendam, The Netherlands, 2019.
  53. Civil Aviation Authority (CAA). CAA ‘Significant Seven’ Task Force Reports. In CAA PAPER 2011/03. 2011. Available online: https://publicapps.caa.co.uk/docs/33/2011_03.pdf (accessed on 28 January 2019).
  54. Van Sciver, G.R. Quantitative risk analysis in the chemical process industry. Reliab. Eng. Syst. Saf. 1990, 29, 55–68. [Google Scholar] [CrossRef]
  55. McCulloch, P. Learning from incidents—Linking incident analysis with BowTie based risk assessments. In Proceedings of the Hazards 27, Birmingham, UK, 10–12 May 2017. [Google Scholar]
  56. Moore, C.; Coleman, G.C.; Chang, J.; Nagle, M.; Sten, M.-B. Using Safety Barrier Analysis to Facilitate Quality Improvement in Health Care: Improving Venous Thromboembolism Prophylaxis as a Proof of Concept. Am. J. Med Qual. 2019, 357. [Google Scholar] [CrossRef]
  57. Ferdous, R.; Khan, F.; Sadiq, R.; Amyotte, P.; Veitch, B. Analyzing system safety and risks under uncertainty using a bow-tie diagram: An innovative approach. Process Saf. Environ. Prot. 2013, 91, 1–18. [Google Scholar] [CrossRef]
  58. Khakzad, N.; Khan, F.; Amyotte, P. Dynamic Safety analysis of process systems by mapping bow-tie into Bayesian network. Process Saf. Environ. Prot. 2013, 91, 46–53. [Google Scholar] [CrossRef]
Figure 1. Schematic Bowtie diagram with prevention and recovery barriers.
Aerospace 06 00110 g001
Figure 2. Generic Bowtie chain.
Aerospace 06 00110 g002
Figure 3. Bowtie diagram for “inappropriate diagnosis of part condition” with immediate consequences.
Aerospace 06 00110 g003
Figure 4. Bowtie diagram for “inappropriate diagnosis of part condition” with immediate and manually added subsequent consequences.
Aerospace 06 00110 g004
Figure 5. Bowtie diagram for “inappropriate diagnosis of part condition” with threats.
Aerospace 06 00110 g005
Figure 6. Left half of the Bowtie diagram with threats and prevention barriers.
Aerospace 06 00110 g006
Figure 7. Right half of the Bowtie diagram with consequences and recovery barriers.
Aerospace 06 00110 g007
Table 1. Threat list with descriptions.
ThreatDescription
Incorrect tool or settingWrong borescope or borescope tip is being used. This can result in difficulties obtaining an angle from which the inspected part is seen properly and is visually assessable.
Incorrect settings in the borescope menu selected include if the contrast is too high or the brightness of the light source is too low.
Borescope not working properlyBorescope is not working properly as required for the inspection task. This can be a result of inappropriate handling or transportation of the borescope.
Damaged borescope tip or inappropriate tip conditionBorescope tip is damaged or in an inappropriate condition. This often happens when borescoping a dirty engine and the fine deposit sticks to the tip or clogs the opening, which results in a limited, blurry, or smeared image.
Inadequate engine or borescope knowledgeA lack of knowledge of the engine or borescope inspection such as the correct manipulation of the borescope can result in inspecting the wrong parts, revisiting the same parts multiple times, or missing the inspection on others.
Correct tool not availableBorescope tips often get dirty and sometimes appropriate cleaning material is not available. As a result, the tips get sent to the manufacturer for cleaning. The same process occurs when the borescope has a technical issue. Due to the time pressure, the engine cannot wait, and the inspection process is performed with alternative available tools.
Tip lost or left behind after inspectionAn unnoticed left behind or lost tip can cause foreign object damage (FOD) to the engine once it is running.
Inappropriate or missing aidsAids include insertion tubes, magic arms, hockey arms, etc. If these are incorrectly installed or missing, borescope inspection can be challenging, which results in a shifting of focus from the actual inspection and evaluation of the part condition to the manipulation and handling of the borescope or aids.

