Article

Computational Study of Propeller–Wing Aerodynamic Interaction

1
High Performance Computing Research Center, U.S. Air Force Academy, Air Force Academy, CO 80840, USA
2
U.S. Army Natick Soldier Research, Development & Engineering Center, Natick, MA 01760, USA
*
Author to whom correspondence should be addressed.
Aerospace 2018, 5(3), 79; https://doi.org/10.3390/aerospace5030079
Submission received: 12 April 2018 / Revised: 9 July 2018 / Accepted: 18 July 2018 / Published: 25 July 2018
(This article belongs to the Special Issue Computational Aerodynamic Modeling of Aerospace Vehicles)

Abstract

:
Kestrel simulation tools are used to investigate the mutual interference between the propeller and wing of C130J aircraft. Only the wing, nacelles, and propeller geometries are considered. The propulsion system modelled is a Dowty six-bladed R391 propeller mounted at inboard or outboard wing sections in single and dual propeller configurations. The results show that installed propeller configurations have asymmetric blade loadings such that downward-moving blades produce more thrust force than those moving upward. In addition, the influence of installed propeller flow-fields on the wing aerodynamic (pressure coefficient and local lift distribution) are investigated. The installed propeller configuration data are compared with the non-installed case, and the results show that propeller effects will improve the wing’s lift distribution. The increase in lift behind the propeller is different at the left and right sides of the propeller. In addition, the propeller helps to delay the wing flow separation behind it for tested conditions of this work. Finally, the results show the capability of Kestrel simulation tools for modeling and design of propellers and investigates their effects over aircraft during conceptual design in which no experimental or flight test data are available yet. This will lead to reducing the number of tests required later.

Graphical Abstract

1. Introduction

For low speed operations, propeller-driven aircraft are more effective than jet engines. The propellers of large size aircraft are usually placed on and in the front of the wing which can drastically alter the aerodynamics of the wing and other parts of the aircraft that are immersed in the propeller slipstream. Propellers of these aircraft typically operate at a constant (desired) rotational speed. The propeller blade angle is then adjusted according to the flight speed in order to achieve the maximum efficiency. The propellers can rotate in the same or opposite directions as well. Understanding the effects of these propellers on the aerodynamic performance, aircraft stability and control, vibration, and noise is a challenging task and expensive using wind tunnel or flight testing. There are significant deficiencies when using simple analytical methods such as momentum theory of Froude [1] and Rankine [2]. An alternative is to use computational methods that allow rapid and accurate prediction of the mutual interference between the propeller and wing. Additionally, there is a growing interest in the use of propellers in new and novel design concepts such as flying taxis, or in the unmanned aerial vehicles or drones for the reconnaissance and payload carrying missions. No historical data exist for these concepts and thus the design of these vehicles would be helped by the early availability of high quality computational models to allow control laws to be defined.
Advances in computational modeling of propellers are reported in literature [3]. In a simple manner, propellers may be physically replaced with thin actuator disks using Froude–Rankine momentum theory. This approach assumes an infinite number of thin propeller blades and inviscid flow through the disk. The model then should ensure the mass flow continuity between front and rear faces of disk. Depending on the input thrust and rotational speed, the rear face will have a jump in total pressure, total temperature, and velocity. Advanced computational methods of sliding interfaces, Chimera or overset grids have been used for propeller flow simulations as well [4,5,6,7]. Results of such simulations have compared well with available wind tunnel data. Periodic slipstream unsteadiness has been captured in wing lift and drag, and increased suction peaks at the wing leading edge have also been documented for wing mounted engines. In addition to propeller slipstream interaction with the wing, other components of the aircraft may also be affected by the local unsteadiness depending on relative position of the propeller and the aircraft component. It is well known for traditional single engine aircraft, the wake–fuselage and wake–tail interactions are significant at high power and low airspeed configurations, such as during takeoff. For these conditions, the aircraft experiences a yaw to the left if no control input is made to counter the resultant force. In addition, at high angles of attack, asymmetric blade effects lead to an asymmetric relocation of the propeller’s center of thrust, P-factor. For propeller driven aircraft with multiple engines mounted along the wing, the P-factor effect can be mitigated by using counter-rotating propellers on either side of the aircraft. Note that the C-130H/J propellers rotate in the same direction (clockwise when viewed from the rear) while the P-38 propellers are mounted to rotate in opposite directions depending on the whether the engine is on the port or starboard side of the aircraft. The propellers’ slipstream characteristics are not only a design consideration for traditional aircraft performance metrics, but they may also contribute to constraints and limitations on the aircraft’s use. The focus of this work is to investigate the spinning propeller effects on C130-J wing aerodynamics.
The aerodynamic modeling of C130 aircraft in air drop configuration has been the subject of recent studies at the U.S. Air Force Academy and U.S. Army Natick Soldier Research, Development & Engineering Center Center [8,9,10]. Propellers have been modeled with a very thin actuator disk in References [8,9]. These studies investigated the wake and flow in the vicinity of the cargo ramp and open troop doors. In a subsequent study [10], the C130H/J test cases were simulated with fully resolved blade geometries and using an overset grid approach. The simulation results were compared with previous studies that assumed the propellers as thin actuator disks, and they showed that propeller effects increase the averaged velocities around the open door and in most locations behind the open cargo ramp at the measured positions. The propeller effects on the wing aerodynamics are briefly described in Reference [10] as well. The current work extends these studies and investigates the mutual interference between C130J propeller(s) and its wing. Only wing, nacelle, and propellers components of the aircraft are considered. The propulsion system modelled is a Dowty six-bladed R391 propeller mounted at inboard and/or outboard wing sections. The installed and non-installed performances of this propeller are investigated. The installed performance includes a single propeller mounted at the inboard or outboard nacelle and two propellers mounted at the inboard and outboard nacelles. Propellers can spin clockwise (CW) or counterclockwise (CCW) at different blade angles. Finally, the stall behavior of the wing with and without propellers are presented.
This work uses the High Performance Computing Modernization Program (HPCMP) Computational Research and Engineering Acquisition Tools and Environments (CREATE) TM -Air Vehicles (AV) Kestrel simulation tools (version 8.0) to investigate the propeller wing aerodynamic interaction of the C130J aircraft. The article is organized as follows: first, the Computational Fluid Dynamics (CFD) solver and test cases are described. The propeller performance and propeller/wing aerodynamic interaction are then briefly presented. Next, the article concludes with the a presentation of the results of the C130J wing and propeller aerodynamic interaction.

2. CFD Solver

The flow solver used in this work is the fixed wing computational tool of CREATE TM -AV program, i.e., Kestrel. The Department of Defense (DoD)-developed solver is funded by the DoD HPCMP. The CREATE TM focuses on addressing the complexity of applying computationally based engineering to improve DoD acquisition processes [11], and it consists of three computationally based engineering tool sets for design of air vehicles, ships, and radio-frequency antennae. The fixed wing analysis code, Kestrel, is part of the Air Vehicles Project (CREATE TM -AV) and is a modularized, multidisciplinary, virtual aircraft simulation tool incorporating aerodynamics, jet propulsion integration, structural dynamics, kinematics, and kinetics [11]. The code has a Python-based infrastructure that integrates Python, C, C++, or Fortran-written components [12]. New modules can easily integrated into the code.
Kestrel version 8.0 is used in this work. The flow solver of the code discretizes Reynolds-Averaged Navier Stokes (RANS) equations into a cell-centered finite-volume form. The code then solves unsteady, three-dimensional, compressible RANS equations on hybrid unstructured grids [13]. The code uses the Method of Lines (MOL) to separate temporal and spatial integration schemes from each other [14]. The spatial residual is computed via a Godunov type scheme [15]. Second-order spatial accuracy is obtained through a least squares reconstruction. The numerical fluxes at each element face are computed using various exact and approximate Riemann schemes with a default method based on HLLE++ scheme [16]. In addition, the code uses a subiterative, point-implicit scheme method (a typical Gauss–Seidel technique) to improve the temporal accuracy.
Kestrel receives an eXtensible Markup Language (XML) input file generated by Kestrel User Interface and stores the solution convergence and volume results in a common data structure for later use by the Output Manager component. Some of the turbulence models available within Kestrel include turbulence models of Spalart–Allmaras (SA) [17], Spalart–Allmaras with rotational/curvature correction (SARC) [18], Mentor’s SST model [19], and Delayed Detached Eddy Simulation (DDES) with SARC [20].
Kestrel allows single and multi-body (overset) simulations. For the C130 example, the aircraft is defined as the body in Kestrel and propellers are defined as children of the main body. In this way, any motion applied to the aircraft will be applied to the propellers as well. Likewise, flaps should be defined as children of the aircraft’s body in the code, but for a store separation problem, different bodies should be defined. Kestrel uses an overset grid approach that allows the independent translation and rotation of each body and its children. Overlapping grids are generated individually, without the need to force grid points aligned with neighboring components. However, some small gaps should be present between bodies to avoid body intersections in the code. In addition, Kestrel allows prescribed or six degrees of freedom motions of rigid aircraft [12]. Bodies and their children can have their own motions. For example, propellers of C-130 can spin around their rotation axis while the whole aircraft undergoes a turn maneuver.
The propeller blades can be fully resolved in Kestrel using an overset grid approach. The code also allows modeling propellers in form of thin actuator disks in which the disk area corresponds to the propeller diameter. The use of uniform or non-uniform thrust distributions are available. A non-uniform case requires a given radial position for maximum thrust force. The loading profile is assumed to be linear with a zero thrust at the inner blade radius and then increases until the radial position of maximum thrust, and then decreases to zero at the rotor tip.

3. Propeller Performance
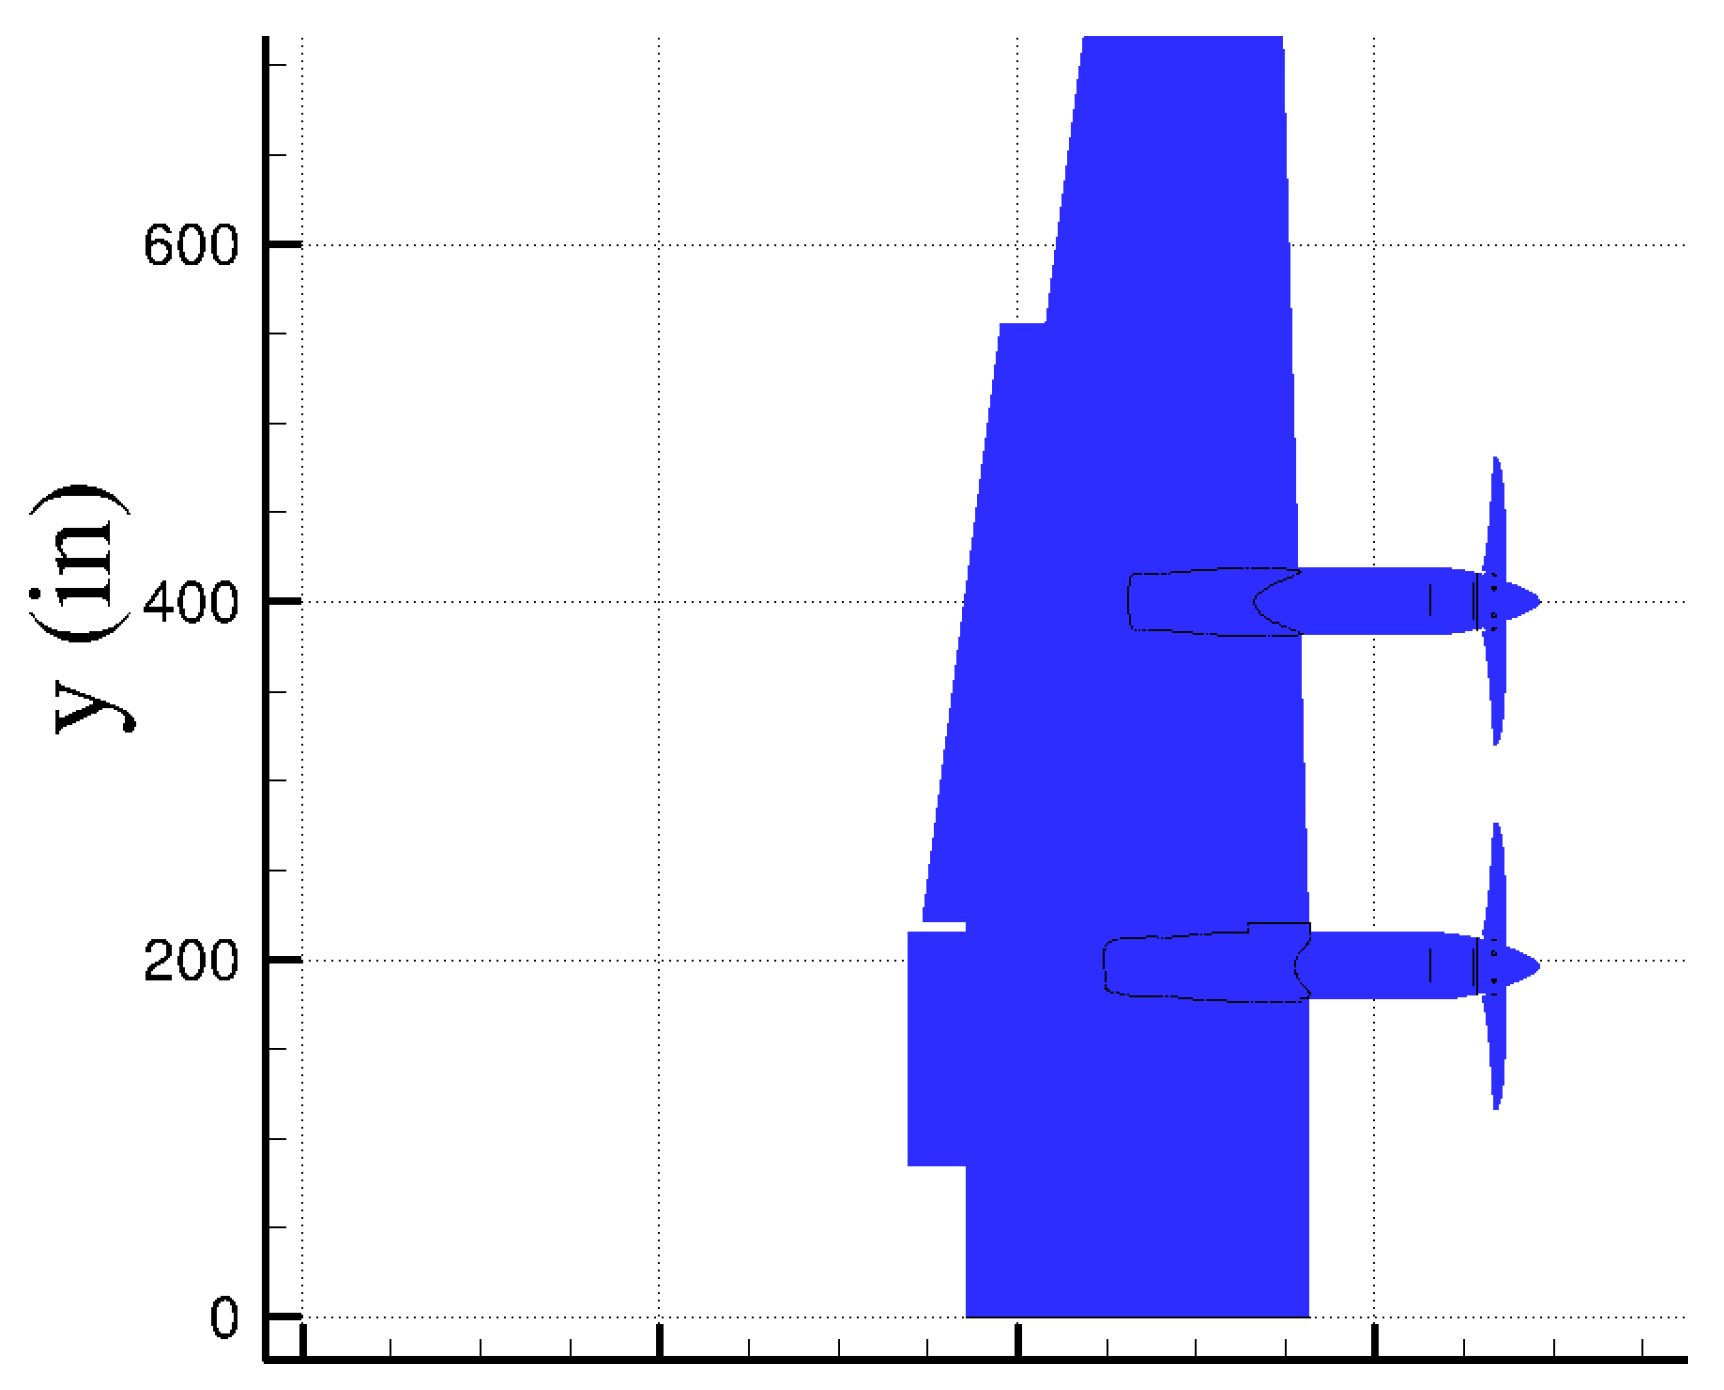
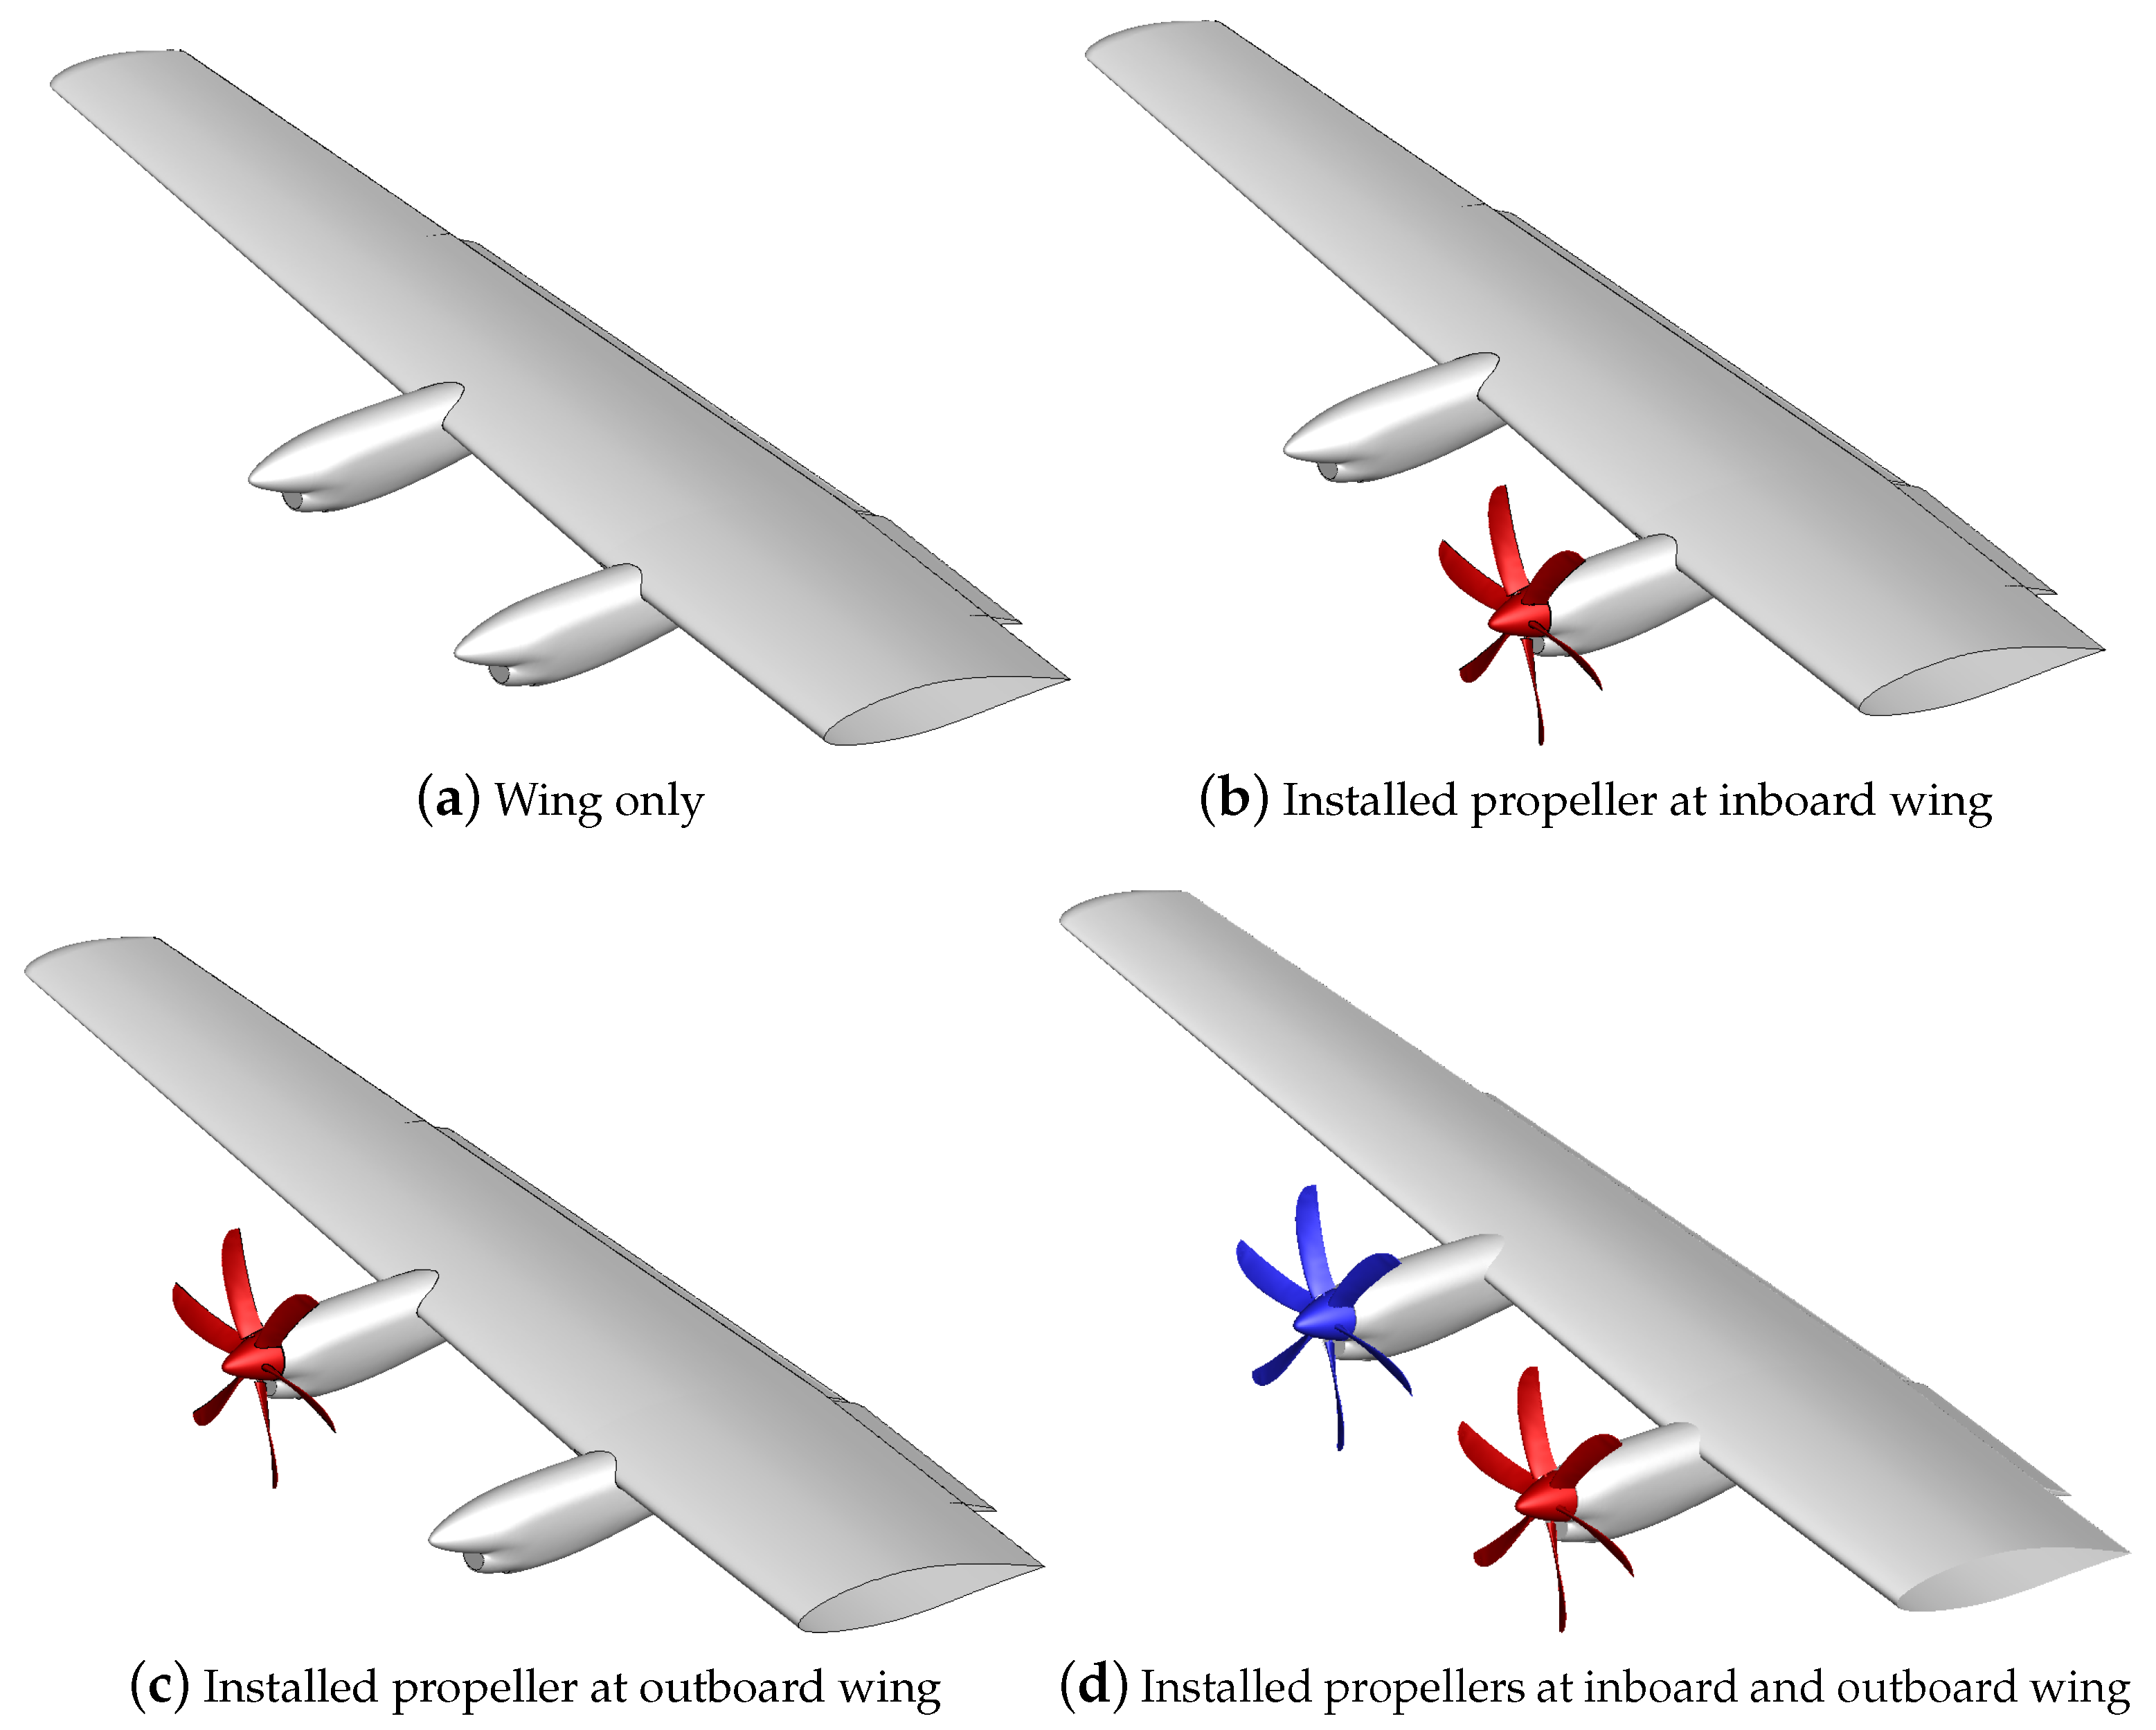
Rotating propellers have significant influence on an aircraft aerodynamics and its stability and control due to slipstream and propeller wake effects. The installed propeller performance is altered due to wing upwash as well [21]. The installed configuration should therefore achieve maximum propeller efficiency while minimizing the adverse impacts on aircraft aerodynamics [22]. The propeller increases air speed and alters the flow direction behind it. The rise in dynamic pressure will increase the wing lift and drag. The change of flow direction leads to a variation of the wing local angle of attack. The propeller slipstream delays the aircraft stall as well [23]. While this is a favorable effect, the stall behavior from propellers can be unacceptable [24]. For example, advanced propellers used in initial designs of C-130J prevented the inner wing from stalling [24] and therefore stall started at the wing tips causing the loss of roll control. Additionally, highly loaded propellers produce a propeller wake because of strong tip vortices formed at the tips of propeller blades. When these propellers are mounted in the front of the wing, the propeller wake causes a considerable variation in the lift and drag distribution across the wingspan [25]. This can cause an unsteady load distribution over the aircraft as well.
Reference [26] describes several propeller aircraft interference effects. In this reference, the wing section is divided into regions and the propeller performance is detailed for four points of the blade tips. Following the guidelines of Reference [26], Figure 1 shows C-130H with two counter-spinning Hamilton Standard 54H60 propellers. Only the inboard propeller effects are considered. The wing is divided into four regions: (1) region one (“R1”) is from fuselage to the propeller tip; (2) region two (“R2”) covers the propeller right tip to the hub; (3) region three (“R3”) extends from the hub to the left propeller tip; (4) and finally region four (“R4”) is from the propeller disk towards the wing tip. In addition, four points are shown on the displayed inboard propeller. These points are at the tip of each blade. Wing regions of 2 and 3 are behind the propeller and are affected by the propeller slipstream. In R2, the lift increases due to an increase in dynamic pressure and local angle of attack. In R3, the angle of attack decreases and it counteracts the tendency of the lift increase due to a rise in dynamic pressure behind the propeller. As reported in Reference [26], the propeller effects are not limited to R2 and R3 and some changes in R1 and R4 can be experienced as well. In terms of propeller performance, the wing upwash causes an asymmetric load on the propeller blades such that angle of attack increases at P2 and decreases at P4. Points 1 and 3 are affected by the wing presence as well. The presence of the nacelle also increases axial velocity in all shown points.

4. Test Cases

The main focus of this work is on the propeller aircraft interference effects of C-130J which uses a Rolls-Royce AE2100 turboprop series with Dowty 391 six-bladed propeller system with a diameter of 162 inches. The blades have a high-speed design with a thin airfoil section and a swept back blade made of composite materials.
Both propellers (inboard and outboard) spin counterclockwise (as viewed from front) at constant rotational speed of 1020 rpm or 6120 deg/s. Different blade angles are tested. The propeller with 20 deg is shown in Figure 2.
Computational grids were generated in Pointwise version 18.0 (Fort Worth, TX, USA). The surface grid cells are mostly structured quadrilateral, but anywhere that these cell types are not possible to make, triangular surface cells are used. The interface between structured and unstructured mesh uses a surface T-rex cells technique that ensures high quality transition between the structured and unstructured surface meshes.
The main motivation for using the quadrilateral mesh is to have very good grid resolution on the blade leading and trailing edges and at the blade tips. A part of the hub is covered with patches of structured meshes as well. The volume mesh is fully unstructured with a 50 prism layer on the propeller surface. The growing ratio of the prism layer is 1.25 and the growth is terminated when the transition between the prism layer and the tetrahedral mesh is smooth.
Two set of grids were generated for each propeller at each given blade angle. In the first grid, the free-stream boundary condition was used with an outer diameter of about 25 times of the blade diameter. These grids have approximately 51.1 million cells and are used for simulation of non-installed propellers. In the second set of grids, the outer boundary is an overset with a diameter of about 1.5 times of blade diameter. These girds are used for installed propeller simulations. These grids have approximately 50 million cells consisting of 27 million prismatic cells around blades and hub surfaces. Finally, for the propeller overset grid with a 20-deg blade angle, a new grid was generated with blade surfaces being mirrored in order to have a clockwise spinning propeller.
The wing geometry is extended to a symmetric plane and has inboard and outboard flaps down 50% (or 22.5 ) with two engine nacelles mounted under the wing. The engine inlets are modelled as solid walls in this work. No-slip conditions are assumed at all solid walls. The wing grid is also generated in Pointwise version 18 and has about 72.5 million cells consisting of around 41 million prismatic cells in proximity of the wall surfaces and 31 million tetrahedral cells elsewhere. The grid units are in inches and in this system the wing half span measures 783.5 inches as shown in Figure 3. The centerline of inboard and outboard nacelles are at 193 inches and 397 inches from the wing root, respectively.
In the wing and propeller simulations, the wing is defined as the parent body with the propeller as its children. This is a helpful approach as any motion applied to the wing will be applied to all children, i.e., propellers. The propeller bodies use the same grids and are defined with a translation vector to have propellers installed inboard or outboard. Different wing/propeller configurations are then considered; some examples are shown in Figure 4. In the first case, only wing geometry is considered including engine nacelles and the propeller hub geometries. In the second case, a single propeller is mounted at the inboard nacelle. The propeller could spin clock or counterclockwise and could have different blade angles. In the third case, a single propeller is installed at the outboard wing section; the propeller could again spin clockwise or counterclockwise and could have different blade angles. In the final case, two propellers are installed at both inboard and outboard nacelles. They can spin at the same or opposite directions. Note that, in the overset approach of this work, a small gap is needed between wing and propeller grids. In addition, the motion files are only applied to the propellers with hub and blades spinning simultaneously.

5. Results and Discussion

In all CFD simulations, the SARC turbulence model DDES simulation is used. Kestrel simulations are run in an unsteady mode in which second order accuracy in time is also used. A time step of 0.001 s, a temporal damping of 0.01, and three Newton sub-iterations are used for non-moving grids. For spinning propellers, eight subiterations are set.

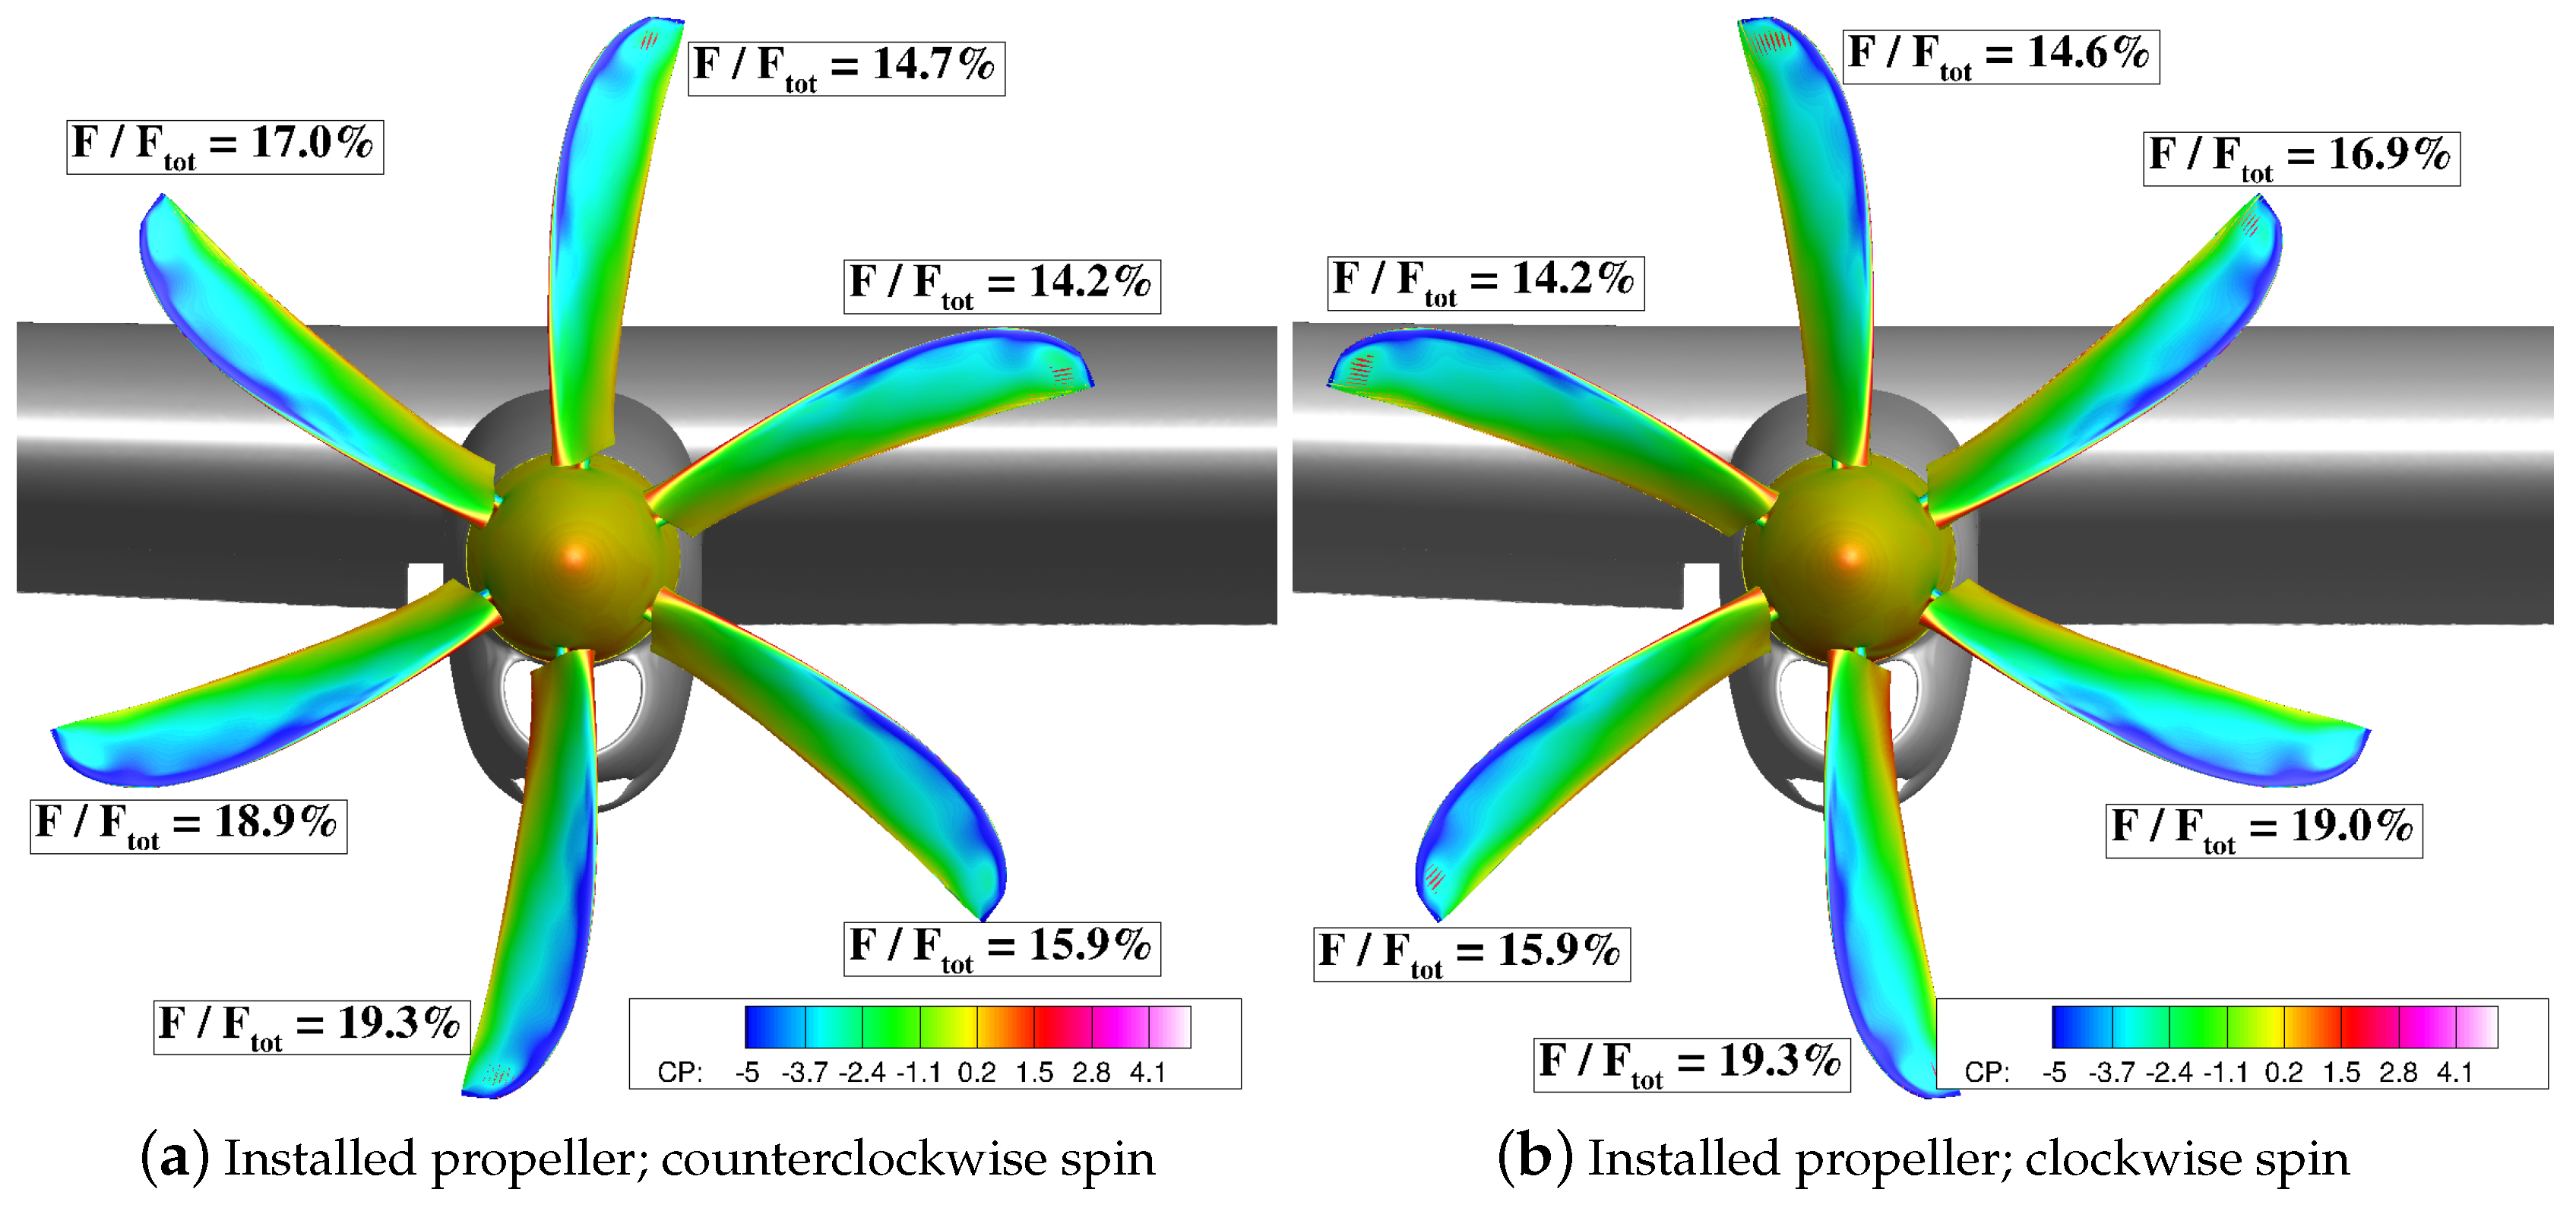
5.1. Propeller Performance

The performance of the Dowty six-bladed R391 propeller is investigated using Kestrel simulation tools. Flow conditions in all simulations correspond to the air speed of 130 KIAS (Knots Indicated Air Speed) at 1000 ft altitude and zero angles of attack and sideslip. The propeller grids with large outer boundaries and free-stream conditions are used to investigate the non-installed propeller performance. The grids (hub and propeller blades) rotate around x-axis at 6120 deg/s speed. The forces and moments of all (noslip wall) surfaces (hub and blades) as well as each blade surface are written in separate files. The simulation results show that blade forces and moments reach steady-state values for constant speed propellers. The results confirm that aerodynamic forces and torques exerted on each blade are symmetric as well.
Figure 5 shows the blade loadings for clockwise and counterclockwise spinning propellers mounted on the inboard wing section at the final time of simulation. Note that propellers spin at a constant speed of 1024 rpm. The solutions are colored by a pressure coefficient. In the computational setup of these simulations, the forces and moments at each blade are written separately. The ratio of thrust force at each blade to total propeller thrust is given in Figure 5. Notice that, for isolated (non installed) propellers, all blades report similar thrust values. Figure 5 shows that installed propeller have different loading depending on the direction of rotation. Figure 5a shows the solution of the propeller spinning counterclockwise. The results show that blades moving downward (opposite of the wing upwash) have more thrust force than those moving upward. The maximum thrust is at the lowest positioned blade. Likewise, Figure 5b shows the solution of the propeller spinning clockwise with constant rotational speed of 1024 rpm. As observed in counterclockwise spinning case, blades moving downward (opposite of the wing upwash) have more thrust force than those moving upward. The maximum thrust again occurs at the lowest positioned blade.

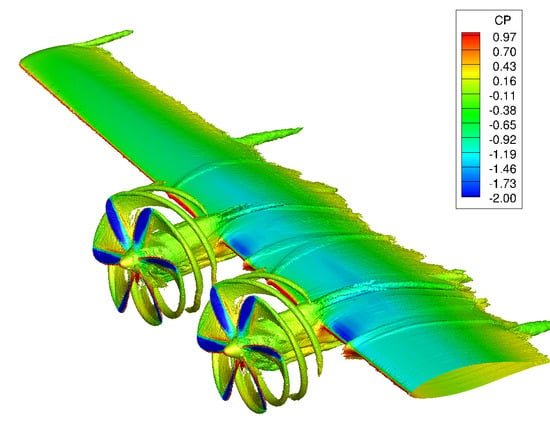
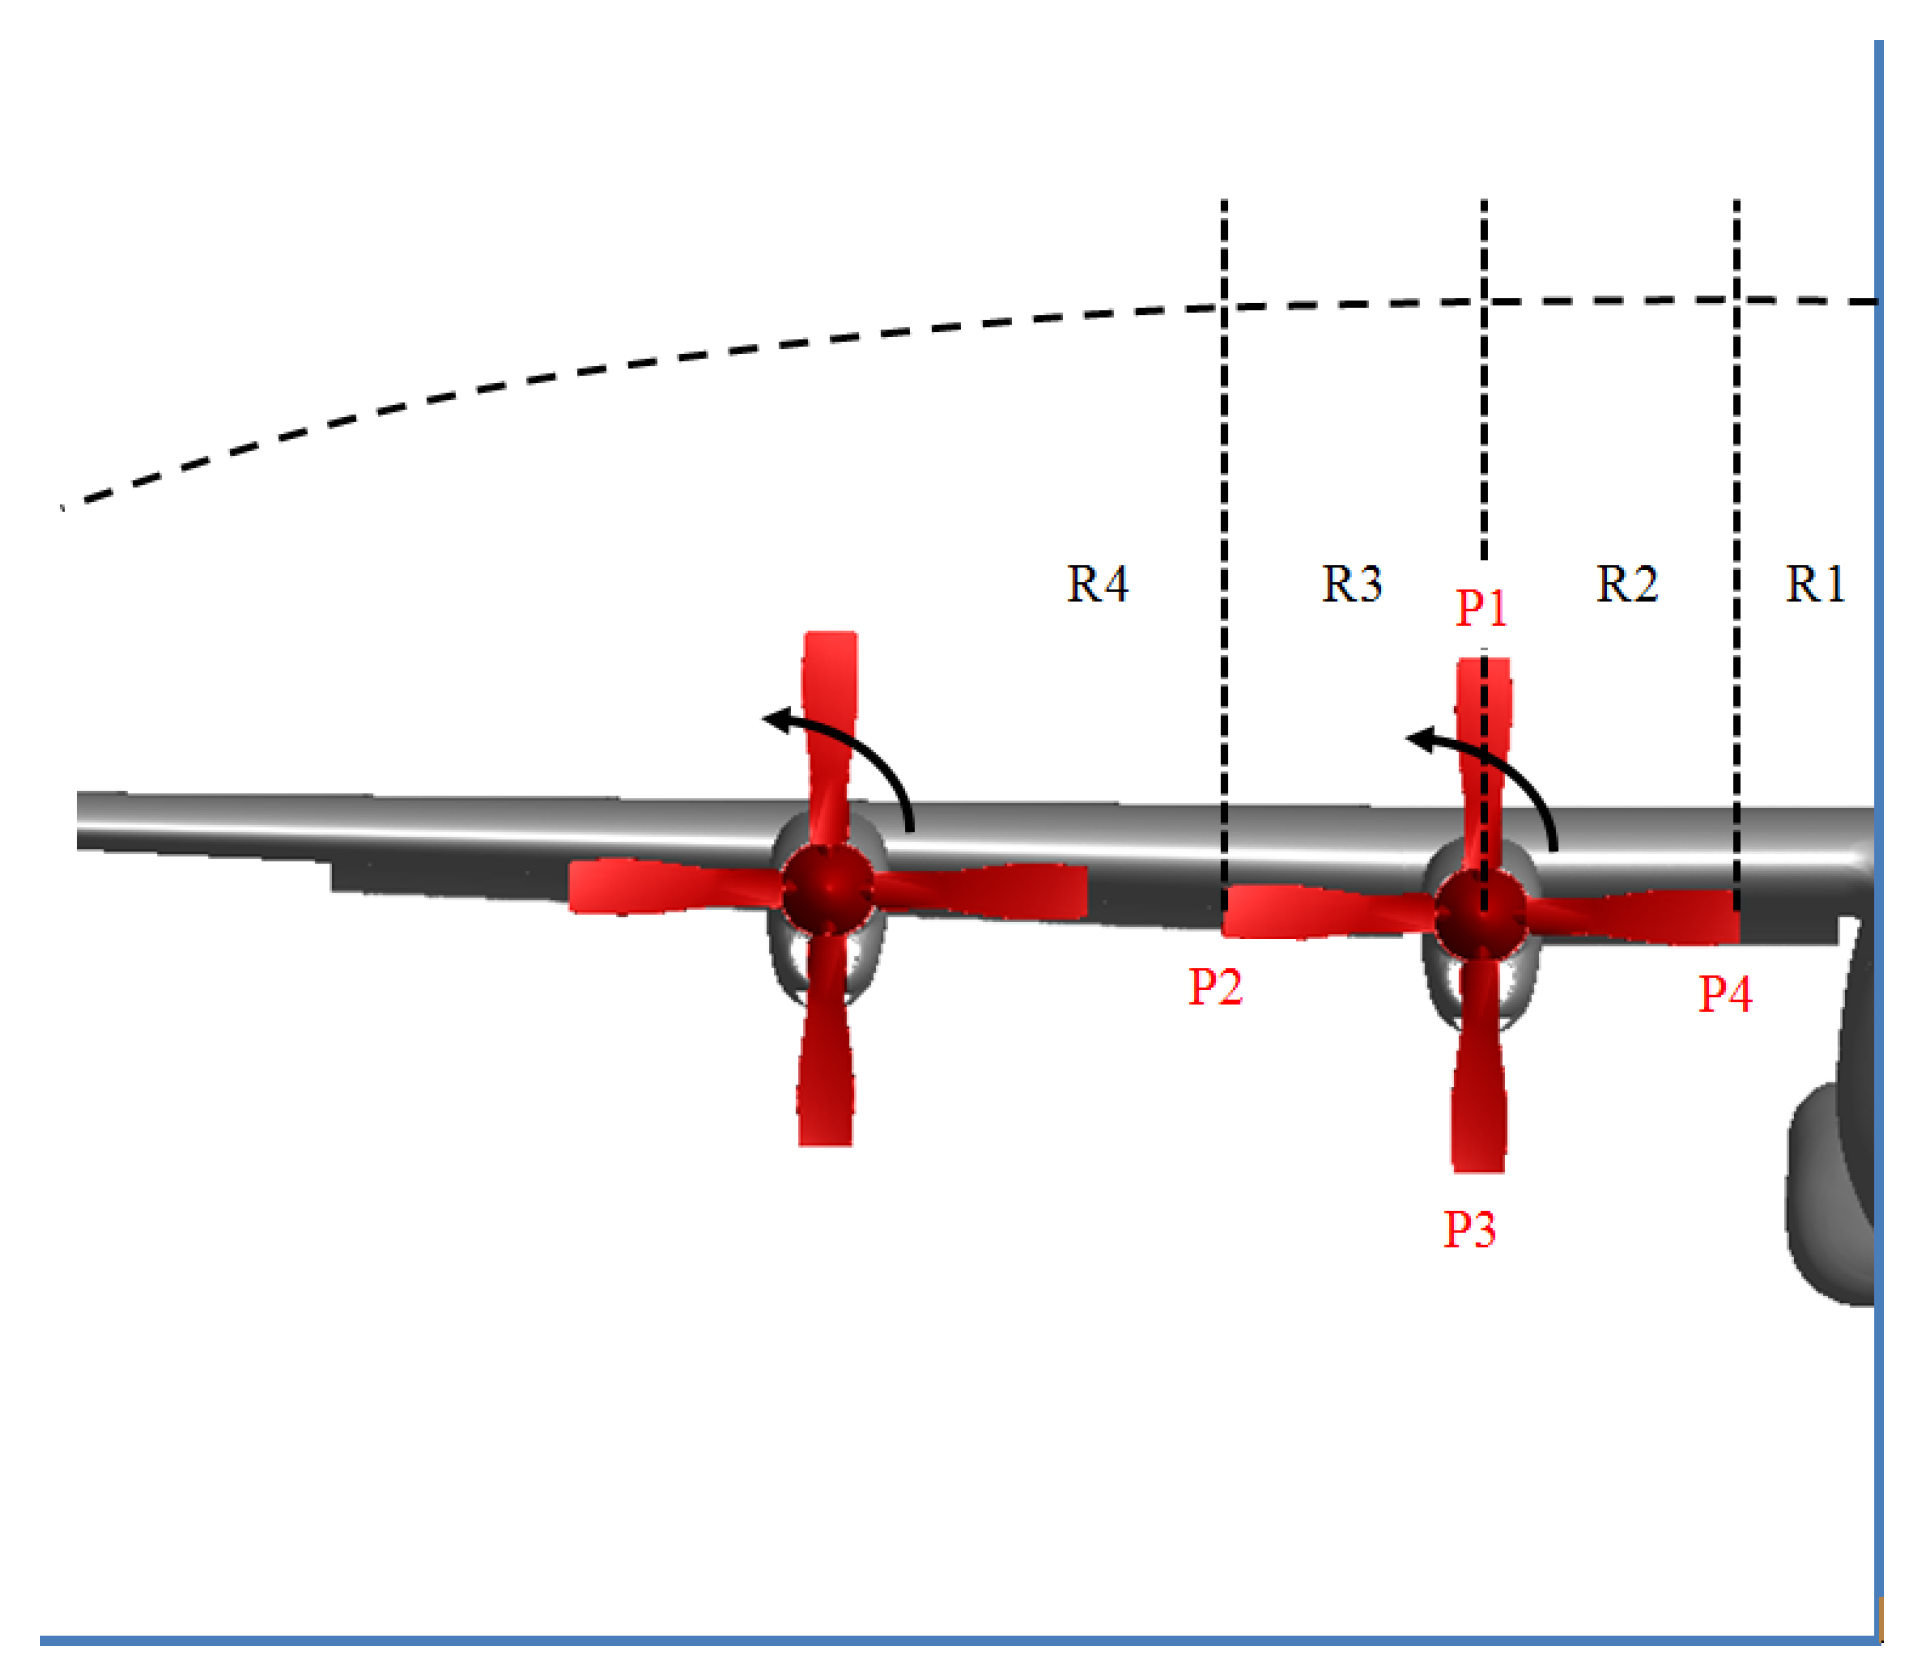
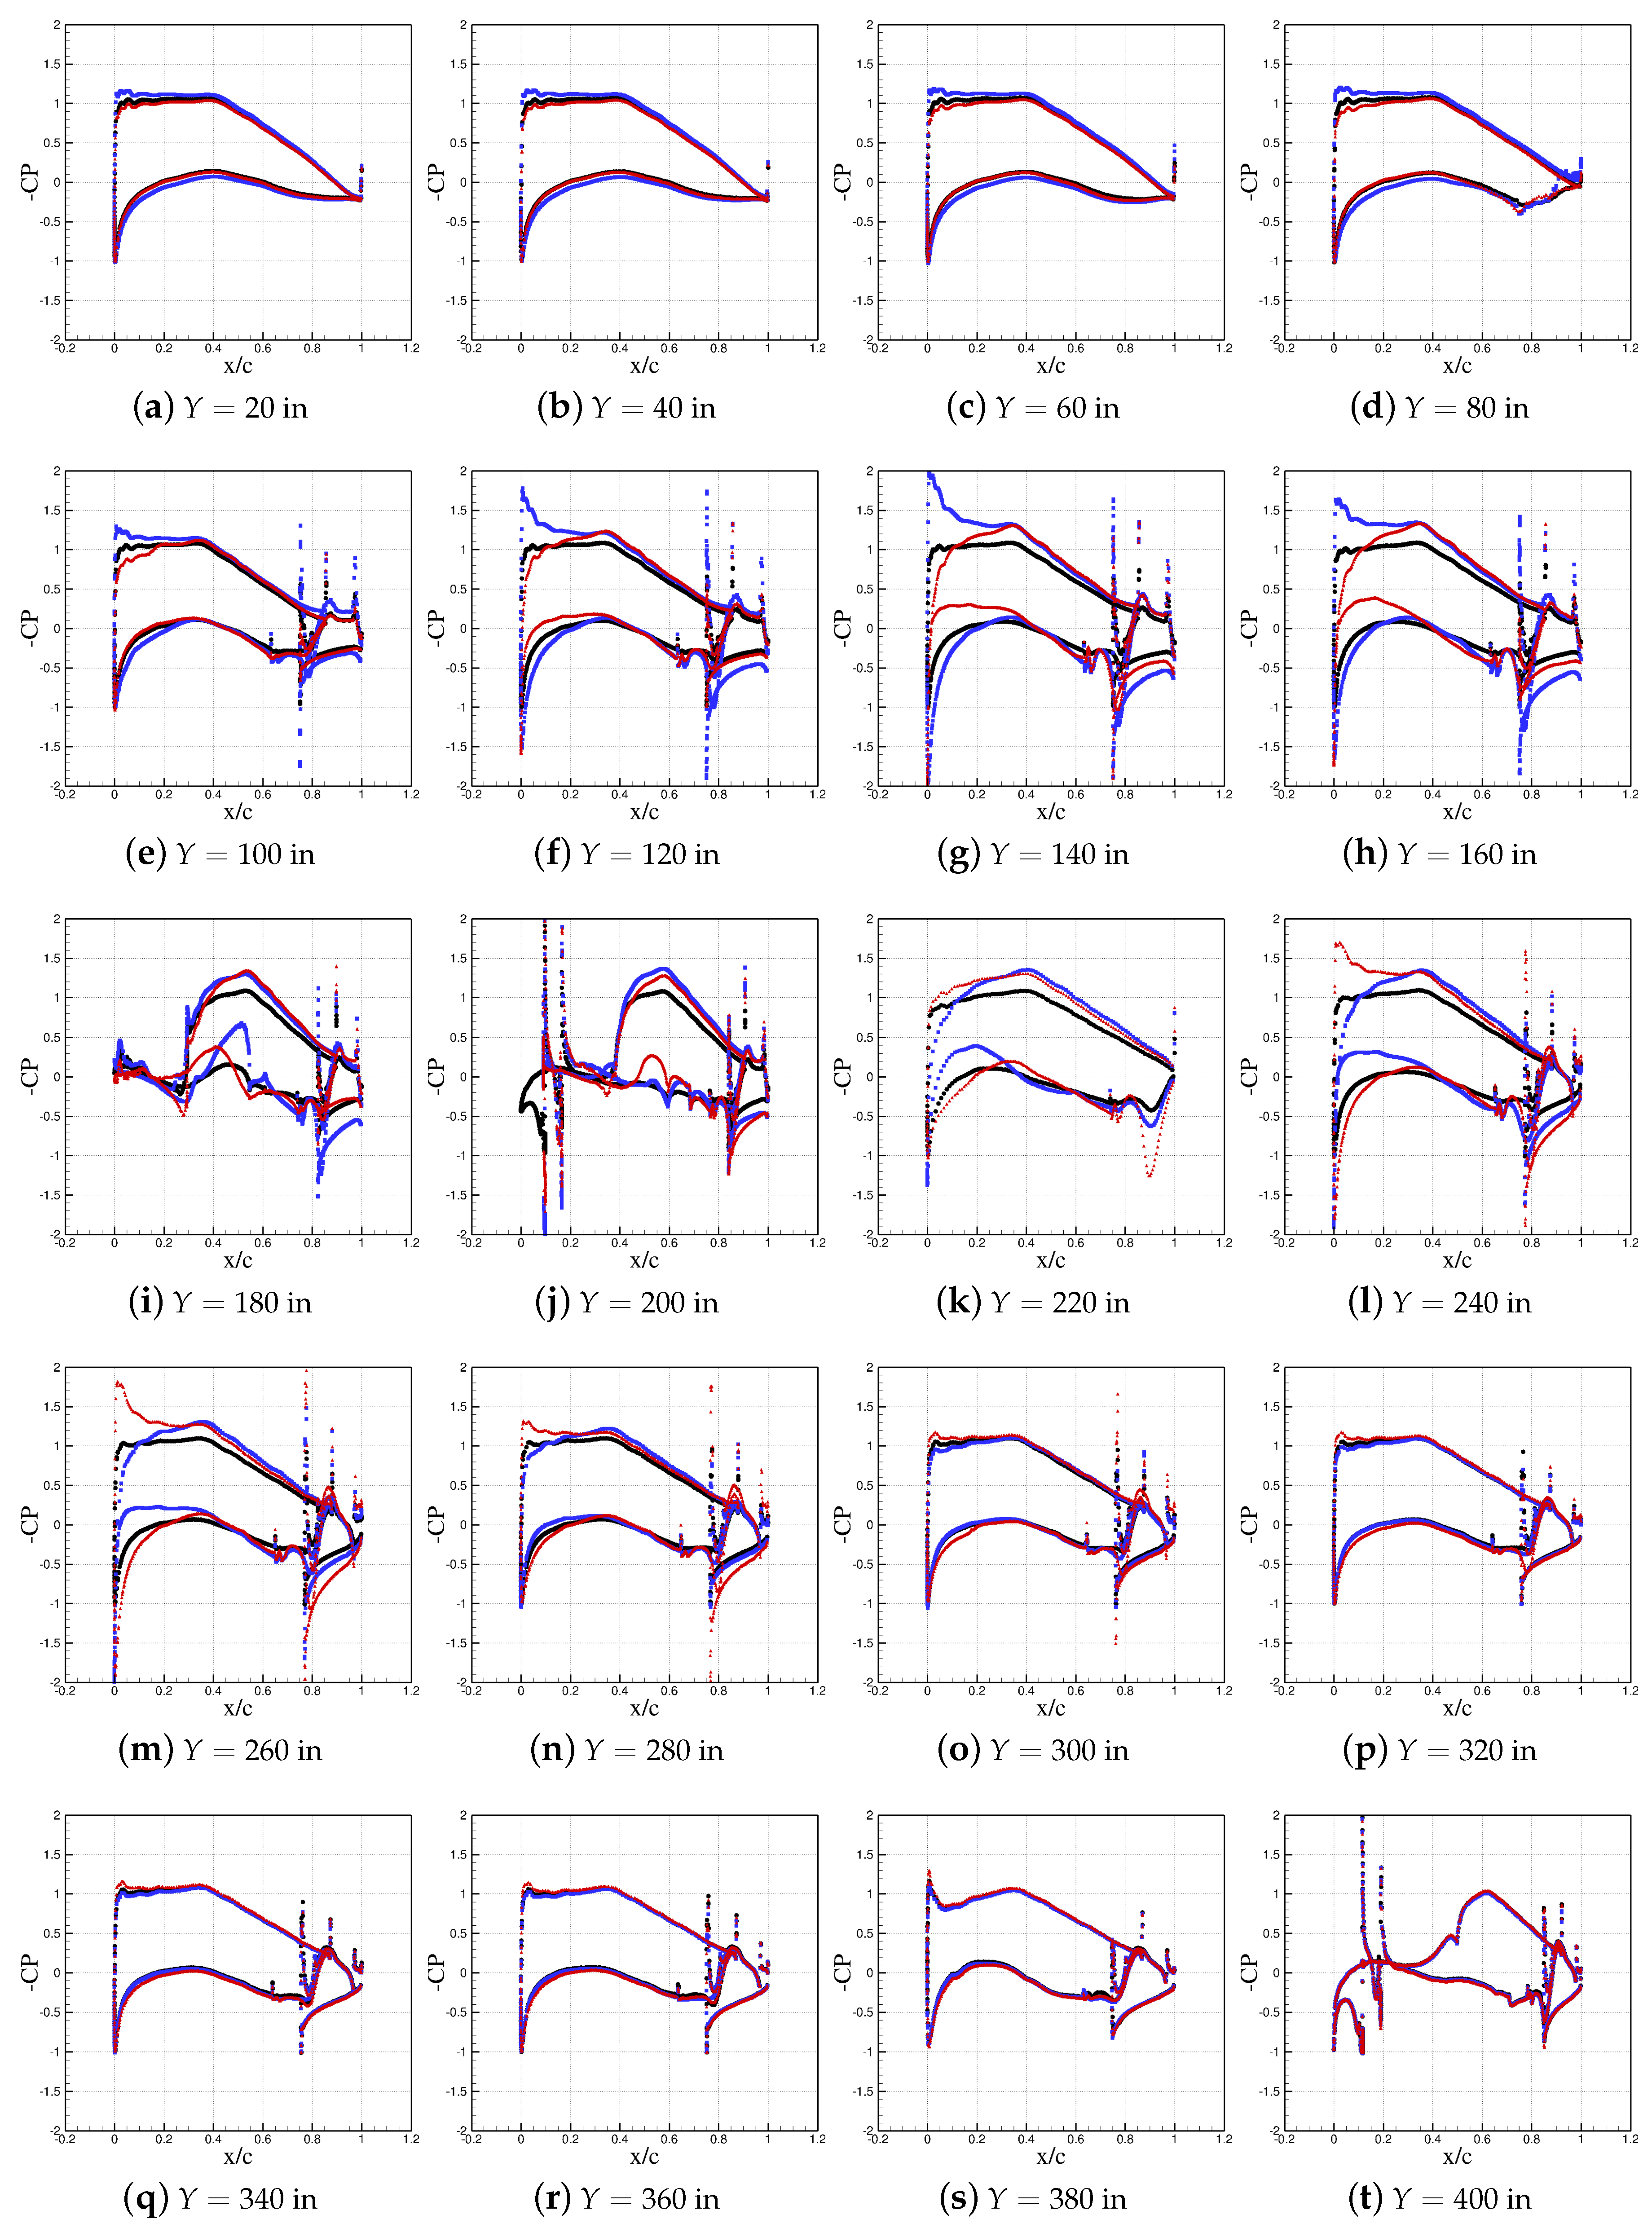
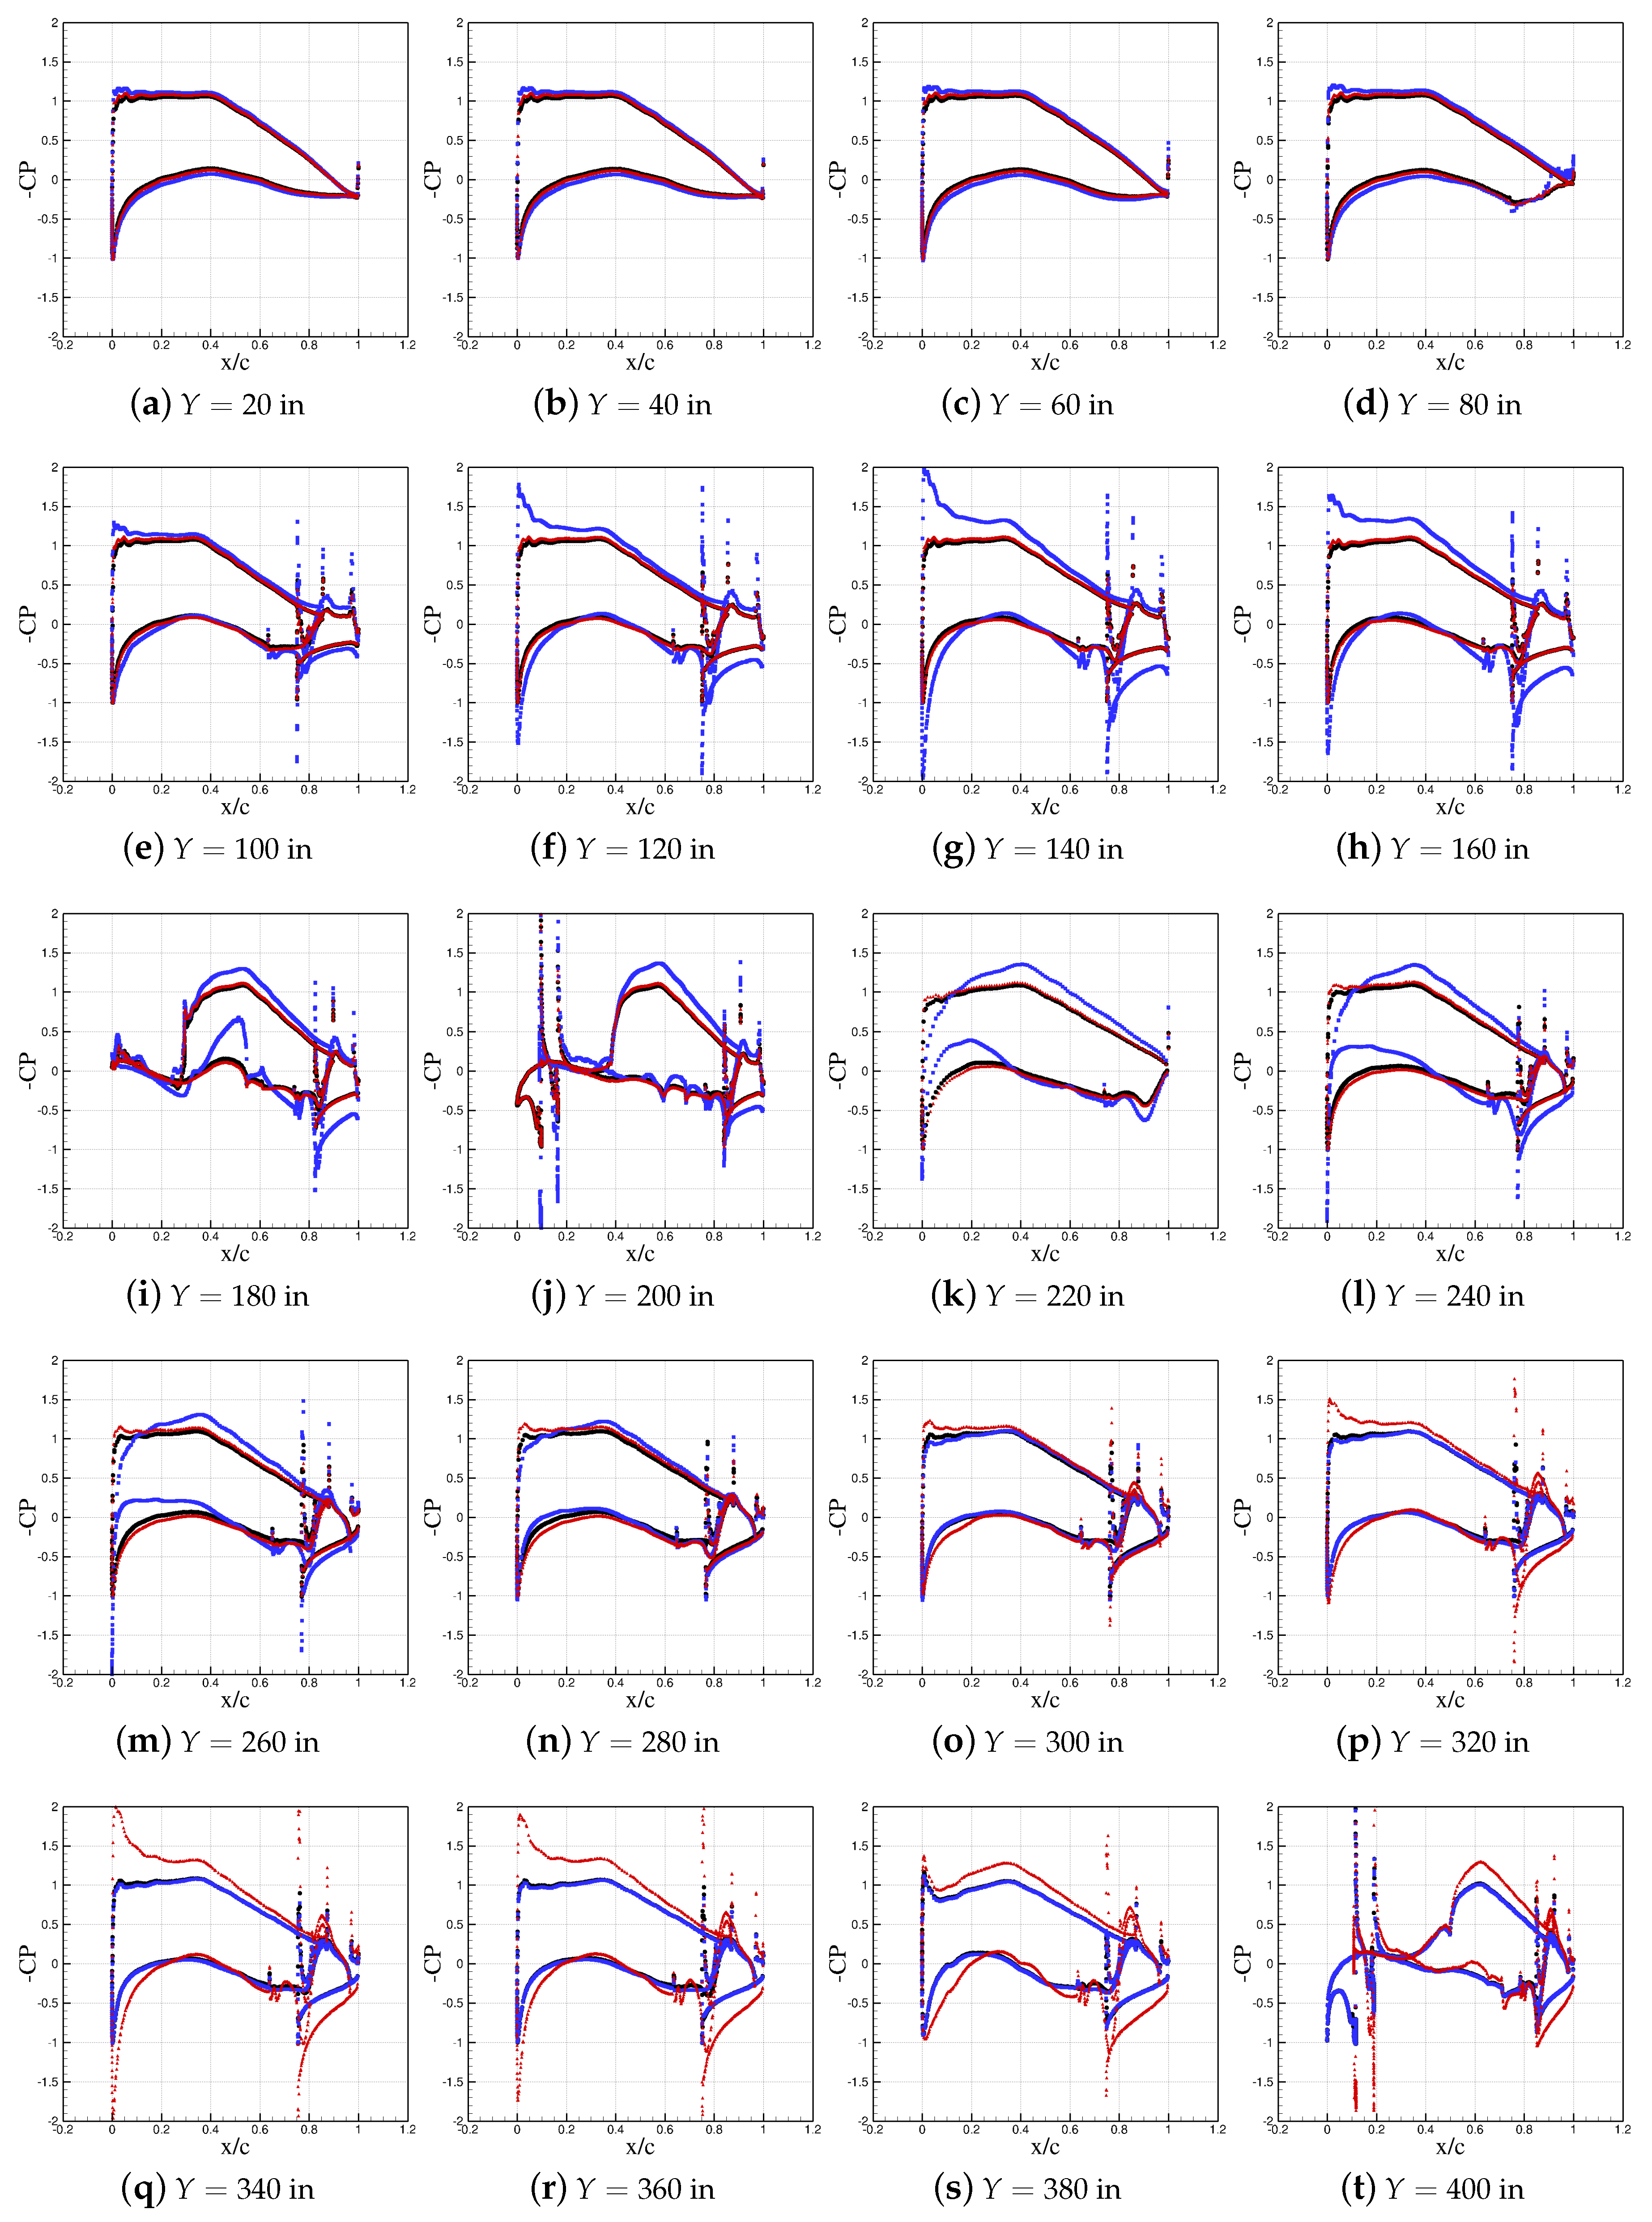
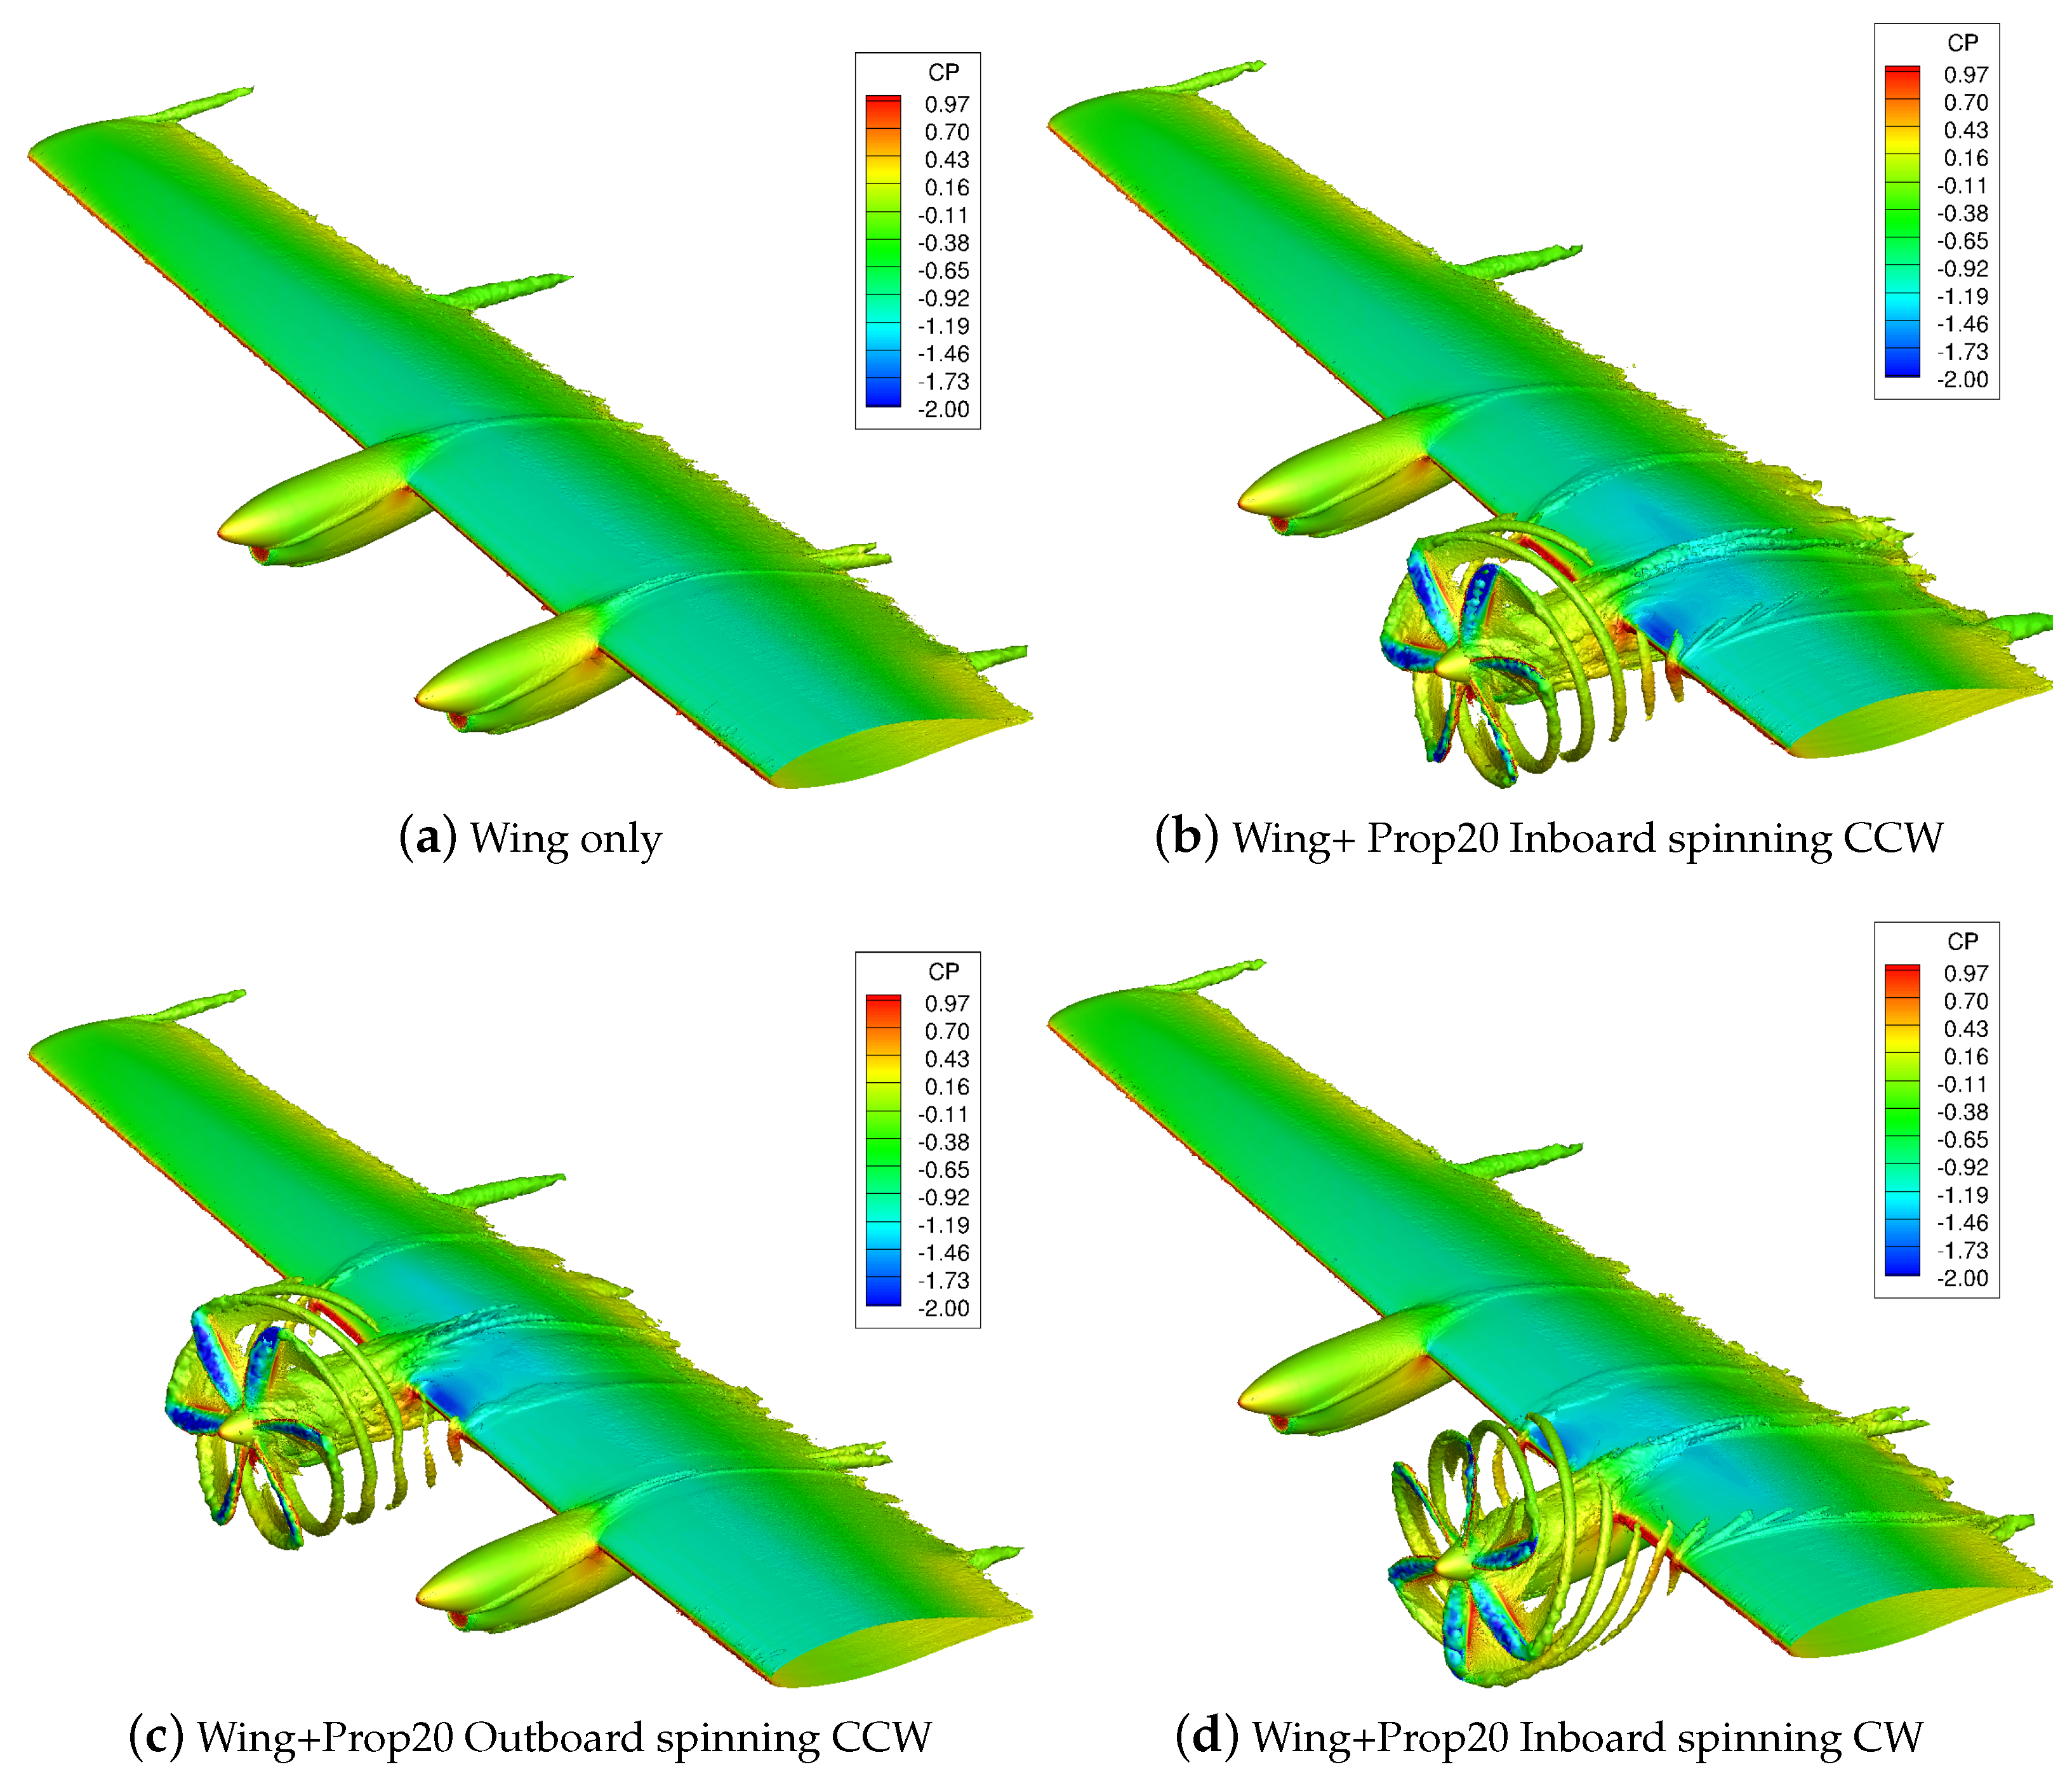
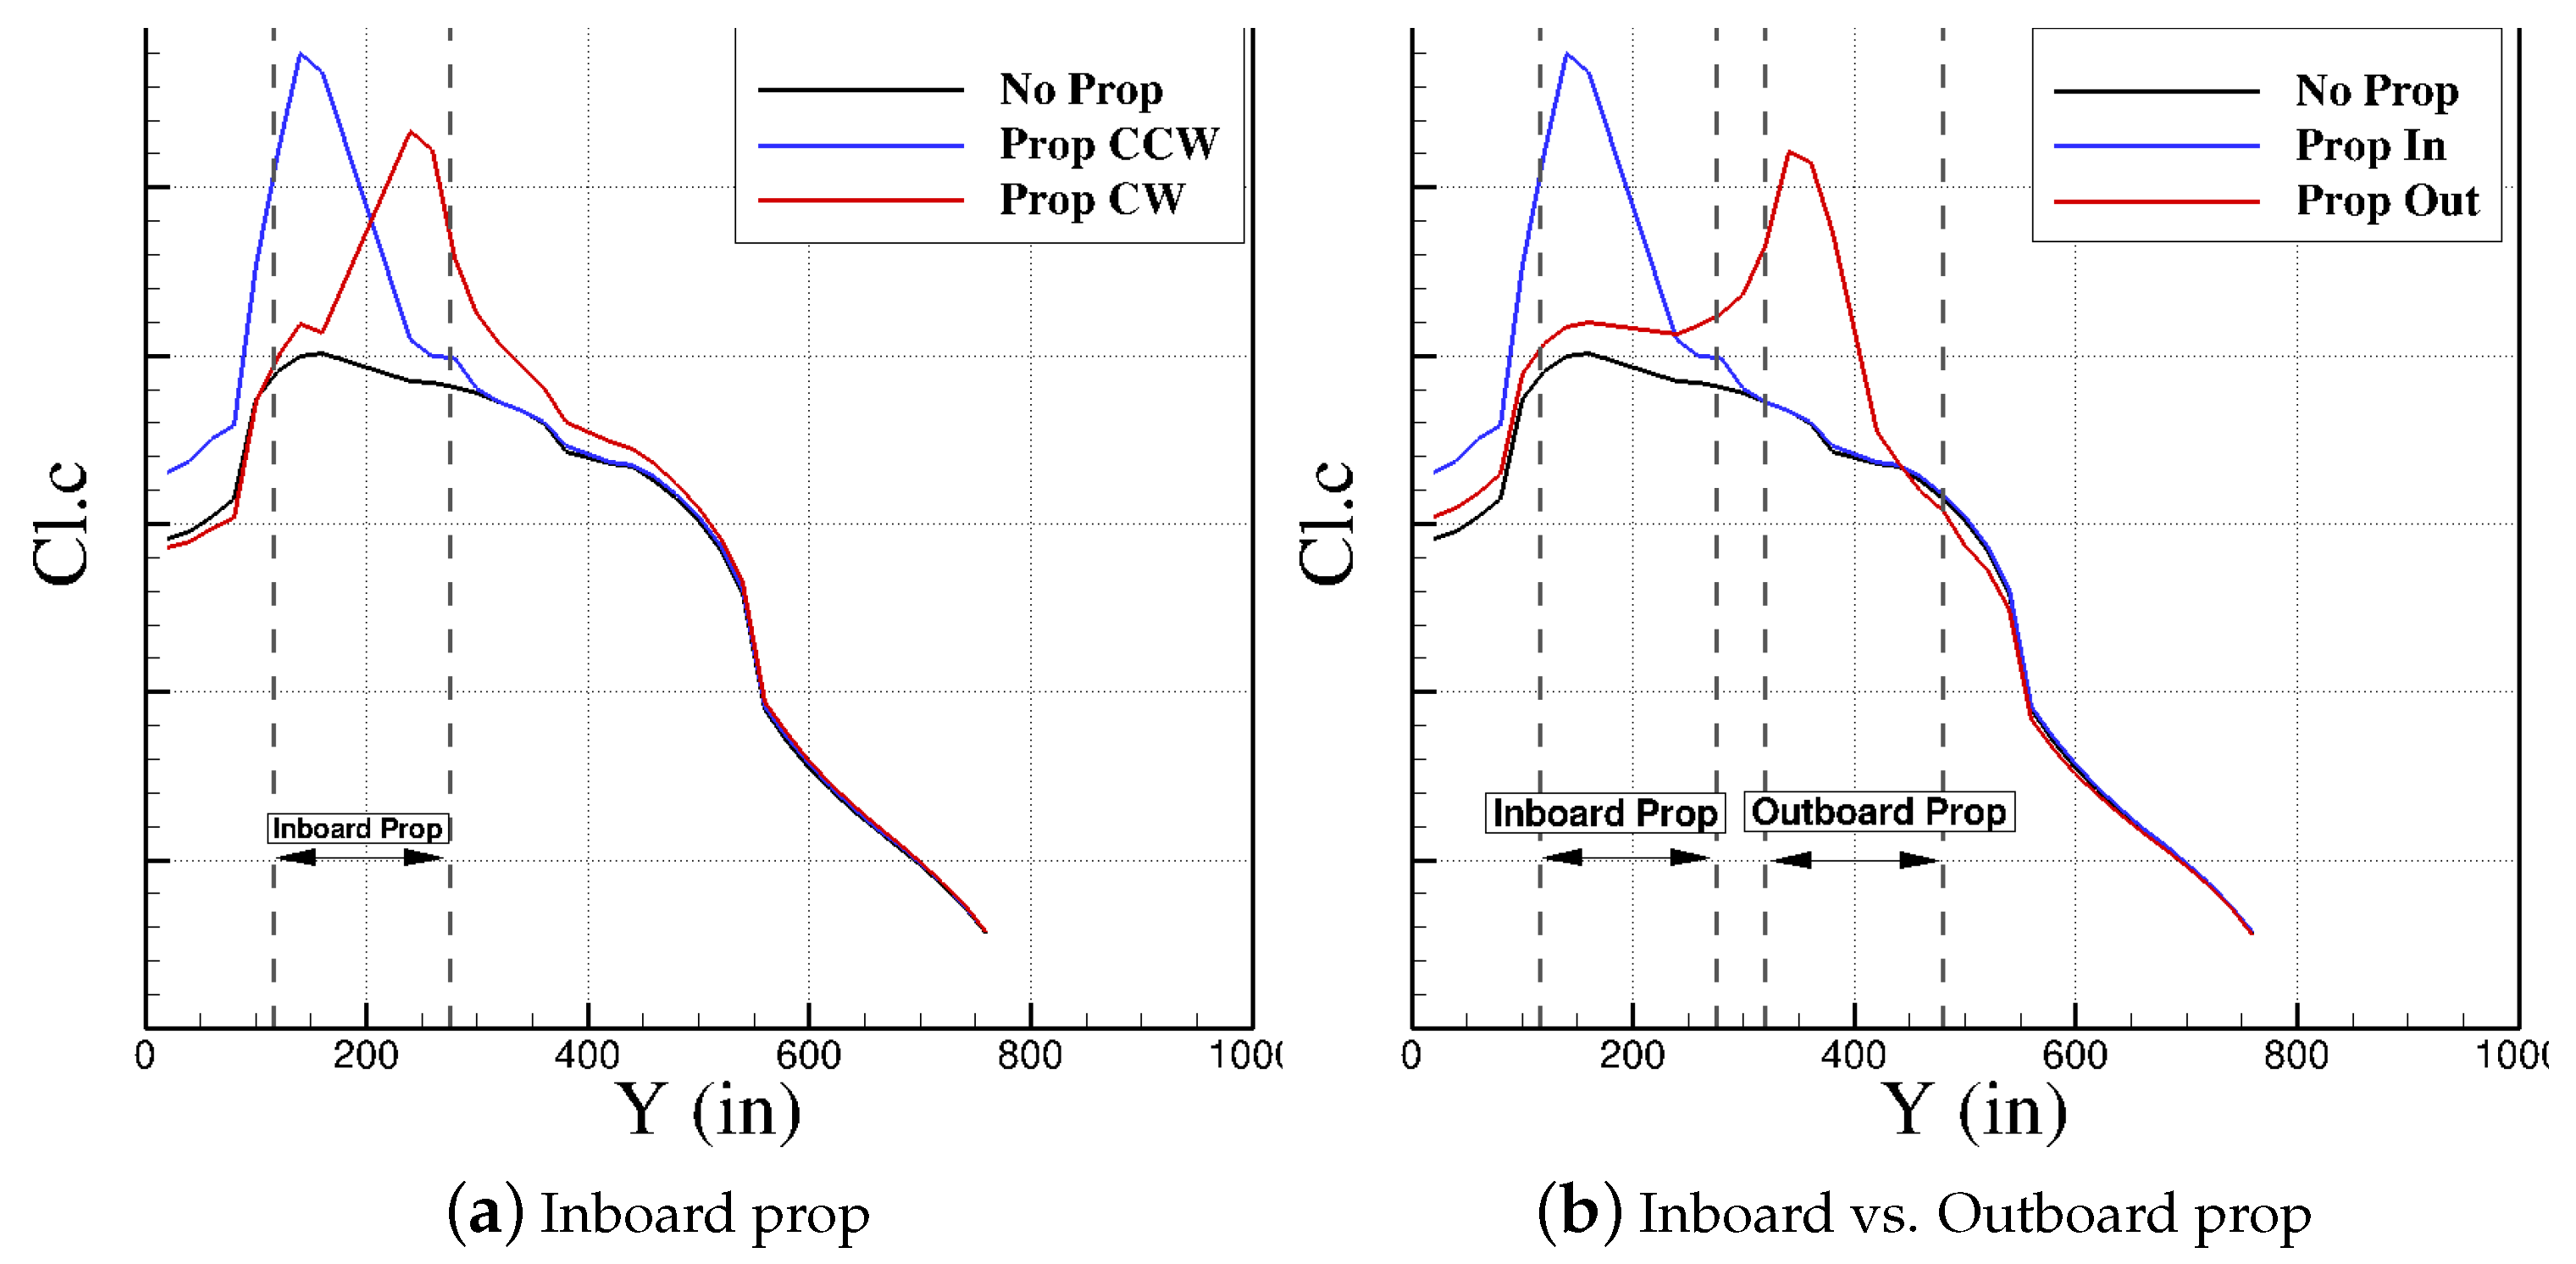
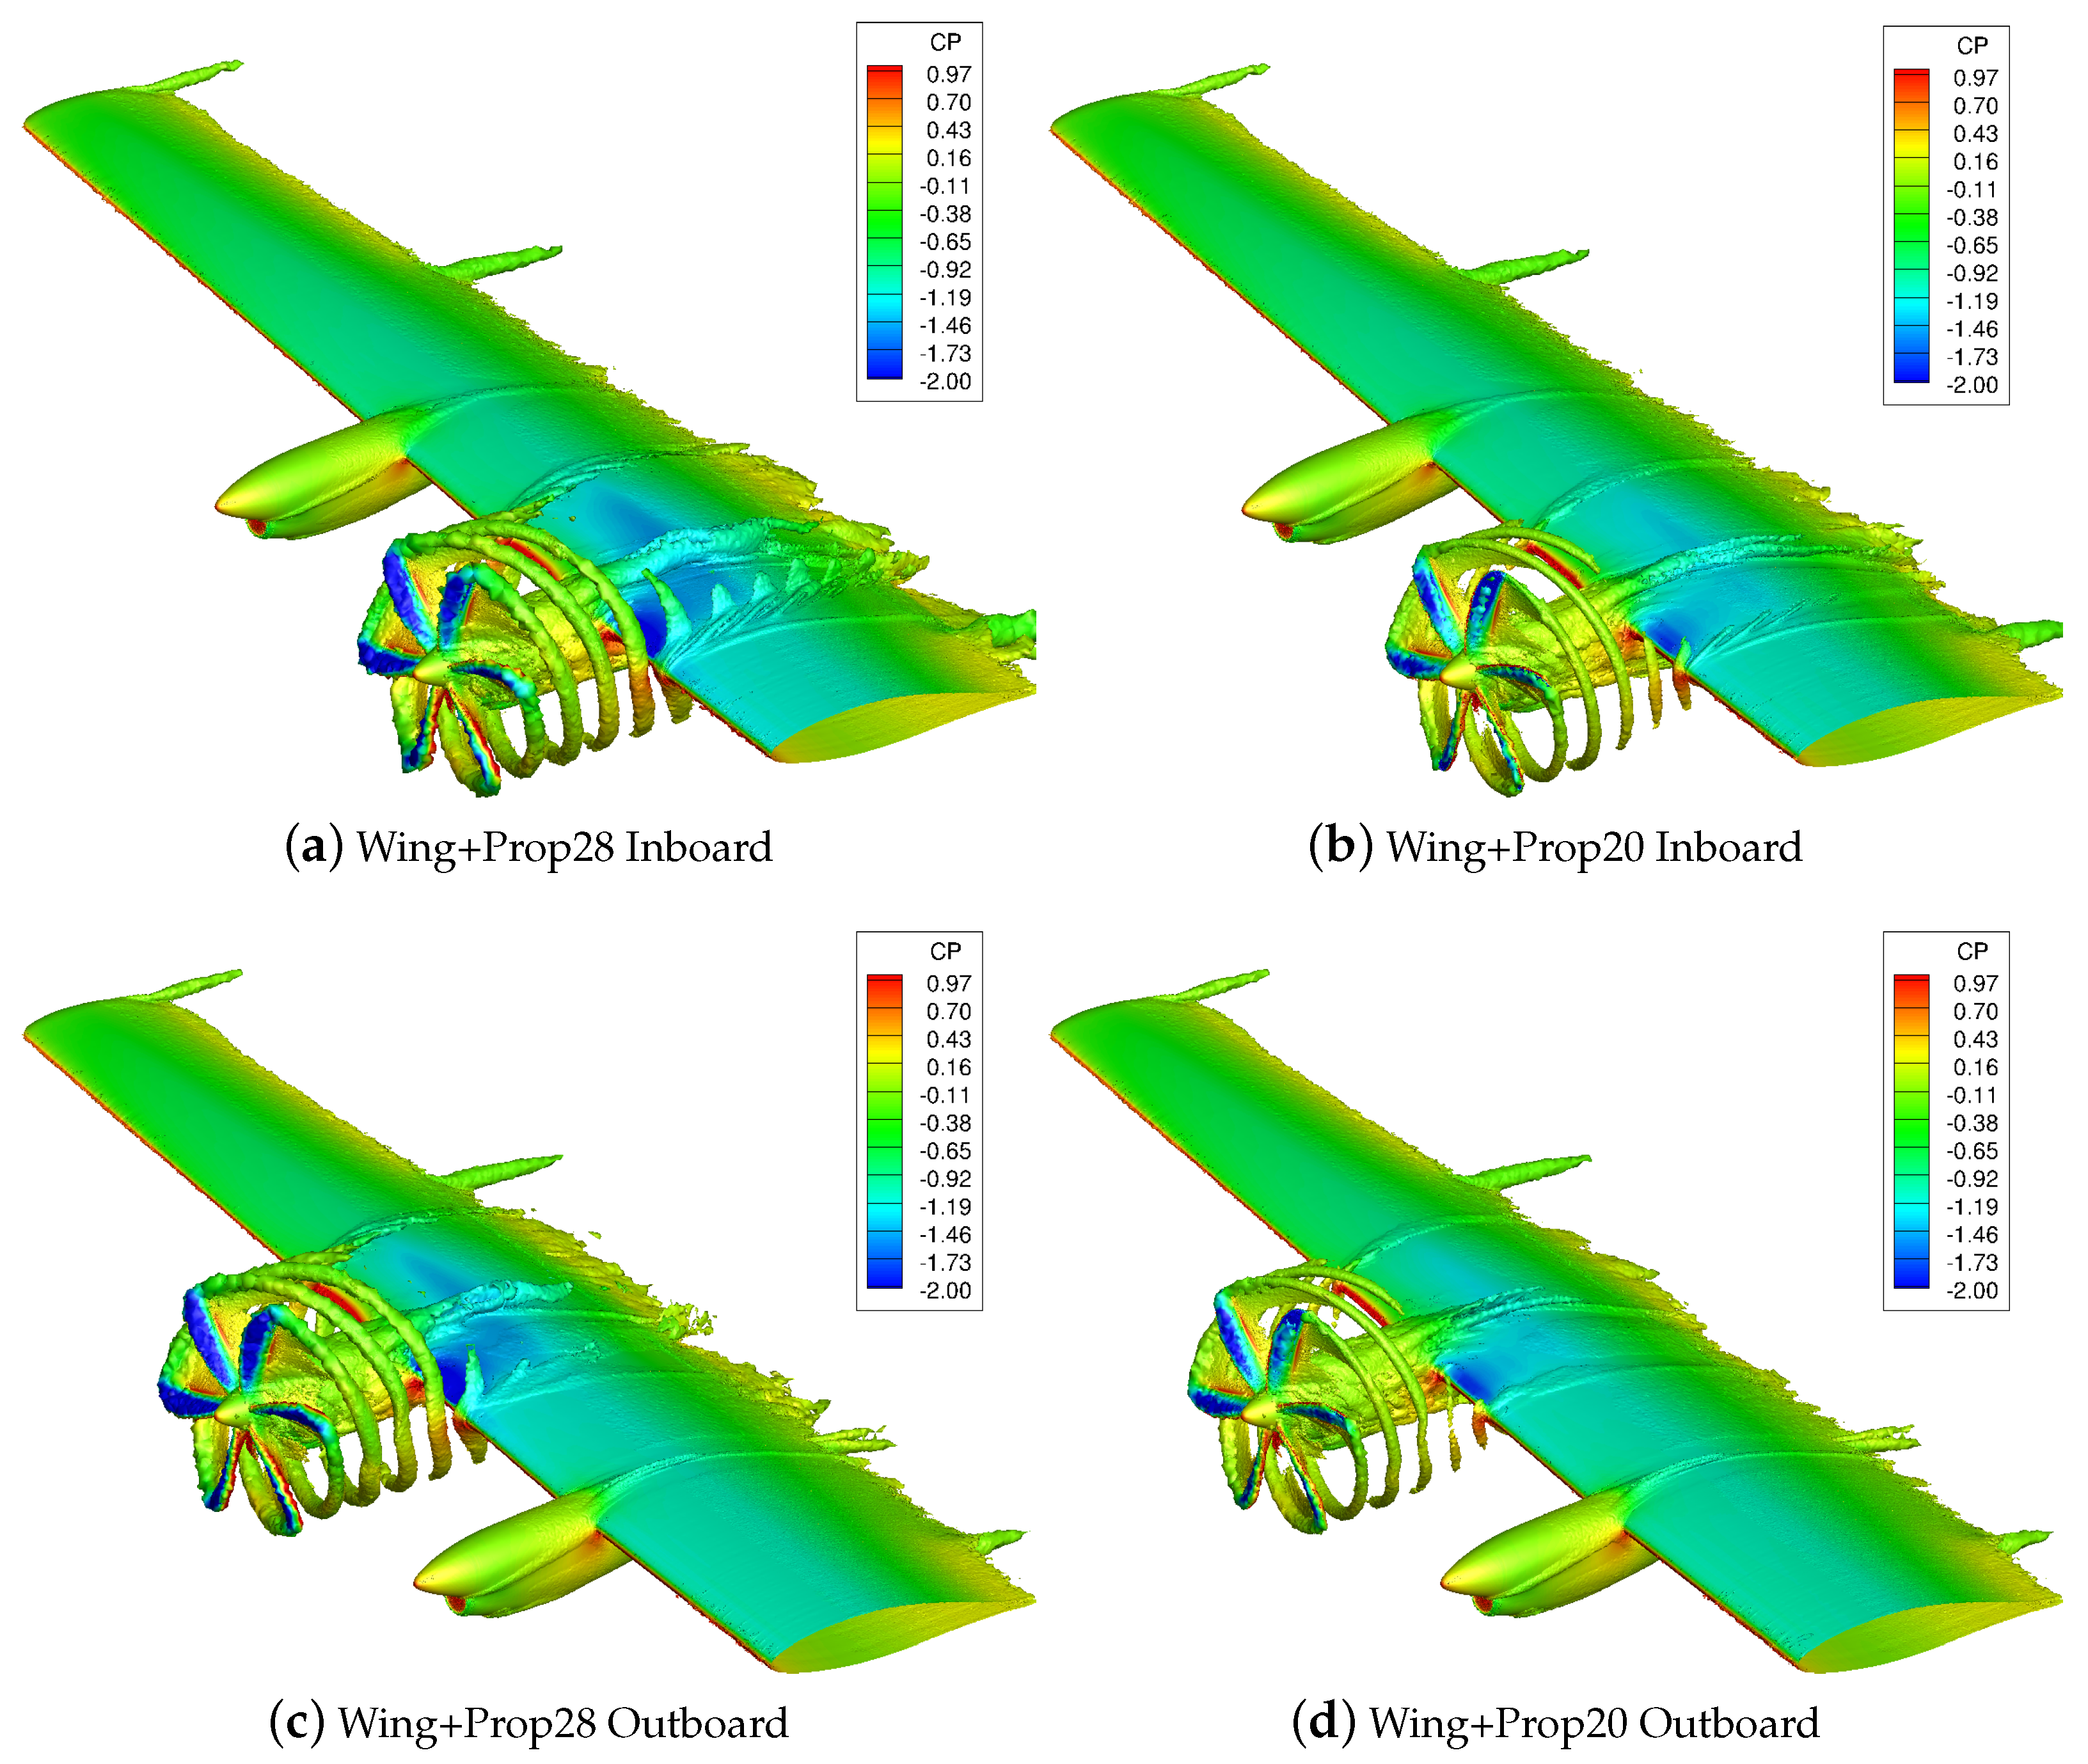
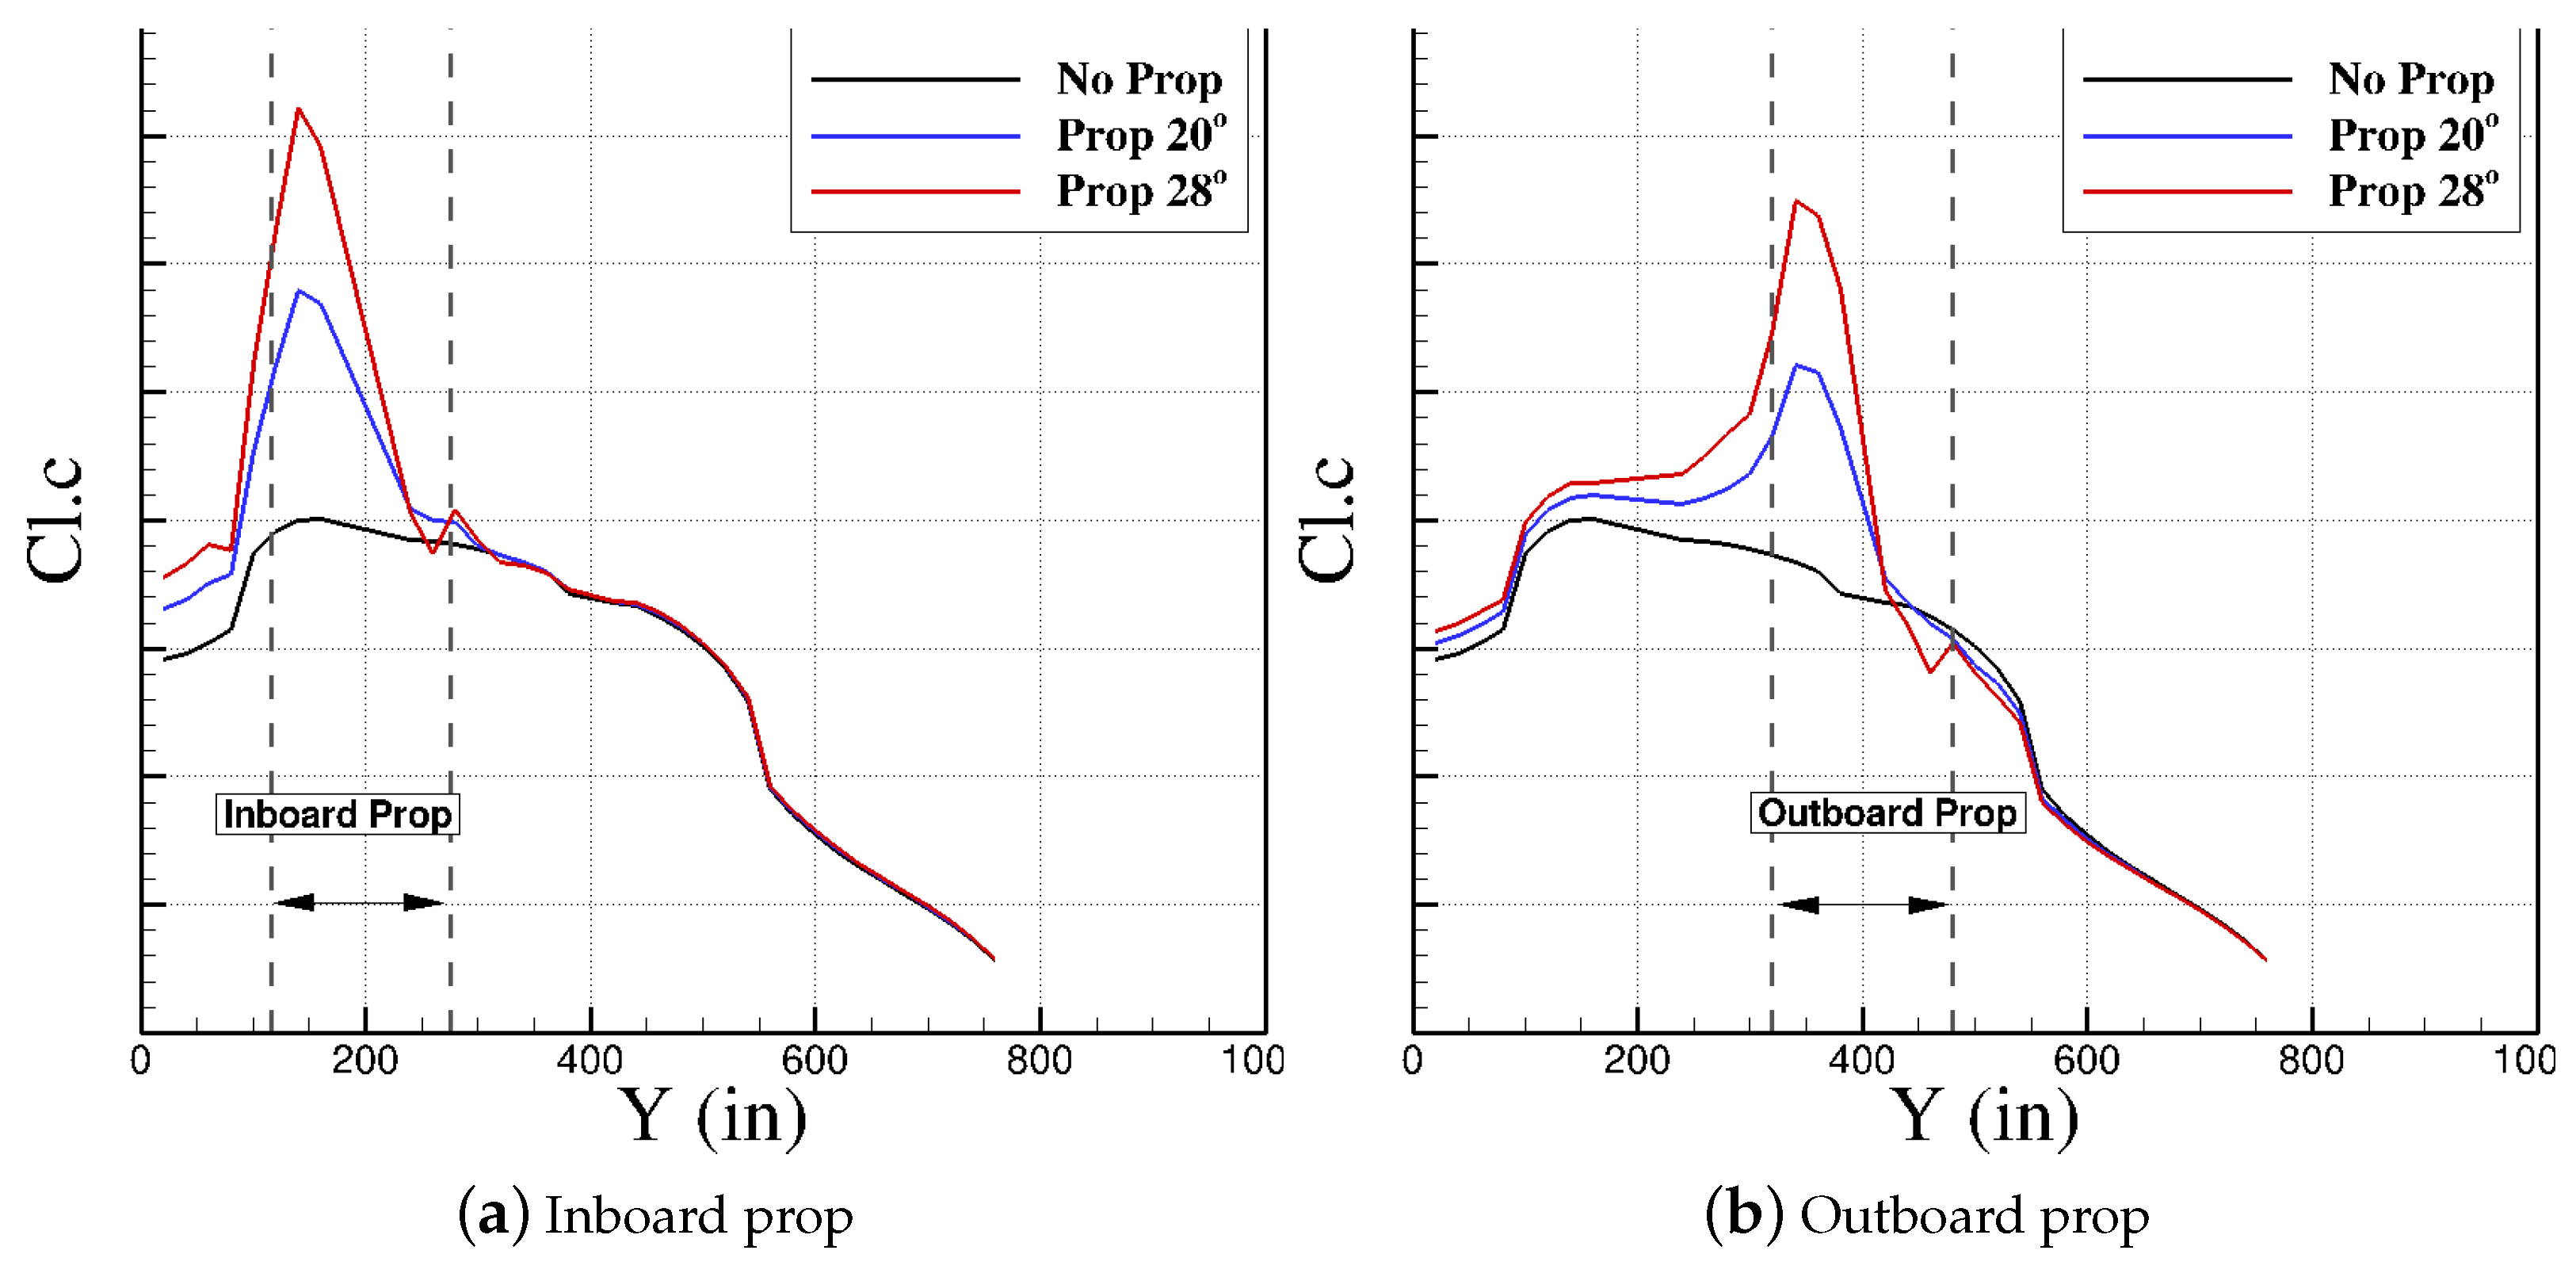
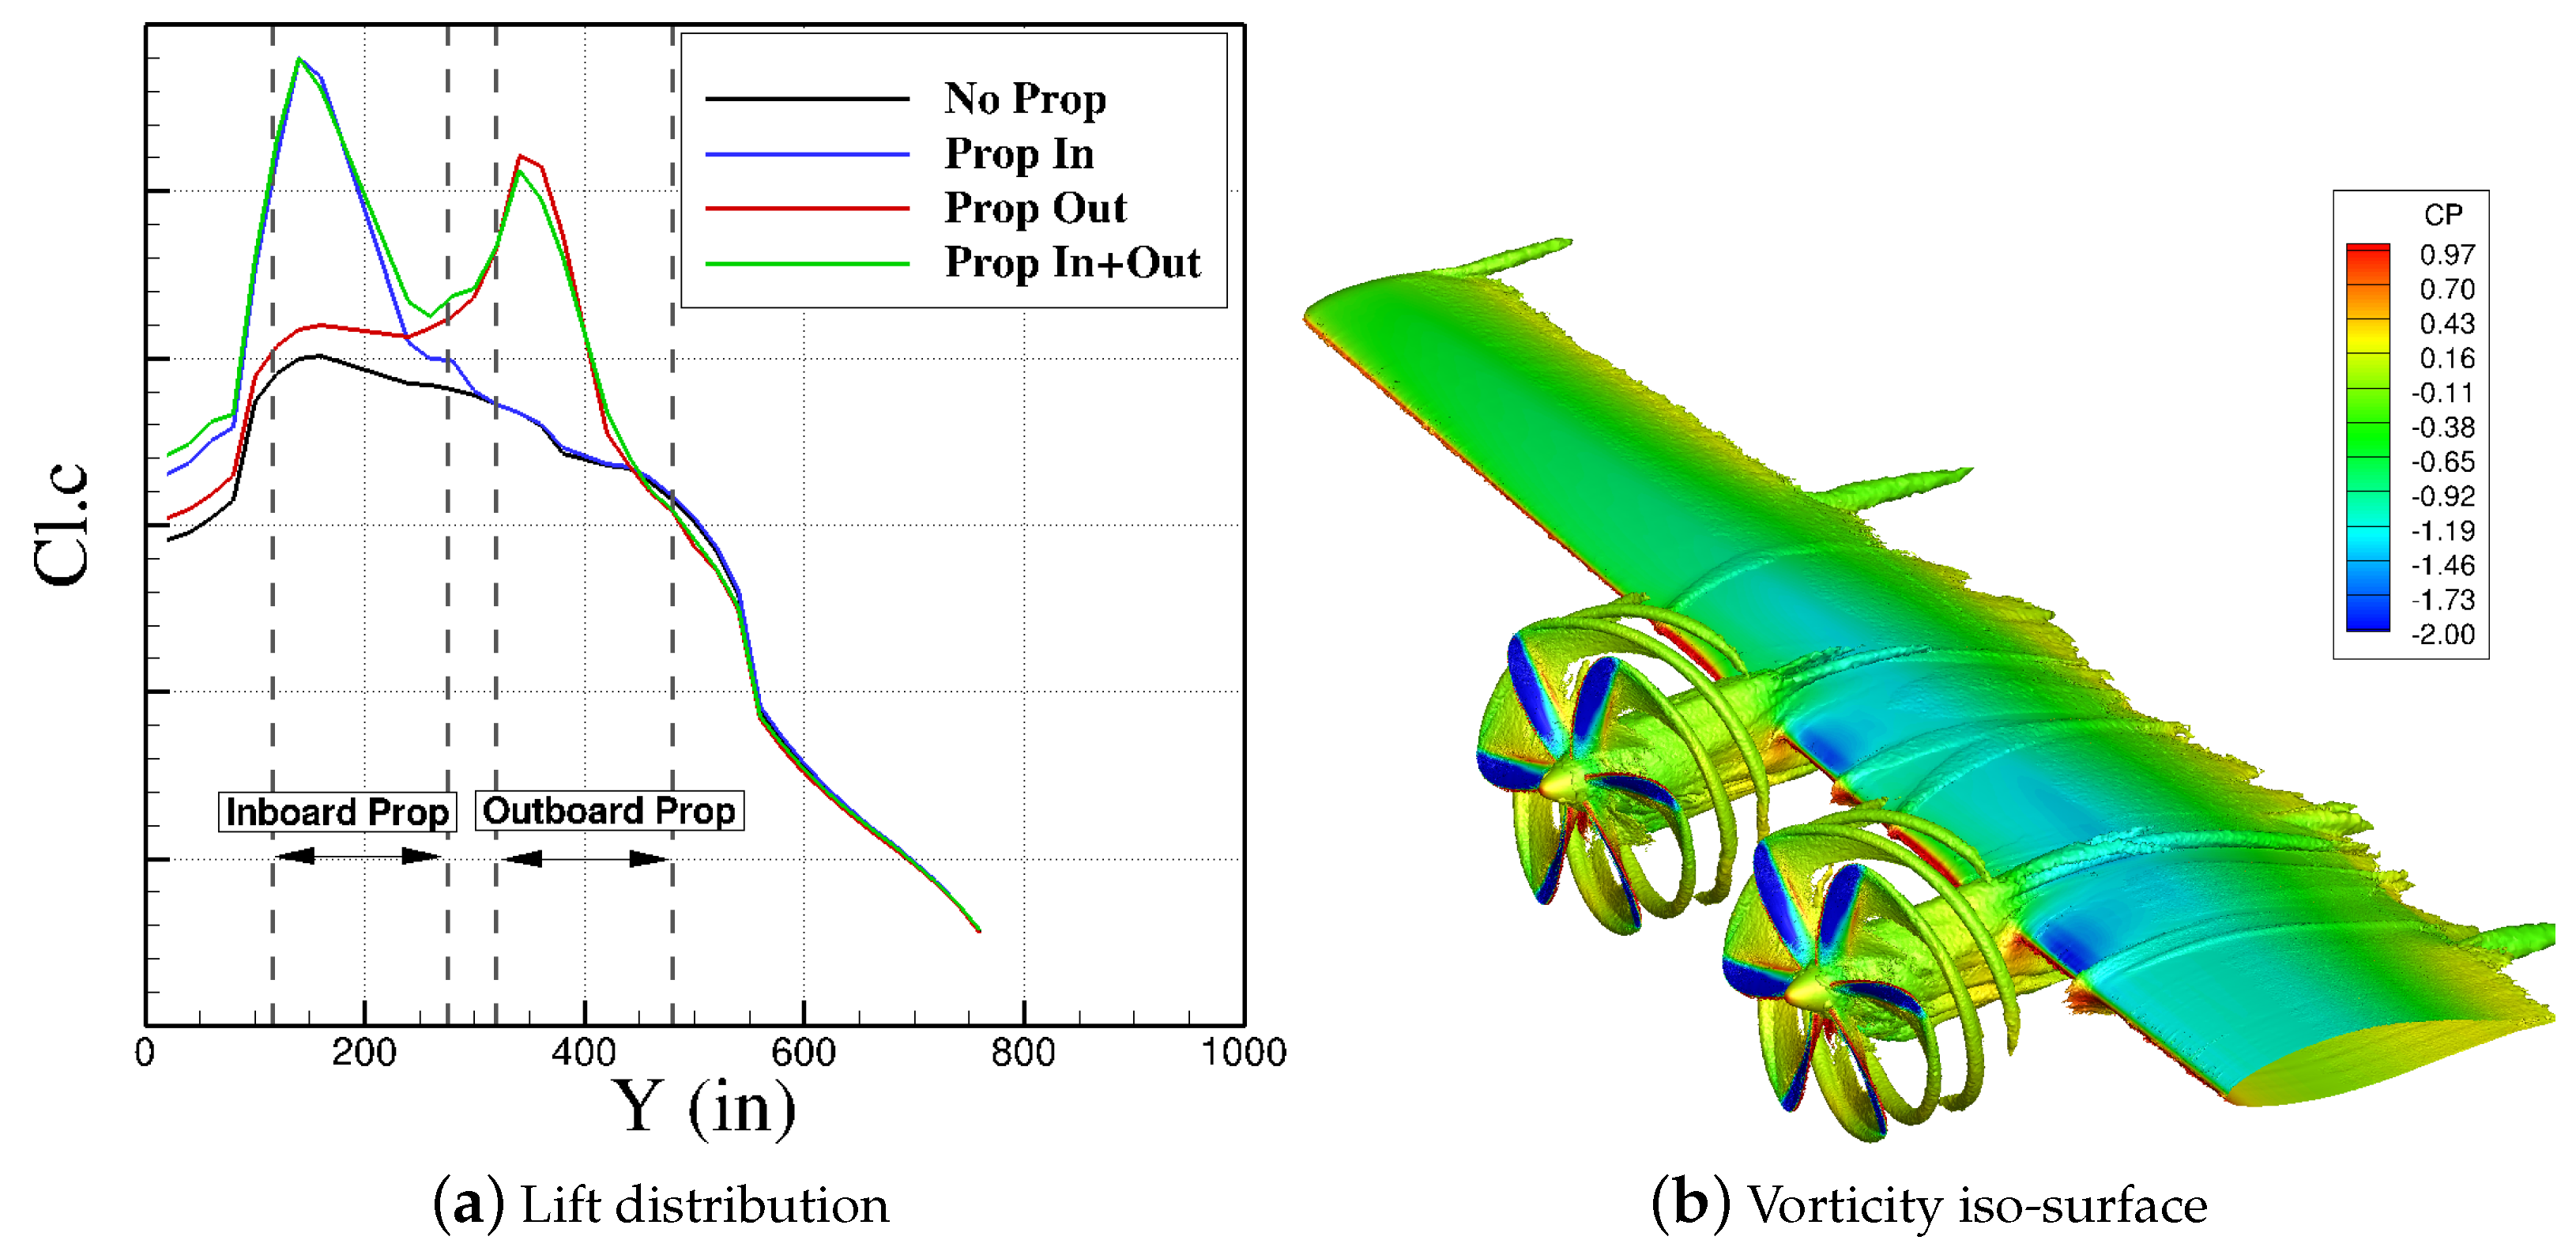
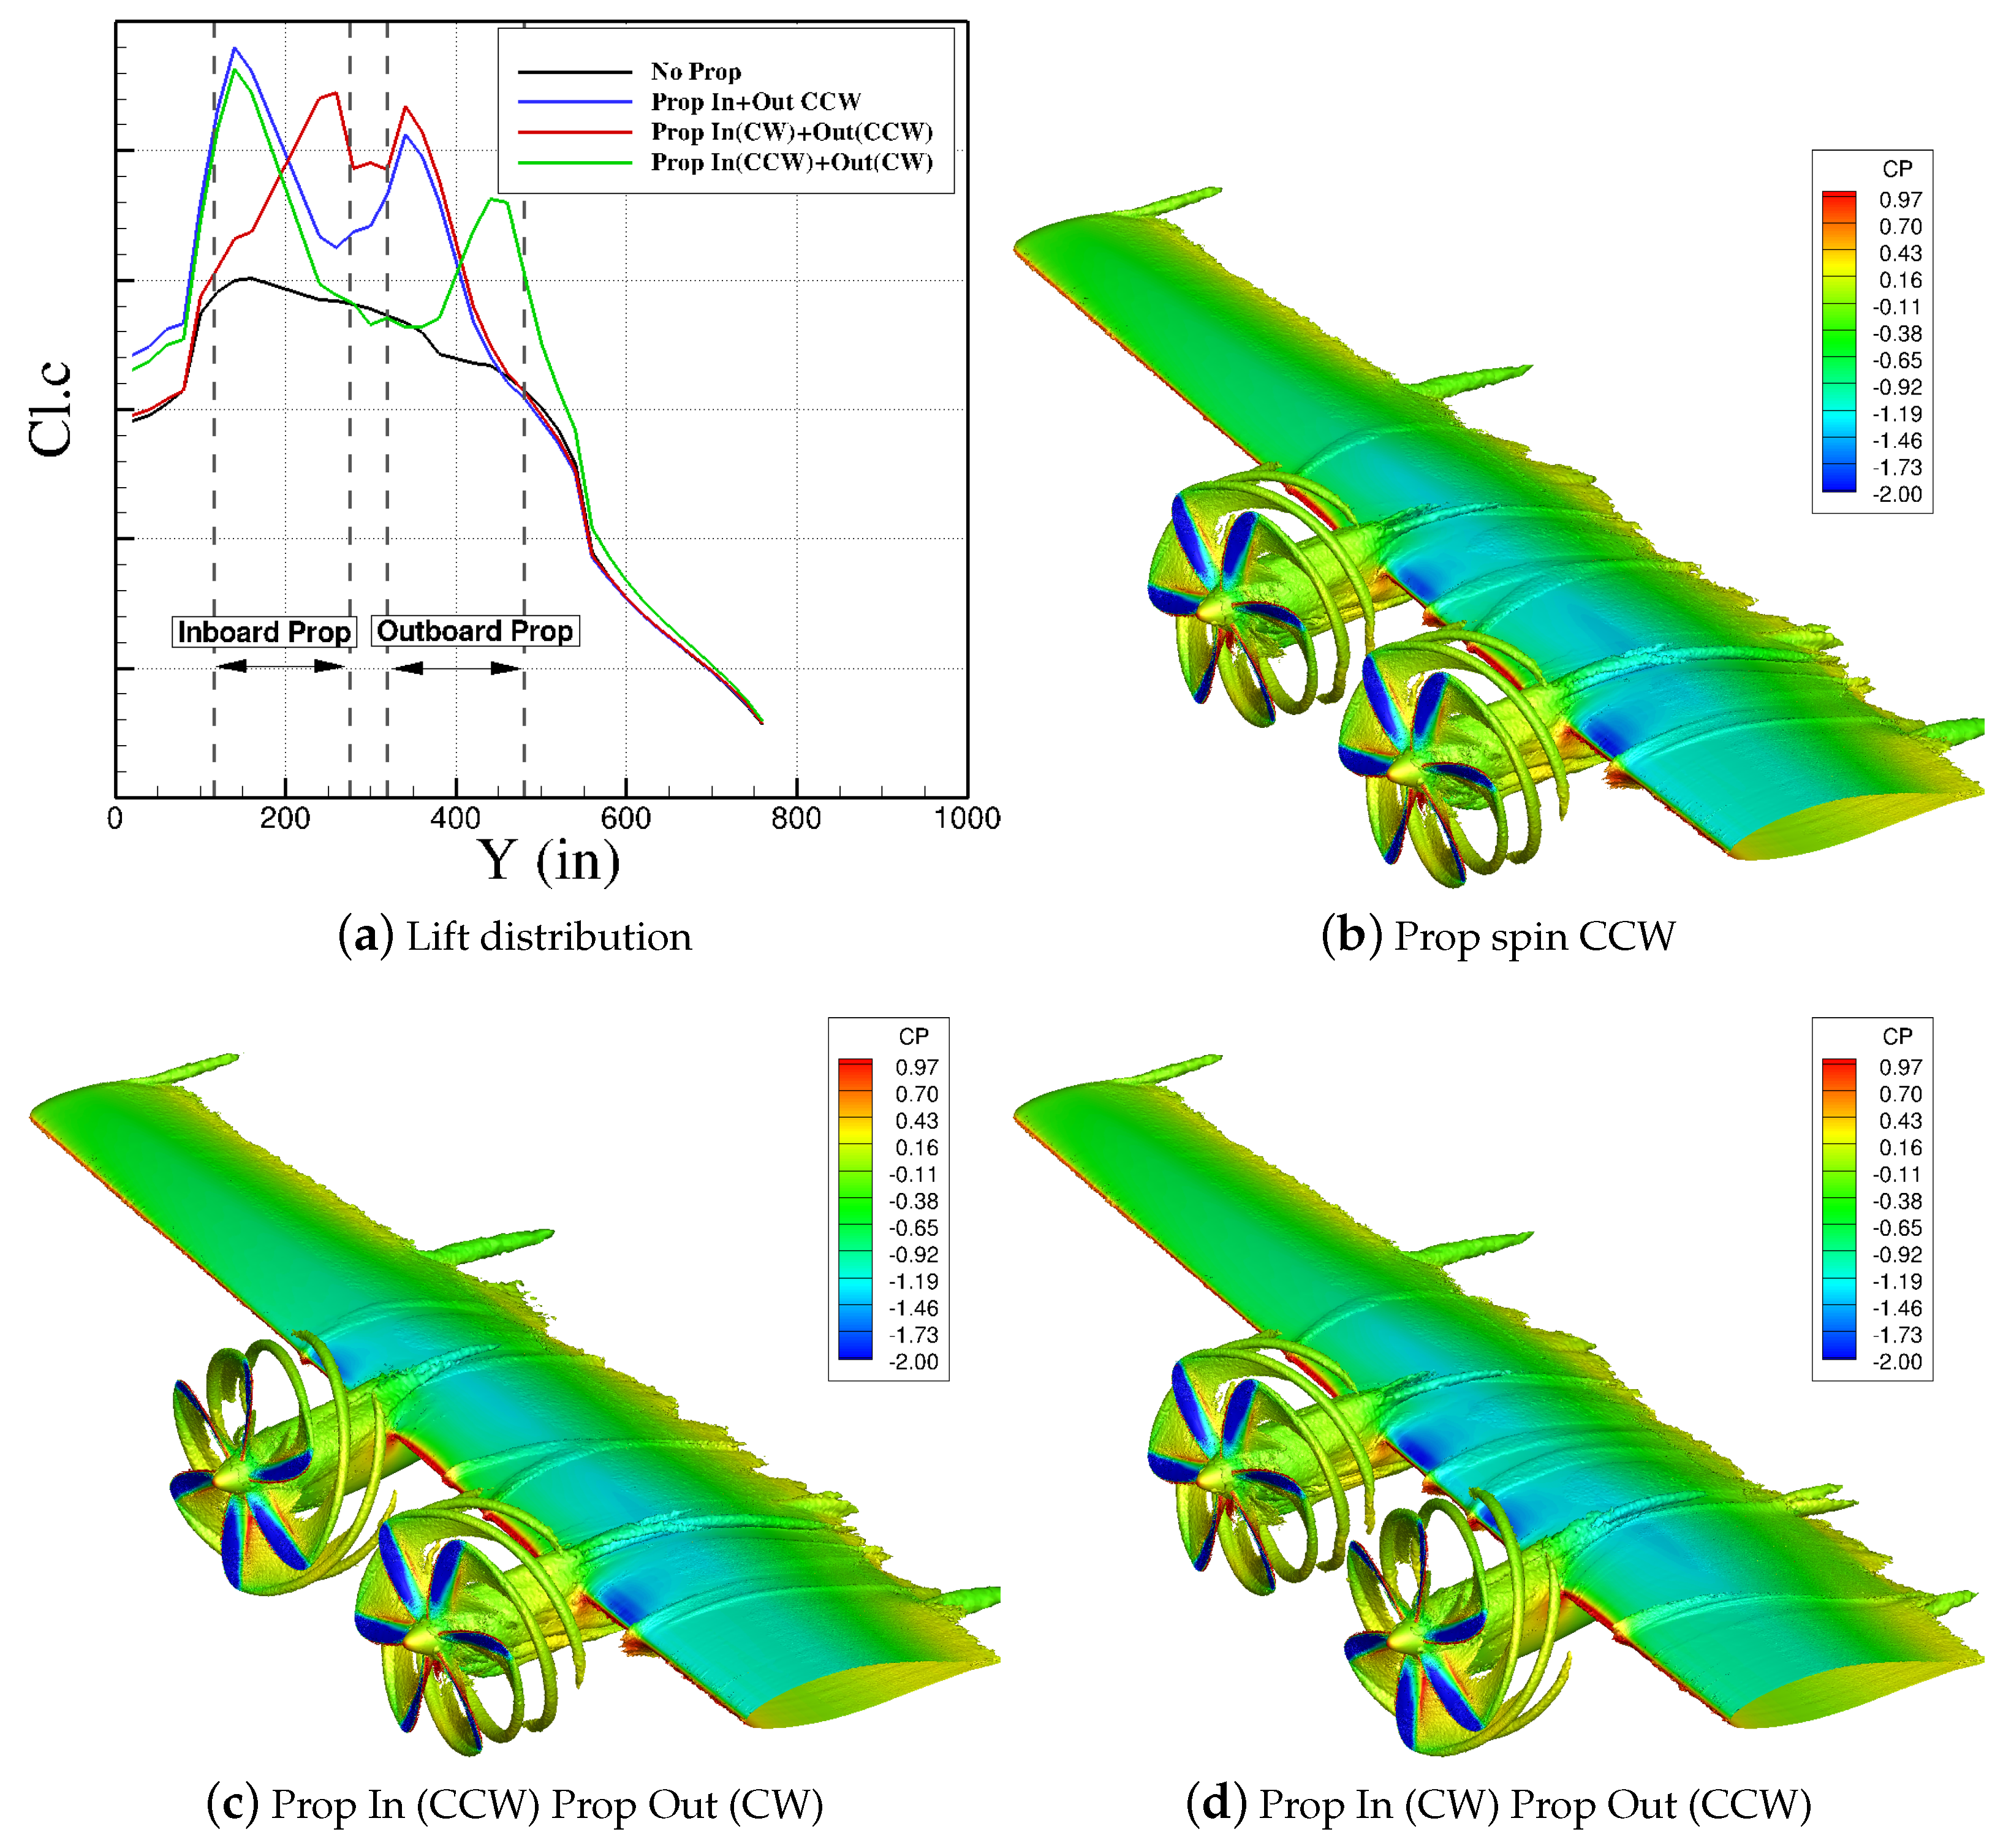
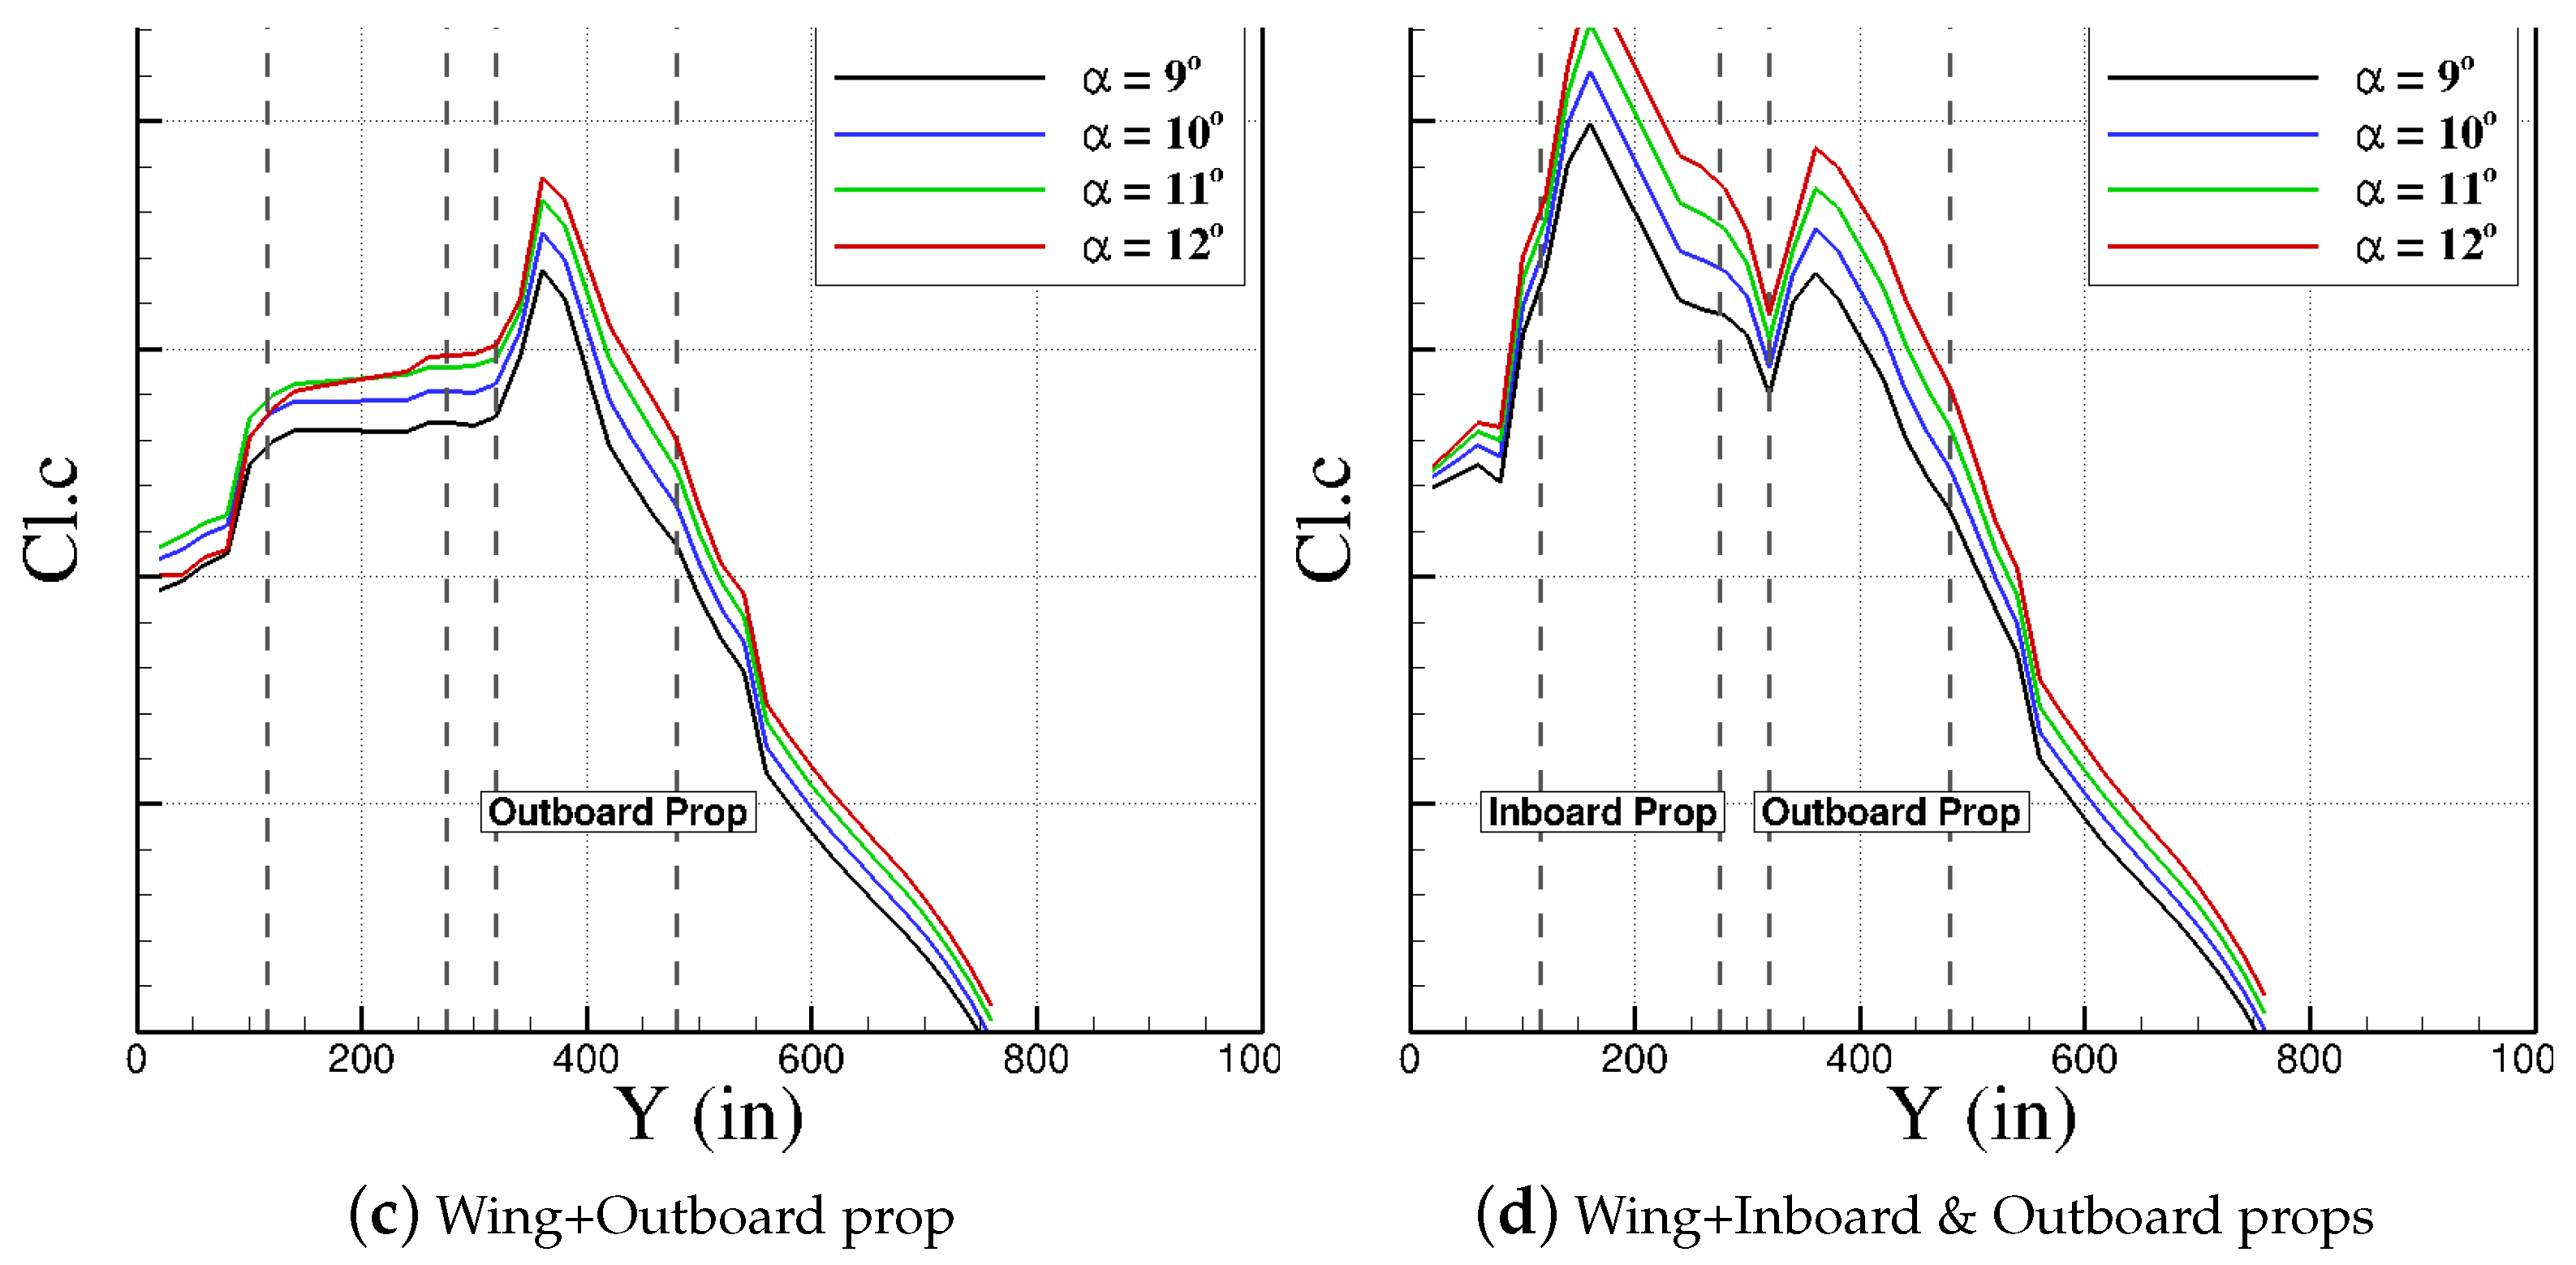
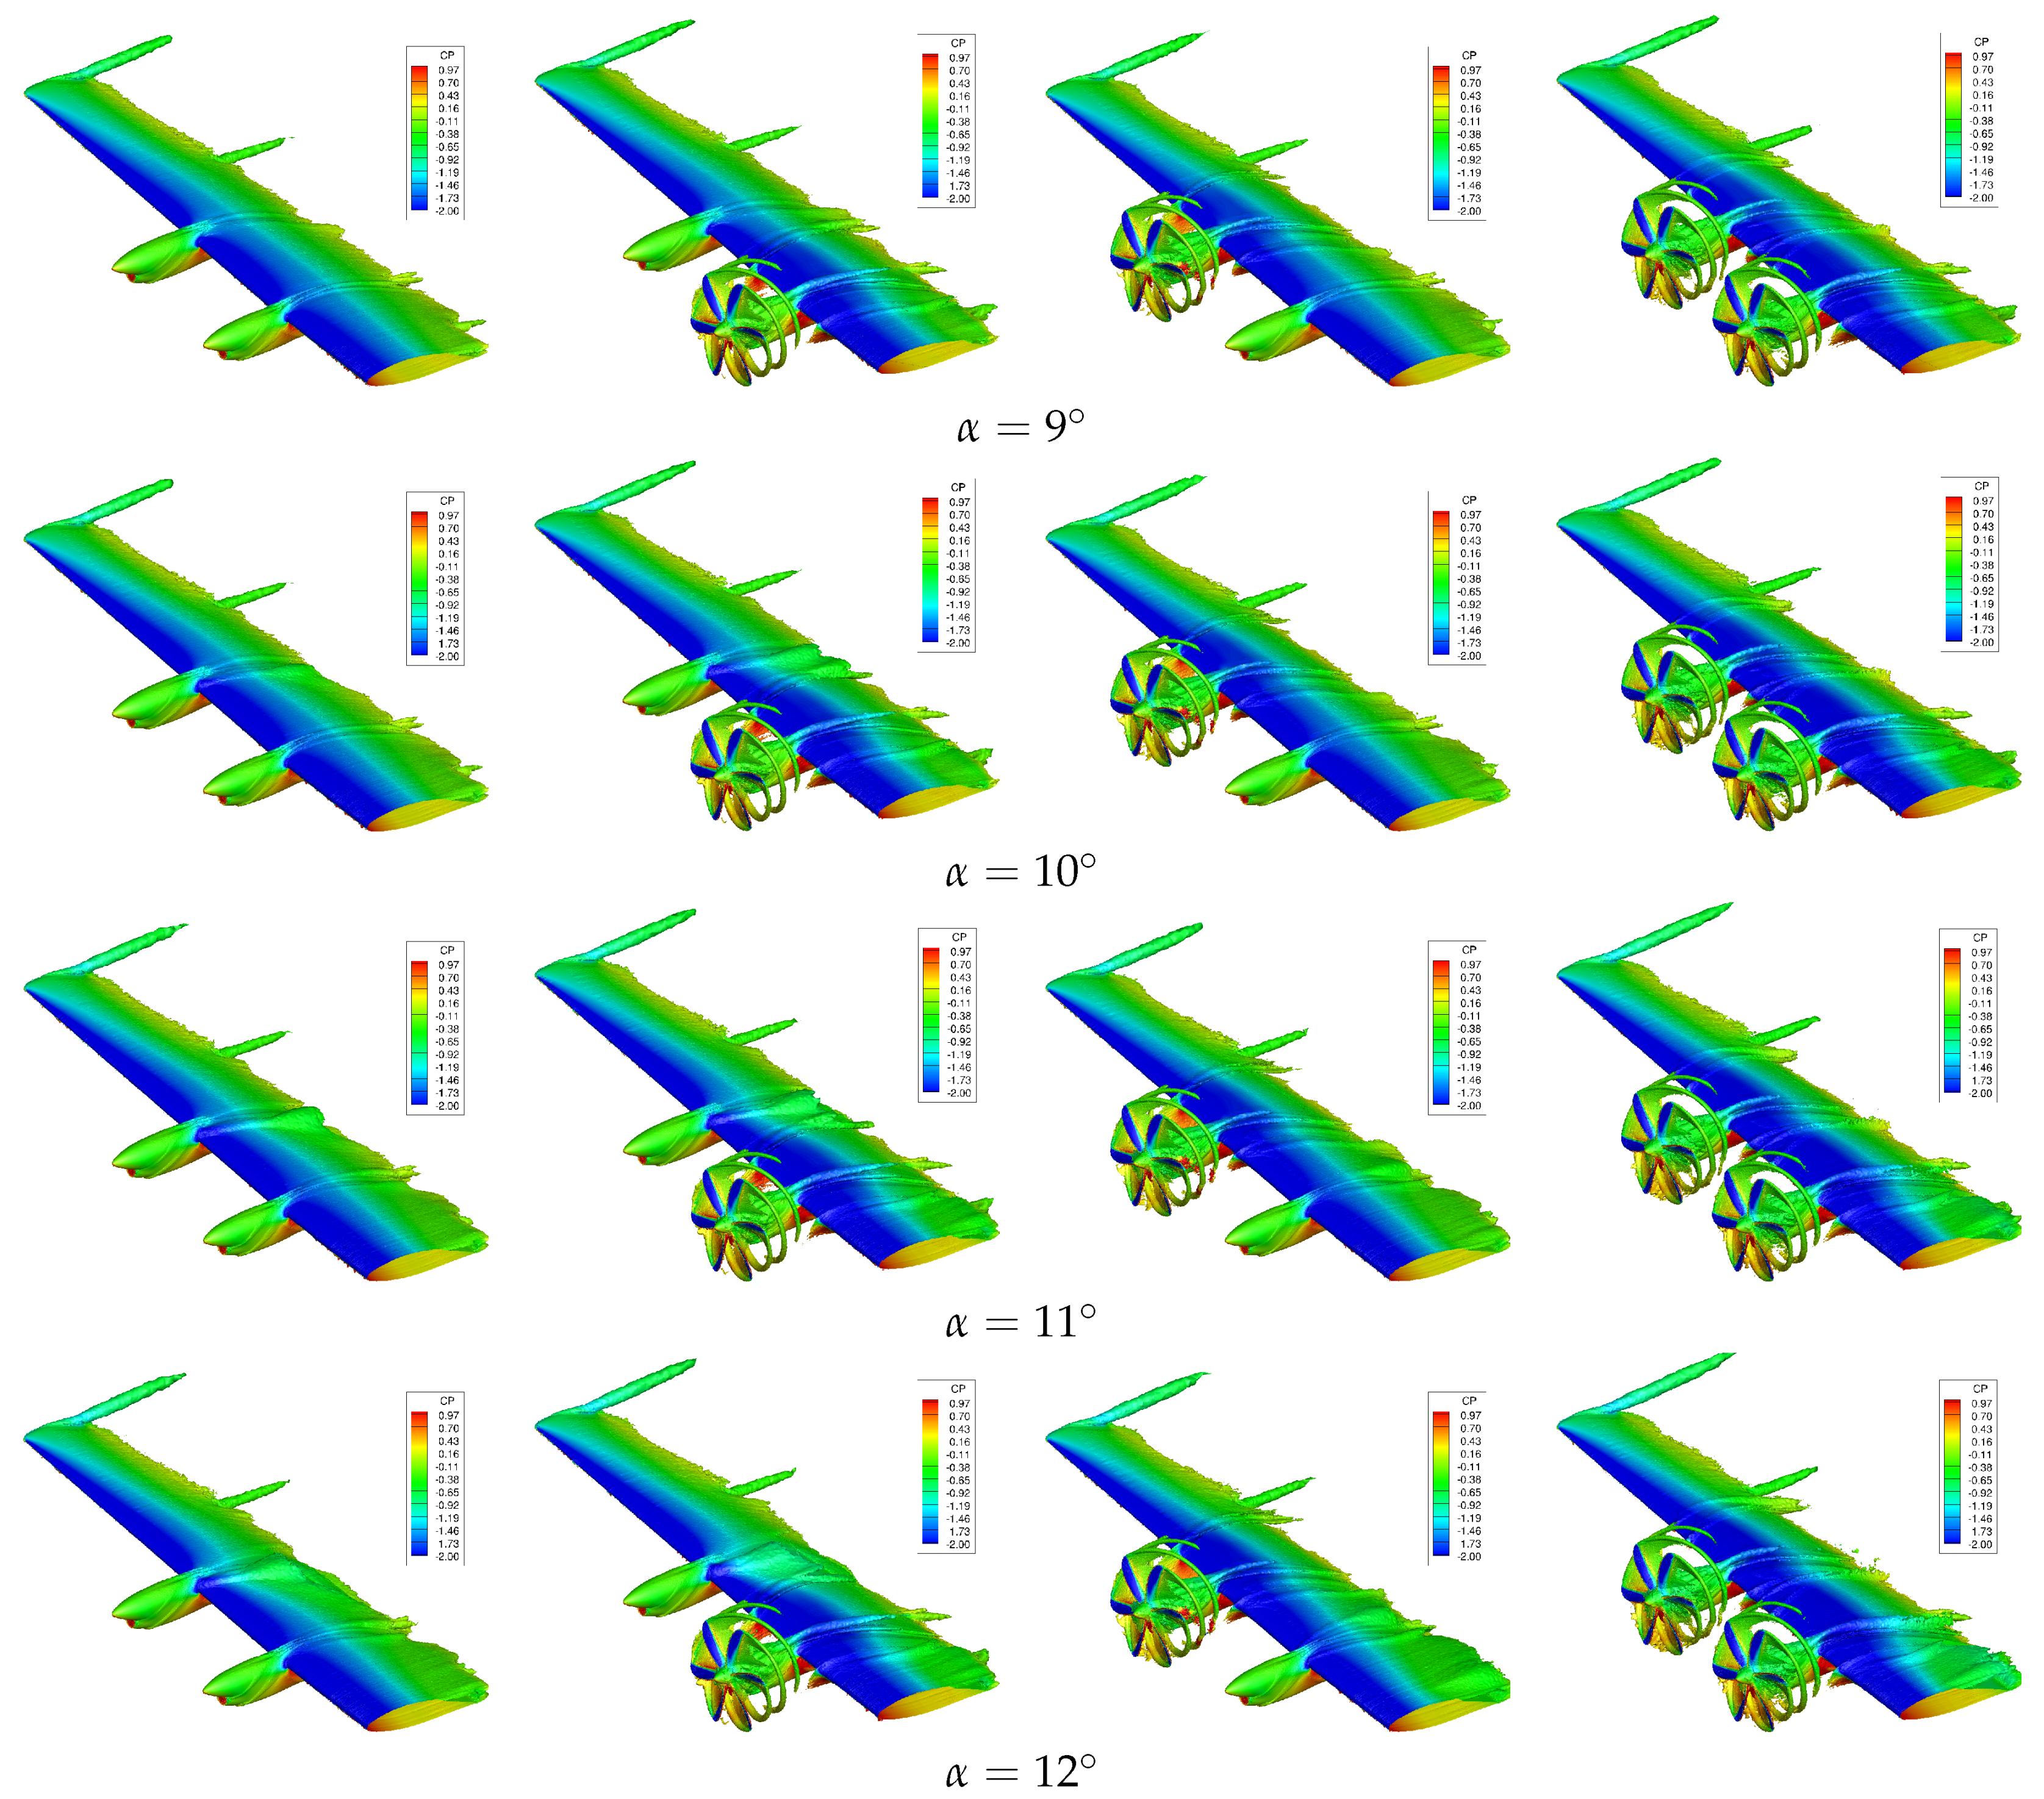
5.2. Wing/Propeller Aerodynamic Interaction

The number of time steps in all simulations is 6500. Out of these time steps, 500 are used in startup mode that helps to fade away the effects of solid walls, ramp up time, ramp down advective damping effects, and prepare the solution for grid motions or unsteady simulations [27]. However, simulation and therefore physical time will remain zero during these startup time steps. Flow conditions in all simulations again correspond to the air speed of 130 KIAS at 1000 ft altitude and zero angles of attack and sideslip. For stall behavior simulations, the angle of attack varies from zero to 12 degrees. For the wing surfaces and C p -plots, time-averaged solutions from the last 3000 iterations were used.
All propellers spin counterclockwise unless stated otherwise. The rotational speed is 1020 rpm or 6120 deg/s. Table 1 gives a list of simulations.
A number of scripts were written to extract slices at different spanwise locations of the wing. These locations are given in inches and can be visualized in Figure 3. Another script will calculate local lift and drag coefficients from pressure coefficients of each slice to make a local lift distribution over the wing. The first set of results compare pressure coefficient values over the wing for a number of slices ranging from y = 20 to y = 420 inches for a wing only and a wing with an inboard mounted propeller. The propeller has a blade angle of 20deg and can spin clockwise or counterclockwise; for each setting, a different propeller grid was selected to have a positive thrust force by spinning propellers. Propellers spin at 6120 deg/s (1020 rpm) as well. The pressure data of these configurations are shown and compared in Figure 6. Notice that these data correspond to time-averaged wing solutions for the final three seconds of simulations.
Note that the wing region behind an inboard propeller ranges approximately from y = 120 to y = 280 inches. Figure 6 shows that inboard propeller effects can be seen at smaller y positions, even at y = 20 inches as the C p -plots do not match with each other at these locations. A counterclockwise propeller mounted on the inboard wing causes the pressure differences between upper and lower surfaces to increase compared with a wing without propeller for y = 20 to y = 120 inches. A counterclockwise rotation causes an upwash in these region and an increased local angle of attack. Instead, a clockwise spinning propeller causes the pressure differences between upper and lower surfaces decrease compared with a wing without propeller for positions y = 20 to y = 120 inches. This is due to downwash effects of the propeller over this region of the wing. Notice that the effects of deflected flaps can be seen in C p -plots of positions at and larger y = 100 in. In the range of y = 120 to y = 200 , the counterclockwise spinning propeller causes significant differences between upper and lower surfaces again compared with the wing-only configuration. The reason is due to the combined effects of upwash and increases momentum behind the propeller at this region. The clockwise spinning propeller also shows larger differences because of the momentum increase, but differences are still smaller than the counterclockwise spinning propeller.
At around the nacelle center, i.e., y = 193 inches, both propellers show nearly the same C p plots as downwash and upwash velocities are small in this region. From y = 200 inches outwards, the propeller effects change to become the opposite, i.e., a clockwise spinning propeller induces upwash over the wing and the counterclockwise spinning propeller induces downwash. The largest effects can be seen from a clockwise spinning propeller for locations between y = 200 to y = 280 inches, where it shows the largest differences between C p values at upper and lower surfaces. For y = 280 outwards, the counterclockwise spinning propeller effects become small and the pressure data almost matches the wing only data. The clockwise spinning propeller still shows some changes in C p plots up to y = 380 inches due to upwash effects over these regions. These results show that a propeller installed on the front of the wing can significantly change the wing aerodynamics in particular behind the propeller; these effects depend on the propeller direction of rotation and they can even be seen at different wing locations that are not behind the propeller.
The next results compare wing only pressure data with a counterclockwise spinning propeller with 20-deg blade angle and mounted either on the wing inboard or outboard. Figure 7 shows and compares these numerical data for wing slices extracted from y = 20 to y = 520 inches. The outboard mounted propeller has no significant changes over wing local pressure plots for positions of y = 20 to y = 300 inches. The inboard mounted propeller, however, creates pressure on the upper surface smaller and on the lower surface larger for positions of y = 20 to y = 300 inches due to propeller upwash effects. The changes become significant for y = 120 to y = 200 inches due to combined effects of upwash and increased dynamic pressure behind the propeller. Large gradients of C p increase and decrease can be seen at the wing leading edge and behind the propeller. For y = 200 to y = 280 inches, the inboard propeller effects are decreased as the downwash effects opposite from the dynamic pressure increase. For y = 280 outwards, the inboard propeller causes smaller differences between upper and lower wing surfaces due to downwash effects.
The outboard propeller shows very similar trends as well; however, the effects over the wing can be seen from y = 300 inches outward. In these regions, the wing is subject to propeller upwash. From y = 320 to y = 400 , there are combined effects of upwash and increased dynamic pressure. For y = 400 to y = 480 inches, the downwash due to propeller opposite from the effects of increased dynamic pressure. Finally, for y = 480 outwards, the propeller downwash causes there to be smaller pressure on the lower surface and larger pressure values on the upper surface.
Figure 8 shows vorticity isosurfaces for simulated cases of wing only, propellers installed inboard or outboard wing with 20-deg blade angle. The inboard propellers spin either clockwise or counterclockwise with a rotational speed of 1024 rpm. Isosurfaces correspond to the vorticity magnitude of 100. Figure 8 shows the slipstream generated behind the propellers. A negative pressure region is formed over the upper wing surface behind the propellers. For counterclockwise propellers, the pressure is more negative behind the right side of propeller (viewed from front) than the left side. This is again due to combined effects of upwash and increased dynamic pressure. For the clockwise spinning propeller, the wing pressure is more negative behind the left side propeller than its right side.
Wing tip and flap vortices can be seen in Figure 8. The engine inlet was assumed to be a solid wall. Therefore, the inlet surface experiences stagnation pressure. The flow separates as it makes a 90-deg turn at the inlet edge. The separated flow will roll into two vortices around each nacelle and they will move upwards. The interaction of these vortices with wings will form two vortices near each other on the upper wing surface behind each nacelle. These vortices can be seen in Figure 8a. In the presence of the propeller, these vortices become much larger and are lifted up from surface as shown in Figure 8c,d. There is a vortex shedding at where the propeller slipstream interacts with the wing surface.
Figure 9 compares the wing local lift distribution for the wing only and propellers installed inboard or outboard. The local lift is presented as C l . c which is local lift times local chord. The propellers have a 20-deg blade angle and spin at 1024 rpm. The inboard propellers can either spin clockwise or counterclockwise. The data calculated correspond to time-averaged data. Figure 9 shows that wing local lift increases behind the propeller. The lift rise in the left and right sections of the propellers are different and will depend on the direction or rotation.
In more detail, Figure 9a compares local lift distribution of a wing only configuration (No Prop) with data of wings and a propeller mounted inboard spinning clockwise (Prop CW) or counterclockwise (Prop CCW). Note that the lift distributions of all wings are affected by the flap deflections (flaps are located approximately at y = 85 to y = 550 inches). For example, moving towards the wing tip, the local lift of “No Prop” configuration increases, then gradually decreases, and then falls outside the outboard flap. In the "No Prop” case, there are local lift changes behind nacelles due to inlet vortices formed over the upper surface as well. In the “Prop CCW” case, the lift distribution is larger than the “No Prop” case for all spanwise distances from 20 to 280 inches. For further distances, the local lift is very close to “No Prop” data. Figure 9a shows that the local lift of “Prop CCW” suddenly increases, moving towards the left side of the propeller until it reaches a maximum and then drops. The effects of vortex shedding can be seen on the plots, especially near the right tip ( y = 276 inches) of the propeller spinning CCW and the left tip ( y = 196 inches) of the propeller spinning CW. The wing of “Prop CW” configuration has smaller lift than “No Prop” for distances from wing root to y = 80 inches due to induced upwash from propeller. The maximum lift occurs behind the right side of propeller. Both CW and CCW spinning propellers have the same thrust at the center of hub. Figure 9b compares the wing data with a propeller installed inboard or outboard. The outboard propeller effects can be seen even at the wing root. The propeller causes less lift than the “No Prop” case at a location right of the propeller.
The next results compare the effects of blade angle on the wing aerodynamics. Two blade angles of 20 and 28 degrees are considered. A single propeller is installed on either the inboard or outboard section of the wing. All propellers spin counterclockwise at a spinning speed of 1024 rpm. In both (inboard and outboard mounted) cases, the propeller with a 28-deg blade angle have similar trends with the propellers with a 20-deg blade angle, but much larger differences are obtained between pressure data at upper and lower surfaces at 28-deg blade angles. In more detail, Figure 10 presents the iso-surfaces of the vorticity magnitude for these simulations. All visualizations correspond to the final simulation time step. Figure 10 shows that a larger slipstream is formed behind the propeller with a 28-deg blade angle. More negative pressure regions over the wing were formed with propellers having a 28-deg blade angle as well. Vortex shedding at the junctions of the wing and propeller slipstream are stronger for propellers with a 28-deg blade angle. Finally, Figure 11 compares the local wing lift distributions of these configurations. The propeller with a 28-deg blade angle leads to larger lift values over the wing. The vortex shedding effects are more visible in the plots of propellers with a 28-deg angle as well.
Next, results of a single propeller and a wing with both inboard and outboard mounted propellers are compared. In both cases, propellers have a 20-deg blade angle, spin counterclockwise at a rotational speed of 1024 rpm. Figure 12 shows the local lift distribution and vorticity isosurfaces of the wing with both propellers installed. In regions between propellers, the two-propellers increase the local wing lift compared with single propeller cases. In other regions, the two-propeller data follow the trends of the single propeller locally installed. In addition, Figure 13 compares the local lift distributions of the wings with two propellers but different spinning scenarios. Figure 13 shows that very different lift distributions are obtained depending on the spinning directions. These effects will be important in the aircraft design and how to control where the wing will stall first.
Final results present the effects of propeller on the wing stall behavior. Figure 14 shows the lift distribution of four configurations at angles of attack of 9, 10, 11, and 12 degrees. The configurations include wing without propeller, wing with inboard propeller, wing with outboard propeller, and wing with both inboard and outboard propellers. All propellers have a blade angle of 20 degrees and spin counterclockwise. Figure 14a shows that the wing only case has stalled at an 11-deg angle of attack. Increasing the angle of attack to 12 degrees does not increase local lift in most regions; it even falls behind the outboard nacelle. Figure 15 shows that, at an 11-deg angle of attack, flow is separated at the wing roots and behind nacelles. However, the tip has not been stalled yet and the lift increases with increasing angle of attack at the tip. Figure 14b,c show that local wing stalls behind propellers are delayed by mounting propellers at the inboard and outboard wing; however, the single propeller causes flow separation in other regions. The two-propeller case, however, delays stall at most positions. Figure 15 compares the vorticity iso-surfaces of all these configurations for tested angles of attack.

6. Conclusions

The propeller significantly changes the wing aerodynamic performance. The effects will depend on the blade angle, direction of rotation, and position of propellers on the wing. The most significant effects were seen beyond the propeller. For a counterclockwise spinning propeller (viewed from front), the upwash on the left side of the propeller caused the local angle of attack to increase and hence the local lift coefficient. The lift increase will be substantial behind the propeller because of combined effects of upwash and rise in the flow momentum. On the right side of the propeller, downwash will reduce the dynamic pressure rise effects. Outside the propeller disk, downwash causes the local lift to decrease. For tested propellers, increasing the blade angle from 20 to 28 degrees increased the local lift as well. In addition, two-propeller configuration was simulated and the results show that this improved wing lift distribution compared with single installed ones. Finally, the propeller presences will delay flow separation and local stall over the wing behind the propeller disk. The results of this work show the capability of Kestrel simulation tools for modeling and design of propellers and investigate their effects over aircraft during a conceptual design in which no experimental or flight test data are available yet. This will lead to reducing the number of tests required later. In addition, these results can be used for teaching purposes.

Author Contributions

All authors contributed to the research conceptualization and methodology. K.B. provided geometries. A.J. developed all computational grids. M.G. and P.A. performed all simulations and prepared the original draft. M.J.S. is the HPCRC director. K.B. funded this research.

Funding

This material is based in part on research sponsored by the US Air Force Academy under the agreement numbers of FA7000-17-2-0007 and FA7000-16-2-0010.

Acknowledgments

The authors acknowledge the support of the HPMCP computing resources and CREATE support team. The U.S. Government is authorized to reproduce and distribute reprints for Governmental purposes notwithstanding any copyright notation thereon. The views and conclusions contained herein are those of the authors and should not be interpreted as necessarily representing the official policies or endorsements, either expressed or implied, of the organizations involved with this research or the U.S. Government.

Conflicts of Interest

The authors declare no conflict of interest.

Nomenclature

aacoustic speed, m·s 1
CFDcomputational fluid dynamics
C p pressure coefficient, ( p p ) / q
CREATEComputational Research and Engineering Acquisition Tools and Environments
CCWcounterclockwise
CWclockwise
Dpropeller diameter, m
DDESdelayed detached eddy simulation
Fthrust force, N
MMach number, V/a
pstatic pressure, N/m 2
p free-stream pressure, N/m 2
q free-stream dynamic pressure, N/m 2
SARCSpalart–Allmaras with rotational and curvature correction
RANSReynolds Averaged Navier–Stokes
ttime, s
VZLUCzech aerospace research center
V free-stream velocity, m·s 1
x,y,zgrid coordinates, m
Greek
α angle of attack, deg
β blade angle, deg

References

  1. Froude, R.E. On the Part Played in Propulsion by Differences of Fluid Pressure. Trans. Inst. Nav. Archit. 1889, 30, 390. [Google Scholar]
  2. Rankin, W.J. On the Mechanical Principles of the Action of Propellers. Trans. Inst. Nav. Archit. 1865, 6, 13–39. [Google Scholar]
  3. Westmoreland, W.S.; Tramel, R.W.; Barber, J. Modeling Propeller Flow-Fields Using CFD. In Proceedings of the 46th AIAA Aerospace Sciences Meeting and Exhibit, Reno, NV, USA, 7–10 January 2008. AIAA Paper 2008-0402. [Google Scholar]
  4. Stuermer, A. Unsteady CFD Simulations of Propeller Installation Effects. In Proceedings of the 42nd AIAA/ASME/SAE/ASEE Joint Propulsion Conference & Exhibit, Sacramento, CA, USA, 9–12 July 2006. AIAA Paper 2006-4969. [Google Scholar]
  5. Shafer, T.; Green, B.; Hallissy, B.; Hine, D. Advanced Navy Applications Using CREATETM-AV Kestrel. In Proceedings of the 52nd Aerospace Sciences Meeting, National Harbor, MD, USA, 13–17 January 2014. AIAA Paper 2014-0418. [Google Scholar]
  6. McDaniel, D.; Nichols, R.; Klepper, J. Unstructured Sliding Interface Boundaries in Kestrel. In Proceedings of the 54th AIAA Aerospace Sciences Meeting, San Diego, CA, USA, 4–8 January 2016. AIAA Paper 2016-1299. [Google Scholar]
  7. Steij, R.; Barakos, G. Sliding Mesh Algorithm for CFD Analysis of Helicopter Rotor–Fuselage Aerodynamics. Int. J. Numer. Methods Fluids 2008, 58, 527–549. [Google Scholar] [CrossRef]
  8. Ghoreyshi, M.; Bergeron, K.; Lofthouse, A.J. Numerical Simulation of Wake Flowfield Behind the C-130 with Cargo Ramp Open. J. Aircr. 2017, 55, 1103–1121. [Google Scholar] [CrossRef]
  9. Bergeron, K.; Ghoreyshi, M.; Jirasek, A. Simulation of C-130 H/J Troop Doors and Cargo Ramp Flow Fields. Aerosp. Sci. Technol. 2018, 72, 525–541. [Google Scholar] [CrossRef]
  10. Bergeron, K.; Ghoreyshi, M.; Jirasek, A.; Aref, P.; Lofthouse, A.J. Computational Modeling of C-130 H/J Propellers and Airdrop Configurations. In Proceedings of the 35th AIAA Applied Aerodynamics Conference, Denver, CO, USA, 5–9 June 2017. AIAA Paper 2017-3574. [Google Scholar]
  11. Roth, G.L.; Morton, S.A.; Brooks, G.P. Integrating CREATE-AV Products DaVinci and Kestrel: Experiences and Lessons Learned. In Proceedings of the 50th AIAA Aerospace Sciences Meeting Including the New Horizons Forum and Aerospace Exposition, Nashville, TN, USA, 9–12 January 2012. AIAA Paper 2012-1063. [Google Scholar]
  12. Morton, S.A.; McDaniel, D.R. A Fixed-Wing Aircraft Simulation Tool for Improving DoD Acquisition Efficiency. Comput. Sci. Eng. 2016, 18, 25–31. [Google Scholar] [CrossRef]
  13. Morton, S.A.; McDaniel, D.R.; Sears, D.R.; Tillman, B.; Tuckey, T.R. Kestrel: A Fixed Wing Virtual Aircraft Product of the CREATE Program. In Proceedings of the 47th AIAA Aerospace Sciences Meeting including The New Horizons Forum and Aerospace Exposition, Orlando, FO, USA, 4–7 January 2009. AIAA Paper 2009-0338. [Google Scholar]
  14. McDaniel, D.; Nichols, R.; Eymann, T.; Starr, R.; Morton, S. Accuracy and Performance Improvements to Kestrel’s Near-Body Flow Solver. In Proceedings of the 54th AIAA Aerospace Sciences Meeting, San Diego, CA, USA, 4–8 January 2016. AIAA Paper 2016-1051. [Google Scholar]
  15. Godunov, S.K. A Difference Scheme for Numerical Computation of Discontinuous Solution of Hydrodynamic Equations. Sbornik Math. 1959, 47, 271–306. [Google Scholar]
  16. Tramel, R.; Nichols, R.; Buning, P. Addition of Improved Shock-Capturing Schemes to OVERFLOW 2.1. In Proceedings of the 19th AIAA Computational Fluid Dynamics Conference, San Antonio, TX, USA, 22–25 June 2009. AIAA Paper 2009-3988. [Google Scholar]
  17. Spalart, P.R.; Allmaras, S.R. A One Equation Turbulence Model for Aerodynamic Flows. In Proceedings of the 30th Aerospace Sciences Meeting and Exhibit, Reno, NV, USA, 6–9 January 1992. AIAA Paper 1992-0439. [Google Scholar]
  18. Spalart, P.R.; Schur, M. On the Sensitisation of Turbulence Models to Rotation and Curvature. Aerosp. Sci. Technol. 1997, 1, 297–302. [Google Scholar] [CrossRef]
  19. Menter, F. Eddy Viscosity Transport Equations and Their Relation to the k-ε Model. ASME J. Fluids Eng. 1997, 119, 876–884. [Google Scholar] [CrossRef]
  20. Spalart, P.R.; Jou, W.H.; Strelets, M.; Allmaras, S.R. Comments on the Feasibility of LES for Wings, and on a Hybrid RANS/LES Approach. In Proceedings of the 1st AFSOR International Conference on DNS/LES, Ruston, LA, USA, 4–8 August 1997; Greyden Press: Columbus, OH, USA, 1997; pp. 137–147. [Google Scholar]
  21. Ferraro, G.; Kipouros, T.; Savill, A.M.; Rampurawala, A.; Agostinelli, A. Propeller–Wing Interaction Prediction for Early Design. In Proceedings of the 52nd Aerospace Sciences Meeting, National Harbor, MD, USA, 13–17 January 2014. AIAA Paper 2014-0564. [Google Scholar]
  22. Stuermer, A.; Rakowitz, M. Unsteady Simulation of a Transport Aircraft Propeller Using MEGAFLOW; RTO-MP-AVT-123 Technical Report; Meeting Proceedings RTO-MP-AVT-123, Paper 7; RTO: Neuilly-sur-Seine, France, 2015. [Google Scholar]
  23. Swatton, P. Principles of Flight for Pilots; Aerospace Series; Wiley: Hoboken, NJ, USA, 2011. [Google Scholar]
  24. Mikolowsky, W. A Short History of the C-130 Hercules. In Proceedings of the AIAA International Air and Space Symposium and Exposition: The Next 100 Years, Dayton, OH, USA, 14–17 July 2003. AIAA Paper 2003-2746. [Google Scholar]
  25. Thom, A.; Duraisamy, K. Computational Investigation of Unsteadiness in Propeller Wake–Wing Interactions. J. Aircr. 2013, 50, 985–988. [Google Scholar] [CrossRef]
  26. Veldhuis, L.M. Review of Propeller–Wing Aerodynamic Interference. In Proceedings of the 24th International Congress of the Aeronautical Sciences, Yokohama, Japan, 29 August–3 September 2004. [Google Scholar]
  27. Computational Research and Engineering Acquisition Tools And Environments (CREATE), Eglin AFB, FL 32542. In Kestrel User Guide, Version 6.0; High Performance Computing Modernization Program: Lorton, VA, USA, 2015.
Figure 1. Propeller wing interference effects for counterclockwise spinning propeller of C-130H.
Aerospace 05 00079 g001
Figure 2. Dowty six-blade R391 propeller with 20-deg blade angle is shown. This propeller has a diameter of a diameter of 162 inches (4.12 m).
Aerospace 05 00079 g002
Figure 3. The location of flaps, nacelles, and propeller on the wing.
Aerospace 05 00079 g003
Figure 4. Test cases include no propeller; propeller installed inboard; propeller installed outboard; and propellers installed on the inboard and outboard wing.
Aerospace 05 00079 g004
Figure 5. Installed propeller surface pressure data. Propeller installed inboard; propellers have a 20-deg blade angle and spin at 1024 rpm clockwise or counterclockwise. Propeller solutions are at final simulation time.
Aerospace 05 00079 g005
Figure 6. Pressure distribution (−Cp) over the wing for wing only and wing with a prop mounted at inboard nacelle; the propeller spins counterclockwise and clockwise and has a 20-deg blade angle. Black dots show no prop. Blue-colored square markers show a propeller spinning counterclockwise. Red triangles show a propeller spinning clockwise. Pressure data are time-averaged for the final three seconds of simulations.
Aerospace 05 00079 g006
Figure 7. Pressure distribution (−Cp) over the wing for wing only and a wing with a prop mounted either on the inboard or outboard nacelle; the propeller spins counterclockwise and has a 20-deg blade angle. Black dots show no prop. Blue-colored square markers show a propeller mounted on the wing inboard. Red triangles show a propeller mounted wing outboard. Pressure data are time-averaged for the final three seconds of simulations.
Aerospace 05 00079 g007aAerospace 05 00079 g007b
Figure 8. Propeller installed inboard/outboard; vorticity isosurfaces are colored with pressure coefficients. Propellers have a 20-deg blade angle and spin at 1024 rpm. Wing only solution is time-averaged for the final three seconds of simulations. Wing+Prop solutions are at the final simulation time.
Aerospace 05 00079 g008
Figure 9. Local lift distribution for wing and propellers are installed inboard or outboard the wing. Propellers have a 20-deg blade angle. The inboard propellers spin either CW or CCW. In these figures, C l . c denotes the local lift times the local chord length. Local lift data are found from time-averaged solutions.
Aerospace 05 00079 g009
Figure 10. Propeller installed inboard/outboard; vorticity isosurfaces are colored with a pressure coefficient. Propellers have a 20-deg blade angle and spin at 1024 rpm counterclockwise. The wing only solution is time-averaged for the final three seconds of simulations. Wing+Prop solutions are at the final simulation time.
Aerospace 05 00079 g010
Figure 11. Local lift distribution for wing and propellers installed inboard or outboard the wing. Propellers have 20-deg or 28-deg blade angles. The propellers spin counter clockwise. In these figures, C l . c denotes the local lift times the local chord length. Local lift data are found from time-averaged solutions.
Aerospace 05 00079 g011
Figure 12. Propeller installed at both inboard and outboard wing; In (a), local lift distribution for wing and propellers installed inboard and outboard the wing are shown. In (b), vorticity isosurfaces are colored with pressure coefficient. Propellers have 20-deg blade angle and spin at 1024 rpm.
Aerospace 05 00079 g012
Figure 13. Propeller installed on both inboard and outboard wings, but they spin at different directions.
Aerospace 05 00079 g013
Figure 14. The wing stall behavior with and without propellers. All propellers spin counterclockwise.
Aerospace 05 00079 g014aAerospace 05 00079 g014b
Figure 15. Propeller installed inboard/outboard; it has a 20-deg blade angle. Wing solution is time-averaged. Wing+Prop solutions are at a time of six seconds.
Aerospace 05 00079 g015
Table 1. Simulation runs.
Simulation CasesInboard PropellerOutboard PropellerAngle of Attack (deg)Blade Angle (deg)
Case 1CCW [0, 9, 10, 11, 12][20, 28]
Case 2CW 20
Case 2 CCW[0, 9, 10, 11, 12][20, 28]
Case 4CCWCCW[0, 9, 10, 11, 12]20
Case 5CWCCW[0, 9, 10, 11, 12]20
Case 6CCWCW[0, 9, 10, 11, 12]20

