Article

Identification of Key Risk Hotspots in Mega-Airport Surface Based on Monte Carlo Simulation

1
College of Civil Aviation, Nanjing University of Aeronautics and Astronautics, Nanjing 211106, China
2
State Key Laboratory of Air Traffic Management System, Nanjing 211106, China
*
Author to whom correspondence should be addressed.
Aerospace 2024, 11(4), 254; https://doi.org/10.3390/aerospace11040254
Submission received: 4 January 2024 / Revised: 15 March 2024 / Accepted: 19 March 2024 / Published: 25 March 2024

Abstract

:
The complex layout of the airport surface, coupled with interrelated vehicle behaviors and densely mixed traffic flows, frequently leads to operational conflict risks. To address this issue, research was conducted on the recognition of characteristics and risk assessment for airport surface operations in mixed traffic flows. Firstly, a surface topological network model was established based on the analysis of the physical structure features of the airport surface. Based on the Monte Carlo simulation method, the simulation framework for airport surface traffic operations was proposed, enabling the simulation of mixed traffic flows involving aircraft and vehicles. Secondly, from various perspectives, including topological structural characteristics, network vulnerabilities, and traffic complexity, a comprehensive system for feature indices and their measurement methods was developed to identify risk hotspots in mixed traffic flows on the airport surface, which facilitated the extraction of comprehensive risk elements for any node’s operation. Finally, a weighting rule for risk hotspot feature indices based on the CRITIC–entropy method was designed, and a risk assessment method for surface operations based on TOPSIS–gray relational analysis was proposed. This method accurately measured risk indices for airport surface operations hotspots. Simulations conducted at Shenzhen Bao’an International Airport demonstrate that the proposed methods achieve high simulation accuracy. The identified surface risk hotspots closely matched actual conflict areas, resulting in a 20% improvement in the accuracy of direct risk hotspot identification compared to simulation experiments. Additionally, 10.9% of nodes in the airport surface network were identified as risk hotspots, including 3 nodes with potential conflicts between aircraft and ground vehicles and 21 nodes with potential conflicts between aircraft. The proposed methods can effectively provide guidance for identifying potential “aircraft–vehicle” conflicts in complex airport surface layouts and scientifically support informed decisions in airport surface operation safety management.

1. Introduction

The global air transportation industry is enjoying sustained and rapid development and witnessing continuous advancement in the construction of world-class airport clusters. Under such circumstances, China’s large busy airports are growing rapidly regarding passenger and cargo transportation volume and flight flow. The scale, layout, and operation rules of runways, taxiways, parking spaces, and other airport surface operational resources are becoming more and more complex, and the mixed and intertwined operations of aircraft, support vehicles, and other activity targets lead to dynamic and changeable airport surface operation environments. The frequent occurrence of unsafe incidents such as the risk of airport surface operation conflicts has put airports under greater operational security pressure. In order to accurately identify the risk hotspots of airport surface, scientifically grasp the potential types of airport surface conflicts, and effectively support the airport surface safety operation decision making, it is urgent to carry out research on the identification of the airport surface operation characteristics and risk evaluation of airports oriented to the mixed traffic flows.
At present, domestic and international research in the field of airport surface conflict identification and risk management mainly focuses on trajectory-based conflict prediction, airport surface operation conflict network construction, and complex network-based field conflict characterization. In the area of trajectory-based conflict prediction, mainly focusing on micro-conflicts between aircraft, the improved evidence-based practice methods [1], complex network models [2,3], deep learning models [4,5], aircraft trajectory temporal–spatial overlap identification algorithms [6], improved end-to-end convolutional neural networks [7], Gaussian spatial–temporal prediction [8] and other theoretical methods are used to analyze and identify spatial–temporal overlapping characteristics of aircraft taxiing trajectories. And constructing an airport hotspot risk assessment model [9] or a temporal–spatial real-scene model based on statistical learning of actual trajectory data [10], excavated hotspot areas where aircraft operation conflicts may occur, and classified the coefficients of aircraft conflicts and risk levels, and risk level for hierarchical division. In the airport surface operation conflict network construction, take the taxiing aircraft as nodes, use the betweenness and degree entropy method [11], and the analytic hierarchy process–entropy weight method [12] and other methods to evaluate the risk index of the activity target network nodes, construct the aircraft operation conflict network on the basis of identifying the key conflict points of the network, and apply the methods of long and short-term memory neural network [13] to predict potential conflicts between airport surface activity targets, which only considered the activity target of aircraft. In terms of airport surface conflict characterization, mainly for historical unsafe event data, theoretical methods such as Delphi method [14], matrix method [15], fuzzy cluster analysis [16], and FaCT++ inference machine [17] were used to quickly identify airport hotspot areas and their spatial and temporal characteristics, and optimize aircraft taxiing paths based on risky hotspot area characteristics [18,19,20].
It can be seen that most of the current studies take aircraft as the main object, analyze and predict the microscopic collision conflicts between aircraft based on the safety interval standard, and consider less the impact of support vehicles as the target of activity on aircraft airport surface operation. Moreover, these studies have not yet explored the problem of airport surface operation conflicts from the perspective of the coordinated operations of the “aircraft–vehicle” mixed traffic flows. In addition, the identification of the key conflict points of airport surface operations is mainly based on the number of conflicts, conflict duration, conflict probability, and other indicators, and considers less the inherent complex network characteristics of the airport surface taxiing system and its impact on the potential conflicts of traffic operations. In view of this, oriented to the actual operations of large busy airports and comprehensively taking into consideration the operational resources such as runways, taxiways, parking spaces, etc., as well as the activity targets such as aircraft and support vehicles, this paper designed the framework of airport surface network topology modeling and mixed traffic simulation, constructed the system of hotspot characteristic indicators of airport surface mixed traffic flows risk and its metrics which cover the topological structure characteristics, network vulnerability, and traffic complexity. Based on the CRITIC–entropy weighting method and the TOPSIS–gray correlation analysis method [21], the airport surface operation risk index empowerment and comprehensive evaluation method were put forward, which realized the extraction of airport surface operation risk characteristic elements and risk index metrics, and selected Shenzhen Bao’an International Airport to carry out a comprehensive validation analysis of the proposed method. The results of this research can provide modeling and methodological support to guarantee the safety of mega-airport surface operations and to improve the risk perception of the aircraft–vehicle mixing traffic conflict.

2. Airport Surface Network Topology Modeling and Hybrid Traffic Simulation

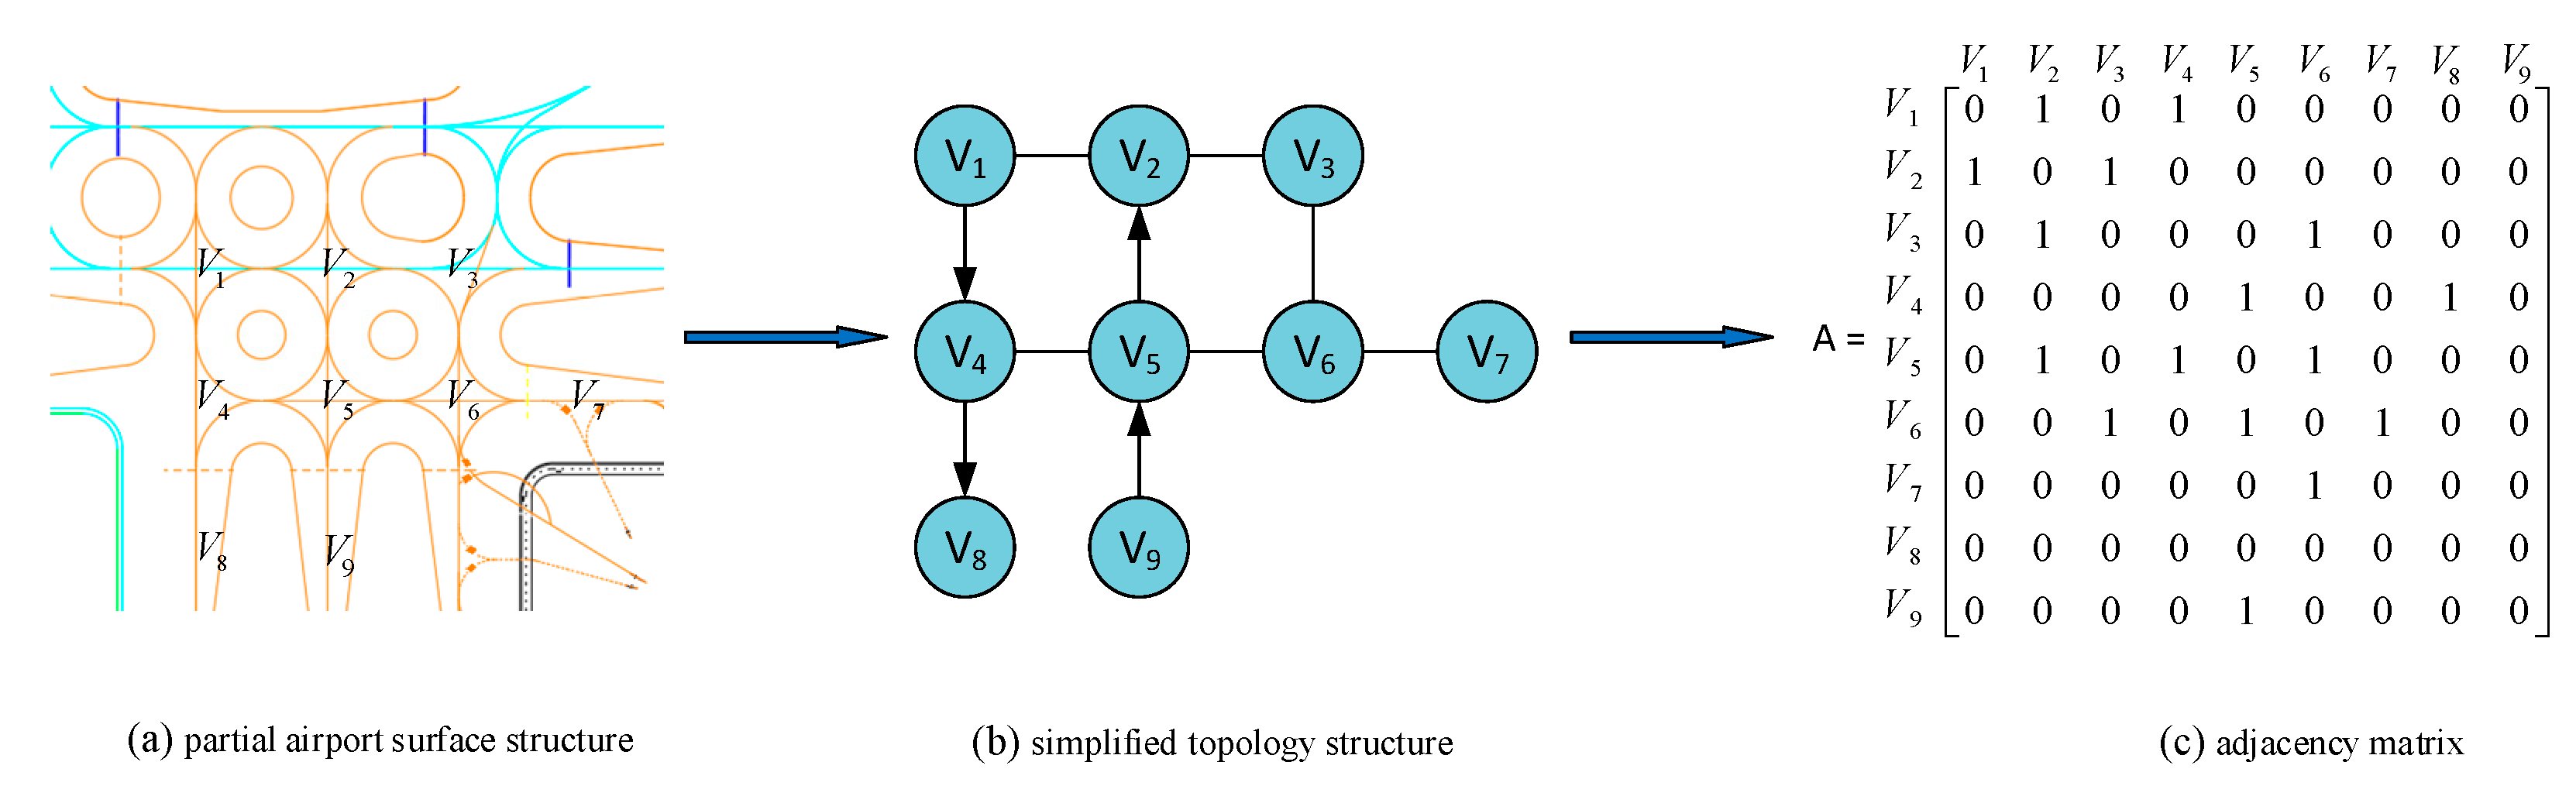
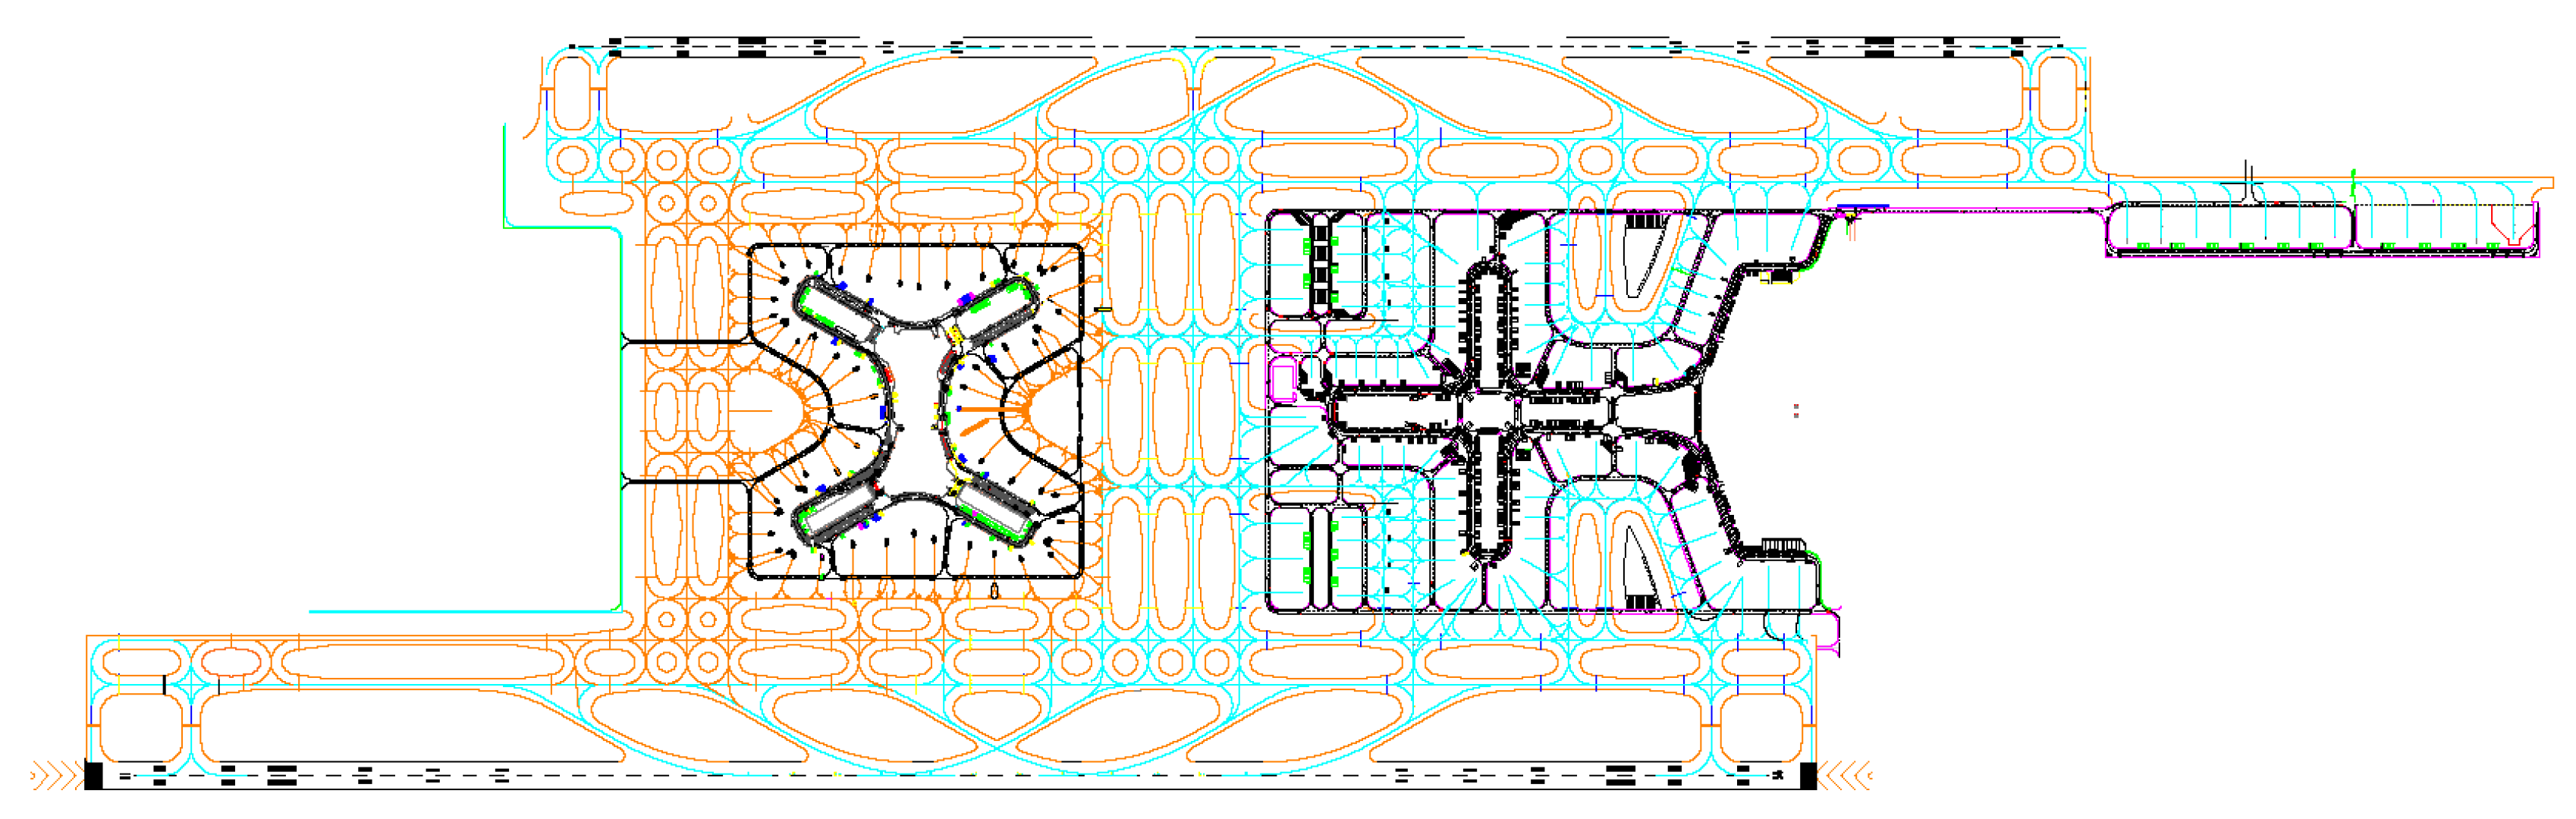
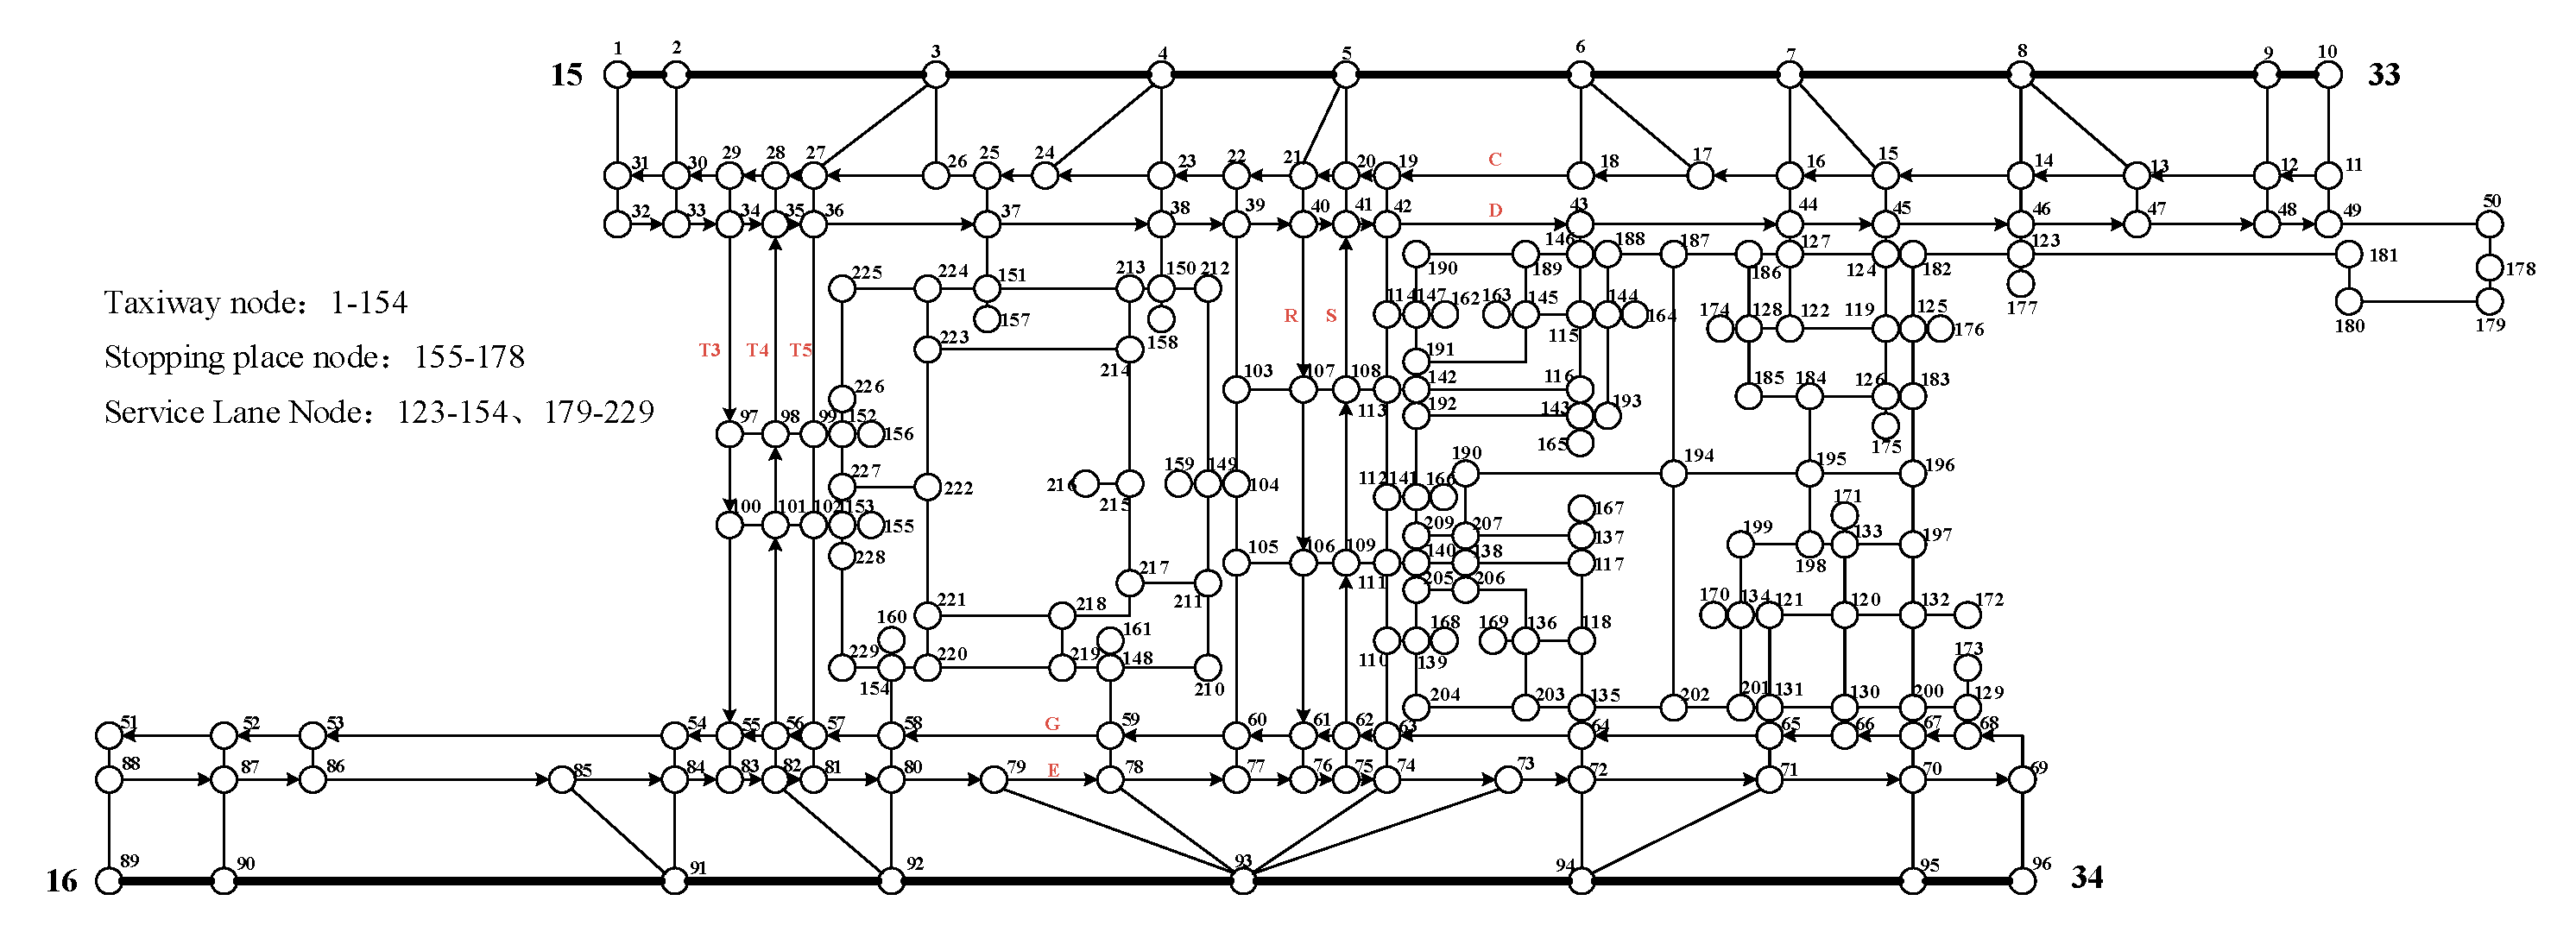
2.1. Characterization of the Physical Structure of the Airport Surface and Network Topology Modeling

The mega-airport surface structure is intricate and complex, and there are many straight sections, turning sections, and hundreds or even thousands of crossing nodes in the taxiway system. In order to facilitate the modeling of the issue, the physical structure of the airport surface is simplified through feature extraction and abstraction. By simplifying the intersection areas of runways, taxiways, and service lanes as “nodes”, and taking the taxiways, liaison lanes, and service lanes corresponding to the connecting lines between the nodes as “edges”, the physical structure of the airport surface is abstracted into a topological network model G = ( V , E , W ) consisting of N nodes and M edges. Where V represents the set of nodes of a topological network model, E represents the set of edges of a topological network model, and W represents the weights of a topological network model. The adjacency matrix A ( a i j ) represents the adjacency relationships between the nodes in the topological network model of the airport surface. If the node i and the node j have connected edges and the weight size is a i j , a i j 0 ; otherwise, a i j = 0 . Taking the partial airport surface structure shown in Figure 1a as an example, the structure can be simplified to a network topology containing 9 nodes and 10 edges as shown in Figure 1b, and further calculations lead to the corresponding adjacency matrix in Figure 1c.

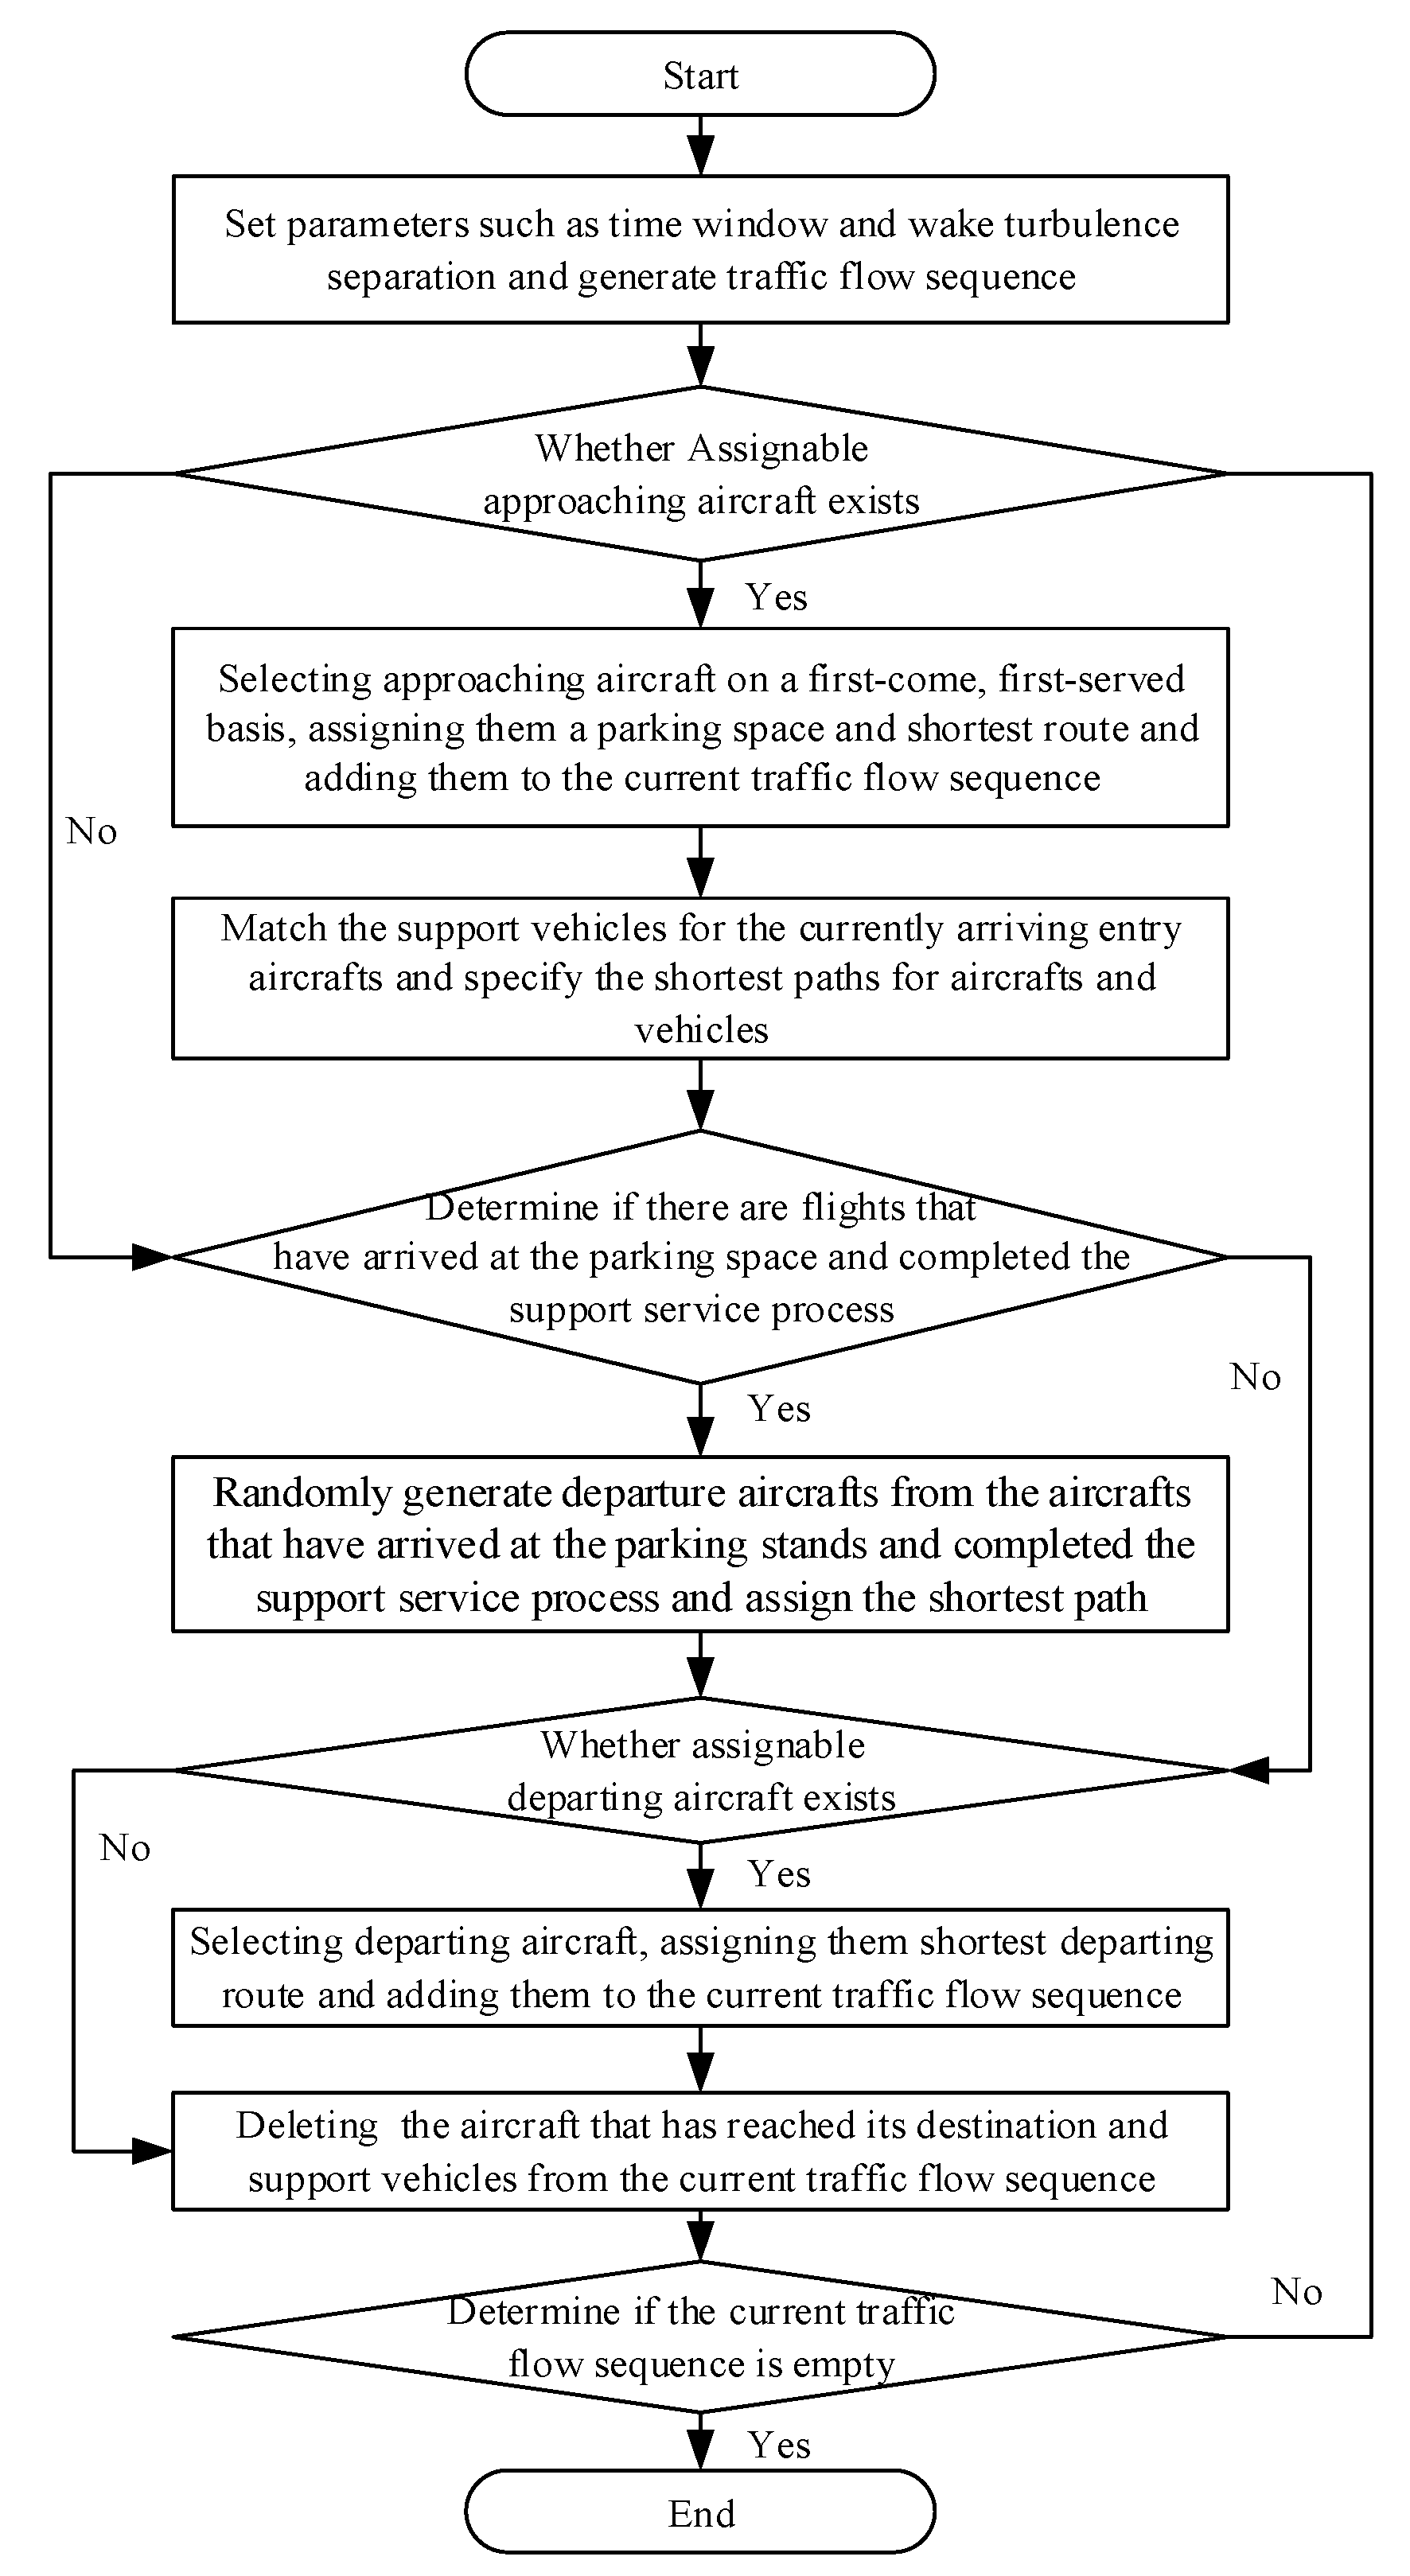
2.2. Simulation of Airport Surface Traffic Operations Based on Monte Carlo Method

Based on the constructed topological network model of the airport surface, in this section, for the two types of activity targets, aircraft, and vehicles, the Monte Carlo method is used to simulate the operation characteristics of different activity targets and establish the simulation environment for heterogeneous traffic flow on the airport surface. Taking Shenzhen Bao’an International Airport as an example, the single-sample K-S test method [22] is used to statistically analyze the historical operation data of approaching and departing aircraft. It is found that the approaching traffic flow obeys the Poisson distribution approximately. Based on the above assumptions, firstly, for the “individualized” traffic subject, each approaching aircraft, each departing aircraft, and each service vehicle that is compatible with the flight transit process are randomly generated; then, for the generated traffic “individual”, comprehensively consider various airport surface operation rules, and further generate “hybridized” airport surface “aircraft–vehicle” heterogeneous traffic flow. The specific traffic flow generation rules are as follows:
(1)
Randomized generation of “traffic individuals” for airport surfaces based on statistical properties
It is assumed that the number of approaching aircraft obeys a Poisson distribution with parameter λ . Further, 1 / λ denotes the number of approaching aircraft per unit time, which reflects the intensity of aircraft arrival. Then, the probability that the number of approaching aircraft per unit time k is
P X ( t ) = k = λ ( t ) k k ! e λ ( t ) ,   k = 0 ,   1 ,   2
where X ( t ) denotes the total number of aircraft approaching at time t .
Assuming that Y ( t ) is the number of support vehicles, then:
Y ( t ) = X ( t )
For departing aircraft, they are randomly generated from slots where the transit process has been completed and the support vehicles have completed their services. Then, the probability that the number of departing aircraft per unit time q is
P ( Z ( t ) = q ) = q n ,   q = 0 , 1 , , n   ( 0 < n Y )
where Z ( t ) denotes the number of departing aircraft at time t , n denotes the number of aircraft that have completed the support service process in the parking spots.
(2)
Hybrid simulation of airport surface heterogeneous “traffic flow” based on rule constraints
For the generated airport surface traffic individuals, tail flow interval, airport surface operation interval, shortest path, and first-come–first-served rule constraints are used to further generate the airport surface traffic group in line with the actual operations of the airport surface.
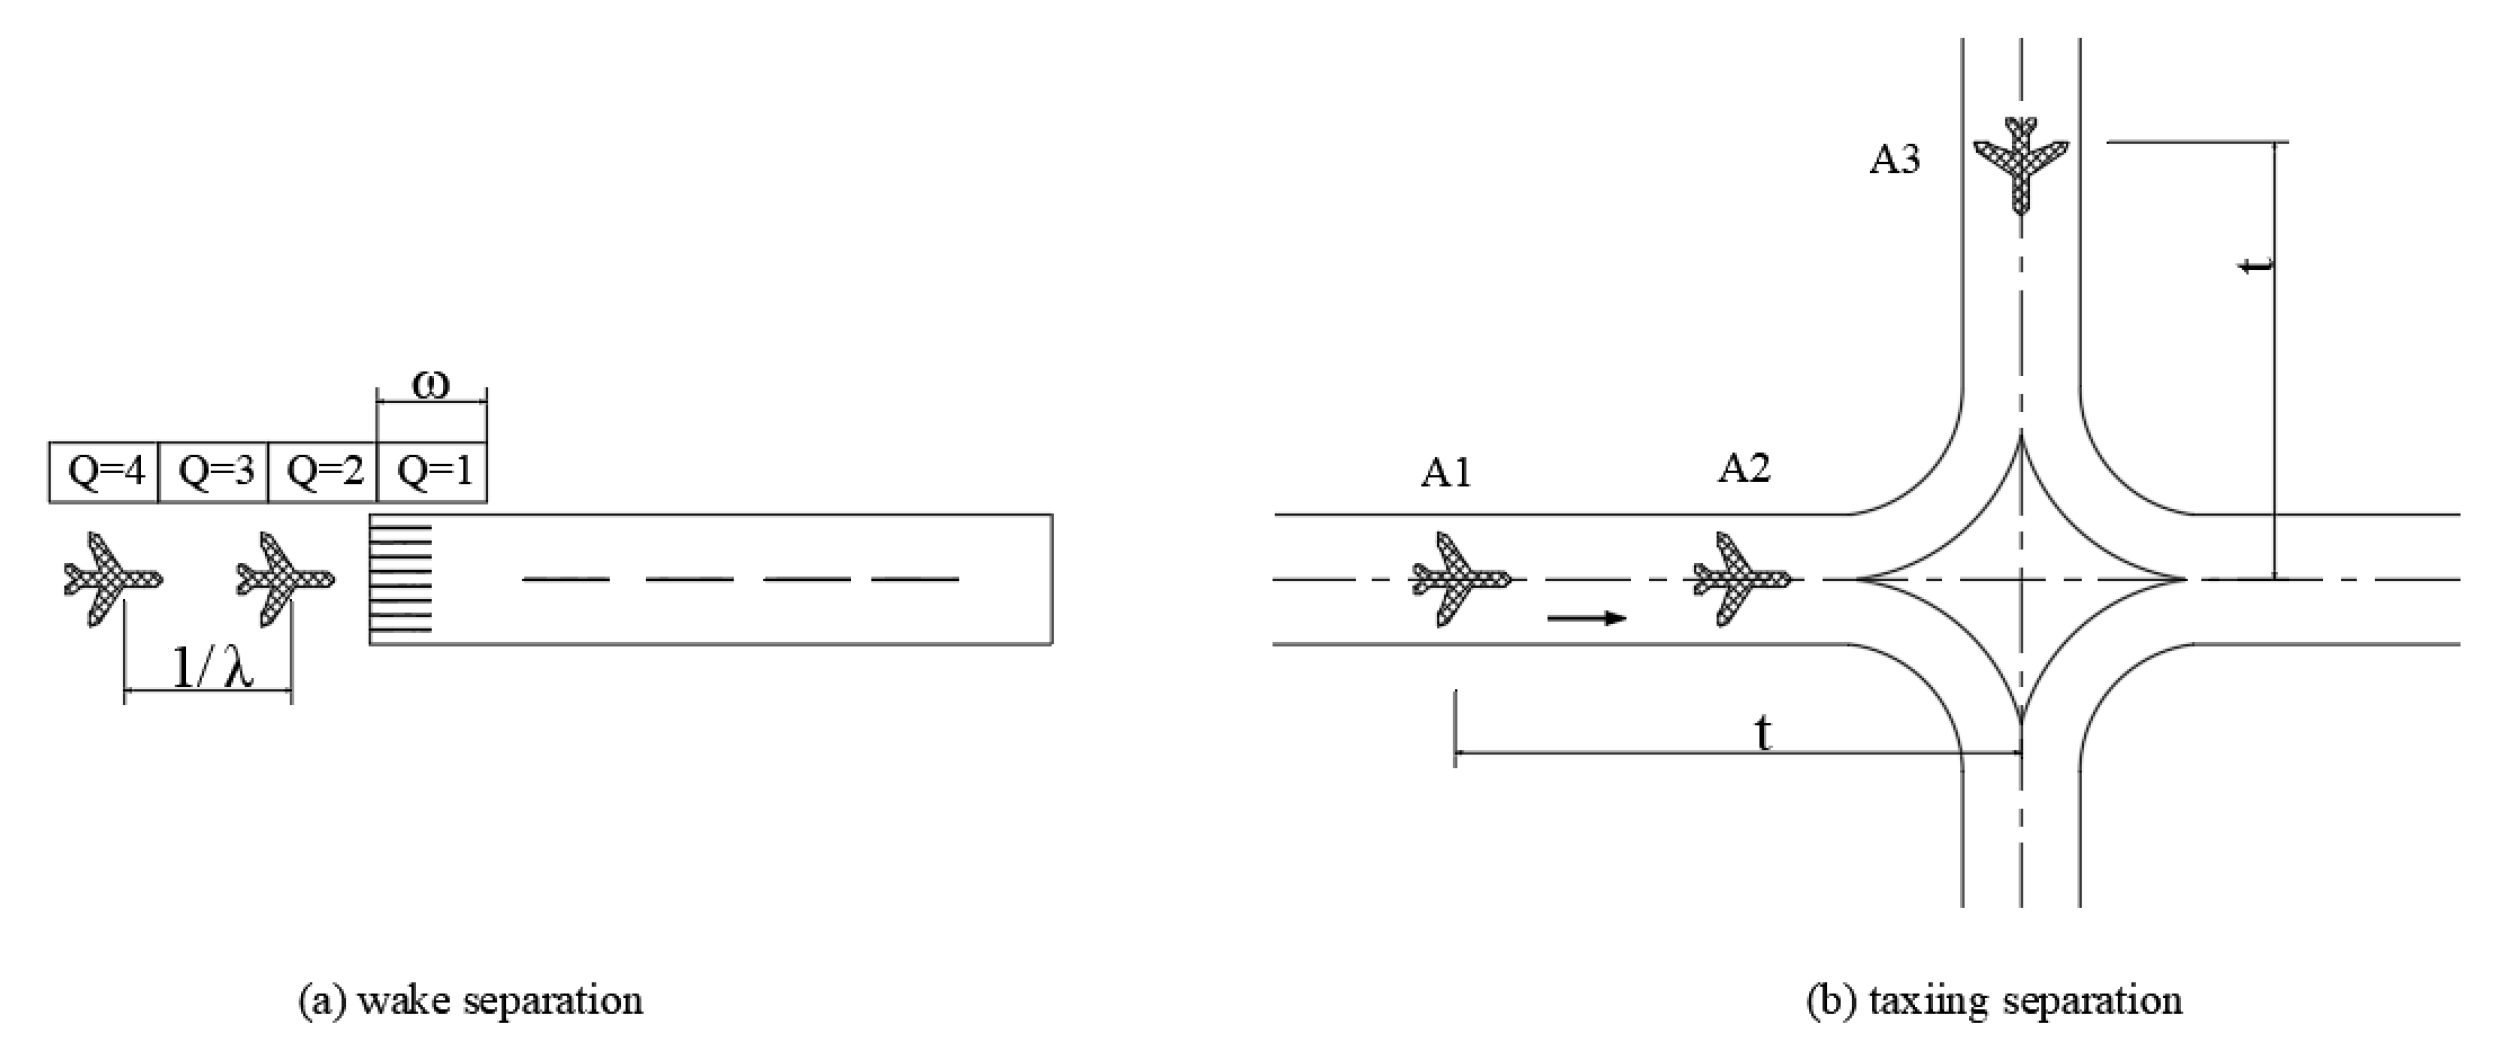
“Tail flow interval” rule: mainly for runway takeoff and landing aircraft. Between approaching aircraft, departing aircraft, and between approaching and departing aircraft, the tail flow interval ω is maintained according to the front and rear aircraft types. In this paper, the interval is set to 5 min.
“Airport surface taxiing interval” rule: mainly for the aircraft that has entered the taxiing process. For between approaching aircraft, between departing aircraft, and between approaching and departing aircraft, the corresponding airport surface taxiing interval τ is maintained according to the front and rear aircraft types. In this paper, the interval is set to 40 s.
“Shortest Path” Rule: mainly for the aircraft before entering the taxiway. For the approaching aircraft arriving at the runway entrance and the randomly generated departing aircraft, the shortest approaching and departing taxi paths are configured for them. The shortest path between two points is calculated using Dijkstra’s algorithm. For support vehicles, the shortest paths are also followed to enter and exit specific areas of the airport surface.
The “first-come–first-served” rule: mainly for the following two types of situations. The first one is the case of not meeting the runway wake interval if the time slot assigned to the former aircraft i is S i = Q , and when the wake interval between the former aircraft and the latter aircraft cannot be met, the time slot assigned to the latter aircraft j is S j = Q + 1 , as shown in Figure 2. The second is the case of not meeting the crossing interval, if two or more aircraft or support vehicles arriving at a taxiway node do not meet the safety interval, the subsequent aircraft or support vehicles need to bypass the node and re-plan the shortest path to continue to complete the movement process.
According to the above rule restrictions, the hybrid simulation process of heterogeneous “traffic flow” on the airport surface shown in Figure 3 is established, and the basic steps are as follows:
Step 1: Set the parameters of the time window, wake interval, taxiing speed of aircraft, traveling speed of vehicles, etc., and generate a sequence of approaching aircraft that conforms to the Poisson distribution of the parameter λ ;
Step 2: If the approaching aircraft sequence is non-empty and has not reached the last time slot, select the approaching aircraft to arrive at the runway entrance according to the first-come–first-served rule, and select the parking space for the currently arriving approaching aircraft and calculate the shortest path and add it to the current traffic flow sequence; otherwise, go to Step 4;
Step 3: Match the protection vehicle for the current approaching aircraft, calculate the shortest path from the vehicle to the corresponding parking space of the aircraft, and add the vehicle to the current traffic flow sequence;
Step 4: Record the dynamic time slot occupancy of the approaching aircraft and the supporting vehicle, and if there exists an approaching aircraft that has arrived at the parking space and completed the supporting service process, randomly generate the departing aircraft from the corresponding parking space and add it to the sequence of departing aircraft; otherwise, go to Step 5;
Step 5: Determine whether the sequence of departing aircraft is empty; if not, select the departing aircraft in accordance with the first-come–first-served rule, specify the shortest path of the departing taxiing process, and add the departing aircraft to the current traffic flow sequence; otherwise, go to Step 6;
Step 6: Record whether all aircraft and support vehicles in the current network reach the endpoint, and remove the aircraft or vehicles that reach the end point from the current traffic flow sequence;
Step 7: Judge whether the current traffic flow sequence is empty; if not, go to Step 2; otherwise, the hybrid traffic flow simulation ends.

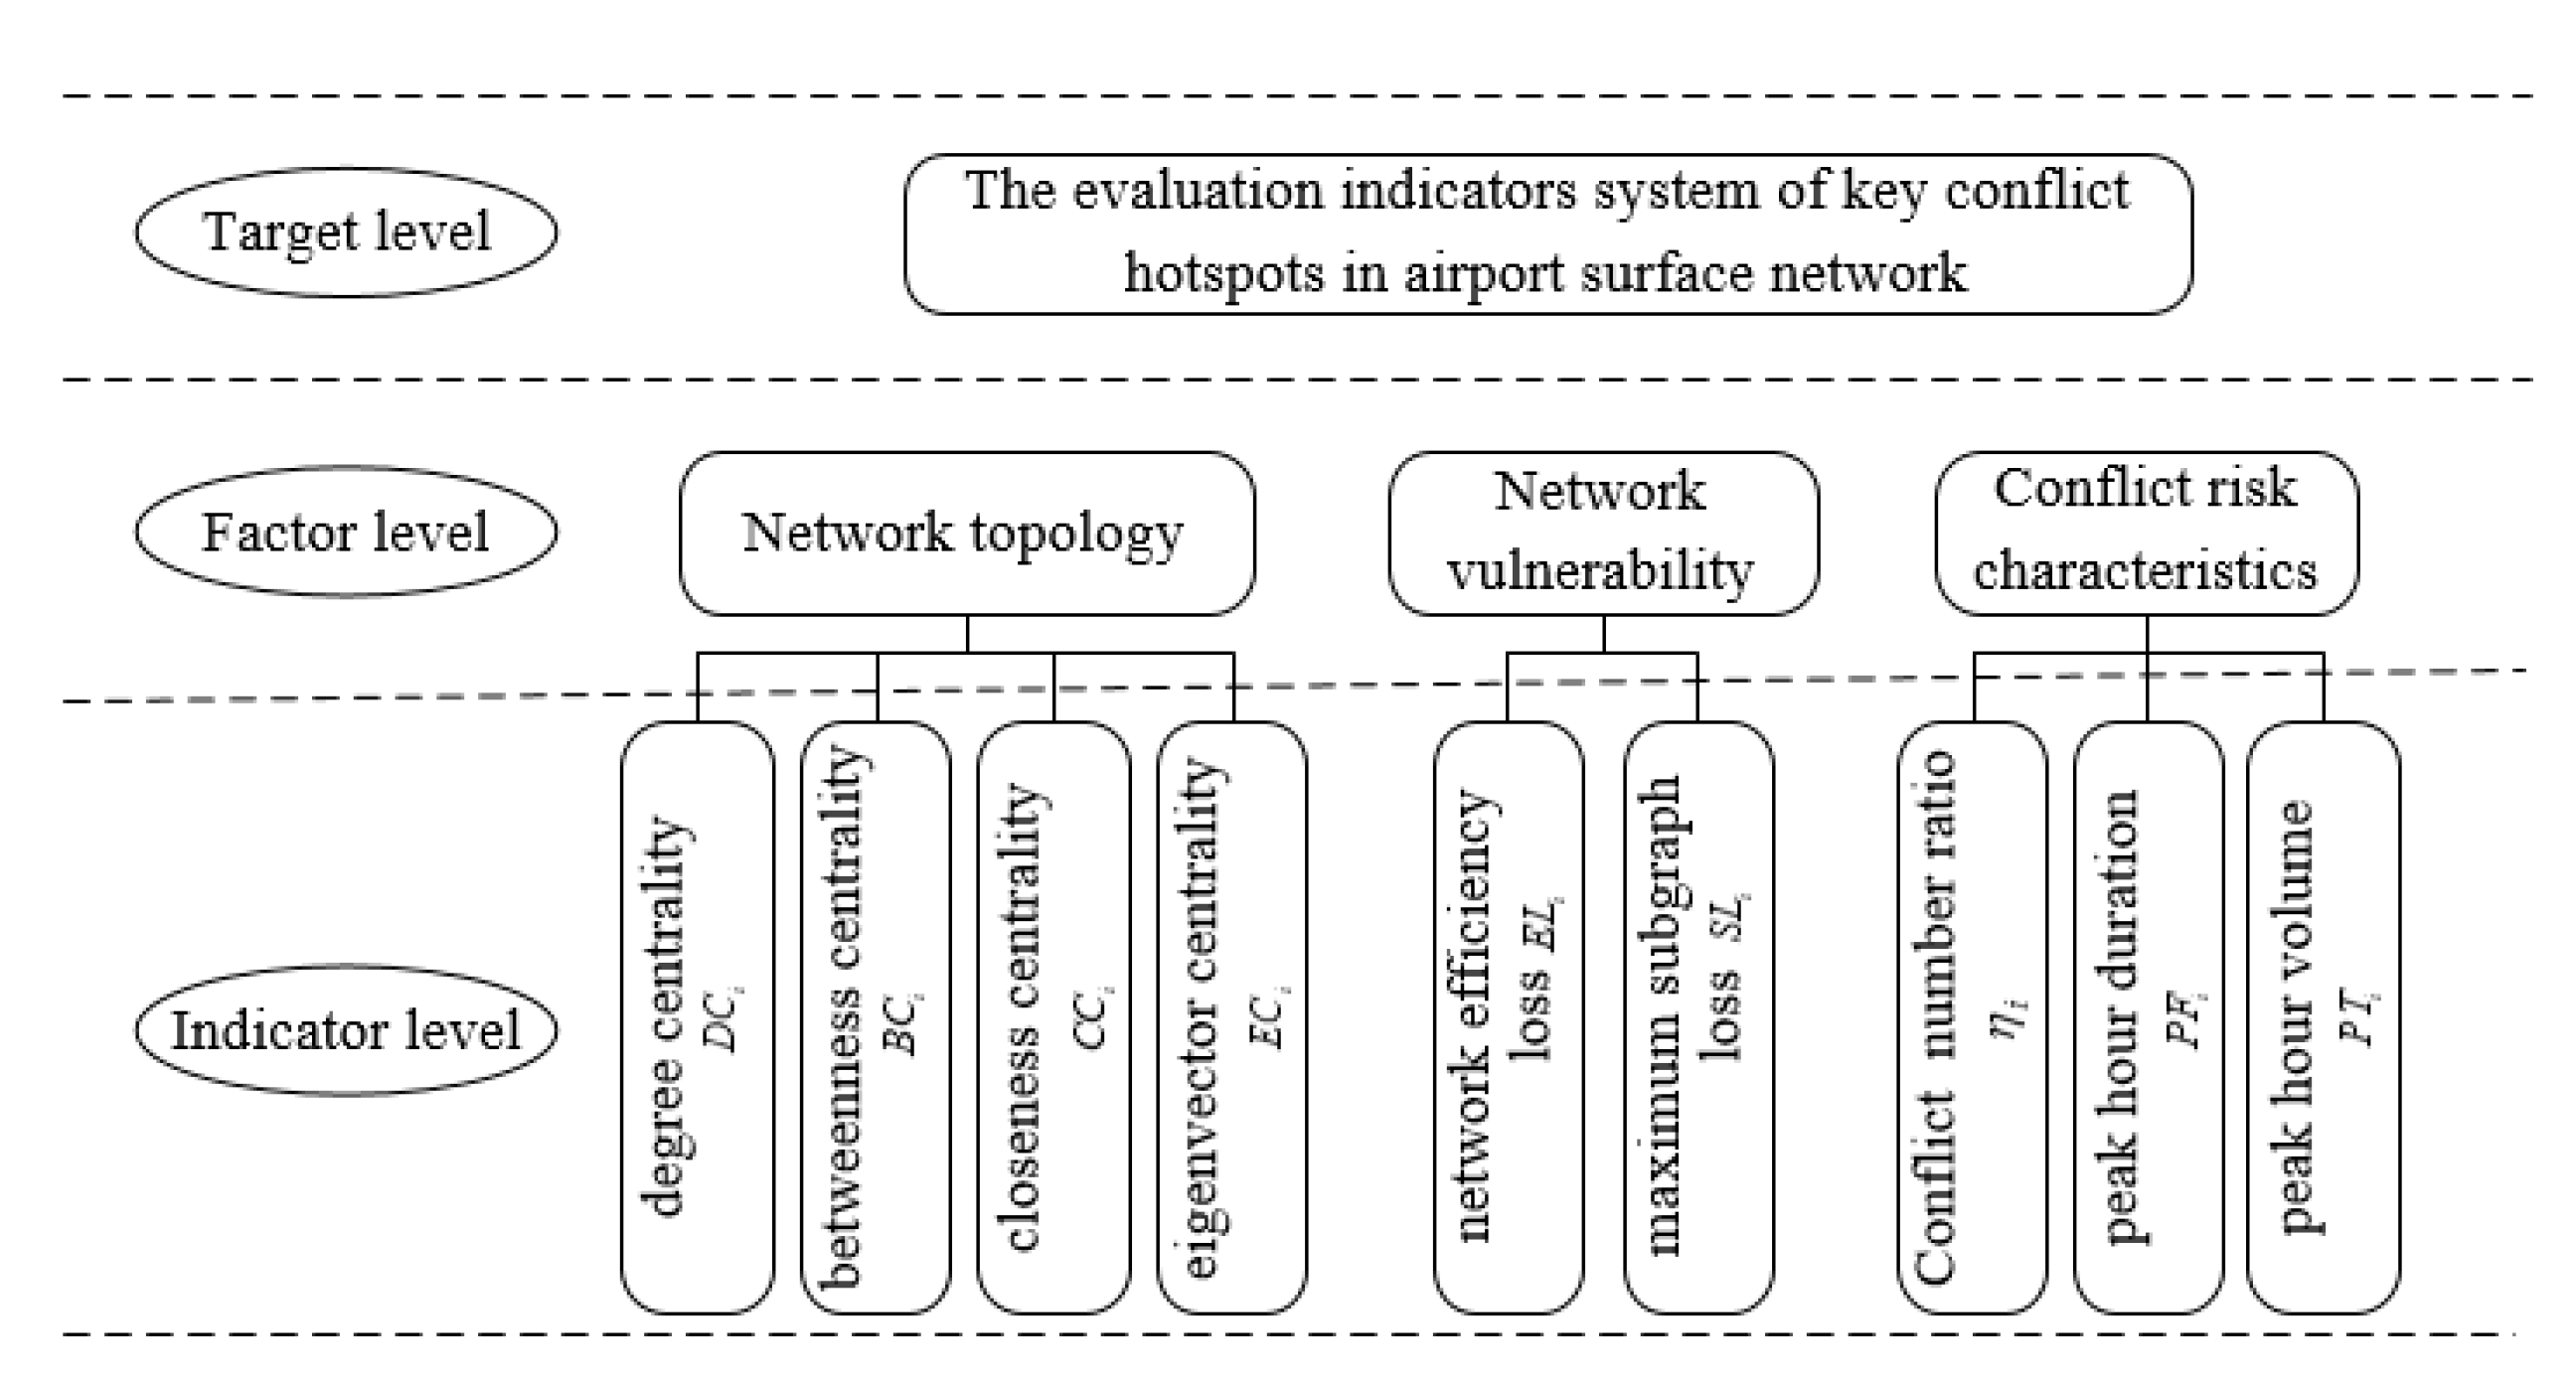
3. Multidimensional Feature Classification and Identification of Mixed Traffic Flows on Airport Surfaces

Aiming at the problem that there are more intersecting nodes in the complex airport surface traffic network. It is difficult for a single conflict indicator to scientifically differentiate and accurately measure the conflict characteristics of different nodes. This section is based on the simulation model of airport surface traffic operation constructed in Section 1, which conducts a hybrid simulation of the airport surface operation process for both aircraft and vehicles, and constructs the risk of the hybrid traffic flows on the airport surface by orienting to the multi-dimensional perspectives of the topological structure characteristics, the vulnerability of the network, and the complexity of the traffic. The hotspot characterization index system and its measurement method are constructed to provide an evaluation basis for accurately identifying the hotspot areas of operation risk between different traffic subjects such as aircraft–aircraft, aircraft–security vehicle, security vehicle–security vehicle, and so on. The hotspot characteristic index system of mixed traffic flow risk on the airport surface is shown in Figure 4.

3.1. Topology Characterization Identification

(1)
Degree centrality index
The degree centrality index is an important index for portraying the centrality of nodes in network analysis. The greater the degree of a node, the higher the value of degree centrality, implying that the operating environment around the node is more complex. The degree of a node is normalized by the total number of nodes in the network and is calculated as
D C i = D i N 1
where D C i is the degree centrality of the node i , N is the number of nodes, D i is the degree value of the node i , which denotes the number of edges directly connected to the node i .
(2)
Betweenness centrality index
The betweenness centrality index of a node is used to reflect the importance of the node’s position in the network, and the more shortest paths through the node, the larger the betweenness of the node, which is normalized by the total number of shortest paths, calculated as
B C i = i j k l j k ( i ) l j k
where B C i is the betweenness centrality of the node i , l j k ( i ) is the number of shortest paths from the node j to the node k through the node i , l j k is the number of all shortest paths from the node j to the node k .
(3)
Closeness centrality index
The proximity centrality index of a node is used to represent the inverse of the average shortest distance from that node to all other nodes, which is used to reflect the proximity between a node and other nodes in a network. The proximity centrality index is calculated as
C C i = N 1 j 1 N d ( i , j )
where C C i is the closeness centrality of the node i , d ( i , j ) is the shortest distance from the node i to the node j .
(4)
Eigenvector centrality index
The eigenvector centrality index is used to reflect the influence of the importance of neighboring nodes on this node, which is the eigenvector corresponding to the largest eigenvalue of the network adjacency matrix. The eigenvector centrality emphasizes that the node importance is linearly related to the importance of neighboring nodes. The eigenvector centrality index is calculated as
E C i = x i = 1 λ A j = 1 N A i j x j
where E C i is the eigenvector centrality of the node i , N is the number of nodes, λ A is the maximum eigenvalue of the network adjacency matrix A , and its corresponding maximum eigenvector is x = x 1 , x 2 , , x N Τ .

3.2. Network Vulnerability Identification

(1)
Network efficiency loss index
Network efficiency refers to the average efficiency of all pairs of nodes in the network. The efficiency of pairs of nodes is expressed as the reciprocal of the shortest distance between the nodes, which reflects the ease of connectivity between nodes in the network. Its calculation formula is as follows:
E = 1 N ( N 1 ) i j 1 d i j
where E is the network efficiency, d i j is the distance from the node i to the node j .
The network efficiency loss of a node is defined as the rate of change of the network efficiency before and after removing the node, and a larger rate of change means that the node is more important. The calculation formula for network efficiency loss is as follows:
E L i = E E i E
where E L i is the network efficiency loss of the node i , and the new network efficiency E i after deleting the node i and its connected edges.
(2)
Maximum subgraph loss index
The maximum subgraph loss of a node is defined as the degree of change in the number of nodes contained in the maximal connected subgraph of the network before and after removing the node. The calculation formula for maximum subgraph loss is as follows:
S L i = N N i N
where S L i is the maximum subgraph loss of the node i , N is the number of nodes in the maximal connected subgraph of the original network, and N i is the number of nodes in the maximal connected subgraph after removing the node i .

3.3. Traffic Complexity Identification

Based on the Section 2.2 simulation of airport surface traffic operation, the dynamic time slot occupancy of all aircraft and support vehicles. The taxi paths of aircraft and vehicle travel paths, as well as the occupancy frequency of the network nodes, are recorded, and the number of traffic individuals passing through each node and resulting in deployment due to conflicts is counted. Based on the simulation statistics, the airport surface traffic complexity index is calculated.
(1)
Conflict number ratio index
The conflict number ratio index is the ratio between the number of abnormal activity targets (i.e., traffic individuals deployed as a result of node conflicts) passed by a node in a given time period and the total number of activity targets in the airport surface topology network in that time period. The conflict number ratio is calculated using the formula:
η i = C i N
where η i is the conflict count ratio of the node i , C i is the total number of aircraft and support vehicles passing through the node i , and N is the sum of the total number of aircraft takeoffs and landings and the total number of support vehicles during the specified time.
(2)
Peak hour flow index
The peak hour flow of a node reflects the maximum level of traffic flow that the node can carry in the network. Its calculation formula is as follows:
P F i = max ( f i t )
where P F i is the peak hour flow of the node i , f i t is the traffic flow of the node i at the time t .
(3)
Peak hour duration index
When the traffic flow of some nodes in the airport surface network always remains at a high level, the likelihood at that node increases, so the peak hourly duration can also reflect the importance of the node. Peak hour duration is defined as the length of time when the hourly traffic f i of node i is greater than its threshold F max , which is calculated by the formula:
P T i = t θ t
F max = F i ¯ P F i
θ t = 1 , f i t F i ¯ P F i 0 , f i t < F i ¯ P F i
where P T i is the peak hour duration of the node i , F i ¯ is the average hourly flow of the node i , θ t is a 0–1 variable used to determine whether the node’s flow is in peak flow status at each moment, if f i t F i ¯ P F i , then θ t = 1 , which indicates that node i is in peak flow state at moment t , otherwise, θ t = 0 , which indicates that node i has not reached peak flow state at moment t .

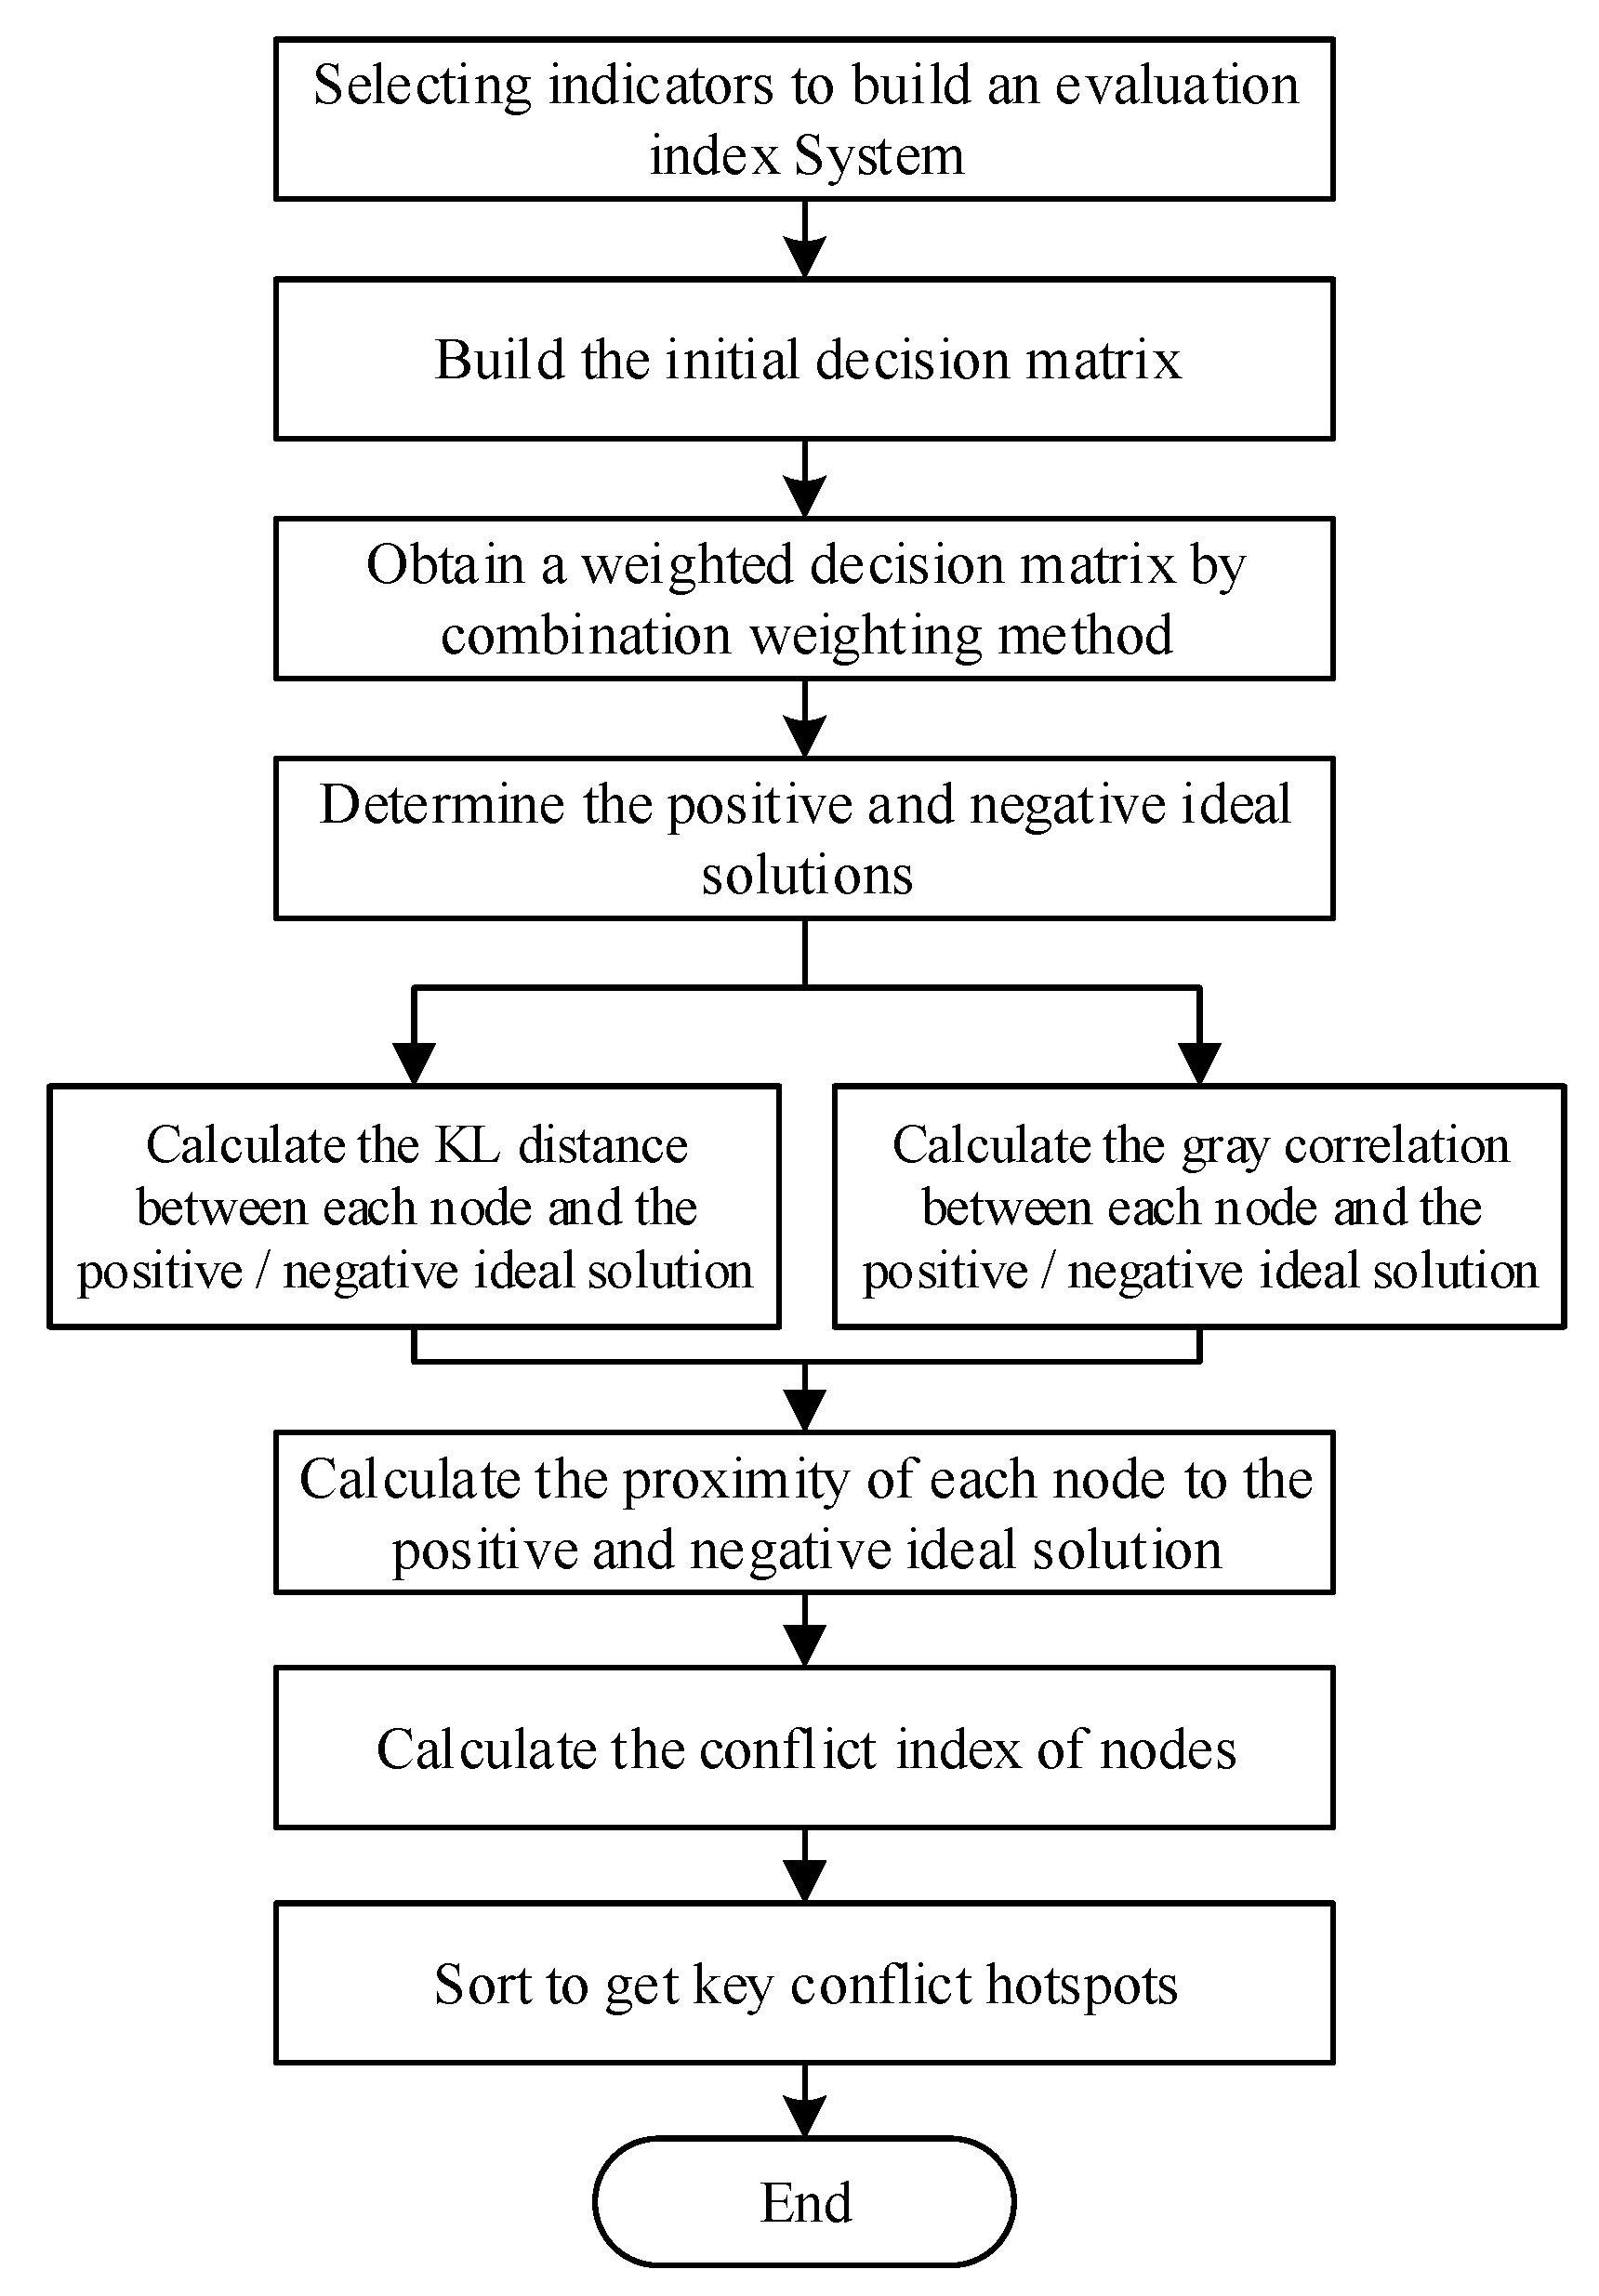
4. Comprehensive Evaluation of Operational Risk of Mixed Traffic Flows on Airport Surfaces

According to the multidimensional characteristic index system of the airport surface mixed traffic flow constructed in Section 2, this section adopts the CRITIC–entropy weighting method to assign weights to each index, which establishes the operation risk evaluation method based on TOPSIS–gray correlation analysis on this basis to realize the comprehensive evaluation of the operation risk of the airport surface mixed traffic flows and the risk hotspots.

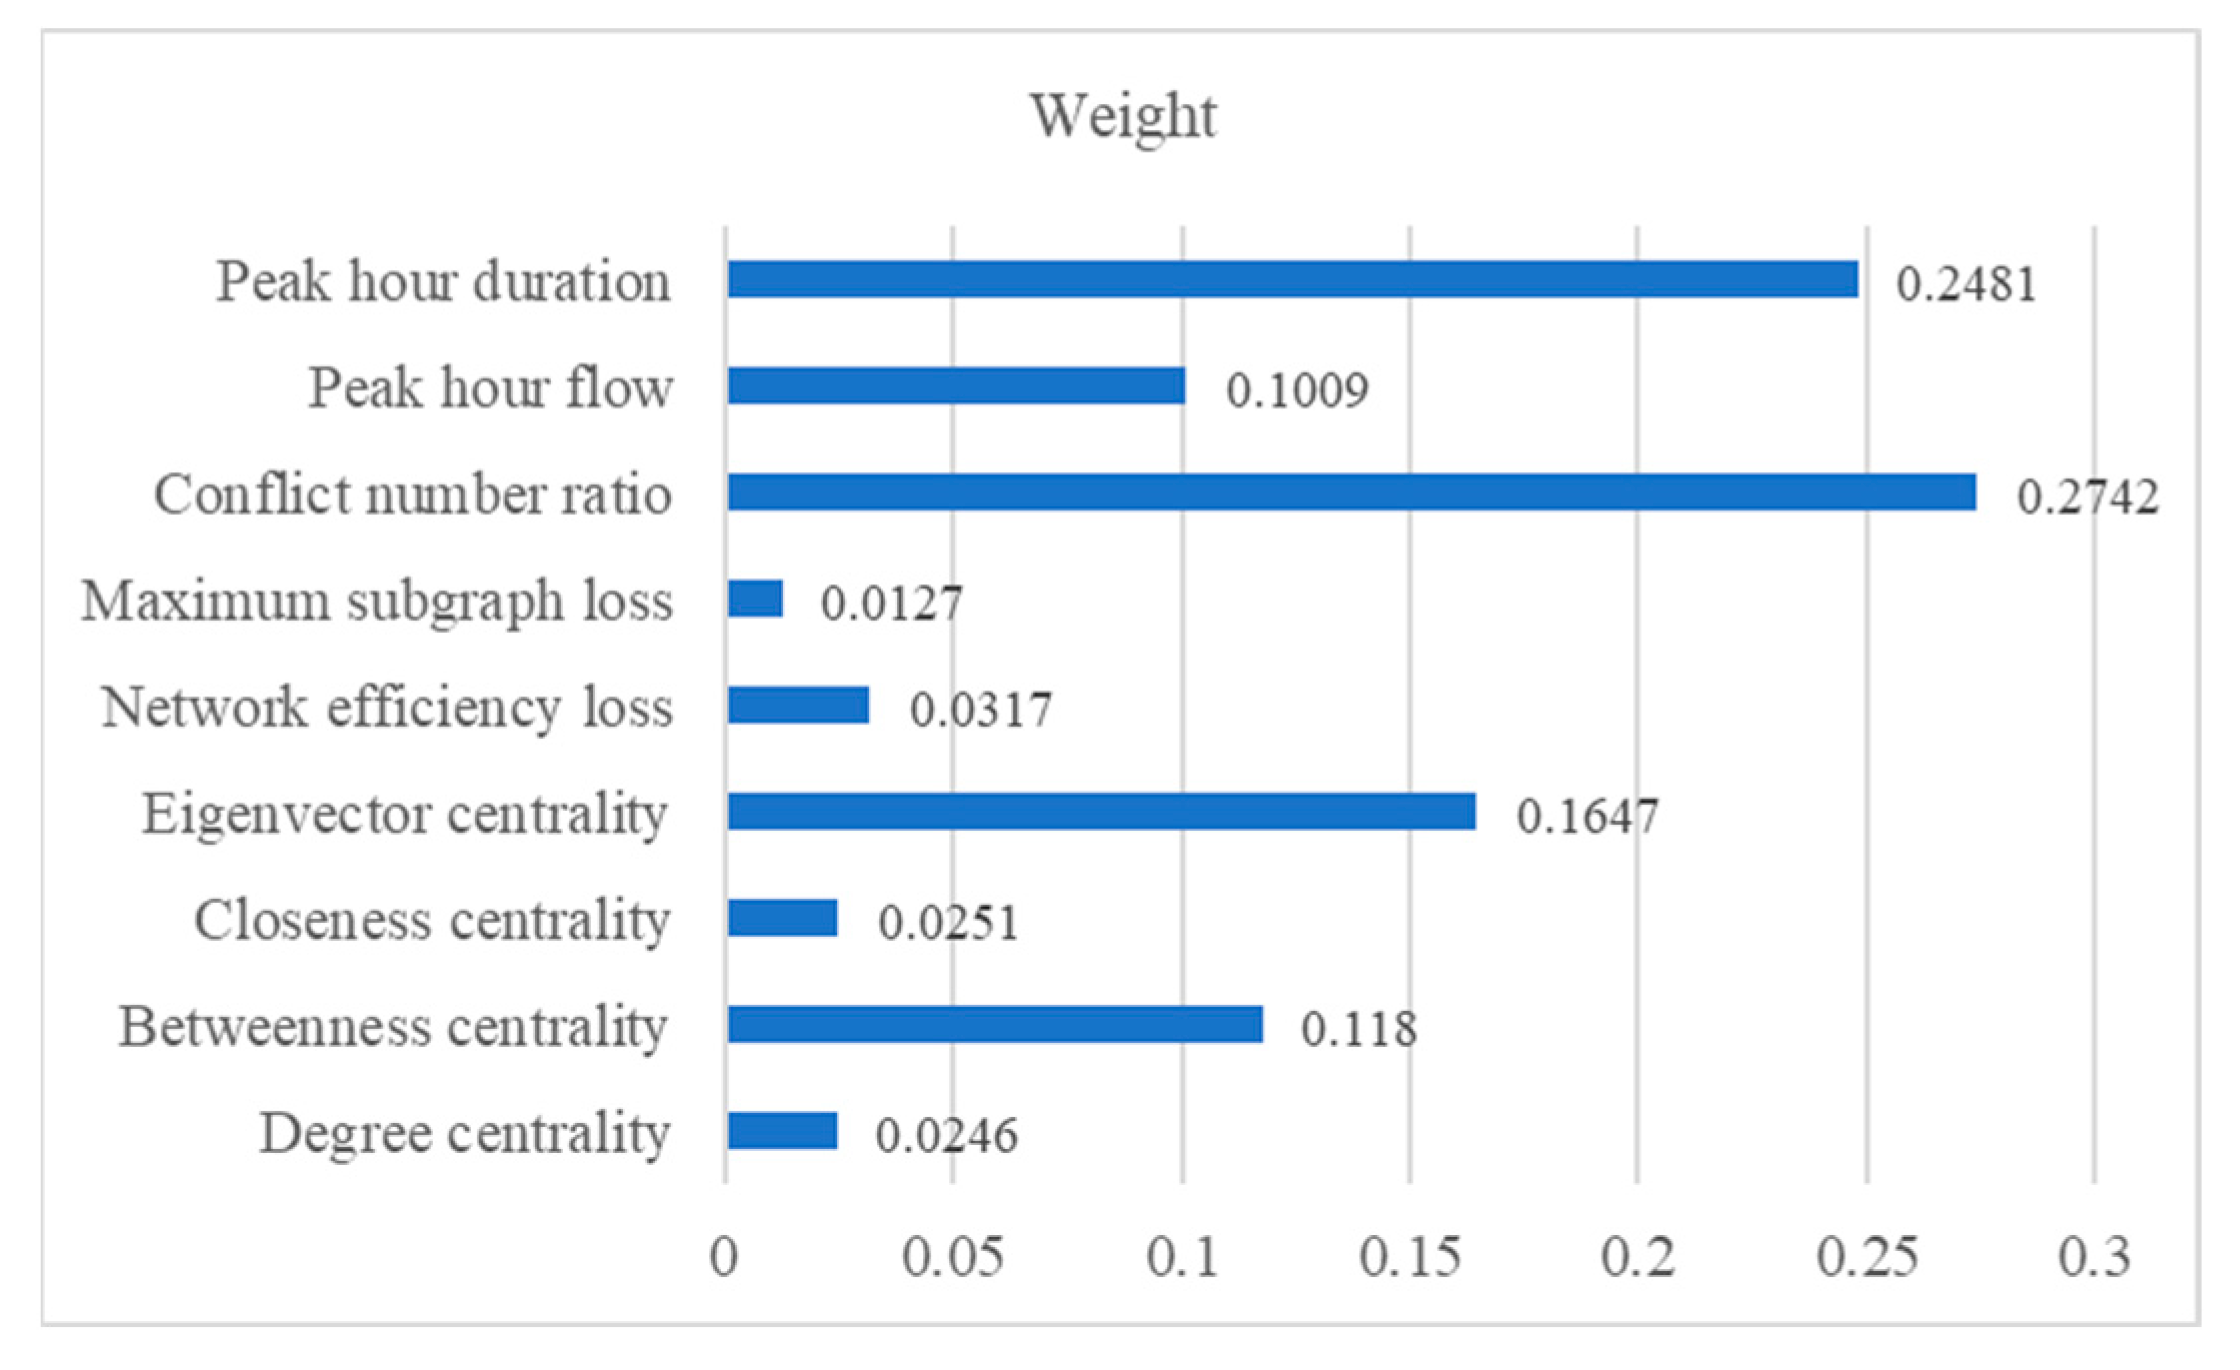
4.1. Assignment of Feature Indicators Based on CRITIC–Entropy Weight Method

The combination of the CRITIC method and entropy weighting method [23] is used to assign weights to each evaluation index, which can avoid subjective arbitrariness and reduce the resulting bias caused by the single assignment method compared with the subjective assignment method, so as to obtain more accurate weights. Assuming that the weights of the i -th indicator obtained by the CRITIC method and entropy weight method are x i and y i , respectively, and the proportion of weights are a 1 and a 2 , respectively, then the combination weight ω i of the i -th indicator is
ω i = a 1 x i + a 2 y i
Combinatorial assignment can be transformed into an assignment optimization problem with the following assignment optimization model:
max F ( a 1 , a 2 ) = i ( j ( a 1 x i + a 2 y i ) ) a 1 + a 2 = 1 a 1 , a 2 0
The solution is based on the Lagrangian extreme value condition:
a 1 = i j x i s i j ( i j x i s i j ) 2 + ( i j y i s i j ) 2 a 2 = i j v j s i j ( i j x i s i j ) 2 + ( i j y i s i j ) 2
This, in turn, leads to a normalized solution:
a 1 = a 1 a 1 + a 2 a 2 = a 2 a 1 + a 2
where i denotes a network node, S i j denotes the value of the i -th metric of the j -th node, S i j denotes the normalized metric value, and S i j = S i j i = 1 N S i j 2 .

4.2. Operational Risk Evaluation Based on TOPSIS–Gray Correlation Analysis

The TOPSIS–gray correlation analysis method [24] was used to calculate the risk index of each node in the airport surface network, and the nodes of the surface network were ranked according to the size of the risk index to obtain the risk hotspots.
(1)
Indicator pre-processing
Assuming that there are n nodes in the constructed airport surface network with m risk evaluation indicators, s i j ( i = 1 , 2 , 3 , , n ;   j = 1 , 2 , 3 , , m ) denotes the initial value of the n -th node under the m -th risk evaluation indicator, and construct the initial matrix S as:
S = s 11 s 12 s 1 m s 21 s 22 s 2 m s n 1 s n 2 s n m
At the same time, in order to avoid the calculation error caused by the different dimension index values of the nodes, it is necessary to standardize the initial matrix S to obtain the standardized decision matrix Z = ( z i j ) n × m .
z i j = s i j min 1 i n s i j max 1 i n s i j min 1 i n s i j , i = 1 , 2 , , n ; j = 1 , 2 , , m
(2)
Calculate the weighting matrix
According to Section 3.1 combination of the weighting method to obtain the weights of the indicators for a j , a j meet j a j = 1 , combined with the standardized decision matrix obtained Z = ( z i j ) n × m of the standardized indicator values to obtain the weighting matrix X :
X = ( x i j ) n × m = ( z i j · a j · ) n × m
(3)
Calculate the ideal solution
Based on the resulting weighting matrix, calculate its positive ideal solution X + and negative ideal solution X .
X + = max 1 i n x i j = [ x + ( 1 ) , x + ( 2 ) , x + ( 3 ) , x + ( m ) ]
X = max 1 i n x i j = [ x ( 1 ) , x ( 2 ) , x ( 3 ) , x ( m ) ]
(4)
Calculate the comprehensive proximity
Combining the relative entropy and gray correlation between each node and the positive and negative ideal solutions, the proximity N i + and N i of each node to the positive and negative ideal solutions is calculated, and, finally, the comprehensive risk index of the node is obtained C i .
C i = N i + N i + + N i
The process of airport surface network node risk index calculation and hotspot identification is shown in Figure 5. The specific steps are as follows:
The steps of comprehensive evaluation are as follows:
Step 1: Determine evaluation indicators. From the three dimensions of topological structure characteristics, network vulnerability, and traffic complexity. The characteristic index system (Equations (4)–(15)) is extracted as the evaluation index of the operational risk of mixed traffic flows on the airport surface.
Step 2: Node risk indicator assignment. Using the indicators extracted in Step 1, the airport surface risk evaluation indicators are assigned according to the Section 3.1 Combined Assignment Method;
Step 3: Calculate the risk index of the node. Calculate the risk index of the nodes of the airport surface network according to the Section 3.2 risk evaluation method for airport surface operation;
Step 4: Sorting the risk index of nodes. Comprehensively evaluate the risk index of the nodes of the airport surface network, so as to obtain the risk index ranking results of the nodes of the surface network, which select the nodes with larger risk indexes as the risk hotspots of the airport surface network.

5. Case Study

5.1. Simulation Environment Setting

Shenzhen Bao’an International Airport is selected as the research object to carry out a comprehensive validation analysis of the method proposed in this paper. The physical layout plan of the airport is shown in Figure 6. Aircraft taxiing in the apron should follow the principle of downward circulation, relatively fixed, flexible deployment, vertical taxiway S, T4 taxiing direction from west to east, R, T3 taxiing direction from east to west, parallel taxiway C, G taxiing direction from south to north, D, E taxiing direction from north to south. Topological abstraction and simplification of the physical structure of the airport surface are processed to obtain the topological model of the airport surface network shown in Figure 7, which contains 229 nodes and 362 edges.
A single-sample K-S test was used to analyze the characteristics of the approaching traffic flow distribution at the airport by selecting the operational data on a normal day. Using the flight schedule data of 10 January 2022 as a sample with a single time slice length of 15 min, this paper statistically analyzes the approaching traffic flows at Shenzhen Bao’an Airport. Count the number of flight arrivals in each time period, calculate the scheduled arrival frequency of flights in each time period, and use the average of the scheduled arrival frequency of flights as the parameter λ of the Poisson distribution. The K-S test statistic is constructed as
Z = n 1 max i S x i F x i
where n 1 is the sample size, S x is the cumulative probability of the actual distribution, F x is the cumulative probability of the theoretical distribution.
The detection probability of the K-S test is 0.557, which is greater than the significance level of 0.05, and thus it can be assumed that the approaching traffic flows obey a Poisson distribution approximately. By using the K-S test, the cumulative distribution function of the actual observed data and the cumulative distribution function of the theoretical distribution are compared as shown in Figure 8.
Based on the field network model of Shenzhen Bao’an Airport, combined with the actual operation of the Bao’an Airport surface, the simulation parameters of the mixed traffic operation of the airport surface based on the Monte Carlo method were set, mainly including:
-
Generating 500 approaching aircraft, and the approaching time obeys Poisson distribution;
-
Setting the aircraft wake interval as 5 min and the airport surface taxi interval as 40 s;
-
Setting three approaching aircraft intervals, i.e., 1.5 min, 2 min, and 3 min, respectively;
-
Set three runway operation modes, i.e., segregated parallel operation mode, correlated approach/independent departure mode, and independent approach/independent departure mode.
Setting the average taxiing speed of aircraft at 50 km/h and the support vehicle traveling speed at 30 km/h.

5.2. Identification of Risk Hotspots for Mixed Traffic Flow on Airport Surfaces
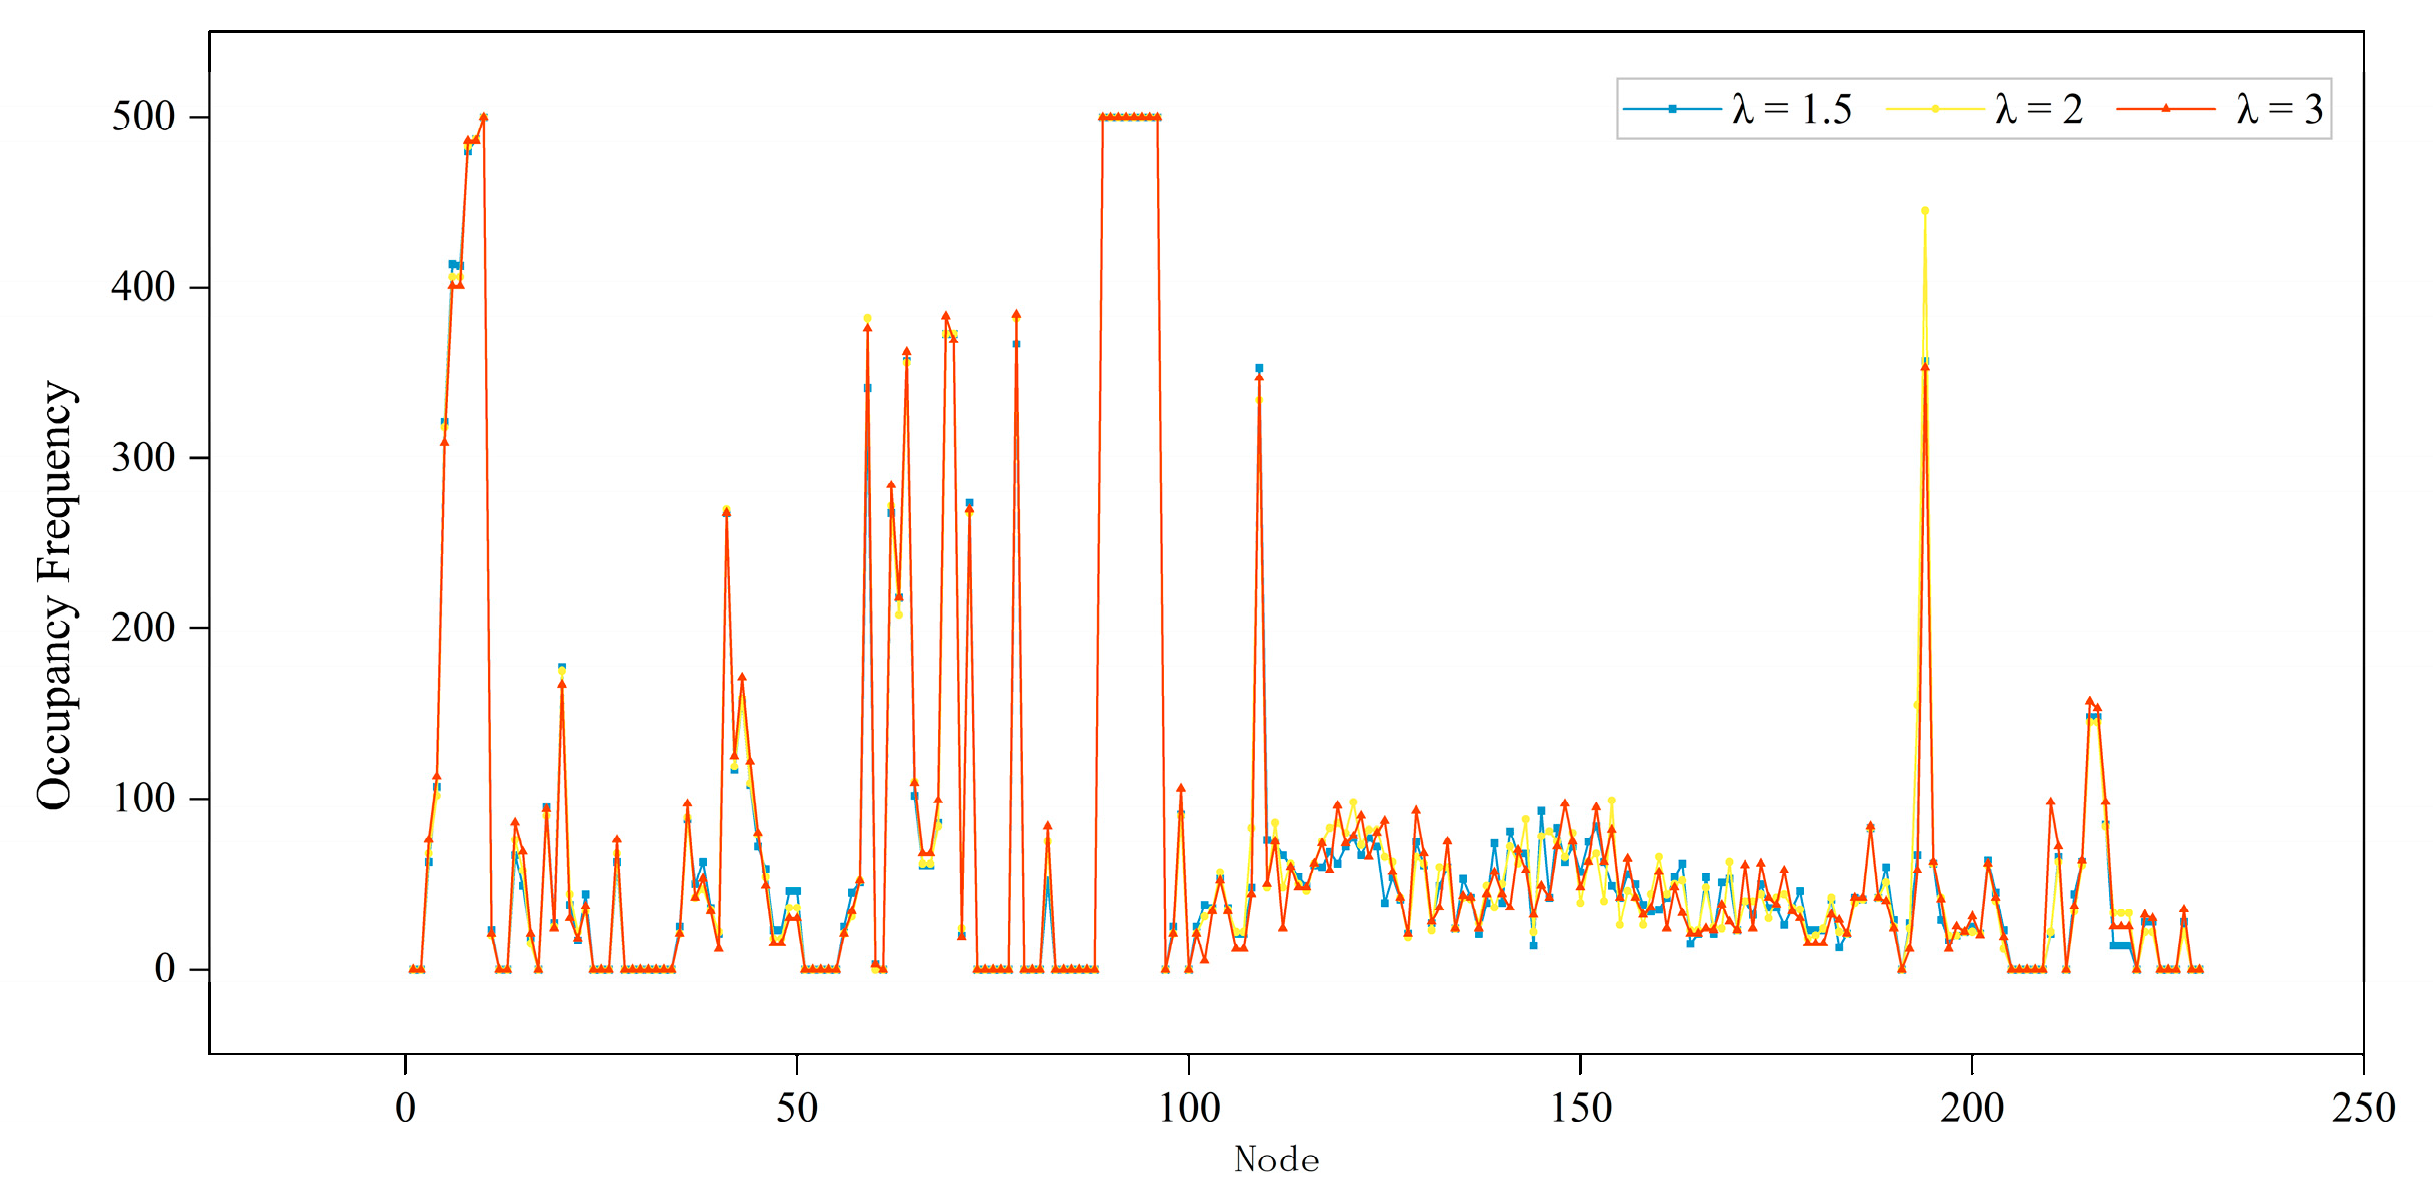
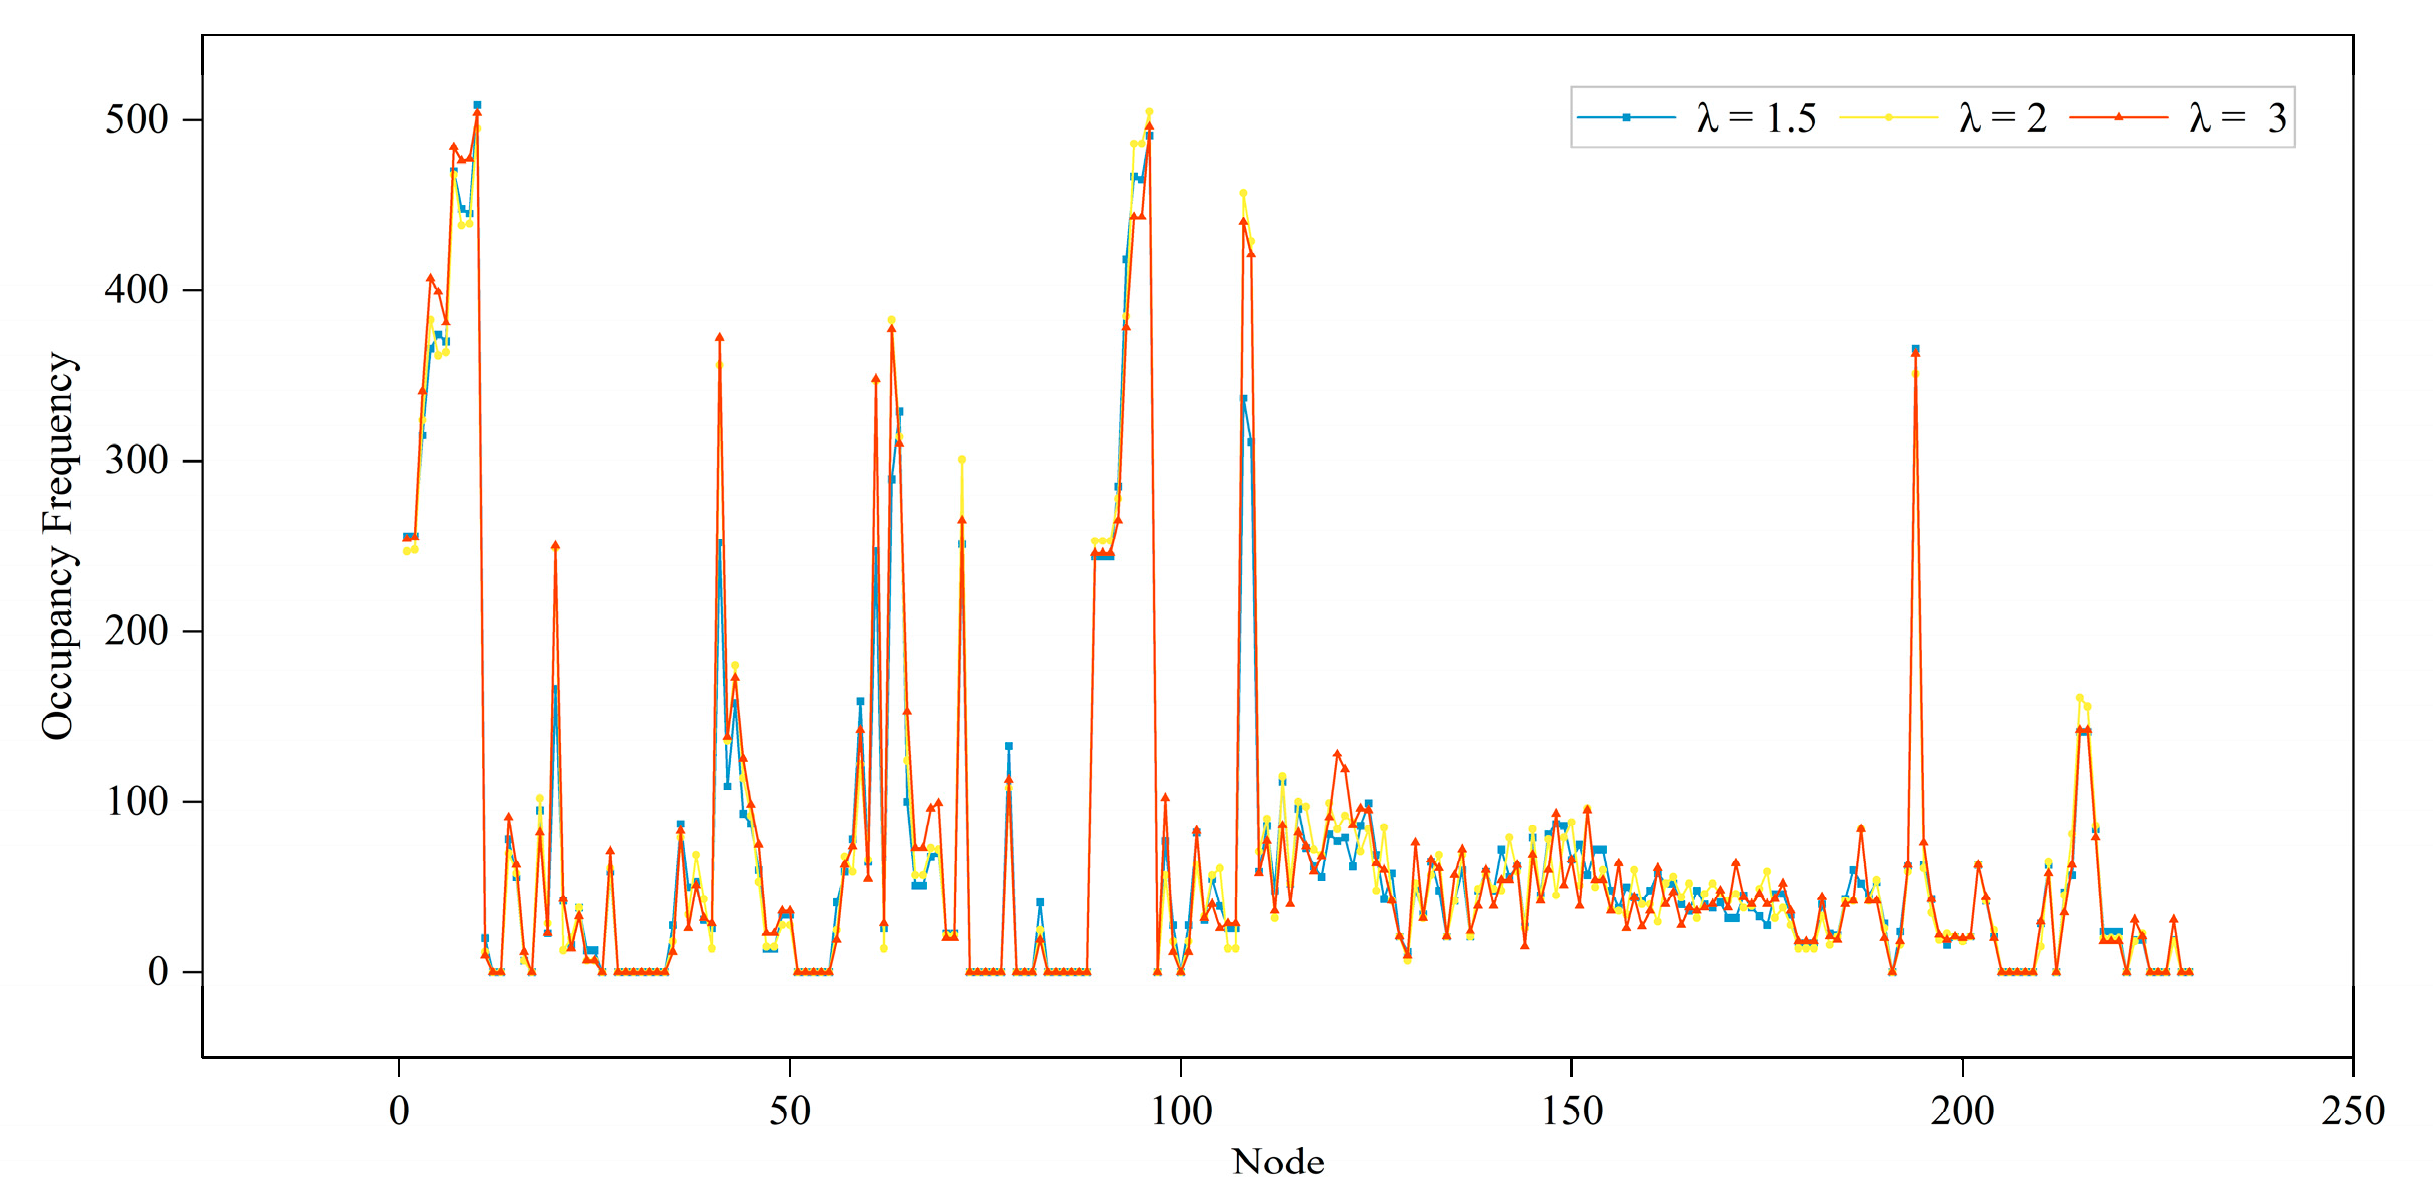
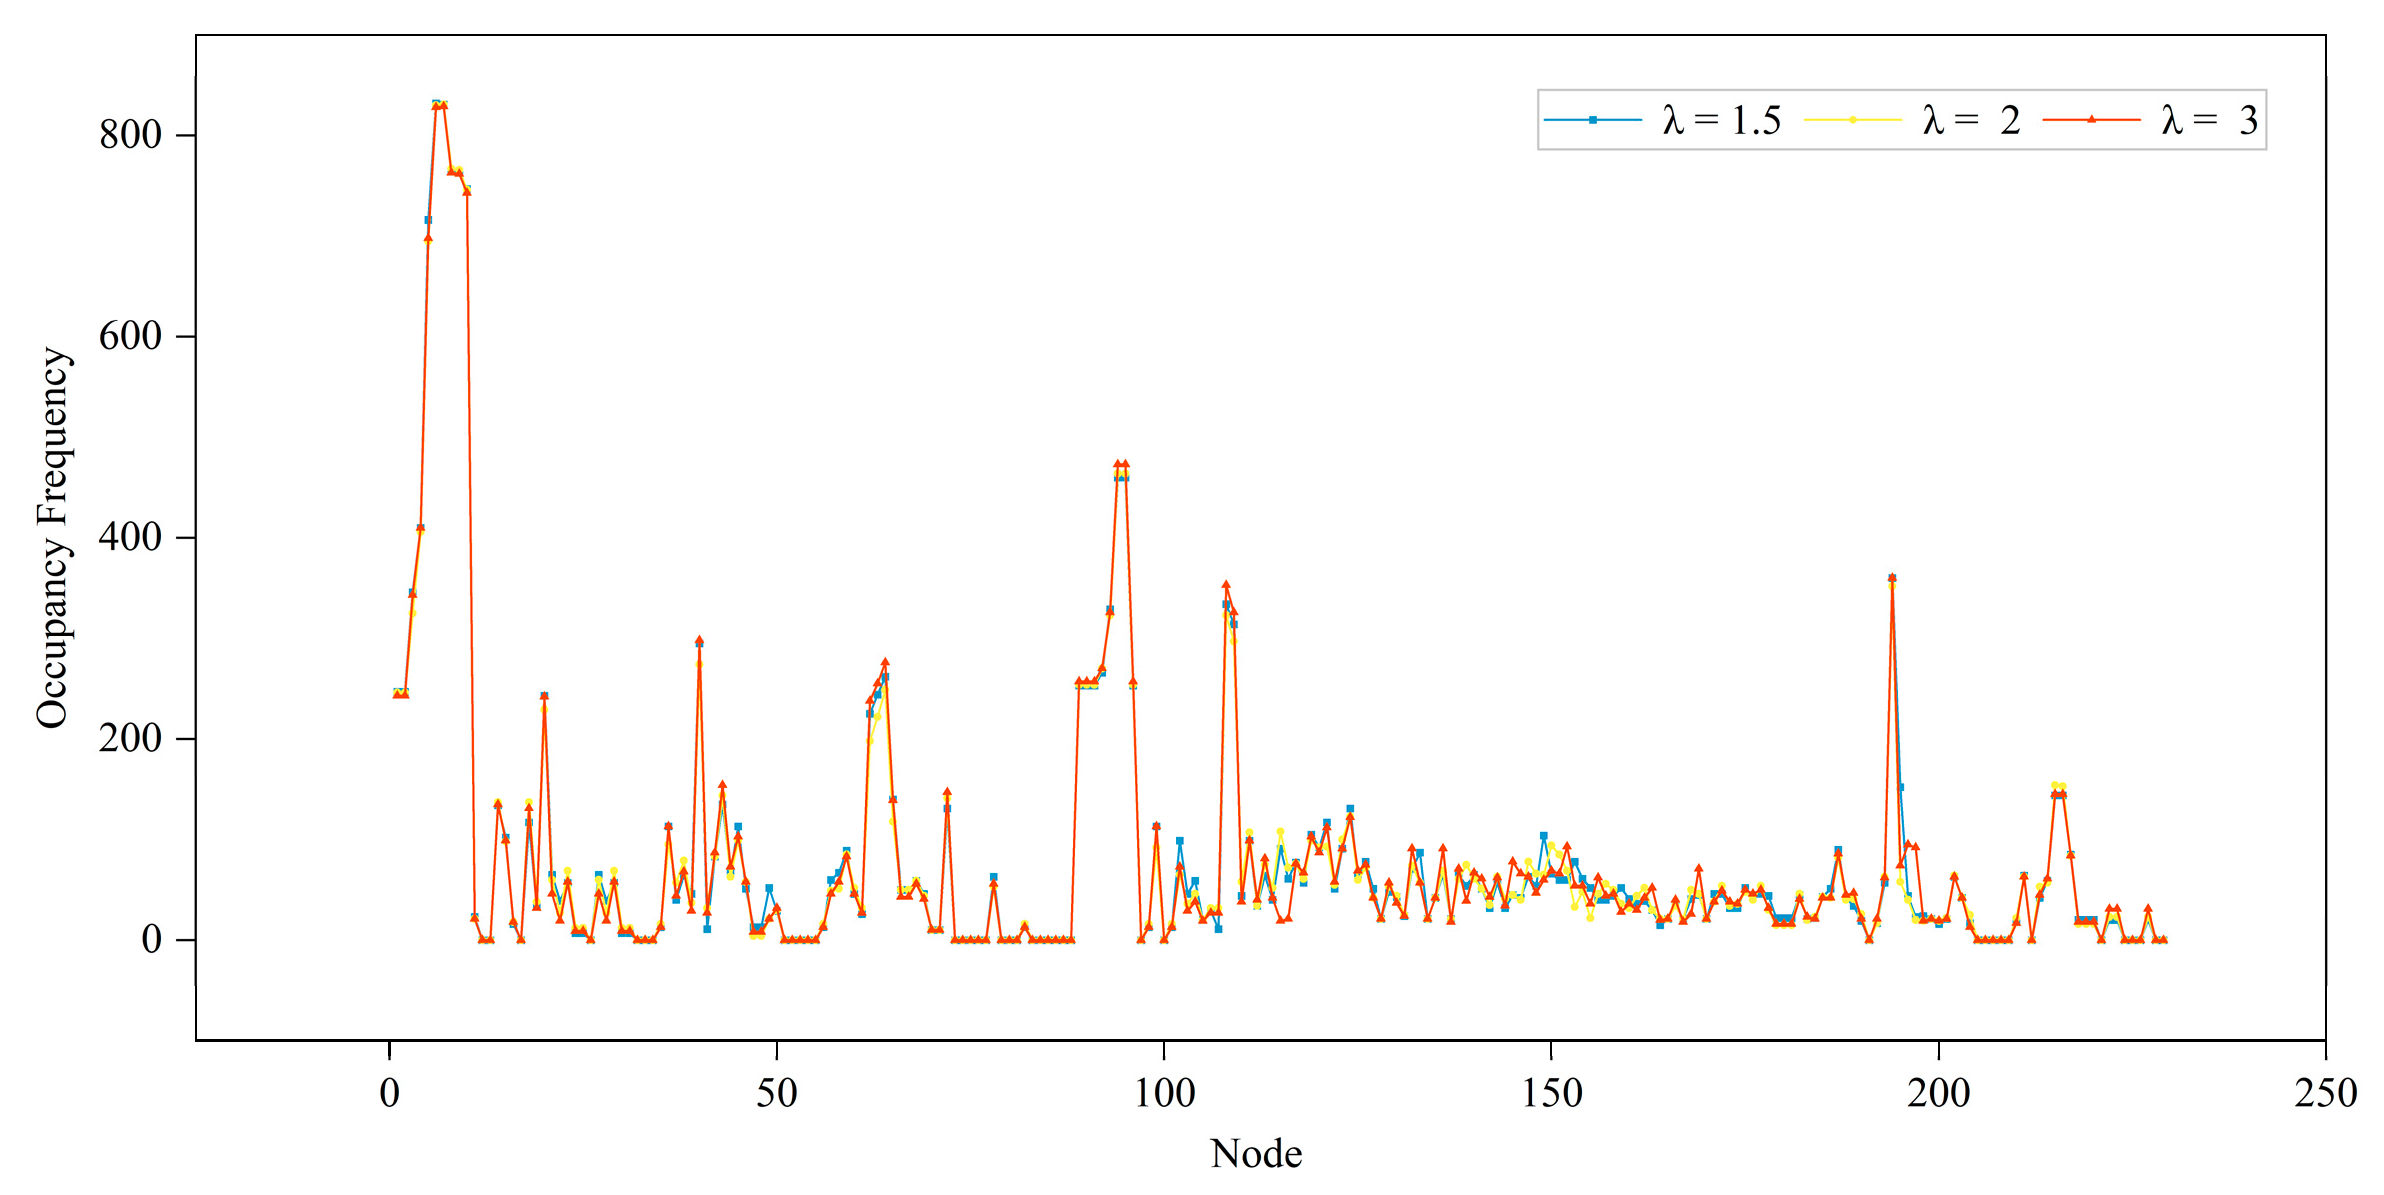
The occupancy frequency of each node in the network structure model of the airport surface under three runway operation modes and different approaching intensities is obtained by counting the average values of 10 simulation experiments, as shown in Figure 9, Figure 10 and Figure 11. Among them, the blue, yellow, and orange curves represent the occupancy frequency of each node when the approaching aircraft interval is 1.5 min, 2 min, and 3 min, respectively. It can be seen that
Under any runway operation mode, the distribution of occupancy frequency corresponding to each node is approximately the same for different arrival strengths, indicating that the arrival strength of traffic flow has no significant effect on the occupancy frequency of nodes, which shows that the results of the simulation experiments are reliable.
The occupancy frequencies of the nodes differ in different runway operation modes. The peak occupancy frequencies of nodes in the related/independent parallel approach mode and independent parallel departure mode are significantly higher compared with the isolated parallel operation mode, indicating that there are relatively more conflict-prone nodes in these two operation modes, which is in line with the actual situation.
Under different runway operating modes, there is overlap in nodes with higher occupancy frequencies, indicating that certain potential risk hotspot areas are consistent in different operation modes, which verifies the applicability of the simulation experiment.
The conflict number ratio of each node of the airport surface network is calculated according to Equation (11), as shown in Figure 12. The 25 nodes numbered 19, 20, 27, 39, 40, 59, 61, 64, 65, 68, 69, 70, 78, 99, 102, 108, 109, 110, 111, 124, 141, 142, 143, etc., have higher values of the conflict number ratio index, and the occupancy frequency of these nodes is also higher as shown in Figure 9, Figure 10 and Figure 11, and such nodes have a higher probability of conflict, so they can be recognized as risky hotspot areas, the distribution of which is shown in Figure 13. Among them, the four nodes of 124, 141, 142, and 143 are the intersections of taxiways and service lanes, which are prone to conflicts between aircraft and protection vehicles. Figure 14 shows the comparison between the actual risk hotspot map and the hotspot identified by simulation at Shenzhen Airport, in which the red circles indicate hotspot areas that overlap with the actual hotspot map of the airport. The graph shows that 11 risk hotspot areas identified based on Monte Carlo simulation experiments are completely consistent with the actual conflict areas, accounting for 73%, while the simulation experiments also identify other potential risk hotspots. In summary, the airport surface operation simulation and feature identification method based on the Monte Carlo method proposed in this paper can effectively identify the risk hotspot areas of the surface, which is in line with the actual situation of airport surface operation in Shenzhen Airport.

5.3. Operational Risk Evaluation of Mixed Traffic Flows on Airport Surfaces
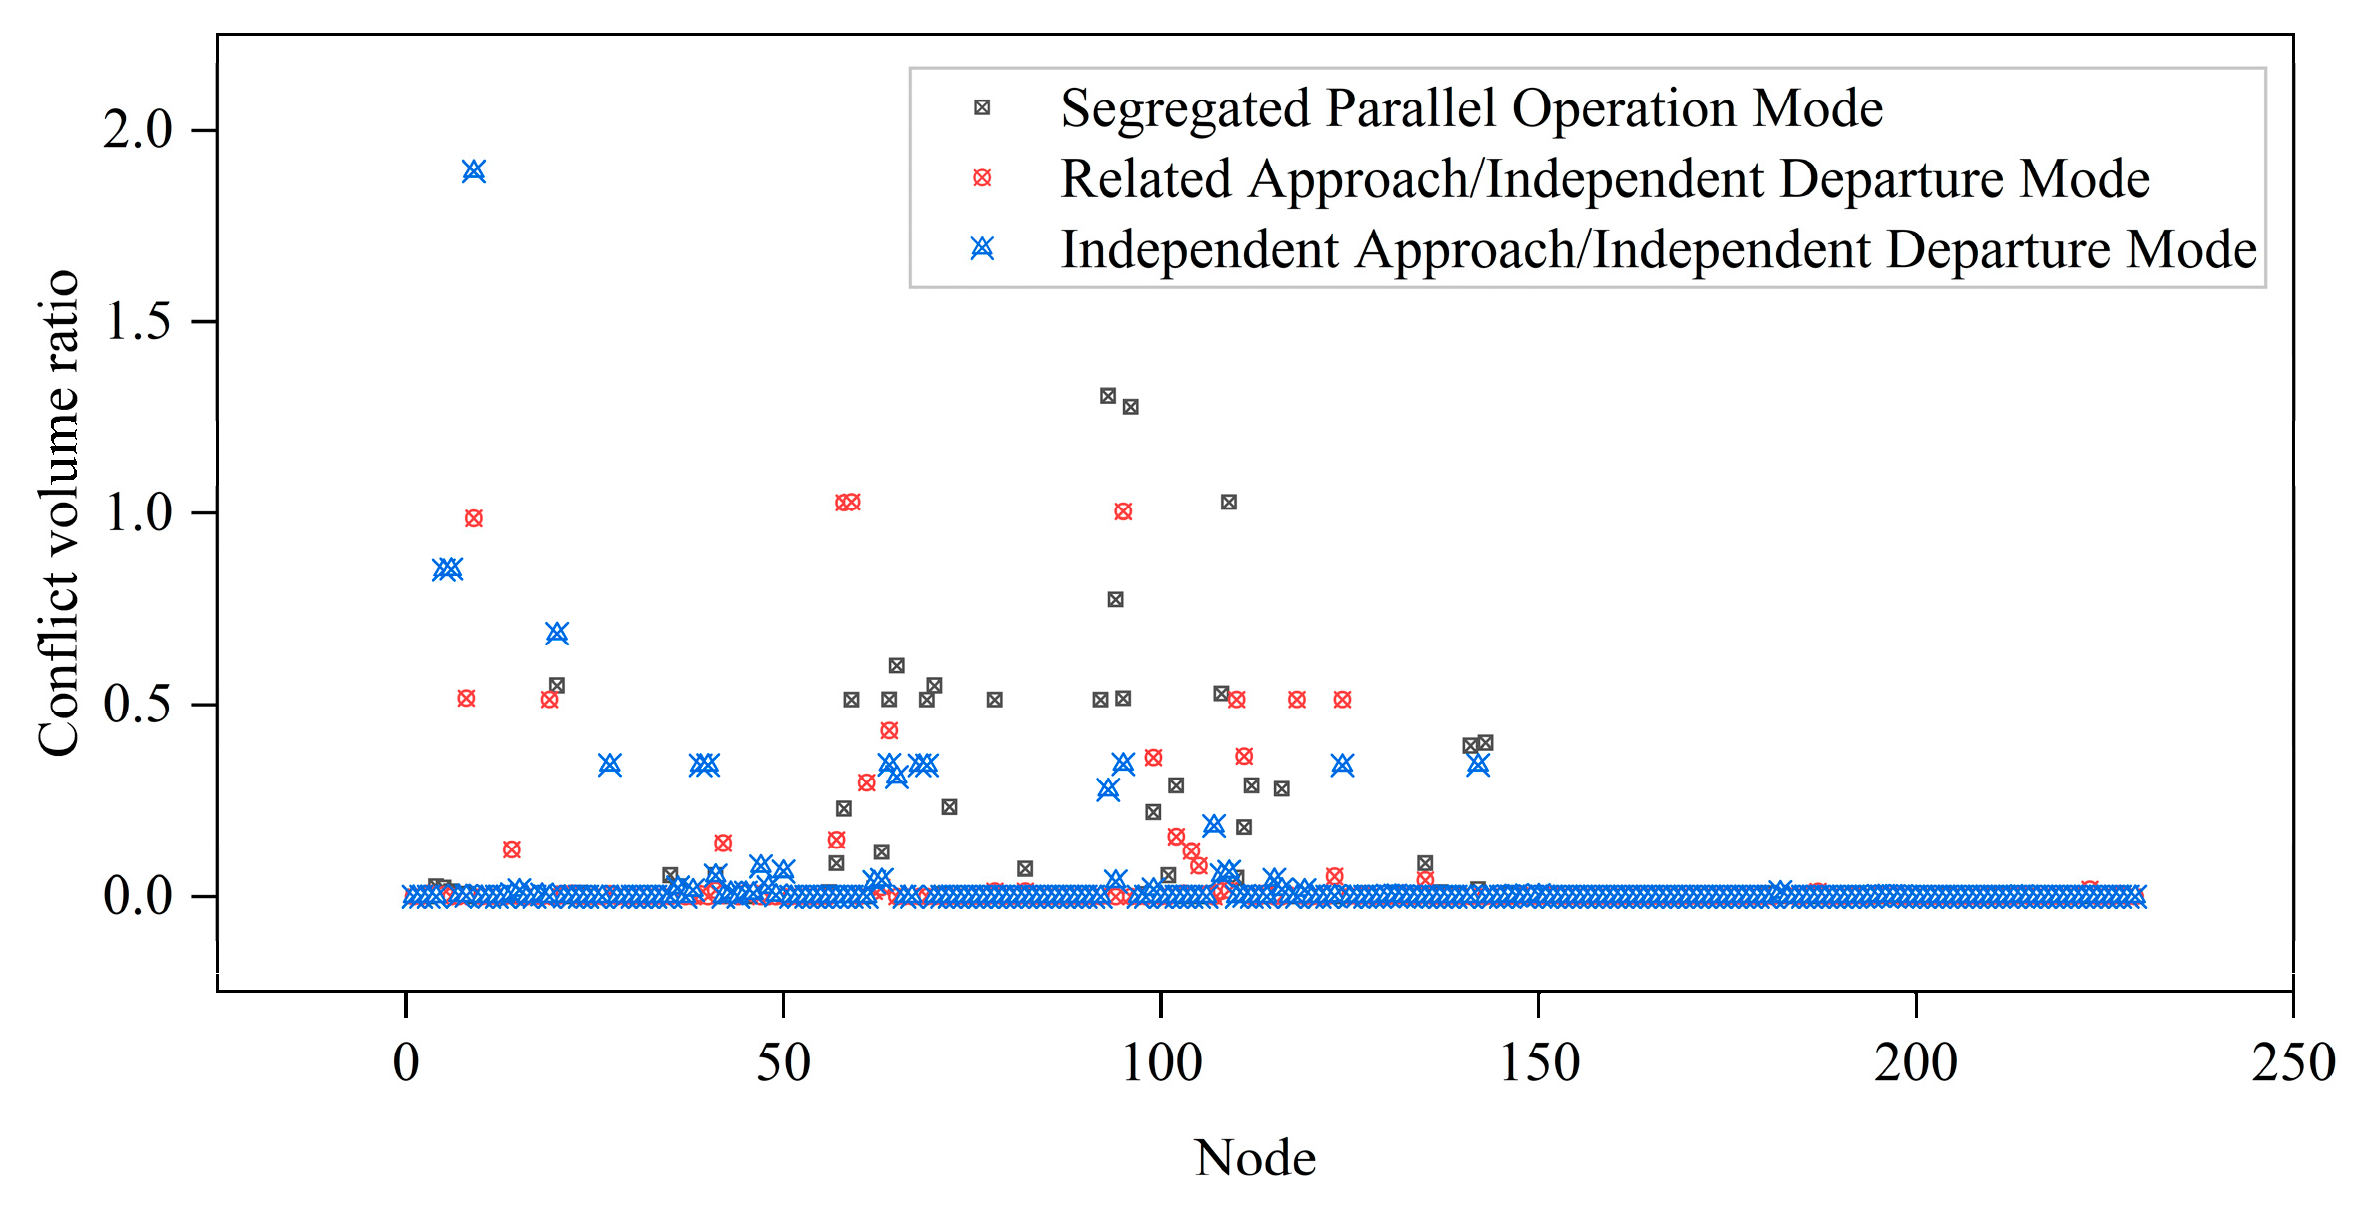
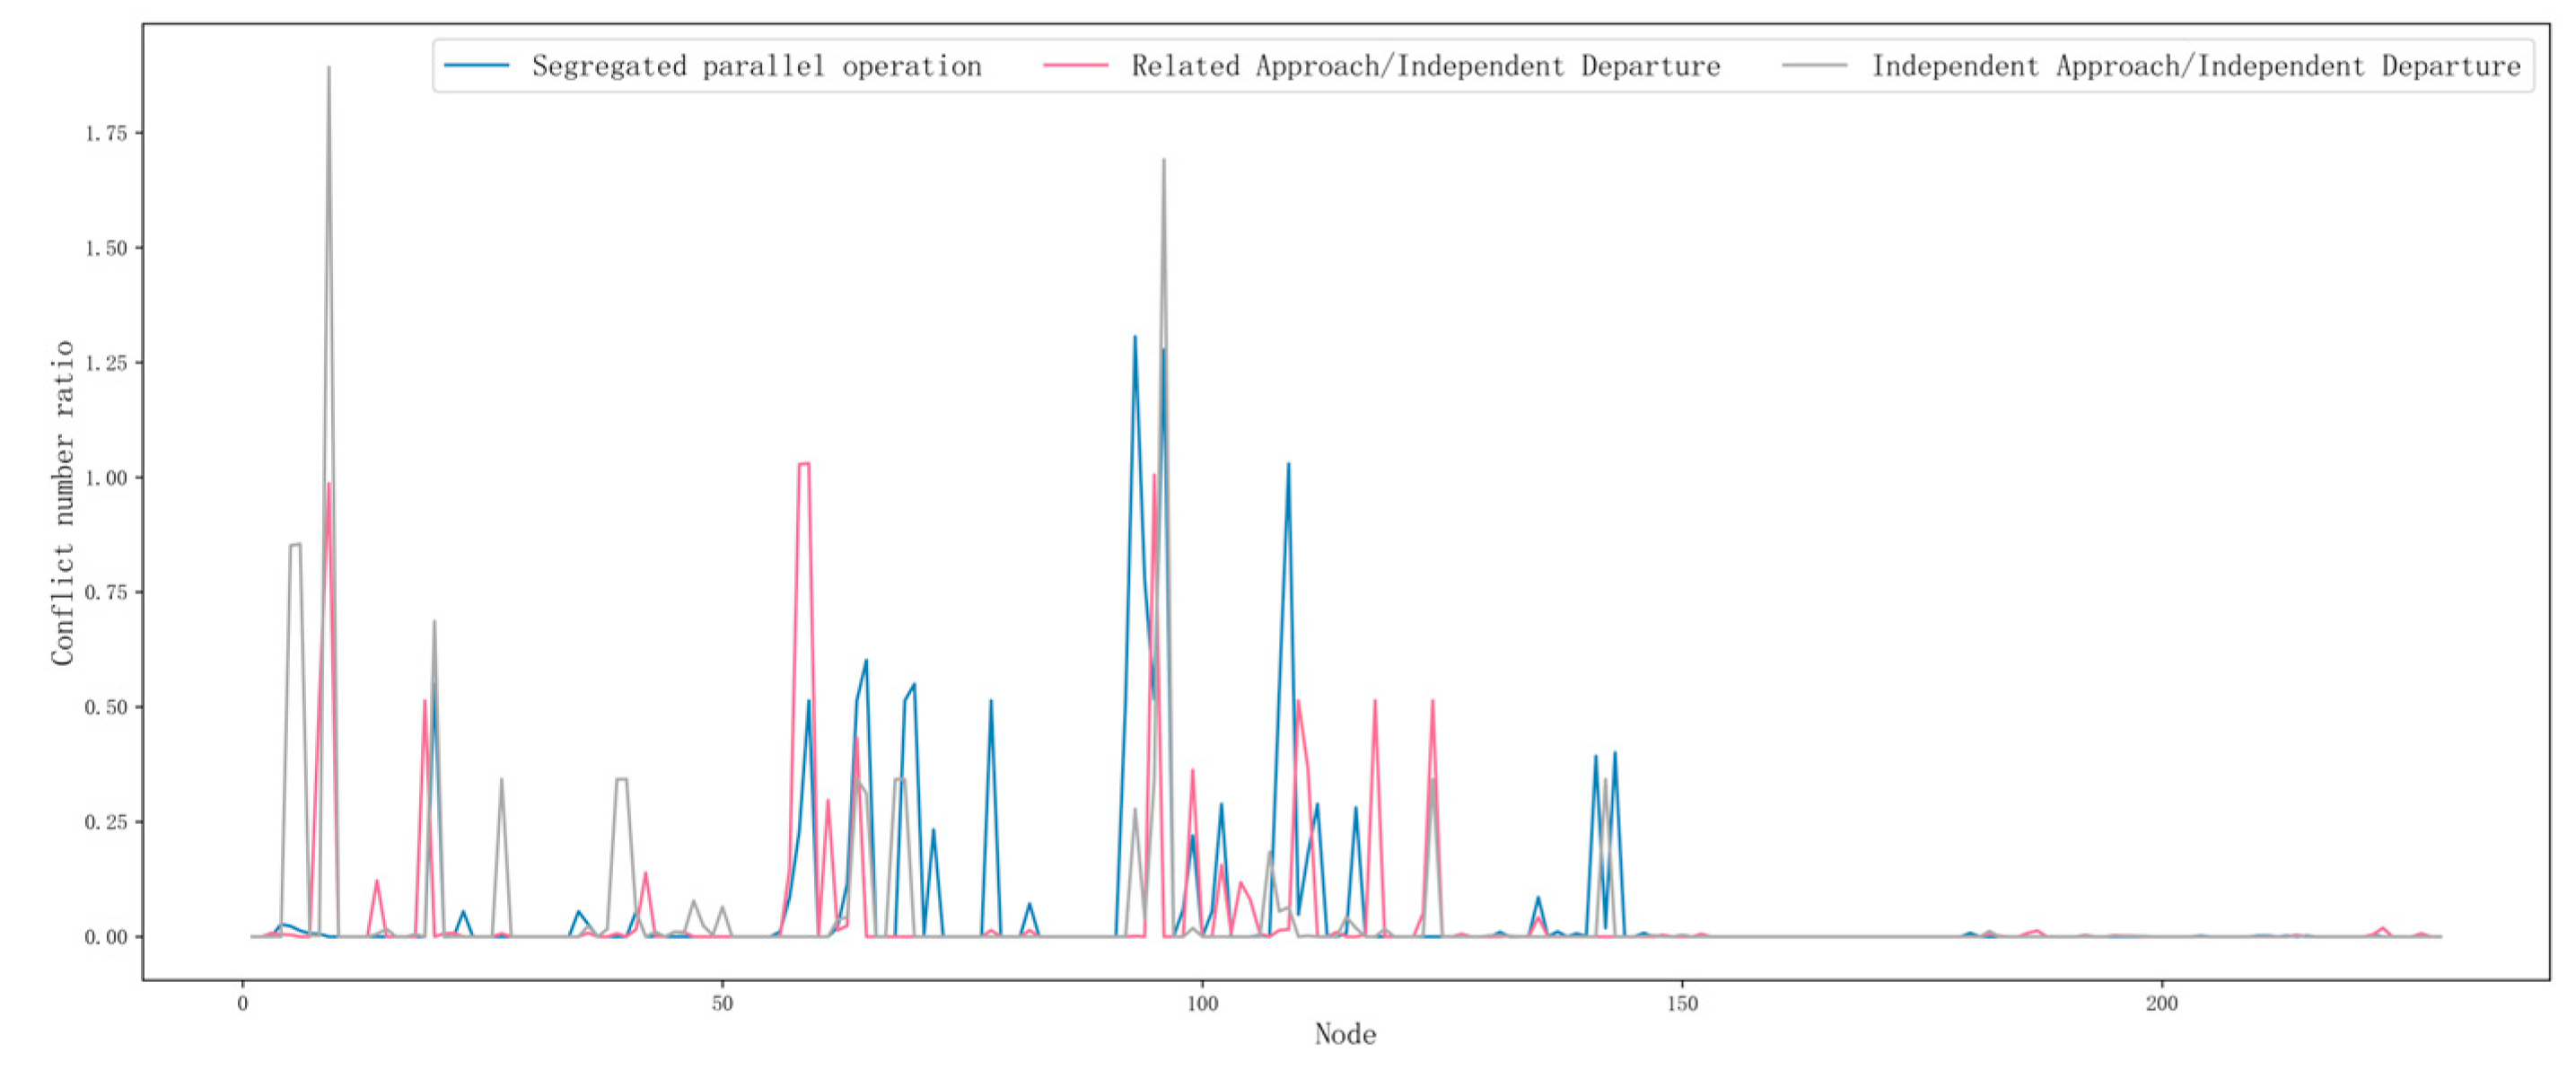
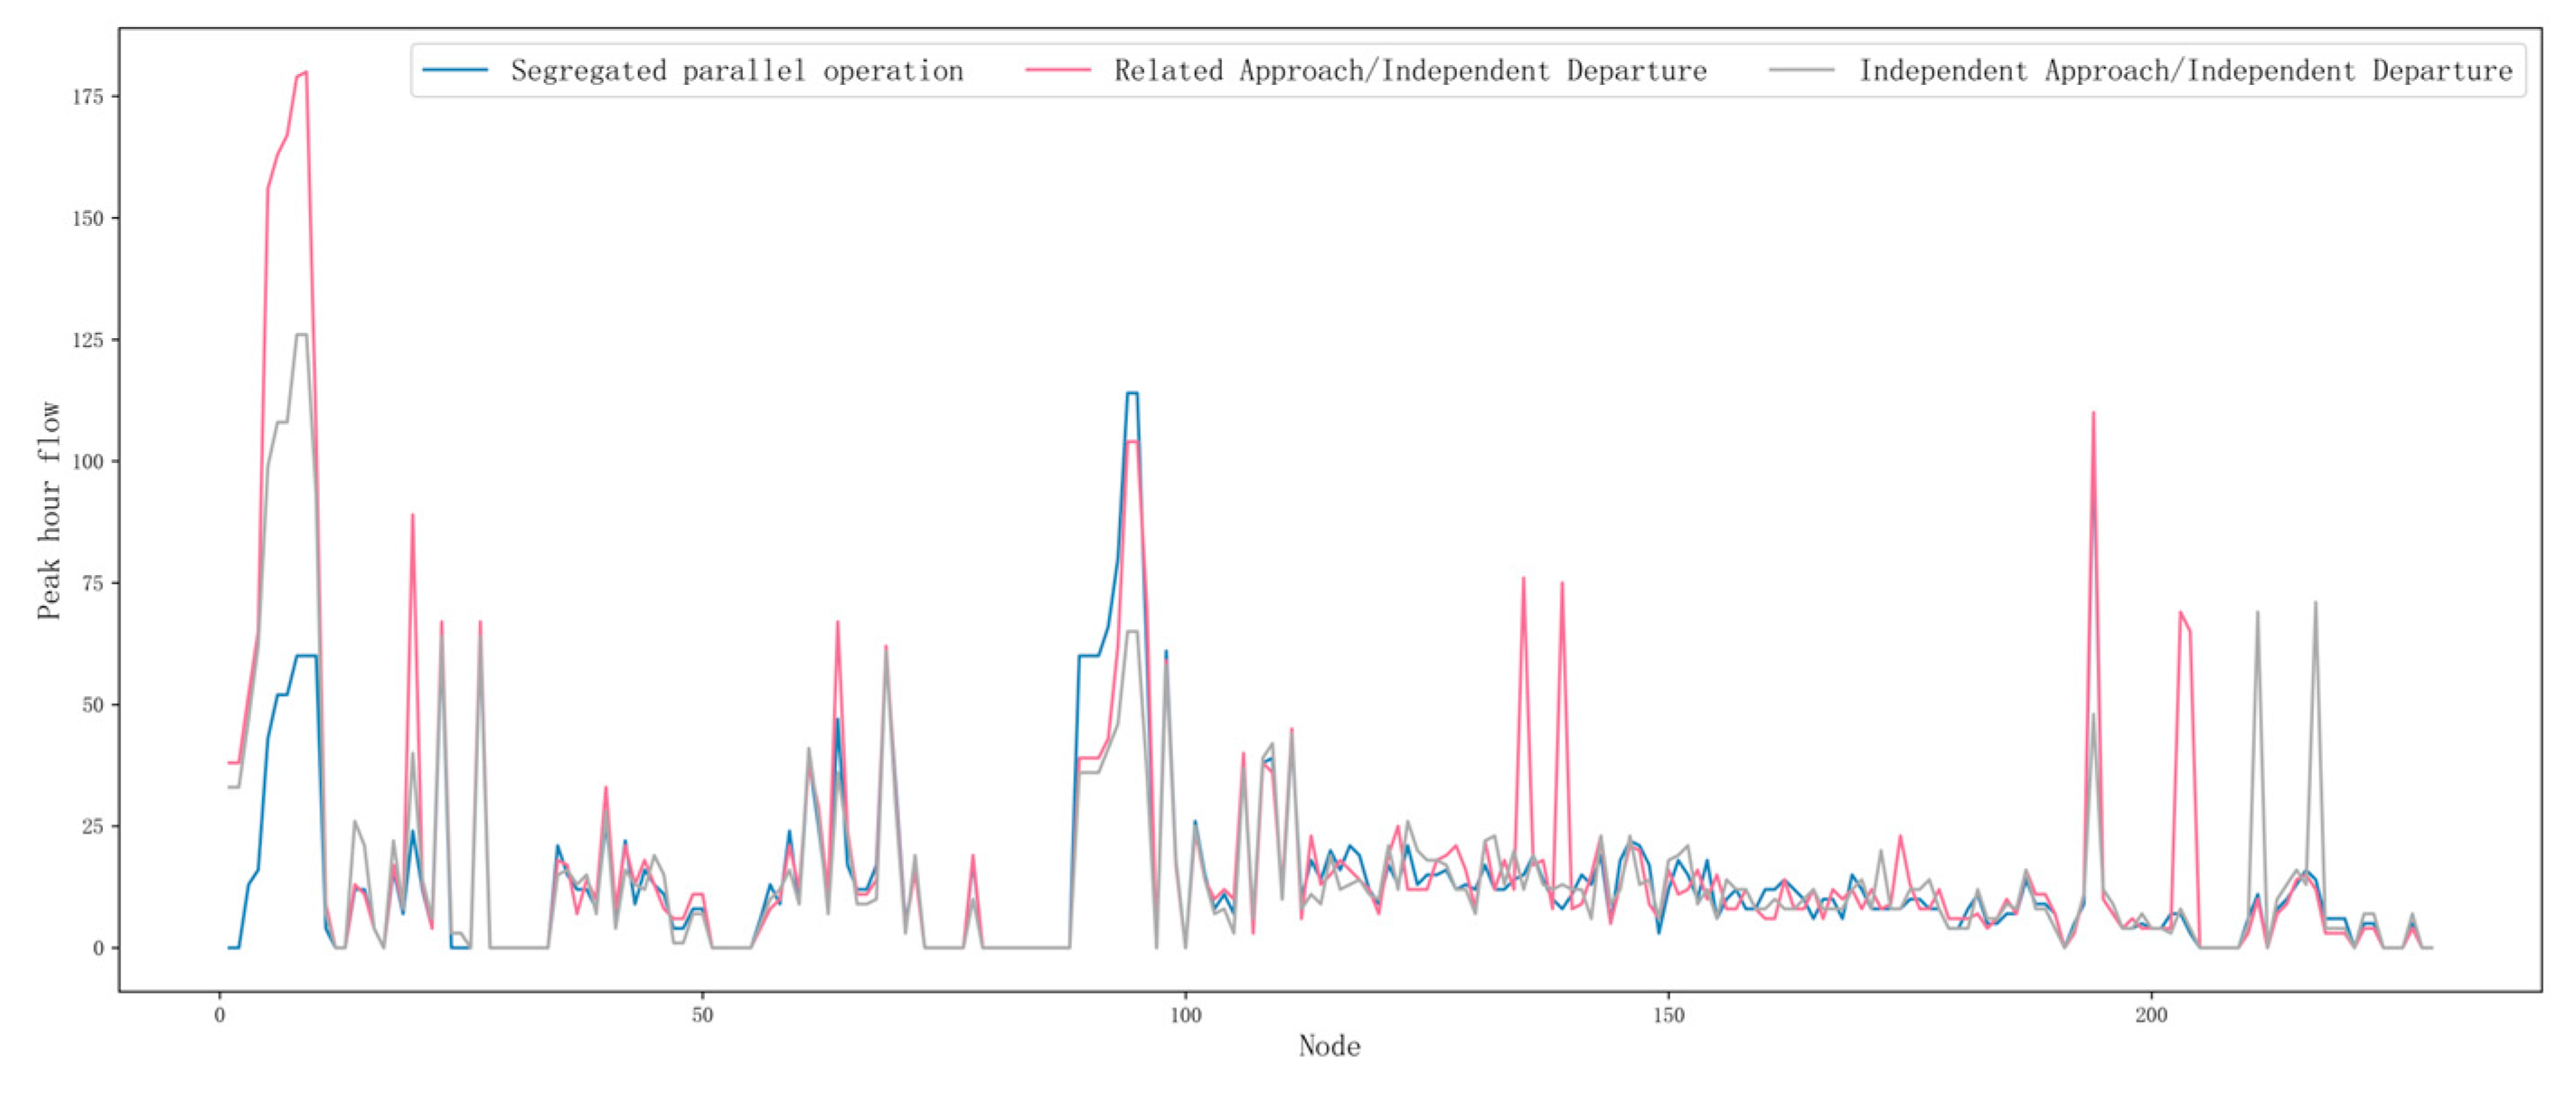
The traffic complexity indexes, i.e., conflict number ratio, peak hour, and peak hourly flow rate, are calculated for each node under the three-runway operation modes with an approaching aircraft interval of 2 min, and the results are shown in Table 1 and Figure 15, Figure 16 and Figure 17. It can be seen that
The conflict number ratios and peak hourly flow rates of the nodes in the correlated approach/separated departure mode are higher relative to the peak of the other two modes of operation, indicating an increase in the number of critical nodes with a higher likelihood of conflict in this mode of operation.
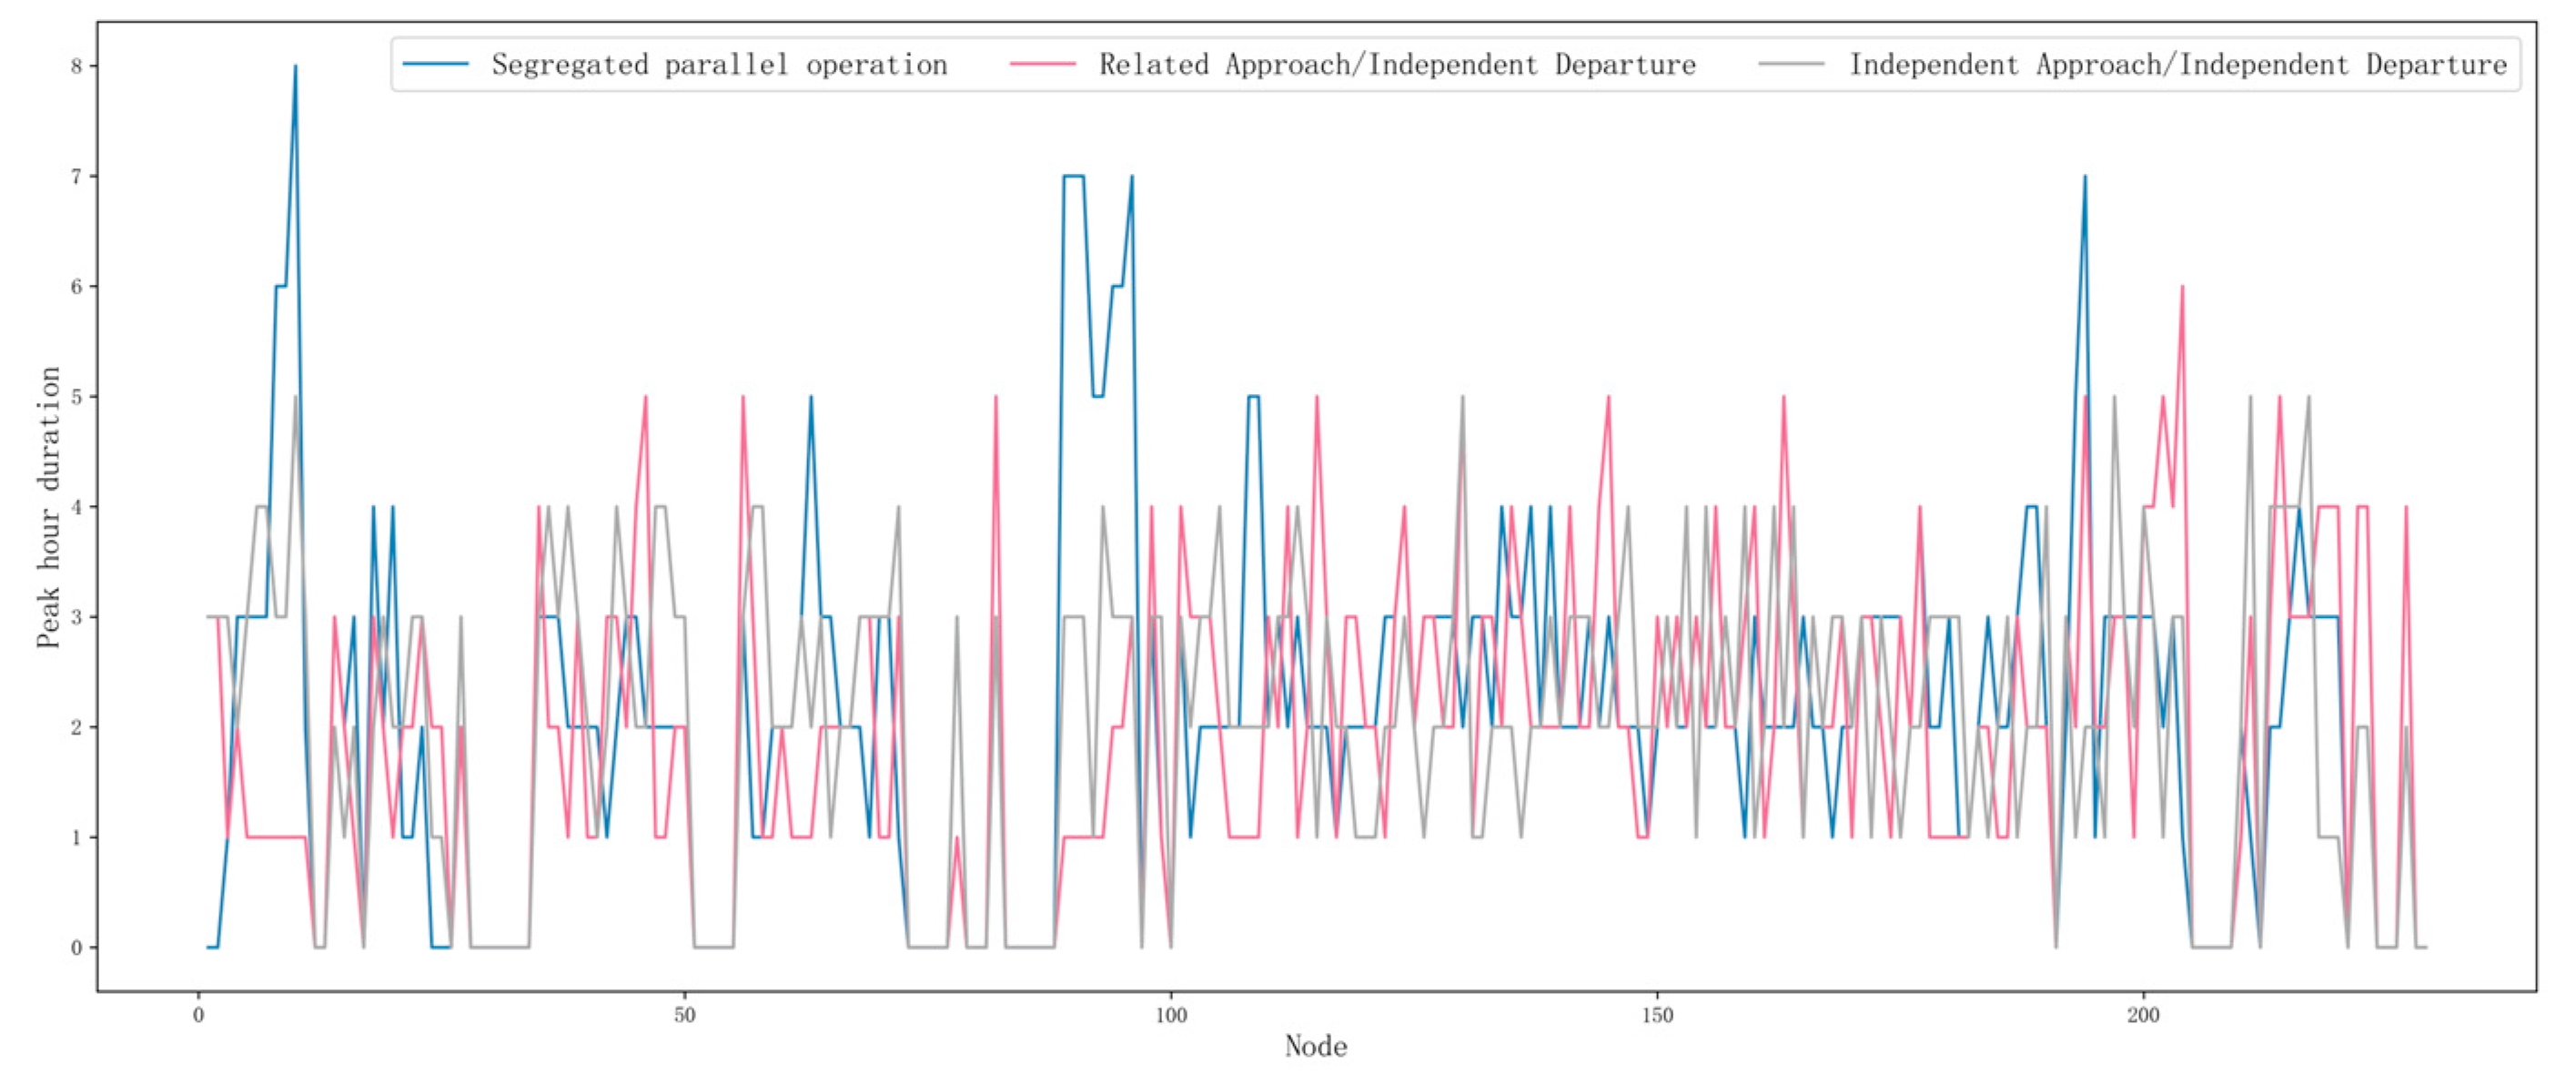
Under the isolated parallel operation mode, some nodes have relatively higher values of peak hourly flow and are more likely to have conflicts; under the other two operation modes, the distribution of peak hourly flow at nodes is relatively stable, with no obvious peaks and valleys.
Since the traffic complexity index takes into account the overall operation of the airport surface under the mixed operation of aircraft and support vehicles, it can reflect the traffic operation pressure on the airport surface to a certain extent. There are obvious peaks and valleys in the conflict number ratio and peak hourly flow distribution, which indicates that some nodes in the network have higher traffic pressure, and it can provide a decision-making basis for airport surface operation and safety management.
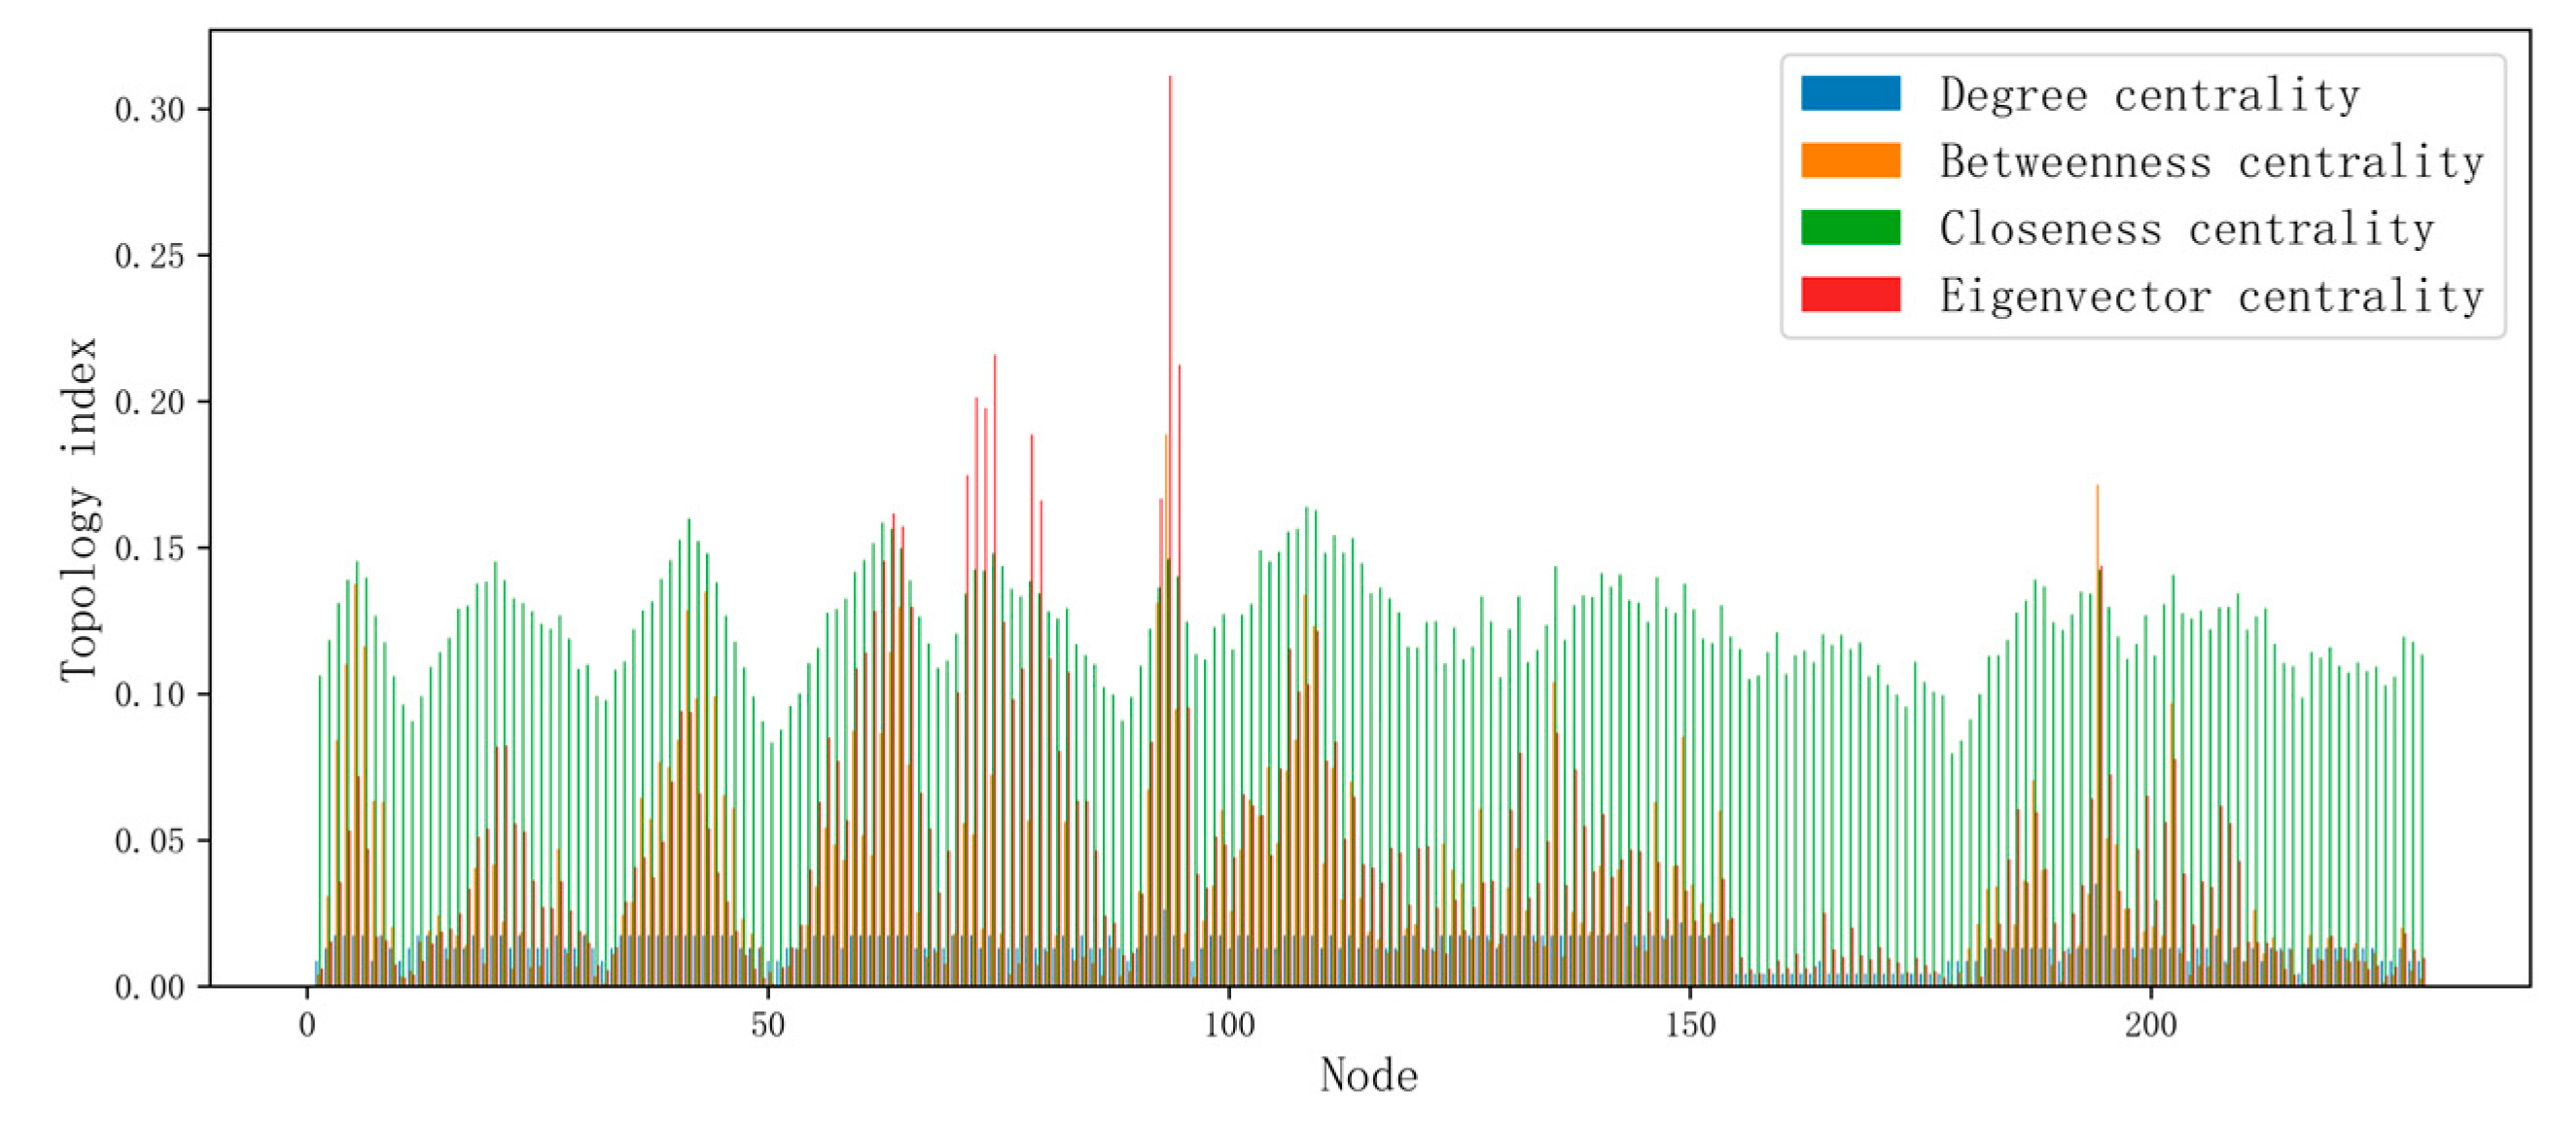
Table 2 shows the topology of each node of Shenzhen Bao’an Airport, network vulnerability index value calculation results, and the corresponding distribution of index value is shown in Figure 18 and Figure 19. It can be seen that
In terms of nodes’ topological structure indexes, betweenness centrality B C i and eigenvector centrality E C i have more peaks and valleys characteristics compared to the other two indexes, which indicates that there is a part of nodes in the network with higher importance, which are more affected by other nodes, and also indicates the necessity of analyzing the structural characteristics of the airport surface network.
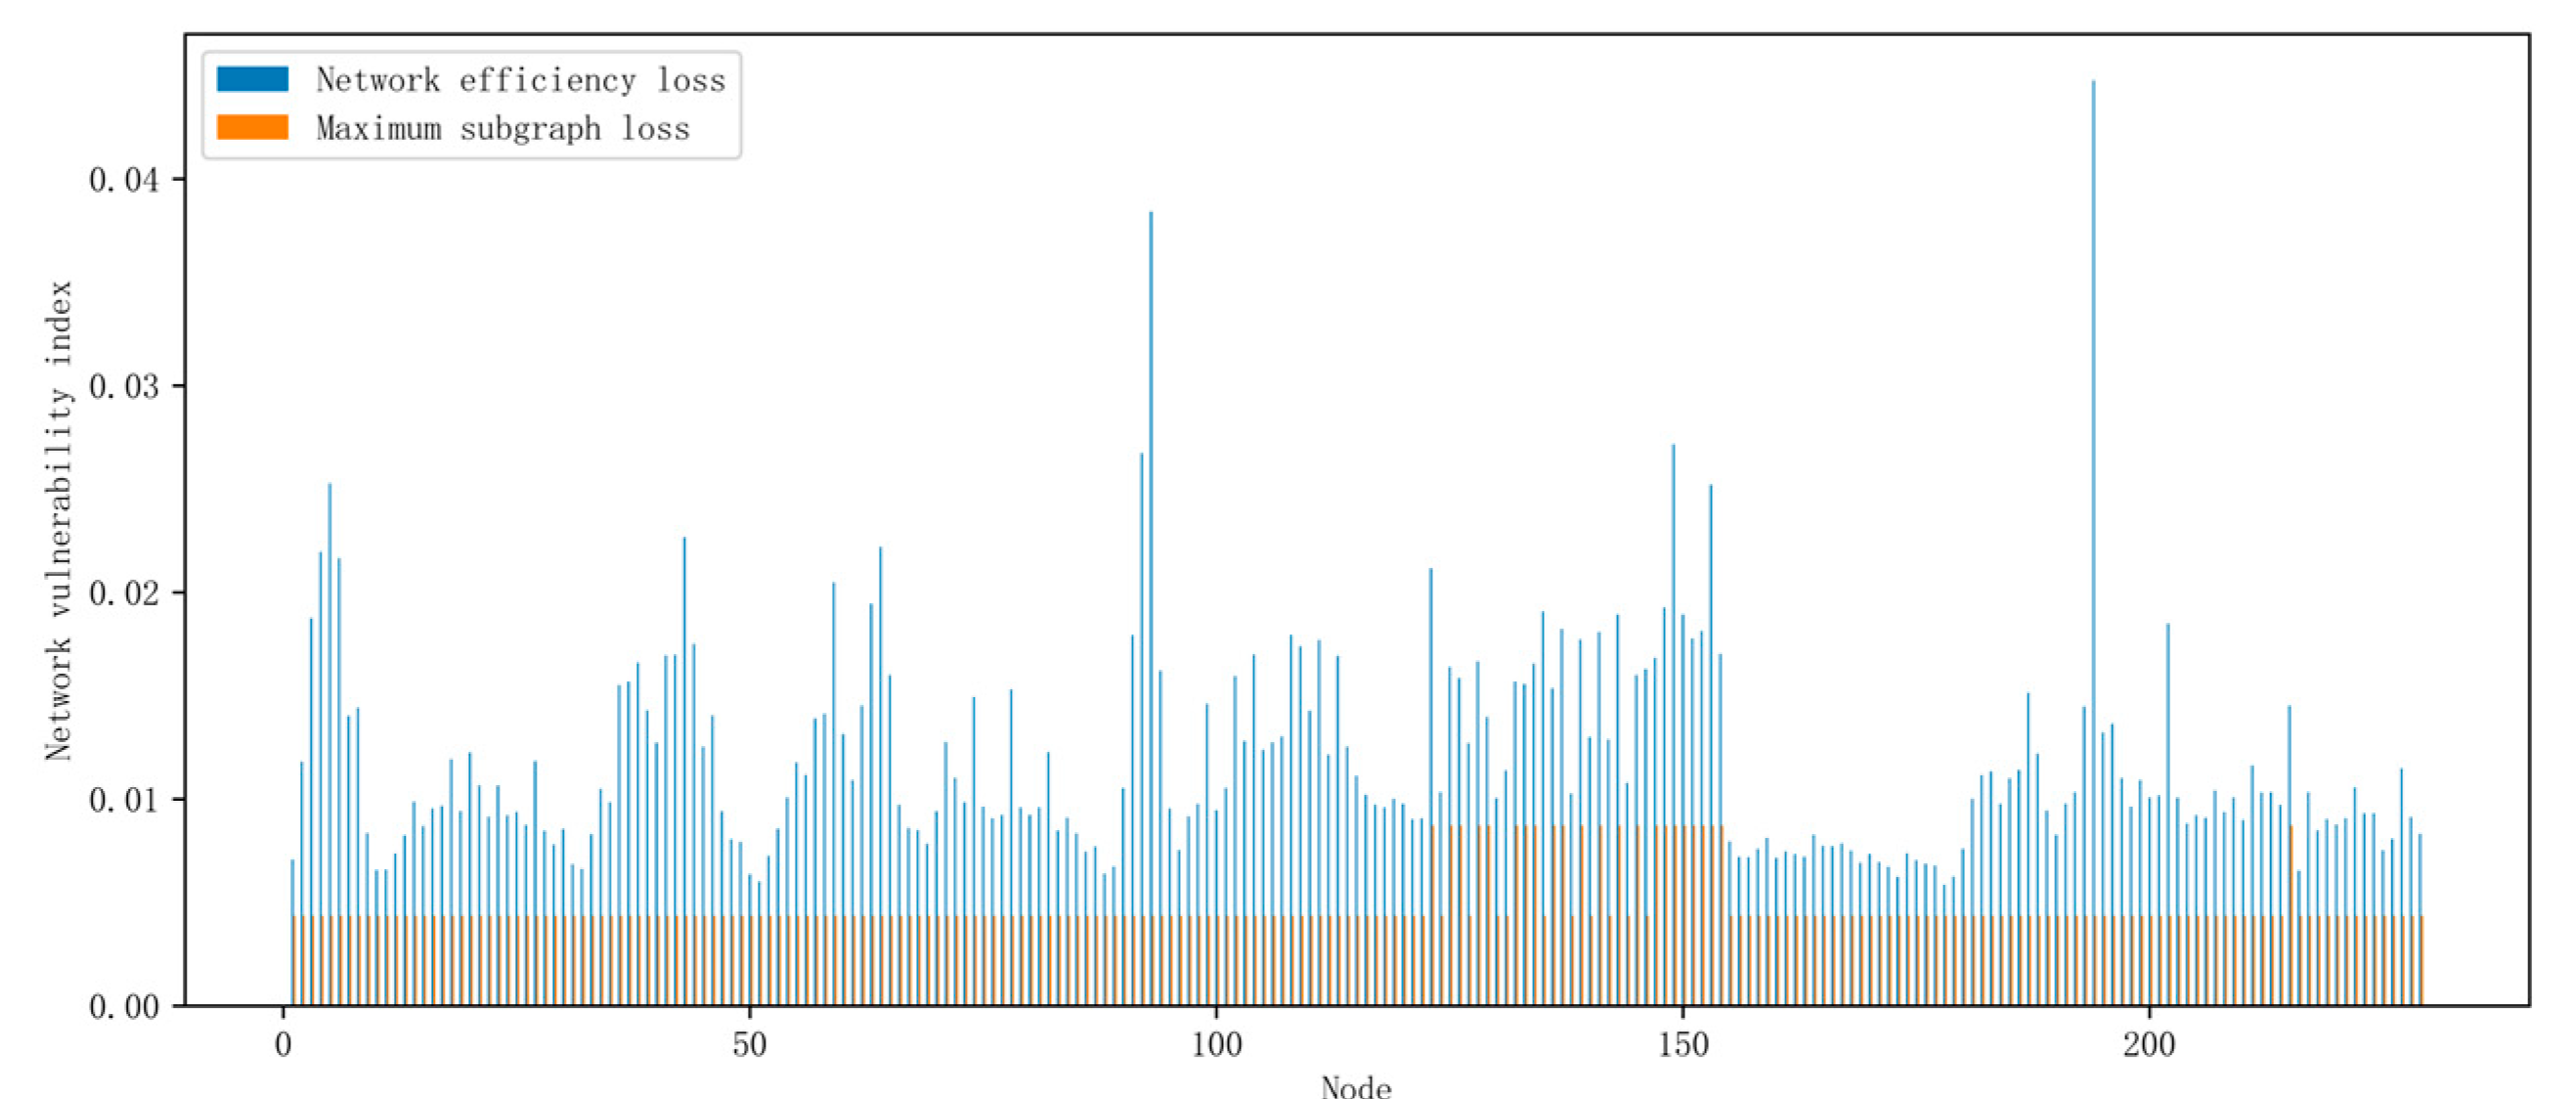
In terms of the network vulnerability index of nodes, the distribution of network efficiency loss degree E L i is relatively chaotic, with more peaks. This indicates that there are some nodes in the network that have a greater impact on the overall operational efficiency of the airport surface, with poorer network robustness, and that we need to pay attention to these types of nodes in the actual operation of the airport surface.
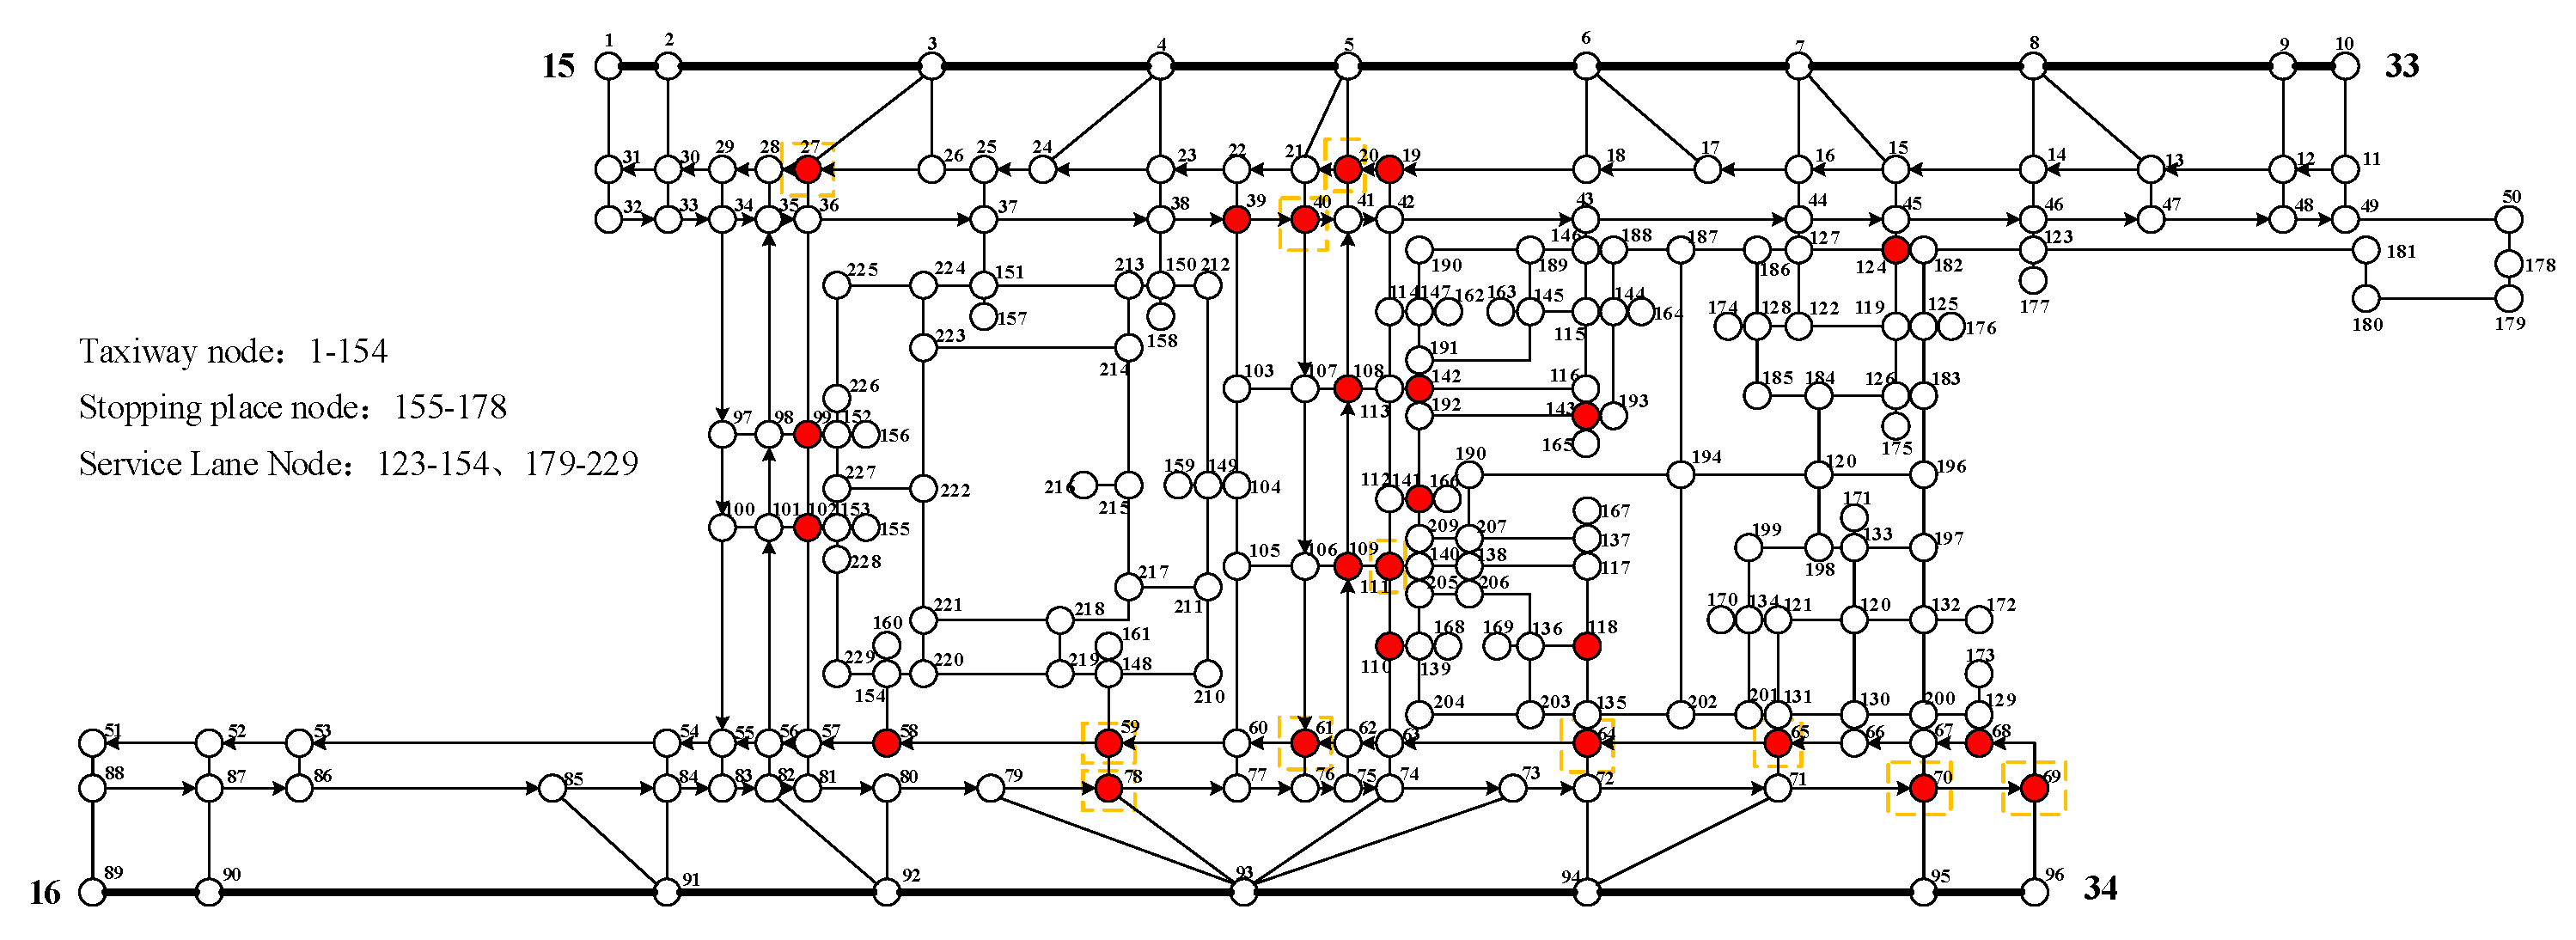
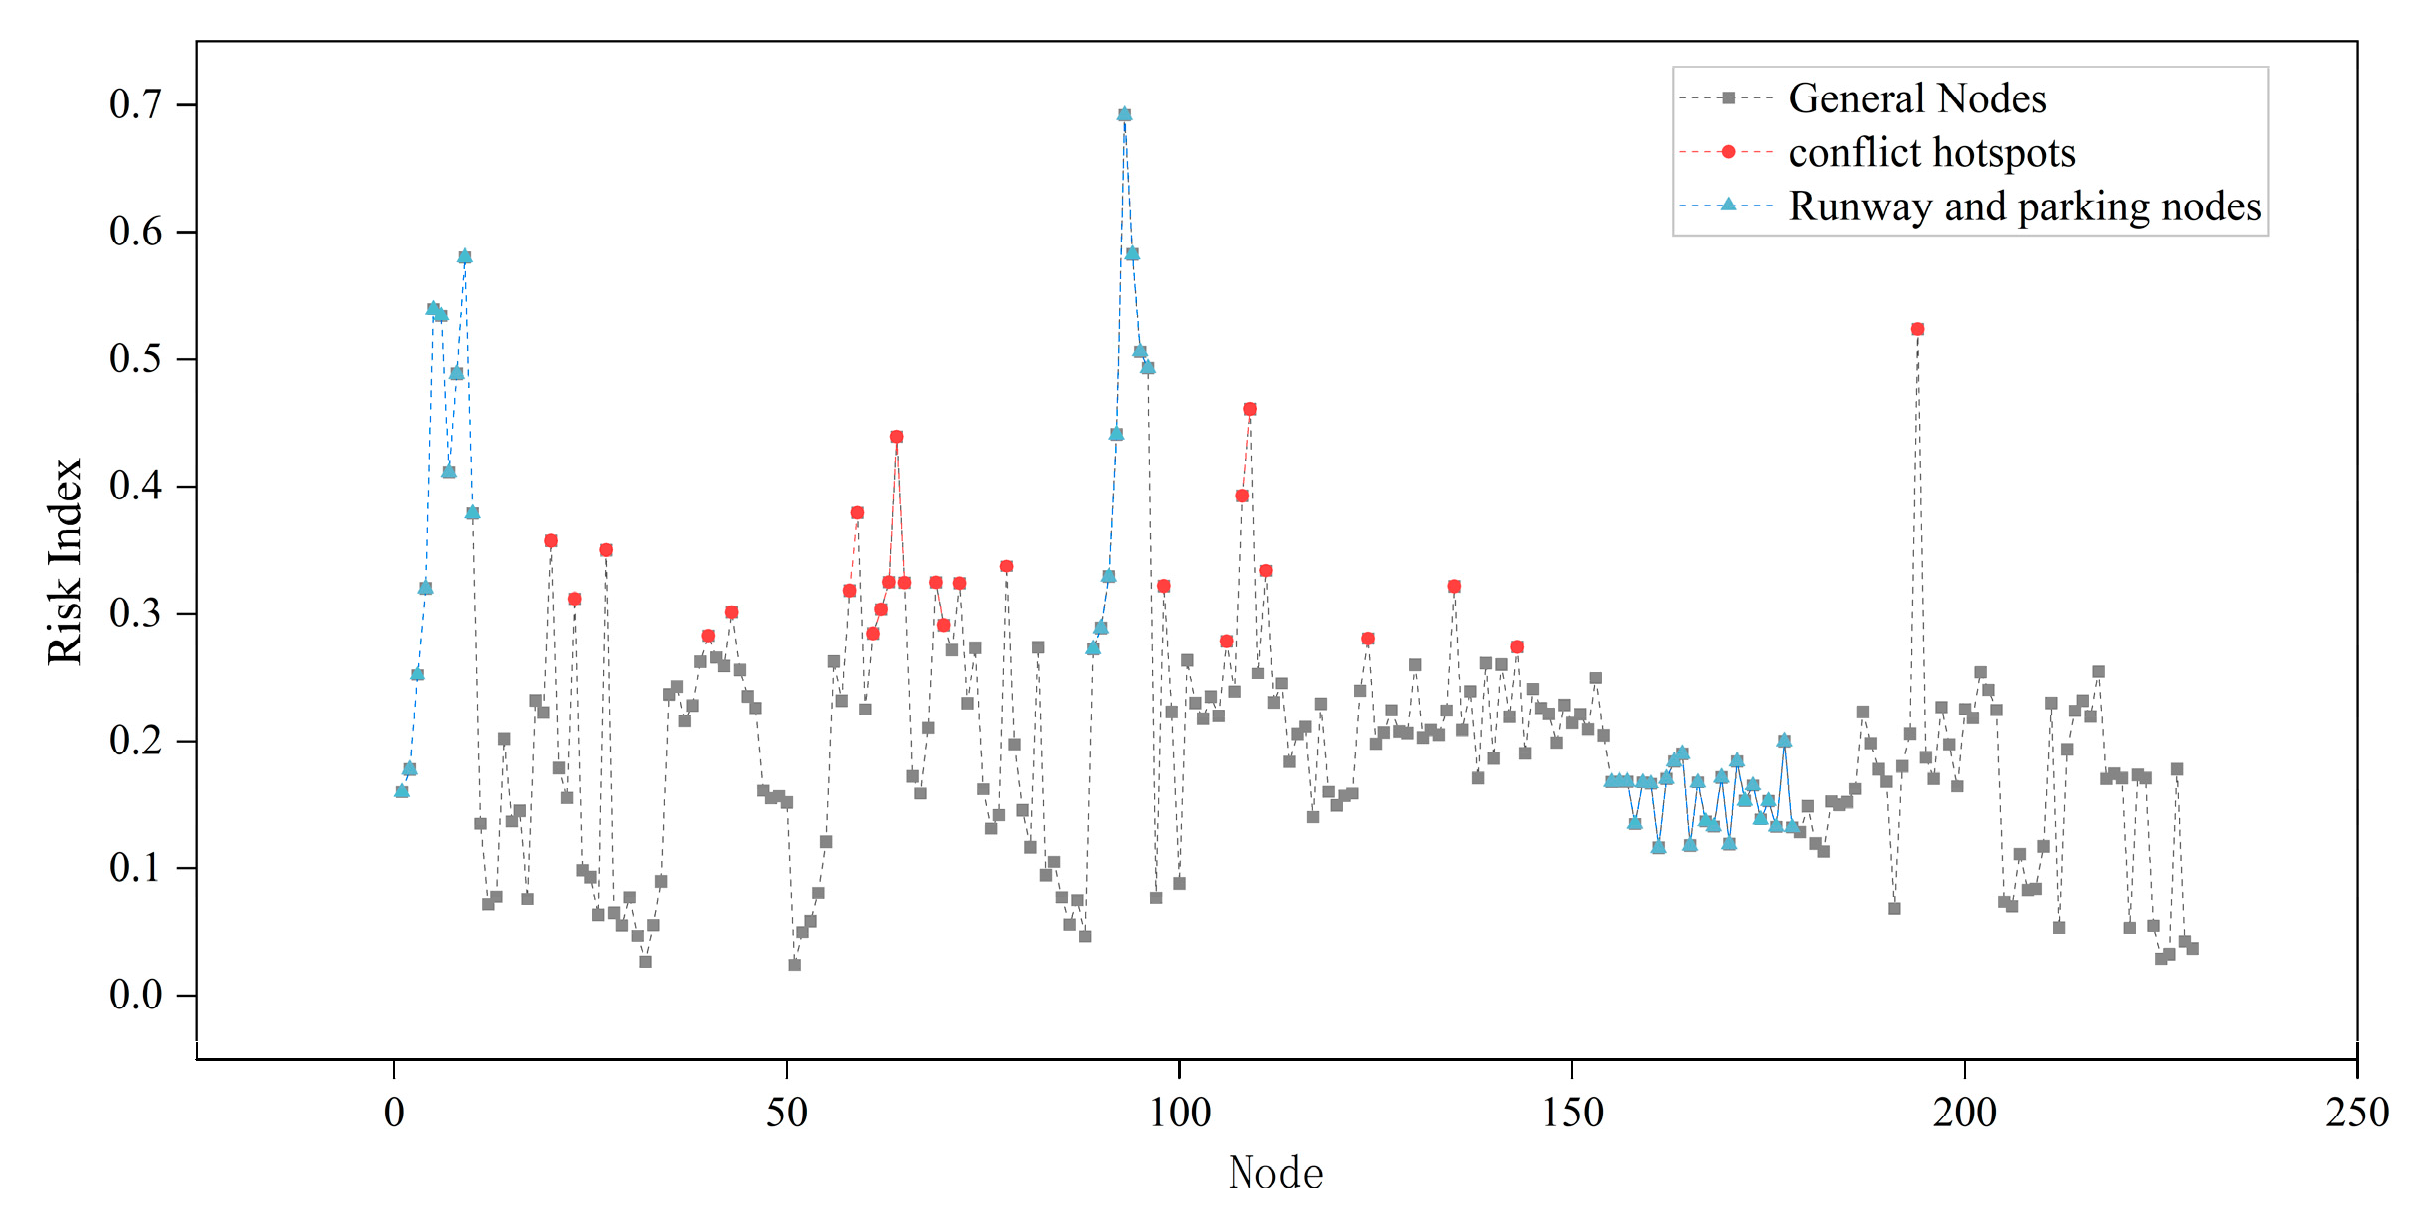
The risk index of each node is comprehensively evaluated based on the above index data, in which the traffic complexity index adopts the average value of the simulation data without using the runway operation mode and with different approaching aircraft intervals. The CRITIC–entropy weight method is used to combine and assign the risk hotspot evaluation indexes of key nodes to obtain the index weights shown in Figure 20. As can be seen from the figure, conflict number ratio, peak hour duration, eigenvector centrality, and betweenness centrality have higher weights relative to the other indicators and contribute more to the risk index.
On this basis, the risk index of each node is calculated based on the TOPSIS–gray correlation analysis method. Since the assessment results of the TOPSIS method are objective and better reflect the overall situation of the evaluation object, and the gray correlation analysis method can reflect the similarity of the geometric shape of the data curves, this paper combines the advantages of the TOPSIS method and the gray correlation analysis method, takes into account the trend of the indicator distance and the shape of the curves, and uses the comprehensive evaluation method based on the TOPSIS–gray correlation analysis to conduct a comprehensive evaluation of the risk index of the node, so as to identify the risk hotspots. According to the weights of all the indexes obtained by the combination assignment method, the evaluation indexes of each node of the airport surface network of Shenzhen Bao’an Airport were weighted and calculated, and the risk index of each node of the airport surface network was obtained based on the comprehensive evaluation method of TOPSIS–gray correlation analysis (Figure 21).
To obtain the most sensitive indexes to the risk index of the nodes on the airport surface, sensitivity analysis of the multidimensional characteristic indexes of the mixed traffic flows on the airport surface is carried out. Take node 20 as an example to carry out the sensitivity analysis of the feature index data, the result of which is shown in Table 3. From the table, it can be seen that the traffic complexity index is the most sensitive to the node risk index, and the eigenvector centrality of the topological structure index is more sensitive to the node risk index.
In the airport surface network, 10.9% of the nodes were identified as risk hotspots, of which
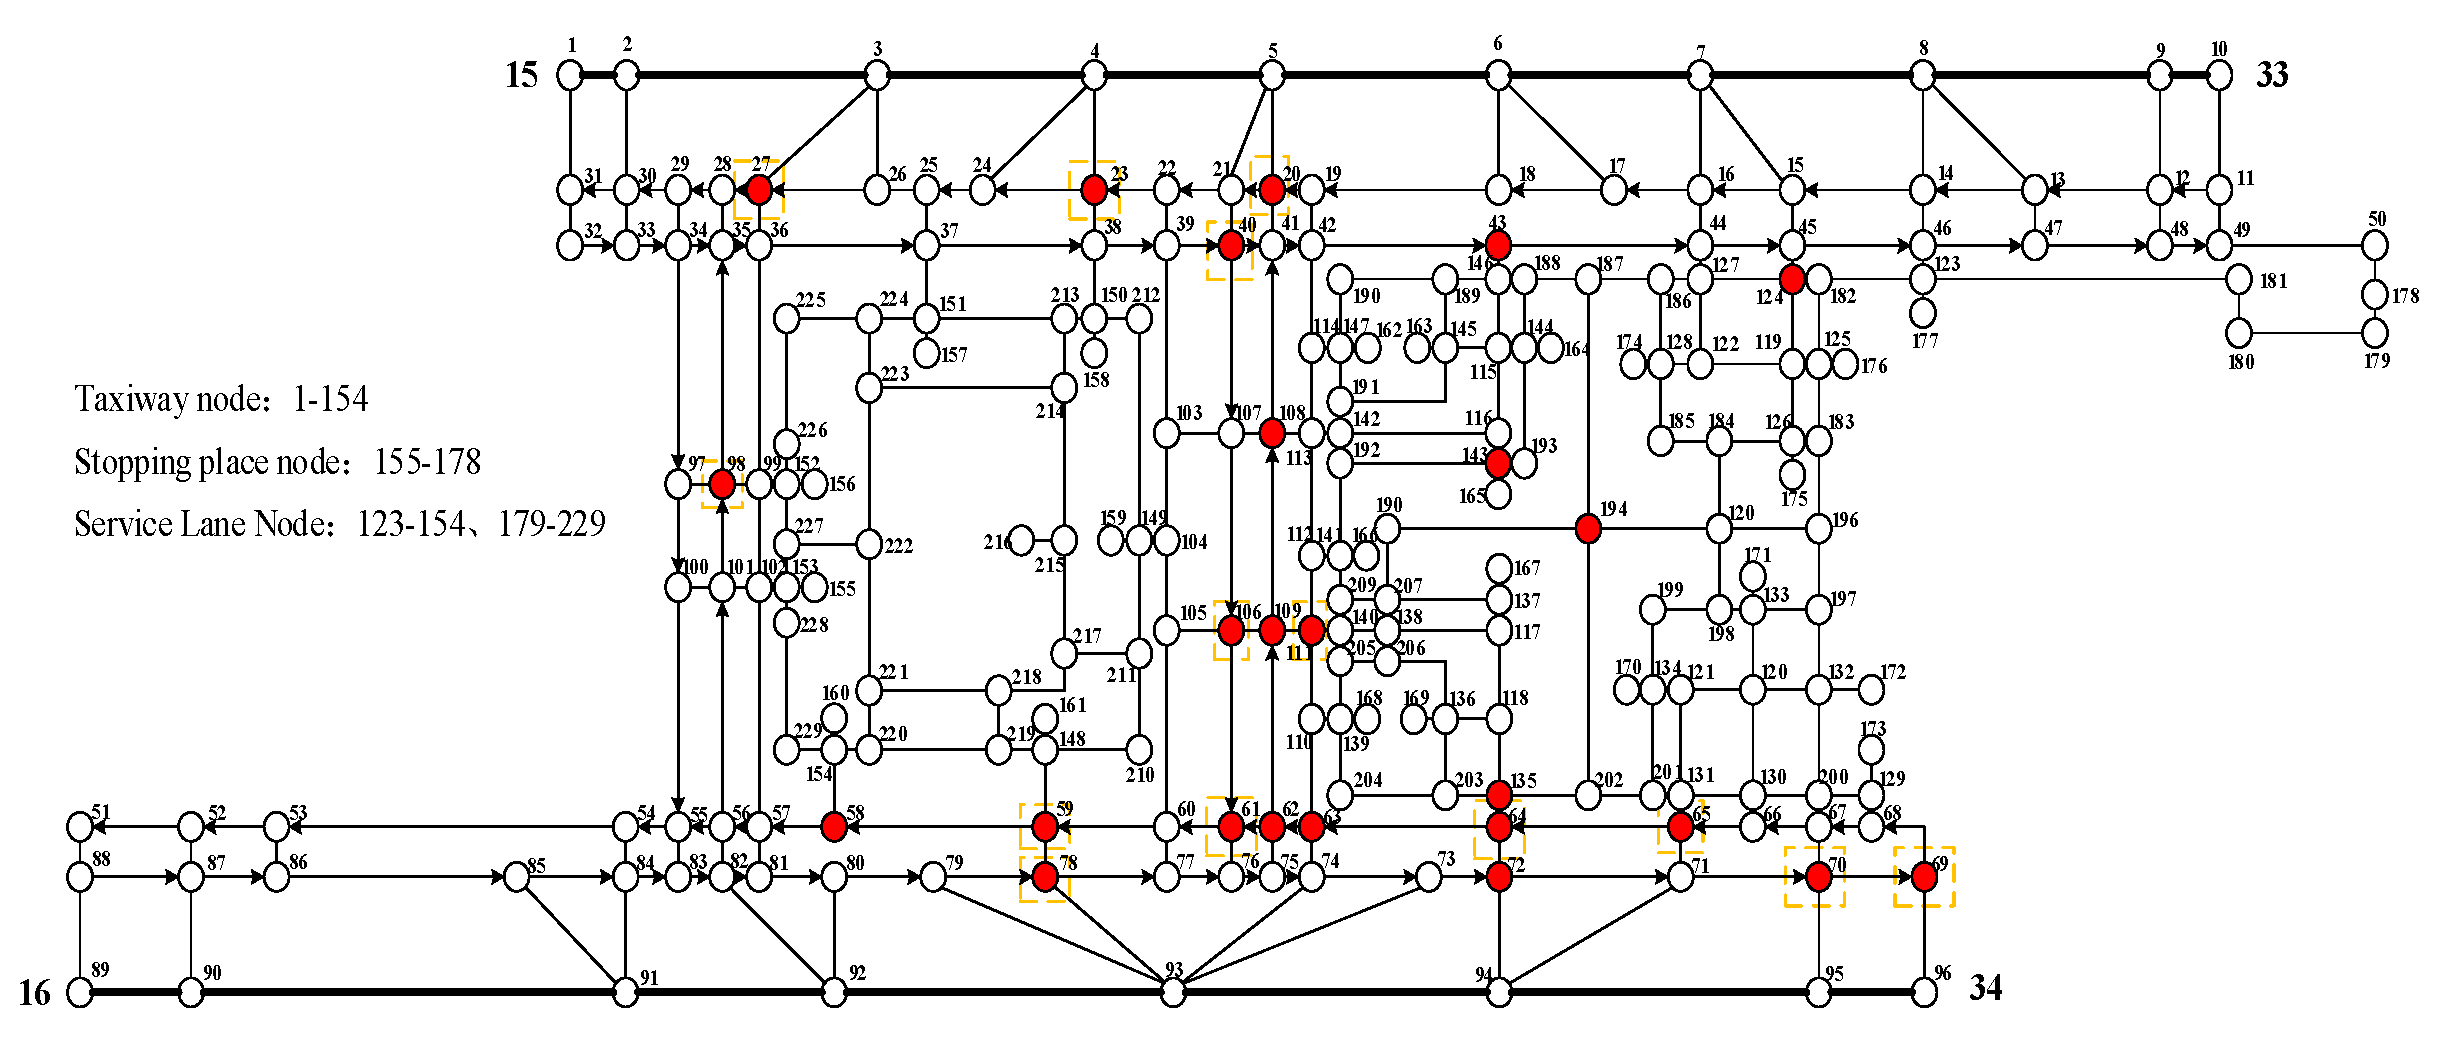
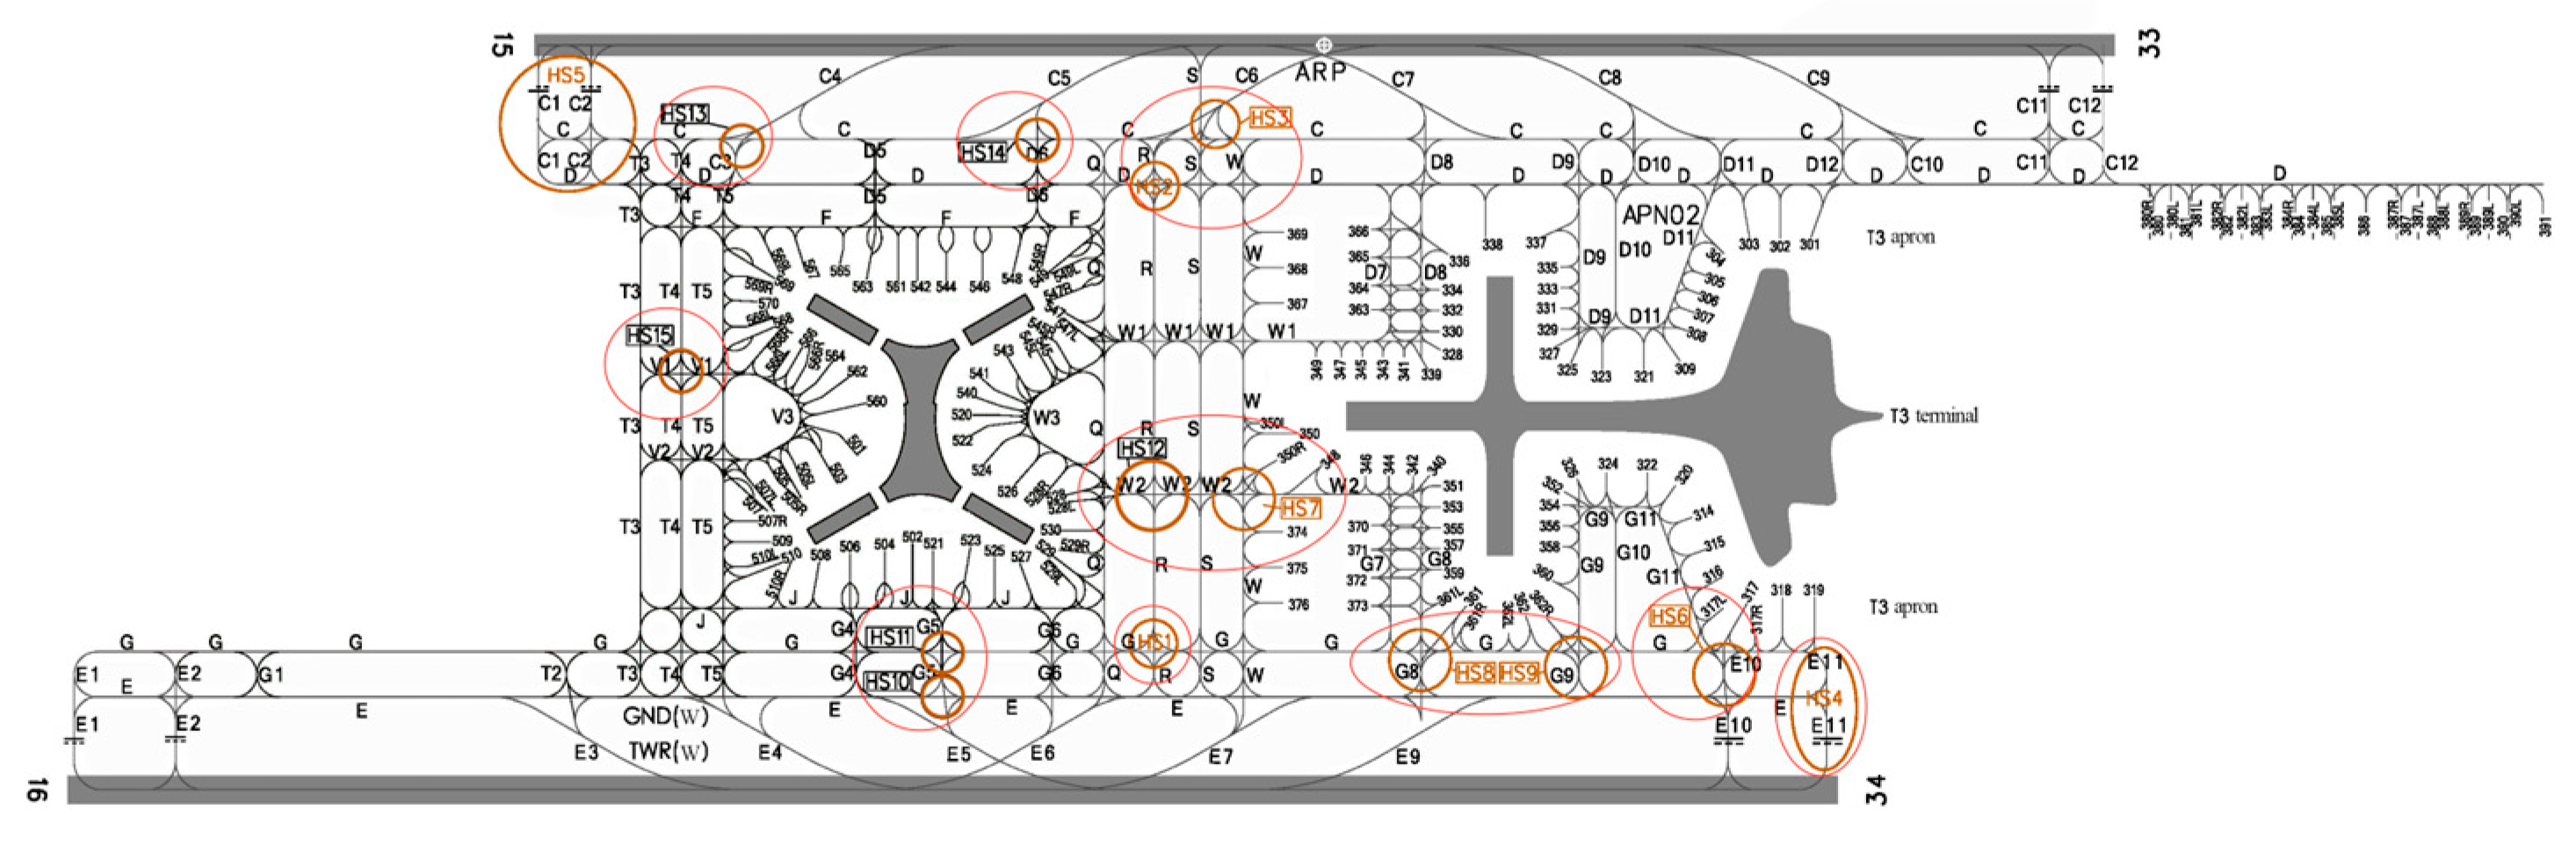
Blue nodes (numbered 1–10, 89–96, 155–178) are runway and parking nodes. Since such nodes are bound to be occupied by aircraft or supporting vehicles, their risk index values obtained after comprehensive evaluation are higher. Since the determination of risk hotspots mainly focuses on taxiway nodes, such nodes are excluded.
Red nodes are risk hotspots. The 25 nodes with higher risk indexes are classified as risk hotspots, and the specific distribution is shown in Figure 22. Among them, the three nodes numbered 124, 135, and 143 are taxiway and service lane intersections, which indicate a higher risk of conflict between aircraft and support vehicles; node 194 is a service lane node, which indicates a higher risk of conflict between support vehicles; nodes numbered 20, 23, 27, 40, 43, 58–59, 61–65, 69–70, 72, 78, 98, 106, 108–109, and 111 are 21 nodes are taxiway nodes, indicating a high risk of taxiing conflicts between aircraft.
The gray nodes are general nodes. They account for the majority of the airport surface network structure and their risk index is relatively low.
Figure 23 shows the comparison between the actual risk hotspot map and the risk hotspots in Shenzhen Bao’an Airport. It can be seen that there are 14 risk hotspots that are exactly the same as the actual conflict areas, accounting for 93%, which verifies the validity and accuracy of the method proposed in this paper, and, at the same time, other potential risk hotspots are also identified, and the relevant results can provide a scientific reference for airport surface safety management.
Comparing Figure 14 directly identifying risk hotspots based on airport surface mixed traffic flows simulation and Figure 23 identifying risk hotspots based on simulation model and risk evaluation, it can be seen that 73% of risk hotspot areas identified based on Monte Carlo simulation experiments are consistent with the actual conflict hotspot areas, whereas 93% of risk hotspot areas identified based on simulation model and risk evaluation are consistent with the actual conflict hotspot areas, which is 20% more accurate compared to the direct identification of risk hotspots by the simulation experiments. The accuracy of the risk hotspots is increased by 20% compared with the direct identification of risk hotspots by simulation experiment. Therefore, the proposed simulation and risk evaluation model for airport surface traffic operation has high identification accuracy, and the identified risk hotspots on the airport surface are in good agreement with the actual conflict areas.

6. Conclusions

(1)
Aiming at the problem that the current research mainly focuses on aircraft micro-collision conflicts, but less on aircraft–vehicle cooperative operation conflicts, the Monte Carlo simulation method was used to construct the cooperative operation environment of “aircraft–vehicle” mixed traffic flows on the airport surface, comprehensively considering the operational resources such as runways, taxiways, parking spaces, and the activity targets of aircraft and support vehicles, which realized the operation simulation of the mixed traffic flows formed by aircraft and vehicles on the airport surface. The proposed method has high simulation accuracy, and 73% of the identified risk hotspots on the airport surface are consistent with the actual risk hotspots, which can provide the basic environment for accurately analyzing the risk of conflict between aircraft, between aircraft and support vehicles, and between support vehicles and support vehicles in the airport surface system.
(2)
Aiming at the current research on the number of conflicts, conflict duration, conflict probability, and other indicators of the airport surface operation, but less consideration of the complex network characteristics inherent in the airport surface skidding system and its impact on the potential conflicts of the traffic operation, facing the multi-dimensional perspectives of the topology structure characteristics, network vulnerability, and traffic complexity, systematically and comprehensively constructed the risk hotspot characteristic index system and its measurement of mixed traffic flows on airport surface, and adopted the combination weighting method and the improved TOPSIS method to comprehensively evaluate the risk index of any node in the topological network of airport surface. The result shows that 93% of the identified risk hotspots are consistent with the actual hotspot areas, which improves the accuracy rate of directly identifying the risk hotspots by 20% compared with that of the simulation experiments. Therefore, the proposed method can provide a decision-making basis for accurately identifying the risk hotspots of airport surface operation, reducing the potential conflicts of airport surface operation, and improving the safety level of airport surface operation.
(3)
The research results of this paper have certain guiding significance for enhancing the cooperative operational safety capability of heterogeneous activity targets in complex airport surface, and future research work will further focus on the temporal and spatial evolution characteristics of the operational risk hotspots in airport surface, as well as the mechanism of the role of the evolution of the conflict risk on the effectiveness of the operational management of airport surface.

Author Contributions

Conceptualization, W.T. and X.Z. and J.Y.; methodology, X.Z.; software, J.Y.; validation, W.T. and X.Z.; formal analysis, X.Z.; investigation, X.Z. and J.Y. and Y.L.; resources, W.T. and Y.Z.; data curation, X.Z.; writing—original draft preparation, J.Y.; writing—review and editing, X.Z.; visualization, Y.L.; supervision, W.T. and Y.Z.; project administration, W.T.; funding acquisition, W.T. All authors have read and agreed to the published version of the manuscript.

Funding

This research was funded by the National Key R&D Program of China, grant number 2021YFB1600500, the National Natural Science Foundation of China, grant number 52002178, and the School Innovation Plan Project of Nanjing University of Aeronautics and Astronautics, grant number xcxjh20230718.

Data Availability Statement

Data are contained within the article. The data presented in this study are available on request from the corresponding author.

Conflicts of Interest

The authors declare no conflicts of interest.

References

  1. Zhu, G.J.J.; Yang, X.Y.; Hu, K.B. Research on Hotspot of Aircraft Taxiing Conflict Based on Improved Evidence-based Practice Method. Aeronaut. Comput. Tech. 2022, 52, 11–15. [Google Scholar]
  2. Wang, G.; Tan, T. Airport Taxiway Conflict Detection Method Based on Network Topology. In Proceedings of the 2020 IEEE 2nd International Conference on Civil Aviation Safety and Information Technology (ICCASIT), Weihai, China, 14–16 October 2020. [Google Scholar]
  3. Landry, S.J.; Chen, X.W.; Nof, S.Y. A decision support methodology for dynamic taxiway and runway conflict prevention. Decis. Support Syst. 2013, 55, 165–174. [Google Scholar] [CrossRef]
  4. Cai, C.; Wu, K.; Yan, Y. Rapid detection and social media supervision of runway incursion based on deep learning. Int. J. Innov. Comput. Appl. 2018, 9, 98–106. [Google Scholar] [CrossRef]
  5. Song, I.; Cho, I.; Tessitore, T.; Gurcsik, T.; Ceylan, H. Data-driven prediction of runway incursions with uncertainty quantification. J. Comput. Civ. Eng. 2018, 32, 04018004. [Google Scholar] [CrossRef]
  6. Xia, Z.; Zheng, B.; Wan, J.; Zhu, X. Recognition Algorithm and Risk Assessment of Airport Hotspots. J. Shanghai Jiaotong Univ. 2019, 24, 769–774. [Google Scholar] [CrossRef]
  7. Han, Y.; Ma, S.; Xu, Y.; He, L.; Li, S.; Zhu, M. Effective complex airport object detection in remote sensing images based on improved end-to-end convolutional neural network. IEEE Access 2020, 8, 172652–172663. [Google Scholar] [CrossRef]
  8. Lian, G.; Wang, Y.; Li, W.; Xu, Q.; Hao, S.; Wen, T. Aircraft taxiing conflict avoidance approach based on Gaussian spatial–temporal prediction. Phys. A Stat. Mech. Appl. 2023, 624, 128915. [Google Scholar] [CrossRef]
  9. Xia, Z.H.; Wan, J.; Zhu, X.P. Research on spatial and temporal distribution characteristics of airport hotspots and airport operational risk assessment. China Saf. Sci. J. 2018, 28, 93–98. [Google Scholar]
  10. Ali, H.; Delair, R.; Pham, D.T.; Alam, S.; Schultz, M. Dynamic Hot Spot Prediction by Learning Spatial-Temporal Utilization of Taxiway Intersections. In Proceedings of the International Conference on Artificial Intelligence, Cairo, Egypt, 8–10 April 2020. [Google Scholar]
  11. Wang, X.L.; Yin, H. Identification of key conflict points in airport airfield area based on betweenness and degree entropy. J. Saf. Sci. Technol. 2022, 18, 236–242. [Google Scholar]
  12. Wu, M.; Wang, Z.; Gan, X.; Yang, G.; Wen, X. Identification of Key Flight Conflict Nodes Based on Complex Network Theory. J. Northwestern Polytech. Univ. 2020, 38, 279–287. [Google Scholar] [CrossRef]
  13. Wang, X.L.; Yin, H.; He, M. Potential conflicts prediction of mobile in the airport airfield area based on LSTM. J. Beijing Univ. Aeronaut. Astronaut. 2022, 48, 1–15. [Google Scholar]
  14. Huo, Z.L. Research on Hotspots Identification in Aero drome through the Triple Selection Method. China Saf. Sci. J. 2012, 22, 92–96. [Google Scholar]
  15. Li, Z.L. Aircraft Taxing Path Optimization Algorithm Based on Conflict Hotspots; Sichuan University: Chengdu, China, 2021. [Google Scholar]
  16. Meng, L.H.; Tian, C. Multi-runway airport hot spot recognition method based on Monte Carlo simulation. J. Civ. Aviat. Univ. China 2020, 38, 8–11+17. [Google Scholar]
  17. Wang, J.L.; Zhao, X.P.; Zhou, Y. Ontology-based approach for airdrome safety hotspots analysis. J. Civ. Aviat. Univ. China 2016, 34, 16–20+26. [Google Scholar]
  18. Pan, W.J.; Wang, X.; Xia, Z.H. Aircraft taxing method for skirting around airport hotspots. Comput. Eng. Des. 2015, 36, 3324–3327+3384. [Google Scholar]
  19. Wang, X.; Zuo, Q.H. Aircraft taxiing route planning based on airport hotspots. AIP Conf. Proc. 2017, 1839, 020088. [Google Scholar]
  20. Tien, S.L.; Tang, H.; Kirk, D.; Vargo, E.; Liu, S. Deep Reinforcement Learning Applied to Airport Surface Movement Planning. In Proceedings of the 2019 IEEE/AIAA 38th Digital Avionics Systems Conference (DASC), San Diego, CA, USA, 8–12 September 2019. [Google Scholar]
  21. Lu, H.; Zhao, Y.; Zhou, X. Selection of agricultural machinery based on improved CRITIC-entropy weight and GRA-TOPSIS method. Processes 2022, 10, 266. [Google Scholar] [CrossRef]
  22. Yin, J.N.; Hu, Y.X.; Ma, Y.Y. Characteristic Analysis of Air Traffic Operations in High Density Traffic Airports. Sci. Technol. Eng. 2019, 19, 346–355. [Google Scholar]
  23. Ning, B.Q.; Shan, Z.P. Fuzzy Object Element Analysis Model and Application Based on Improved Entropy and Gray Correlation Analysis. Pract. Underst. Math. 2016, 280–284. [Google Scholar] [CrossRef]
  24. Yoon, K. Systems Selection by Multiple Attribute Decision Making. Master’s Thesis, Kansas State University, Manhattan, KS, USA, 1980. [Google Scholar]
Figure 1. The process of modeling the physical structure and topology of the scene.
Aerospace 11 00254 g001
Figure 2. Scene traffic flow conflict allocation rules based on first-come–first-served principle.
Aerospace 11 00254 g002
Figure 3. Overall process of airport surface traffic operation simulation.
Aerospace 11 00254 g003
Figure 4. Airport mixed traffic flow risk hotspot characteristics indicator system.
Aerospace 11 00254 g004
Figure 5. Comprehensive evaluation process of node conflict index.
Aerospace 11 00254 g005
Figure 6. Shenzhen Airport physical layout map.
Aerospace 11 00254 g006
Figure 7. Shenzhen Airport scene network topology model.
Aerospace 11 00254 g007
Figure 8. Comparison chart of arrival traffic flow cumulative distribution functions.
Aerospace 11 00254 g008
Figure 9. Node occupancy frequency in segregated parallel operation mode.
Aerospace 11 00254 g009
Figure 10. Node occupancy frequency in related/independent parallel approach modes.
Aerospace 11 00254 g010
Figure 11. Distribution of node occupancy frequency in independent parallel departure mode.
Aerospace 11 00254 g011
Figure 12. Distribution of node conflict quantity ratios in different operational modes of the scene topological network.
Aerospace 11 00254 g012
Figure 13. Distribution of risk hotspots in mixed traffic flow scenarios.
Aerospace 11 00254 g013
Figure 14. Identification of risk hotspot areas in scene operations based on simulation models.
Aerospace 11 00254 g014
Figure 15. Conflict quantity ratios for each node in three operating modes.
Aerospace 11 00254 g015
Figure 16. Peak duration for each node in three operating modes.
Aerospace 11 00254 g016
Figure 17. Peak hour traffic flow for each node in three operating modes.
Aerospace 11 00254 g017
Figure 18. Distribution of topological structure characteristic indicators for various nodes at Shenzhen Bao’an Airport.
Aerospace 11 00254 g018
Figure 19. Distribution of vulnerability indicators for various nodes at Shenzhen Bao’an Airport.
Aerospace 11 00254 g019
Figure 20. Weighting of risk assessment indicators for mixed traffic flow operations in the scene.
Aerospace 11 00254 g020
Figure 21. Risk index for nodes in Bao’an Airport’s scene network.
Aerospace 11 00254 g021
Figure 22. Distribution of risk hotspots in airport scenes.
Aerospace 11 00254 g022
Figure 23. Identification of risk hotspot areas in scene operations based on simulation models and risk assessment.
Aerospace 11 00254 g023
Table 1. Traffic complexity metrics for partial nodes in different operating modes.
Node
Mode
12345225226227228229
Segregated Parallel Operation η i 0000.0270.02300000
P T i 0013300200
P F i 0013164300500
Related Approaches/Independent Departures η i 000.0080.0050.004000.00700
P T i 3312100400
P F i 3838526515600400
Independent Approach/Independent Departing η i 00000.85200000
P T i 3332300200
P F i 333347629900700
Table 2. Node topological structure and network vulnerability indicator values.
Node D C i B C i C C i E C i E L i S L i
10.00880.00410.10620.00620.00710.0044
20.01320.03100.11860.01540.01180.0044
30.01750.08420.13110.03580.01880.0044
40.01750.11030.13910.05340.02200.0044
50.01750.13770.14550.07190.02530.0044
2250.00880.00140.10310.00380.00750.0044
2260.00880.00400.10590.00690.00810.0044
2270.01320.02020.11970.01830.01150.0044
2280.00880.00550.11790.01260.00910.0044
2290.00880.00280.11350.00980.00830.0044
Table 3. Sensitivity analysis of indicators for the evaluation of the nodal risk index.
IndexAmplitude of Change in Risk Index/%
Decrease by 10%Decrease by 20%Increase by 10%Increase by 20%
D C i 0000
B C i 0000
C C i 0000
E C i 0−0.0200.02
E L i 0000
S L i 0000
η i −0.12−0.230.120.23
P T i −0.17−0.330.170.33
P F i −9.70−19.419.7019.41
Disclaimer/Publisher’s Note: The statements, opinions and data contained in all publications are solely those of the individual author(s) and contributor(s) and not of MDPI and/or the editor(s). MDPI and/or the editor(s) disclaim responsibility for any injury to people or property resulting from any ideas, methods, instructions or products referred to in the content.

