
Research on Aerodynamic Test Validation and the Vector Force Control Method for an E-STOL Fan Wing Unmanned Aerial Vehicle

Abstract
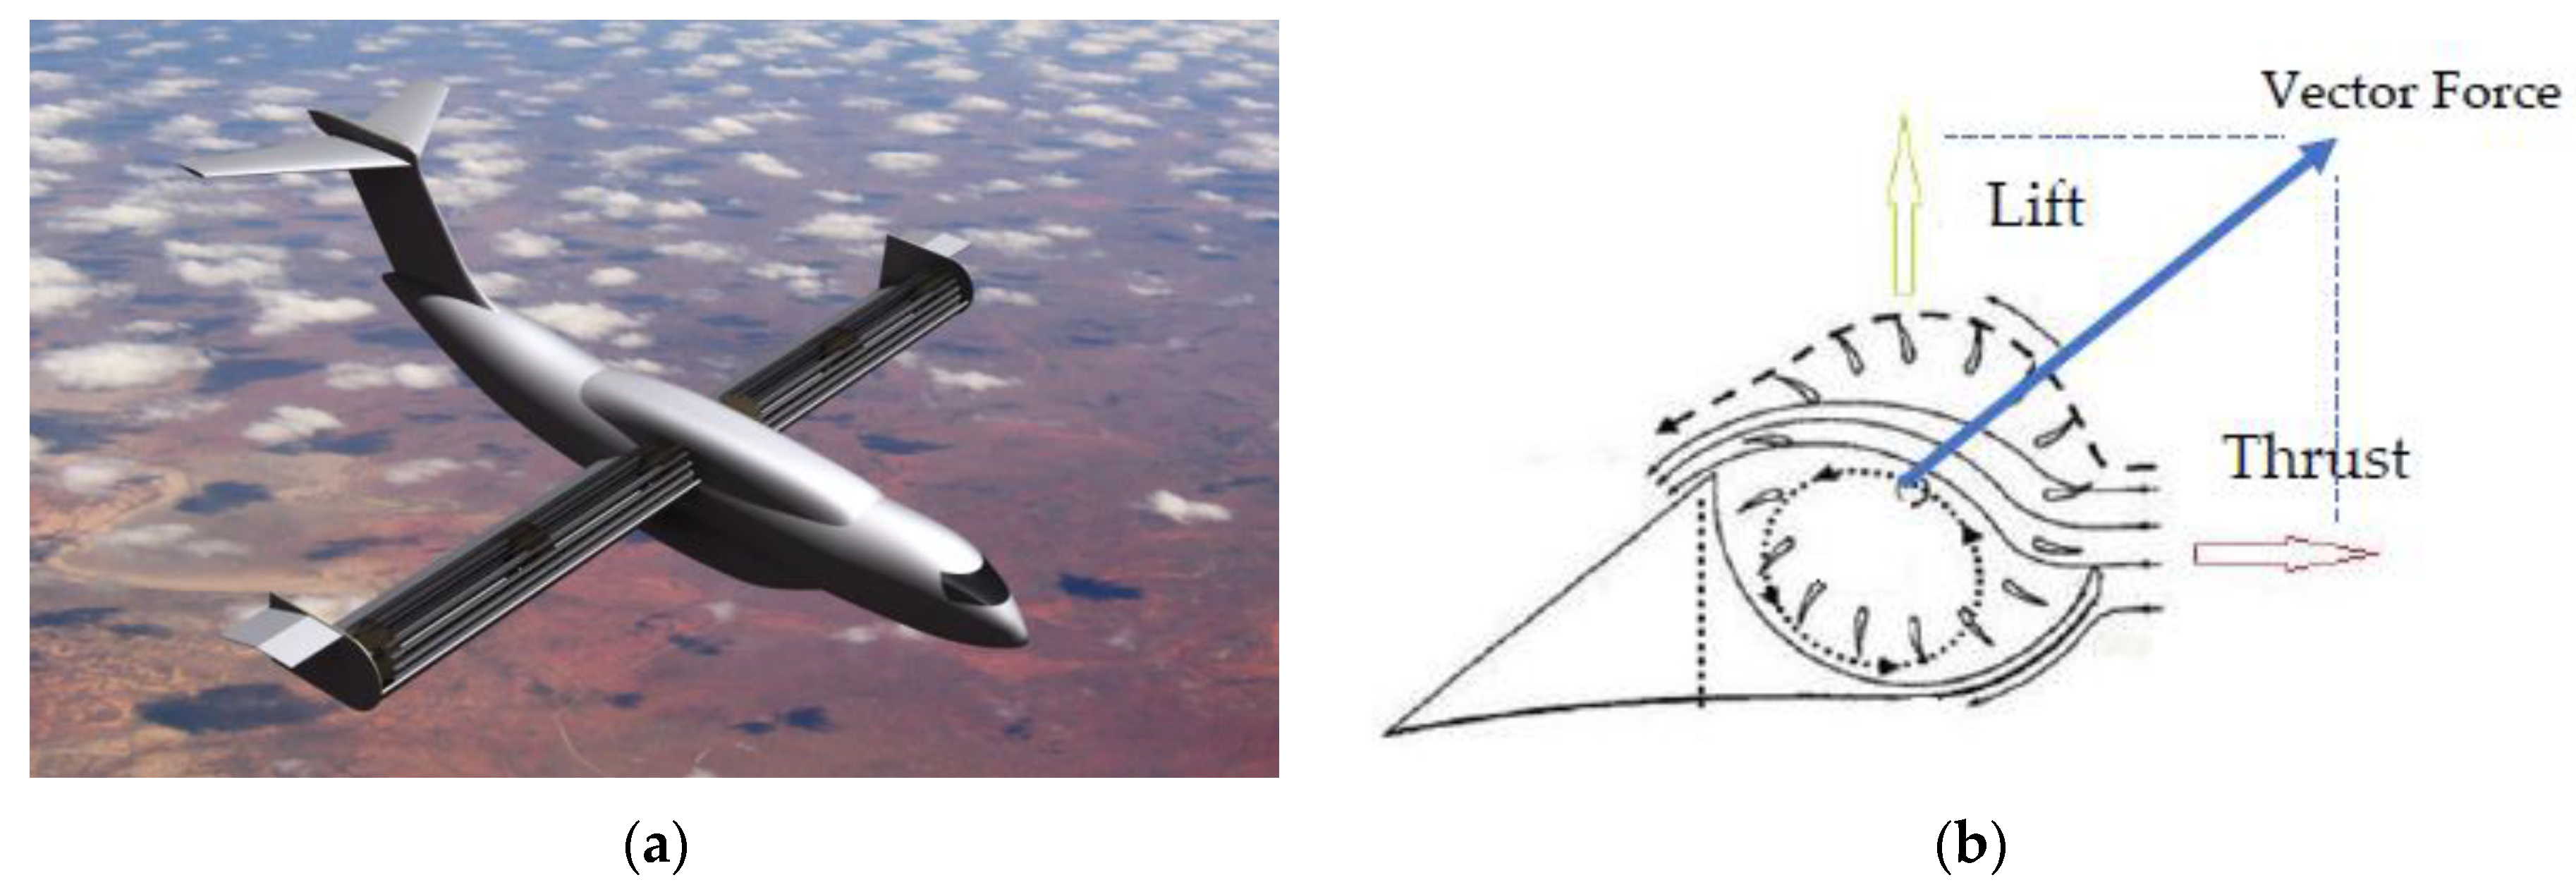
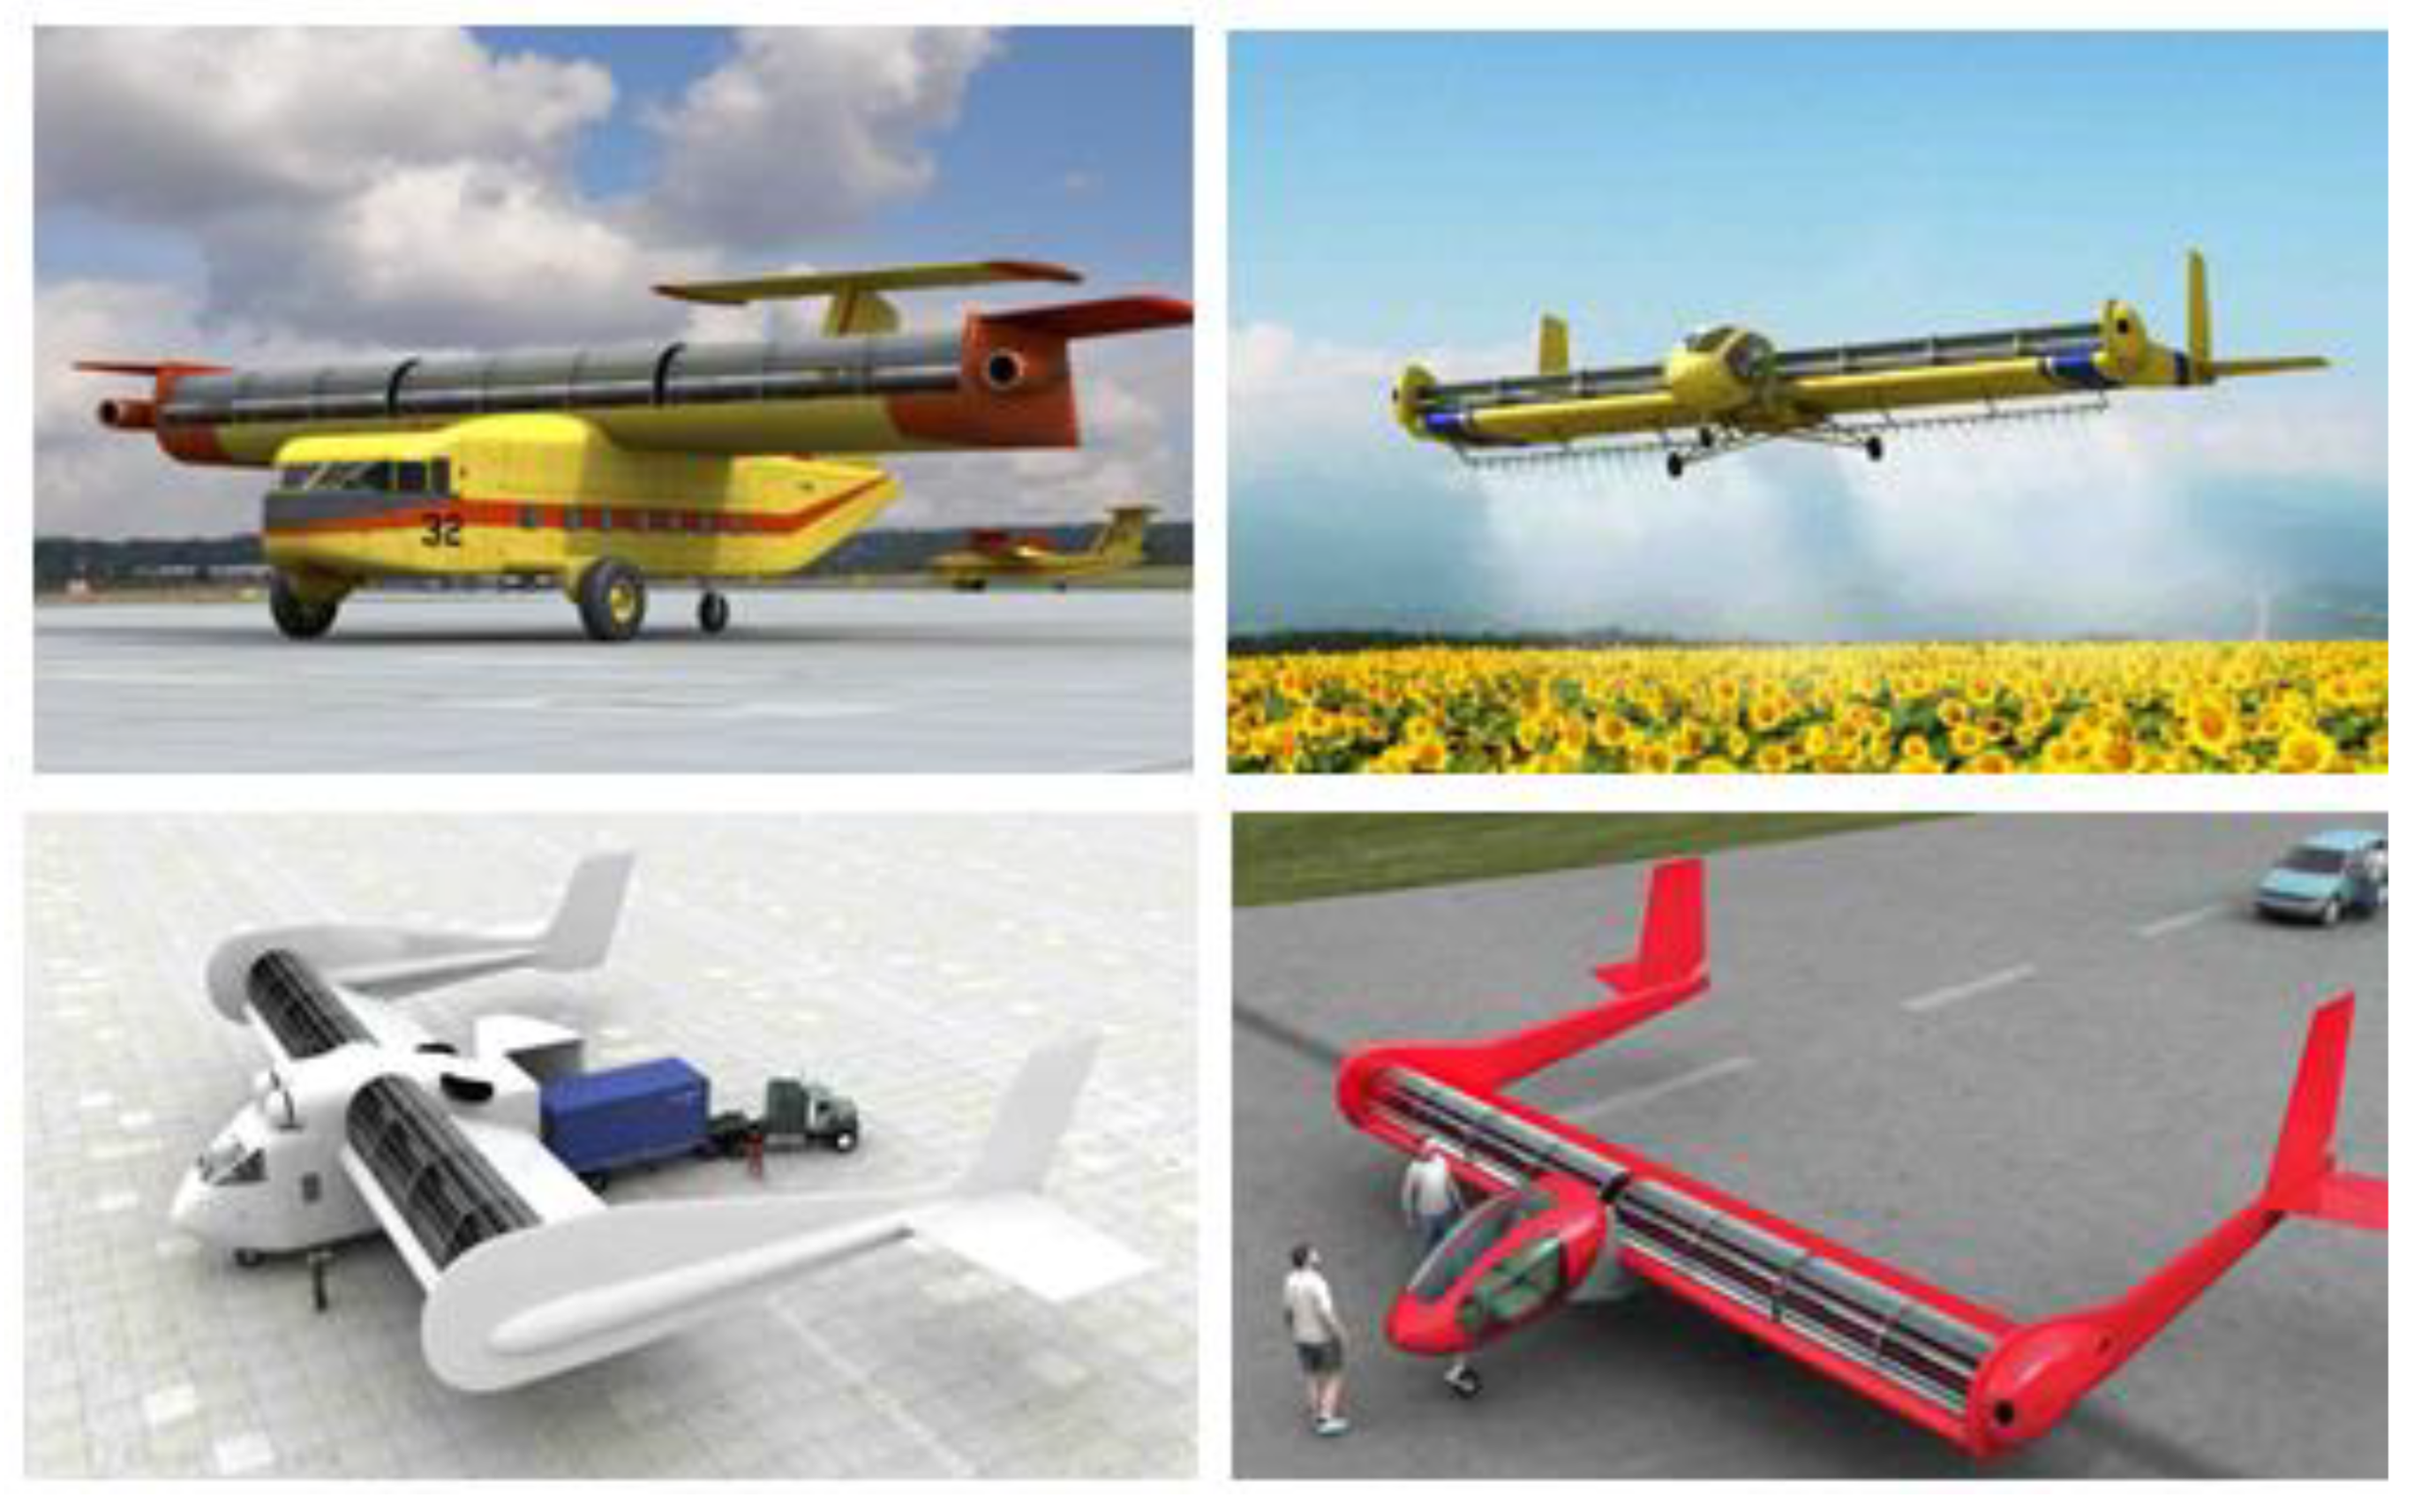
:1. Introduction
2. Fan Wing Aerodynamic Characteristics Test
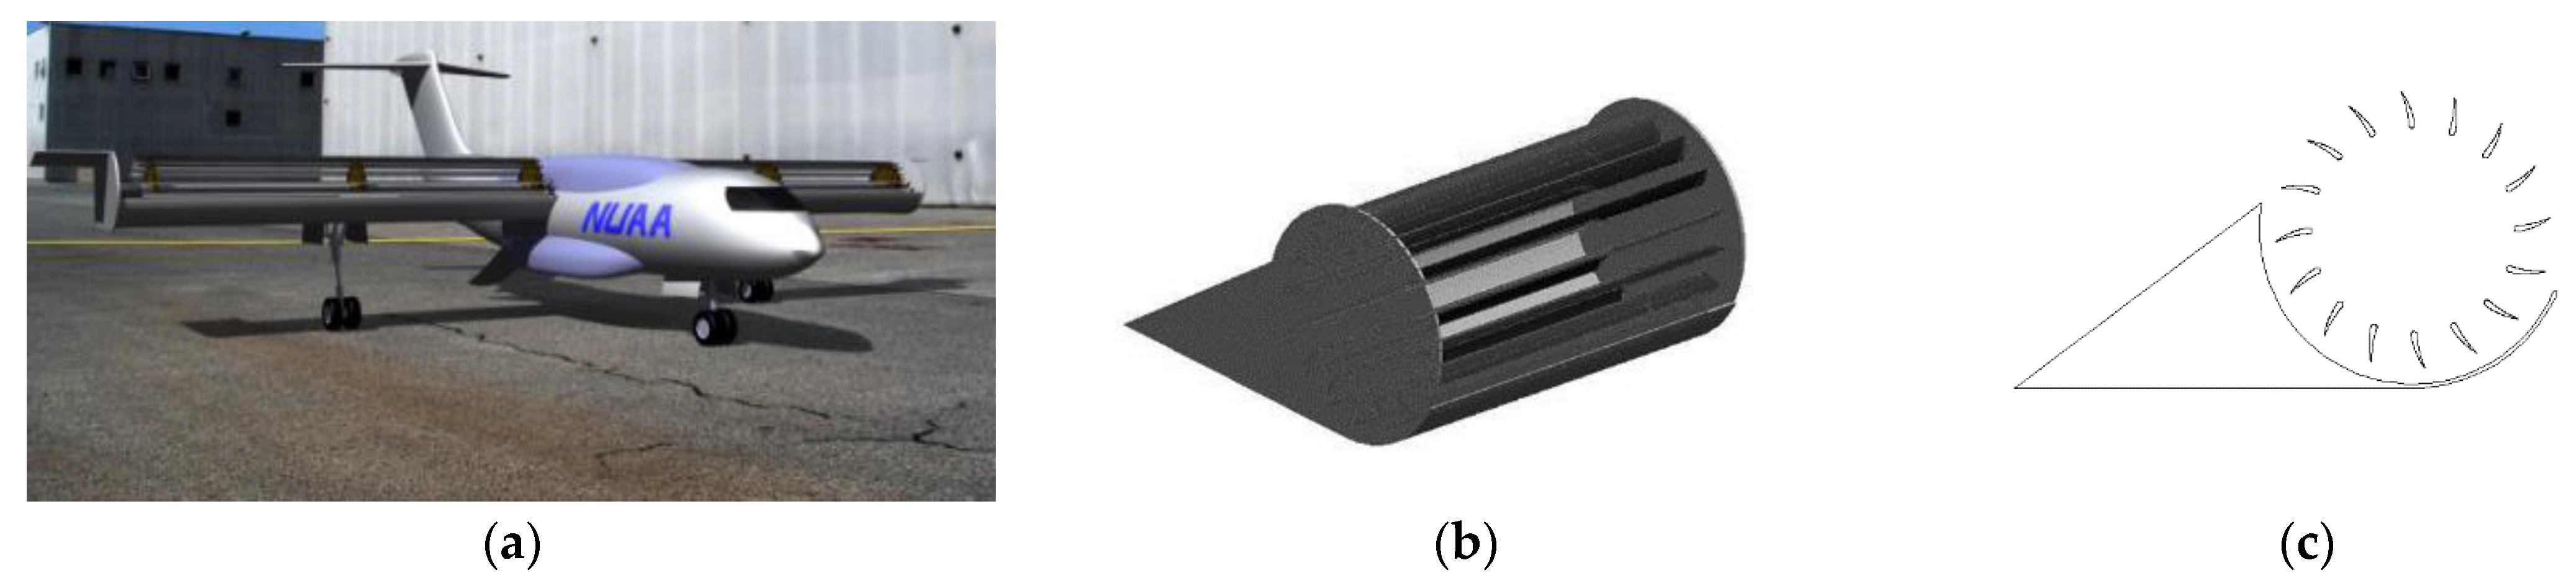
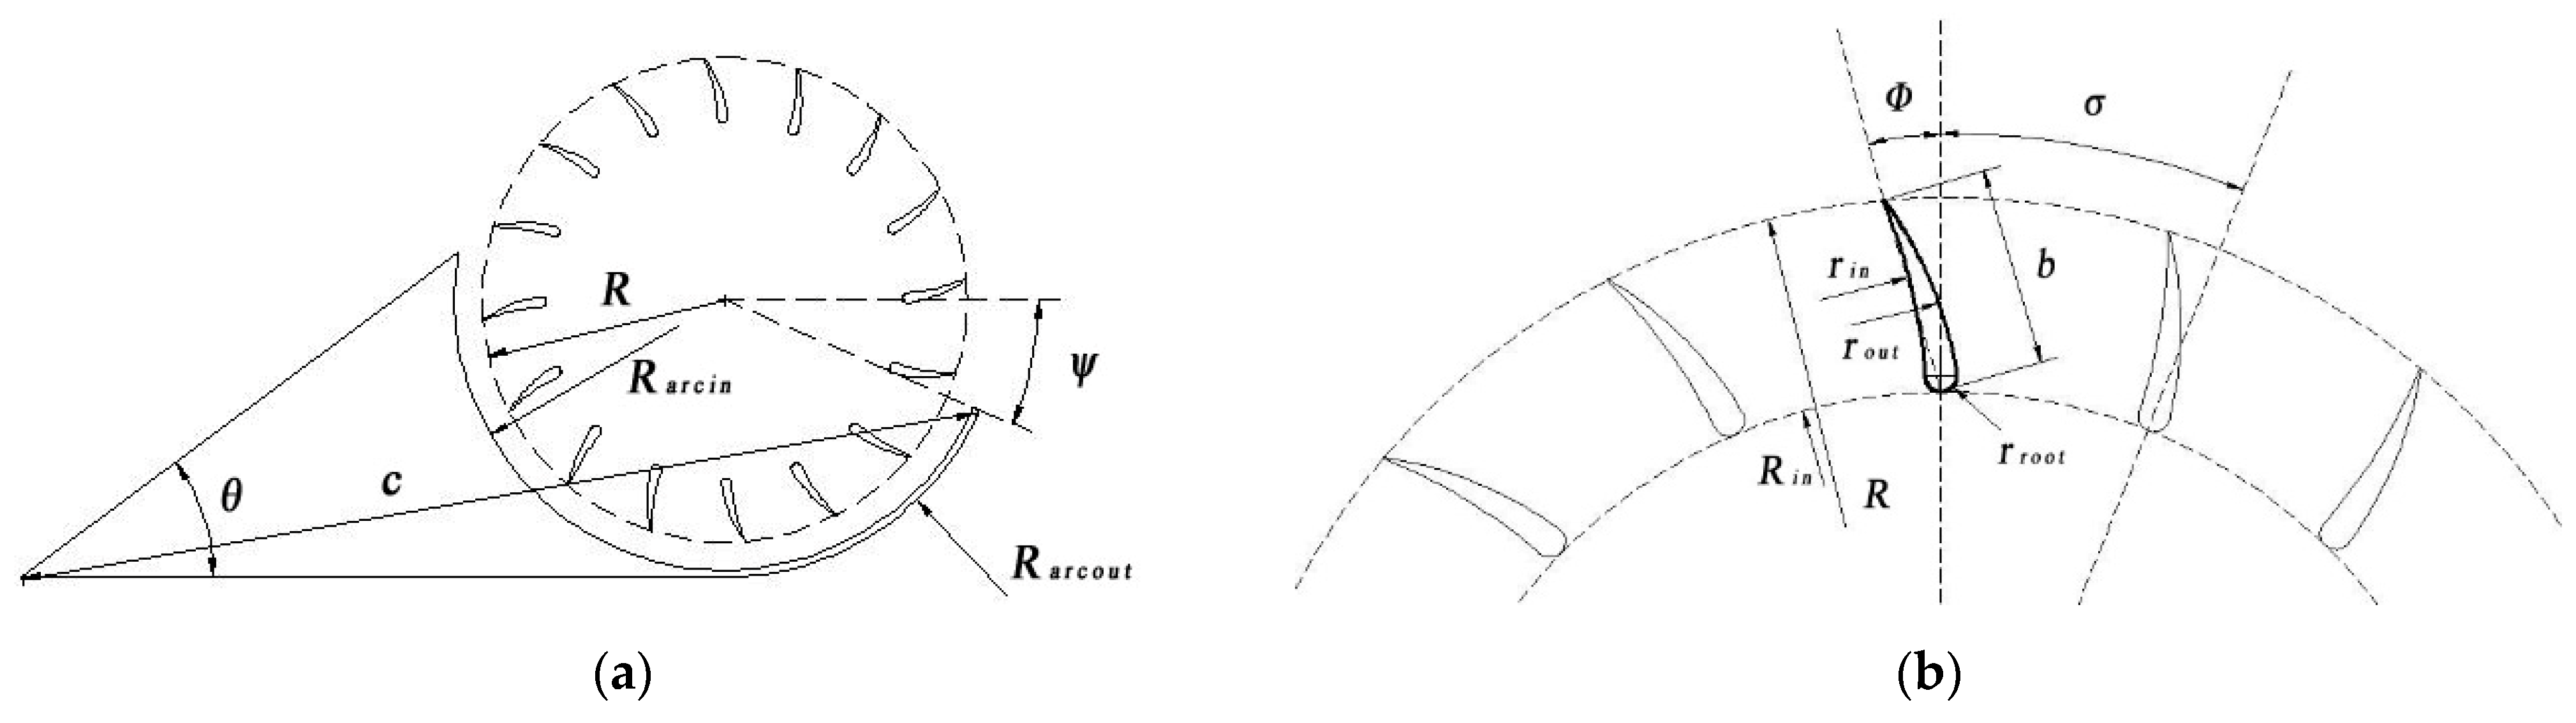
2.1. Construction of the Test Model
2.2. Establishment of Test Environment
2.3. Test Scheme
- The first part involves measuring the propulsive force of the fan blade, which includes measuring both the lift and thrust of the fan blade. The measurement conditions are outlined in Table 4.
- The second part focuses on measuring the flow direction and velocity of the airflow accelerated by the fan blade rotor.
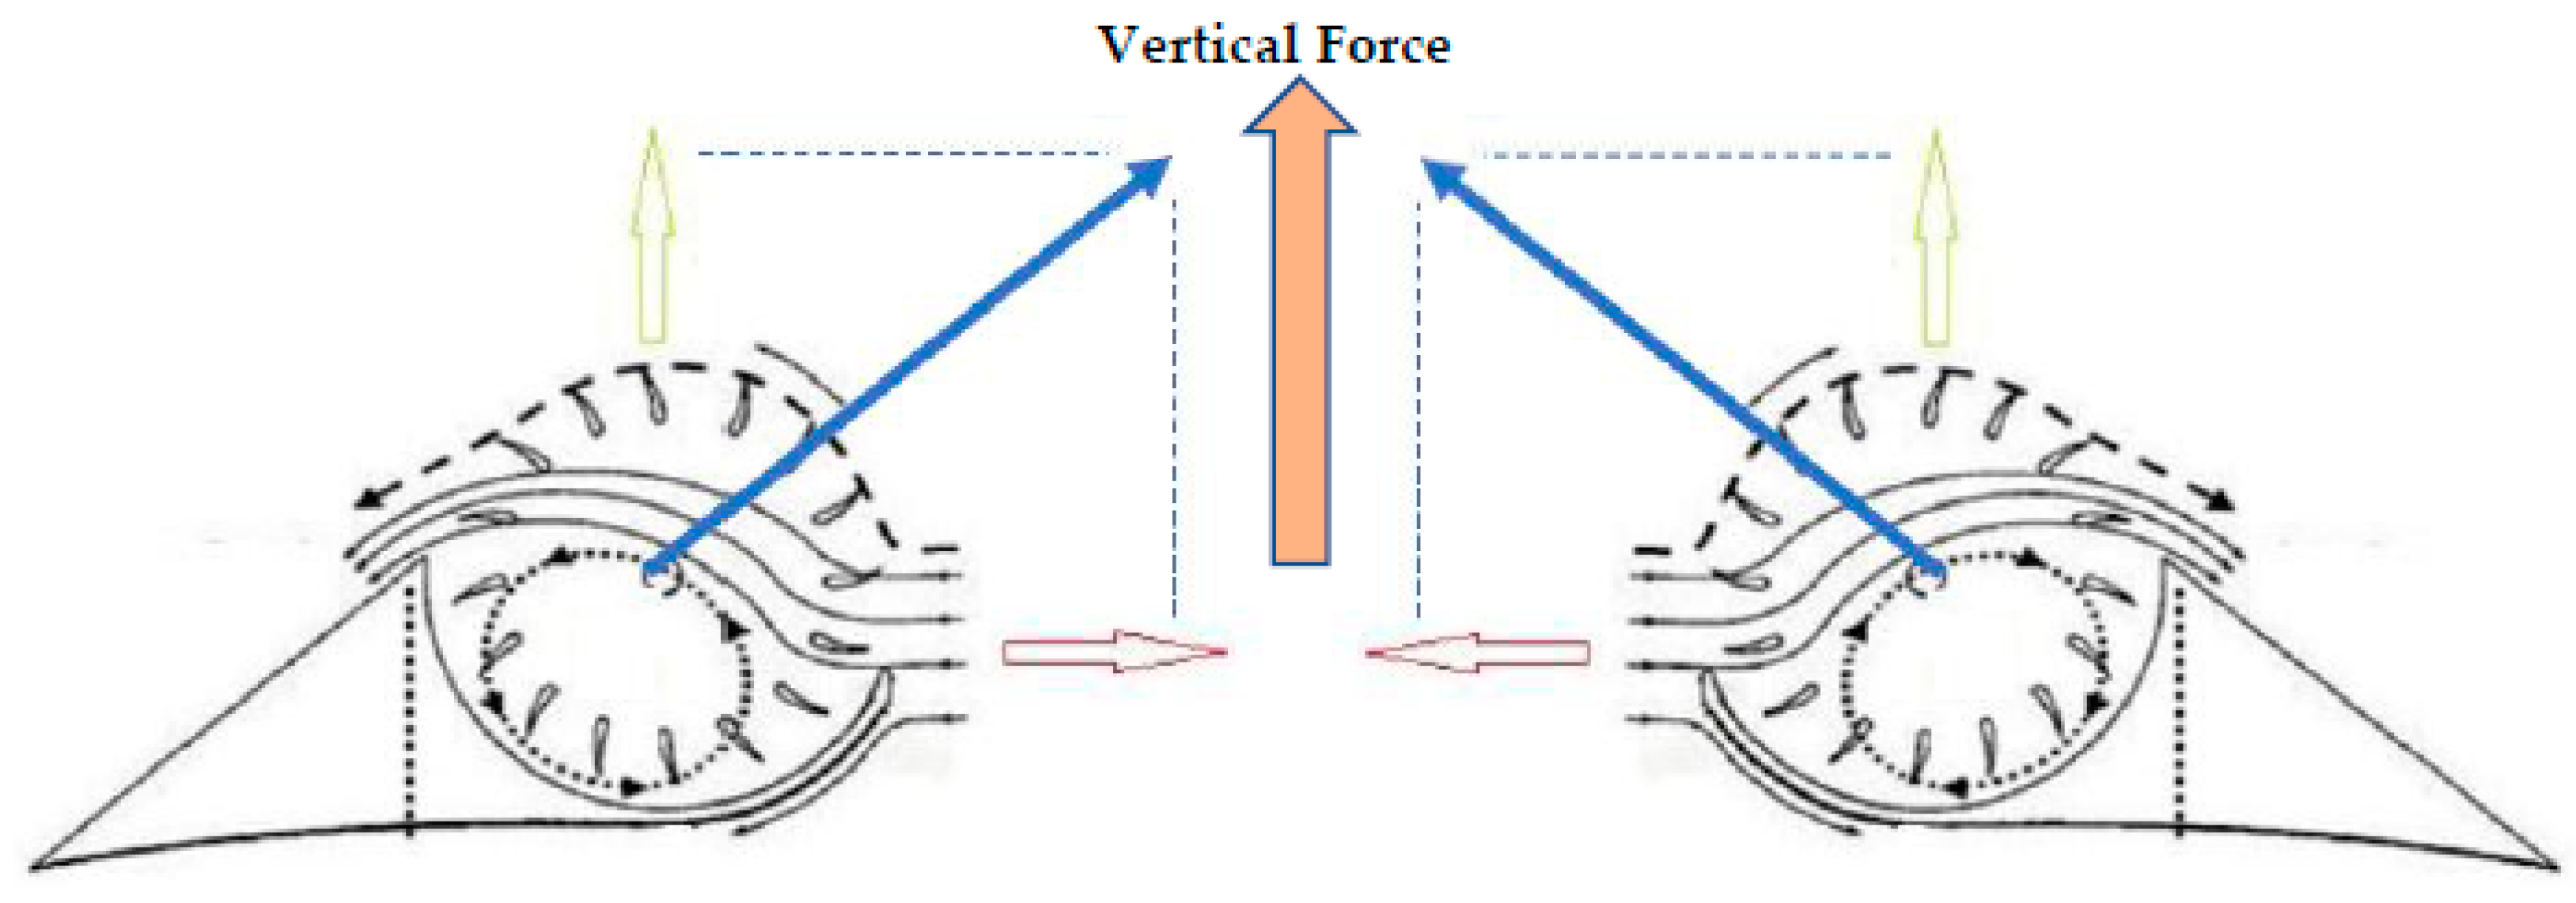
- The third part involves the observation and verification of the formation process of the low-pressure vortex inside the fan blade.
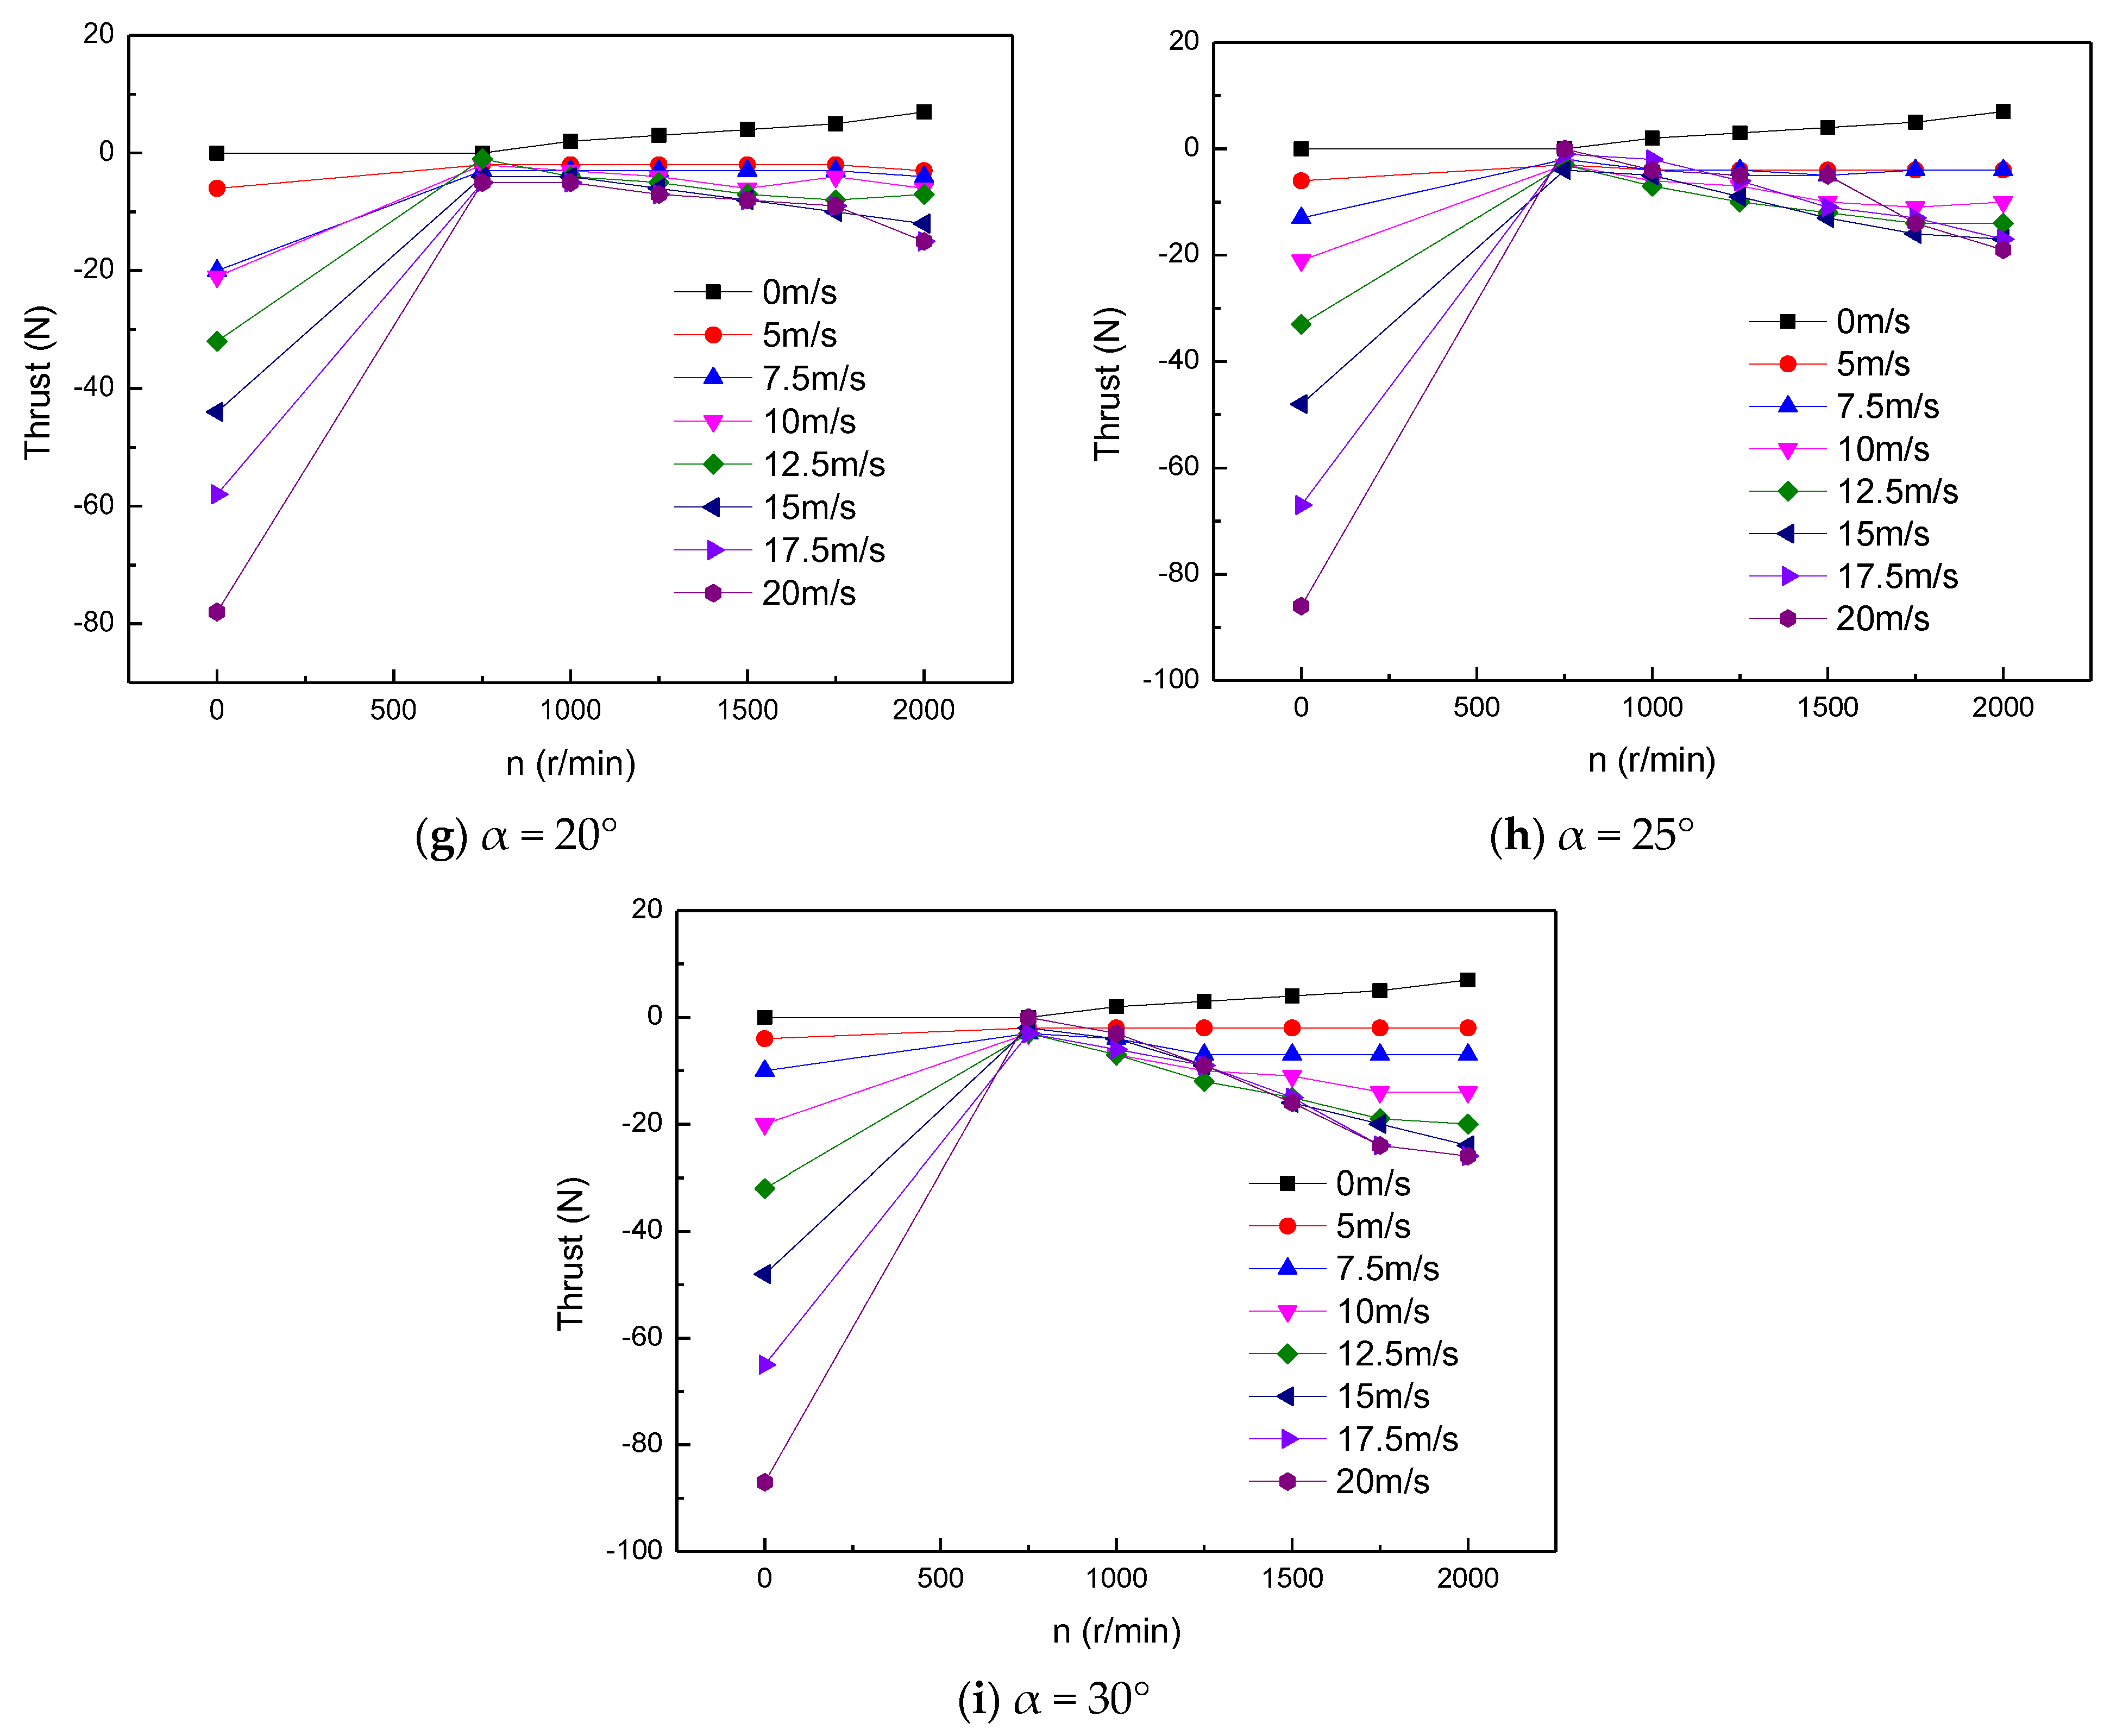
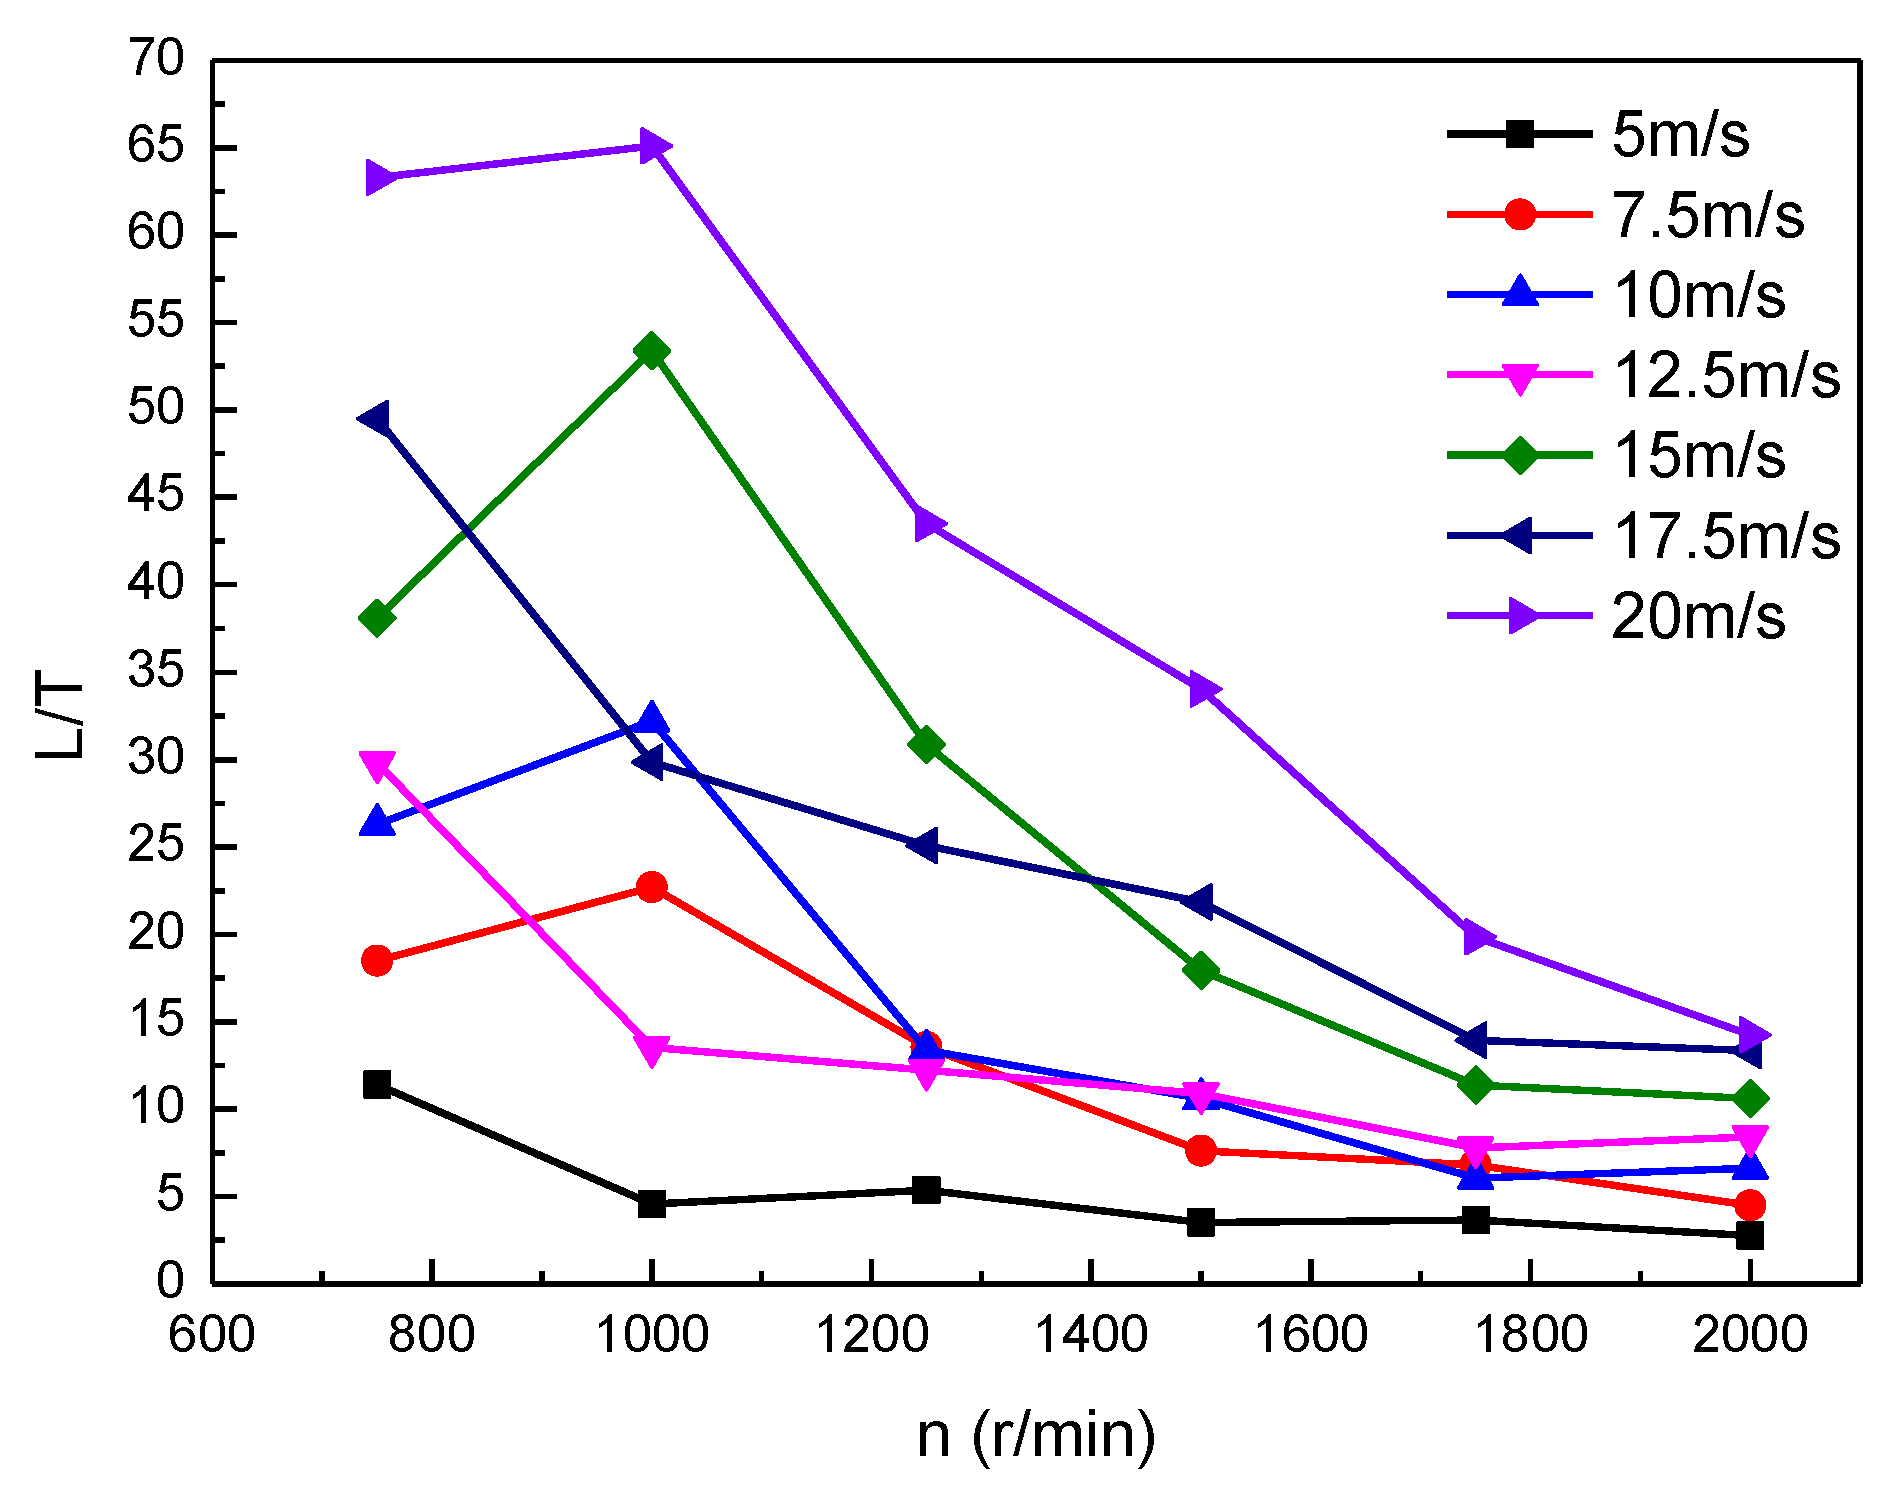
2.4. Test Results and Analysis
3. Fan Wing Vector Force Control Method
3.1. Definition of Leading Edge Slotting
3.2. Numerical Calculation Method
3.3. Examples Verification
3.4. Calculation Results and Analysis
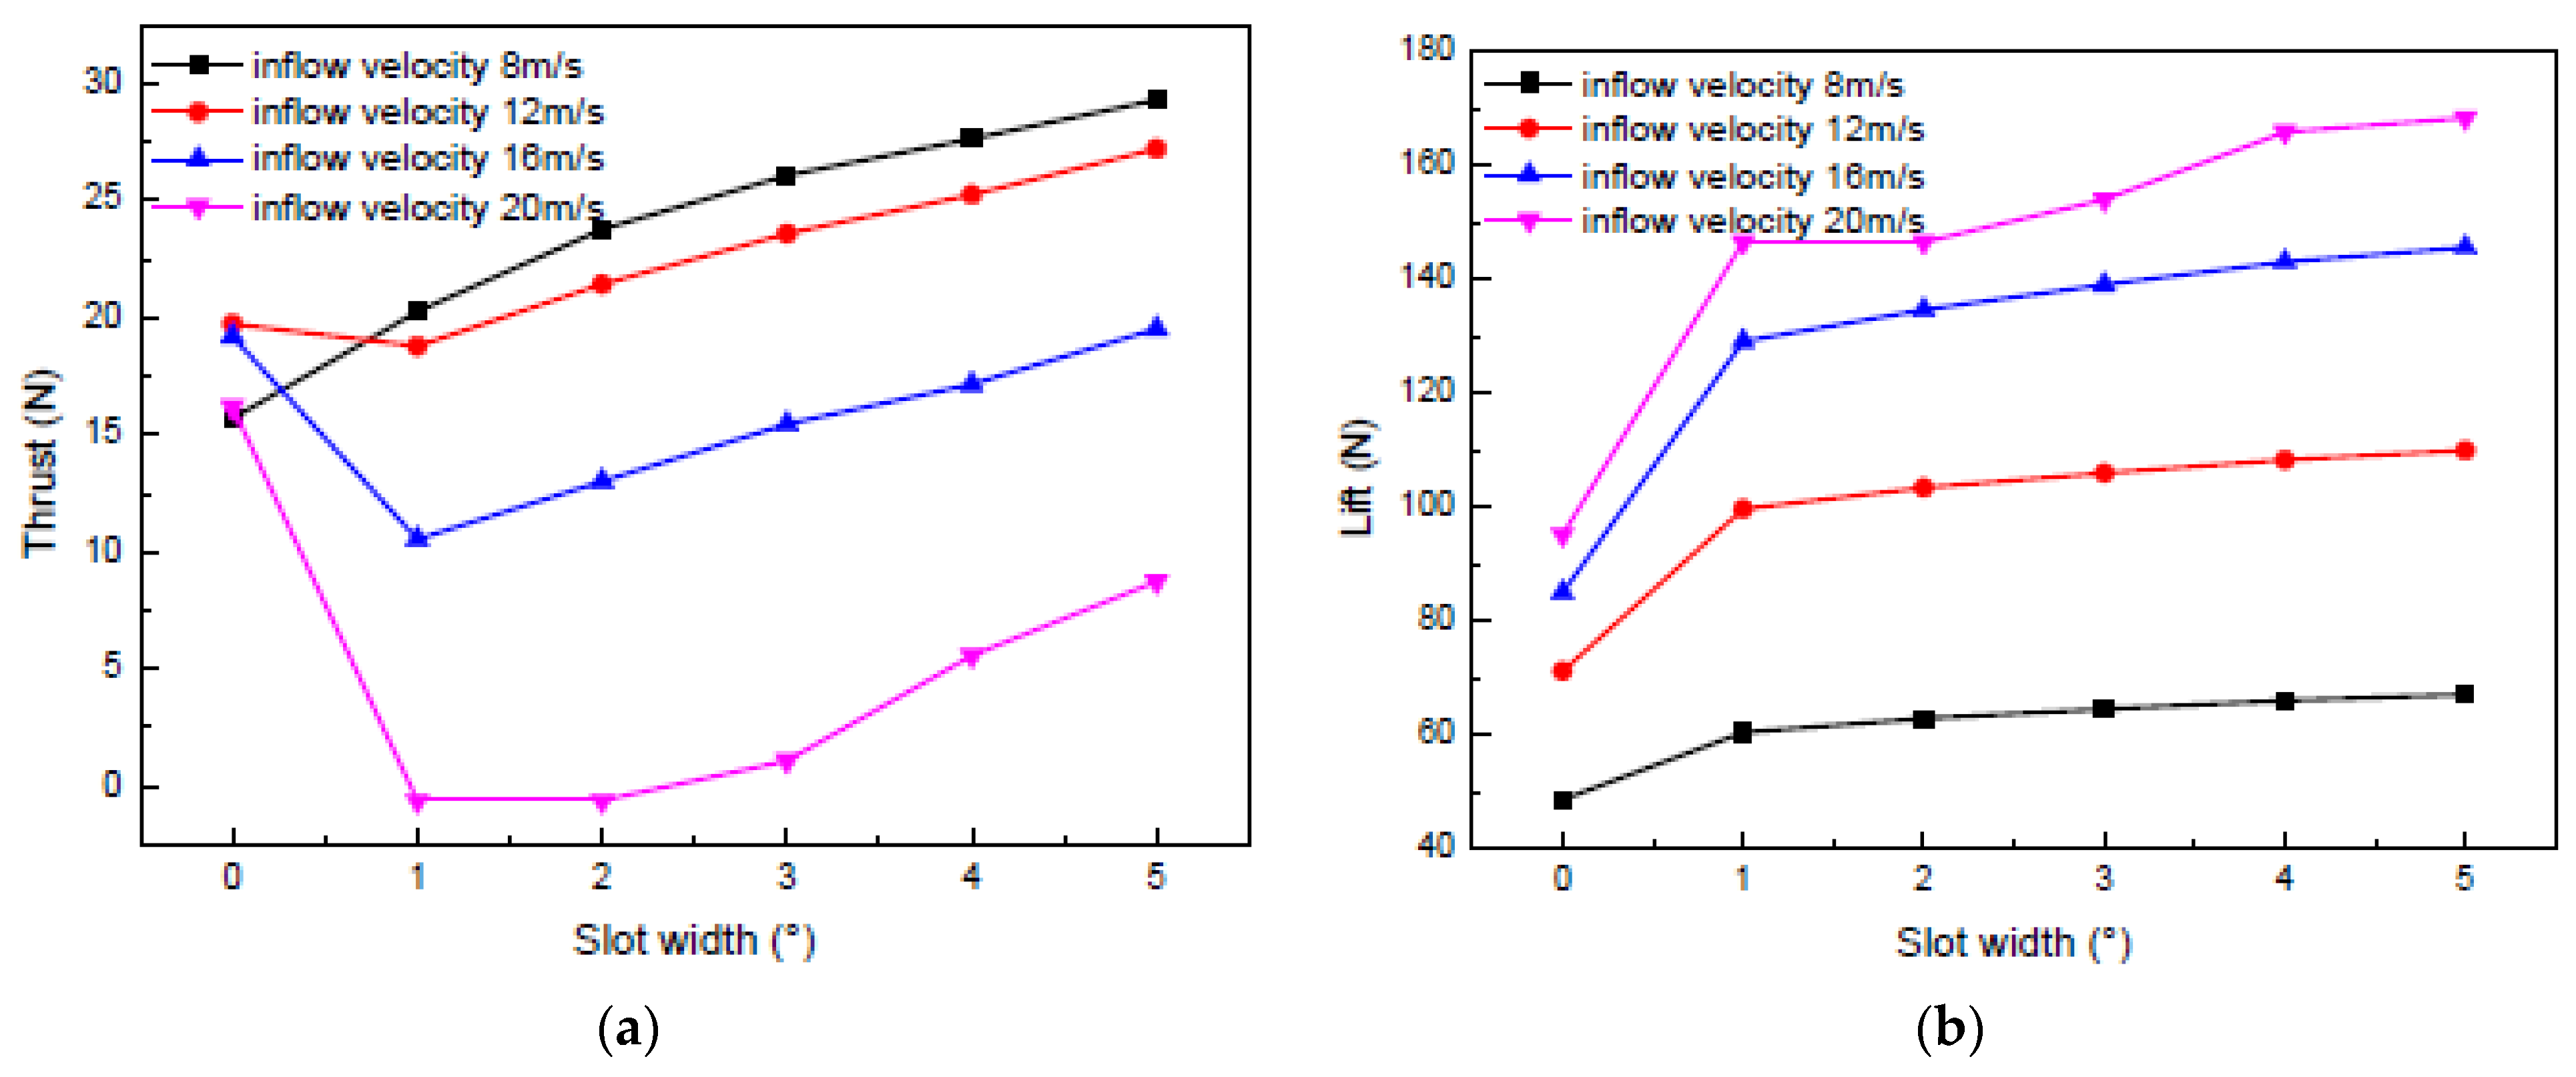
3.4.1. Effect of Slot Width on the Aerodynamic Performance of the Fan Wing
3.4.2. Effect of Number of Slots on the Aerodynamic Performance of the Fan Wing
3.4.3. Effect of Slot Position on the Aerodynamic Performance of the Fan Wing
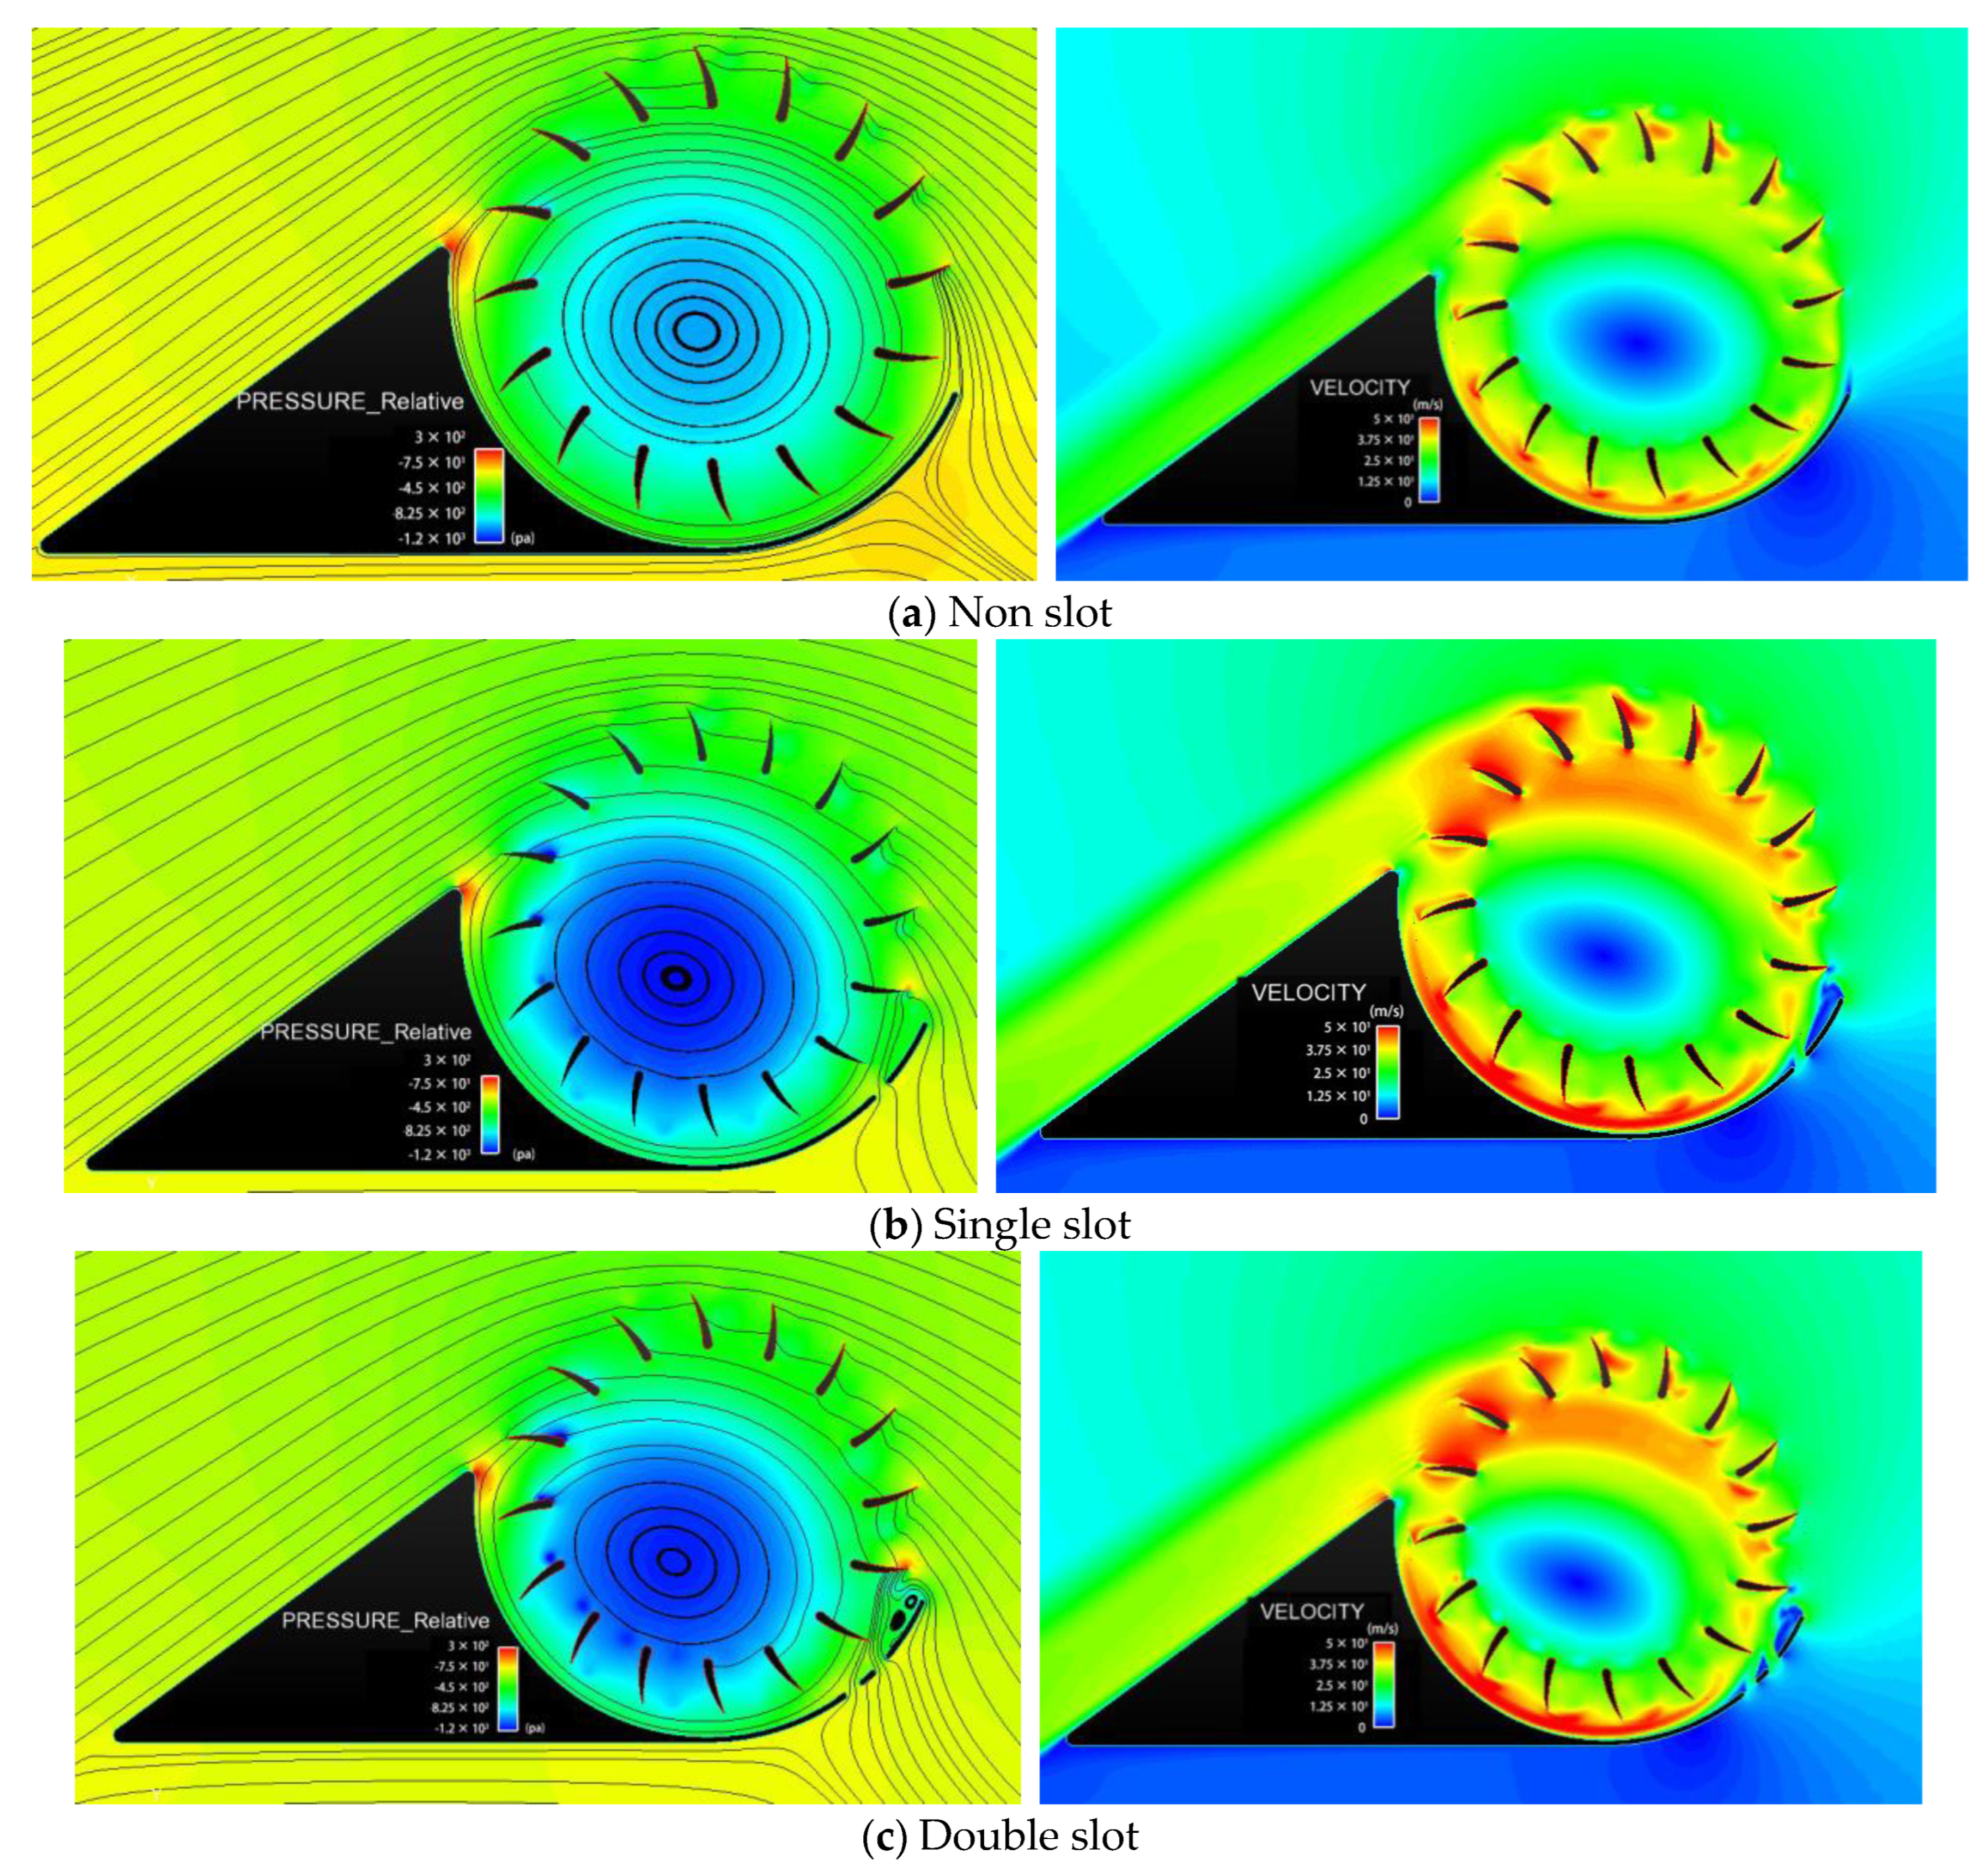
- Impact of slot position on flow field
- 2.
- Impact of slot position on lift and thrust
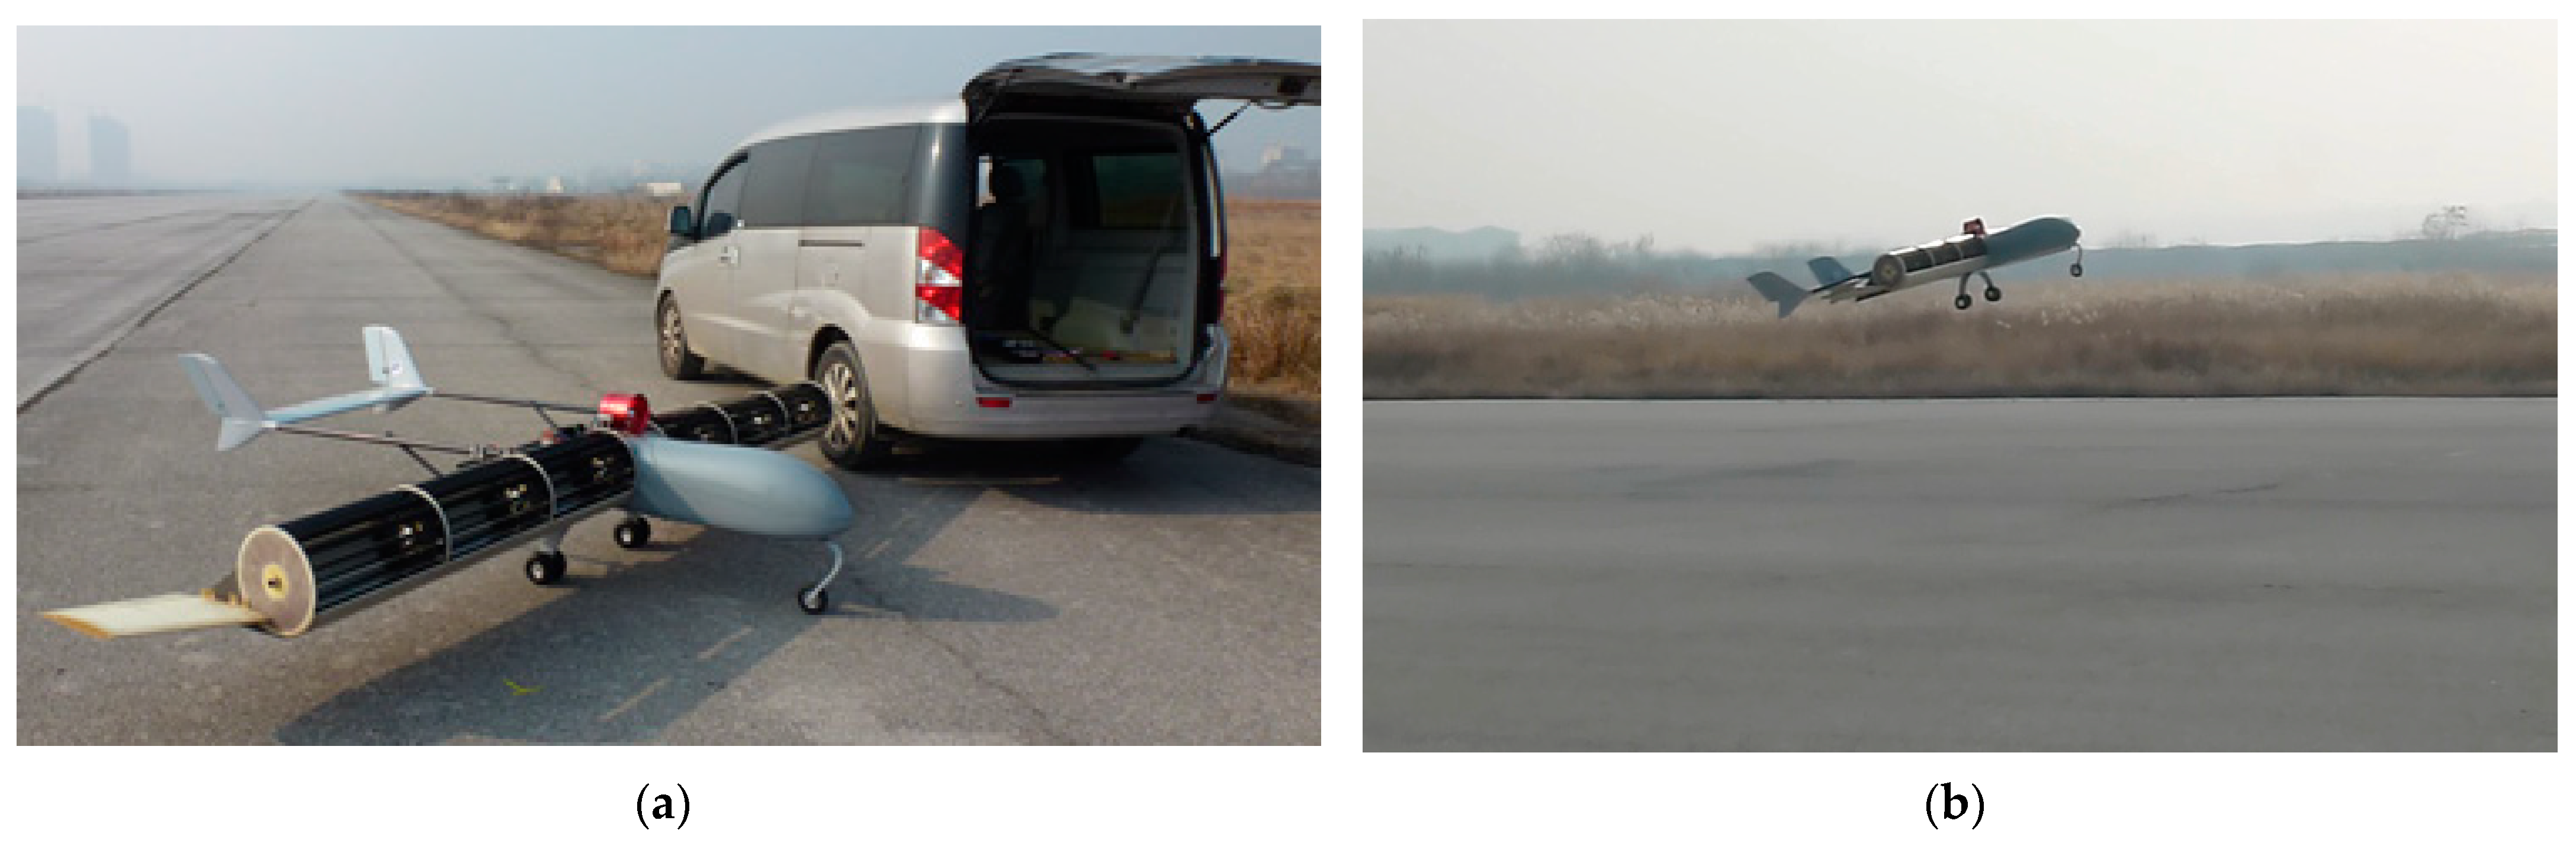
4. Flight Test
5. Conclusions and Further Discussion
5.1. Conclusions
- Improving aircraft performance: Research on Fan Wings can help improve the design and performance of aircraft, enabling them to generate lift and thrust more efficiently during flight. By optimizing the shape, size, and material of the Fan Wings, the flight speed, maneuverability, and fuel efficiency of the aircraft can be improved, thereby reducing energy consumption and environmental pollution.
- Enhancing aerodynamic theory: As a common aerodynamic device, Fan Wings are of great significance for the study of aerodynamic theory. By studying the aerodynamic characteristics and flow field distribution of Fan Wings, we can gain a deeper understanding of the basic principles of fluid dynamics and aerodynamics, providing a theoretical basis for the design and optimization of aircraft and other engineering fields.
- Promoting engineering innovation: The results of Fan Wing research can be applied to aerospace, automobile, wind power generation, and other fields, which promotes the innovation and development of engineering technology. For example, in the field of aviation, Fan Wing research can improve the takeoff and landing performance and manoeuvrability of aircraft, and improve the safety and comfort of aircraft. In the field of wind power, Fan Wing research can help optimize the design of wind turbines and improve energy efficiency.
- Expanding scientific knowledge: The study of Fan Wings is of great significance for deepening our understanding of scientific fields such as fluid dynamics and aerodynamics. By conducting experiments and numerical simulations on Fan Wings, complex fluid behavior and turbulence phenomena can be explored, providing new observational and experimental platforms for scientific research, and deepening the understanding of fluid motion laws in nature and engineering practice.
5.2. Discussion
Author Contributions
Funding
Data Availability Statement
Acknowledgments
Conflicts of Interest
References
- Meng, L.; Gao, Y.; Liu, Y.Y.; Lu, S. Take-off control and characteristics of FanWing. Aircr. Eng. Aerosp. Technol. 2022, 94, 705–714. [Google Scholar] [CrossRef]
- Meng, L.; Wang, S.; Chen, Y.; Gao, Y. Emergency Flight Control Based on the Fan Wing. Int. J. Aerosp. Eng. 2021, 2021, 1216059. [Google Scholar] [CrossRef]
- Francisc, B.; Ioan, S. New Nature-Inspired Cycloidal Propeller for Low-Reynolds-Number Hovering Flight. AIAA J. 2019, 57, 2321–9653. [Google Scholar]
- Rostami, M.; Bardin, J.; Neufeld, D.; Chung, J. EVTOL Tilt-Wing Aircraft Design under Uncertainty Using a Multidisciplinary Possibilistic Approach. Aerospace 2023, 10, 718. [Google Scholar] [CrossRef]
- Saif, A.W.A.; Aliyu, A.; Dhaifallah, M.A.; Elshafei, M. Decentralized backstepping control of a quadrotor with tilted-rotor under wind gusts. Int. J. Control. Autom. Syst. 2018, 16, 2458–2472. [Google Scholar] [CrossRef]
- Altun, A.T.; Hasanzade, M.; Saldiran, E.; Guner, G.; Uzun, M.; Fremond, R.; Tang, Y.; Bhundoo, P.; Su, Y.; Xu, Y.; et al. The Development of an Advanced Air Mobility Flight Testing and Simulation Infrastructure. Aerospace 2023, 10, 712. [Google Scholar] [CrossRef]
- Kogler, K.U. FANWING—Experimental Evaluation of an Ovel Lift & Propulsion Device. Master’s Thesis, Aeronautical Engineering Department, Imperial College, London, UK, 2002. [Google Scholar]
- Peebles, P. Aerodynamic Lift Generating Device. US Patent 527229, 4 March 2003. [Google Scholar]
- Seyfang, G.R. Fanwing—Developments and Applications. In Proceedings of the 28th Congress of International Council of the Aeronautical Sciences, ICAS, Brisbane, Australia, 23–28 September 2012; pp. 1–9. [Google Scholar]
- Seyfang, G.R. Recent Developments of the Fan-Wing Aircraft. In Proceedings of the International Conference of the European Aerospace Socoeties, CEAS, Venice, Italy, 25 October 2011; pp. 1–7. [Google Scholar]
- Foreshaw, S. Wind Tunnel Investigation of the New Fan-Wing Design; Imperial College: London, UK, 1999. [Google Scholar]
- Bayindir, H.S.; Guillermo, P. Analysis of the Flow Field around the Wing Section of a FanWing Aircraft under Various Flow Conditions. In Proceedings of the 53rd AIAA Aerospace Sciences Meeting, AIAA, Kissimmee, FL, USA, 5–9 January 2015; p. 1936. [Google Scholar]
- Askari, S.; Shojaeefard, M.H. Numerical Simulation of Flow an Airfoil with a Cross Flow Fan as a Lift Generating Member in a New Aircraft Model. Aircr. Eng. Aerosp. Technol. 2009, 81, 59–64. [Google Scholar] [CrossRef]
- Askari, S.; Shojaeefard, M.H.; Goudarzi, K. Experimental Study of Stall in an Airfoil with Forced Airflow Provided by an Integrated Cross-flow Fan. Proc. Inst. Mech. Eng. Part G J. Aerosp. Eng. 2011, 225, 97–104. [Google Scholar] [CrossRef]
- Shojaeefard, M.H.; Askari, S. Experimental and Numerical Study of the flap application an Airfoil in Combination with a Cross Flow Fan. Int. J. Numer. Methods Heat Fluid Flow 2012, 22, 742–763. [Google Scholar] [CrossRef]
- Askari, S.; Shojaeefard, M.H. Shape Optimization of the Airfoil Comprising a Cross Flow Fan. Aircr. Eng. Aerosp. Technol. 2009, 81, 407–415. [Google Scholar] [CrossRef]
- Duddempudi, D.; Yao, Y.; Edmondson, D.; Yao, J.; Curley, A. Computational study of flow over generic fan-wing airfoil. Aircr. Eng. Aerosp. Technol. 2007, 79, 238–244. [Google Scholar] [CrossRef]
- Dang, T.Q.; Bushnell, P.R. Aerodynamic of Cross-flow Fans and their Application to Aircraft Propulsion and Flow Control. Prog. Aerosp. Sci. 2008, 45, 1–29. [Google Scholar] [CrossRef]
- Kummer, J.D.; Dang, T.Q. Hight-lift Propulsive with Integrated Cross Flow Fan. J. Aircr. 2006, 43, 1059–1068. [Google Scholar] [CrossRef]
- Du, S.; Tang, Z. The aerodynamic behavioral study of tandem Fan Wing configuration. Int. J. Aerosp. Eng. 2018, 2018, 1594570. [Google Scholar] [CrossRef]
- Du, S.; Zhao, Q.; Wang, B. Research on Distributed Jet Blowing Wing Based on the Principle of Fan-Wing Vortex-Induced Lift and Thrust. Int. J. Aerosp. Eng. 2019, 2019, 7561856. [Google Scholar] [CrossRef]
- Du, S.; Zhao, Q.; Tang, Z. Numerical Simulation of the Effect of Different Number Leading Edge Winglets on the Fan-Wing Aerodynamic Characteristics. Int. J. Aerosp. Eng. 2020, 2020, 8941453. [Google Scholar] [CrossRef]


| Symbol | Part | Data |
|---|---|---|
| number of blades | 16 | |
| span | 0.5 m | |
| cross flow fan radius | 0.15 m | |
| Inner diameter of circular groove | 0.155 m | |
| Outer diameter of circular groove | 0.16 m | |
| Chord | 0.561 m | |
| Angle between rear inclined planes | 18° | |
| Leading edge opening angle | 24° | |
| Blade width | 0.036 m | |
| Cross flow fan inner diameter | 0.098 m | |
| Blade outer arc radius | 0.096 m | |
| Blade inner arc radius | 0.068 m | |
| Blade reference arc radius | 0.003 m | |
| Blade tangential angle | 36.5° | |
| Blade installation angle | 22.5° |
| Part | Data |
|---|---|
| Wind tunnel caliber (height × width) | 2.4 m × 3.4 m |
| Stable wind speed range | 5~50 m/s |
| Average airflow deviation angle | Δα ≤ ±0.1° Δβ ≤ ±0.1° |
| Turbulence | ε ≤ 0.1~0.14% |
| Velocity Field Coefficient | Δμ ≤ 0.5% |
| Part | Brand/Specification | Quantity | Parameter |
|---|---|---|---|
| Force sensor | −100~+100 kg | 5 | accuracy ±0.03% |
| Speed Sensor | 0~9999 r/min | 1 | accuracy ±0.1% |
| Data Acquisition Software | Anhui Dayang, China | 1 | 5 channels |
| Wireless data transmission module | Loar | 2 | RS232 |
| DC power | Agilent N8900 | 1 | accuracy ±0.1% |
| Brushless DC motor | HACKER | 1 | 50 V 10 KW |
| Electronic speed control | HACKER | 1 | 50 V 220 A |
| Particle Image Velocimetry | LaVison PIV | 1 | accuracy RMS < 0.04 |
| Parameters | Data |
|---|---|
| Rotation speed (r/min) | 750, 1000, 1250, 1500, 1750, 2000 |
| Incoming flow velocity (m/s) | 0, 5, 7.5, 10, 12.5, 15, 17.5, 20 |
| Angle of attack (°) | −10, −5, 0, +5, +10, +15, +20, +25, +30 |
Disclaimer/Publisher’s Note: The statements, opinions and data contained in all publications are solely those of the individual author(s) and contributor(s) and not of MDPI and/or the editor(s). MDPI and/or the editor(s) disclaim responsibility for any injury to people or property resulting from any ideas, methods, instructions or products referred to in the content. |
© 2024 by the authors. Licensee MDPI, Basel, Switzerland. This article is an open access article distributed under the terms and conditions of the Creative Commons Attribution (CC BY) license (https://creativecommons.org/licenses/by/4.0/).
Share and Cite
Du, S.; Zha, Y.; Zhao, Q. Research on Aerodynamic Test Validation and the Vector Force Control Method for an E-STOL Fan Wing Unmanned Aerial Vehicle. Aerospace 2024, 11, 55. https://doi.org/10.3390/aerospace11010055
Du S, Zha Y, Zhao Q. Research on Aerodynamic Test Validation and the Vector Force Control Method for an E-STOL Fan Wing Unmanned Aerial Vehicle. Aerospace. 2024; 11(1):55. https://doi.org/10.3390/aerospace11010055
Chicago/Turabian StyleDu, Siliang, Yi Zha, and Qijun Zhao. 2024. "Research on Aerodynamic Test Validation and the Vector Force Control Method for an E-STOL Fan Wing Unmanned Aerial Vehicle" Aerospace 11, no. 1: 55. https://doi.org/10.3390/aerospace11010055