Article

Integrating Life Cycle Assessment in Conceptual Aircraft Design: A Comparative Tool Analysis

Chair of Aircraft Design, Technical University of Munich, 85748 Garching, Germany
*
Author to whom correspondence should be addressed.
Aerospace 2024, 11(1), 101; https://doi.org/10.3390/aerospace11010101
Submission received: 29 November 2023 / Revised: 8 January 2024 / Accepted: 9 January 2024 / Published: 22 January 2024
(This article belongs to the Special Issue Aircraft Life Cycle Assessment)

Abstract

:
Early and rapid environmental assessment of newly developed aircraft concepts is eminent in today’s climate debate. This can shorten the decision-making process and thus accelerate the entry into service of climate-friendly technologies. A holistic approach within the conceptual aircraft design is taken into consideration in terms of a life cycle assessment (LCA) to properly model and evaluate these concepts. To provide an understanding of how different LCA software affects the assessment, the goals of this study are to establish a baseline metrics definition for comparative evaluation and apply them to two tools. The first tool is an existing simplified derivative of openLCA, while the second, developed in this study, is an automated interface to the same software. The main finding is that researchers and practitioners must carefully consider the intended use of the tool. The simplified tool is suitable for training and teaching purposes and assessments on single score level. In contrast, an advanced tool is required in order to appropriately analyze the overall impact categories requiring high levels of LCA expertise, modeling, and time effort.

1. Introduction

As the climate debate becomes more prominent in governments and the general public worldwide, research institutions and industries are focusing increasingly on novel ways of assessing the environmental impact of their research topics or products. The aviation industry is no exception to this. While the sector is characterized by steady demand and continually increasing air traffic on the one hand, on the other, it has the highest average greenhouse gas emission contribution per passenger kilometer among the motorized modes of passenger transport (EU-27, 2014–2018 [1]). Additionally, aviation is known for its lengthy development cycle and production process for new configurations. Furthermore, new measures like using hydrogen as a propellant, switching to sustainable aviation fuels, or enhancing airport infrastructure are now being discussed, and require an early environmental impact analysis [2]. This leads to the conclusion that an assessment in the early stage of aircraft design is needed to accomplish the climate targets in the near future. To appropriately model and assess these measures, a holistic approach in terms of a life cycle assessment (LCA) within the conceptual aircraft design is considered.
The methodological foundation of performing a LCA was laid out in the 1990s within the standards ISO 14040 [3] and ISO 14044 [4]. Within these norms, e.g., specific terms are defined, and the general procedure for performing a LCA is explained. Several aircraft assessments have been conducted in accordance with it; however, they exhibit substantial discrepancies in the implementation with respect to the used data, software, and methodology and are therefore comparable only to a limited extent [5,6,7,8]. These discrepancies are also visible across industries. To cope with that, initiatives such as the Life Cycle Initiative hosted by the UN Environmental Programme are currently extending the guidelines globally. The Global Guidance on Environmental Life Cycle Impact Assessment Indicators (GLAM) [9] and the Global LCA Data Access (GLAD) [10] projects aim to, e.g., enhance global consensus on environmental life cycle impact assessment indicators and improve data accessibility and interoperability. These projects aim to eliminate the discrepancies related to the assessment methodology and data. However, there are currently no projects focusing on establishing a guideline for the implementation of and data handling in tools and software itself [11] (According to the FAQ of GLAD, it is a long-term goal and part of the vision to easily import GLAD data to LCA software. However, this is not the case at the moment. Eventually, GLAD should be interoperable with LCA software, perhaps even with access to the database integrated into LCA software tools).
To understand what impact the use of different software can have, this work focuses on the comparative analysis of two LCA tools within the conceptual aircraft design. For that, a methodology is defined, including relevant qualitative and quantitative metrics, e.g., the software robustness or the environmental indicators. Hence, the first research question is:
RQ1: 
What qualitative and quantitative metrics are relevant when comparing different LCA software within the conceptual aircraft design?
The first LCA application used in the analysis was developed by Johanning [12]. The tool, named LCA-AD or simplified tool, is an open-source tool derived from the LCA software openLCA. It focuses explicitly on comparing potential future concepts, such as hydrogen or electric-powered aircraft. Kossarev et al. [13] have updated the tool with a more current impact assessment method, improved it with a new climate model, and bug-fixed it. The second LCA application, named openLCA-AD or advanced tool, was developed within this study and establishes a direct linkage to the previously utilized openLCA software. With that, it is aimed to answer the second research question:
RQ2: 
To what extent do different tools affect the assessment of the environmental footprint of future aircraft designs?
To address the research questions, this paper is structured as follows: Section 2 covers the fundamental aspects of life cycle assessment. It begins with a description of the general working principle of a LCA, and proceeds with an overview of current LCA software. Then, LCA is explained with respect to the use case of the conceptual aircraft design. It is followed by a review of previous aircraft LCA studies with a focus on their used software, including a detailed explanation of the simplified LCA-AD tool by Johanning [12]. Section 3 then explores the applied software evaluation methodology of this work. It defines the general assumptions and limitations and refers to the RQ1 establishing metrics the tools are compared with. In Section 4, the implementation of the second tool openLCA-AD as an advanced automated LCA interface is presented. With this knowledge, Section 5 provides the LCA results and its discussion in relation to the defined metrics. Thus, the effect of different LCA tools is evaluated to answer RQ2. Lastly, Section 6 concludes the findings. The main objectives in this are summarized as:
  • A baseline metric definition for comparative evaluation of LCA tools;
  • Development and implementation of the automated LCA interface openLCA-AD;
  • Evaluation of the simplified LCA-AD versus advanced openLCA-AD tools.

2. Fundamentals

2.1. LCA in General

Environmental life cycle assessments are used to examine how activities and products affect the environment throughout their entire lives. ISO 14040 [3] is the foundational standard, outlining the principles and framework for conducting LCA. ISO 14044 [
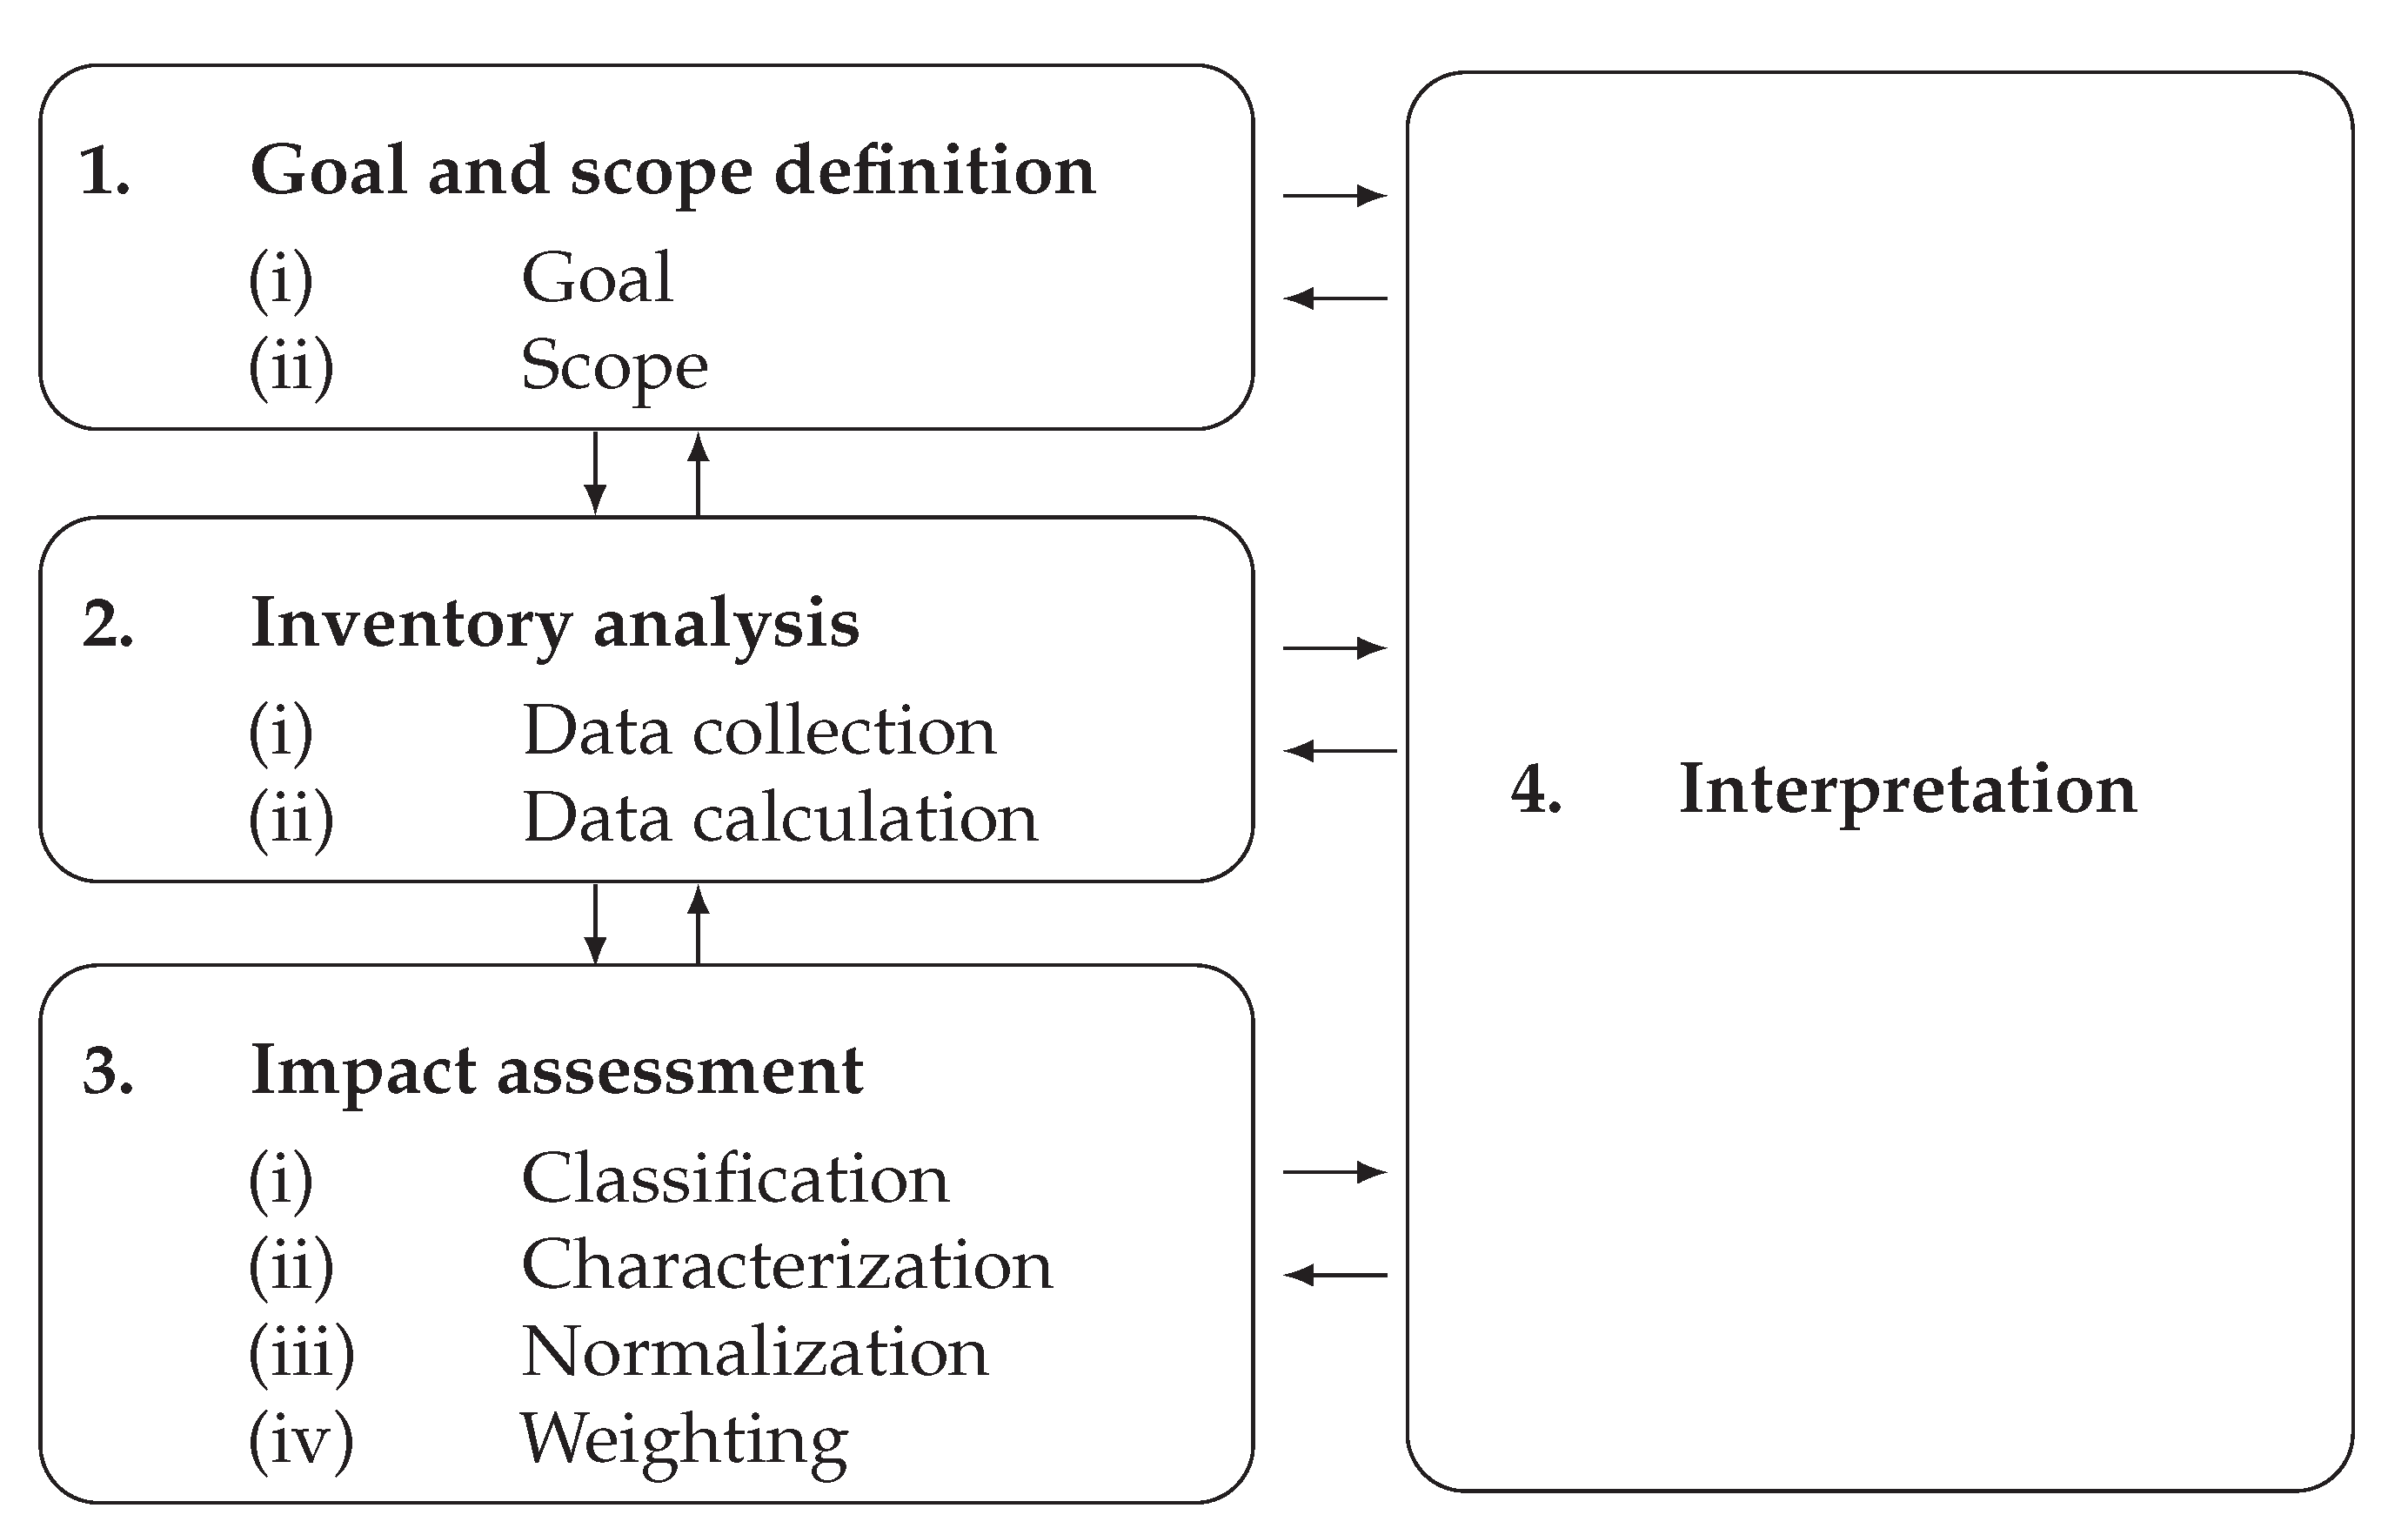
4] provides detailed requirements and guidelines for performing LCA studies, including practical recommendations for data collection, impact assessment, and reporting. There are four phases: (A) goal and scope definition, (B) inventory analysis, (C) impact assessment, and (D) interpretation, as shown in Figure 1.
In the following, information relevant to the LCA software and its evaluation will be provided. First, additional information on each of the phases shown in Figure 1 is given. Then, a general distinction between two LCA approaches is explained.
The goal and scope definition comprises the intended application and the reasons for the implementation. Among others, a unit is established, the so-called functional unit, which defines the product’s performance in a quantity. Additionally, system boundaries are defined. The life cycle ideally refers to the entire lifetime known as cradle-to-grave, but can also be narrowed down to cradle-to-gate, gate-to-gate, or gate-to-grave [3,4].
Inputs and outputs (also referred to as “resources and emissions”) that occur during the life cycle of the process or product system are quantified in an inventory analysis, also known as life cycle inventory analysis (LCI). An inventory can be set up based on the literature, laboratory test data, industry knowledge from, e.g., the production chain, or electronic databases. Examples of electronic databases are the European Reference Life Cycle Database (ELCD) [14] (which has been discontinued as of the 29 June 2018) and the database from ecoinvent [15], which is partially freely available at the open access database by GLAD [
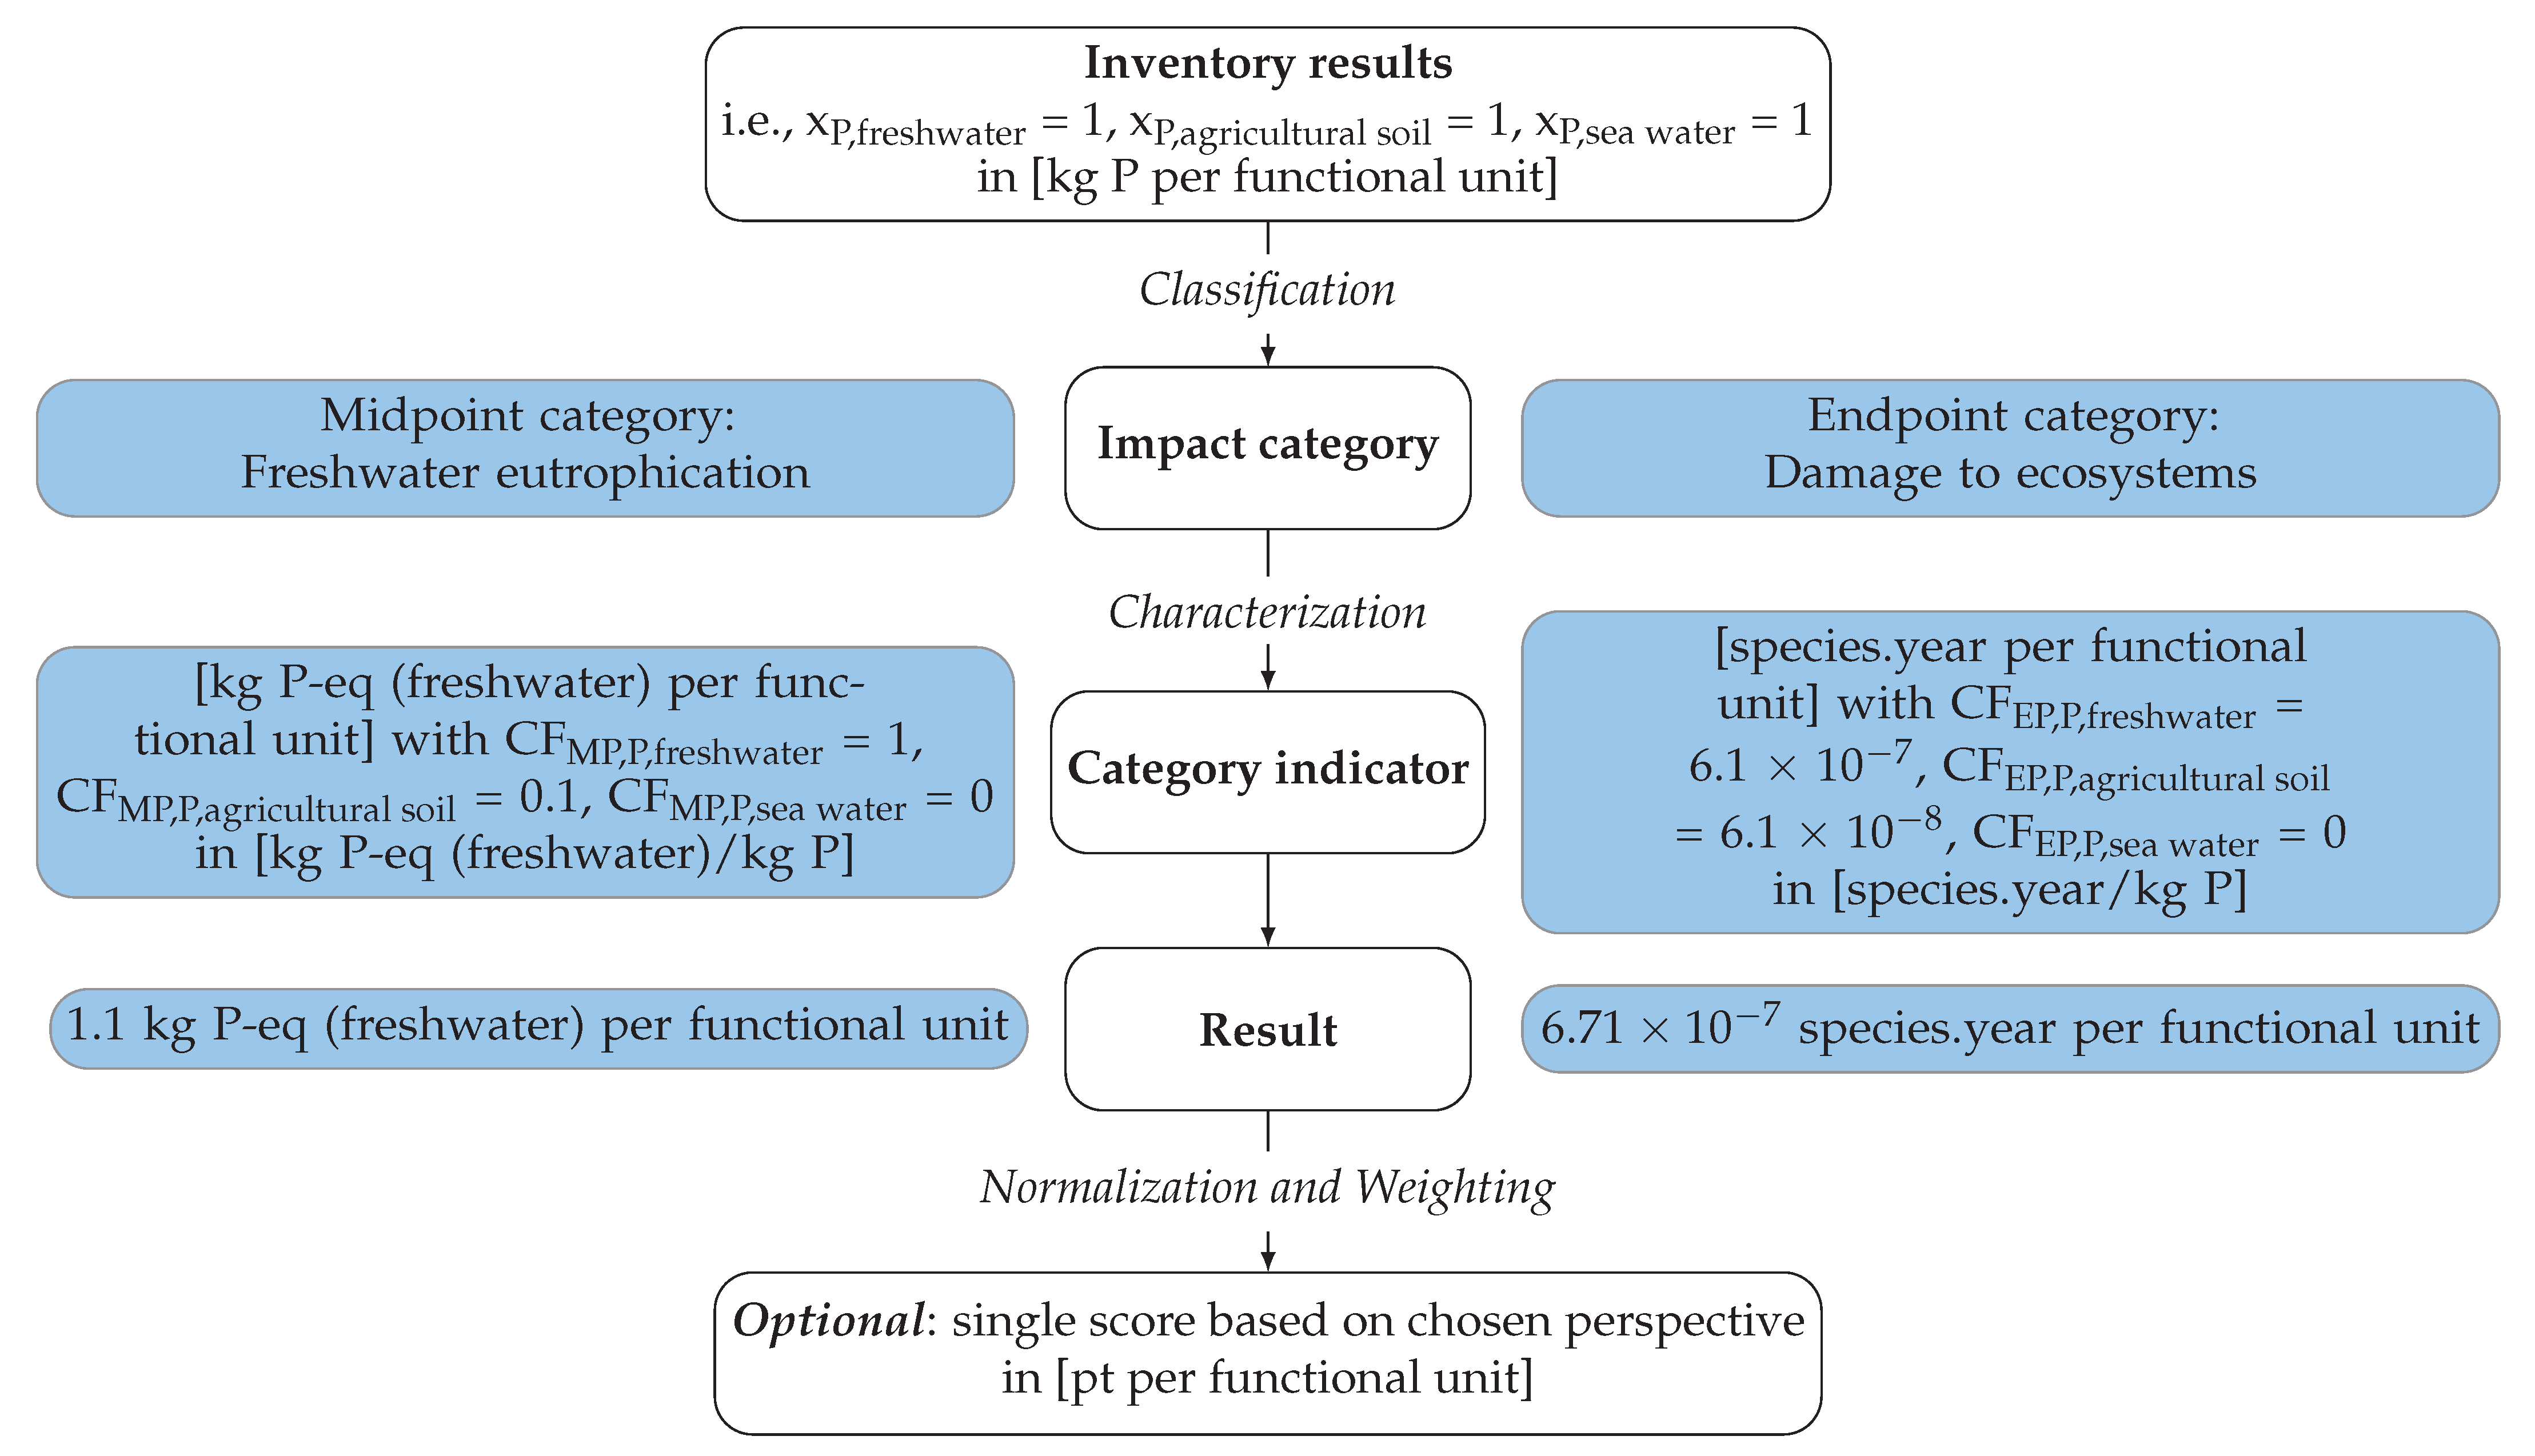
10]. The high level of detail that characterizes these electronic databases needs to be highlighted. In these databases, flows are subdivided into so-called compartments (e.g., emission “to water”, “to soil” or “to air”) and sub-compartments (e.g., “freshwater” or “sea water”). The resulting impact can vary depending on how the flow is used. To show the effect on the assessment, an example is given at the end of the section in Figure 2.
In the impact assessment, also known as life cycle impact assessment (LCIA), the magnitude and significance of the LCI are evaluated based on characterization factors. Different LCIA methodologies, such as ReCiPe [16], or Eco-Indicator 99 [17], use various impact assessment models and assessment factors to quantify the potential impacts [18]. In the following, ReCiPe will be explained exemplary (more details in [13]). The ReCiPe method is a combined mid- and endpoint category model. Midpoint categories represent indicators that measure specific environmental stressors, such as “climate change” (also known as Global Warming Potential (GWP)). It quantifies the emissions of greenhouse gases in g C O 2 -equivalent. Whereas midpoints are closer defined to the emission itself, the endpoint categories express the impact as societal damage, such as the three areas of protection of human health, ecosystem quality, and resource scarcity. Endpoints are more comprehensible, e.g., the damage to ecosystems is measured in loss of species in a year ([species.year]). They make LCA results more accessible to decision-makers and the public, but are also more subject to assumptions and uncertainties. To handle these uncertainties, ReCiPe offers different perspectives (individualist, egalitarian, and hierarchist) and regions (Europe and world), which affect the factor of characterization (conversion of in- or outputs to impact indicators), normalization (e.g., the region’s population) and weighting (e.g., the perspective’s time frame) within the calculation.
The ReCiPe method also provides the option of a single score, which represents the impact information in one metric often used to compare the overall environmental performance of different products with each other. This idea originated from the concept of Wagernagel and Rees and the “ecological footprint” [19]. This is an indicator that measures the ecological resources and services required to support a specific human activity or the production of a product. This idea was taken up again in the development of the Eco-Indicator 99 [17], which resulted in the indicator later known as single score in units Eco-Indicator-Points (pt).
To understand how the inventory and its assessment are computed, Figure 2 visualizes the different steps of an imaginary product. It focuses on highlighting the previously mentioned complexity, e.g., the compartments, whereas the mathematical description can be found in [13].
As shown in the figure, it is assumed that in the inventory, 1 kg of phosphorus is emitted into freshwater, 1 kg into agricultural soil, and 1 kg into sea water. These emissions are classified as affecting the freshwater eutrophication (midpoint category) and damaging the ecosystems (endpoint category). To evaluate the emissions, they have to be characterized by indicators: kg P-eq (freshwater) for the midpoint and species.year for the endpoint. The characterization factors C F are used to summarize the emissions in these indicators, e.g., the midpoint CF for emitting to the sea water is 0 and, therefore, assumed to have no environmental impact. If the factors are multiplied by the emissions and then added together, the results are obtained. It is optional to weigh and normalize the results in order to calculate the single score.
As previously mentioned, these steps align with ISO 14040 and 14044 standards. Two distinct approaches are considered for completeness: process-based LCA (traditional ISO) and Economic Input-Output LCA (EIO-LCA). The traditional approach adopts a bottom-up methodology, dissecting the product’s life cycle into individual stages. For example, in the process-LCA of making a sandwich, each step, from ingredient cultivation and transportation to assembly and waste management, is examined, enhancing accuracy but requiring extensive data collection. Conversely, EIO-LCA is a simpler methodology, calculating energy, material resources, and associated greenhouse gas emissions for economic activity. In the sandwich example, EIO-LCA views the product as an economic activity, focusing on economic transactions, such as ingredient purchase, and considering the entire supply chain, encompassing entities like bakeries and wheat farms involved in bread production.

2.2. Current LCA Software and Tools

A LCA can be carried out with a variety of software and tools. The most commonly used process-based LCA software and tools are listed and evaluated in Table 1. The following categories used in the table base on Bach and Hildebrand [20]:
  • Origin, including the country, developer, and year of publication, provides background information and indicates the relevance;
  • Required user knowledge implies the degree of editable pre-settings for the user, while e.g., for a researcher, a significant degree of flexibility is desired, the goal in teaching is to demonstrate the basic concept;
  • Documentation and tutorials highlights which tools provide sufficient material to use the software;
  • Accessibility distinguishes between free, conditional (e.g., free for educational and paid for professional use), and paid access;
  • Data source shows whether the software is open for imports or has a predefined database;
  • LCIA methods implies the degree of flexibility with respect to importing different assessment methods;
  • Sensitivity analysis shows whether uncertainties can be analyzed;
  • API integration and model customization refers to possible Application Programming Interfaces (API) and manual adaption of models (such as LCIA) to customize the processing of data.
Five tools are compared in Table 1. SimaPro is a comprehensive LCA software known for its user-friendly interface and extensive database of life cycle inventory data. It offers various impact assessment methods and suits users looking for a versatile and well-supported LCA tool. LCA for Experts (formerly GaBi) is a powerful LCA software that provides access to a comprehensive database of life cycle data and is known for robust modeling capabilities. openLCA is an open-source LCA software known for its flexibility and customization options. It offers a wide range of impact assessment methods. It is suitable for users who prefer a free and open platform that can adapt and extend its functionality to meet specific project needs. Brightway2 is a newer flexible open-source LCA software that stands out for its strong emphasis on customization and adaptability. It provides a Python-based platform for users who want to create customized LCA workflows, integrate with external systems, and perform advanced analyses. It is a powerful choice for users with coding skills and specific project requirements. LCA-AD is an open-source tool specifically designed to evaluate aircraft designs. Details are given in Section 2.4. Not considered tools within this study are, e.g., Umberto [25] and CMLCA [26].
Studies show that these tools can generate different results for the same product system, as mentioned in Section 1. Whereas there are, to the author’s knowledge, no comparative tool assessments in the aviation context, studies were conducted relating generalized processes, or specific products. Herrmann and Moltesen [5] compared the outputs from 100 unit processes for SimaPro and GaBi. They concluded that while the results in many cases are the same, in others, they show discrepancies that may affect the interpretation provided by the LCA study. Speck et al. [27] studied SimaPro and GaBi as well, and assessed four basic material production and disposal processes for three different LCIAs with a total of 42 categories. They reported that half of these categories show at least a ± 20 % discrepancy for one material. Additionally, the material’s ranking (high vs. low environmental impact) shifted for one category. Bach et al. [20,28] compared different LCA software for the building sector but focused on a qualitative assessment. Emami et al. [29] assessed SimaPro and GaBi for two buildings and supports the before-mentioned findings that the tool choice affects the LCA interpretation. Lopes Silva et al. [6] compared SimaPro, GaBi, Umberto, and openLCA. The researchers conducted a comparative study using a standard case study of particleboard production in Brazil. They analyzed the inventory flows, characterized and normalized impact potentials, and compared the results across the different software tools. The findings show that, in general, the impact results were similar for most impact categories across the software tools. However, there were variations in impact values for the photochemical oxidant formation and freshwater ecotoxicity categories. Additionally, the analysis of the characterization factors used by each software tool revealed several differences. Some software tools had missing CFs, additional CFs, or different CFs for the same flows. These discrepancies contributed to the differences observed in the impact results. Miranda Xicotencatl et al. [30] analyzed the effect of LCI database versions and software choice (Brightway and CMLCA). They tested the hypothesis of whether the same data and modeling yield the same result on the example a of permanent magnet. They found out that the percentage difference between the tools can be below 0.4 % if the inventory-LCIA linkage is correctly implemented.

2.3. Challenges of LCA in Aviation and Aircraft Design

In addition to the general overview given in Section 2.1, this section focuses on highlighting the challenges of LCA in the aviation sector and the conceptual aircraft design.
The first challenge is the multidisciplinarity. In the systematic literature review of Pinheiro Melo et al. [7], aviation’s life cycle is presented based on three systems: (1) the aircraft, (2) the infrastructure, and (3) the fuel life cycle. They all include phases of resource extraction, manufacturing/construction/production, the operation and maintenance of the system, and its end-of-life. Even though these systems could be assessed separately, they are highly connected. Evaluating new technologies might shift, e.g., the relevance of the aircraft’s operating phase to the fuel production [13].
Assessing future technologies leads to another difficulty. Due to the wide range of technical parameter variations and temporal and geographical variability, they are characterized by a high degree of uncertainty, e.g., the effects of future aircraft systems may be influenced by regional variations in the electricity mix or the utilized materials. It is possible for a component to be manufactured in one country and have some of its raw materials imported from another [7].
Another challenge is the often inaccessible data. The systematic literature review of Keiser et al. [8] examined, among others, the data used for LCA conducted in the aviation domain and highlighted its limitations [8]. 64 % of the authors consult scientific literature, while 47 % also use the electronic database of ecoinvent.
Finally, the special nature of flying at different altitudes should be mentioned. Current impact assessments characterize emissions based on emissions close to sea level. However, this does not take into account the climate impact that results from flying at different altitudes causing non- C O 2 emissions such as NO x , water vapor, and soot, as well as the cloud or contrail formation. In order to consider the non- C O 2 effects and altitude dependency, climate models can be integrated into the assessment (e.g., [31]). However, it should be noted that they are subjected to a low degree of confidence [32].

2.4. Previous Aircraft LCA Work

To provide a comprehensive overview of LCA in aviation, Keiser et al. [8] conducted a systematic literature review to identify the state-of-the-art and common approaches to aircraft LCA [8]. A total of 45 publications are analyzed qualitatively, covering a wide range of research areas within the aviation industry, including energy-efficient aircraft design, optimizing aircraft ground operations and facilities, sustainable aircraft production, and more (119 are analyzed quantitatively, including the new aircraft fuel development studies, which are already reviewed in [7]). The results show that 23 studies focus on the design of energy-efficient aircraft, especially the research of fiber composite materials (19 studies). Additionally, the following topics are discussed in detail: (1) what aircraft components are studied; (2) which functional units are used; (3) which system boundaries are defined; (4) which data sources, impact assessment methods, and software tools are utilized; (5) what environmental indicator is used; and (6) how the studies document their LCA approach.
Of interest in this study are the functional units, LCIAs, the used software, and environmental indicators. Firstly, the unit “passenger kilometer (PKM)” is, according to the analysis, considered to be appropriate for the entire aircraft operation. Regarding the LCIA, it is to be highlighted that 31 % of the studies do not report any impact assessment method. Besides that, the dominant estimation method is ReCiPe, used by 27 % of the authors, followed by Eco-Indicator 99 with 11 % . Furthermore, minor details about the software or tool being used are provided. In general, it is reported that 64 % of the papers use LCA software. At 36 % , SimaPro is the most commonly used (e.g., [33,34]), followed by GaBi (e.g., [35]) and OpenLCA (e.g., [36,37]) at 14 % each. In total, 20 % of the studies use simplified methods, such as EIO-LCA [38] (e.g., [39]) or Greenhouse Gases, Regulated Emissions, and Energy Use in Transportation (GREET) [40]. One study uses its own developed tool (the Eco-Efficiency-Assessment-Model by DLR [41]), and for the remaining studies, no accounting software or tools were provided. Lastly, an analysis is conducted on environmental indicators. In total, 87 % correspond to the midpoint categories, whereas 82 % relate to the “climate change” category. The “photochemical oxidant formation” (commonly referred to as summer smog), “resource depletion”, “acidification”, and “human toxicity” are also usually taken into account. In addition, the endpoint categories are also determined by 27 % of the analyzed literature. The review makes no note of the single score.
A few additional studies are worth mentioning. One of these studies is from Rahn et al. [42,43]. To eliminate simplification, such as considering flight hours as an average per year or neglecting maintenance events, they suggest a discrete-event simulation combined with LCA [42]. In a more recent publication [43], the authors analyze different dynamization methods to allow detailed consideration of temporal and spatial variations. An application case is, e.g., the altitude-dependency operating an aircraft, which, therefore, requires dynamic characterization.
Furthermore, Johanning’s study [12] should be highlighted, as this tool serves as a baseline within this study. He aimed to build a simple and comprehensive connection between LCA and aircraft design. The Microsoft Excel tool LCA-AD containing the model is open-source [44], as well as its updated version as MATLAB scripts [13]. The tool is limited to up to 13 inputs (e.g., number of seats, operating aircraft empty weight, including default values) assessing aircraft powered by kerosene, sustainable aviation fuels, hydrogen, or battery-electric. The used functional unit is PKM, and the data bases on a mix of literature and ELCD data. ReCiPe is used as LCIA, which calculates mid- and endpoint categories, as well as the single score. A process-based LCA approach is used including a cradle-to-grave system boundary. His assumptions are the following:
  • Goal and scope definition: environmental impact of a short-range passenger aircraft (A320-200 like), openLCA 1.4.1 as LCA software with following processes:
    -
    Design and development: computer usage, wind tunnel tests, flight test campaign;
    -
    Production: use of production facilities, material production;
    -
    Operation: energy generation and consumption at airports, ground handling at airports, and either:
    *
    For kerosene, sustainable aviation fuel, or hydrogen-powered aircraft: fuel production, cruise flight, landing, and take-off cycle;
    *
    For battery-powered aircraft: battery production, battery charging;
    -
    End-of-life: reuse.
  • Inventory analysis: ELCD 3.0 database;
  • Impact assessment: ReCiPe 2008 (was updated to ReCiPe 2016 with [13]) & altitude-dependent linear climate model;
  • Interpretation: based on the single score (assumptions: hierarchist perspective with average weighting and region world).
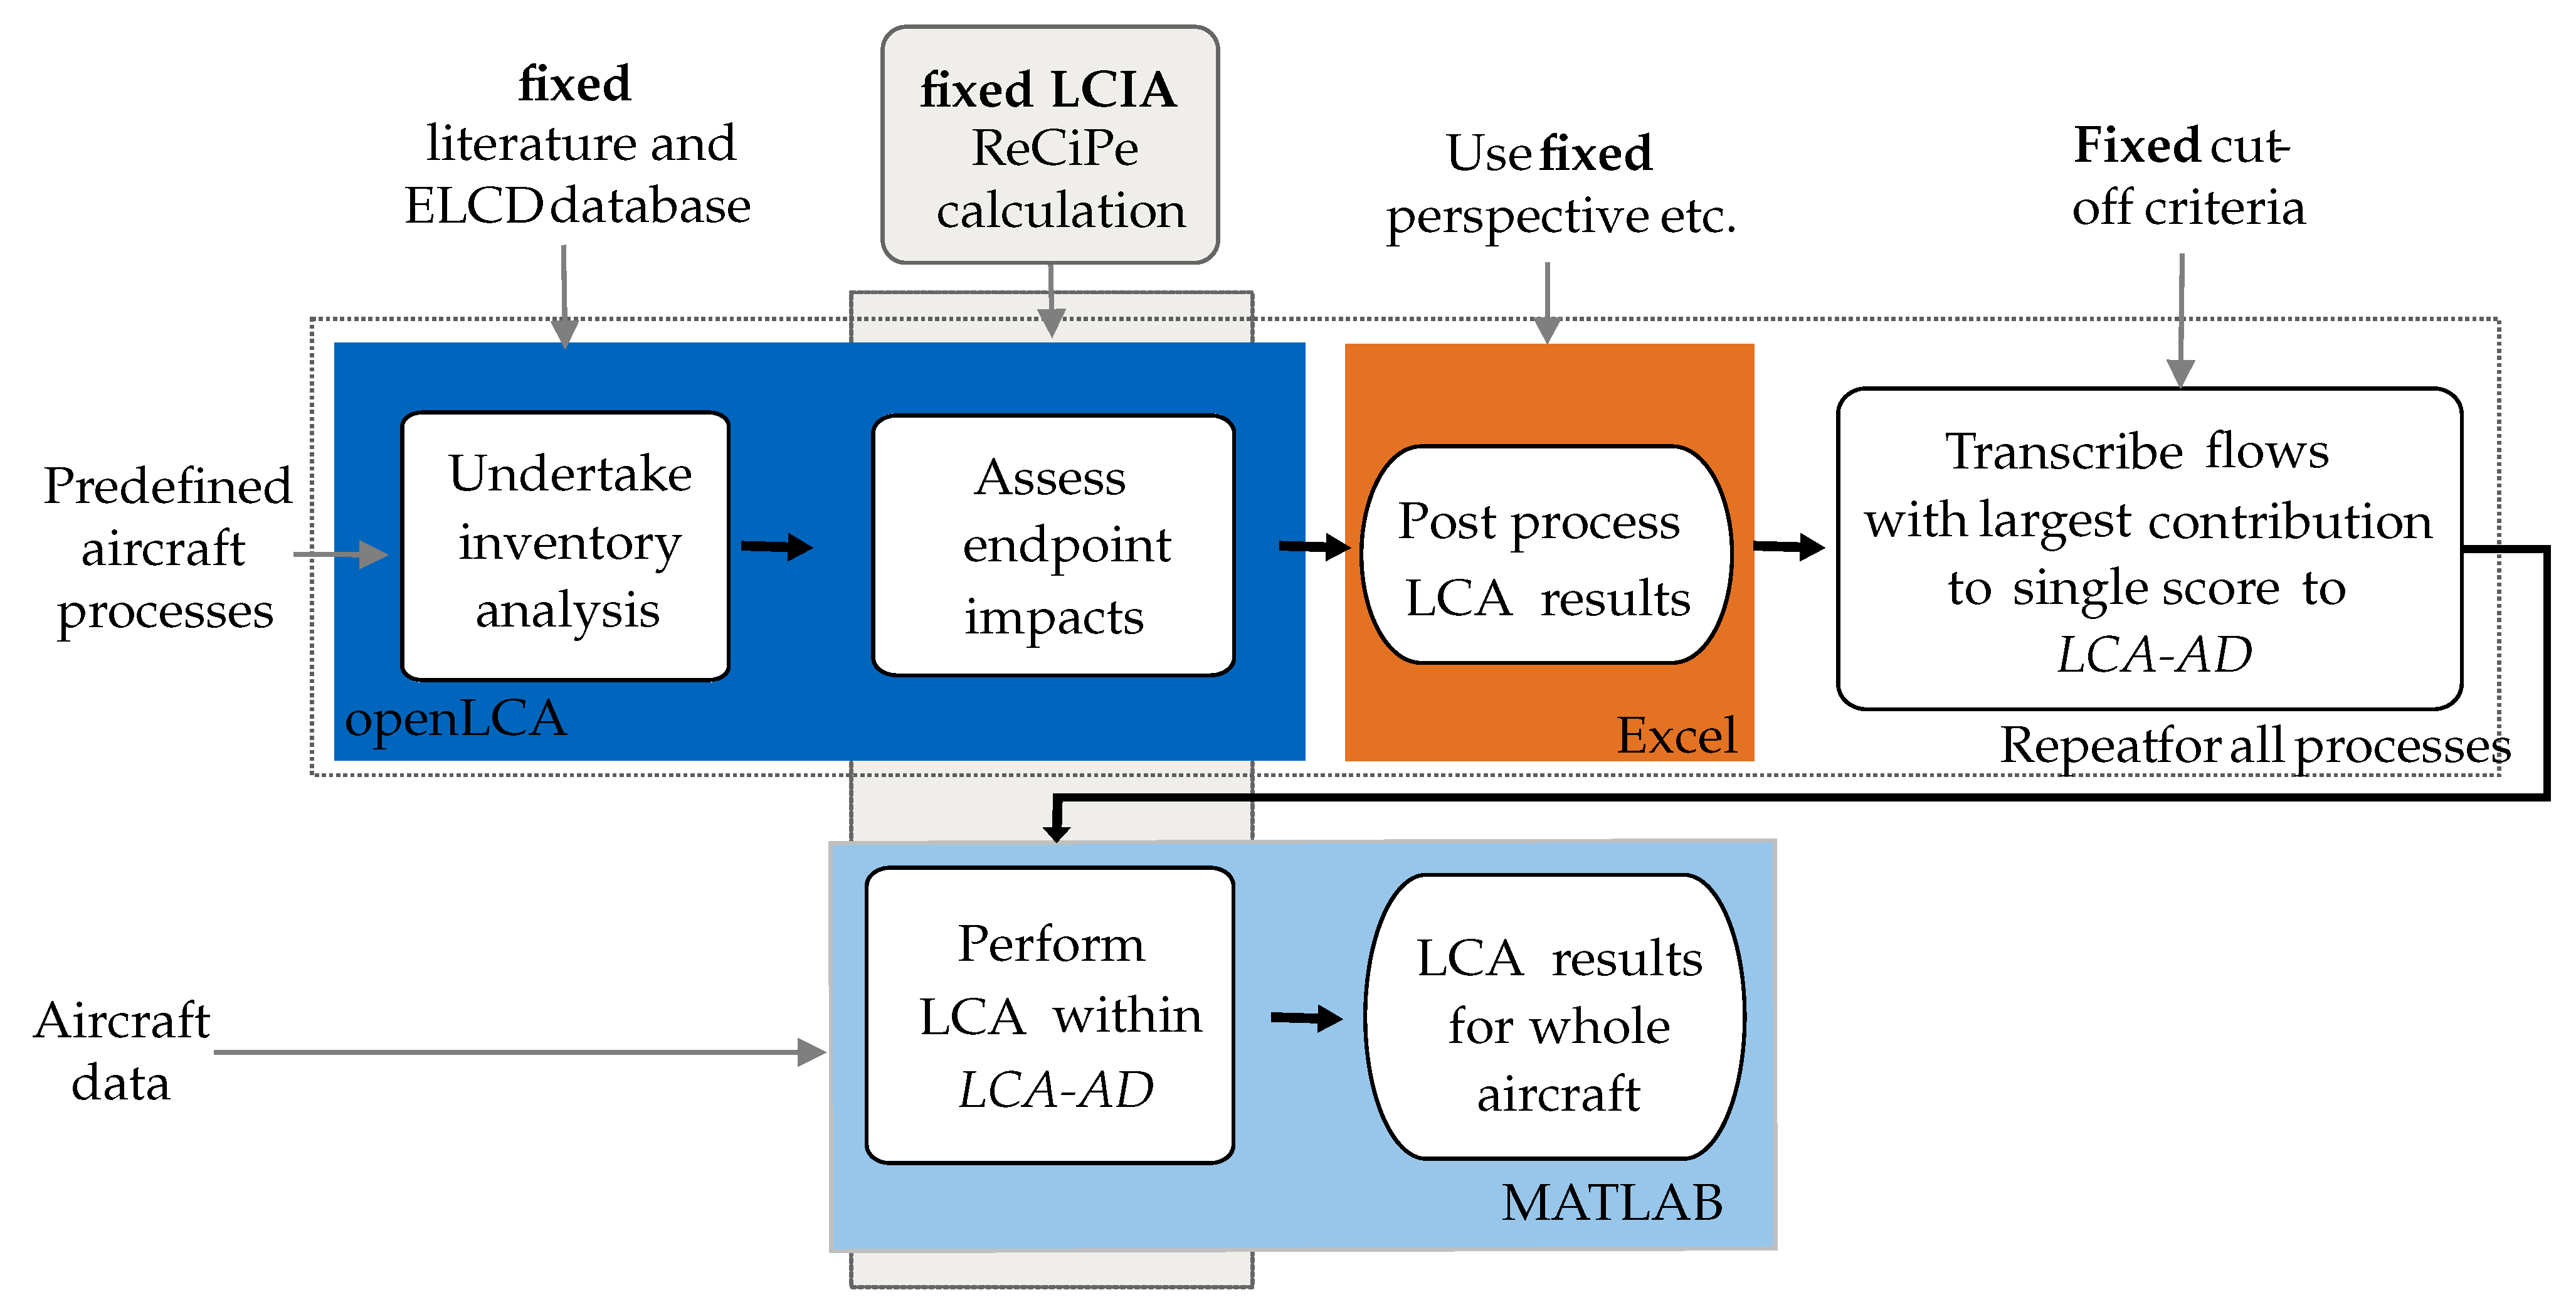
The methodology is outlined in Figure 3.
Starting with a fixed database, LCIA, perspective (hierarchist), and cut-off criteria, an analysis is conducted for each process in openLCA, e.g., for the process “computer usage”, a LCI is conducted, which results in a list of resources and emissions (can be up to 800 in- and outputs). These are evaluated then with the ReCiPe endpoint assessment, and the results are exported to an Excel spreadsheet. To reduce the extensive list, in- and outputs that fall below a fixed threshold of single score contribution are not considered relevant (up to 2.5 % ). Additionally, to reduce the complexity, the differentiation between subcompartments (freshwater, ocean, etc.) is neglected by using the emission and resource with the highest C F . In the case of “computer usage”, the inventory is reduced from 392 to 13 in- and outputs ( 1 % threshold), which cover 94.2 % of the overall modeled process. The reduced LCI is then transcribed to the LCA-AD tool, where the overall aircraft assessment is conducted.
This approach is easy to use but reduces the share of considered in- and outputs, limits the tool in the assumed settings, and does not allow, e.g., a new perspective, weighting, region, cut-offs, database, or impact assessment method to be used.

3. LCA Tool Evaluation Methodology

3.1. Assumptions and Limitations

The basis of the study is the short-range aircraft Airbus A320-200, including the same processes as described in Section 2.4 (the configuration is described in detail in [12,13] and in Appendix A). Five different data sets were studied: an aircraft powered by (1) kerosene, (2) hydrogen based on steam methane reforming (SMR), (3) hydrogen produced from electrolysis, (4) a battery with electricity based on the EU mix, or (5) powered by a battery with electricity from renewable energies (renew.). It should be emphasized that the battery-electric configuration has half the range of the other two concepts. The altitude-dependent climate model from Dahlmann [31] is included (the switch from [45,46] is outlined in [47]).
To differentiate between the models, LCA-AD is synonymously called the simplified tool. To be mentioned is that minor bugs were noticed during its use, which were fixed (see Appendix B.1). The implemented new interface outlined in Section 4 is called openLCA-AD or the advanced tool. The following prerequisites and limitations are given:
  • Installation of Python 3.X and libraries (olca-ipc (0.0.12) and pathlib (1.0.1));
  • Installation and configuration of openLCA software (least 1.11.0; will also include Java);
  • Creation of database including the respective product system “aircraft” (with all modeled processes) and import of LCIAs in openLCA;
  • Limitation to Windows only, and might differ for Linux and OS X.

3.2. Quantitative and Qualitative Metrics

This section aims to answer the research question RQ1. The quantitative metrics include the numeric values to be assessed, whereas the qualitative metrics refer to soft indicators, which relate to the software handling. An overview is given in Table 2.
It was decided that the quantitative metrics, the single score and the endpoint categories “damage to human health“, “damage to ecosystems”, and “damage to resource availability” are prioritized as high, despite the fact that they are not or only mentioned in 27 % of the analyzed studies of [8]. Because of the mentioned uncertainties for aircraft LCA results (Section 2.3), it is preferable to consider the results as an overall decision-making indicator (main purpose of endpoints) or as relative impacts of new concepts compared to a reference concept (main purpose of single score).
Additionally, the midpoint “climate change” is the highest-ranked quantitative metric in the review of [8] and this study. Furthermore, low-priority qualitative metrics are midpoints considered up to 40 % and 40–80% as mid-priority.
The qualitative metrics are conducted from an own analysis when using LCA tools. It should therefore be emphasized that they are based on a subjective evaluation and prioritization. The ability to trace the results (diagnostic use) and to perform sensitivity studies (uncertainty analysis) is ranked as a high priority. As a researcher, it is considered important to be able to trace and understand the outcomes of their analyses, ensuring transparency and reliability. Additionally, assessing the impact of uncertainties on the results is considered important, enhancing the software’s overall credibility.
Mid-prioritized are the abilities to adapt the database and assessment methods (LCI and LCIA adaptability), the vulnerability to errors (implementation stability), and the modeling’s accuracy (level-of-detail). The ability of database and method adaptability is an important feature, whereby a certain amount of effort (familiarization with the system, validation of the interface/import) is considered acceptable. The importance of a stable and error-resistant software environment is acknowledged and considered as a topic of a robust software architecture design. This can reduce the modeling and validation process. However, the underlying, more critical goal of ensuring reliable data are covered in the metric of diagnostic use. Model accuracy, represented by the level-of-detail, is deemed important but not the highest priority, considering the overall objective of conceptual aircraft design.
User-friendliness and time effort were ranked as low priority. While user-friendliness is undoubtedly important, the assumption here is that the users will have the necessary expertise to prioritize functionality over ease of use. Similarly, time effort is assigned a lower priority, considering that time may be sacrificed to some extent to achieve, e.g., traceable results.

4. Implementation of openLCA-AD

To overcome the shortages of the simplified LCA-AD tool mentioned in Section 2.4, a direct connection to the openLCA software is possible. The in-house aircraft design environment Aircraft Design Box (ADEBO) of the Chair of Aircraft Design at the Technical University of Munich is implemented in the coding language MATLAB, which communicates with openLCA over an Application Programming Interface (API), the programming language Python and its package olca-ipc. The prerequisites are mentioned in Section 3.1. Further documentation and examples can be found in [48].
The methodology of the advanced tool openLCA-AD is outlined in Figure 4, showing that the overall assessment is performed in openLCA. For that, inputs are set firstly in MATLAB, such as the selected assessment method and assumptions (e.g., ReCiPe (2016) hierarchist and region world), the aircraft-specific data (e.g., aircraft’s maximum take-off weight), as well as additional data pre-processing (e.g., estimating turn-around time based on aircraft type). With the input data, a Python script is called, which includes the olca-ipc package [49] providing an API for inter-process communication with openLCA. With that, all modeled processes (from the development to the reuse phase) can be calculated at once with different LCIA and perspectives. After the simulation exports the results, the data are post-processed. The quantitative metrics presented in Section 3 are either read in (e.g., results of midpoint and endpoint categories) or require additional calculation (e.g., assessing specific LCI).

5. Results and Discussion

5.1. Quantitative Metrics

This section aims to answer the research question RQ2. The results refer to the simplified LCA-AD tool of [12,13] and the advanced openLCA-AD tool outlined in Section 4. For a fair comparison, both refer to the same LCIA method (ReCiPe 2016), perspective (hierarchist), weighting (average), region (world), and include the same altitude-dependent climate model. The bug fixes of LCA-AD (see Section 3.1) have minor impact on the results and are therefore not discussed in detail. An overview is given in Table A3.
The selected metrics are explained in Section 3.2. First, the high-priority metrics single score, the endpoint categories, and the midpoint “climate change” are discussed in detail. A broader review of the mid- and low-priority metrics is given afterward. Even if the life cycle inventory is not addressed in depth, it is the foundation of the majority of the metrics’ differences. Therefore, details exemplary on the kerosene-powered aircraft are available in Appendix B.2 and Table A4. Additionally, Table A5, Table A6, Table A7 and Table A8 provide the assessments of all concepts.

5.1.1. High-Priority Metrics

The initial metric under consideration is the single score (SS), as illustrated in Figure 5. This figure displays the relative differences in SS between the kerosene-powered aircraft and its alternatives using both the simplified and advanced tools. The findings indicate that the methodologies exert a negligible difference on the single score. The SS impact ranges from 1.2 % for the hydrogen-powered aircraft concept with H 2 generated by electrolysis, to + 8 % for the same concept with hydrogen generated by steam methane reforming. The reason lies, for one, in the reduced number of considered in- and outputs of the simplified tool as explained in Section 2.4. For example, the input “hard coal” was neglected in the process “energy carrier production” which was considered per 1 MJ energy or kg fuel. Multiplying the resource with the actual energy amount, the considered resource increases by a factor of 10 3 (see also reduced numbers in Table A4 and detailed explanation in the Appendix B.2). For another, in- and outputs are neglected in the simplified tool if the characterization factor of the sub-compartment is small. For example, for the emission “phosphate” ( P O 4 ), only “emission to air” (and not “to soil”) is considered. Overall, this leads to an increased SS for all configurations assessed by the advanced tool when comparing it with the simplified one (see Table A5, Table A6, Table A7 and Table A8).
A similar trend is evident in Figure 6, portraying the single score shares of the modeled processes in comparison of the simplified and advanced tool and all concepts (processes are listed in Section 2.4).
For most aircraft, the processes “energy carrier production” (kerosene, liquid hydrogen, or electricity production for battery charging, respectively), “LTO” (landing and take-off), “cruise flight”, “production facilities”, and “airport consumption” have a predominant impact. The “other” category aggregates the remaining processes. The results reveal that the tools show a marginal difference in the single score shares. In the case of kerosene-powered aircraft, the share for “energy carrier production” slightly increases from 16 to 18 % , “LTO” decreases from 8 to 5 % , and “cruise flight” increases from 74 to 75 % . For both hydrogen-powered concepts, “LTO” shares reduce by less than 1 % and shift to an increased “energy carrier” by 2 % for SMR and to “cruise flight” by 7 % for the electrolysis version. No changes are observed for the battery-electric aircraft (EU-27). For the battery-electric aircraft (renew.), a slight shift from “airport energy consumption” to “production facilities” is evident (simplified: 53 and 11 % , advanced: 50 and 13 % ).
The subsequent metrics are the endpoint categories, depicted in Figure 7. These categories include “damage to human health” in Disability-adjusted life years or DALY per PKM, “damage to ecosystems” in species.year per PKM, and “damage to resource availability” in USD (2013) per PKM presented for all configurations and both LCA-AD and openLCA-AD.
The outcomes indicate that the advanced tool has varied impacts on the endpoints. For the first two categories, minor absolute divergences range between 0.01 and 0.23 × 10 7 DALY/PKM and 0.03 and 0.08 × 10 10 species.year/PKM. In relative terms, the maximum deviation is observed for “damage to human health” in the battery-electric aircraft (EU-27) with 4.34 % , and for “damage to ecosystems” in battery-electric aircraft (renew.) with 15.0 % . The category “damage to resource availability” exhibits more substantial differences, ranging from 0.05 to 3.76 × 10 3 USD2013/PKM, leading to a maximum relative deviation of 116 % for hydrogen-powered aircraft (SMR). This is linked to the above-mentioned missing “hard coal” resource in the “energy carrier production”, which is considered for the current EU electricity mix.
The final qualitative metric under consideration is the midpoint category “climate change”, detailed in Figure 8. They are presented for all five concepts using the simplified and advanced tool. The findings indicate a minor impact of the openLCA-AD on “climate change”. The midpoint increases by up to 0.99 g C O 2 eq/PKM for the hydrogen-powered aircraft (SMR), with the highest relative difference of 2.32 % observed for the battery-electric aircraft (renew.).

5.1.2. Mid- and Low-Priority Metrics

The mid- and low-priority metrics delve into midpoint categories that are often not considered relevant in aviation research, as outlined in Section 3.2. Consequently, a concise description is given to these categories, and for detailed data it is referred to Table A5, Table A6, Table A7 and Table A8.
Opposed to the low-impacted single score, most midpoints are strongly influenced by the tool choice. Among the four mid-priority midpoint categories, “terrestrial acidification” and “summer smog” display disparities of less than 10 % between the methodologies. In contrast, “human toxicity” and “resource scarcity” show large variations, e.g., of up to a factor of 80 for “non-carcinogenic toxicity” for the hydrogen-powered aircraft (SMR). This is linked to underestimated arsenic, lead, and zinc per 1 kW of energy from the current electric mix.
Across the seven low-priority midpoint categories, only “particulate matter formation” exhibits differences lower than 10 % . The most significant deviations are evident in “ozone depletion,” where a two- to four-order magnitude shift occurs for all configurations. This is due to the underestimated presence of dinitrogen monoxide ( N 2 O ) (exemplary shown for kerosene-powered aircraft in Table A4).

5.2. Qualitative Metrics

To compare the simplified LCA-AD and advanced openLCA-AD qualitatively, metrics have been established in Section 3.2. Table 3 evaluates them in a decision matrix.
The simplified and advanced tool are ranked to fulfill 82 % and 79 % of the indicators, respectively. For the LCA-AD, e.g., the diagnostic use is ranked as easy to trace and debug due to its modeling in a programming script. The openLCA-AD, in contrast, offers visualization of the results, but the calculation steps are not easy to follow and rather non-transparent. The uncertainty analysis is ranked high for both, as openLCA offers a built-in Monte-Carlo-Simulation, which can be triggered with the API, or script-based parameter variation can be used. In terms of LCI and LCIA adaptability, the simplified tool does provide poor capabilities (see Figure 3), whereas flexibility for the inventory and assessment methods is high for the interface version. On the other hand, the implementation stability for the fully script-based tool is strong. With the help of version control systems like Git, code changes can easily be tracked. The openLCA interface can only be tracked for the pre- and post-processing and the software offers timestamps documenting the last changes. In the level-of-detail, a large discrepancy is visible. The ranking is based on these subdivisions:
  • LCI (1) with or (2) without cut-offs;
  • LCI (1) without or (2) with compartments/subcompartments;
  • (1) Without or (2) with spatial/temporal differentiated LCI;
  • (1) Only relevant or (2) all processes considered.
The simplified LCA-AD considers a low level of detail as it follows the first option for all subdivisions. The advanced openLCA-AD, on the other hand, follows the second option for the first two.
The script-based tool beats out the interface in respect of user-friendliness and time effort. The advanced tool does need openLCA and Python to be installed and requires expert knowledge in the LCA software. The simplified tool is a straightforward function requiring a low amount of inputs to generate the results.

5.3. Discussion

The quantitative metrics assessed in this study reveal varying effects between the simplified LCA-AD and the advanced openLCA-AD tool on various levels of the LCA. The findings suggest that the use of the different applications has a negligible influence on the overall single score. A closer examination of the single score shares of the modeled processes supports this observation, as they also experience a marginal impact. However, a substantial impact is demonstrated in the analysis of the endpoint categories. Furthermore, while the impact on the high-priority midpoint category “climate change” is minor, it significantly influences most other midpoints. As the literature lacks validation data, only the midpoint “climate change” of kerosene-powered aircraft can be compared. In Kossarev et al. [13], a comparison of the global warming potentials of kerosene-powered aircraft from different sources is shown. An average GWP for narrow-body aircraft of 118 g C O 2 -eq/PKM is visualized, which does not consider altitude-dependent climate models. If the model is also excluded in the simplified and the advanced tool, results of 102.61 and 102.78 g C O 2 eq/PKM are achieved, resulting in an underestimation compared to the average values.
In addition to quantitative assessments, qualitative metrics play an important role in evaluating the effectiveness of the methodologies. Both the simplified and advanced tools are ranked to fulfill > 75 % of the requirements, but they focus on different use cases.
The openLCA-AD tool is recommended for detailed research and comprehensive assessments. It outperforms the simplified tool in a higher level-of-detail and accuracy, due to its direct interface to the LCA software openLCA, making it the preferred choice for examining endpoints and the overall midpoint categories. However, drawbacks in terms of medium-level traceability, required expert knowledge, and high modeling effort can lead to an increase in required assessment time. This is not beneficial in the conceptual aircraft design because new technologies should be quickly evaluated.
The LCA-AD tool serves as a low-level, user-friendly tool that can provide reasonably accurate results, particularly for comparing single scores across different aircraft types. It proves valuable for indicating ecological tendencies and identifying relevant processes, e.g., in first assessment within the conceptual aircraft design or for teaching. However, its accuracy diminishes when examining endpoints or other midpoints, emphasizing its limitations for in-depth analyses. Additionally, the tool relies on data derived from a specific LCA software. The dependence on a particular software introduces challenges, particularly when new databases become available (see GLAD) or when life cycle impact assessments undergo updates. Updating the simplified tool under such circumstances requires a substantial effort.
However, the advent of new automation technologies opens avenues for addressing this limitation. Future work could explore a procedure that automatically creates semi-empirical or surrogate models from LCA software. This approach could streamline the adaptation of the simplified tool to changes in databases or impact assessment methodologies, enhancing its flexibility and ensuring an up-to-date version when used in LCA training and teaching. Additionally, this can increase the transparency of openLCA-AD by transcribing relevant inventory data, characterization factors, and results in an easy-to-understand code.

6. Conclusions

While several life cycle assessments in the aviation sector have been undertaken, their comparability is hindered by disparities in data sources, tools, and methodologies employed. The current research is increasingly oriented towards establishing a global database and standardized impact methodologies. By providing a comparative analysis of life cycle assessment tools in the context of conceptual aircraft design, this study adds to the ongoing effort.
The analysis includes two research questions: To methodically address the first question, a LCA tool evaluation including quantitative and qualitative metrics is formulated. The quantitative domain encompasses five high-priority indicators, including the single score, three endpoint categories, and the “climate change” midpoint category, alongside eleven mid- or low-priority midpoint categories. Concurrently, the qualitative metrics consist of seven indicators, prioritizing “diagnostic use” and “uncertainty analysis.”
The second research question involves the application of these metrics to assess two LCA tools: a simplified open-source tool LCA-AD derived from the openLCA software, and an automated interface tool openLCA-AD developed in this study for with same software. Quantitative metrics reveal variable effects: the tool selection exerts negligible influence on the overall single score and “climate change” midpoint category, yet significantly impacts endpoint and other midpoint categories. Qualitative analysis indicates that both tools satisfy over 75 % of the metrics, albeit with preferences for distinct use cases.
The implications of the findings suggest that researchers and practitioners should carefully align their choice of tools with the intended application. The simplified tool is suitable for didactic purposes and quick assessments on single score level. In contrast, the advanced tool is essential for research requiring high levels of LCA expertise, modeling, and time effort to accurately assess the overall impact categories.
In summary, the evaluation methodology presented in this study significantly enhances our grasp of the intricacies involved in comparing LCA tools. It can serve as a guideline that points out difficulties and peculiarities. Applying this method to two tools highlights the need to choose LCA tools carefully for accurate and reliable analyses in conceptual aircraft design.

Author Contributions

Conceptualization, K.M.; methodology, K.M. and M.S.; software, K.M. and M.S.; validation, K.M. and M.S.; formal analysis, K.M. and M.S.; investigation, K.M. and M.S.; resources, K.M. and M.S.; Writing—Original Draft Preparation, K.M.; Writing—Review & Editing, M.S. and M.H.; visualization, K.M.; supervision, M.H. All authors have read and agreed to the published version of the manuscript.

Funding

This research received no external funding.

Data Availability Statement

Data are contained within the article.

Conflicts of Interest

The authors declare no conflicts of interest.

Abbreviations

The following abbreviations are used in this manuscript:
ADEBOAircraft Design Box
APIApplication Programming Interface
CFCharacterization factor
DALYDisability-adjusted life years
EIO-LCAEconomic Input-Output LCA
ELCDEuropean Reference Life Cycle Database
EU mixEuropean electricity mix
LCALife cycle assessment
GLAMGlobal Guidance on Environmental Life Cycle Impact Assessment Indicators
GLADGlobal LCA Data Access
GWPGlobal Warming Potential
LCA-ADLife Cycle Assessment in Conceptual Aircraft Design
LCILife cycle inventory analysis
LCIALife cycle impact assessment
openLCA-ADopenLCA in Conceptual Aircraft Design
PKMPassenger kilometer
ptEco-Indicator-Points
renew.Renewable energies
SMRSteam methane reforming

Appendix A. Aircraft Configurations

The reference aircraft is considered as the A320-200 WV000 and equipped with two CFM56-5A5 engines [50]. Two alternative designs, one hydrogen and one battery-electric powered aircraft, were derived from this conventional design by [12]. These aircraft parameters are presented in Table A1.
Table A1. Aircraft parameters [12].
ParameterConventional AircraftHydrogen AircraftBattery Aircraft
Maximum take-off mass73,500 kg74,000 kg101,300 kg
Operating empty mass41,244 kg48,700 kg58,700 kg
Trip fuel mass/Energy4557 kg2790 kg15,582 kWh
Average passengers per flight122
Number of operation years25
Mission range589 NM294 NM
The shares for each material for the three configurations are reported in Table A2. For the hydrogen aircraft, an aluminum tank is considered.
Table A2. Shares of materials in aircraft configuration [12,13].
MaterialAluminumSteelCompositesTitanOther
Conventional & electric aircraft [%]6691375
Hydrogen aircraft [%]7271164

Appendix B. Results

Appendix B.1. Single Score

As errors were noticed in the simplified tool, the following is adapted: the characterization factor of Hydrogen-3 is corrected affecting the midpoint ionizing radiation (former referred to the compartment “emission to air” with C F = 8.56 × 10 4 whereas the LCI referred to “emission to water” C F = 4.12 × 10 5 ). Additionally, for the process “production facilities”, the amount of total annual water consumption was given in tons in the previous work, whereas the original source provides the value in cubic meters.
Table A3. Comparison of the single score in [pts/PKM] of the aircraft concepts studied in [12,13]. Simplified refers to the baseline data in [13], simplified (fixed) to the bug-fixed version, and advanced to the results from the new interface.
KeroseneHydrogen # Battery
SMRElectrolysisEU MixRenew.
(A) Simplified [13] 8.408 × 10 2 1.786 × 10 1 7.330 × 10 2 5.762 × 10 2 3.963 × 10 3
(B) Simplified (fixed) 8.387 × 10 2 1.784 × 10 1 7.309 × 10 2 5.721 × 10 2 3.551 × 10 3
(C) Advanced 8.554 × 10 2 1.887 × 10 2 7.349 × 10 2 6.188 × 10 2 3.768 × 10 3
Difference [ ( C B ) / B ] + 1.99 % + 5.77 % + 0.55 % + 8.16 % + 6.12 %
# New studies show that the Contrail and Cirrus cloud formation is reduced for hydrogen in comparison to kerosene burning concepts (Section 2.2.2 in [51]). For a 40 % reduction, the SS in the simplified and advanced LCA would be 1.536 × 10 1 and 1.637 × 10 1 for the SMR and 4.836 × 10 2 and 4.855 × 10 2 for the electrolysis. To focus on the methodology comparison with [13], no reduction was chosen for the above-mentioned results.

Appendix B.2. Inventory Analysis

The inventory analysis for the conventional aircraft is reported in Table A4. Only the results of the respective substances previously presented in [13] are provided, even though the automated interface can include all substances for all subcompartments without a cut-off criteria. The inventory analysis is reported for a conventional aircraft only to highlight the general difficulties in inventory assessment. To understand the occurring differences, first, general notes about the differences in how the two methodologies are handling the inventory are given. Simplified evaluates the inventory process-by-process. Each process was calculated in openLCA evaluating one item of its own functional unit (e.g., “kerosene production” for 1 k g fuel, “computer usage” for 1 k W h , “aircraft production” for 1 seat). The single score for this process is estimated and the flow’s contribution to that SS is calculated (e.g., the resource use of “crude oil” [g/1 kg fuel] has a SS share of 67.51 % of the process “kerosene production). All flows with a greater impact than 1 % are assumed to be relevant. In an additional step, the flow is converted in the unit [g/PKM].
Advanced evaluates the inventory in one process. The processes already include the overall functional unit of PKM, meaning that, e.g., the process ”kerosene production“ includes the total fuel mass and the aircraft production the total number of seats. The relevant contribution of a flow is now referred to the total SS in [g/PKM].
Table A4. Results of life cycle inventory (simplified [13] vs. advanced LCA) of the kerosene-powered concept.
SubstanceUnitSimplifiedAdvancedDifference [%]
C O 2 g/PKM 9.939 × 10 1 9.940 × 10 1 0.01
Crude oilg/PKM 3.162 × 10 1 3.162 × 10 1 0.00
Dinitrogen oxide ( N O 2 )g/PKM 2.391 × 10 2 2.398 × 10 2 0.28
Zinc ( Z n )g/PKM 1.394 × 10 6 1.427 × 10 6 2.31
Arsenic ( A s )g/PKM 2.630 × 10 7 2.638 × 10 7 0.29
Dioxineg/PKM 2.699 × 10 12 2.819 × 10 12 4.45
Lead (Pb)g/PKM 5.891 × 10 10 1.224 × 10 6 > 10 6
O 2 g/PKM 9.627 × 10 1 0.000 100
Water (in-flight emission)g/PKM 3.483 × 10 1 3.801 × 10 1 9.14
NO x g/PKM 4.425 × 10 1 4.425 × 10 1 0.00
Hard coalg/PKM 1.721 × 10 4 1.543 × 10 1 > 10 5
Natural gasg/PKM 1.779 × 10 0 1.780 × 10 0 0.06
COg/PKM 7.737 × 10 2 0.000 100
S O 2 g/PKM 9.029 × 10 2 9.027 × 10 2 0.02
HCg/PKM 5.077 × 10 3 5.077 × 10 3 0.00
C H 4 g/PKM 9.470 × 10 2 9.752 × 10 2 2.98
N 2 O g/PKM 2.496 × 10 8 1.845 × 10 4 > 10 6
PM2.5g/PKM 6.713 × 10 3 7.104 × 10 3 5.83
Water (resource)g/PKM 6.615 × 10 2 8.894 × 10 0 > 10 5
Nickel ( N i )g/PKM 1.179 × 10 7 4.461 × 10 6 > 10 4
Benzene (C6H6)g/PKM 0.000 1.067 × 10 5 -
Formaldehyde ( C H 2 O )g/PKM 2.488 × 10 7 8.210 × 10 6 > 10 4
Lig/PKM 0.000 0.000 -
Phosphate ( P O 4 )g/PKM 3.274 × 10 5 9.752 × 10 5 197.86
Polycyclic aromatic hydrocarbon (PAH)g/PKM 1.327 × 10 7 2.552 × 10 7 92.35
Copper oreg/PKM 0.000 1.879 × 10 5 -
H-3Bq/PKM 3.016 × 10 2 3.206 × 10 2 6.31
C-14Bq/PKM 1.002 × 10 2 2.112 × 10 2 110.81
Cs-134Bq/PKM 1.159 × 10 3 1.748 × 10 3 50.79
Cs-137Bq/PKM 7.678 × 10 3 1.303 × 10 2 69.72
Co-60Bq/PKM 2.915 × 10 3 5.424 × 10 3 86.06
Rn-222Bq/PKM 6.428 × 10 0 1.270 × 10 1 97.51
The following list summarizes the specific explanation with respect to differences:
  • Lead, hard coal, N 2 O and P A H : The simplified LCA, lead is only mentioned in the processes ”steel production” and consequently “test flight campaign” (acc. to its inventory analysis, 4 % SS contribution with 5.89 × 10 10 g/PKM). The emission also occurs in the “kerosene production” with a 0.08 % process-SS share and was therefore neglected. In the context of the overall process in the advanced LCA, the contribution is higher than 1 % and should not be neglected. Similar can be applied to hard coal, N 2 O and P A H .
  • Water (in-flight emission): Emissions are considered contributing to the Contrails and Cirrus Clouds formation and the global warming potential acc. to the climate model.
  • Water (resource): water is only considered in CFRP production in the simplified LCA whereas, in advanced, the highest water consumption comes from kerosene production, which is now included in the LCIA. Additionally, only categories “water, surface” and “water, river” are considered relevant to keep comparability.
  • N i and P O 4 : The simplified LCA only considers Nickel in the process “use of production facilities” whereas in the advanced LCA, “kerosene production” also contributes to a higher absolute number. Similar applies to P O 4 Additionally, for P O 4 , only emissions to water are considered, and to soil are neglected due to a lower CF.
  • Formaldehyde: the simplified LCA only considers it in the processes “computer usage” and “material production (composites)”, whereas in the advanced LCA, “kerosene production” contributes to a higher absolute number.
  • C-14, C-137, Cs-134, Co-60, Rn-222: The simplified LCA only considers emissions in the processes “computer usage”, “use of production facilities”, “material production (composites)” and “test flights” whereas in the advanced LCA, “kerosene production” is also added. Additionally, for C-14 in both methodologies, only “emissions to air” is included in the table (CF is higher compared to “emissions to water, unspecified and fresh water”). Also, for C-137, only emissions to water is shown.

Appendix B.3. Summarized Life Cycle Assessment Results

Table A5. Results of life cycle impact assessment (simplified (bugfixed) vs. advanced LCA) of the kerosene-powered concept.
Mid-/Endpoint CategoriesUnitValue (Simplified)Value (Advanced)Difference [%]
Climate changeg C O 2 eq 3.287 × 10 2 3.289 × 10 2 0.05
Ozone depletiong CFC-11 eq 2.746 × 10 10 2.169 × 10 6 > 10 6
Particulate matter formationg PM2.5 eq 8.420 × 10 2 8.461 × 10 2 0.49
Ionizing radiationBq Co-60 eq 1.277 × 10 1 2.221 × 10 1 73.94
Human carcinogenic toxicityg 1.4-DCB eq 1.409 × 10 3 5.173 × 10 3 > 10 2
Human non-carcinogenic toxicityg 1.4-DCB eq 4.326 × 10 2 6.523 × 10 1 > 10 3
Photochemical oxidant formation (HH)g NO x eq 4.672 × 10 1 4.692 × 10 1 0.42
Photochemical oxidant formation (ECO)g NO x eq 4.677 × 10 1 4.708 × 10 1 0.67
Water useg consumed 6.615 × 10 2 8.944 > 10 4
Terrestrial acidificationg S O 2 eq 2.582 × 10 1 2.584 × 10 1 0.07
Freshwater eutrophicationg P eq 1.080 × 10 5 6.205 × 10 5 > 10 2
Marine eutrophicationg N eq0.000 1.205 × 10 4 0.00
Terrestrial ecotoxicityg 1.4-DCB eq 2.207 × 10 1 7.333 > 10 3
Freshwater ecotoxicityg 1.4-DCB eq 2.204 × 10 2 3.605 × 10 3 83.64
Marine ecotoxicityg 1.4-DCB eq 1.840 × 10 4 8.513 × 10 2 > 10 5
Land usem2/a0.000 3.106 × 10 4 0.00
Mineral resource scarcityg Fe eq0.000 2.044 × 10 3 0.00
Fossil resource scarcityg oil eq 3.370 × 10 1 3.377 × 10 1 0.22
Damage to human healthDALY 3.574 × 10 7 3.580 × 10 7 0.16
Damage to ecosystemsspecies.yr 1.033 × 10 9 1.036 × 10 9 0.37
Damage to resource availabilityUSD2013 1.508 × 10 2 1.519 × 10 2 0.79
Single Scorepoints 8.387 × 10 2 8.554 × 10 2 1.99
Table A6. Results of life cycle impact assessment (simplified (bugfixed) vs. advanced LCA) of the hydrogen-powered concept (steam reforming).
Mid-/Endpoint CategoriesUnitValue (Simplified)Value (Advanced)Difference [%]
Climate changeg C O 2 eq 8.427 × 10 2 8.437 × 10 2 0.12
Ozone depletiong CFC-11 eq 2.522 × 10 10 5.157 × 10 5 > 10 7
Particulate matter formationg PM2.5 eq 3.197 × 10 1 3.398 × 10 1 6.30
Ionizing radiationBq Co-60 eq 1.510 × 10 1 1.839 × 10 1 21.81
Human carcinogenic toxicityg 1.4-DCB eq 3.546 × 10 2 8.086 × 10 2 > 10 2
Human non-carcinogenic toxicityg 1.4-DCB eq 3.356 × 10 2 2.700> 10 3
Photochemical oxidant formation (HH)g NO x eq 4.900 × 10 1 4.912 × 10 1 0.25
Photochemical oxidant formation (ECO)g NO x eq 4.905 × 10 1 4.926 × 10 1 0.43
Water useg consumed 6.609 × 10 2 1.003 × 10 2 > 10 5
Terrestrial acidificationg S O 2 eq 1.070 × 10 0 1.070 × 10 0 0.05
Freshwater eutrophicationg P eq 1.080 × 10 5 3.309 × 10 5 > 10 2
Marine eutrophicationg N eq0.000 3.404 × 10 4 0.00
Terrestrial ecotoxicityg 1.4-DCB eq 4.396 × 10 2 3.867 × 10 1 > 10 4
Freshwater ecotoxicityg 1.4-DCB eq 2.203 × 10 2 7.332 × 10 3 66.72
Marine ecotoxicityg 1.4-DCB eq 8.773 × 10 5 3.985 × 10 2 > 10 4
Land usem2/a0.000 3.106 × 10 4 0.00
Mineral resource scarcityg Fe eq 0.000 1.389 × 10 3 0.00
Fossil resource scarcityg oil eq 1.070 × 10 1 3.220 × 10 1 > 10 2
Damage to human healthDALY 9.752 × 10 7 9.895 × 10 7 1.46
Damage to ecosystemsspecies.yr 2.624 × 10 9 2.632 × 10 9 0.30
Damage to resource availabilityUSD2013 3.252 × 10 3 7.005 × 10 3 115.42
Single Scorepoints 1.784 × 10 1 1.887 × 10 1 5.77
Table A7. Results of life cycle impact assessment (simplified (bugfixed) vs. advanced LCA) of hydrogen-powered concept (electrolysis).
Mid-/Endpoint CategoriesUnitValue (Simplified)Value (Advanced)Difference [%]
Climate changeg C O 2 eq 4.711 × 10 2 4.713 × 10 2 0.05
Ozone depletiong CFC-11 eq 2.522 × 10 10 5.512 × 10 7 > 10 5
Particulate matter formationg PM2.5 eq 2.000 × 10 2 2.072 × 10 2 3.59
Ionizing radiationBq Co-60 eq 1.278 × 10 1 1.987 × 10 1 55.43
Human carcinogenic toxicityg 1.4-DCB eq 4.876 × 10 3 5.962 × 10 3 22.27
Human non-carcinogenic toxicityg 1.4-DCB eq 1.420 × 10 1 2.050 × 10 1 44.37
Photochemical oxidant formation (HH)g NO x eq 5.437 × 10 2 5.410 × 10 2 0.49
Photochemical oxidant formation (ECO)g NO x eq 5.437 × 10 2 5.418 × 10 2 0.35
Water useg consumed 1.582 × 10 1 1.601 × 10 5 1.19
Terrestrial acidificationg S O 2 eq 4.478 × 10 2 4.692 × 10 2 4.78
Freshwater eutrophicationg P eq 1.080 × 10 5 1.211 × 10 5 12.11
Marine eutrophicationg N eq0.000 1.977 × 10 5 0.00
Terrestrial ecotoxicityg 1.4-DCB eq 3.097 × 10 1 1.436 × 10 0 > 10 2
Freshwater ecotoxicityg 1.4-DCB eq 2.203 × 10 2 8.778 × 10 3 60.16
Marine ecotoxicityg 1.4-DCB eq 5.941 × 10 5 2.812 × 10 3 > 10 3
Land usem2/a0.000 3.106 × 10 4 0.00
Mineral resource scarcityg Fe eq0.000 4.230 × 10 3 0.00
Fossil resource scarcityg oil eq 5.420 × 10 1 9.358 × 10 1 72.65
Damage to human healthDALY 4.413 × 10 7 4.420 × 10 7 0.15
Damage to ecosystemsspecies.yr 1.310 × 10 9 1.314 × 10 9 0.29
Damage to resource availabilityUSD2013 2.222 × 10 4 2.852 × 10 4 28.37
Single Scorepoints 7.309 × 10 2 7.349 × 10 2 0.55
Table A8. Results of life cycle impact assessment (simplified (bugfixed) vs. advanced LCA) of the battery-electric aircraft (EU mix).
Mid-/Endpoint CategoriesUnitValue (Simplified)Value (Advanced)Difference [%]
Climate changeg C O 2 eq 1.212 × 10 2 1.221 × 10 2 0.74
Ozone depletiong CFC-11 eq 7.816 × 10 10 4.705 × 10 5 > 10 6
Particulate matter formationg PM2.5 eq 2.377 × 10 1 2.539 × 10 1 6.85
Ionizing radiationBq Co-60 eq 1.585 × 10 1 1.683 × 10 1 6.18
Human carcinogenic toxicityg 1.4-DCB eq 3.030 × 10 2 4.237 × 10 2 39.86
Human non-carcinogenic toxicityg 1.4-DCB eq 9.274 × 10 1 2.454 × 10 0 164.60
Photochemical oxidant formation (HH)g NO x eq 2.201 × 10 1 2.123 × 10 1 3.53
Photochemical oxidant formation (ECO)g NO x eq 2.201 × 10 1 2.131 × 10 1 3.18
Water useg consumed 1.883 × 10 1 9.132 × 10 5 > 10 4
Terrestrial acidificationg S O 2 eq 7.690 × 10 1 7.626 × 10 1 0.84
Freshwater eutrophicationg P eq 2.161 × 10 5 4.225 × 10 5 95.50
Marine eutrophicationg N eq0.000 3.275 × 10 4 0.00
Terrestrial ecotoxicityg 1.4-DCB eq 3.915 × 10 1 3.535 × 10 1 > 10 3
Freshwater ecotoxicityg 1.4-DCB eq 4.408 × 10 2 7.166 × 10 3 83.75
Marine ecotoxicityg 1.4-DCB eq 3.025 × 10 4 3.741 × 10 2 > 10 4
Land usem2/a0.000 6.212 × 10 4 0.00
Mineral resource scarcityg Fe eq 2.859 × 10 0 2.761 × 10 0 3.44
Fossil resource scarcityg oil eq 1.367 × 10 1 2.994 × 10 1 > 10 2
Damage to human healthDALY 2.626 × 10 7 2.740 × 10 7 4.34
Damage to ecosystemsspecies.yr 5.307 × 10 10 5.381 × 10 10 1.40
Damage to resource availabilityUSD2013 5.346 × 10 3 7.269 × 10 3 35.99
Single Scorepoints 5.721 × 10 2 6.188 × 10 2 8.16
Table A9. Results of life cycle impact assessment (simplified (bugfixed) vs. advanced LCA) of the battery-electric aircraft (renewable energies).
Mid-/Endpoint CategoriesUnitValue (Simplified)Value (Advanced)Difference [%]
Climate changeg C O 2 eq 1.058 × 10 1 1.082 × 10 1 2.32
Ozone depletiong CFC-11 eq 7.816 × 10 10 5.372 × 10 7 > 10 4
Particulate matter formationg PM2.5 eq 2.910 × 10 2 2.933 × 10 2 0.80
Ionizing radiationBq Co-60 eq 2.645 × 10 1 2.829 × 10 1 6.93
Human carcinogenic toxicityg 1.4-DCB eq 1.688 × 10 3 2.210 × 10 3 30.93
Human non-carcinogenic toxicityg 1.4-DCB eq 3.284 × 10 2 8.926 × 10 2 > 10 2
Photochemical oxidant formation (HH)g NO x eq 8.612 × 10 3 8.694 × 10 3 0.95
Photochemical oxidant formation (ECO)g NO x eq 8.612 × 10 3 8.744 × 10 3 1.53
Water useg consumed 2.996 × 10 0 3.377 × 10 6 12.70
Terrestrial acidificationg S O 2 eq 5.387 × 10 2 5.434 × 10 2 0.88
Freshwater eutrophicationg P eq 2.161 × 10 5 2.253 × 10 5 4.26
Marine eutrophicationg N eq0.000 3.444 × 10 5 0.00
Terrestrial ecotoxicityg 1.4-DCB eq 1.317 × 10 1 6.973 × 10 1 > 10 2
Freshwater ecotoxicityg 1.4-DCB eq 4.407 × 10 2 2.419 × 10 3 94.51
Marine ecotoxicityg 1.4-DCB eq 6.701 × 10 5 2.680 × 10 3 > 10 3
Land usem2/a0.000 6.212 × 10 4 0.00
Mineral resource scarcityg Fe eq 2.859 × 10 0 2.760 × 10 0 0.00
Fossil resource scarcityg oil eq 1.035 × 10 0 1.193 × 10 0 15.20
Damage to human healthDALY 2.815 × 10 8 2.852 × 10 8 1.31
Damage to ecosystemsspecies.yr 4.221 × 10 11 4.854 × 10 11 15.01
Damage to resource availabilityUSD2013 1.033 × 10 3 1.078 × 10 3 4.36
Single Scorepoints 3.551 × 10 3 3.768 × 10 3 6.12

References

  1. Doll, C.; Brauer, C.; Köhler, J.; Scholten, P. Methodology for GHG Efficiency of Transport Modes—Final Report; Technical Report, Framework Service Contract EEA/ACC/18/001/LOT1; European Environment Agency (EEA): Karlsruhe, Germany; Delft, The Netherlands, 2020; Available online: https://www.eea.europa.eu/publications/rail-and-waterborne-transport/rail-and-waterborne-best/d3b-eea-ghg-efficiency-indicators/view (accessed on 30 October 2023).
  2. Air Transport Action Group. Waypoint 2050. Available online: https://aviationbenefits.org/media/167417/w2050_v2021_27sept_full.pdf (accessed on 5 October 2023).
  3. DIN EN ISO 14040; Environmental Management—Life Cycle Assessment—Principles and Framework. Beuth Verlag GmbH: Berlin, Germany, 2006.
  4. DIN EN ISO 14044; Environmental Management—Life Cycle Assessment—Requirement and Guidelines. Beuth Verlag GmbH: Berlin, Germany, 2006.
  5. Herrmann, I.T.; Moltesen, A. Does it matter which Life Cycle Assessment (LCA) tool you choose?—A comparative assessment of SimaPro and GaBi. J. Clean. Prod. 2015, 86, 163–169. [Google Scholar] [CrossRef]
  6. Lopes Silva, D.A.; Nunes, A.O.; Piekarski, C.M.; da Silva Moris, V.A.; de Souza, L.S.M.; Rodrigues, T.O. Why using different Life Cycle Assessment software tools can generate different results for the same product system? A cause–effect analysis of the problem. Sustain. Prod. Consum. 2019, 20, 304–315. [Google Scholar] [CrossRef]
  7. Pinheiro Melo, S.; Barke, A.; Cerdas, F.; Thies, C.; Mennenga, M.; Spengler, T.S.; Herrmann, C. Sustainability Assessment and Engineering of Emerging Aircraft Technologies—Challenges, Methods and Tools. Sustainability 2020, 12, 5663. [Google Scholar] [CrossRef]
  8. Keiser, D.; Schnoor, L.H.; Pupkes, B.; Freitag, M. Life cycle assessment in aviation: A systematic literature review of applications, methodological approaches and challenges. J. Air Transp. Manag. 2023, 110, 102418. [Google Scholar] [CrossRef]
  9. UN Environmental Programme. Global Guidance on Environmental Life Cycle Impact Assessment Indicators (GLAM). 2023. Available online: https://www.lifecycleinitiative.org/activities/life-cycle-assessment-data-and-methods/global-guidance-for-life-cycle-impact-assessment-indicators-and-methods-glam/ (accessed on 31 October 2023).
  10. UN Environmental Programme. Global LCA Data Access Network (GLAD). 2023. Available online: https://www.globallcadataaccess.org/ (accessed on 31 October 2023).
  11. UN Environmental Programme. Global LCA Data Access Network (GLAD)—Frequently Asked Questions. 2023. Available online: https://www.globallcadataaccess.org/faq (accessed on 31 October 2023).
  12. Johanning, A. Methodology for Life Cycle Assessment in Aircraft Conceptual Design [Methodik zur Ökobilanzierung im Flugzeugvorentwurf]. Ph.D. Thesis, Technical University of Munich, Munich, Germany, 2017. [Google Scholar]
  13. Kossarev, K.; Scholz, A.E.; Egerer, P.; Hornung, M. Comparison of Environmental Life Cycle Impact Assessment Methods for Future Aircraft Designs. In Proceedings of the AIAA AVIATION 2022 Forum, Virtual, 27 June–1 July 2022. [Google Scholar] [CrossRef]
  14. European Commission. European Platform on LCA | EPLCA. 2023. Available online: https://eplca.jrc.ec.europa.eu/ELCD3/ (accessed on 2 November 2023).
  15. Ecoinvent. Ecoinvent Database. 2023. Available online: https://ecoinvent.org/the-ecoinvent-database/ (accessed on 2 November 2023).
  16. Huijbregts, M.A.J.; Steinmann, Z.J.N.; Elshout, P.M.F.; Stam, G.; Verones, F.; Vieira, M.D.M.; Hollander, A.; Zijp, M.; van Zelm, R. ReCiPe 2016 v1.1: A Harmonized Life Cycle Impact Assessment Method at Midpoint and the Endpoint Level. Report I: Characterisation; Technical Report RIVM Report 2016-0104a; National Institute for Public Health and the Environment: Bilthoven, The Netherlands, 2017. [Google Scholar]
  17. Goedkoop, M.; Spriensma, R. Eco-Indicator 99, a Damage Oriented Method for Life Cycle Impact Assessment—Methodology Report; Technical Report; National Institute of Public Health and the Environment: Amersfoort, The Netherlands, 2001. [Google Scholar]
  18. Acero, A.P.; Rodríguez, C.; Ciroth, A. LCIA methods—Impact Assessment Methods in Life Cycle Assessment and Their Impact Categories. 2015. Available online: https://www.openlca.org/wp-content/uploads/2015/11/LCIA-METHODS-v.1.5.4.pdf (accessed on 27 October 2023).
  19. Wackernagel, M. Ecological Footprint and Appropriated Carrying Capacity: A Tool for Planning toward Sustainability. Ph.D. Thesis, University of British Columbia, Vancouver, BC, Canada, 1988. Available online: https://open.library.ubc.ca/collections/ubctheses/831/items/1.0088048 (accessed on 30 October 2023).
  20. Bach, R.; Hildebrand, L. A Comparative Overview of Tools for Environmental Assessment of Materials, Components and Buildings. In Sustainable and Resilient Building Design: Approaches, Methods and Tools; KLABS: Mitrovica, Kosovo, 2018; pp. 143–157. [Google Scholar]
  21. PRé Sustainability, B.V. SimaPro. 2023. Available online: https://simapro.com/ (accessed on 5 November 2023).
  22. Sphera. LCA for Experts (GaBi). 2023. Available online: https://sphera.com/software-fuer-die-lebenszyklus-beurteilung-lca/?lang=de (accessed on 5 November 2023).
  23. GreenDelta. openLCA. 2023. Available online: https://www.openlca.org/ (accessed on 5 November 2023).
  24. Brightway Developers. Brightway LCA Software Framework. 2023. Available online: https://docs.brightway.dev/en/latest/ (accessed on 5 November 2023).
  25. iPoint-Systems GmbH. Umberto—Software für Nachhaltigkeit. 2023. Available online: https://www.ifu.com/de/umberto/ (accessed on 4 January 2024).
  26. Heijungs, R. CMLCA: Scientific Software for LCA, IOA, EIOA, and More. 2023. Leiden University, Faculty of Science, Institute of Environmental Science, Department of Industrial Ecology. Available online: https://personal.vu.nl/R.Heijungs/CMLCA/home.html (accessed on 4 January 2024).
  27. Speck, R.; Selke, S.; Auras, R.; Fitzsimmons, J. Life Cycle Assessment Software: Selection Can Impact Results. J. Ind. Ecol. 2016, 20, 18–28. [Google Scholar] [CrossRef]
  28. Bach, R.; Mohtashami, N.; Hildebrand, L. Comparative Overview on LCA Software Programs for Application in the Façade Design Process. J. Facade Des. Eng. 2019, 7, 13–26. [Google Scholar] [CrossRef]
  29. Emami, N.; Heinonen, J.; Marteinsson, B.; Säynäjoki, A.; Junnonen, J.M.; Laine, J.; Junnila, S. A Life Cycle Assessment of Two Residential Buildings Using Two Different LCA Database-Software Combinations: Recognizing Uniformities and Inconsistencies. Buildings 2019, 9, 20. [Google Scholar] [CrossRef]
  30. Miranda Xicotencatl, B.; Kleijn, R.; van Nielen, S.; Donati, F.; Sprecher, B.; Tukker, A. Data implementation matters: Effect of software choice and LCI database evolution on a comparative LCA study of permanent magnets. J. Ind. Ecol. 2023, 27, 1252–1265. [Google Scholar] [CrossRef]
  31. Dahlmann, K. A Method for the Efficient Evaluation of Climate Optimisation Measures for Air Transport [Eine Methode zur Effizienten Bewertung von Maßnahmen zur Klimaoptimierung des Luftverkehrs]. Ph.D. Thesis, Ludwig-Maximilians-Universität München, Munich, Germany, 2011. [Google Scholar]
  32. Lee, D.S.; Fahey, D.W.; Skowron, A.; Allen, M.R.; Burkhardt, U.; Chen, Q.; Doherty, S.J.; Freeman, S.; Forster, P.M.; Fuglestvedt, J.; et al. The Contribution of Global Aviation to Anthropogenic Climate Forcing for 2000 to 2018. Atmos. Environ. 2021, 244, 117834. [Google Scholar] [CrossRef] [PubMed]
  33. Calado, E.A.; Leite, M.; Silva, A. Integrating life cycle assessment (LCA) and life cycle costing (LCC) in the early phases of aircraft structural design: An elevator case study. Int. J. Life Cycle Assess. 2019, 24, 2091–2110. [Google Scholar] [CrossRef]
  34. Ribeiro, J.; Afonso, F.; Ribeiro, I.; Ferreira, B.; Policarpo, H.; Peças, P.; Lau, F. Environmental assessment of hybrid-electric propulsion in conceptual aircraft design. J. Clean. Prod. 2020, 247, 119477. [Google Scholar] [CrossRef]
  35. Butt, A.A.; Harvey, J.; Saboori, A.; Ostovar, M.; Bejarano, M.; Garg, N. Decision Support in Selecting Airfield Pavement Design Alternatives Using Life Cycle Assessment: Case Study of Nashville Airport. Sustainability 2021, 13, 299. [Google Scholar] [CrossRef]
  36. Léonard, P.L.Y.; Nylander, J.W. Sustainability Assessment of Composites in Aero-Engine Components. Proc. Des. Soc. Des. Conf. 2020, 1, 1989–1998. [Google Scholar] [CrossRef]
  37. Fabre, A.; Planès, T.; Delbecq, S.; Pommier-Budinger, V.; Lafforgue, G. Life Cycle Assessment Models for Overall Aircraft Design. In Proceedings of the 2022 AIAA SciTech Forum, AIAA, San Diego, CA, USA, 3–7 January 2022. [Google Scholar] [CrossRef]
  38. Carnegie Mellon University. EIO-LCA. 2023. Available online: http://www.eiolca.net/ (accessed on 5 November 2023).
  39. Chester, M.; Horvath, A. High-speed rail with emerging automobiles and aircraft can reduce environmental impacts in California’s future. Environ. Res. Lett. 2012, 7, 034012. [Google Scholar] [CrossRef]
  40. U.S. Department of Energy. Greet Model. 2023. Available online: https://greet.anl.gov/ (accessed on 5 November 2023).
  41. Al-Lami, A.; Hilmer, P.; Sinapius, M. Eco-efficiency assessment of manufacturing carbon fiber reinforced polymers (CFRP) in aerospace industry. Aerosp. Sci. Technol. 2018, 79, 669–678. [Google Scholar] [CrossRef]
  42. Rahn, A.; Wicke, K.; Wende, G. Using Discrete-Event Simulation for a Holistic Aircraft Life Cycle Assessment. Sustainability 2022, 14, 10598. [Google Scholar] [CrossRef]
  43. Rahn, A.; Wicke, K.; Wende, G. A Comparison of Temporally Dynamic Life Cycle Assessment Methods for Ecological Evaluation in Aviation. Procedia CIRP 2023, 116, 149–154. [Google Scholar] [CrossRef]
  44. Scholz, D. Airport 2030—Arbeitspaket 4.1. 2022. Available online: http://airport2030.profscholz.de/ (accessed on 25 March 2022).
  45. Köhler, M.O.; Rädel, G.; Dessens, O.; Shine, K.P.; Rogers, H.L.; Wild, O.; Pyle, J.A. Impact of Perturbations to Nitrogen Oxide Emissions from Global Aviation. J. Geophys. Res. Atmos. 2008, 113, D11305. [Google Scholar] [CrossRef]
  46. Rädel, G.; Shine, K.P. Radiative Forcing by Persistent Contrails and its Dependence on Cruise Altitudes. J. Geophys. Res. Atmos. 2008, 113, D07105. [Google Scholar] [CrossRef]
  47. Scholz, A.E.; Michelmann, J.; Hornung, M. Design, Operational and Environmental Assessment of a Hybrid-Electric Aircraft. In Proceedings of the AIAA Scitech 2021 Forum, Virtual, 11–15, 19–21 January 2021. [Google Scholar] [CrossRef]
  48. GreenDelta. Inter-Process Communication with openLCA. 2023. Available online: https://greendelta.github.io/openLCA-ApiDoc/ipc/ (accessed on 16 November 2023).
  49. Python Developers. olca-ipc 2.0.2. 2023. Available online: https://pypi.org/project/olca-ipc/ (accessed on 16 November 2023).
  50. Airbus, S.A.S. A320 Aircraft Characteristics Airport and Maintenance Planning; Revision No. 39—Dec 01/20; Airbus S.A.S.: Blagnac, France, 2020. [Google Scholar]
  51. Kossarev, K.; Scholz, A.E.; Hornung, M. Comparative Environmental Life Cycle Assessment and Operating Cost Analysis of Long-Range Hydrogen and Biofuel Transport Aircraft. CEAS Aeronaut. J. 2023, 14, 3–28. [Google Scholar] [CrossRef]
Figure 1. Phases of an environmental life cycle assessment, ref. [13], adapted from [3].
Aerospace 11 00101 g001
Figure 2. Steps during the impact assessment phase on the example of Phosphorus (P), adapted from [13] and [4] (Figure 3 in [4]); xP,freshwater stands for the amount of P emitted in freshwater.
Aerospace 11 00101 g002
Figure 3. Methodology of simplified LCA-AD tool of Johanning [12], adapted from [13].
Aerospace 11 00101 g003
Figure 4. Methodology of advanced openLCA-AD tool (automated interface MATLAB-Python-openLCA-MATLAB).
Aerospace 11 00101 g004
Figure 5. Single score comparison for simplified LCA-AD vs. advanced openLCA-AD tools for individual fuels relative to kerosene-powered aircraft.
Aerospace 11 00101 g005
Figure 6. Comparison of the single score shares of life cycle processes on different aircraft concepts for the simplified LCA-AD vs. advanced openLCA-AD tools.
Aerospace 11 00101 g006
Figure 7. Comparison of the endpoint categories “damage to human health” (row 1), “damage to ecosystems” (row 2) and “damage of resource availability” (row 3) for different aircraft concepts for the simplified LCA-AD vs. advanced openLCA-AD tools.
Aerospace 11 00101 g007
Figure 8. Comparison of the midpoint “climate change” for different aircraft concepts for the simplified LCA-AD vs. advanced openLCA-AD tools.
Aerospace 11 00101 g008
Table 1. Comparison of a selection of software and tools for process-based LCA.
SimaProLCA for Experts Former GaBiopenLCABrightway2LCA-AD
OriginNetherlands, PRé Consultants, 1990 [21]Germany, PE International, 1992 [22]Germany, GreenDelta, 2010 [23]Switzerland, Paul Scherrer Institut, 2011 [24]Germany, Technical University of Munich, 2017 (2022 extended) [12,13]
Required user knowledgeexpertexpertbasic/expertexpertbasic
Documentation and tutorialsavailableavailableavailableavailablelimited
Accessibilitypaidpaidfree (paid add-ons)open sourceopen source
Data sourcescan import external datacan import external datacan import external datacan import external dataUses ELCD
LCIA methodsvariousvariousvariousvariousReCiPe only
Sensitivity analysisyesyesyesyesyes
API integration and model customizationyes (COM-interface)noyes (Java API)yes (Python API)yes
Table 2. Qualitative and quantitative metrics for LCA tool evaluation in conceptual aircraft design.
MetricPriorityComment *
QuantitativeSingle scorehighnot mentioned
Damage to human healthhigh 27 %
Damage to ecosystemshigh 27 %
Damage to resource availabilityhigh 27 %
Climate Changehigh 82 %
(Photochemical oxidant formation) summer smogmid 44 %
(Mineral and fossil) resource scarcitymid 44 %
Terrestrial acidificationmid 44 %
Human (non- and carcinogenic) toxicitymid 42 %
Particulate matter formationlow 38 %
(Freshwater and marine) eutrophicationlow 33 %
(Terrestrial, freshwater, marine) ecotoxicitylow 31 %
Ozone depletionlow 29 %
(Land) natural area uselow 24 %
Ionizing radiationlow 22 %
Water consumptionlow 11 %
QualitativeDiagnostic usehighHow efficient is the software in terms of result traceability?
Uncertainty analysishighTo what degree are uncertainty analysis possible?
LCI and LCIA adaptabilitymidWhat is the degree of difficulty involved in extending the software with respect to new databases or assessment methods?
Implementation stabilitymidTo what extent does the software’s implementation exhibit vulnerability to errors?
Level-of-detailmidWhat is the depth of detail included in the software’s modeling?
User-friendlinesslowTo what extent does the software exhibit ease of use?
Time effortlowTo what extent does the modeling require time investments?
* percentage values refer to [8].
Table 3. Qualitative metric evaluation of the simplified LCA-AD and advanced openLCA-AD tool.
SimplifiedAdvanced
RequirementWeighting *Rating **TotalRating **Total
Diagnostic use33926
Uncertainty analysis33939
LCI & LCIA adaptability21236
Implementation stability23624
Level-of-detail20024
User-friendliness13311
Time effort13311
Points (of maximum 39) 32 31
* Priority low = 1, mid = 2, high = 3. ** Rating from 0 to 3 with 0 as, e.g., for “diagnostic use” 0 for not traceable and 3 for easy to trace.
Disclaimer/Publisher’s Note: The statements, opinions and data contained in all publications are solely those of the individual author(s) and contributor(s) and not of MDPI and/or the editor(s). MDPI and/or the editor(s) disclaim responsibility for any injury to people or property resulting from any ideas, methods, instructions or products referred to in the content.

