Article

Using the Impulse Method to Determine High-Pressure Dynamic Burning Rate of Solid Propellants

Key National Laboratory of Solid Rocket Propulsion, Northwestern Polytechnical University, Xi’an 710072, China
*
Author to whom correspondence should be addressed.
Aerospace 2023, 10(9), 818; https://doi.org/10.3390/aerospace10090818
Submission received: 21 August 2023 / Revised: 11 September 2023 / Accepted: 13 September 2023 / Published: 18 September 2023
(This article belongs to the Special Issue Combustion Evaluation and Control of Solid Rocket Motors)

Abstract

:
A new method for determining the burning rate of a solid propellant, called the Impulse Method, is proposed in this paper. It is based on the proportional relationship between the impulse generated and the mass of the burned propellant. The pressure–time and thrust–time curves are obtained from a tubular propellant grain burning in the chamber, whose inner surface serves as the initial burning surface. Consequently, the mass of the propellant that was burned off at different pressures can be determined, and the burning rates at different pressures are derived according to the geometric parameters of the propellant grain. The Impulse Method was applied to test the burning rate of two types of propellants twice. The results show that the burning rates were consistent for the same propellant at corresponding pressures, demonstrating the feasibility and reliability of the Impulse Method. The burning rate of a GAP-based composite propellant at 20 MPa measured using the Standard Motor Method was 22.6 mm/s, and that measured using the Impulse Method was 22.2 mm/s and 22.7 mm/s, respectively. These findings indicate that the two methods have comparable accuracy. However, the Impulse Method has the advantage of obtaining the burning rate of the solid propellant at any pressure through a single test. In addition, the nozzle erosion only affected the pressure and not the burning rate. Finally, the rationality of the approach for determining the actual specific impulse was proven by comparing the results with those from another testing method.

1. Introduction

The burning rate and pressure exponent of a solid propellant are critical performance parameters for designing solid rocket motors [1]. The combustion mechanism of a solid propellant is complex and influenced by various factors, such as the formulation, pressure, initial temperature, gas flow velocity, and condensed combustion products [2,3]. However, despite extensive research, the current understanding of the underlying mechanisms is still limited. This lack of understanding hinders the accurate prediction of the solid propellant burning rate. Therefore, experimental measurements are generally employed to determine the solid propellant burning rate.
Traditional methods used for determining the burning rate include the Strand Burner Method and the Underwater Acoustic Emission Method [4]. While these methods have been widely used, researchers have continuously strived to improve their accuracy and efficiency [5,6,7]. In recent years, there has been a growing interest in studying the combustion performance of solid propellants under high-pressure conditions [8]. The Closed Bomb Method can be used to test the high-pressure burning rate of propellants. However, it faces challenges in accurately correcting the heat loss and determining the average molecular weight of the combustion gas [9,10,11,12]. To validate steady-state and unsteady-state burning theories of solid propellants, researchers have focused on measuring the transient burning rate. Several techniques have emerged as effective means of testing the transient burning rate of solid propellants, including the Microwave Method [13,14,15,16] and the Ultrasonic Method [17,18,19,20,21,22,23]. Furthermore, the application of laser and photography techniques [24,25,26,27] provides added avenues for measuring the transient burning rate.
One of the notable methodologies proposed in the literature is the Mass Flow Rate Method [28,29]. This method offers a wide pressure testing range and enables the measurement of the dynamic burning rate at a high pressure. However, it relies on the assumption that the nozzle throat diameter and the characteristic velocity remain constant during data processing, which can introduce errors in the results.
In this paper, we propose a novel method for determining the dynamic burning rates of solid propellants at a high pressure based on the fundamental principles of solid rocket motor operation. It utilizes the gas generated from the burning of the propellant itself to create a high-pressure environment, which eliminates the need for pipelines of constant pressure systems and external high-pressure gas sources. Furthermore, the method enables the determination of the burning rate at any desired pressure within an extended pressure range through a single experiment. With this method, we can achieve testing with pressures of up to 40 MPa, allowing for a comprehensive investigation of the propellant burning rate under high-pressure conditions.

2. Measurement Principle and Experiment

2.1. Test System

Figure 1 shows the testing system of the Impulse Method for determining the high-pressure dynamic burning rates of solid propellants. The system consists of five essential components: a compact thick-walled solid rocket test motor equipped with sensors, a vertical test stand, a data acquisition device, an igniter, and a data processing device. The test motor, which is equipped with pressure and thrust sensors, is securely mounted on the vertical test stand. The data acquisition device connects the sensors and the data processing device, allowing for real-time data transfer and analysis. The igniter triggers the primer cartridge in the test motor to initiate the ignition process. And the solid propellant grain under examination is loaded freely in the chamber of the test motor, where it undergoes ignition and subsequent burning.
During the burning process, the integrated testing and data acquisition systems capture and record the thrust produced by the test motor, as well as the pressure signals within the chamber. These signals provide valuable information on the dynamic burning rate of a propellant under high-pressure conditions.
The propellant grain is designed as a tubular configuration, as shown in Figure 2. The end faces and outside surfaces of the propellant grain are coated to prevent burning, leaving only the inner surfaces exposed as the initial ignition surface. During testing, the propellant grain’s initial burning surface is uniformly ignited in perfect synchronization, and the subsequent burning surface follows the parallel layer rule. The propellant exhibits stable burning, without any unstable burning such as erosive burning. Moreover, the actual changing pattern of the burning surface matches the design specifications. In addition, it is assumed that the combustion can respond quickly to the pressure changes.

2.2. Principles

2.2.1. Data Processing

When the primer cartridge in the test motor is ignited, a distinct peak ignition pressure is observed, as indicated by point A in Figure 3. Then, at time t1, the propellant’s initial burning surface is uniformly ignited, and the propellant burns according to the parallel layer rule. The burning surface of the propellant expands from its initial state, resulting in increased pressure and thrust signals over time. At time t2, the propellant grain is completely burned out, causing a sharp drop in the chamber pressure and motor thrust. Figure 3 shows the time-dependent variations of the chamber pressure and motor thrust during this process.
In Figure 3, the curves are pressure–time and thrust–time traces (P~t and F~t), respectively. t1 and t2 are the initial moment and final moment of propellant burning, respectively. The total impulse (I0) of the propellant can be obtained according to Equation (1):
I 0 = t 1 t 2 F ( t ) d t
After that, the average specific impulse ( I s ¯ ) and the average pressure of the propellant during the whole burning process of the propellant ( P ¯ ) are obtained using Equation (2) and Equation (3), respectively.
I s ¯ = I 0 / M p
P ¯ = t 1 t 2 P ( t ) d t   / ( t 2 t 1 )
The burning time of the propellant is divided into n (n > 1) segments, and each segment is denoted as si ( i = 1 , 2 , 3 , , n ). The duration of si is denoted as  Δ ti, mi is the mass of the propellant burned during  Δ ti, and    P i ¯  is the average pressure of si. There is a relationship, as shown in Equation (4):
I 0 i = m i · I s ( P i ¯ )
where I0i is the total impulse of si I s ( P i ¯ )  is the specific impulse at the corresponding    P i ¯ , and  I s P i ¯  is a function of    P i ¯  and can be obtained through the approach given later. Additionally, I0i and    P i ¯  can be obtained using Equations (5) and (6):
I 0 i = Δ t i F ( t ) d t
P i ¯ = Δ t i P d t / Δ t i
Then, mi is obtained using Equation (7):
m i = I 0 i / I s ( P i ¯ )
en is the web thickness of the propellant that was burned off during  Δ tn. According to the geometric parameters of the propellant grain, en can be calculated using Equation (8):
m n = π D 2 D 2 e n 2 L ρ p / 4
Correspondingly, en−1, en−2, …, e1 can be solved sequentially through the following relationships:
m n 1 = π D 2 e n 2 ( D 2 e n 2 e n 1 ) 2 L ρ p / 4
m n 2 = π 4 ( D 2 e n 2 e n 1 ) 2 ( D 2 e n 2 e n 1 2 e n 2 ) 2 L ρ p
ρ p  in Equations (8)–(10) is the density of the propellant grain.
In addition, the pressure at each moment of  Δ ti is considered to be equal to    P i ¯ , and the burning rate (ri) corresponding to  P i ¯  is
r i = e i / Δ t i

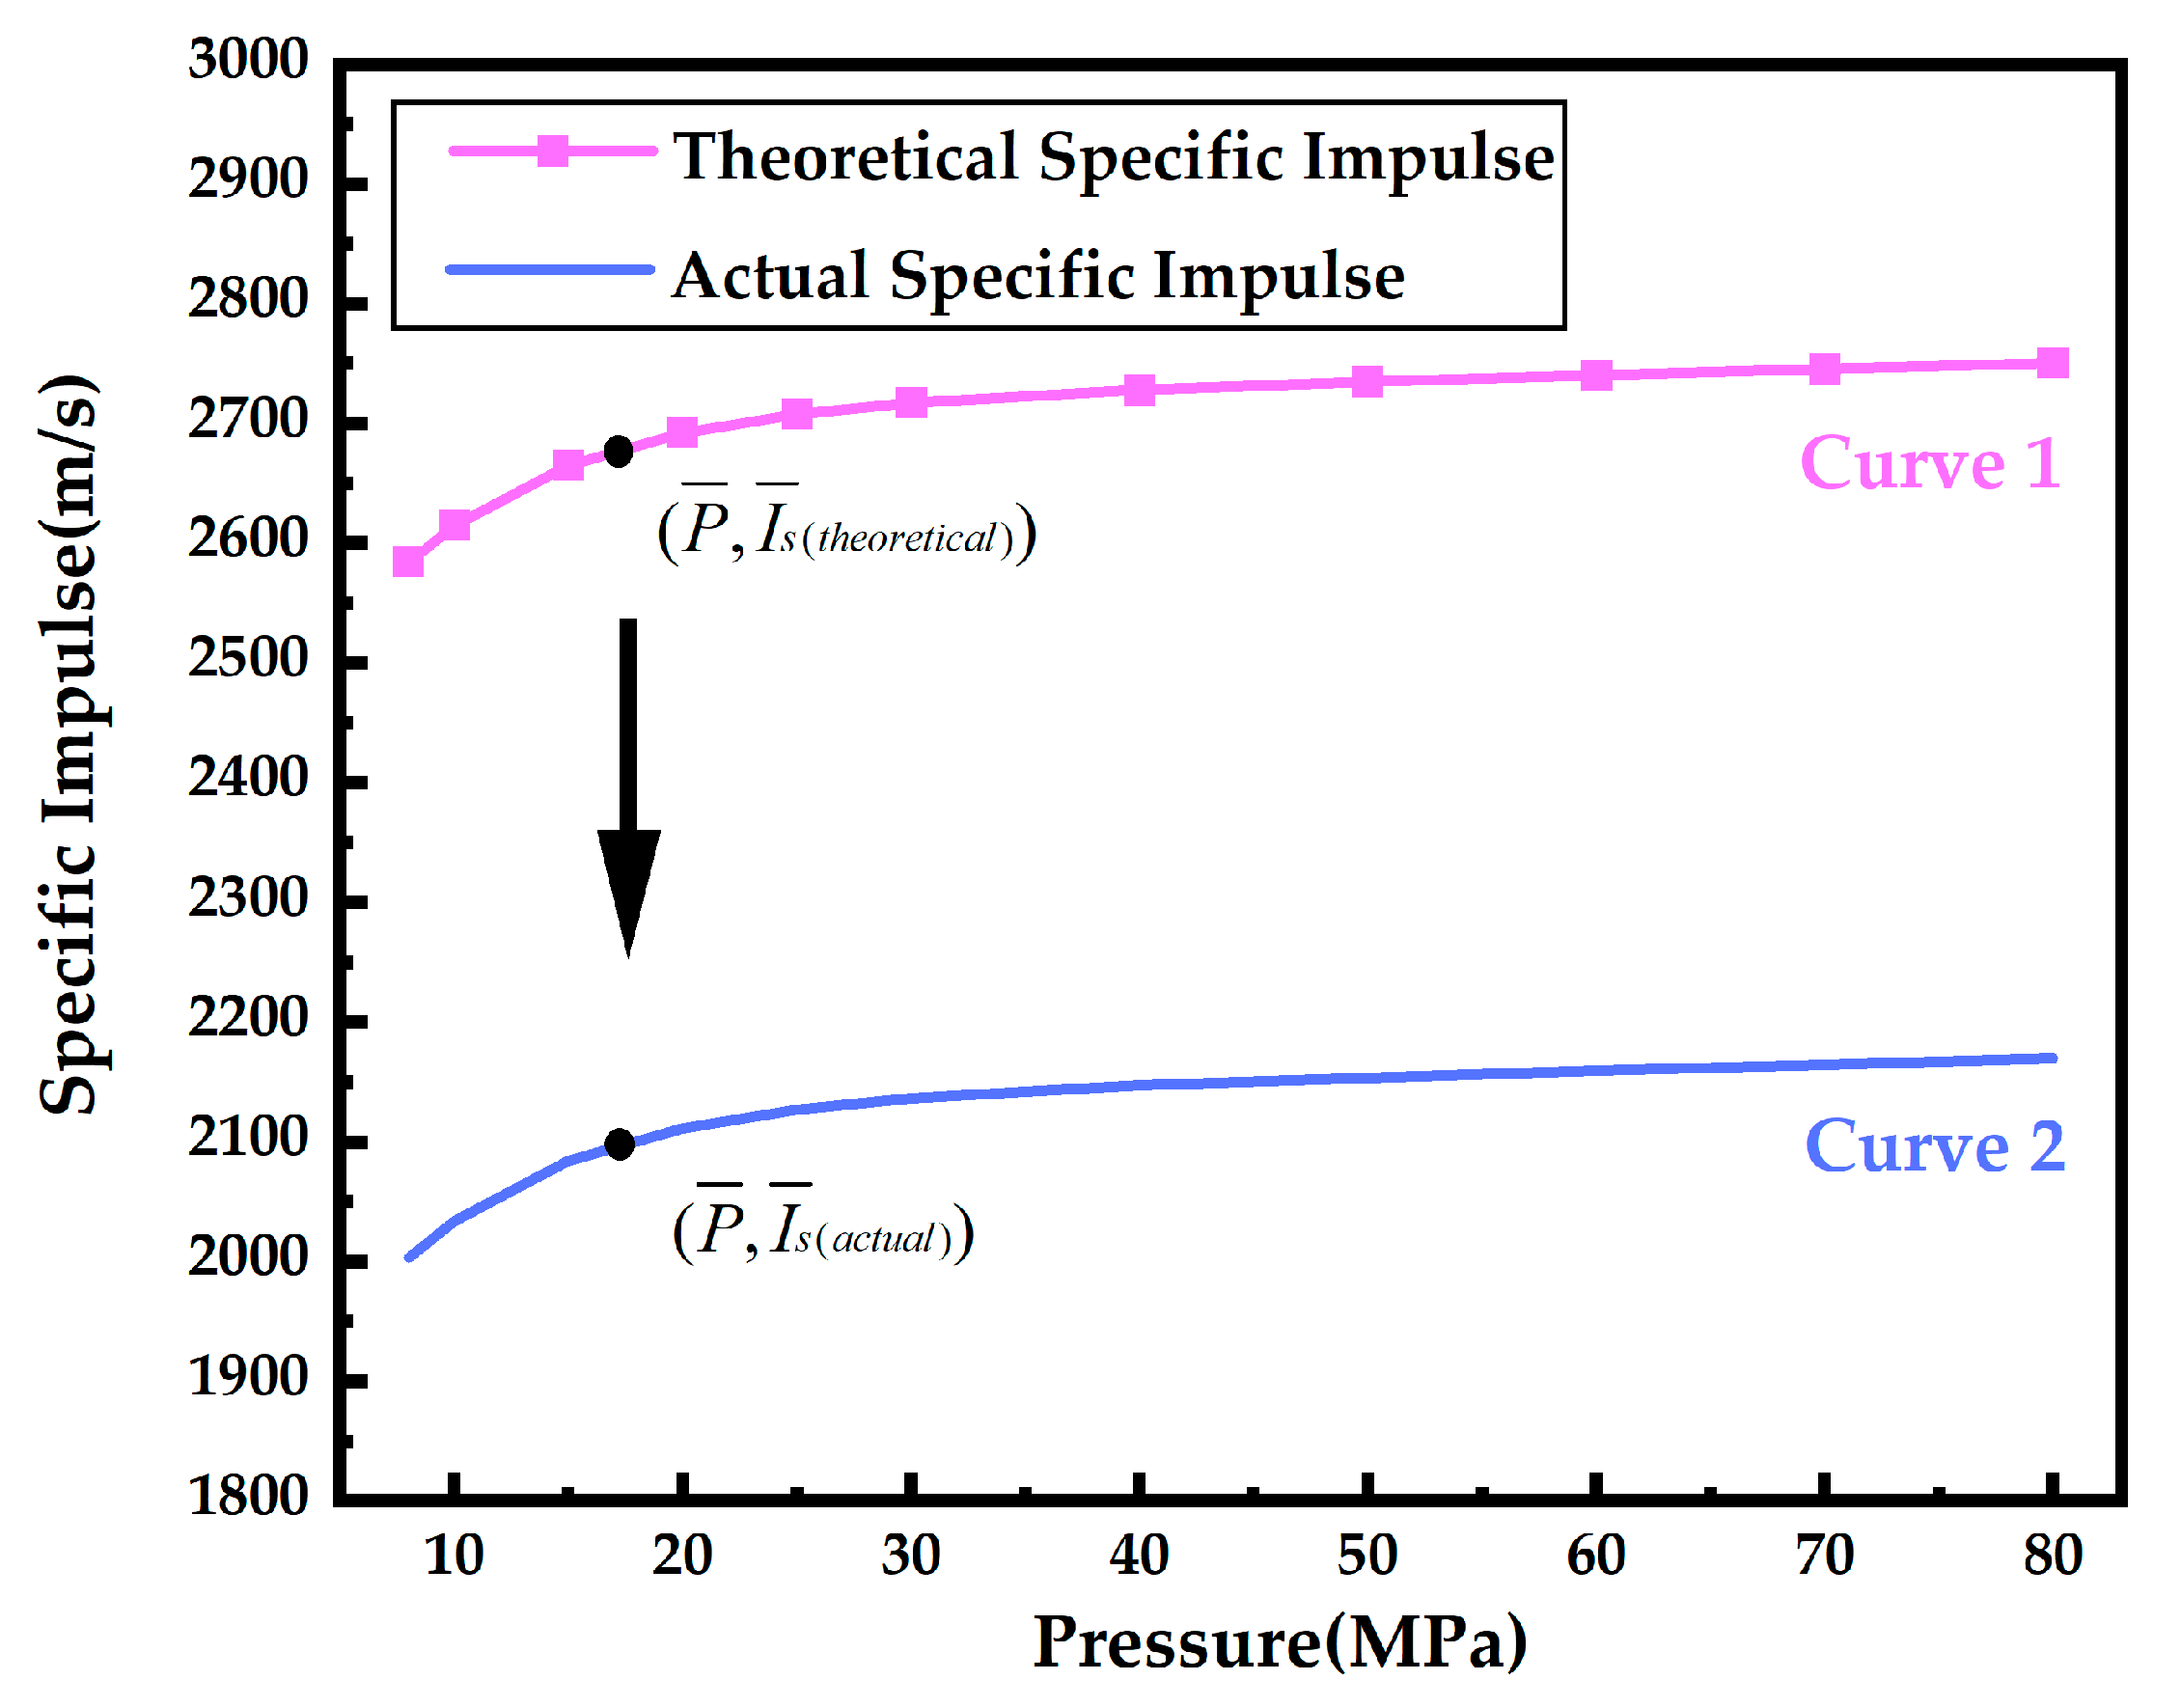
2.2.2. Actual Specific Impulse

In Equation (4), the actual specific impulse (Is(actual)) at the corresponding pressure is unknown, but it is essential for subsequent data processing. Assuming that the actual specific impulse follows a consistent trend with the theoretical specific impulse (Is(theoretical)) as a function of pressure, the following method is proposed to determine the specific impulse at the corresponding pressure:
(1)
Use the chemical thermodynamic calculations based on the tested propellant’s composition to obtain the theoretical specific impulse values at a series of different pressures.
(2)
Fit the pressures and corresponding theoretical specific impulse values using an appropriate mathematical function, which will result in a function depicting the variation of the theoretical specific impulse with the pressure (Is(theoretical) ~ P), as shown by curve 1 in Figure 4.
(3)
Use Equations (2) and (3) to calculate the average specific impulse and the average pressure values, respectively. Locate the corresponding point ( P ¯ , I s ¯ ( a c t u a l ) ) in Figure 4.
(4)
Since the actual specific impulse should be lower than the theoretical specific impulse, shift curve 1 in Figure 4 downward in parallel until it passes through the point ( P ¯ , I s ¯ ( a c t u a l ) ). This adjustment will produce curve 2, representing the relationship between the actual specific impulse and the pressure (Is(actual) ~ P).

3. Experimental Results and Analysis

3.1. Experimental Samples

The experimental samples were GAP-based composite propellants and SQ2 double-base propellants. The main components of the SQ2 double-base propellants were nitrocellulose, nitroglycerin, dinitrotoluene, calcium carbide, and lead oxide. It is important to note that the formulation of the SQ2 propellants used in the experiments was consistent, but the grain dimensions varied. The binder systems of the GAP-based composite propellants were based on GAP, with other key components including aluminum powder and oxidizer AP/HMX. Similarly, the formulations of the GAP-based composite propellants remained uniform, but the grain dimensions varied in the experiments.
Table 1 provides an overview of the geometrical dimensions and densities of the propellant grains, as well as the nozzle throat diameters. The outer diameter, inner diameter, and length of the propellant grain are represented by D, d, and L, respectively. Moreover, the initial and final throat diameters of the nozzle are represented by dt1 and dt2, respectively.

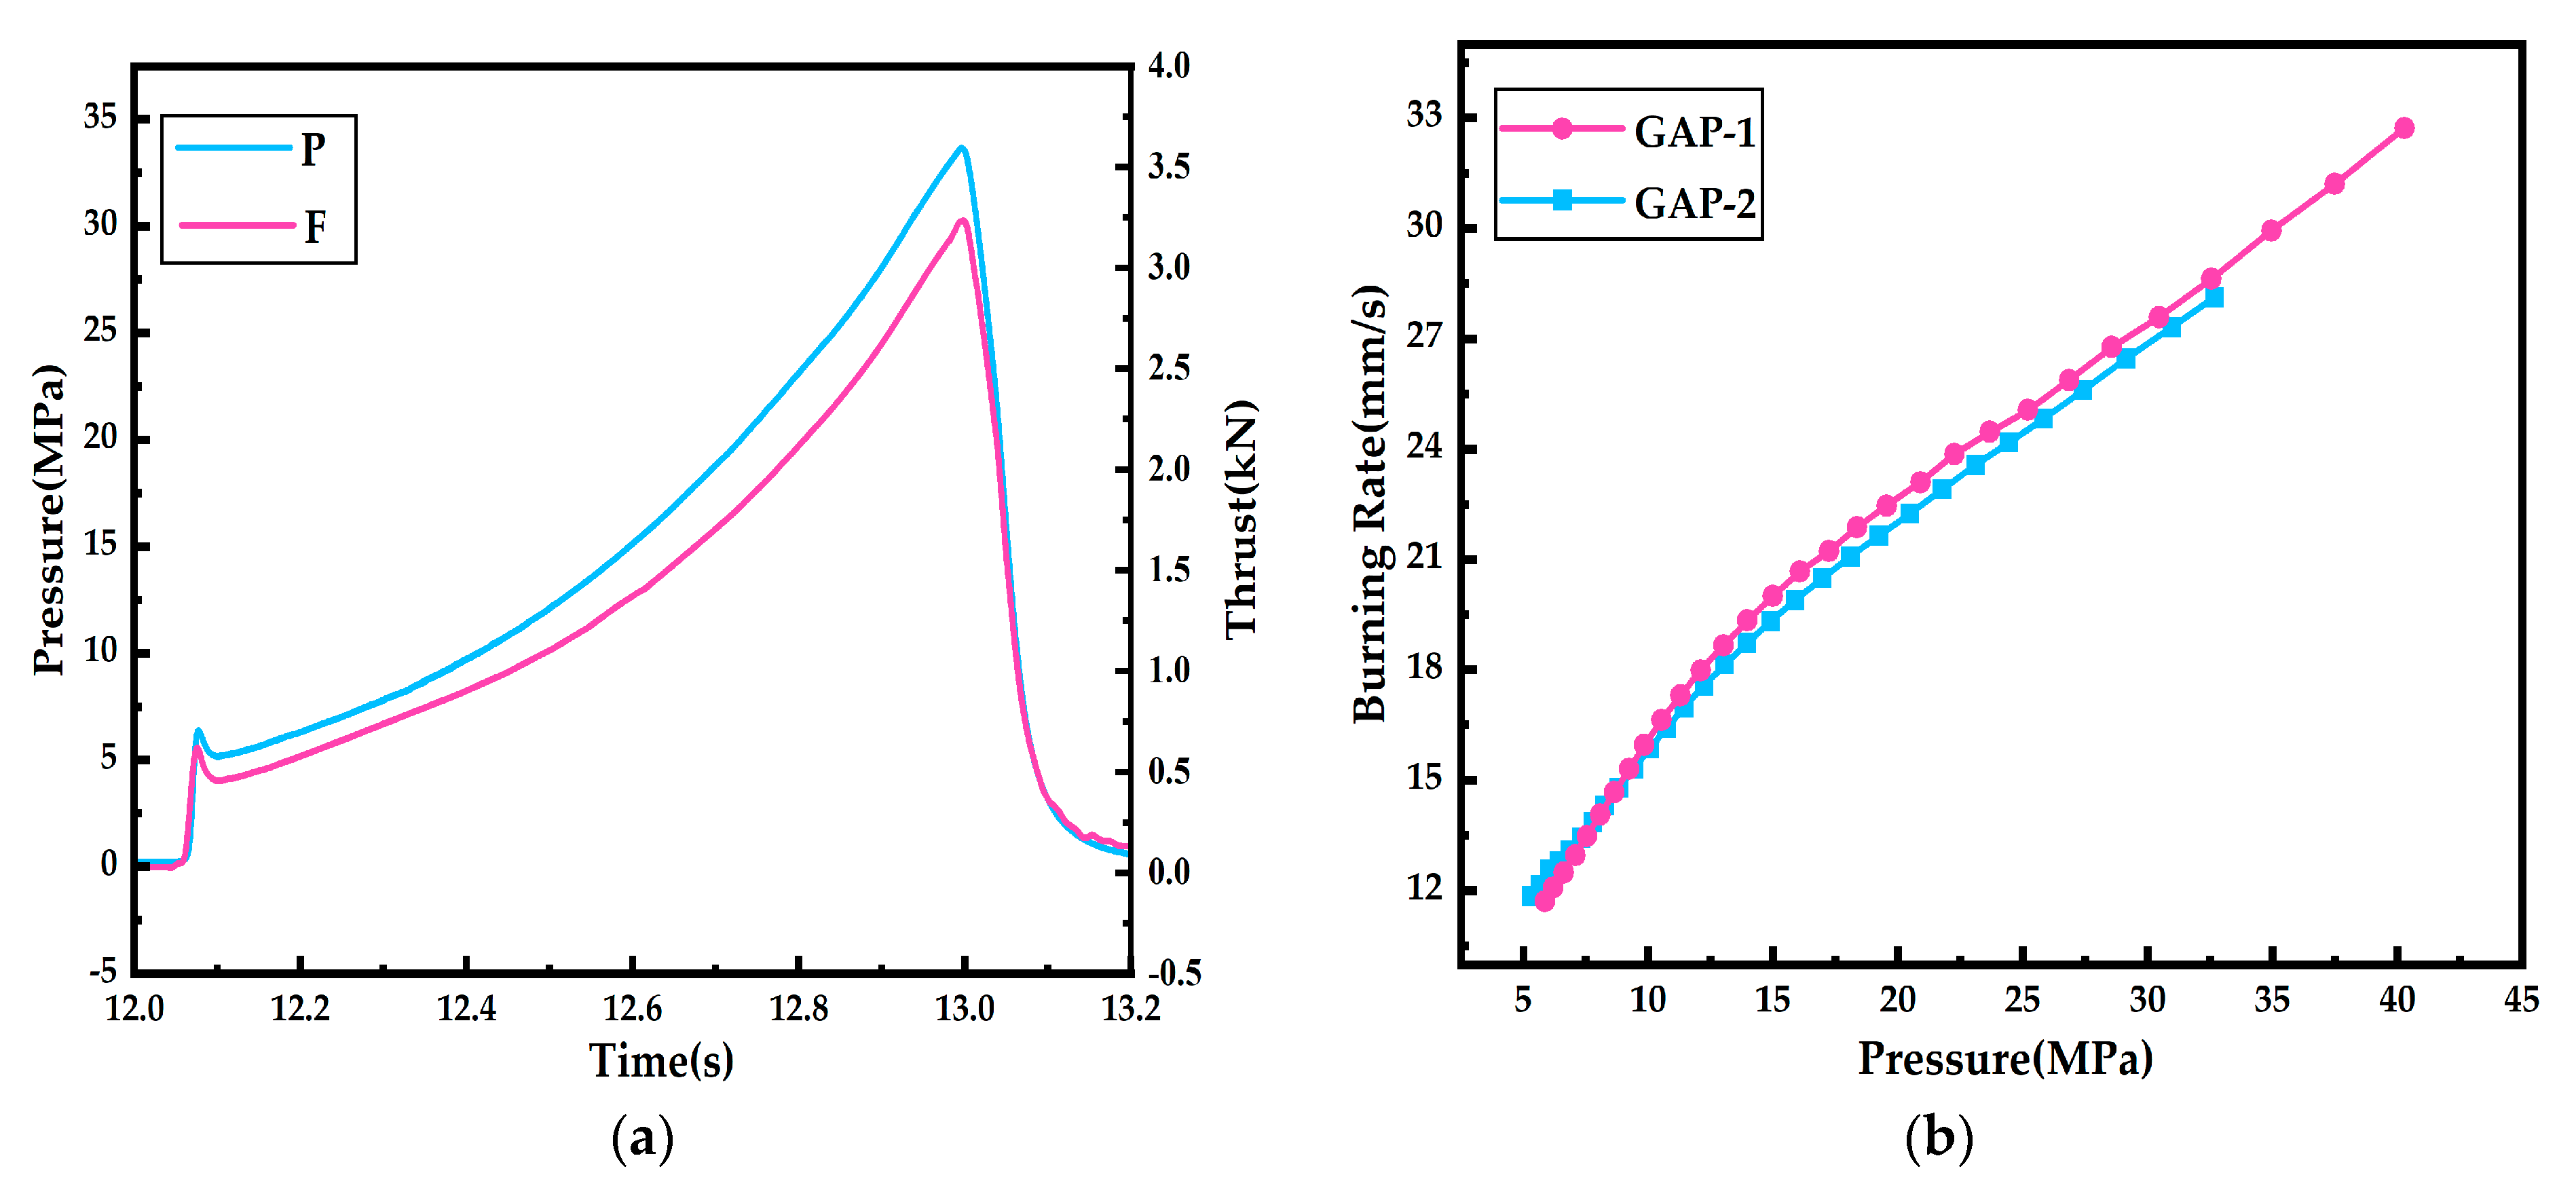
3.2. Processing of Test Data for GAP-1

The P~t and F~t curves of GAP-1, GAP-2, SQ2-1 and SQ2-2 were obtained using the Impulse Method. Taking GAP-1 as an example, the data processing method of the Impulse Method described in Section 2.2.1 was used to calculate the burning rates at a range of pressures.
Figure 5a shows the P~t and F~t curves of GAP-1, where the pressure and thrust of the working section both increased with time. The curves between the initial and final moments of propellant burning in Figure 5a were extracted, resulting in the curves shown in Figure 5b, which were the bases for the subsequent data processing to obtain the burning rates.
According to the propellant formula, the theoretical specific impulses of the GAP-based propellant at different pressures were obtained via a chemical thermodynamic calculation, and they are shown in Table 2. The data in Table 2 were fitted, and the result is shown in Figure 4. The fitting function was the following (curve 1 in Figure 4):
I s = 2709 × e 1.9 × 10 4 P 365.6 × e 0.13 P
Based on Figure 5b, the average pressure of the whole working process of the motor was calculated using Equation (3), which was  P ¯  = 17.92 MPa. The total impulse was calculated using Equation (1), which was  I 0  = 1057.88 N·s. The average specific impulse of the propellant was 1978.04 m/s. It should be noted that the actual specific impulse of the propellant is normally lower than the theoretical specific impulse. In this test, the expansion efficiency of the nozzle was not considered, so the actual specific impulse was much lower. The fitting function was modified according to the calculated actual average pressure and the average specific impulse values, and the corrected result is shown as follows (curve 2 in Figure 4):
I s = 2709 × e 1.9 × 10 4 P 365.6 × e 0.13 P 580.73
Then, the burning period was divided into 30 segments, each of which was 27.8 ms. According to data in Figure 5b and the processing method in Section 2.2.1, the following parameters were calculated in order: the total impulse within each time period (I0i), the average pressure during each time period ( P i ¯ ), the mass burned in each time period (mi), and the web thickness that was burned off at each time period (ei). Notably,  I s ( P i ¯ )  in Equation (7) is the actual average specific impulse corresponding to each average pressure. Thus, the burning rate ri corresponding to each  P i ¯  could be calculated using Equation (11). The calculation results are shown in Table 3.
Since the specific impulses used in the calculation process were corrected values (actual specific impulse), if the corrected values were reasonable, the sum of the calculated masses of the burned-off propellant for each segment should be equal to Mp. According to the burning masses in Table 3, the sum was 590.68 g. Based on the dimensions of the propellant grain, the real mass was 591.16 g. Obviously, the two values were almost equal. This showed that the calculation method and process were reasonable.

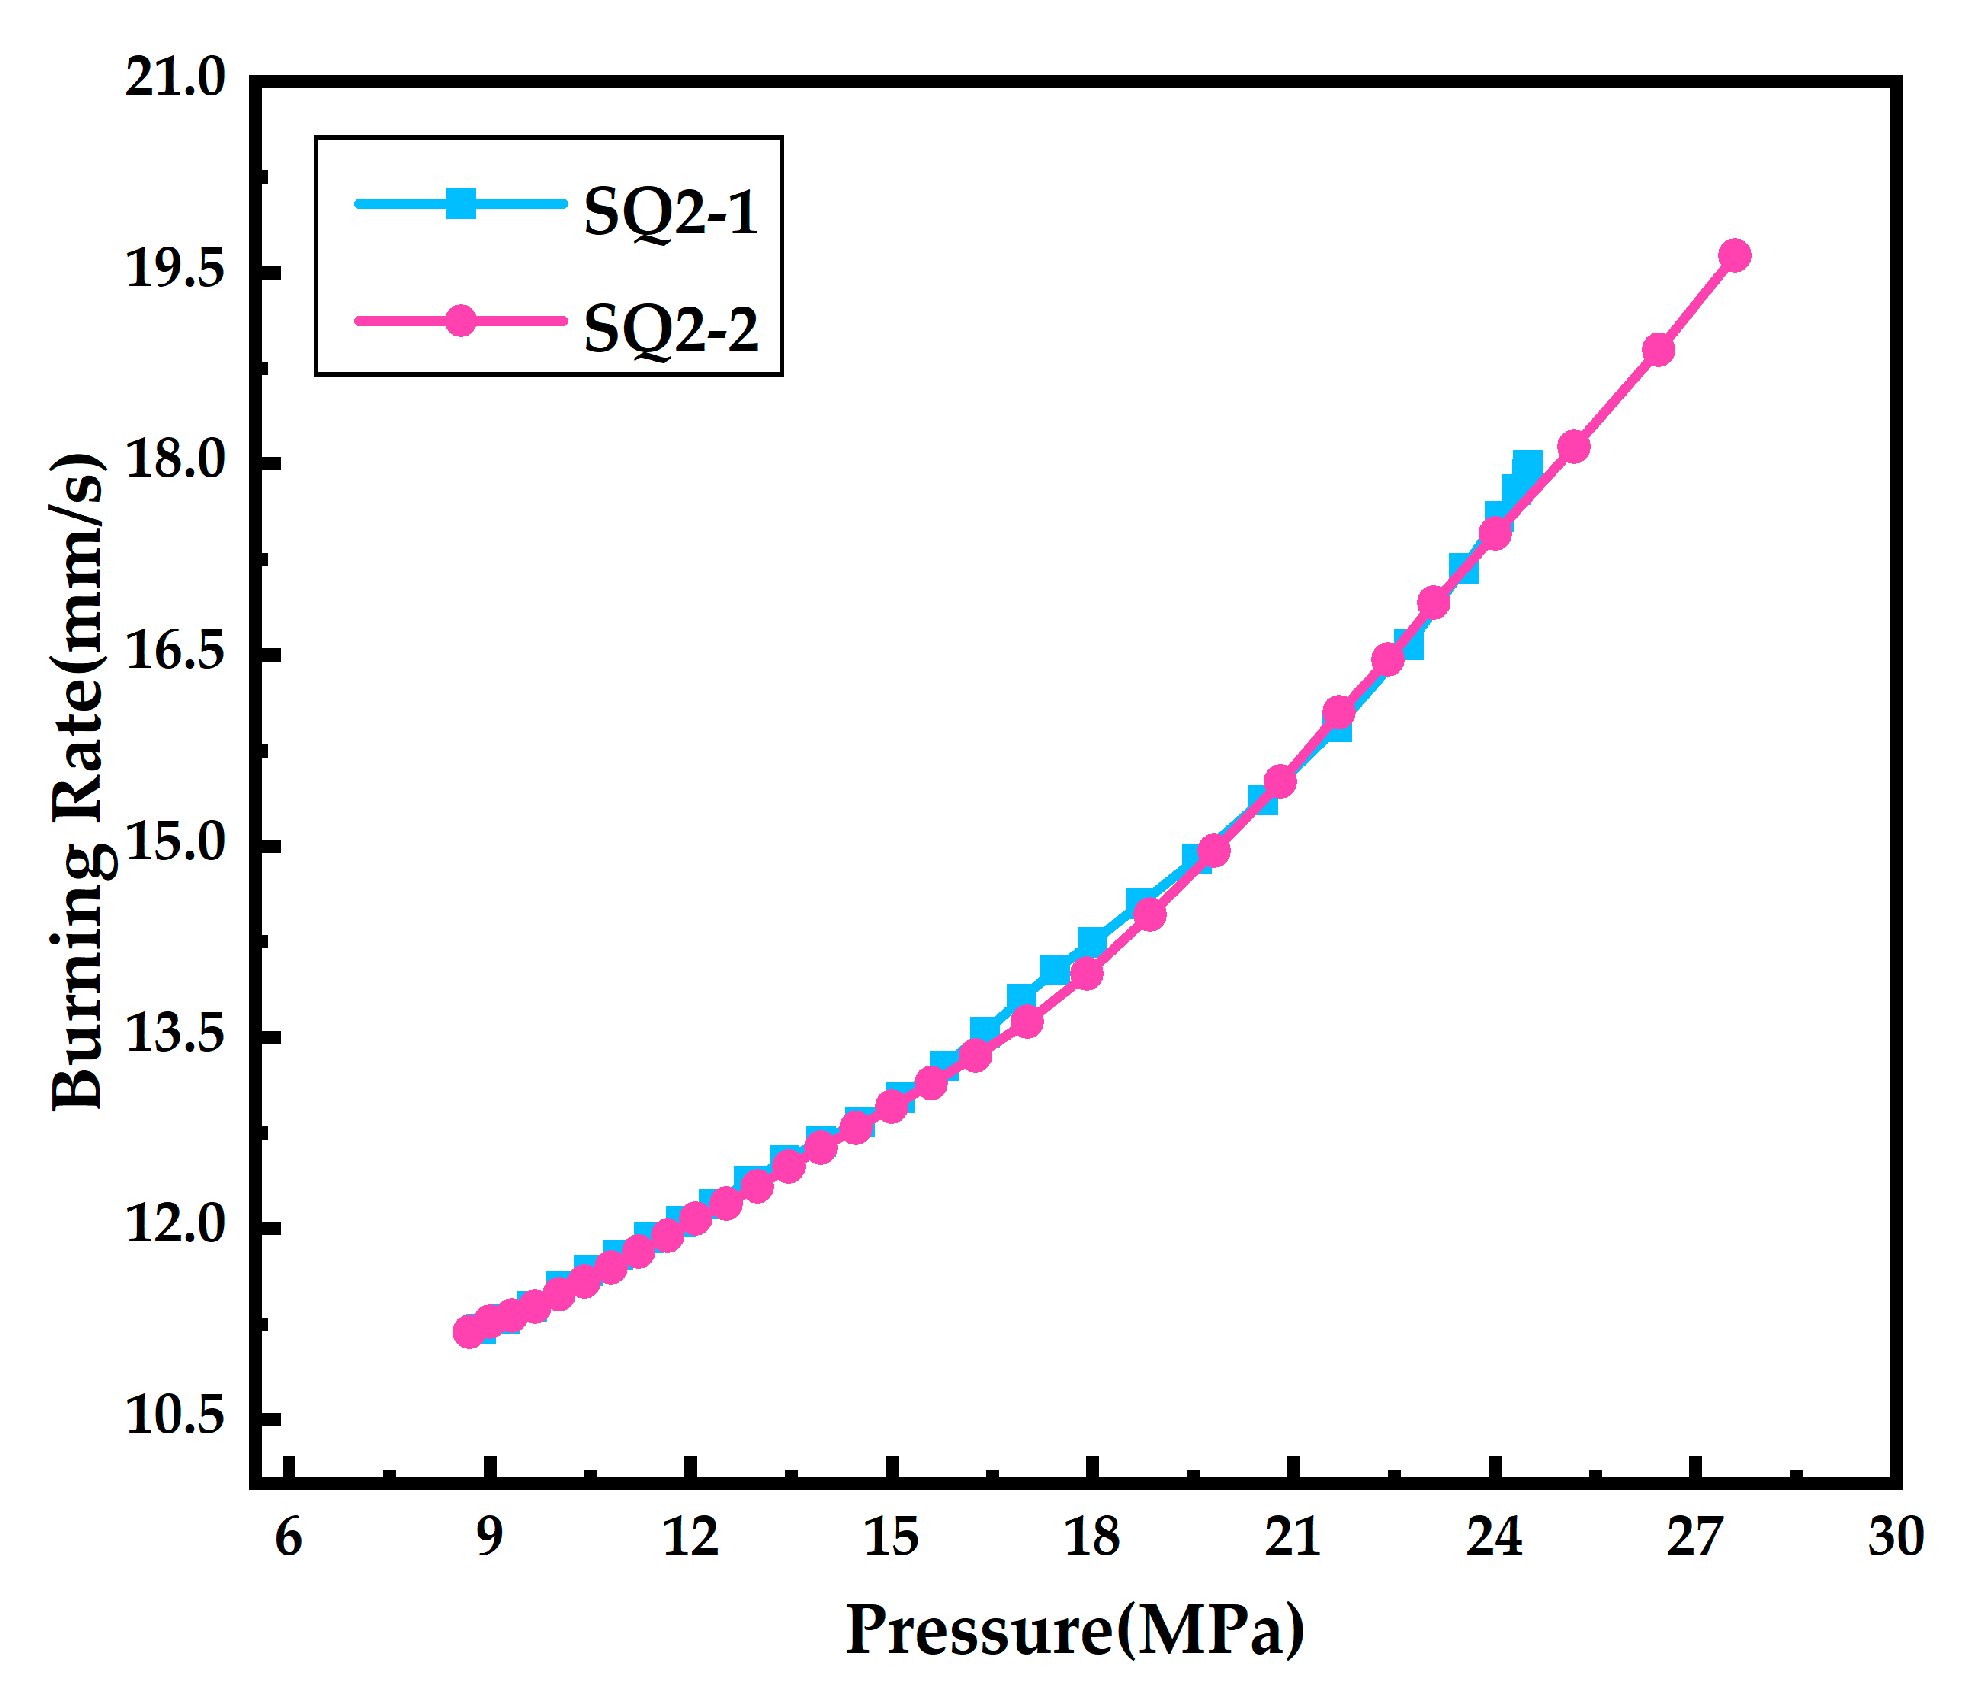
3.3. Burning Rate Test Results and Analysis

Figure 6 displays the P~t curves and F~t curves of GAP-2. The burning rates at various pressures of all the samples in experiment, obtained through meticulous data processing with the Impulse Method, are partially listed in Table 4.
Figure 6a displays the P~t and F~t curves of GAP-2. It can be observed that the thrust and pressure gradually increased over time during propellant burning, reaching their peak values when the propellant grains were completely burned out. The maximum pressure achieved was 33.65 MPa. Following this peak, the pressure and thrust experienced a rapid decline. Furthermore, the burning time was measured to be 0.8968 s.
The comparison of the burning rates between two grains, GAP-1 and GAP-2, is illustrated in Figure 6b. It can be observed that both groups of burning rates increased with the increasing pressure, and at the same pressure, the burning rates were nearly equal. The maximum difference in the burning rate at the same pressure was less than 1 mm/s, as indicated by the data in Table 2, demonstrating a high level of reproducibility. Additionally, the burning rate of the GAP composite propellant at 20 MPa, obtained using the Standard Motor Method and the Impulse Method, was consistent. The burning rate obtained using the Standard Motor Method was 22.6 mm/s, and the Impulse Method yielded values of 22.2 mm/s and 22.7 mm/s, respectively. This consistency indicated that the two types of methods had comparable accuracy for testing the burning rate of a solid propellant.
The P~t and F~t curves of the SQ2-1 and SQ2-2 are shown in Figure 7a and Figure 7b, respectively. Similar to the trends of GAP-1 and GAP-2, it can be observed in Figure 7b that the thrust and pressure increased with time during propellant burning. The maximum pressure achieved by SQ2-2 was 28.06 MPa when the grain burned out, and the burning time was 1.2690 s.
In Figure 7a, the burning time of SQ2-1 was measured to be 1.3638 s. Initially, both the pressure and thrust increased with time. However, in the final period, the pressure tended to stabilize, while the corresponding thrust continued to incrementally increase. Notably, erosion of the nozzle was observed, indicated by an increase in the throat diameter from 8.10 mm before the test to 9.42 mm after the test, explaining why the pressure reached a plateau. As shown in Equation (14), the increasing At resulted in incremental thrust under constant pressure.
F = C F P A t
where At is the cross-sectional area of the nozzle throat; CF is the thrust coefficient; and P is the chamber pressure.
Figure 8 shows the comparison of the burning rates obtained from testing SQ2-1 and SQ2-2. It can be seen that the burning rate increased with the increasing pressure for both samples. Furthermore, at the same pressure, the burning rates of SQ2-1 and SQ2-2 were found to be nearly equal. By comparing the burning rates of SQ2-1 and SQ2-2 at the same pressure presented in Table 4, it was determined that the maximum deviation was less than 0.3 mm/s, highlighting the high level of reproducibility.
According to the data for SQ2-1 in Table 4, the burning rates at similar pressures (24.50 MPa) during different periods were determined to be 17.99 mm/s, 18.00 mm/s, and 18.04 mm/s. These results highlight the high reproducibility of the burning rates at nearly equal pressures. Similarly, the burning rate of SQ2-2 at 24.50 MPa was found to be 17.98 mm/s, as shown in the data for SQ2-2. It can be observed that the burning rates, whether they were obtained from a single test or multiple tests, were almost equal at the same pressure. Therefore, it is concluded that the Impulse Method is both feasible and reliable. Additionally, the erosion of the nozzle only affects the trend of the pressure change during testing with the Impulse Method, without significantly impacting the burning rate of the propellant.

3.4. Rationality of the Method for Determining Is(actual)

In addition to the Impulse Method, the Mass Flow Rate Method [28,29] is widely employed for testing the burning rate of a solid propellant in solid rocket motors. This method involves generating an incremental P~t curve with the burned propellant grain (as depicted in Figure 2), in which the inner surface of the grain serves as the initial burning surface. Based on the principle that the gas mass flow rate at the nozzle throat is equal to the mass of the propellant that was burned off, and assuming that both the characteristic velocity and throat diameter are constant throughout the test process, the average pressure and the corresponding mass of propellant consumed can be determined using Equation (6) and Equation (15), respectively.
m i = A t Δ t i P ( t ) d t / C * = M P Δ t i P ( t ) d t / t 1 t 2 P ( t ) d t
Subsequently, the burning rates at different pressures can be derived according to the geometric parameters of the propellant grain using Equations (8)–(11). Figure 9 illustrates the underlying principles and steps involved in this method, while more detailed information regarding the data processing procedures can be found in relevant studies.
Similar to the Impulse Method, the Mass Flow Rate Method provides an alternative approach to determine the burning rate of a solid propellant in a compact thick-walled solid rocket test motor equipped with sensors. By analyzing the incremental P~t curve generated during the burning process, valuable insights into the propellant’s burning rate characteristics can be gained. The Mass Flow Rate Method relies on the assumption of a constant characteristic velocity and throat diameter, allowing for researchers to accurately calculate the mass of the propellant that was burned off. These then enable the derivation of burning rates at various pressures. Most remarkably, the P~t trace generated from one propellant sample can be used as test data for both the Impulse Method and the Mass Flow Rate Method to obtain the burning rates.
According to the P~t curve of GAP-1 in Figure 5a and the dimensional parameters in Table 1, the burning rates obtained using the Impulse Method and the Mass Flow Rate Method can be calculated, and they are illustrated in Figure 10a. It can be observed that the burning rates obtained using the Impulse Method were slightly greater than those obtained using the Mass Flow Rate Method at stages of lower pressures. At stages of higher pressures, the burning rates obtained using the Mass Flow Rate Method were greater than those obtained using the Impulse Method.
During the operation of the test motor, the characteristic velocity (C*) of the propellant slightly increased with the increasing pressure. Consequently, during the low-pressure stage, the actual C* of the propellant was slightly smaller than the average characteristic velocity ( C ¯ * ), resulting in slightly higher actual burning rates compared to those obtained using the Mass Flow Rate Method. Conversely, during the high-pressure stage, the actual C* of the propellant was slightly larger than  C ¯ * , leading to slightly lower actual burning rates compared to those obtained using the Mass Flow Rate Method. Furthermore, minor nozzle erosion occurring in the later stages of testing caused a slight increase in the throat diameter. This increase had the small effect of reducing the burning rate determined using the Mass Flow Rate Method, bringing it closer to the actual burning rate. By analyzing the differences between the burning rates obtained using the two methods, as depicted in Figure 10, it can be observed that the Impulse Method’s burning rates were consistent with the actual burning rates, which proved the rationality of the method for determining the actual specific impulse.
According to the P~t and F~t curves of SQ2-1 shown in Figure 7a and the dimensional parameters provided in Table 1, the burning rates were calculated using the two methods and are presented in Figure 10b. During the low-pressure stage, it was observed that the burning rates obtained using the Mass Flow Rate Method were greater than those obtained using the Impulse Method. However, during the high-pressure stage, the burning rate obtained from the Mass Flow Rate Method was smaller compared to that obtained from the Impulse Method.
For the SQ2-1 grain, theoretically, the total web thickness (ea) and burning time (ta) were constant, at 19.15 mm and 1.3638 s, respectively, regardless of whether the Impulse Method or the Mass Flow Rate Method was used to determine the burning rate. This means that the average burning rate (ravg) throughout the combustion process was constant, which was  r a v g = e a / t a  14.04 mm/s. However, due to severe nozzle erosion, the burning rates of SQ2-2 obtained using the Mass Flow Rate Method decreased significantly with the increasing pressure at a high pressure, which resulted in lower burning rates from the Mass Flow Rate Method than those obtained from the Impulse Method. Since the average burning rate of SQ2-2 obtained using the two methods was the same, which was 14.04 mm/s, the burning rates at a low pressure that were obtained using the Mass Flow Rate Method would inevitably be larger than those obtained using the Impulse Method.
In addition, the characteristic velocity of both the SQ2 double-base propellant and the GAP-based composite propellant tended to increase with the pressure, but they were affected by pressure in different degrees, which had a different effect on the pattern of difference between subfigures a and b in Figure 10. However, this different effect was considered to be smaller compared to the effect of severe nozzle erosion. In summary, the severe nozzle erosion of SQ2-2 was considered to be the main cause of the results in Figure 10b, while the variation in the characteristic velocity with pressure was considered to be the main cause of the results in Figure 10a.
Notably, a phenomenon was observed in which the Mass Flow Rate Method’s burning rates of different periods were different at the same pressure, which contravened the fundamental principles of propellant combustion. The data for dt1 and dt2 in Table 1 show that the nozzle erosion of SQ2-1 was severe, so it was believed that the phenomenon in the burning rate was attributed to the neglect of nozzle erosion in the Mass Flow Rate Method. However, the Impulse Method’s burning rates for different periods were nearly equal at the same pressures. These findings indicate that the burning rate obtained using the Impulse Method is not influenced by nozzle erosion.

4. Conclusions

(1)
Two types of propellants were subjected to burning rate tests using the Impulse Method. The burning rates were nearly equal for propellants of the same type at the corresponding pressures, demonstrating the feasibility of the method.
(2)
The Impulse Method is efficient for testing the burning rate of a solid propellant. It allows one to obtain the burning rate of a solid propellant at any pressure within an increased pressure range through a single test. The burning rates obtained using the Impulse Method and the Standard Motor Method at the same pressure were consistent, indicating the comparability between the Impulse Method and the Standard Motor Method. Furthermore, the Impulse Method eliminates the need to consider errors introduced by nozzle erosion.
(3)
A comparative analysis was conducted on the burning rates obtained through the Mass Flow Rate Method and the Impulse Method. The results provide evidence supporting the rationality of the approach in determining the actual specific impulse.

Author Contributions

Conceptualization, Y.W.; methodology, Y.W.; software, J.L.; validation, Y.W. and J.L.; formal analysis, Y.W. and J.L.; investigation, J.L.; resources, Y.W.; data curation, J.L.; writing—original draft preparation, Y.W. and J.L.; writing—review and editing, Y.W., J.L., X.L. and J.C.; supervision, Y.W.; project administration, Y.W.; funding acquisition, Y.W. All authors have read and agreed to the published version of the manuscript.

Funding

This research was funded by the Key Laboratory of Combustion, Thermo-Structure, and Internal Flow Field Fund: 6142701220101.

Data Availability Statement

The data presented in this study are available upon request from the corresponding authors. The data are not publicly available due to privacy restrictions.

Conflicts of Interest

The authors declare no conflict of interest.

Nomenclature

Douter diameter of propellant grain
Dinner diameter of propellant grain
Llength of propellant grain
P~tpressure versus time trace
F~tthrust versus time trace
I0total impulse of the propellant
t1initial moment of propellant burning
t2final moment of propellant burning
I s ¯ average specific impulse of propellant
P ¯ average pressure of during the whole burning process of propellant
sitime segment of propellant burning time
Δ tiduration of si
mimass of the propellant burned off si
P i ¯ average pressure of si
Is ( P i ¯ ) specific impulse at the corresponding    P i ¯  
I0itotal impulse of the si
eiweb thickness of propellant burned off during  Δ ti
ρ p density of the propellant grain
riburning rate of propellant corresponding to  P i ¯  
Is(actual)actual specific impulse
Is(theoretical)theoretical specific impulse
Is(theoretical)~Ptheoretical specific impulse versus pressure trace
Is(actual)~Pactual specific impulse versus pressure trace
Atcross-sectional area of the nozzle throat
dt1initial throat diameter of the nozzle
dt2final throat diameter of the nozzle
CFthrust coefficient
Pchamber pressure
C*characteristic velocity
ravgthe average burning rate throughout the combustion process
eathe total web thickness of propellant grain
tathe total burning time of propellant grain

References

  1. Liu, J.H. Physical and Chemical Properties of Gunpowder, 1st ed.; Beijing Institute of Technology Press: Beijing, China, 1997; p. 160. [Google Scholar]
  2. Yue, S.; Liu, L.; Liu, H.; Jiang, Y.; Liu, P.; Pang, A.; Zhang, G.; Ao, W. Agglomerate Size Evolution in Solid Propellant Combustion under High Pressure. Aerospace 2023, 10, 515. [Google Scholar] [CrossRef]
  3. Sun, D.; Li, Y.; Liu, P.; Chen, B.; Fan, W. Numerical Investigation on the Effect of Ammonium Perchlorate Content and Position on the Combustion Characteristics of an Ammonium Perchlorate/Hydroxyl-Terminated Polybutadiene Propellant. Aerospace 2023, 10, 692. [Google Scholar] [CrossRef]
  4. Wang, B.X.; Feng, Z.G.; Yang, R.J. Theory of Gunpowder Combustion, 1st ed.; Beijing Institute of Technology Press: Beijing, China, 1997; p. 123. [Google Scholar]
  5. Liu, K.X.; Zhao, L.; Li, B. Testing Method for Dynamic Burning Rate of Closed Chamber Pressurized Solid Propellant. J. Explos. Propellants 2014, 37, 78–81. [Google Scholar]
  6. Pei, Q. Research on the Method and Testing System for Quasi-Dynamic Burning Rate Testing of Solid Propellants with Multiple Strain Gauges. Master Thesis, Xidian University, Xi’an, China, 2013. [Google Scholar]
  7. Yilmaz, N.; Donaldson, B.; Gill, W.; Erikson, W. Solid propellant burning rate from strand burner pressure measurement. Propellants Explos. Pyrotech. 2008, 33, 109–117. [Google Scholar] [CrossRef]
  8. Pei, Q.; Zhao, F.Q.; Luo, Y. Research Progress on Burning Rate Testing Techniques of Solid Propellants. J. Explos. Propellants 2015, 38, 9–14+21. [Google Scholar]
  9. Hu, S.Q.; Li, B.X.; Li, F.C. Research on Burning Rate of Propellants Under High Pressure Using Closed Vessel Combustion Method. Chin. J. Energ. Mater. 2005, 13, 189–191. [Google Scholar]
  10. Celminš, A. Solid propellant burning rate measurement in a closed bomb. Combust. Flame 1974, 23, 381–397. [Google Scholar] [CrossRef]
  11. Liu, H.Q.; Li, B.X.; Wang, Y. Closed Vessel Combustion Method for Solid Propellant Burning Rate Testing System. J. Solid Rocket Technol. 2000, 23, 75–78. [Google Scholar]
  12. Wang, J.Y.; Sang, B.C. Measurement of Transient Burning Rate and Delayed Response of Burning Rate to Pressure Variation in Solid Propellants. Chin. J. Aeronaut. 1997, 1, 93–96. [Google Scholar]
  13. Zarko, V.E.; Vdovin, D.V.; Perov, V.V. Methodical problems of solid-propellant burning-rate measurements using microwaves. Combust. Explos. Shock Waves 2000, 36, 62–71. [Google Scholar] [CrossRef]
  14. Vladica, S.; Bozi, D.J. Measurement System for Determining Solid Rocket Propellant Burning Rate Using Reflection Microwave Interferometry. J. Propuls. Power 1997, 13, 457–462. [Google Scholar]
  15. Vladica, S.; Bozi, D.J. Measurement System for Determining Solid Propellant Burning Rate Using Transmission Microwave Interferometry. J. Propuls. Power 1998, 14, 421–428. [Google Scholar]
  16. Qu, C.J. A New Microwave Method for Measuring Transient Burning Rate of Solid Propellants. J. Propuls. Technol. 1993, 1, 70–77. [Google Scholar]
  17. Zhang, J.M.; Yuan, H.; Zhang, J. Ultrasonic Method for Testing Burning Rate of Solid Propellant. J. Explos. Propellants 2008, 31, 64–66. [Google Scholar]
  18. Song, S.J.; Jeon, J.H.; Kim, H.J.; Kim, I.C.; Yoo, J.C.; Jung, J.Y. Burning rate measurement of solid propellant using ultrasound—Approach and initial experiments. AIP Conf. Proc. 2006, 820, 1229–1236. [Google Scholar]
  19. Jeon, S.K.; Song, S.J.; Kim, H.J.; Ko, S.F.; Oh, H.T.; Kim, I.C.; Yoo, J.C.; Jung, J.Y. Ultrasonic Signal Denoising for Robust Measurement of Solid-Propellant Burning Rates. J. Propuls. Power 2010, 26, 473–478. [Google Scholar] [CrossRef]
  20. Song, S.J.; Kim, H.J.; Ko, S.F.; Oh, H.T.; Kim, I.C.; Yoo, J.C.; Jung, J.Y. Measurement of solid propellant burning rates by analysis of ultrasonic full waveforms. J. Mech. Sci. Technol. 2009, 23, 1112–1117. [Google Scholar] [CrossRef]
  21. Zhang, J.M.; Wang, Z.Q.; Yuan, H. Application of Ultrasonic Burning Rate Testing Technique in Solid Propellant Development. J. Explos. Propellants 2006, 29, 9–12. [Google Scholar]
  22. Hasegawa, K.; Hori, K. Novel burning rate measurement technique for solid propellant by means of ultrasonics. Combust. Explos. Shock Waves 2010, 46, 188–195. [Google Scholar] [CrossRef]
  23. Traineau, J.C.; Kuentzman, P. Ultrasonic measurements of solid propellant burning rates in nozzleless rocket motors. J. Propuls. Power 1986, 2, 215–222. [Google Scholar] [CrossRef]
  24. Brewster, M.Q.; Hites, M.H.; Son, S.F. Dynamic burning rate measurements of metalized composite propellants using the laser-recoil technique. Combust. Flame 1993, 94, 178–190. [Google Scholar] [CrossRef]
  25. Osborn, J.R.; Murphy, J.M.; Kershner, S.D. Photographic measurement of burning rates in solid propellant rocket motors. Rev. Sci. Instrum. 1963, 34, 305–306. [Google Scholar] [CrossRef]
  26. Rajak, R.; Chakravarthy, S.R.; Ganesan, S. Measurement of admittance and acoustic augmentation of burning rate of composite solid propellants using Laser Doppler Velocimetry. Proc. Combust. Inst. 2021, 38, 4391–4399. [Google Scholar] [CrossRef]
  27. Wang, J.; Gao, Z.; Sang, B. Laser technology for measurement of solid propellant transient burning rates during rapid depressurization. Fuel 2001, 80, 263–271. [Google Scholar] [CrossRef]
  28. Wang, Y.H.; Zhu, Q.L.; Zhang, H. Research on Burning Rate Testing Method Based on Mass Flow Rate and Working Principle of Solid Rocket Engines. J. Explos. Propellants 2020, 43, 428–4321. [Google Scholar]
  29. Marko, V.M.; Viladica, S.B. Small motor measurement method for determining burning rate of solid rocket propellants. In Proceedings of the 34th AIAA/ASME/SAE/ASEE Joint Propulsion Conference and Exhibit, Cleveland, OH, USA, 13–15 July 1998; p. 3390. [Google Scholar]
Figure 1. Burning rate test system of Impulse Method: (1) test motor; (2) vertical test stand; (3) thrust sensor; (4) pressure sensor; (5) data acquisition device; (6) data processing device; (7) igniter.
Aerospace 10 00818 g001
Figure 2. Geometric appearance of the propellant grain: D is outer diameter; d is inner diameter; L is length.
Aerospace 10 00818 g002
Figure 3. Pressure and thrust versus time trace during motor operation.
Aerospace 10 00818 g003
Figure 4. Determination of actual specific impulse.
Aerospace 10 00818 g004
Figure 5. Test data for GAP-1: (a) the P~t and F~t curves of the whole process; (b) the P~t and F~t curves of propellant burning process.
Aerospace 10 00818 g005
Figure 6. Test data and burning rate: (a) the P~t and F~t curves of GAP-1; (b) the burning rate of the GAP composite propellant.
Aerospace 10 00818 g006
Figure 7. Test data for propellant grains: (a) the P~t and F~t curves of SQ2-1; (b) the P~t and F~t curves of SQ2-2.
Aerospace 10 00818 g007
Figure 8. The burning rates of the SQ2 double-base propellant.
Aerospace 10 00818 g008
Figure 9. Data processing procedures for the Mass Flow Rate Method.
Aerospace 10 00818 g009
Figure 10. Burning rates obtained using two methods. (a) The burning rates of GAP-1 obtained using two methods; (b) the burning rates of SQ2-1 obtained using two methods.
Aerospace 10 00818 g010
Table 1. Performance and parameters of test propellant grains.
Types of PropellantsDensities (g·cm3)Experiment No.d (mm)D (mm)L (mm)dt1 (mm)dt2 (mm)
GAP composite propellant1.735GAP-120.054.0170.07.808.10
GAP-220.054.0184.08.408.90
SQ2 double-base propellant1.610SQ2-135.073.3180.08.009.42
SQ2-230.063.0200.08.008.55
Table 2. Theoretical specific impulses of the SQ-2 double-base propellant under different pressures.
Pressure (MPa)Theoretical Impulse (m/s)
82582
102617
152666
202691
252706
302716
402728
502737
602742
702746
802749
Table 3. The burning rate of GAP-1 tested using the Impulse Method.
Pressure
(MPa)
Burning Rate
(mm/s)
Burned Mass
(g)
Pressure
(MPa)
Burning Rate
(mm/s)
Burned Mass
(g)
5.8211.705.8816.0020.7317.57
6.1212.066.2717.1821.3918.78
6.5312.586.7718.2921.9019.91
6.9913.167.3219.4822.5021.16
7.4613.817.9620.8423.2322.61
7.9814.478.6322.2223.8624.03
8.5415.109.3323.6424.5525.58
9.1515.7310.0725.1825.3527.31
9.7616.3410.8426.8226.1329.13
10.4416.9711.6628.5526.9931.11
11.2017.6812.5930.4528.0133.39
12.0118.3313.5332.5829.1435.93
12.9318.9714.5134.9930.4538.84
13.8919.6115.4937.5532.0142.26
14.9120.1916.5340.3633.4245.68
Table 4. Burning rates of the propellant grains.
GAP-1GAP-2SQ2-1SQ2-2
Pressure
/MPa
Burning Rate/mm/sPressure
/MPa
Burning Rate/mm/sPressure
/MPa
Burning Rate/mm/sPressure
/MPa
Burning Rate/mm/s
5.8711.715.3112.408.8711.169.0011.15
6.6212.496.0512.599.6411.359.6811.28
7.5513.496.8713.0910.4811.6310.4211.49
8.6414.677.7813.8611.3711.9011.2311.73
9.8515.968.8314.8012.3412.1812.0812.00
11.3017.3110.0515.8613.3912.5213.0012.27
13.0218.6611.4516.9814.1512.7013.9512.58
13.9819.3412.2317.5615.7813.2715.5913.09
16.0820.6713.9518.7316.9413.8116.2513.32
18.3621.9815.8919.9018.0014.2517.9213.96
20.0022.7018.0921.0819.5514.9120.8115.48
22.2723.8720.0022.2021.6515.9521.6916.08
25.2125.0621.7722.9122.7116.5922.4116.63
26.8525.6823.1023.5723.5417.1923.0917.07
28.5726.7724.4424.1824.0717.5924.0117.50
30.4527.5825.8324.8324.3217.8124.5017.98
32.5628.6327.4025.6024.4917.9925.1918.10
34.9629.9429.1426.4624.5018.0026.4518.85
40.2832.7230.9727.3224.4118.0427.5919.58
Disclaimer/Publisher’s Note: The statements, opinions and data contained in all publications are solely those of the individual author(s) and contributor(s) and not of MDPI and/or the editor(s). MDPI and/or the editor(s) disclaim responsibility for any injury to people or property resulting from any ideas, methods, instructions or products referred to in the content.

