Article

Aerodynamic Exploration on Rough Airfoil Based on Overlapping Feathers of a Swift-Wing Structure

1
School of Mechanical Engineering, Nanjing University of Science and Technology, Nanjing 210094, China
2
Beijing Zhonghangzhi Technology Co., Ltd., Beijing 100176, China
3
Taiyuan Jinxi Industrial Group, Taiyuan 030027, China
*
Author to whom correspondence should be addressed.
Aerospace 2023, 10(8), 660; https://doi.org/10.3390/aerospace10080660
Submission received: 26 June 2023 / Revised: 12 July 2023 / Accepted: 21 July 2023 / Published: 25 July 2023
(This article belongs to the Special Issue Structures, Actuation and Control of Morphing Systems)

Abstract

:
To investigate the flow mechanism of feather-like rough airfoils based on swift wings, computational simulations were employed to explore their overall aerodynamic characteristics in comparison to equivalent smooth airfoils. The study focused on angles of attack ranging from 0° to 20° at low Reynolds numbers. The results reveal that the rough airfoil exhibits higher lift and lower drag compared to the smooth airfoil at moderate angles of attack ranging from 6° to 10°, resulting in significantly improved aerodynamic efficiency. Notably, at an angle of attack of 8°, the aerodynamic efficiency is increased by 19%. However, at angles of attack smaller than 6°, the increase in drag outweighs the increase in lift, leading to lower aerodynamic efficiency for the rough airfoil. Conversely, when the angle of attack exceeds 16°, both airfoils experience separated flow-dominated flow fields, resulting in comparable effective aerodynamic shapes and similar aerodynamic efficiencies. Furthermore, the study found that increasing the Reynolds number results in greater pressure differences in the flow field, leading to higher aerodynamic efficiency. These preliminary conclusions are valuable for elucidating the flight mechanisms of bird-feather-like wings and can inform the design or morphing design of bio-inspired micro aerial vehicles in the near future.

1. Introduction

In the vast realm of flight, nature showcases remarkable diversity, with nearly a million species of flying insects and over 13,000 warm-blooded vertebrates, including mammals, birds, and bats, that take to the skies. These creatures, through their exceptional ability to navigate through space, embody nature’s extraordinary experiments in locomotion. Human fascination with the flight of birds, bats, and insects has persisted throughout history. Even with the rapid advancements in aeronautical technology since the Wright brothers’ pioneering flight in 1903, the aerial prowess of nature’s aviators, honed over 150 million years of evolution, continues to captivate our imagination. As McMasters and Henderson eloquently state, while humans fly for commercial or recreational purposes, animals fly professionally [1,2,3,4,5,6].
While man-made flying vehicles have made remarkable advancements, surpassing natural flyers in terms of effective payload, flight speed, and distance covered, the exceptional maneuverability, controllability, and stability demonstrated by natural flyers remain elusive for current human-engineered vehicles [6,7,8,9,10,11,12]. For instance, consider the supersonic aircraft SR-71 “Blackbird,” capable of traveling near 3 Mach (~900 m/s) and covering approximately 32 body lengths per second. In contrast, the common pigeon (Columba livia) frequently achieves speeds of 22.4 m/s, translating to an astonishing 75 body lengths per second. The European Starling (Sturnus vulgaris) can reach speeds of 120 body lengths per second, while certain swift species surpass even that, flying over 140 body lengths per second [1]. Most general aviation aircraft permit a maximum positive G-force of 4–5 G, with select military aircraft enduring 8–10 G. However, many bird species routinely experience positive G-forces exceeding 10 G and, in some cases, up to 14 G [1].
Particularly in the realm of low-Reynolds-number flow observed in biological flight, man-made micro aerial vehicles (MAVs) suffer from limited range, flight time, maneuverability, and stability when compared to birds. These constraints hinder the further development and application of MAVs [13,14,15]. The exceptional maneuvering and flight characteristics exhibited by birds are primarily attributed to their wing structures, which continue to hold numerous captivating mysteries despite millions of years of evolution. Therefore, delving deeper into the understanding and exploration of the low-Reynolds-number aerodynamic mechanisms governing bird wings offers a practical path to surmount the current technical bottlenecks faced by MAVs [1,2,6,7,8,9,10,11,12].
The swift, renowned as the champion of fast-flying birds, boasts the highest flight speed, remarkable maneuverability, and an extensive flight time compared to other land birds [16,17,18,19,20,21,22,23,24,25,26,27,28]. Noteworthy flight characteristics unique to swifts include (1) their wings comprise smaller inner arm surfaces and larger outer hand surfaces, enabling some adjustments to the wingtip bones’ angle during flight, thereby altering the shape and area of the wings [21,22,23,24]; (2) swifts exhibit minimal wing flapping during flight, relying predominantly on modulating the geometric shape of their wings to sustain efficient gliding over long distances [25,26,27,28]; and (3) unlike other birds, swifts rarely land throughout their lifetime, capable of sleeping while in flight, enabling uninterrupted flight for up to 10 consecutive months [21,22,23,24]. The wing structure, encompassing the skeleton and feathers, plays a crucial role in facilitating the swift’s efficient flight, especially during the transitional phases between different flight modes, as depicted in Figure 1. Unlike conventional aircraft with smooth wing profiles, swifts possess an unsmooth structure formed by overlapping feathers, resulting in a relative thickness of approximately 2% [28,29,30,31,32,33,34]. Preliminary findings indicate that this feather-overlapping rough wing exhibits improved structural stiffness compared to a smooth wing type [31]. However, the aerodynamic effects of the rough airfoil remain a topic of ongoing research, with varying viewpoints. Some studies propose that the rough airfoil can reduce drag at Re = 15,000 [29,30], while others suggest that although it may mitigate flow separation at high angles of attack, it does not significantly alter the overall aerodynamic characteristics [31].
The wing structure of birds plays a pivotal role in maintaining efficient flight in the air. However, previous studies have devoted limited attention to investigating the aerodynamic effects of feathered rough airfoils, and quantitative conclusions that can guide engineering practice remain elusive due to variations in flight conditions and the objects of study. To shed light on the aerodynamic effects of rough airfoils and their corresponding geometrically equivalent smooth counterparts under low-Reynolds-number flow conditions, this paper focuses on the feathered profile structure of a swift wing as the subject of study. Utilizing numerical simulation methods, the vortex evolution of the rough airfoil and its overall aerodynamic performance are examined, with particular emphasis on understanding the rough effect and Reynolds number influences exhibited by such non-smooth surfaces under low-Reynolds-number flow conditions. In the current era marked by the robust development of micro air vehicles, this exploratory research aims to provide a theoretical foundation and technical support for the design and fabrication of future micro bio-inspired airfoils.
This research not only provides valuable insights into the aerodynamic effects of rough airfoils but also holds promise for the application of morphing design principles. By exploring the rough effect and Reynolds number influences on non-smooth surfaces, this study contributes to the development of morphing airfoil designs. The ability to dynamically adjust the shape and surface characteristics of an airfoil during flight presents significant potential for enhancing maneuverability, stability, and overall aerodynamic performance. The findings of this research serve as a theoretical foundation and technical support for future advancements in morphing airfoil design, offering innovative solutions for the design and manufacture of micro bio-inspired airfoils. As the field of micro air vehicles continues to advance rapidly, this exploratory research contributes to the ongoing development of micro air vehicles by providing valuable insights for their design and fabrication.

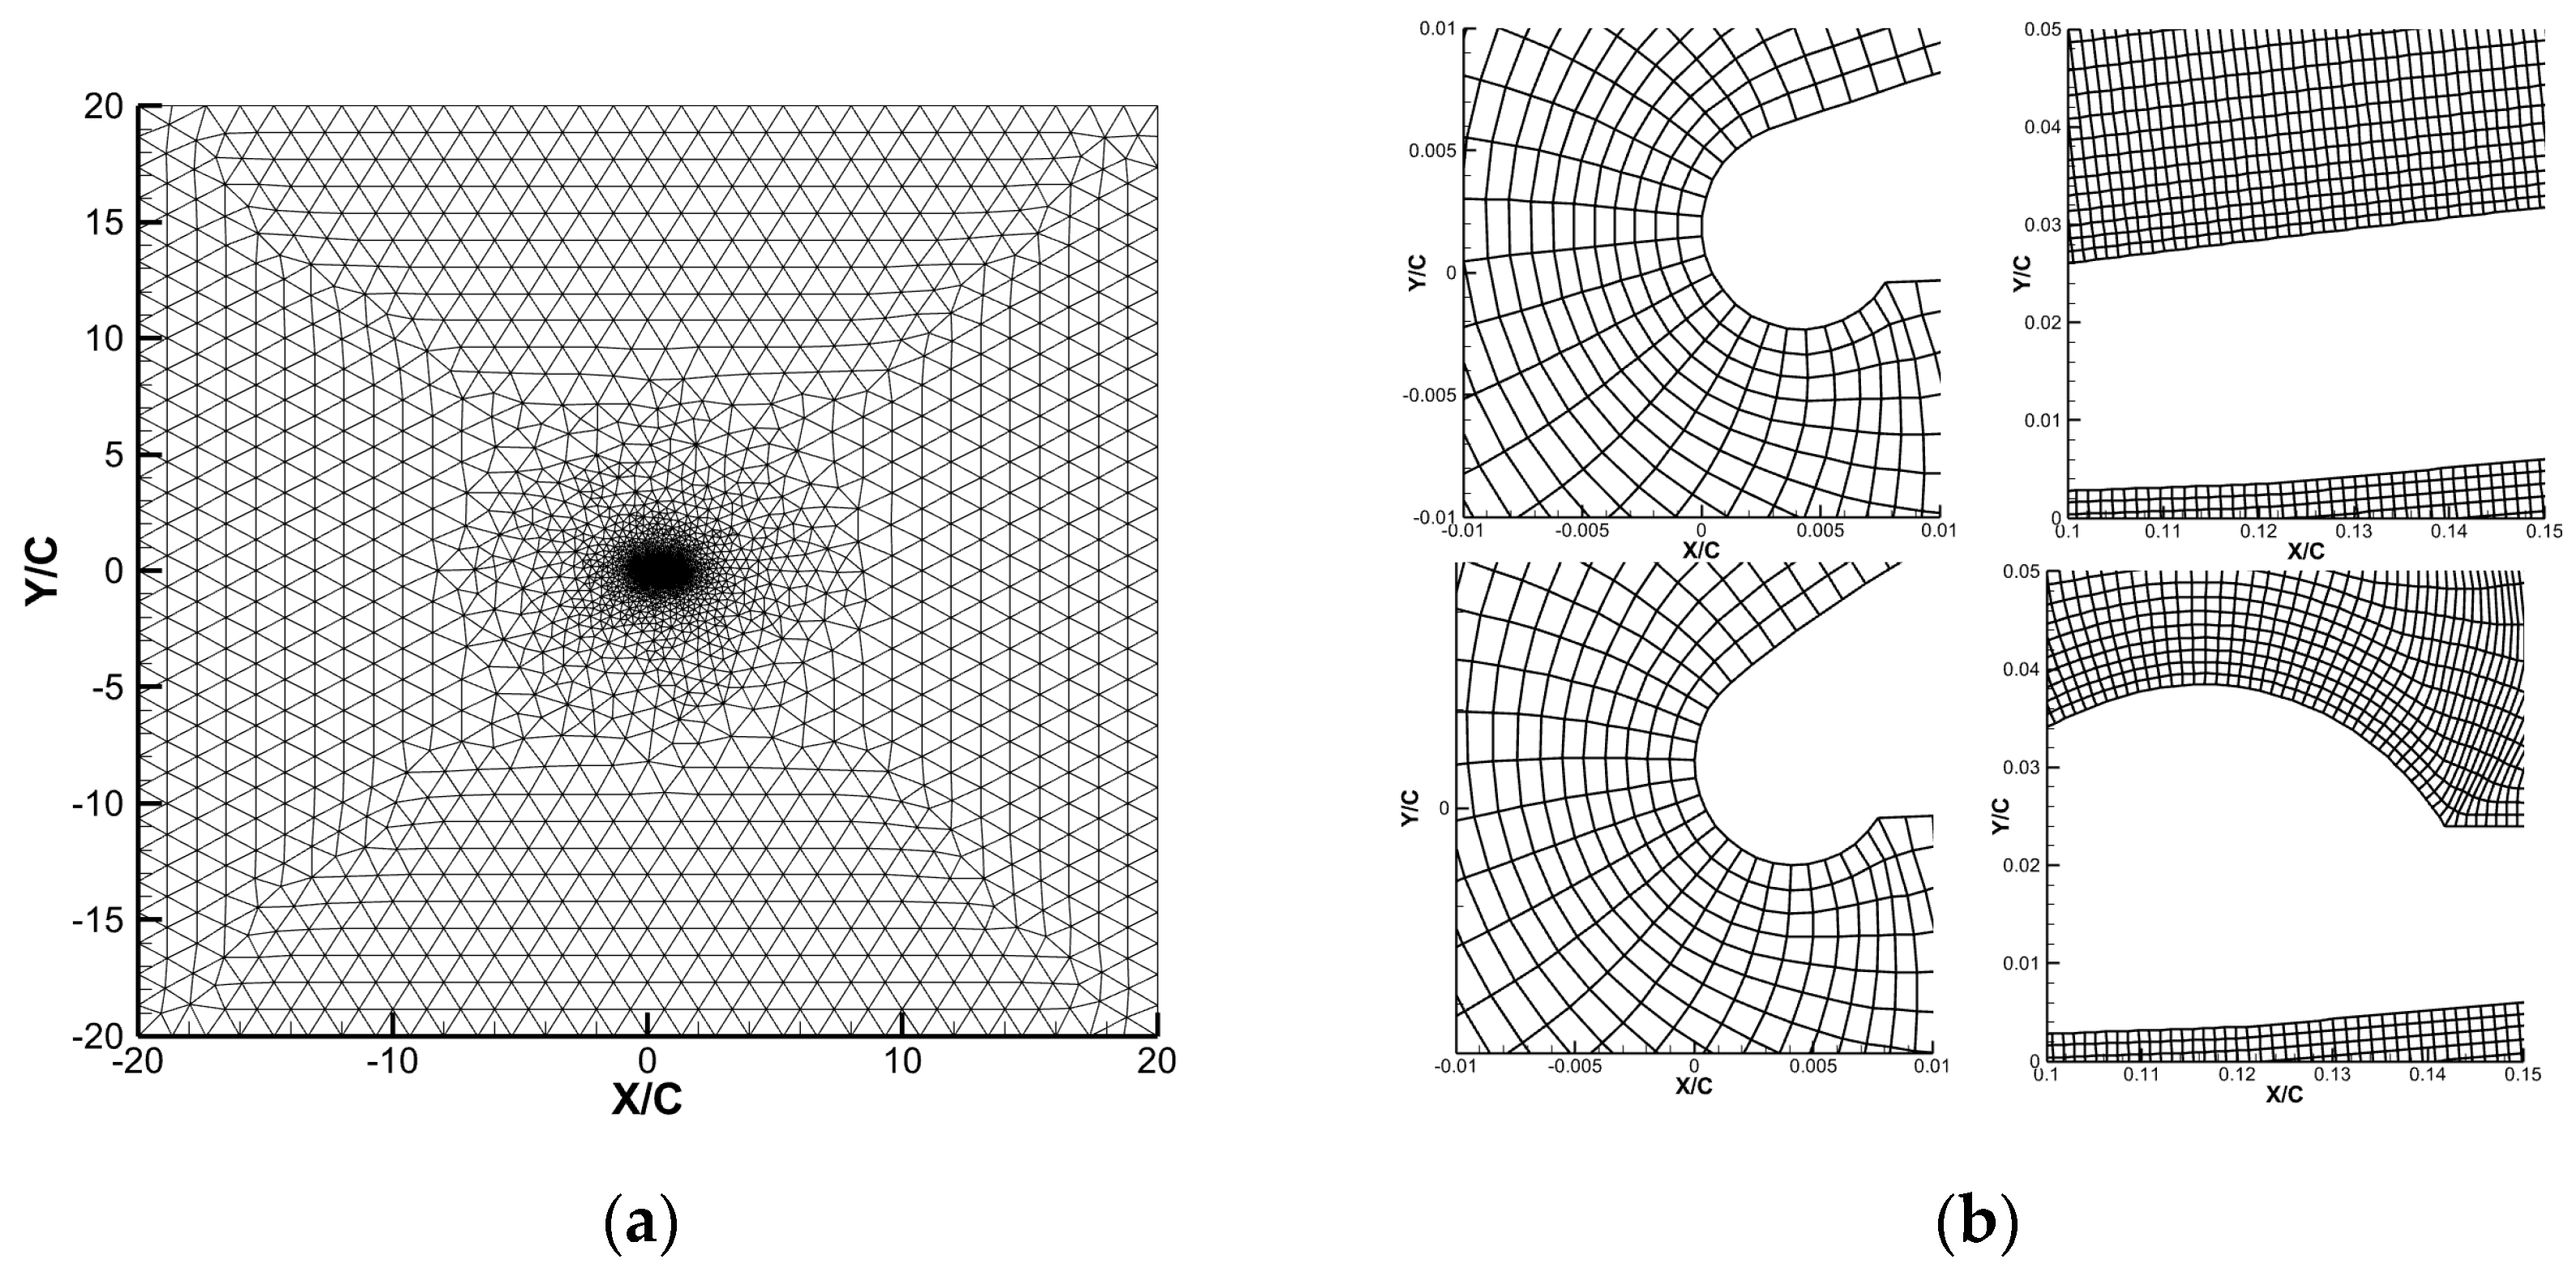
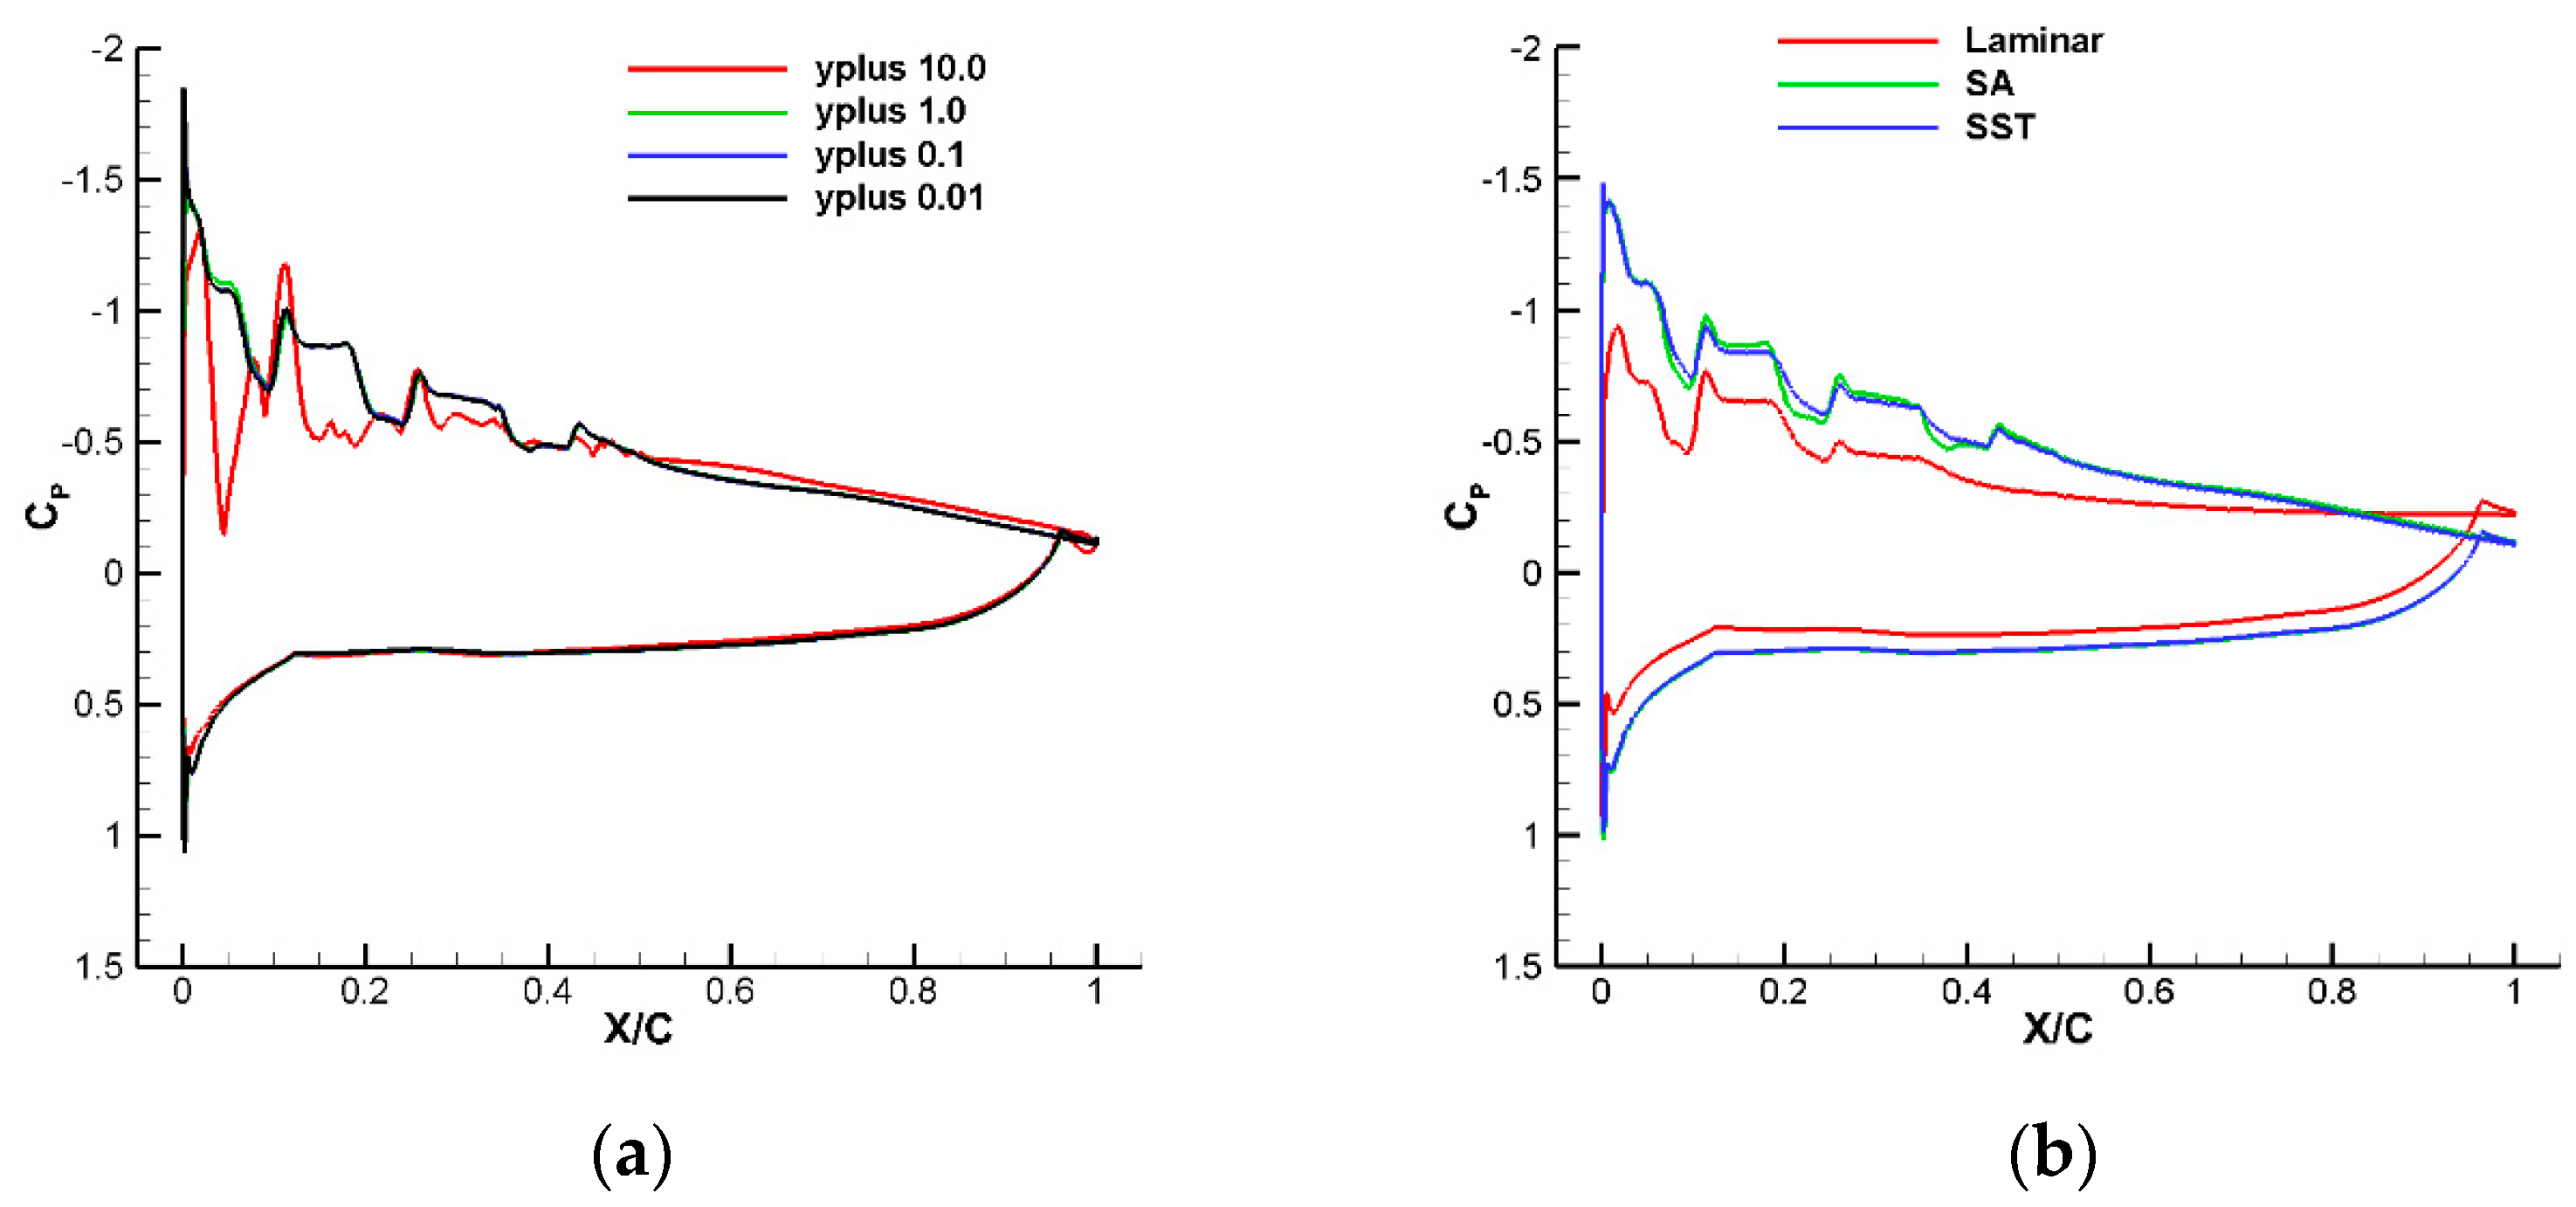
2. Geometry Description, Computational Methods, and Validation Case

The complex structure and arrangement of feathers pose challenges in building fully equivalent geometric models for dynamic simulations and analysis [35,36]. Consequently, it becomes necessary to simplify the feathered wing model. Previous research has focused on accurately determining the wing contours by employing high-precision scanning techniques [37,38,39]. However, these studies often overlook the slender structure and anisotropic properties of feathers, instead emphasizing the flow variations caused by the valleys and ridges of overlapping primary feathers with thick protruding rachides.
Due to the variations in research objects and Reynolds numbers in previous studies, inconsistent conclusions have been drawn. To address this and elucidate the aerodynamic effects of rough airfoils in low-Reynolds-number flight, this paper builds upon the research conducted at the School of Mechanical Engineering at Stanford University [28,29,30,31,32,33,34]. The investigation specifically examines the vortex structure and aerodynamics of a swift rough model and an equivalent smooth airfoil under low-Reynolds-number flow conditions (Re = 1.5 × 10⁴, 2.0 × 10⁴, 3.0 × 10⁴) during gliding flight. Numerical simulations are employed to explore the aerodynamic characteristics of the feathered rough airfoil. It is important to note that, for consistency, the Reynolds numbers selected in this study are based on the reference [31].
Figure 2 illustrates the swift rough and smooth swift wing shapes examined in this study, derived from the scanning results of the hand wing segment of the swift (refer to Figure 1c in the literature [31] for more detailed information). Both wings feature overlapping lower and upper surfaces, with the key distinction lying in the first half of the upper surface of the rough wing type. This region exhibits a non-smooth profile, characterized by four distinct valleys and ridges. In contrast, the equivalent smooth wing neglects these non-smooth geometric features. The chord lengths of both airfoils are maintained at C = 0.15 m. The reference areas for lift and drag coefficients are standardized to 0.15 m2. The Reynolds numbers (Re) considered in this investigation, based on the chord length C, encompass three values: 1.5 × 10⁴, 2.0 × 10⁴, and 3.0 × 10⁴, respectively. The free stream pressure (P) is set to 101,325 Pa, and the range of the angle of attack (α) spans from 0° to 20°, with increments of 2°.
The primary objective of the numerical simulation in this paper is to validate the computational method for aerodynamic calculations in low-Reynolds-number flows and assess its capability to capture the intricate structure of separated flows. To ensure a robust computational approach, the commercial software ANSYS Fluent 19.5 was employed as the simulation tool. All simulations were conducted on the Gekko cluster at the High-Performance Computing Centre of Nanyang Technological University, Singapore. The computational grid utilized in this study is a hybrid grid, comprising quadrilateral cells in the vicinity of the airfoil surface and triangular cells in other fluidic regions. The grid distribution across different regions is illustrated in detail in Figure 3. Figure 3a demonstrates the far-field boundary, represented as a square with a length of 40C (where C is the chord length). In Figure 3b, the upper two figures depict the boundary layer distribution for the smooth airfoil, while the lower two figures show the boundary layer distribution for the rough airfoil. The number of points evenly distributed around the airfoil surface is 1690 for the smooth airfoil and 1706 for the rough airfoil. Both airfoils have a boundary layer of 30 points off the wall, with an increasing ratio of 1.2. The total number of elements is 96,102 for the smooth airfoil and 96,938 for the rough airfoil.
For the boundary conditions, the left boundary of the rectangular far-field is set as a velocity inlet, the right boundary is a pressure outlet, and the lower side boundary is also a velocity inlet. The boundary condition for the upper side depends on the flow direction at different angles of attack. Specifically, when the angle of attack is 0°, the upper side boundary condition is set as a velocity inlet. However, for positive angles of attack, the fluid exits the domain, and thus the upper side boundary condition is set as a pressure outlet [16,37].
To ensure the accuracy and reliability of the numerical tool employed in this study, a comparison was conducted between ANSYS Fluent 19.5 and the new method of intermittency function suitable for low-Reynolds-number transitional flow described in Ref [40] for the surface pressure distribution of the SD7003 airfoil at an angle of attack of 4° and Reynolds number of 6 × 10⁴. The detailed comparison of lift and drag, using different turbulence models, is presented in Table 1. It reveals that the last two methods exhibit better performance in terms of relative error for lift, while the third method demonstrates superior results considering the relative error for drag. Considering both the relative force error and computational efficiency, the Spalart–Allmaras (SA) one-equation turbulence model is adopted for the computational calculations in this paper to simulate the flow field in low-Reynolds-number conditions. It is important to note that for low-Reynolds-number flows at 104, the computational results tend to exhibit greater scattering and are challenging to converge as effectively as high-Reynolds-number flows at 106.
Figure 4 illustrates the comparison of airfoil surface pressure using different boundary layer scales and turbulence models. In Figure 4a, the results demonstrate consistency across the first layer heights of the appendage layer (y+ = 1.0, 0.10, and 0.01), indicating that the grid has minimal impact on improving computational accuracy. Consequently, a first layer height of y+ = 1.0 is adopted for the boundary layer grid in all subsequent models presented in this paper because y+ = 1.0 is dense enough to capture the flow characteristics of the flow around rough surface. In [37,38], the S-A and SST turbulence models were utilized to calculate the wing flow fields of pigeons and golden eagles. The comparison results in Figure 4b also confirm that the results obtained using the two turbulence models, S-A and SST, are essentially similar. Considering the slightly lower computational cost of the one-equation S-A model, it was chosen for the subsequent calculations in this study. Furthermore, it is important to note that the flow field remains steady for angle-of-attack values less than 8° and becomes unsteady for angles of attack greater than 8°. In the case of unsteady flow, time-averaged physical parameters are extracted by averaging over a cycle after obtaining converged sinusoidal results. As the reference time scale τ = C/V = 0.1027 s, the unsteady time step is two orders of magnitude smaller, set at 0.001 s. The number of internal iterations is set to 20, and the total simulation time consists of 10,000 steps.

3. Results and Discussion

The valleys and ridges of overlapping primary feathers with thick protruding rachides are neglected on the surface of the smooth wing model, while these corrugated structures are retained in the front part of the upper surface of the bio-inspired rough wing model. In this section, the aerodynamic effects of the rough and equivalent smooth wings of the swift at low-Reynolds-number flow (Re = 1.5 × 10⁴) are quantitatively investigated. The focus is on analyzing the overall aerodynamic coefficients as well as examining the vortex evolution structure to gain insights into these properties.

3.1. Comparisons of Overall Aerodynamic Characteristics

Figure 5 provides a comparison of the time-averaged lift coefficient CL, drag coefficient CD, and lift/drag ratio K for the two models at different angles of attack. Table 2 compares the change rate of the aerodynamic efficiency of the rough airfoil compared to the smooth airfoil. Figure 6 compares the differential pressure drag coefficient and friction drag coefficient. It is important to note that in all figures, the term “Rough” refers to the rough airfoil, while “Smooth” represents the equivalent smooth airfoil. The results indicate that, at angles of attack below 16°, the lift generated by the rough wing is greater than that of the smooth wing. Specifically, at angles of attack of 8° and 10°, the rough airfoil experiences lift increases of 2.3% and 3.4%, respectively, compared to the smooth airfoil. However, as the angle of attack exceeds 16°, the lift of both airfoils becomes nearly identical. Regarding drag, when the angle of attack is less than 6°, the rough airfoil exhibits higher drag compared to the smooth airfoil. At angles of attack of 0° and 4°, the drag of the rough airfoil increases by 6.8% and 9.0%, respectively. Conversely, as the angle of attack surpasses 6°, the rough airfoil demonstrates lower drag than the smooth airfoil. Notably, at angles of attack of 8°, 10°, and 20°, the rough airfoil experiences drag reductions of 14.0%, 8.4%, and 0.7%, respectively, compared to the smooth airfoil. It is worth mentioning that although the frictional drag of the rough airfoil at small angles of attack is significantly smaller than the pressure drag, the total drag aligns with the magnitude of the pressure drag due to its order-of-magnitude-larger value.
In general, when the angle of attack is below 6°, the rough airfoil exhibits lower aerodynamic efficiency compared to the smooth airfoil. This is mainly due to a more pronounced increase in drag than in lift. However, in the angle of attack range of 6°–16°, the rough airfoil demonstrates better aerodynamic efficiency than the smooth airfoil, as displayed in Table 2. This improvement can be attributed to the combined effects of increased lift and reduced drag in the rough airfoil. Once the angle of attack exceeds 16°, the flow field is characterized by separated flow, and the lift of both airfoil types becomes nearly identical. Although the drag of the rough airfoil is slightly smaller in this regime, the overall aerodynamic efficiency of the two airfoil types is almost equal.

3.2. Comparisons of Vortex Development and Evolution

This section focuses on investigating the evolution characteristics of the flow field and the variations in the pressure and friction coefficients of the airfoil under different conditions. These aspects are crucial in understanding the overall aerodynamic characteristics, particularly the development and evolution of vortices on the upper surface of the airfoil. By analyzing the numerical simulation results, we aim to gain insights into these flow-field dynamics and the corresponding changes in the pressure and friction coefficients.
Figure 7 illustrates the comparison of the airfoil surface pressure coefficient CP for four selected angles of attack (0°, 4°, 10°, and 20°). Additionally, Figure 8 presents the distribution of the corresponding friction coefficient Cf on the airfoil surface, while Figure 9 displays the pressure contour and streamlines. The pressure coefficient, Cp, is defined as Cp = (P − P)/(0.5ρV2), where P represents the local static pressure, and the friction coefficient, Cf, is defined as Cf = τω/(0.5ρV2), with τω representing the wall shear stress. Analyzing Figure 7, it becomes evident that the pressure distributions on the lower surface and the second half of the upper surface of both airfoils closely overlap. However, the rough airfoil exhibits noticeable suction peaks at protruding positions, resulting in lower pressure compared to the corresponding positions on the smooth airfoil. Figure 8 reveals that the friction coefficients at these corrugated positions of the rough airfoil are significantly higher due to the irregularities, contrasting with the corresponding positions on the smooth airfoil. When examining the flow field in Figure 9, we observe that the four valleys resemble “stagnant zones” in the flow at 4° and 10°, leading to the formation of standing vortices. Conversely, the flow is accelerated before the four ridges, resulting in reduced pressure. Since lift is generated by the pressure difference between the upper and lower surfaces, the rough airfoil exhibits higher lift compared to the smooth airfoil. At an angle of attack of 20°, the flow field is predominantly characterized by a wide range of separated vortices, minimizing the effect of standing vortices in the valleys and resulting in similar lift for both airfoil types.
In Figure 9, significant extreme values of the friction coefficient can be observed at the ridges, while negative friction occurs at the valleys due to recirculating flows where the flow reverses direction. The frictional drag coefficients of the two airfoil types largely overlap at other locations. Since the drag force is a combination of the pressure and friction acting on the airfoil surface, the overall trend of the total drag force is primarily determined by changes in the pressure coefficient. This is mainly due to the relatively small area of the corrugated region and the fact that the friction coefficient is an order of magnitude smaller than the pressure coefficient. These observations align with the findings presented in Figure 5 and Figure 6.

3.3. Comparisons of Reynolds Number Effect

In the previous section, we examined the aerodynamic effects of the rough and equivalent smooth airfoils based on the swift wing at Re = 1.5 × 10⁴. In this section, we extend our investigation to explore the aerodynamic characteristics of these two airfoils at Re = 2.0 × 10⁴ and Re = 3.0 × 10⁴. Figure 10 presents a comparison of the time-averaged lift coefficient CL, drag coefficient CD, and lift-to-drag ratio K for the two models at various angles of attack. Additionally, Figure 11 and Figure 12 showcase the pressure contours and streamlines at selected angles of attack (4°, 10°, and 20°). These visualizations offer valuable insights into the aerodynamic behaviors of the airfoils under different flow conditions.
From Figure 10, we observe that the lift curves exhibit a consistent trend across different Reynolds numbers, with the maximum lift occurring around the 10° angle of attack. Beyond 16°, the lift of both airfoils becomes nearly identical. Generally, higher Reynolds numbers correspond to larger lift coefficients. At the 10° angle of attack, the lift coefficient of the rough airfoil increases by 77% and 298% for Re = 2.0 × 10⁴ and Re = 3.0 × 10⁴, respectively, compared to Re = 1.5 × 10⁴. The drag coefficient also experiences a significant increase with increasing Reynolds numbers. Specifically, at the 10° angle of attack, the drag coefficient of the rough airfoil increases by 74% and 282% for Re = 2.0 × 10⁴ and Re = 3.0 × 10⁴, respectively, compared to Re = 1.5 × 10⁴. The trend of the lift-to-drag ratio remains consistent across the three Reynolds number cases, demonstrating that the rough airfoil exhibits superior aerodynamic efficiency to the smooth airfoil in the medium angle range of 8°–16°. When examining the streamlines and pressure distribution in Figure 11 and Figure 12, we observe that the flow field structure remains largely similar across different Reynolds numbers. However, as the Reynolds number increases, resulting in higher freestream velocities, we observe larger maximum pressure and smaller minimum pressure in the flow field. Consequently, the pressure difference and corresponding lift and drag forces also increase.

4. Concluding Remarks

In this study, a comprehensive investigation into the aerodynamic characteristics of the feather-overlapping rough airfoil under low-Reynolds-number flow conditions (Re = 1.5 × 10⁴, 2.0 × 10⁴, and 3.0 × 10⁴) was conducted using numerical simulations. Our aim was to quantitatively analyze the impact of the rough airfoil’s geometric features on vortex structure and overall aerodynamic performance. The findings highlight the significant influence of valleys and ridges on the rough airfoil’s upper surface on flow patterns and aerodynamic behaviors. The conclusions drawn from our analysis at different angles of attack are as follows:
(1)
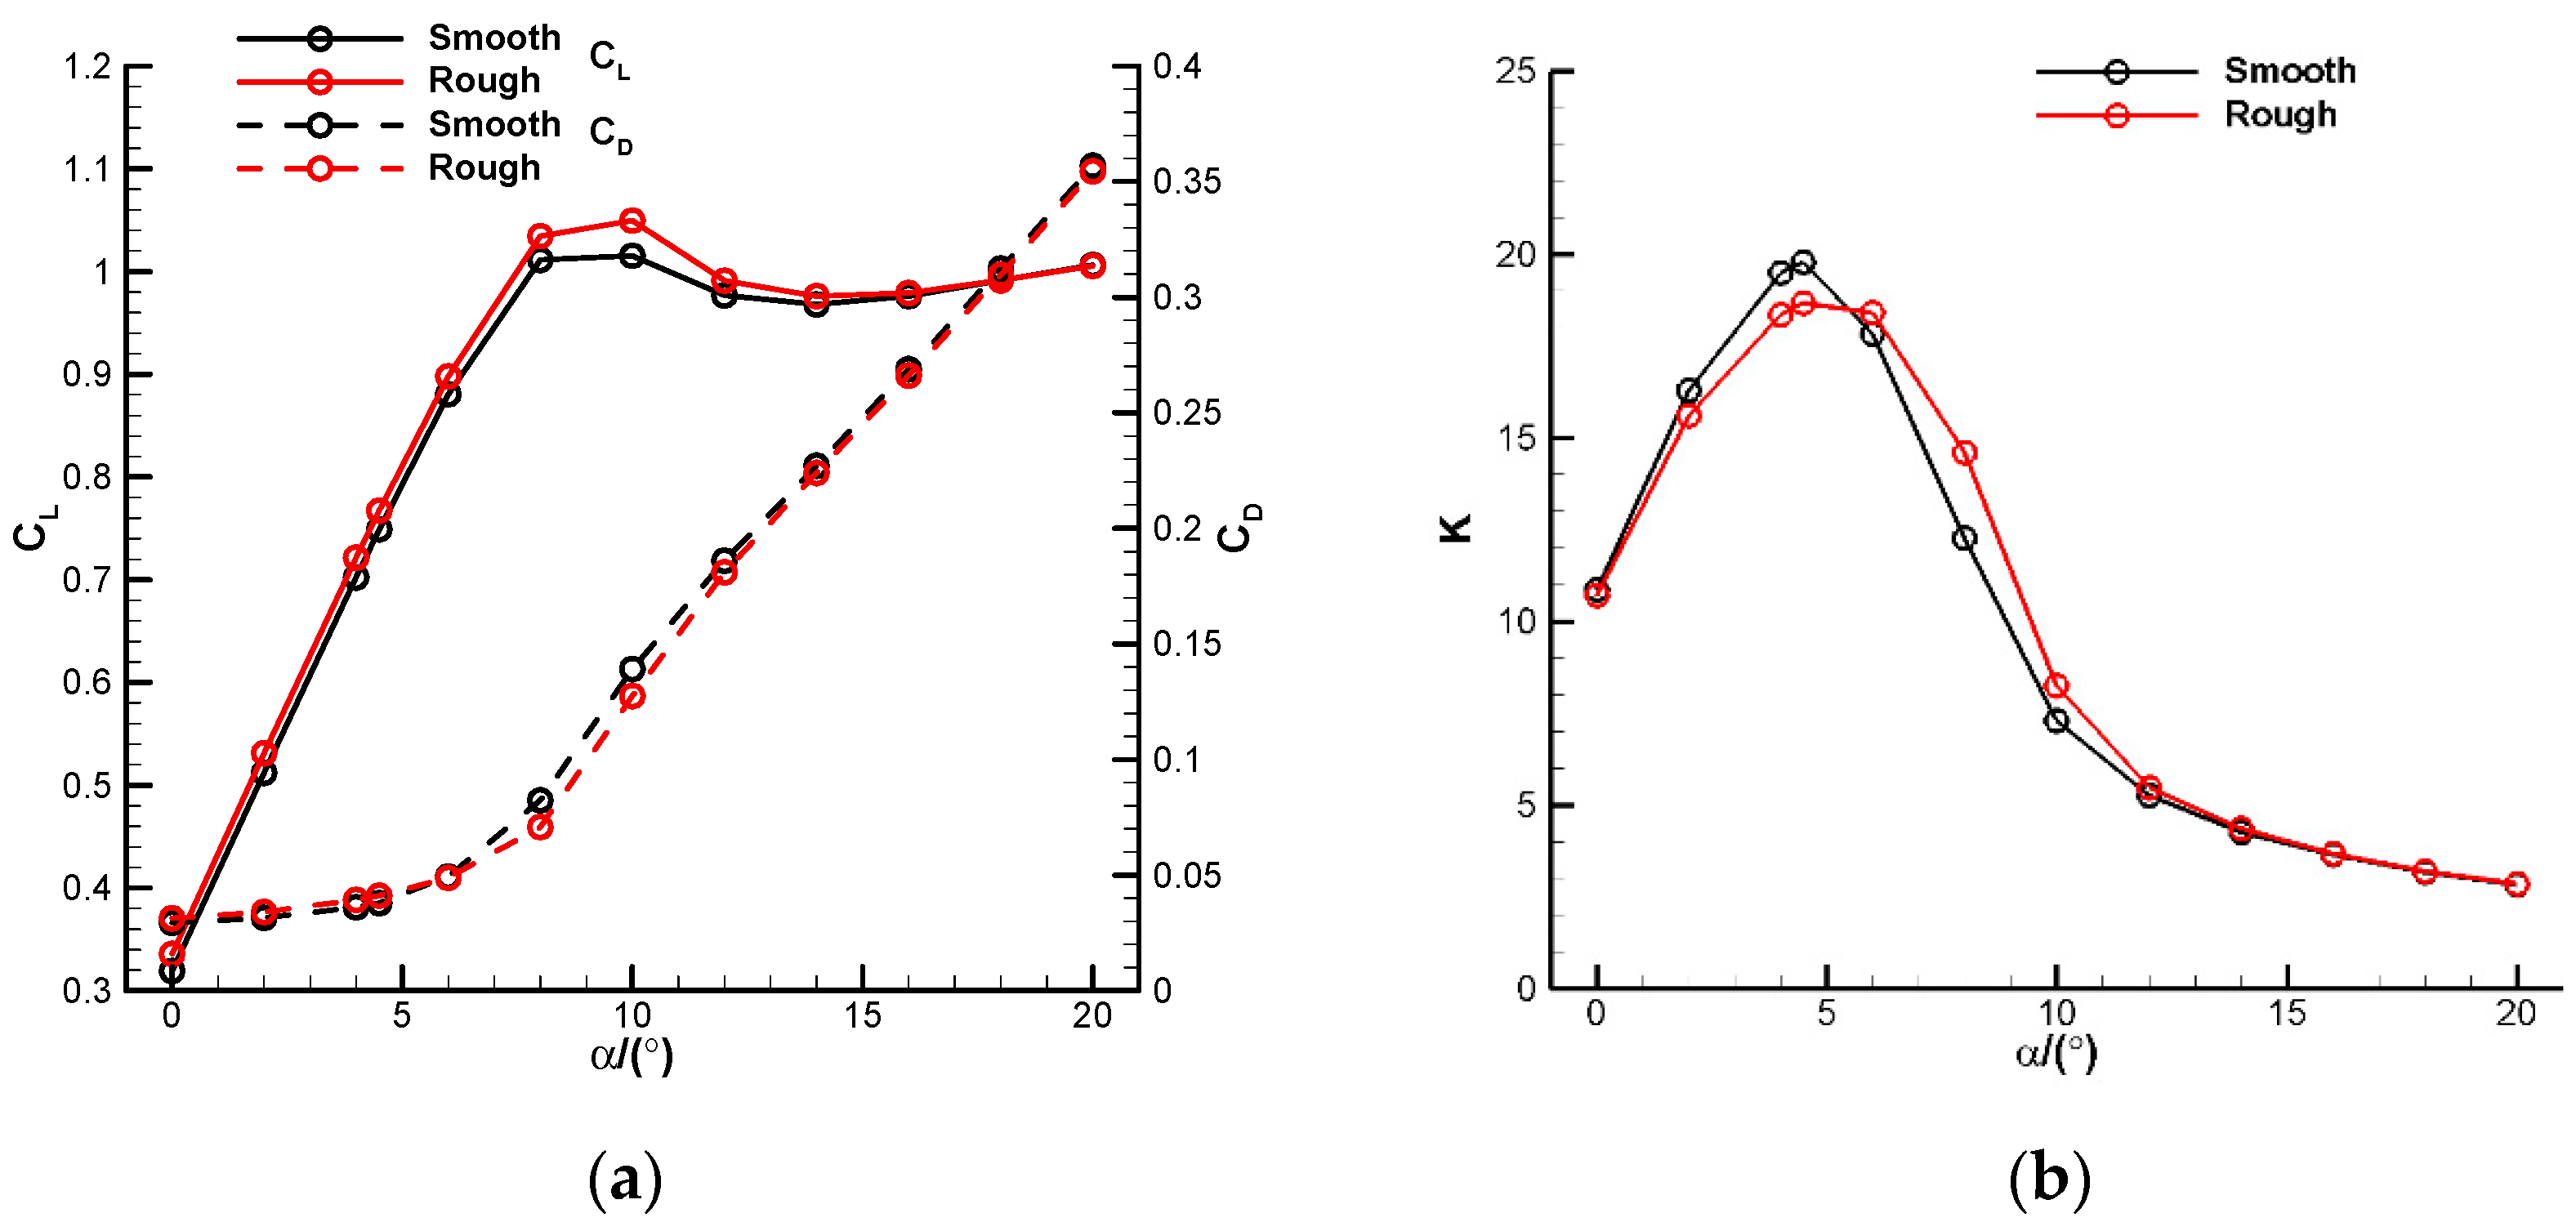
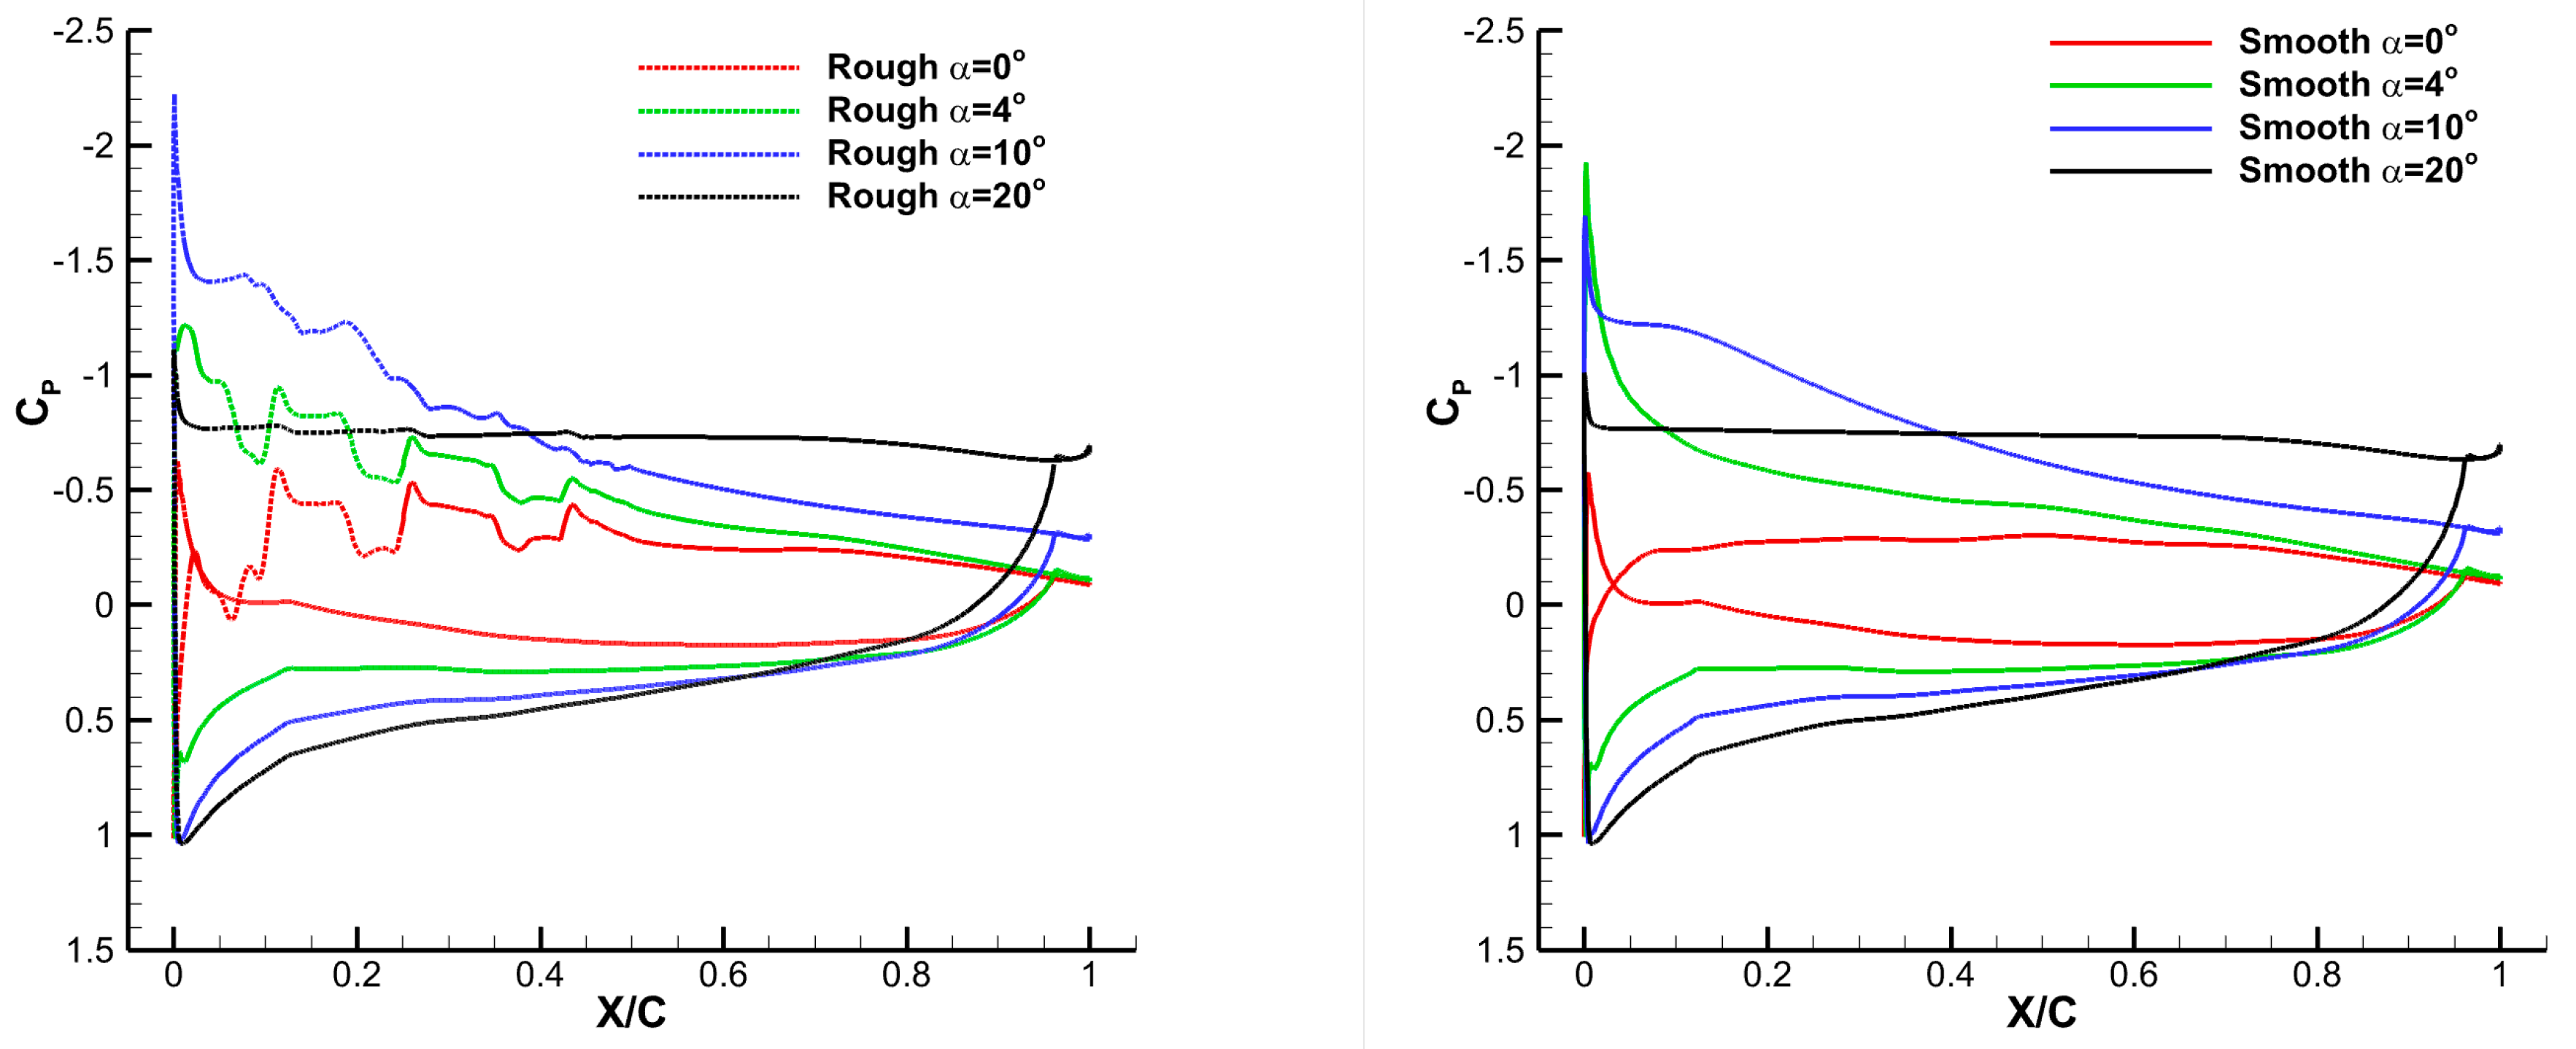
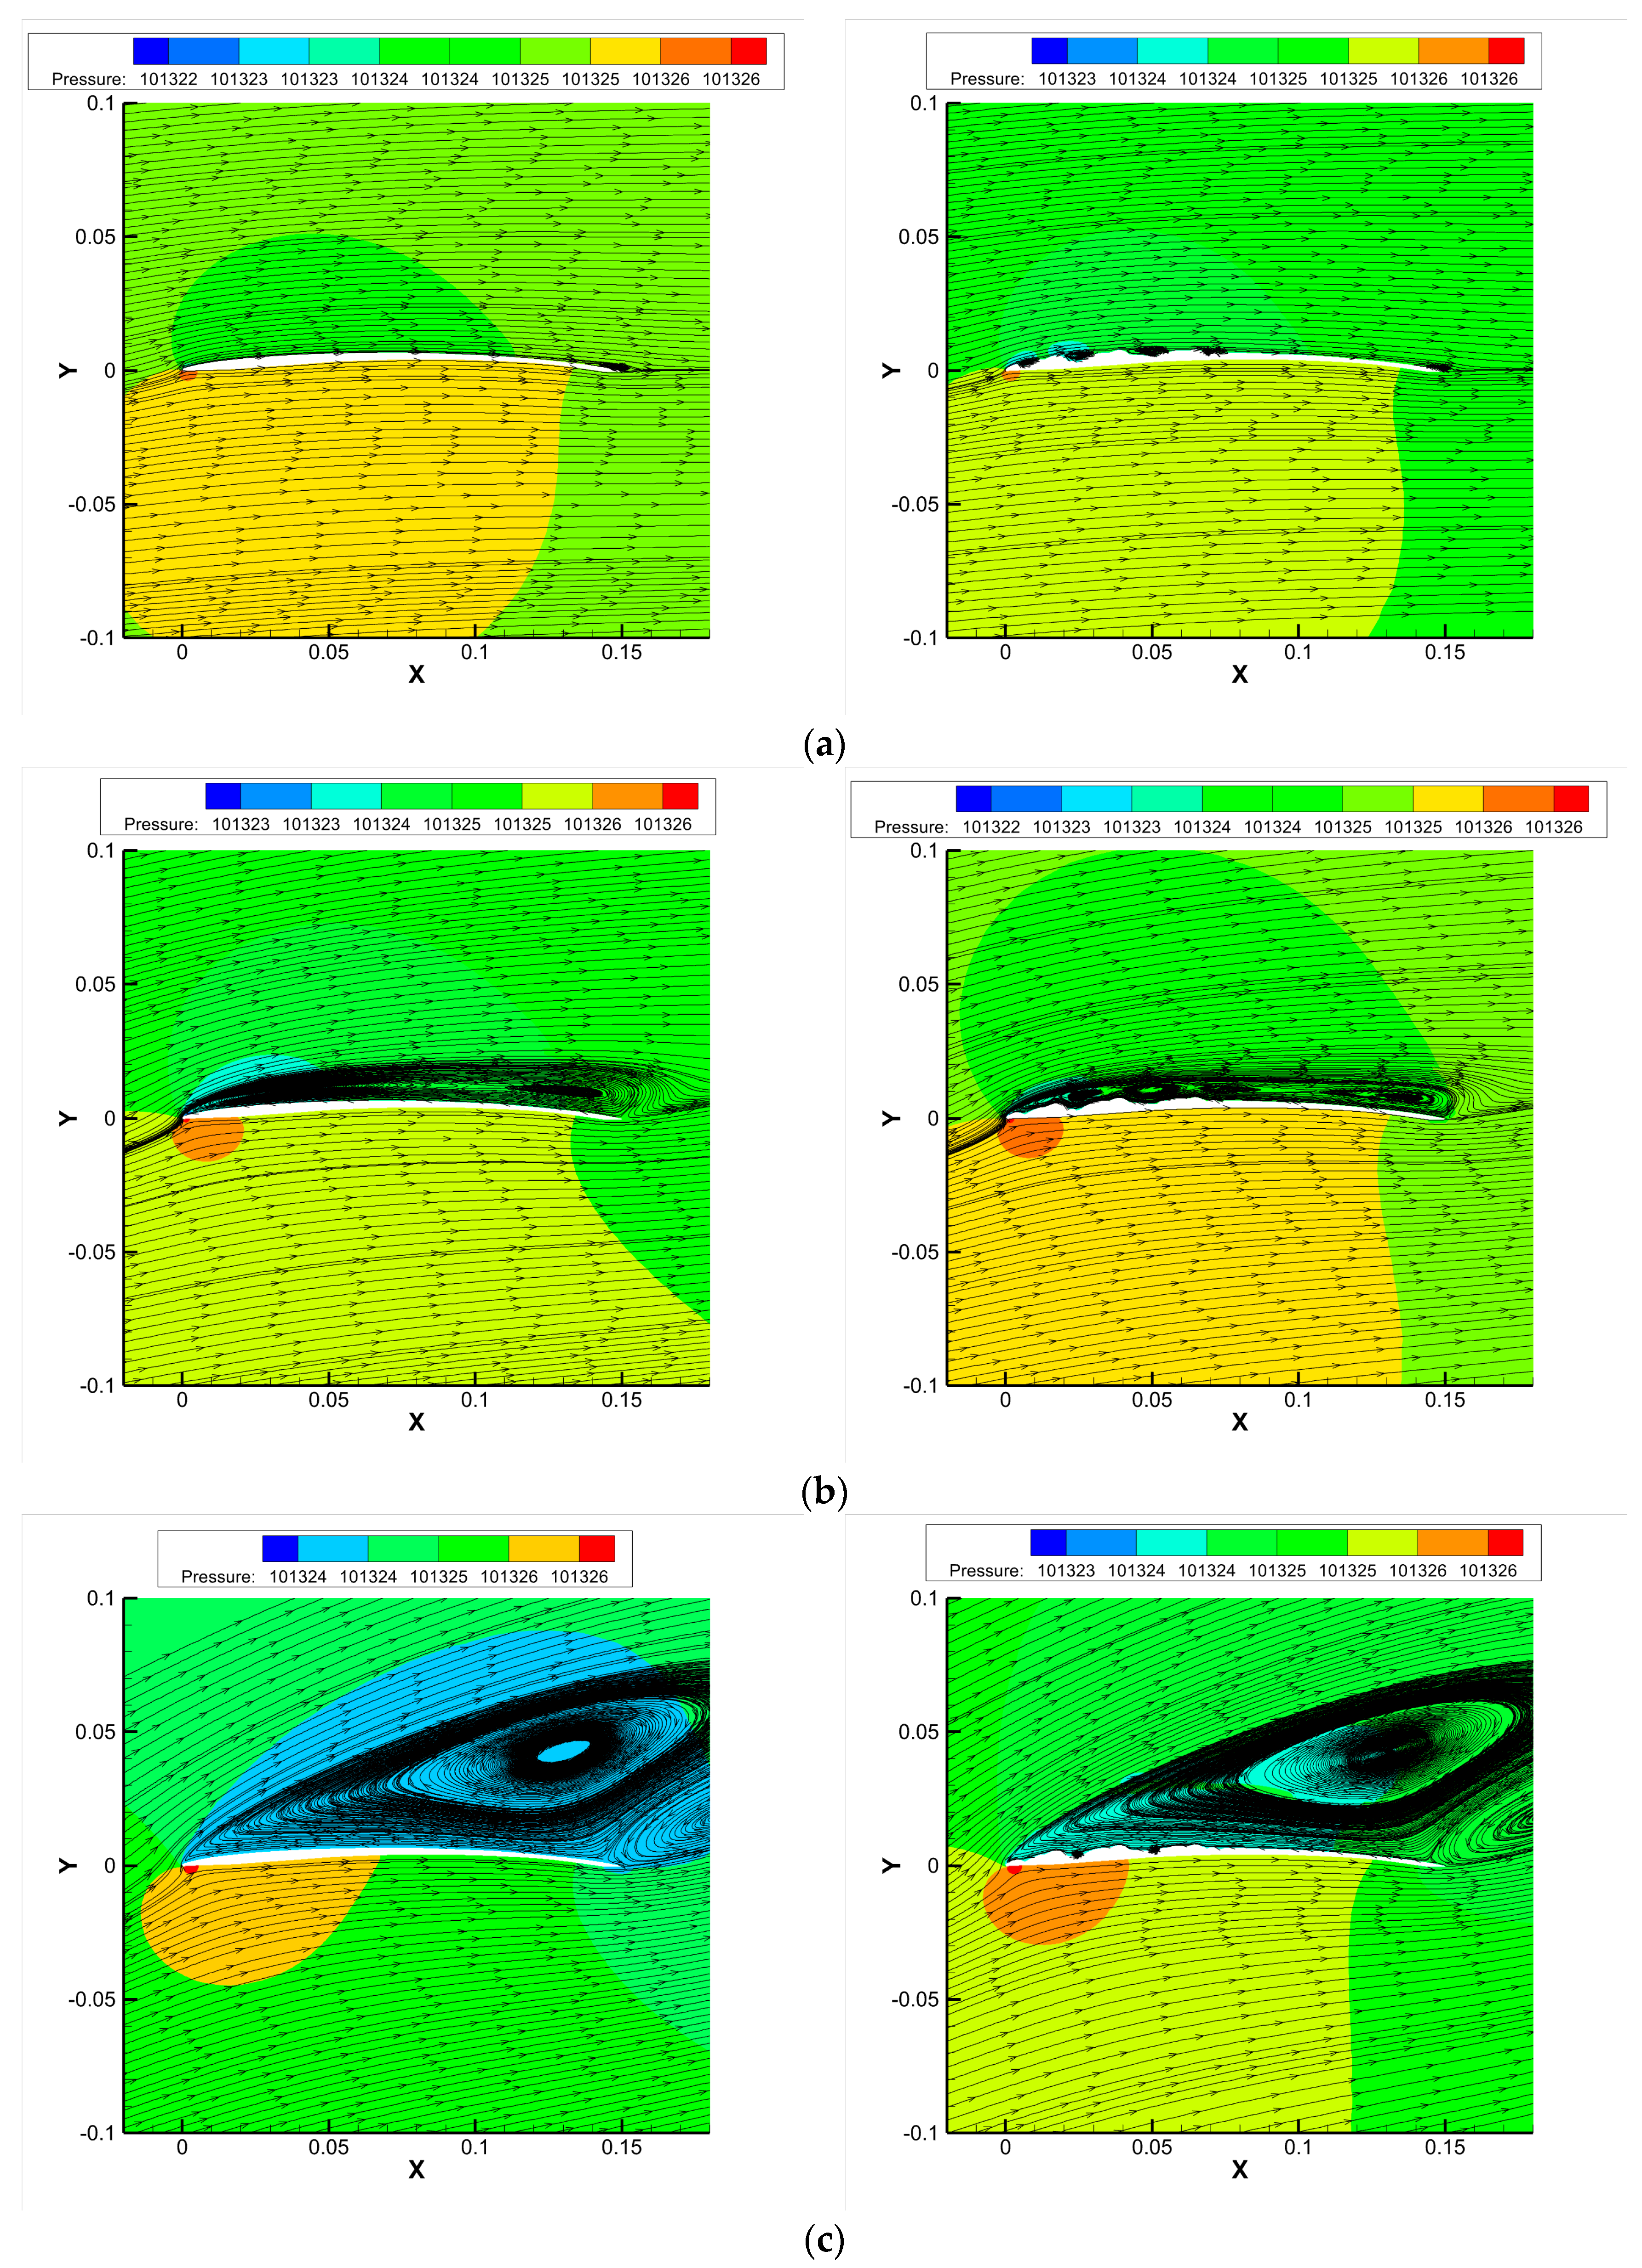
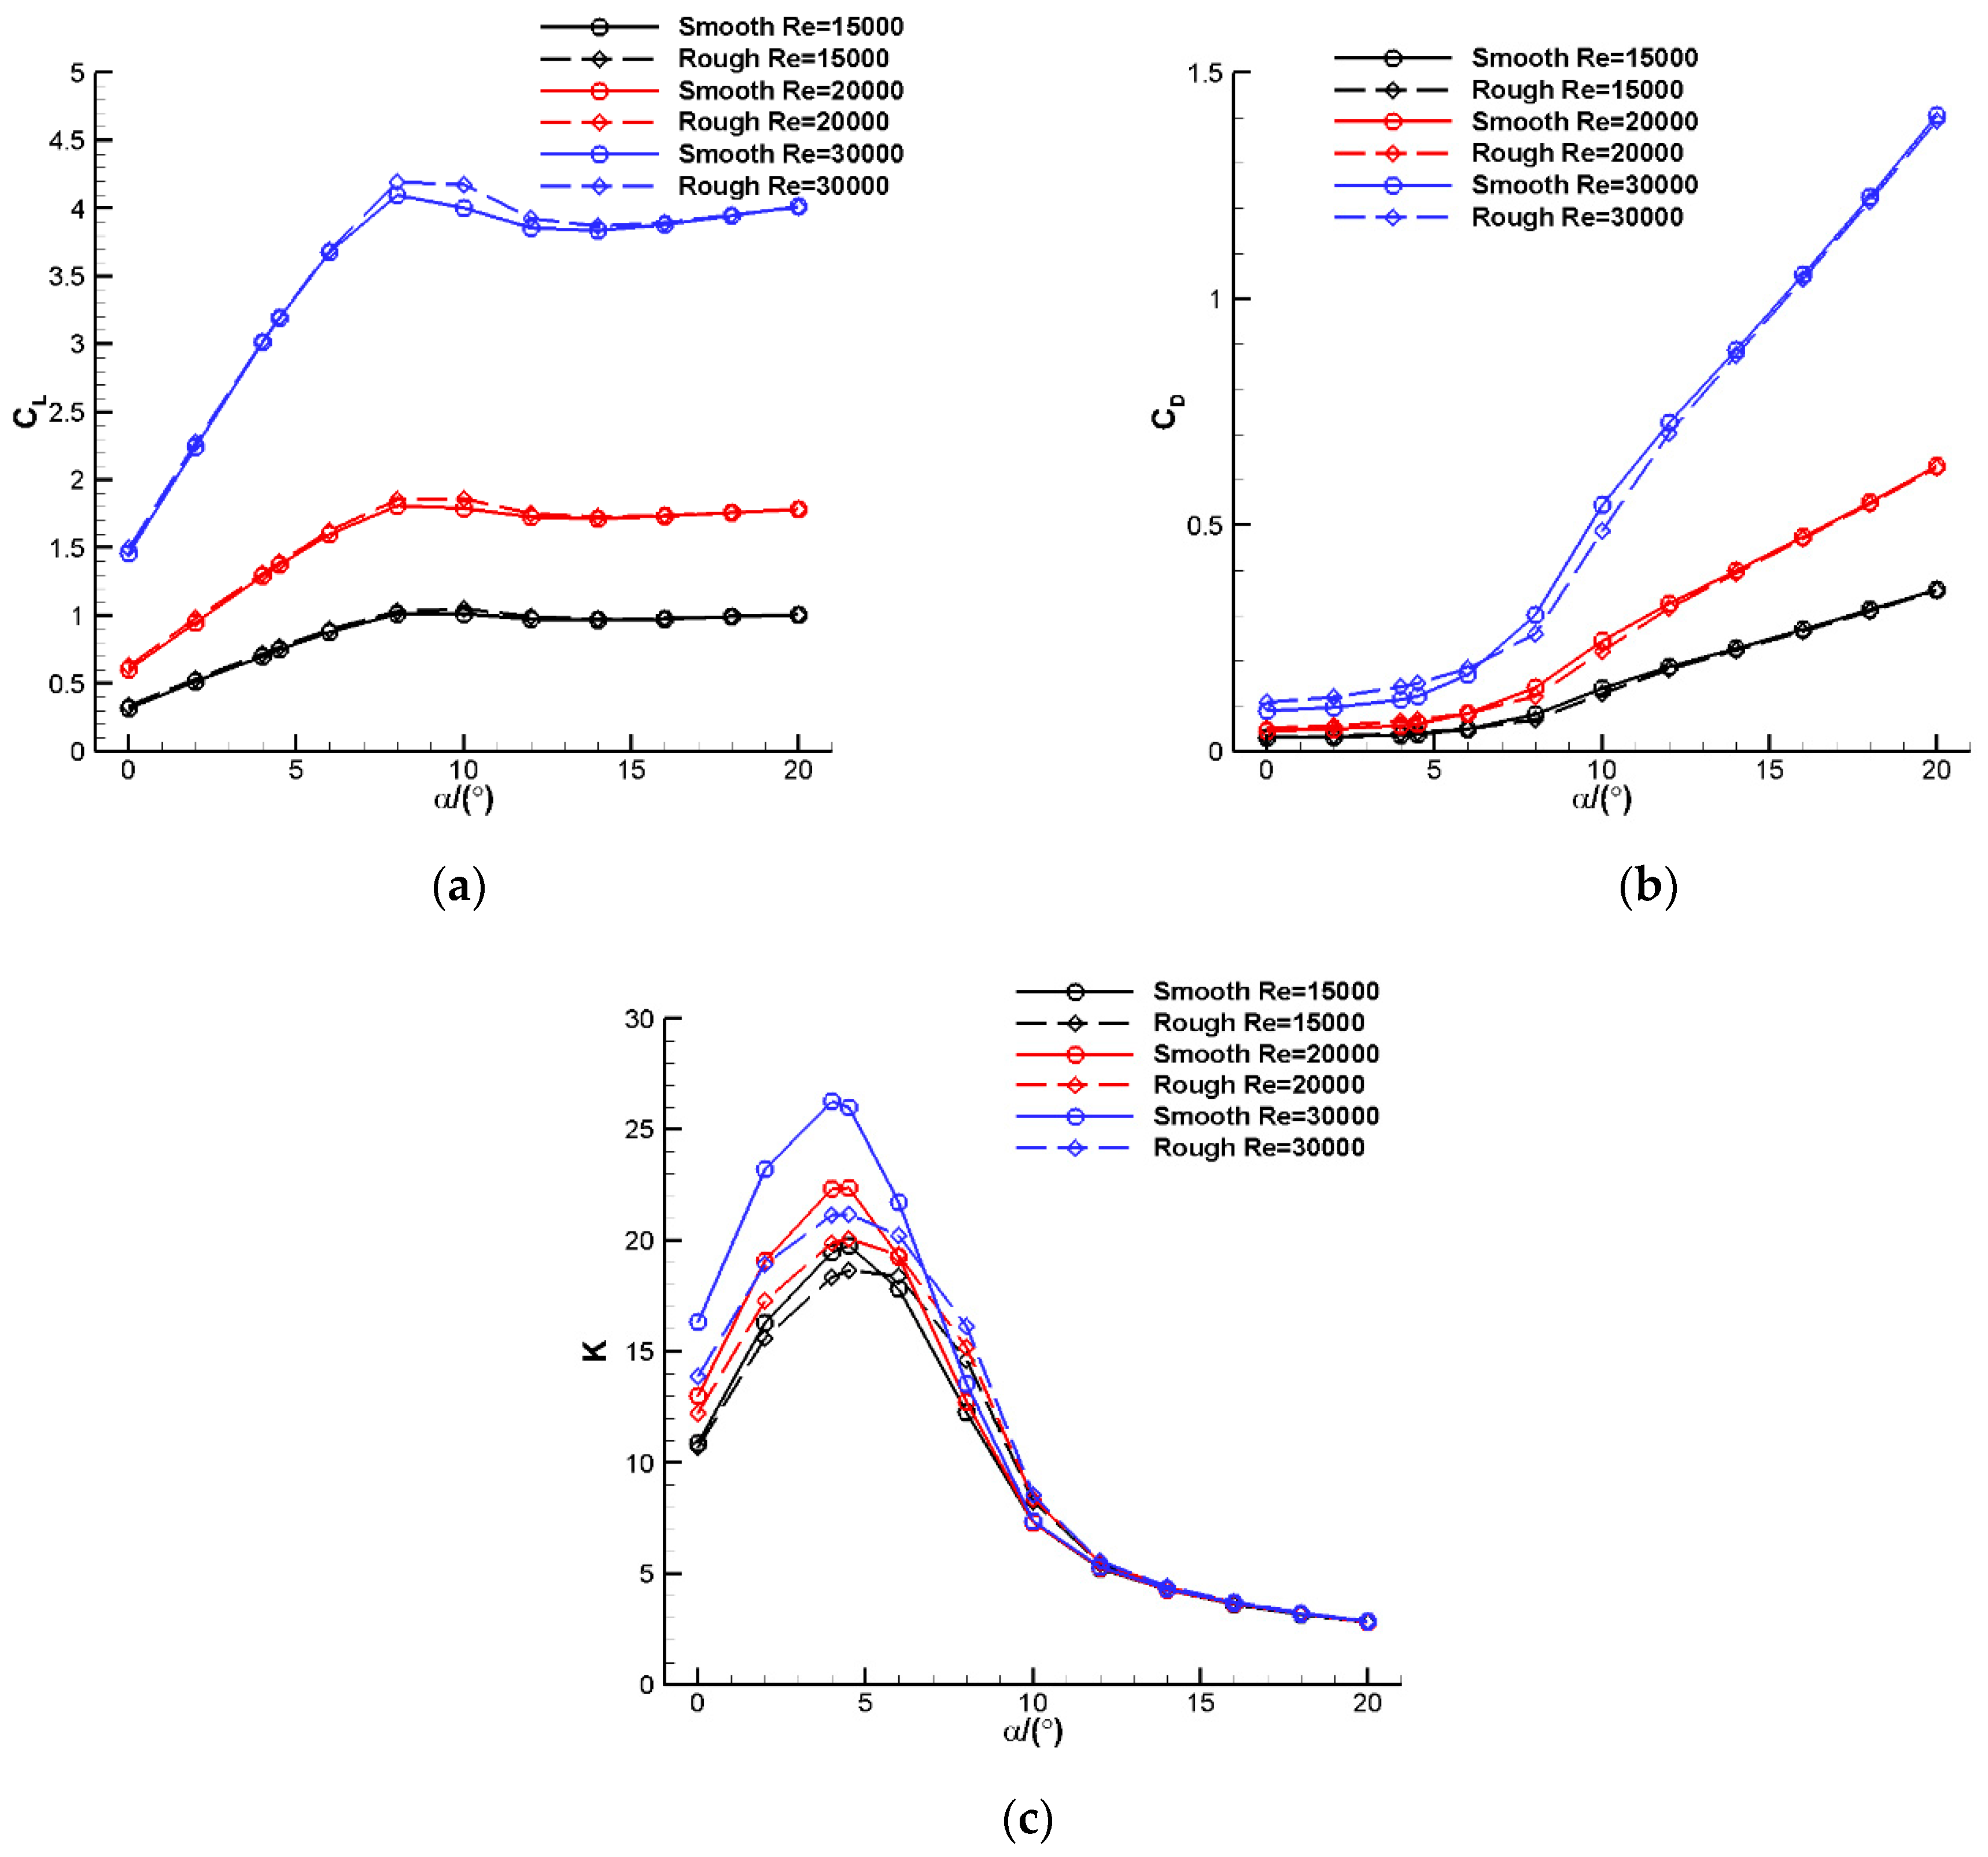
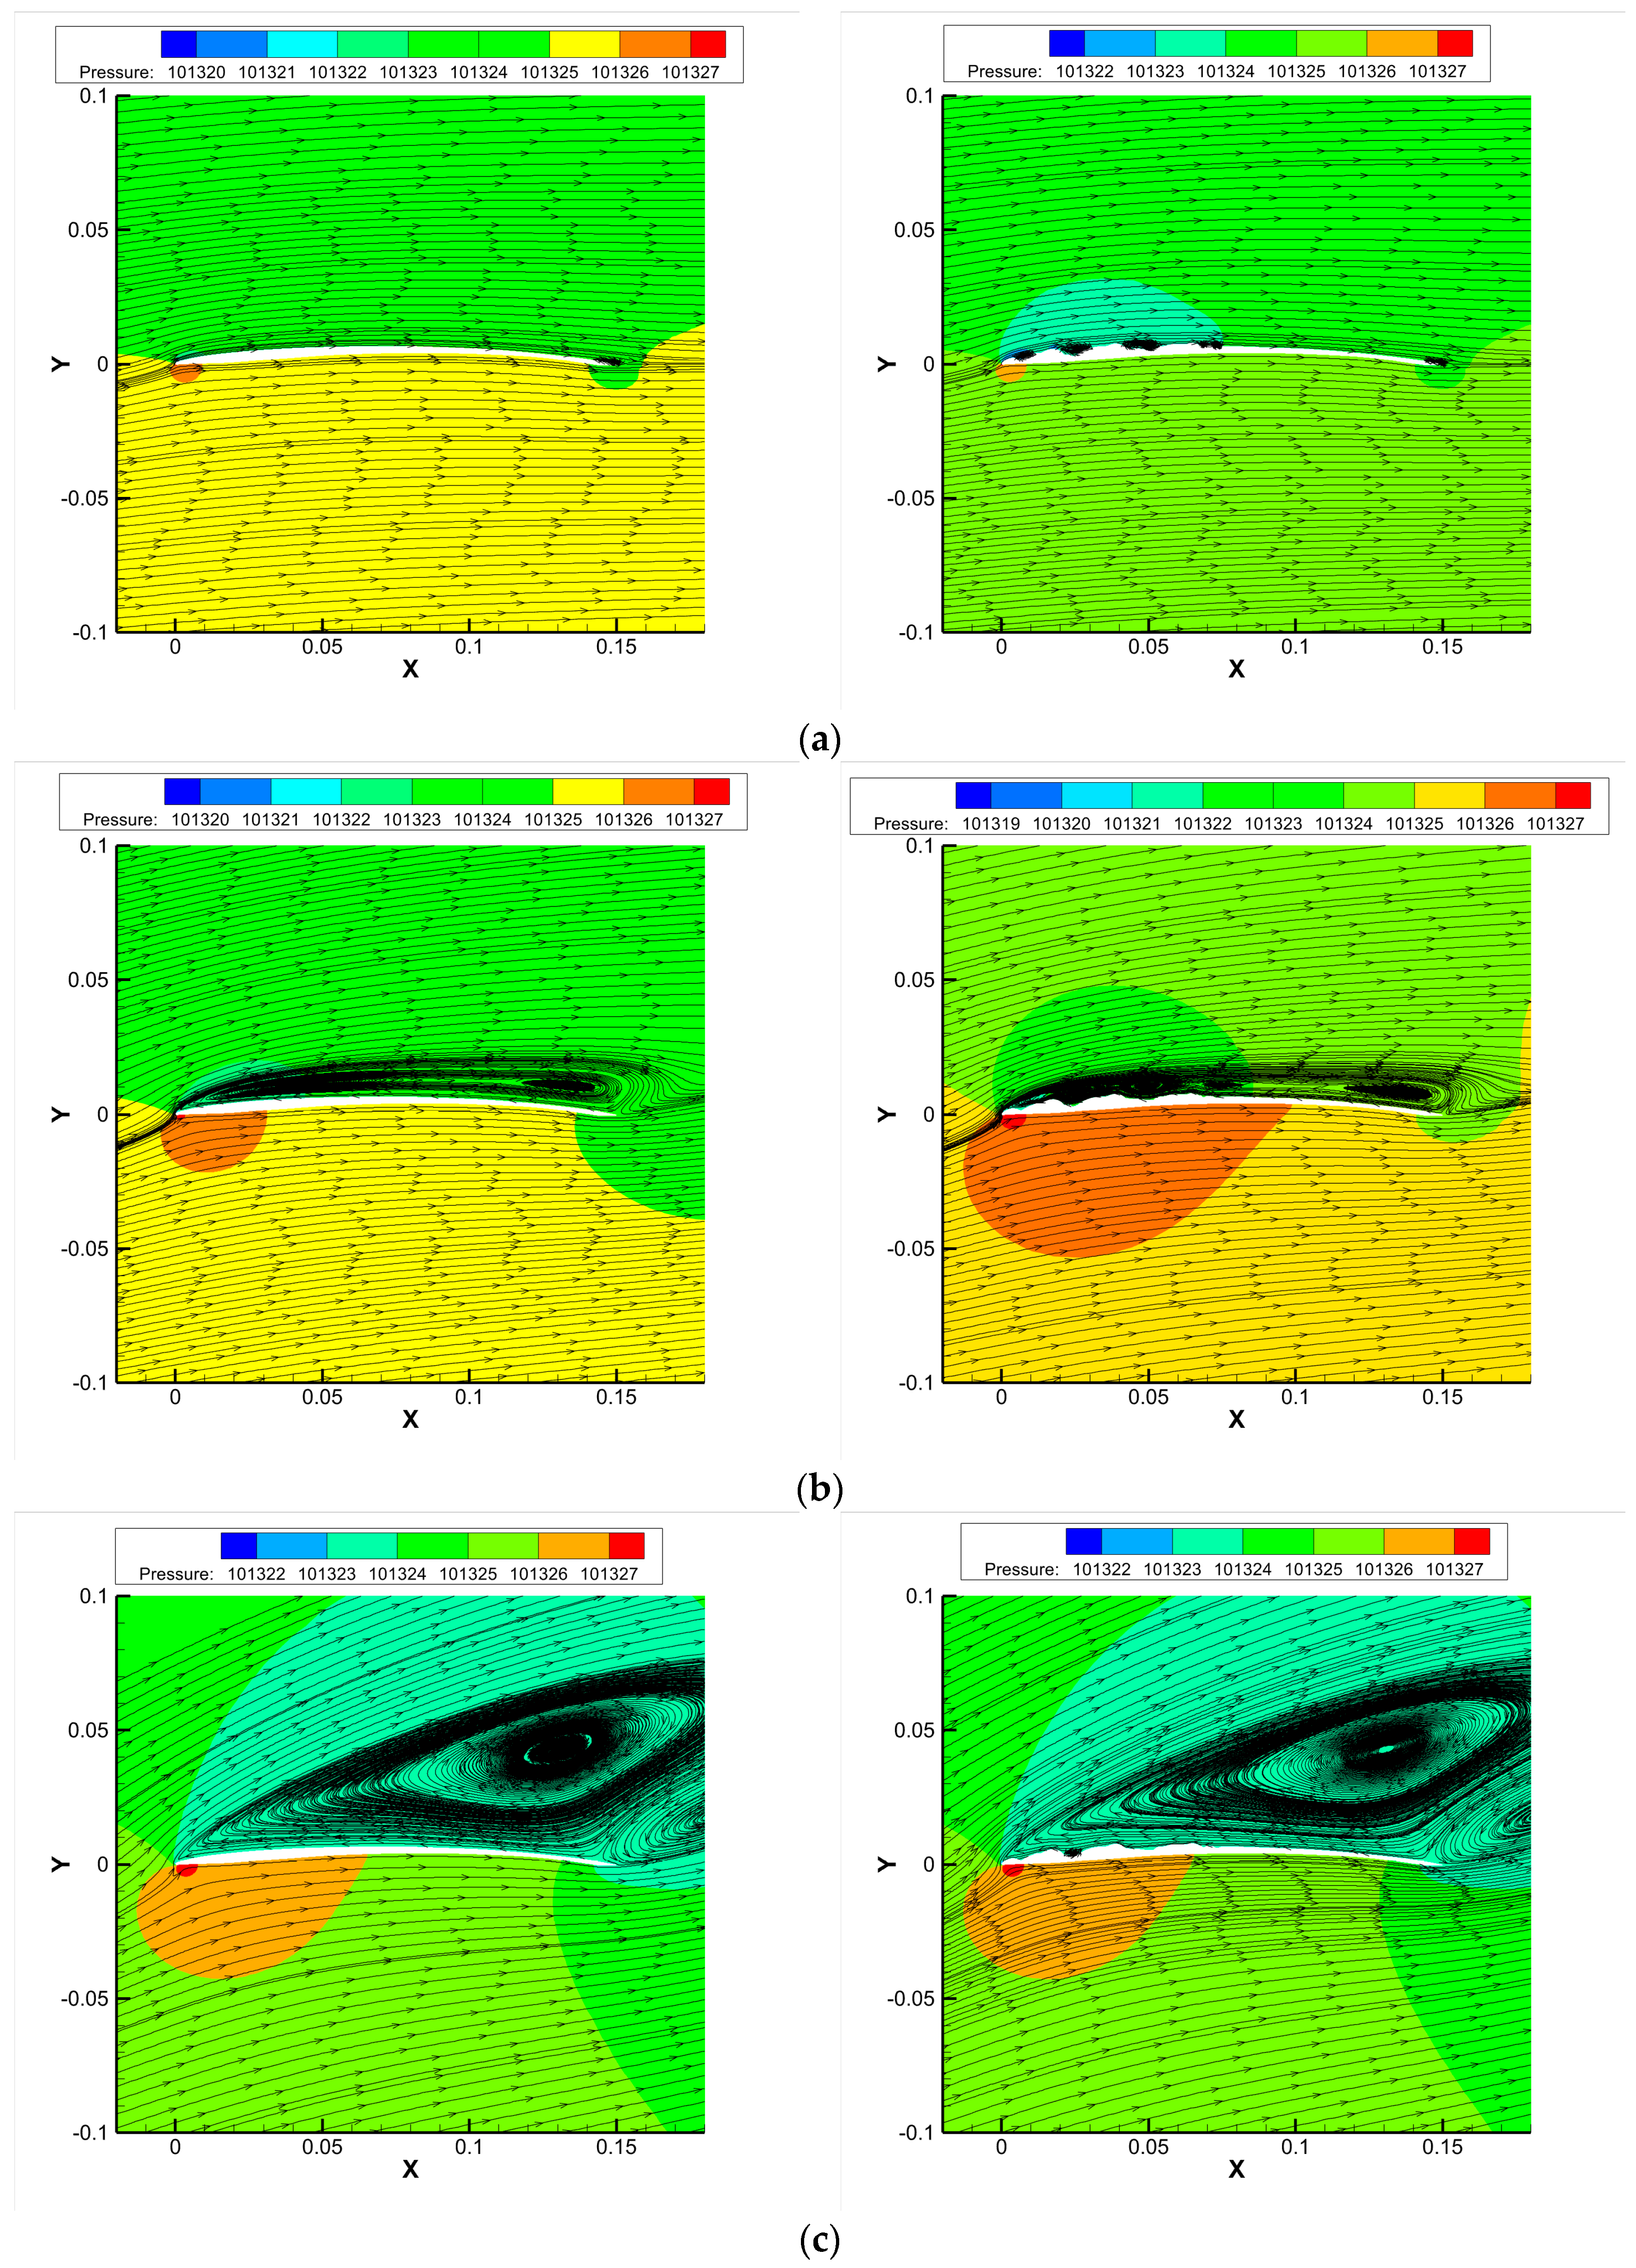
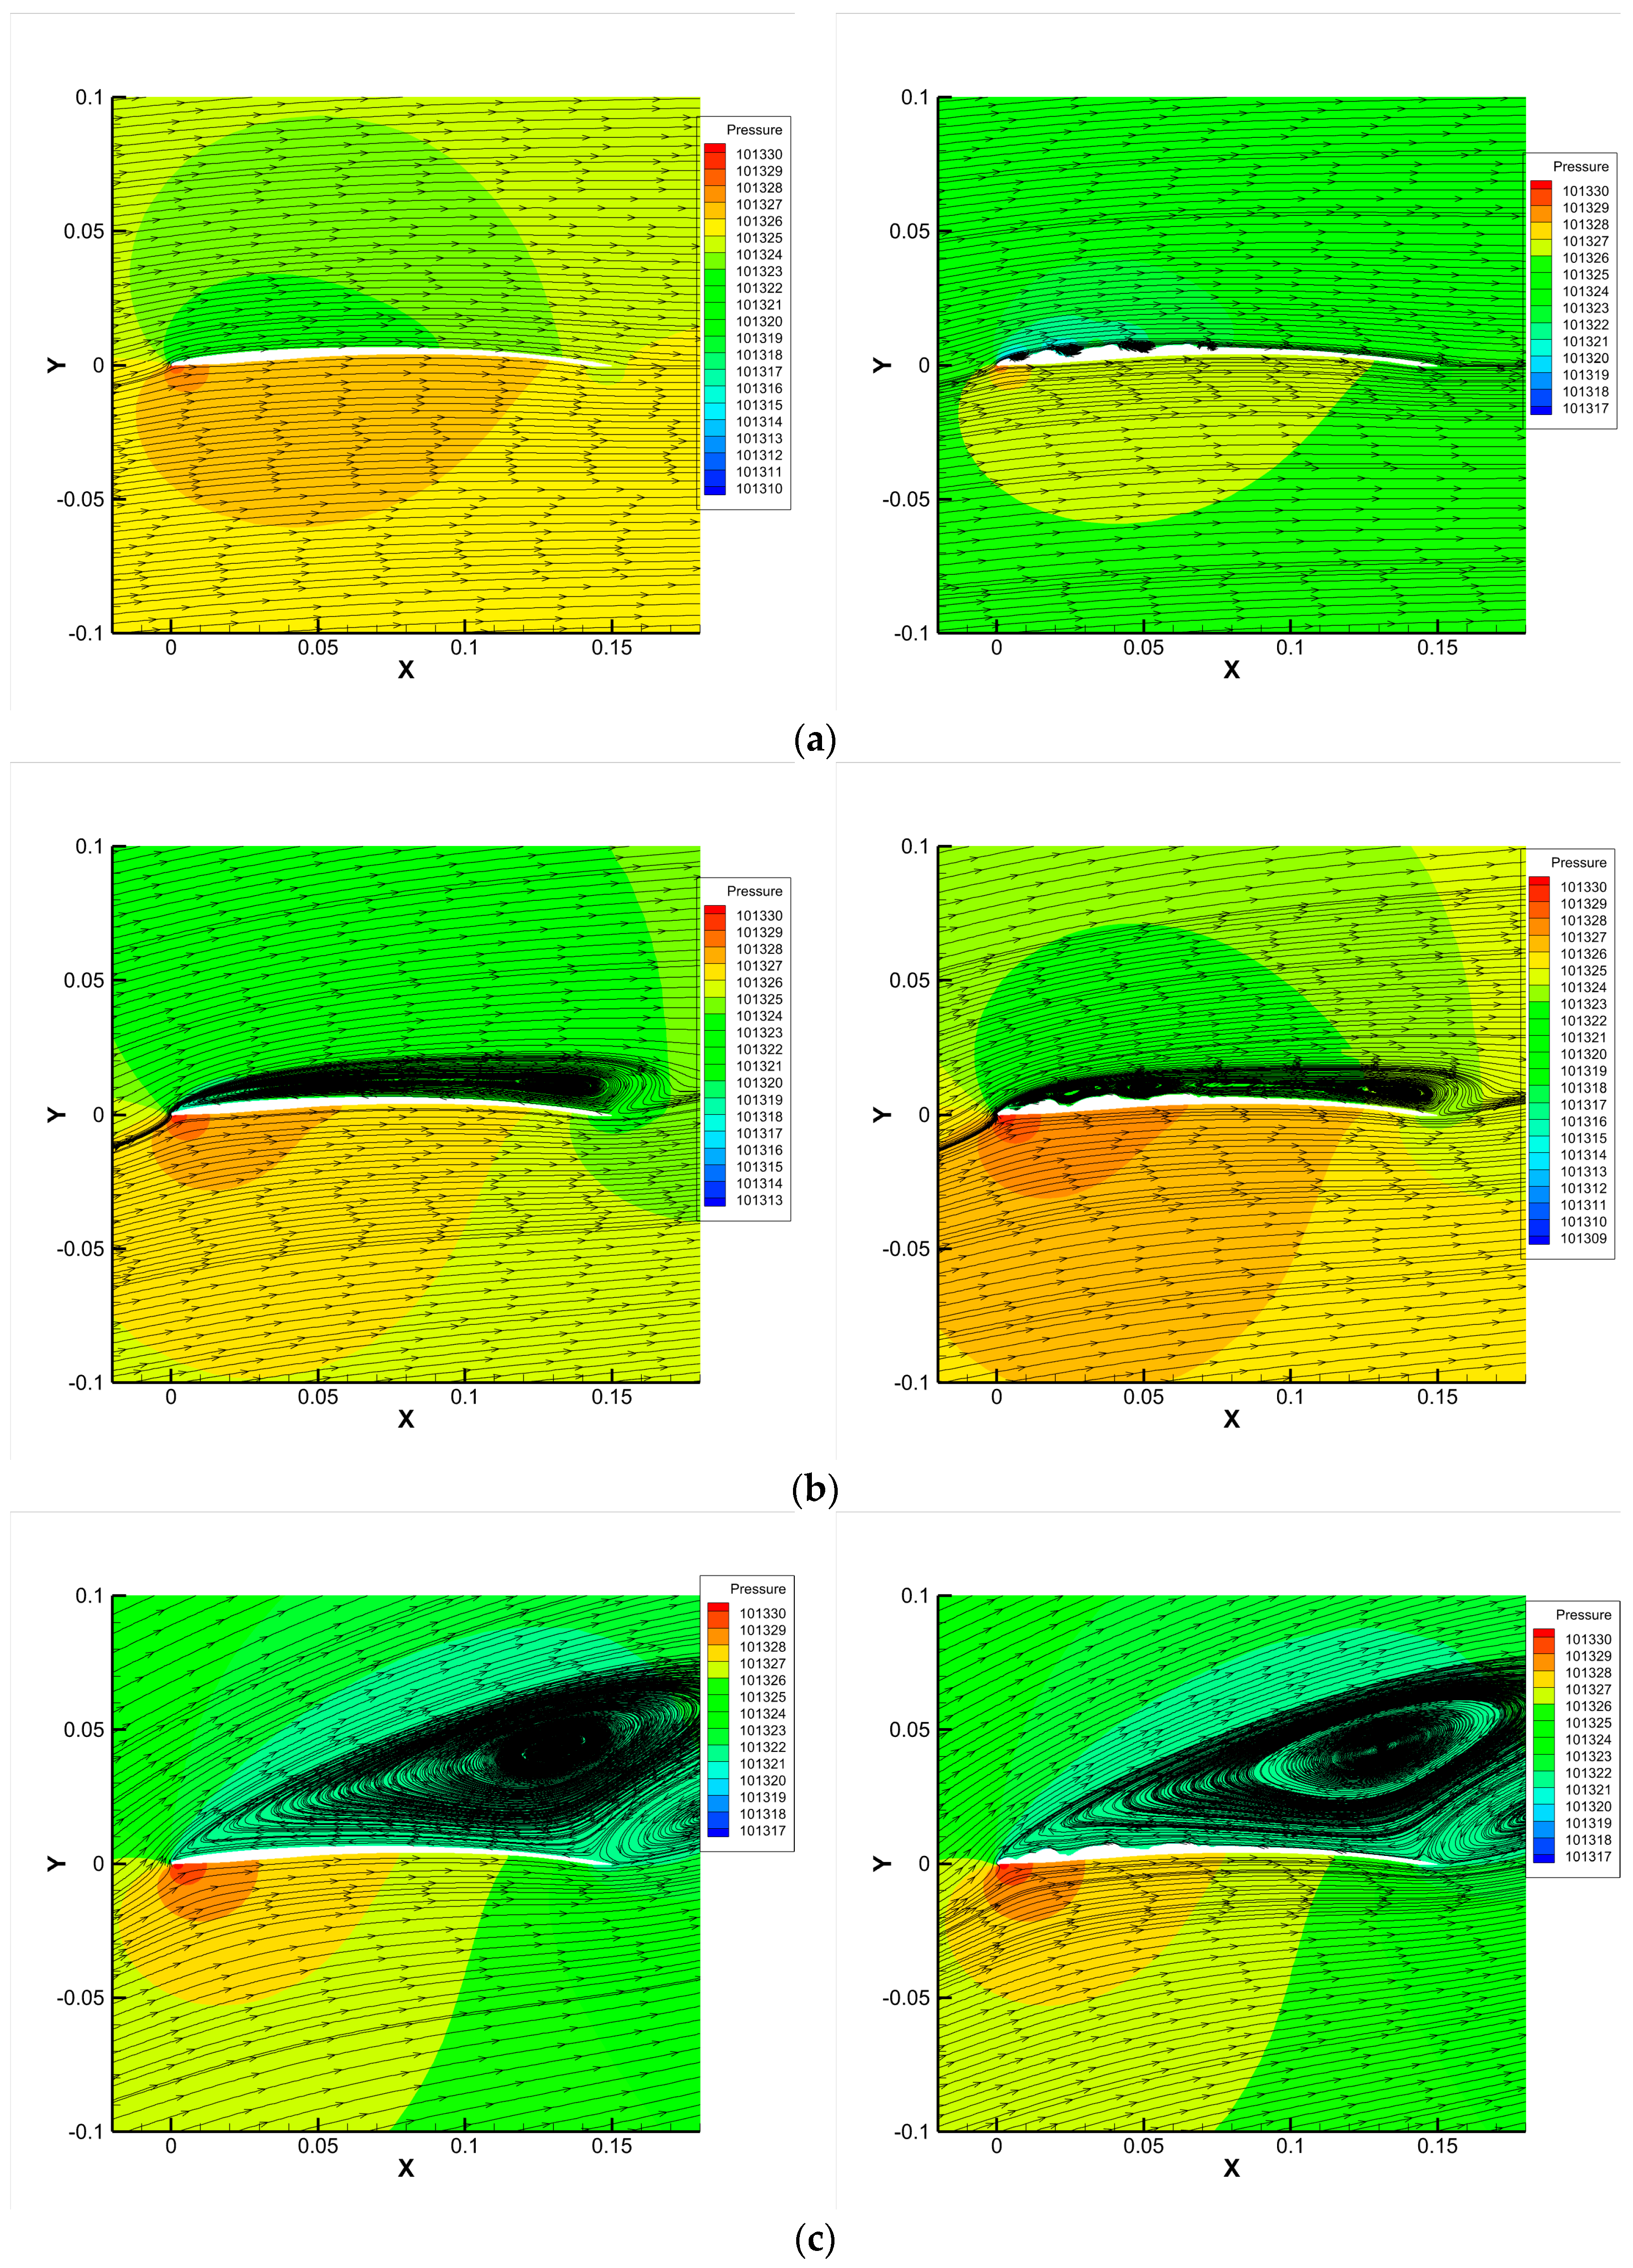
The presence of valleys in the rough structure leads to the formation of standing vortices, while the flow is accelerated at the ridges, resulting in suction peaks. Consequently, at small angles of attack, the rough airfoil exhibits higher lift compared to the smooth airfoil, primarily due to the presence of these four protruding suction peaks. However, as the angle of attack reaches 18°, the flow field becomes dominated by separated flow, and the lift becomes similar for both airfoils.
(2)
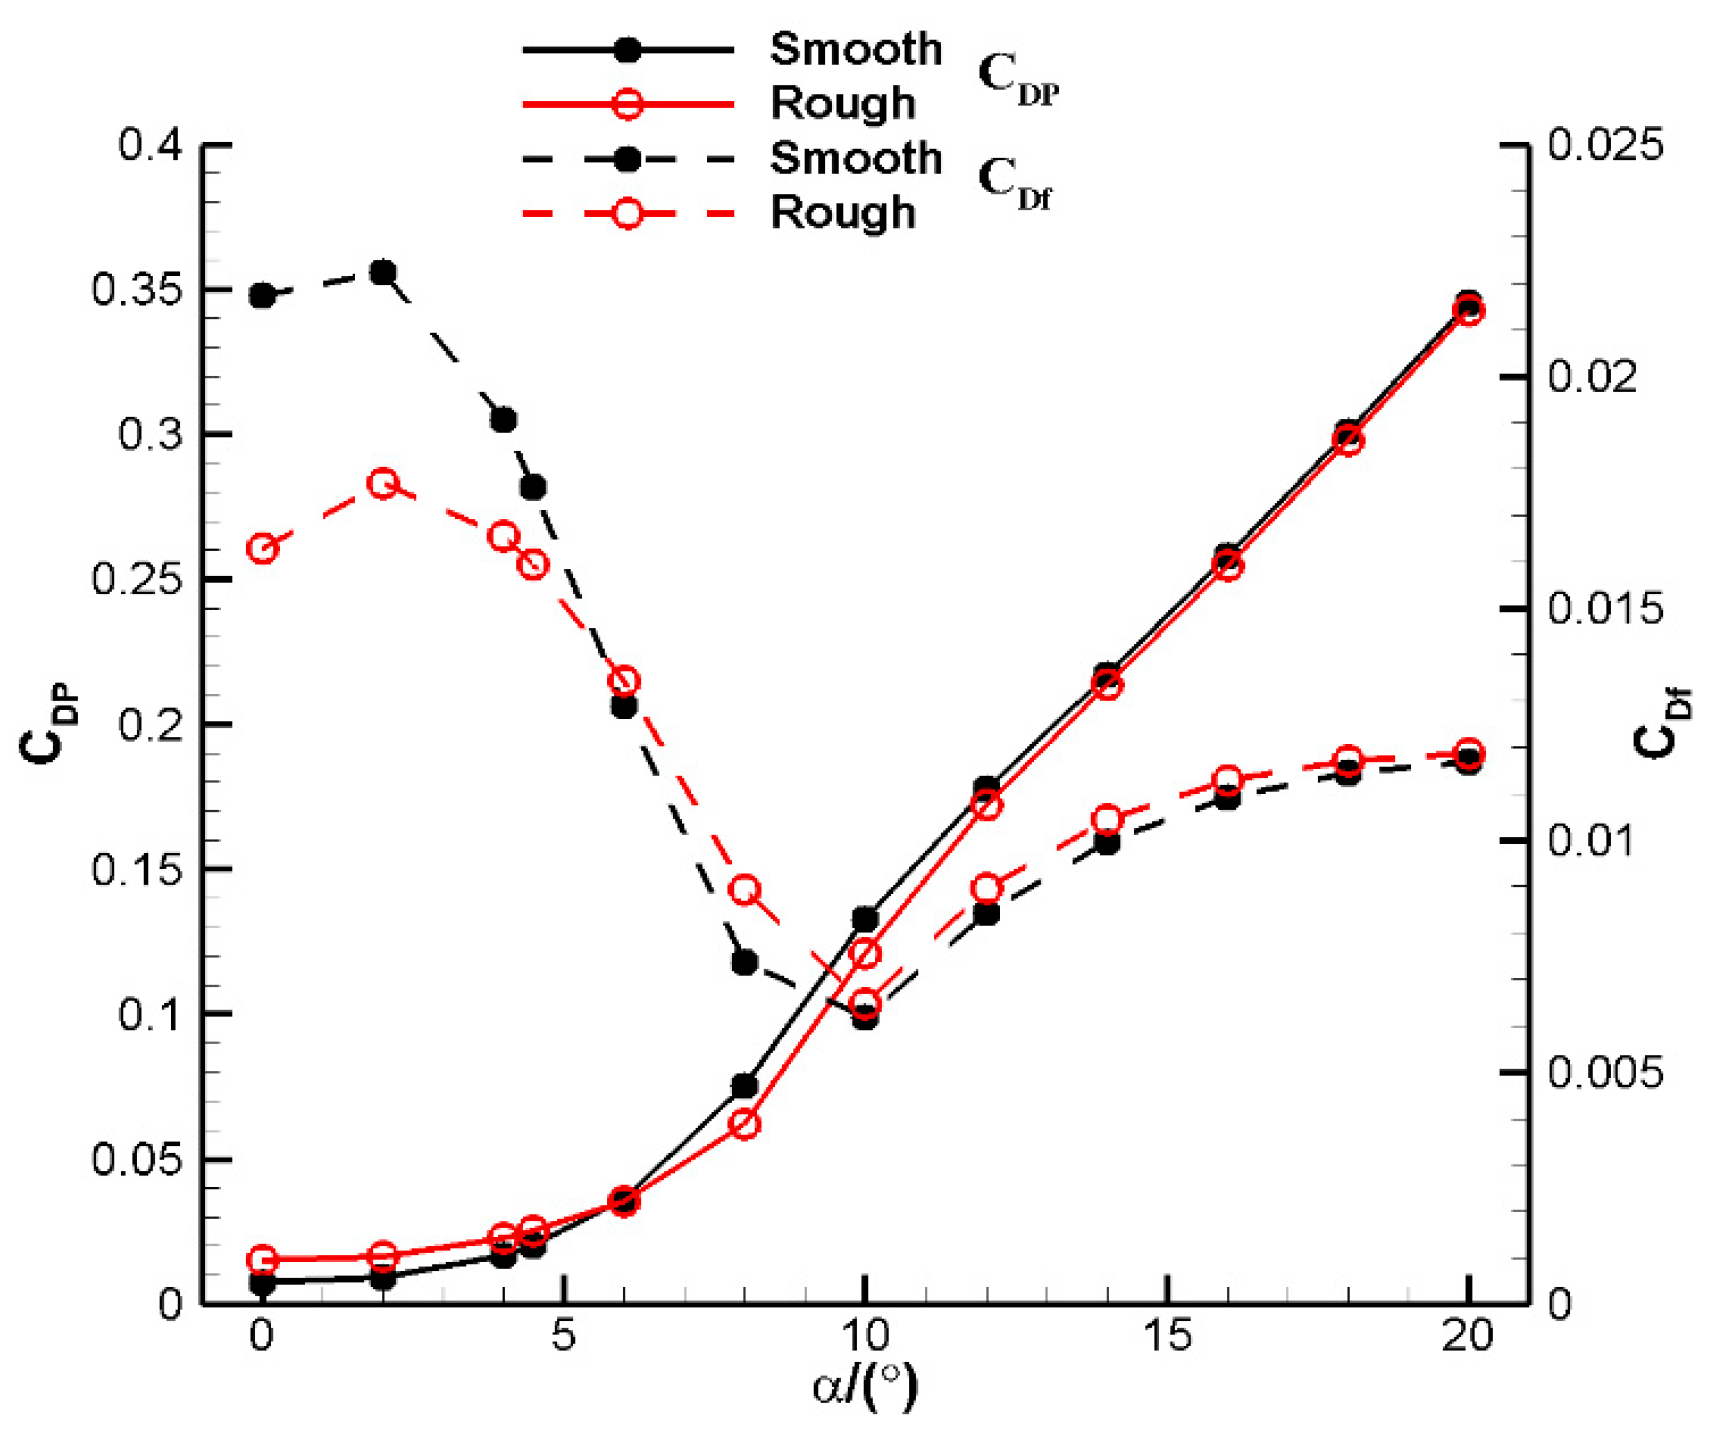
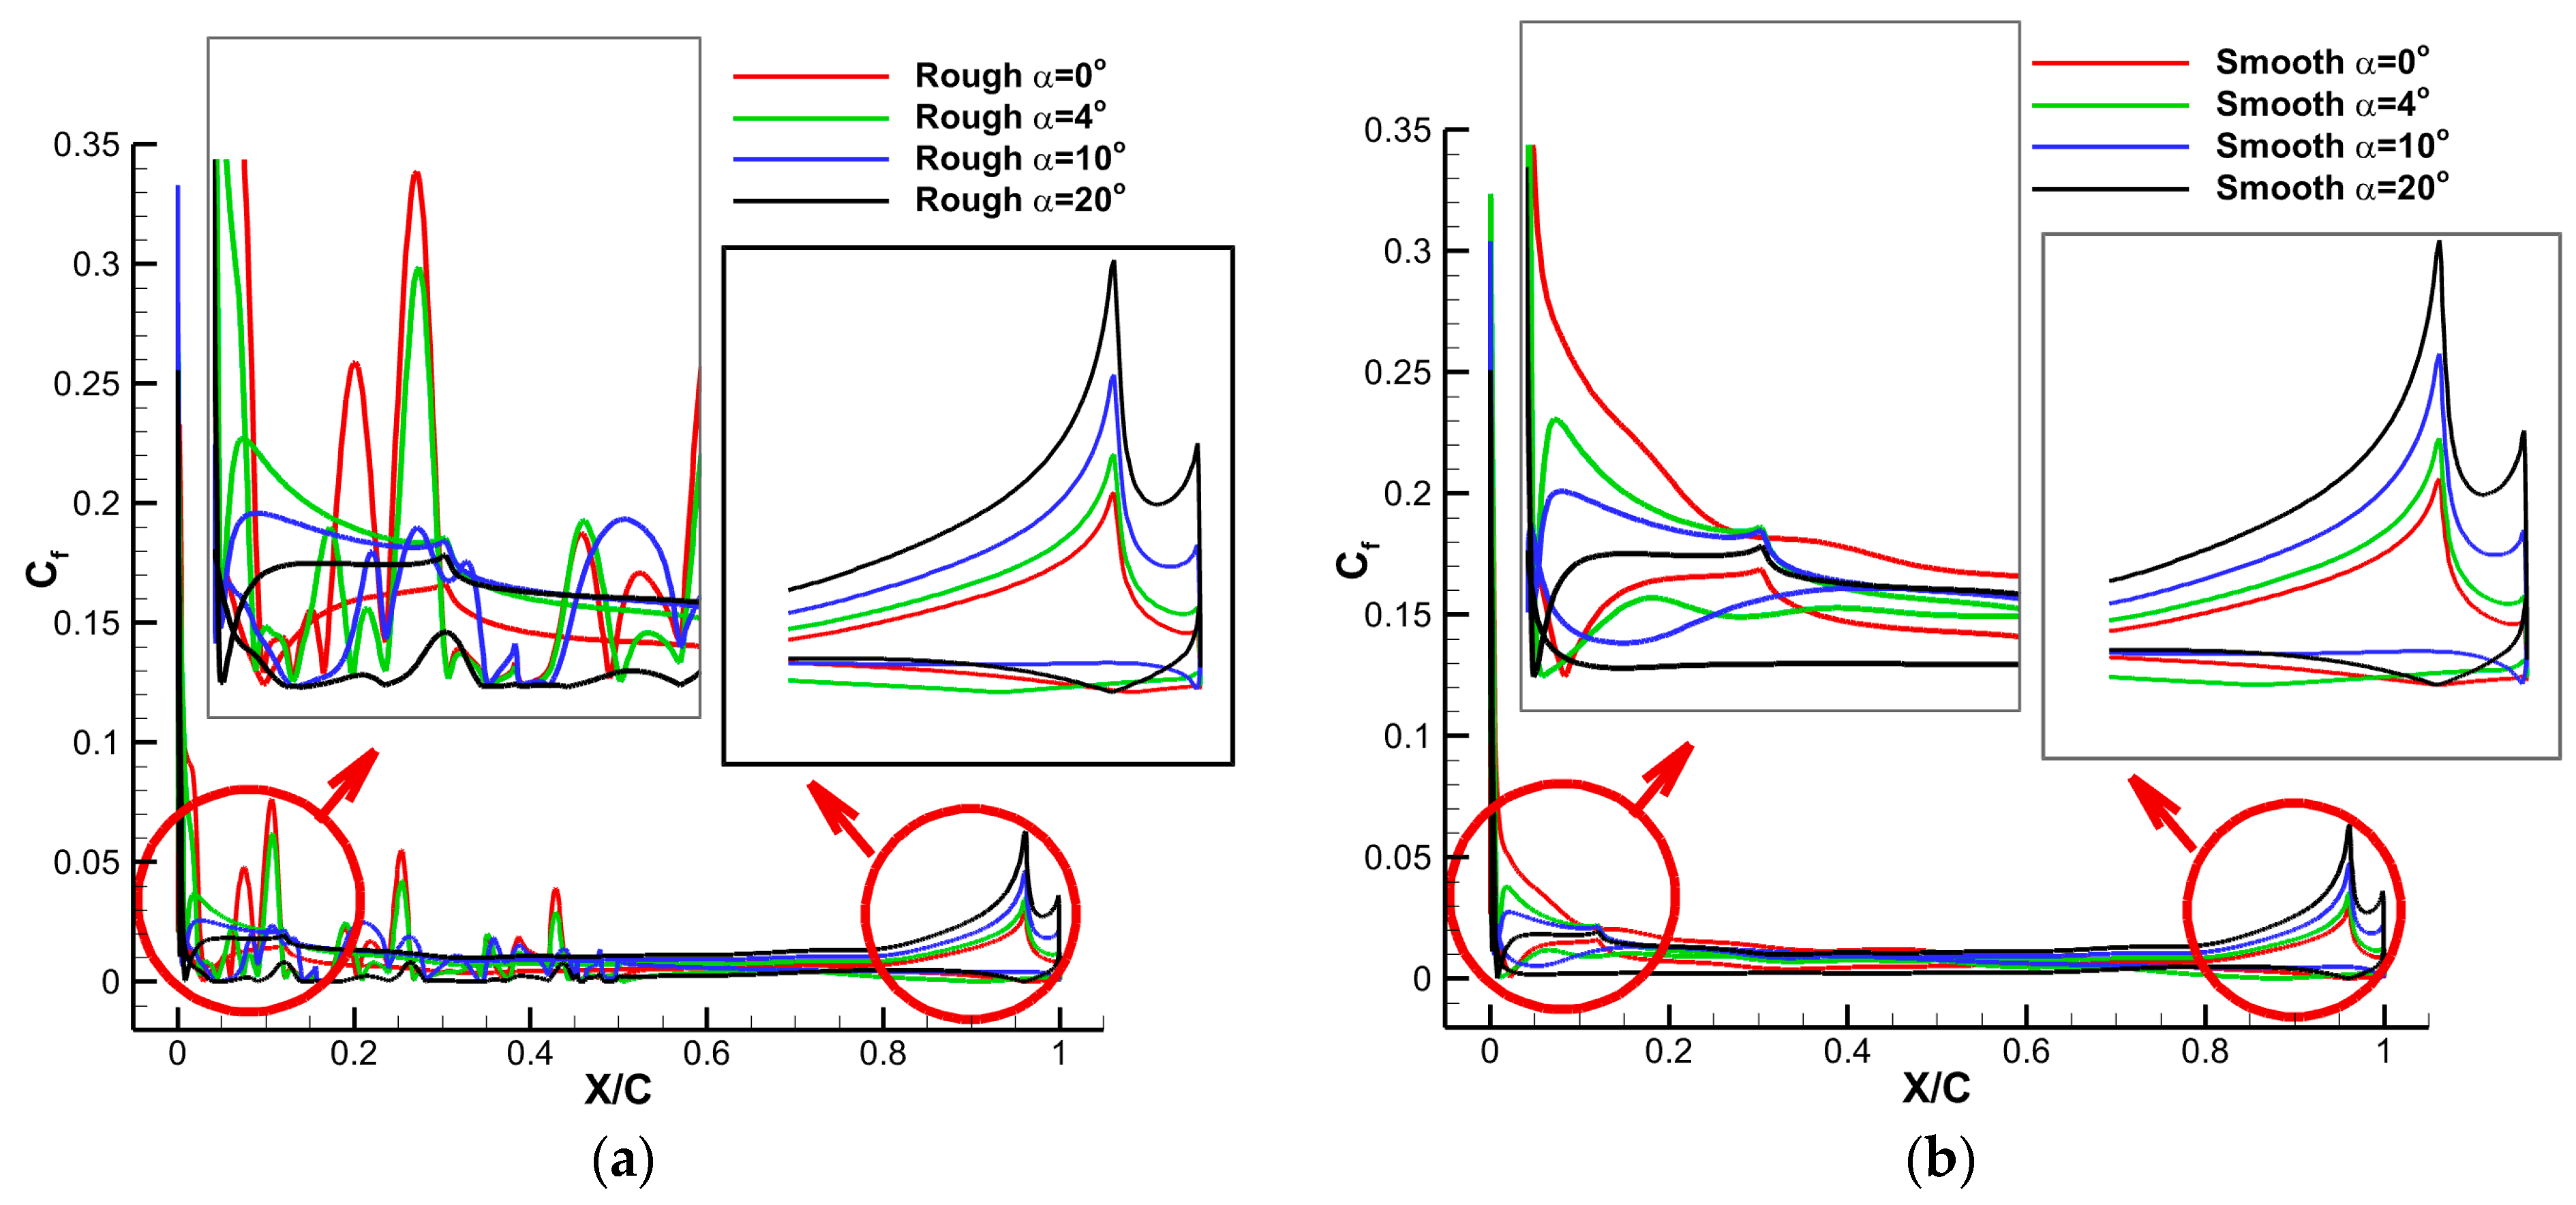
Frictional drag, being an order of magnitude smaller than pressure drag, has a minor impact on the total drag. The primary determinant of total drag is the pressure difference between the upper and lower surfaces. When the angle of attack is less than 6°, the rough airfoil experiences higher drag compared to the smooth airfoil. However, as the angle of attack surpasses 6°, the rough airfoil exhibits lower drag than the smooth airfoil
(3)
The aerodynamic efficiency of the rough airfoil is lower than that of the smooth airfoil at angles of attack below 6°, primarily due to the more pronounced increase in drag compared to lift. In the medium angle range of 8°–16°, the rough airfoil demonstrates higher aerodynamic efficiency. However, after 16°, when the flow field is dominated by separated flow, the lift remains almost constant, the drag experiences a slight reduction, and the aerodynamic efficiency does not exhibit significant improvement (less than 1%).
(4)
The aerodynamic effects of both airfoils exhibit similar trends within the range of Reynolds numbers studied. However, higher Reynolds numbers result in greater pressure differences in the flow field, leading to higher aerodynamic efficiency.
This study sheds light on the aerodynamic effects of non-smooth structures on the airfoil surface of the swift wing, providing insights into flow field evolution and aerodynamic changes. Further research is warranted to explore lift enhancement, drag reduction, and control mechanisms of compliant overlapping-feather structures during flight. These investigations will serve as a theoretical foundation and technical support for the future development of miniature feather-like bird-flying vehicles and morphing designs.

Author Contributions

Conceptualization, W.H. and Q.Z.; Methodology, W.H.; Software, Q.Z.; Validation, W.H. and Q.Z.; Formal Analysis, Q.Z.; Investigation, Q.Z.; Resources, J.X., J.W., J.Z. and X.C.; Data Curation, Q.Z.; Writing—Original Draft Preparation, Q.Z.; Writing—Review and Editing, W.H., J.X., J.W., J.Z. and X.C.; Visualization, Q.Z.; Supervision, Q.Z.; Project Administration, W.H. and Q.Z.; Funding Acquisition, W.H. and Q.Z. All authors have read and agreed to the published version of the manuscript.

Funding

This research was funded by the National Natural Science Foundation of China (Grant Nos. 52105107, 12202331), Guangdong Basic and Applied Basic Research Foundation (Grant No.2021A1515110002), and the Natural Science Basic Research Program of Shaanxi (Grant No.2022JQ−028).

Data Availability Statement

The datasets generated or analyzed during this study are available from the corresponding author upon reasonable request.

Acknowledgments

The computational work was carried out in the Gekko Cluster in the High Performance Computing Centre at Nanyang Technological University.

Conflicts of Interest

The authors declare that they have no known competing financial interests or personal relationships that could have appeared to influence the work reported in this paper.

References

  1. Shyy, W.; Aono, H.; Kang, C.; Liu, H. An Introduction to Flapping Wing Aerodynamics; Cambridge University Press: Cambridge, UK, 2013. [Google Scholar]
  2. Helfler, C.; Kang, C.; Qiu, H.; Shyy, W. Distinct Aerodynamics of Insect-Scale Flight (Elements of Aerospace Engineering); Cambridge University Press: Cambridge, UK, 2021. [Google Scholar]
  3. Zhang, Q.; Xue, R. Aerodynamic exploration of corrugated airfoil based on NACA0030 for inflatable wing structure. Aerospace 2023, 10, 174. [Google Scholar] [CrossRef]
  4. de Croon, G. Flapping wing drones show off their skills. Sci. Robot. 2020, 5, eabd0233. [Google Scholar] [CrossRef]
  5. Floreano, D.; Wood, R.J. Science, technology and the future of small autonomous drones. Nature 2015, 521, 460–466. [Google Scholar] [CrossRef] [Green Version]
  6. Zhang, Q.; Xue, R.; Li, H. Aerodynamic exploration for tandem wings with smooth or corrugated surfaces at low Reynolds number. Aerospace 2023, 10, 427. [Google Scholar] [CrossRef]
  7. Tong, B.; Lu, X. A review on biomechanics of animal flight and swimming. Adv. Mech. 2004, 34, 1–8. (In Chinese) [Google Scholar]
  8. Taylor, G.K.; Nudds, R.L.; Thomas, A.L.R. Flying and swimming animals cruise at a Strouhal number tuned for high power efficiency. Nature 2003, 425, 707–711. [Google Scholar] [CrossRef]
  9. Srygley, R.B.; Thomas, A.L.R. Unconventional lift-generating mechanisms in free-flying butterflies. Nature 2002, 420, 660–664. [Google Scholar] [CrossRef]
  10. Dickinson, M.H.; Lehmann, F.O.; Sane, S.P. Wing rotation and the aerodynamic basis of insect flight. Science 1994, 284, 1954–1960. [Google Scholar] [CrossRef]
  11. Ellington, C.P.; Van, D.B.C.; Willmott, A.P. Leading-edge vortices in insect flight. Nature 1996, 384, 626–630. [Google Scholar] [CrossRef]
  12. Ákos, Z.; Nagy, M.; Vicsek, T. Comparing bird and human soaring strategies. Proc. Natl. Acad. Sci. USA 2008, 105, 4139–4143. [Google Scholar] [CrossRef]
  13. Lian, Y.; Shyy, W.; Viieru, D. Membrane wing aerodynamics for micro air vehicles. Prog. Aerosp. Sci. 2003, 39, 425–465. [Google Scholar] [CrossRef]
  14. Lissaman, P.B.S. Low-Reynolds-Number Airfoils. Annu. Rev. Fluid Mech. 2003, 15, 223–239. [Google Scholar] [CrossRef]
  15. Luca, M.D.; Mintchev, S.; Su, Y.X.; Shaw, E.; Breuer, K. A bioinspired Separated Flow wing provides turbulence resilience and aerodynamic efficiency for miniature drones. Sci. Robot. 2020, 5, eaay8533. [Google Scholar] [CrossRef]
  16. Zhang, Q.; Ye, Z.Y. Computational investigations for aerodynamic performance of bio-inspired delta-wing based on swift-wing. Chin. J. Theor. Appl. Mech. 2021, 53, 373–385. (In Chinese) [Google Scholar]
  17. Chin, Y.W.; Kok, J.M.; Zhu, Y.Q.; Chan, W.L.; Chahl, J.S.; Khoo, B.C.; Lau, G. Efficient flapping wing drone arrests high-speed flight using post-stall soaring. Sci. Robot. 2020, 5, eaba2386. [Google Scholar] [CrossRef]
  18. Zhan, J.X.; Wang, J.J. Study on the effect of the flexibility of common swift’s wing on longitudinal aerodynamics. J. Exp. Fluid Mech. 2010, 24, 1–4. (In Chinese) [Google Scholar]
  19. Lambert, W.B.; Stanek, M.J.; Gurka, R.; Hackett, E.E. Leading-edge vortices over swept-back wings with varying sweep geometries. R. Soc. Open Sci. 2019, 6, 190514. [Google Scholar] [CrossRef] [Green Version]
  20. Muir, R.E.; Arredondo-Galeana, A.; Viola, I.M. The leading-edge vortex of swift wing-shaped delta wings. R. Soc. Open Sci. 2017, 4, 170077. [Google Scholar] [CrossRef] [Green Version]
  21. Henningsson, P.; Hedenström, A.; Bomphrey, R.J. Efficiency of lift production in flapping and gliding flight of swifts. PLoS ONE 2014, 9, e90170. [Google Scholar] [CrossRef] [Green Version]
  22. Henningsson, P.; Spedding, G.R.; Hedenström, A. Vortex wake and flight kinematics of a swift in cruising flight in a wind tunnel. J. Exp. Biol. 2011, 211, 717–730. [Google Scholar] [CrossRef] [Green Version]
  23. Henningsson, P.; Muijres, F.T.; Hedenström, A. Time-resolved vortex wake of a common swift flying over a range of flight speeds. J. R. Soc. Interface 2011, 8, 807–816. [Google Scholar] [CrossRef] [Green Version]
  24. Zhan, J.X.; Wang, J.J. The effect of leading-edge sweep angle asymmetry on lateral aerodynamics. Sci. China Ser. E Technol. Sci. 2009, 52, 2445–2448. [Google Scholar] [CrossRef]
  25. Videler, J.J.; Stamhuis, E.J.; Povel, G.D. Leading-edge vortex lifts swifts. Science 2004, 306, 1960–1962. [Google Scholar] [CrossRef] [Green Version]
  26. Henningsson, P.; Hedenström, A. Aerodynamics of gliding flight in common swifts. J. Exp. Biol. 2011, 214, 382–393. [Google Scholar] [CrossRef] [PubMed] [Green Version]
  27. Chellapurath, M.; Noble, S.; Sreejalekshmi, K. Design and kinematic analysis of flapping wing mechanism for common swift inspired micro aerial vehicle. Proc. Inst. Mech. Eng. Part C J. Mech. Eng. Sci. 2021, 235, 4026–4036. [Google Scholar] [CrossRef]
  28. Lentink, D.; Müller, U.K.; Stamhuis, E.J.; Kat, R.D.; Gestel, W.V.; Veldhuis, L.L.M.; Henningsson, P.; Hedenström, A.; Videler, J.J.; Leeuwen, J.L.V. How swifts control their glide performance with morphing wings. Nature 2007, 446, 1082–1085. [Google Scholar] [CrossRef] [PubMed]
  29. Matloff, L.Y.; Chang, E.; Feo, T.J. How flight feathers stick together to form a continuous morphing wing. Science 2020, 367, 293–297. [Google Scholar] [CrossRef]
  30. Lentink, D.; De, K.R. Gliding swifts attain laminar flow over rough wings. PLoS ONE 2014, 9, e99901. [Google Scholar] [CrossRef] [Green Version]
  31. Van, B.E.; De, K.R.; Elsinga, G.E.; Lentink, D. Feather roughness reduces flow separation during low Reynolds number glides of swifts. J. Exp. Biol. 2015, 218, 3179–3191. [Google Scholar]
  32. Xie, C.C.; Gao, N.Y.; Meng, Y.; Wu, Y.; Yang, C. A review of bird-like flapping wing with high aspect ratio. Chin. J. Aeronaut. 2023, 36, 22–44. [Google Scholar] [CrossRef]
  33. Han, J.K.; Hui, Z.; Tian, F.B.; Chen, G. Review on bio-inspired flight systems and bionic aerodynamics. Chin. J. Aeronaut. 2021, 34, 170–186. [Google Scholar] [CrossRef]
  34. Meseguer, J.; Franchini, S.; Pérez-Grande, I.; Sanz, J.L. On the aerodynamics of leading-edge high-lift devices of avian wings. Proc. Inst. Mech. Eng. Part G J. Aerosp. Eng. 2005, 219, 63–68. [Google Scholar] [CrossRef]
  35. Ye, Z.Y.; Hong, Z.; Wu, J. Suppression of flexible feather-like structure on boundary layer transition. Acta Aerodyn. Sin. 2020, 38, 1173–1182. (In Chinese) [Google Scholar]
  36. Ijspeert, A.J. Biorobotics: Using robots to emulate and investigate agile locomotion. Science 2014, 346, 196–203. [Google Scholar] [CrossRef] [PubMed] [Green Version]
  37. Sooraj, P.; Sharma, A.; Agrawal, A. Dynamics of co-rotating vortices in a flow around a bio-inspired corrugated airfoil. Int. J. Heat Fluid Flow 2020, 84, 108603. [Google Scholar] [CrossRef]
  38. Tang, D.; Fan, Z.Y.; Lei, M.X. A combined airfoil with secondary feather inspired by the golden eagle & its influences on the aerodynamics. Chin. Phys. B 2019, 28, 034702. [Google Scholar]
  39. Zhang, M.M.; Wang, G.F.; Xu, J.Z. Aerodynamic control of low-Reynolds-number airfoil with leading-edge protuberances. AIAA J. 2013, 51, 1960–1970. [Google Scholar] [CrossRef]
  40. Lian, Y.S.; Shyy, W. Laminar-turbulent transition of a low Reynolds number rigid or flexible airfoil. AIAA J. 2007, 45, 1501–1513. [Google Scholar] [CrossRef] [Green Version]
Figure 1. Swift wing with an amplified stethoscope [30]: (A) Similarly to other birds, swift hand wings are built up by overlapping primary feathers that make the upper surface corrugated. (B) When broad-spectrum turbulent noise was detected with the stethoscope, a photo of the transition location (grey arrow) was made.
Aerospace 10 00660 g001
Figure 2. Rough and smooth airfoils based on the swift wing.
Aerospace 10 00660 g002
Figure 3. Computational grid distribution at different positions. (a) Computational domain, (b) Detailed view of grid distribution near the two airfoils.
Aerospace 10 00660 g003
Figure 4. Comparison of pressure coefficients by different computational methods. (a) y+ = 10.0, 1.0, 0.1, 0.01 (α = 4.5°), (b) α = 4.5°.
Aerospace 10 00660 g004
Figure 5. Comparison of lift coefficient CL, drag coefficient CD, and lift-to-drag ratio K. (a) CL&CD, (b) K.
Aerospace 10 00660 g005
Figure 6. Comparison of pressure drag coefficient CDP and skin drag coefficient CDf.
Aerospace 10 00660 g006
Figure 7. Comparison of wall pressure coefficient at different angles of attack.
Aerospace 10 00660 g007
Figure 8. Comparison of wall skin friction coefficient at different angles of attack. (a) Rough airfoil, (b) Smooth airfoil.
Aerospace 10 00660 g008
Figure 9. Comparison of vortical structures at different angles of attack. (a) α = 4°, (b) α = 10°, (c) α = 20°.
Aerospace 10 00660 g009
Figure 10. Comparison of lift coefficient CL, drag coefficient CD, and lift-to-drag ratio K at different Reynolds numbers. (a) CL, (b) CD, (c) K.
Aerospace 10 00660 g010
Figure 11. Comparison of vortical structures at different angles of attack (Re = 20,000). (a) α = 4°, (b) α = 10°, (c) α = 20°.
Aerospace 10 00660 g011
Figure 12. Comparison of vortical structures at different angles of attack (Re = 30,000). (a) α = 4°, (b) α = 10°, (c) α = 20°.
Aerospace 10 00660 g012
Table 1. Comparison of lift and drag coefficients by different computational methods.
MethodCL (Relative Error)CD (Relative Error)
Ref [40]0.5610.021
Inviscid0.6541 (16.60%)0.0025 (−88.10%)
S-A0.5561 (−0.87%)0.0219 (4.29%)
SST0.5654 (0.78%)0.0223 (6.19%)
Table 2. Comparison of change rate of aerodynamic efficiency of the rough airfoil compared to the smooth airfoil.
α / °   K (Smooth)K (Rough)%
010.8745 10.7124 −1.49%
216.2739 15.5969 −4.16%
419.4783 18.3618 −5.73%
4.519.7688 18.6565 −5.63%
617.8323 18.4004 3.19%
812.2775 14.6062 18.97%
107.2949 8.2341 12.88%
125.2495 5.4760 4.31%
144.2617 4.3568 2.23%
163.6302 3.6799 1.37%
183.1737 3.2018 0.88%
202.8205 2.8369 0.58%
Disclaimer/Publisher’s Note: The statements, opinions and data contained in all publications are solely those of the individual author(s) and contributor(s) and not of MDPI and/or the editor(s). MDPI and/or the editor(s) disclaim responsibility for any injury to people or property resulting from any ideas, methods, instructions or products referred to in the content.

