Article

A Layered Structure Approach to Assure Urban Air Mobility Safety and Efficiency

1
Ingeniería y Economía del Transporte (INECO), 28036 Madrid, Spain
2
Sistemas Aeroespaciales, Transporte Aéreo y Aeropuertos, Universidad Politécnica de Madrid (UPM)–ETSI Aeronáutica y del Espacio, 28040 Madrid, Spain
3
Boeing Researh and Technology Europe (BRTE), 28042 Madrid, Spain
4
Galicia Institute of Technology (ITG), 15003 A Coruña, Spain
5
NTT Data, 28050 Madrid, Spain
6
School of Aerospace, Transport and Manufacturing, Cranfield University, Cranfield MK43 0AL, UK
7
Royal Netherlands Aerospace Centre (NLR), 1059 CM Amsterdam, The Netherlands
*
Author to whom correspondence should be addressed.
Aerospace 2023, 10(7), 609; https://doi.org/10.3390/aerospace10070609
Submission received: 16 May 2023 / Revised: 25 June 2023 / Accepted: 29 June 2023 / Published: 30 June 2023
(This article belongs to the Special Issue Advanced Air Mobility)

Abstract

:
The demand for air mobility services will depend on the safety of these operations but also on the transportation time savings in congested urban areas. An adequate air space structure is therefore essential to achieve both objectives. Corridors, the most extended solution proposed nowadays, can meet the safety requirements necessary for air taxi operations, but they are rigid (point-to-point solutions) and would increase delays. As an alternative, this paper presents the airspace structure proposed in the SESAR AMU-LED Project, based on layers to assure both safety and efficiency of air taxi operations. In this proposal, small UAS will fly in the bottom part, called the Very Low Level, whereas air taxis will fly in the upper part. The paper applies a collision risk model to determine the minimum required safety buffer between both layers to assure the necessary safety levels. The results obtained show that a buffer of 10 m between them would meet the required safety levels for air taxi operations.

1. Introduction

The technological developments in automation and electric batteries and propulsion over the past years have boosted interest for Urban Air Mobility (UAM) [1]. In particular, electrical vertical takeoff and landing (eVTOL) vehicles are expected to generate less noise and to be safer and cheaper to produce and operate than helicopters, opening the door for short-range passenger air transportation on a regular basis [1].
Air taxi or air shuttle services based on eVTOL aircraft are expected to experience a big demand in upcoming years, with initial deployments already foreseen in 2025 [2]. NASA expects that by 2030, a commercial market for last-mile delivery operations and air metro [3] could be established in the largest metropolitan areas, whereas air taxis could be profitable by that year in some niche markets. Other market studies [4,5] foresee that by as soon as 2025, air taxis could be providing commercial services in certain locations, and by 2035, around 25,000 eVTOL would be operating worldwide. More recent studies [6] show that global air taxis’ passenger demand will rise quadratically until 2040, reaching a demand of 900 million passengers, although mostly concentrated in the biggest metropolitan areas worldwide, with intra-city operations being more demanded than inter-city operations.
However, the aforementioned market studies might overestimate users’ willingness to pay for these kinds of mobility services, not properly considering the potential constraints that could reduce demand. Analysing airport shuttle and air taxi services, Ref. [7] shows that only 0.5% of unconstrained trips (air taxi and airport shuttle combined) would be captured using air mobility, with infrastructure (both the number of vertiports and capacity) being the greatest constraint on the demand for these services; moreover, the paper states that non-discretionary trips (fixed routes such as airport shuttles) are more likely to be demanded than air taxis (discretionary trips), which will be limited to those with a travel time greater than 30 min by ground transportation.
Focusing on the factors driving the demand for air mobility services, Ref. [8] revealed that individuals’ willingness to hire and willingness to pay for flying taxis depends on socio-demographic characteristics, individual experiences and, above all, the perceived concerns and benefits of flying cars. The study determines that an attractive pricing and regulatory framework will be essential for the development of this sector, which will be concentrated in densely populated urban areas, as inhabitants in congestion-prone urban areas are looking for lower and more reliable travel times and, therefore, are more likely to pay for flying taxis. With regard to concerns, the study also shows that respondents who are familiar with advanced vehicle safety features are willing to hire human-operated flying taxis and, congruously, that those who are very concerned about the safety consequences of flying car equipment/system failure are not willing to hire autonomous flying cars.
Similarly, Ref. [9] conducted surveys to understand the impact on UAM adoption of socio-demographic parameters and their attitudes, whose results indicated high adoption rates for UAM, but also that many respondents were reluctant to use the service, with safety being the factor perceived to be of highest importance regarding the use of UAM.
In addition to these surveys, a case study in San Francisco and New York [10] shows, considering population density and airspace restrictions, that UAM applications will be mostly demanded in the areas called HL (i.e., High population/Low airspace availability); thus, efficient traffic flow management is needed, considering the high UAM demand and the limited airspace availability, especially due to the necessary safety restrictions.
Therefore, it can be concluded that two main factors will determine the demand for air mobility services: (1) the transportation time savings in congested urban areas and (2) the safety of these operations.
This paper presents the airspace structure proposed in the SESAR AMU-LED Project, based on layers, to assure both conditions for eVTOL operations, as well as the reasons underpinning this approach and an analysis of its feasibility. Section 2 summarises the state-of-the-art on UAM. Section 3 describes the proposed airspace structure, whereas Section 4 describes the methodology used to estimate the minimum buffers required to guarantee a low enough collision risk among layers. Section 5 presents the results and minimum buffers and, finally, Section 6 shows the main conclusions.

2. State-of-the-Art of UAM with Regard to Safety

As discussed, it is clear that no efficiency or time saving benefit will generate a high demand for air taxi services if the societal perception of the safety of this means of transportation is not high enough, i.e., the results of air taxi services are at least as safe as other transport means, if not even safer.
Accordingly, the first objective of Aviation Authorities is focused on assuring that the operation of eVTOL vehicles carrying people on board assures safety levels similar to those of manned aviation today. EASA includes this type of operation in the so-called ‘certified category’ [11], which will demand certification of the aircraft and of the operator, as well as licensing of the remote pilot, in order to guarantee the required safety levels. To address the certification of these operations, EASA will propose amendments to the existing regulations that are applicable to manned aviation [12,13]. The FAA follows a similar approach [14], as do other National Aviation Authorities. For the time being, and considering the specifications for the type of certification required for this kind of product, EASA has already published dedicated technical specifications by means of a Special Condition for VTOL [15].
However, the required safety levels will not depend only on the features of the vehicle, the type of operator and the pilot licensing; it is also essential to assure that collisions with other aircraft can be generally avoided. In the case of manned aviation, the ICAO’s Rules of the Air [16] assign the responsibility for detecting and avoiding collisions in uncontrolled airspace to the pilot-in-command on board the aircraft, following the principle of “See and Avoid”; obviously, this approach is not valid for unmanned aircraft, so collision risk has to be avoided by other means. Considering that most general aviation aircraft are not conspicuous, i.e., they do not broadcast or share their position by means of TCAS, ADS-B or FLARM equipage on board [17], in order to avoid collisions with them, UAS would have to detect them by relying on non-cooperative devices, whose technical requirements are far from being met by existing technologies.
To solve this problem, a first solution is to allow VTOL air taxi operations only with a pilot on board; this is the initial approach followed by EASA in the “Type #3 operations” defined in the NPA 2022-06 [13]. However, this can only be seen as a first step to facilitate the development of the sector, not a final solution; these operations are conceptually designed to be unmanned, as the cost of these services is a critical factor for the potential demand.
A second solution that has been used for most drone operations through the present day consists of segregating them from manned aircraft. As ICAO’s Rules of the Air [16] specify that VFR flights shall take place below 1000 ft above the highest obstacle over cities and congested areas and 500 ft elsewhere, except when necessary for take-off or landing, or except by permission from the competent authority. This lowest part of the airspace, known as the Very Low Level (VLL), has been generally assigned for UAS operations to keep them segregated from manned aircraft.
However, UAM includes many other applications and Unmanned Aerial Systems (UASs). A clarifying definition of UAM is provided in [18] “Urban Air Mobility is a transformational mobility concept for urban areas, making use of all types of UAS to perform any type of missions operated in the VLL airspace that aims to improve the welfare of individual and organizations”. This definition clearly shows that UAM encompasses not only large eVTOL vehicles, but any kind of drone, which implies that the safe coexistence with different types of unmanned aircraft is essential for the development of intraurban passenger transport based on eVTOL aircraft, especially if they are going to share the same portion of airspace.
As explained, integrating such operations in the ATM (Air Traffic Management) system would require a drastic overhaul of this system; therefore, UAM operations will more likely be conducted in a separated airspace with new rules and standards [19]. Because eVTOL and other UAS will compete for the same limited space, smaller separation standards will be required.
To allow the safe development of the expected amount of UAS operations and provide those required smaller separation standards, U-space/UTM is considered a key enabler. U-space services aim to provide automated, interoperable, and sustainable traffic management solutions for achieving the safe integration of drones in all classes of airspace in the long term, but starting in the VLL [20].
Additionally, although sharing airspace with other UAS operations is a challenge for air taxis, last-mile deliveries could also pave the way for future UAM passenger transportation, allowing the development of enabling technologies and exploring the most efficient way for the implementation of these types of services, including concept development, regulations and public acceptance [21].
However, as explained, this solution implies the coexistence of people-carrying VTOL aircraft with the rest of UAS, and the performances of both types of vehicles can be very different, especially considering UAS in the Open and Specific Categories [11], as well as the required safety levels, which have to be greater for air taxis, as they carry people on board. To cope with this problem, segregating large eVTOL vehicles from small UAS also becomes essential. The most extended solution is the deployment of corridors for UAM, in which these eVTOL vehicles for carrying people or goods will be separated from manned aircraft and UAS, which do not meet the requirements to operate in this environment [22]. Therefore, this corridor solution can assure the required safety levels.
However, an exhaustive analysis of urban airspace design initiatives [19] shows that less structured airspace, such as the concept of Free flight, allows greater capacity and route efficiency but requires greater technological capabilities and reduces safety. In this case, the detect-and-avoid system is the only barrier that prevents an accident. On the other hand, more restrictive structures, such as tubes and lanes, enable the operations of less-equipped aircraft but increase inefficiency and delays.
Therefore, corridors can meet the safety requirements necessary for air taxi operations in terms of segregation, but they are inefficient, rigid (point-to-point solutions) and would increase delays. As explained, the second key element for the adoption of air taxis are the transportation time savings in congested urban areas. With this idea in mind, corridors can only be considered as a temporary solution.
A potential solution would be to segregate aircraft of different capabilities (e.g., eVTOL and small UAS) into different layers. Layers reduce the probability of a collision [23] by providing vertical separation among operations, segregating flights depending on their headings and speeds, as well as on the aircraft capabilities. The layered approach could therefore meet the required levels of safety without generating delays that would limit interest in air taxis. For this reason, the AMU-LED project has proposed an airspace structure based on layers for eVTOL and small UAS operations in the VLL.

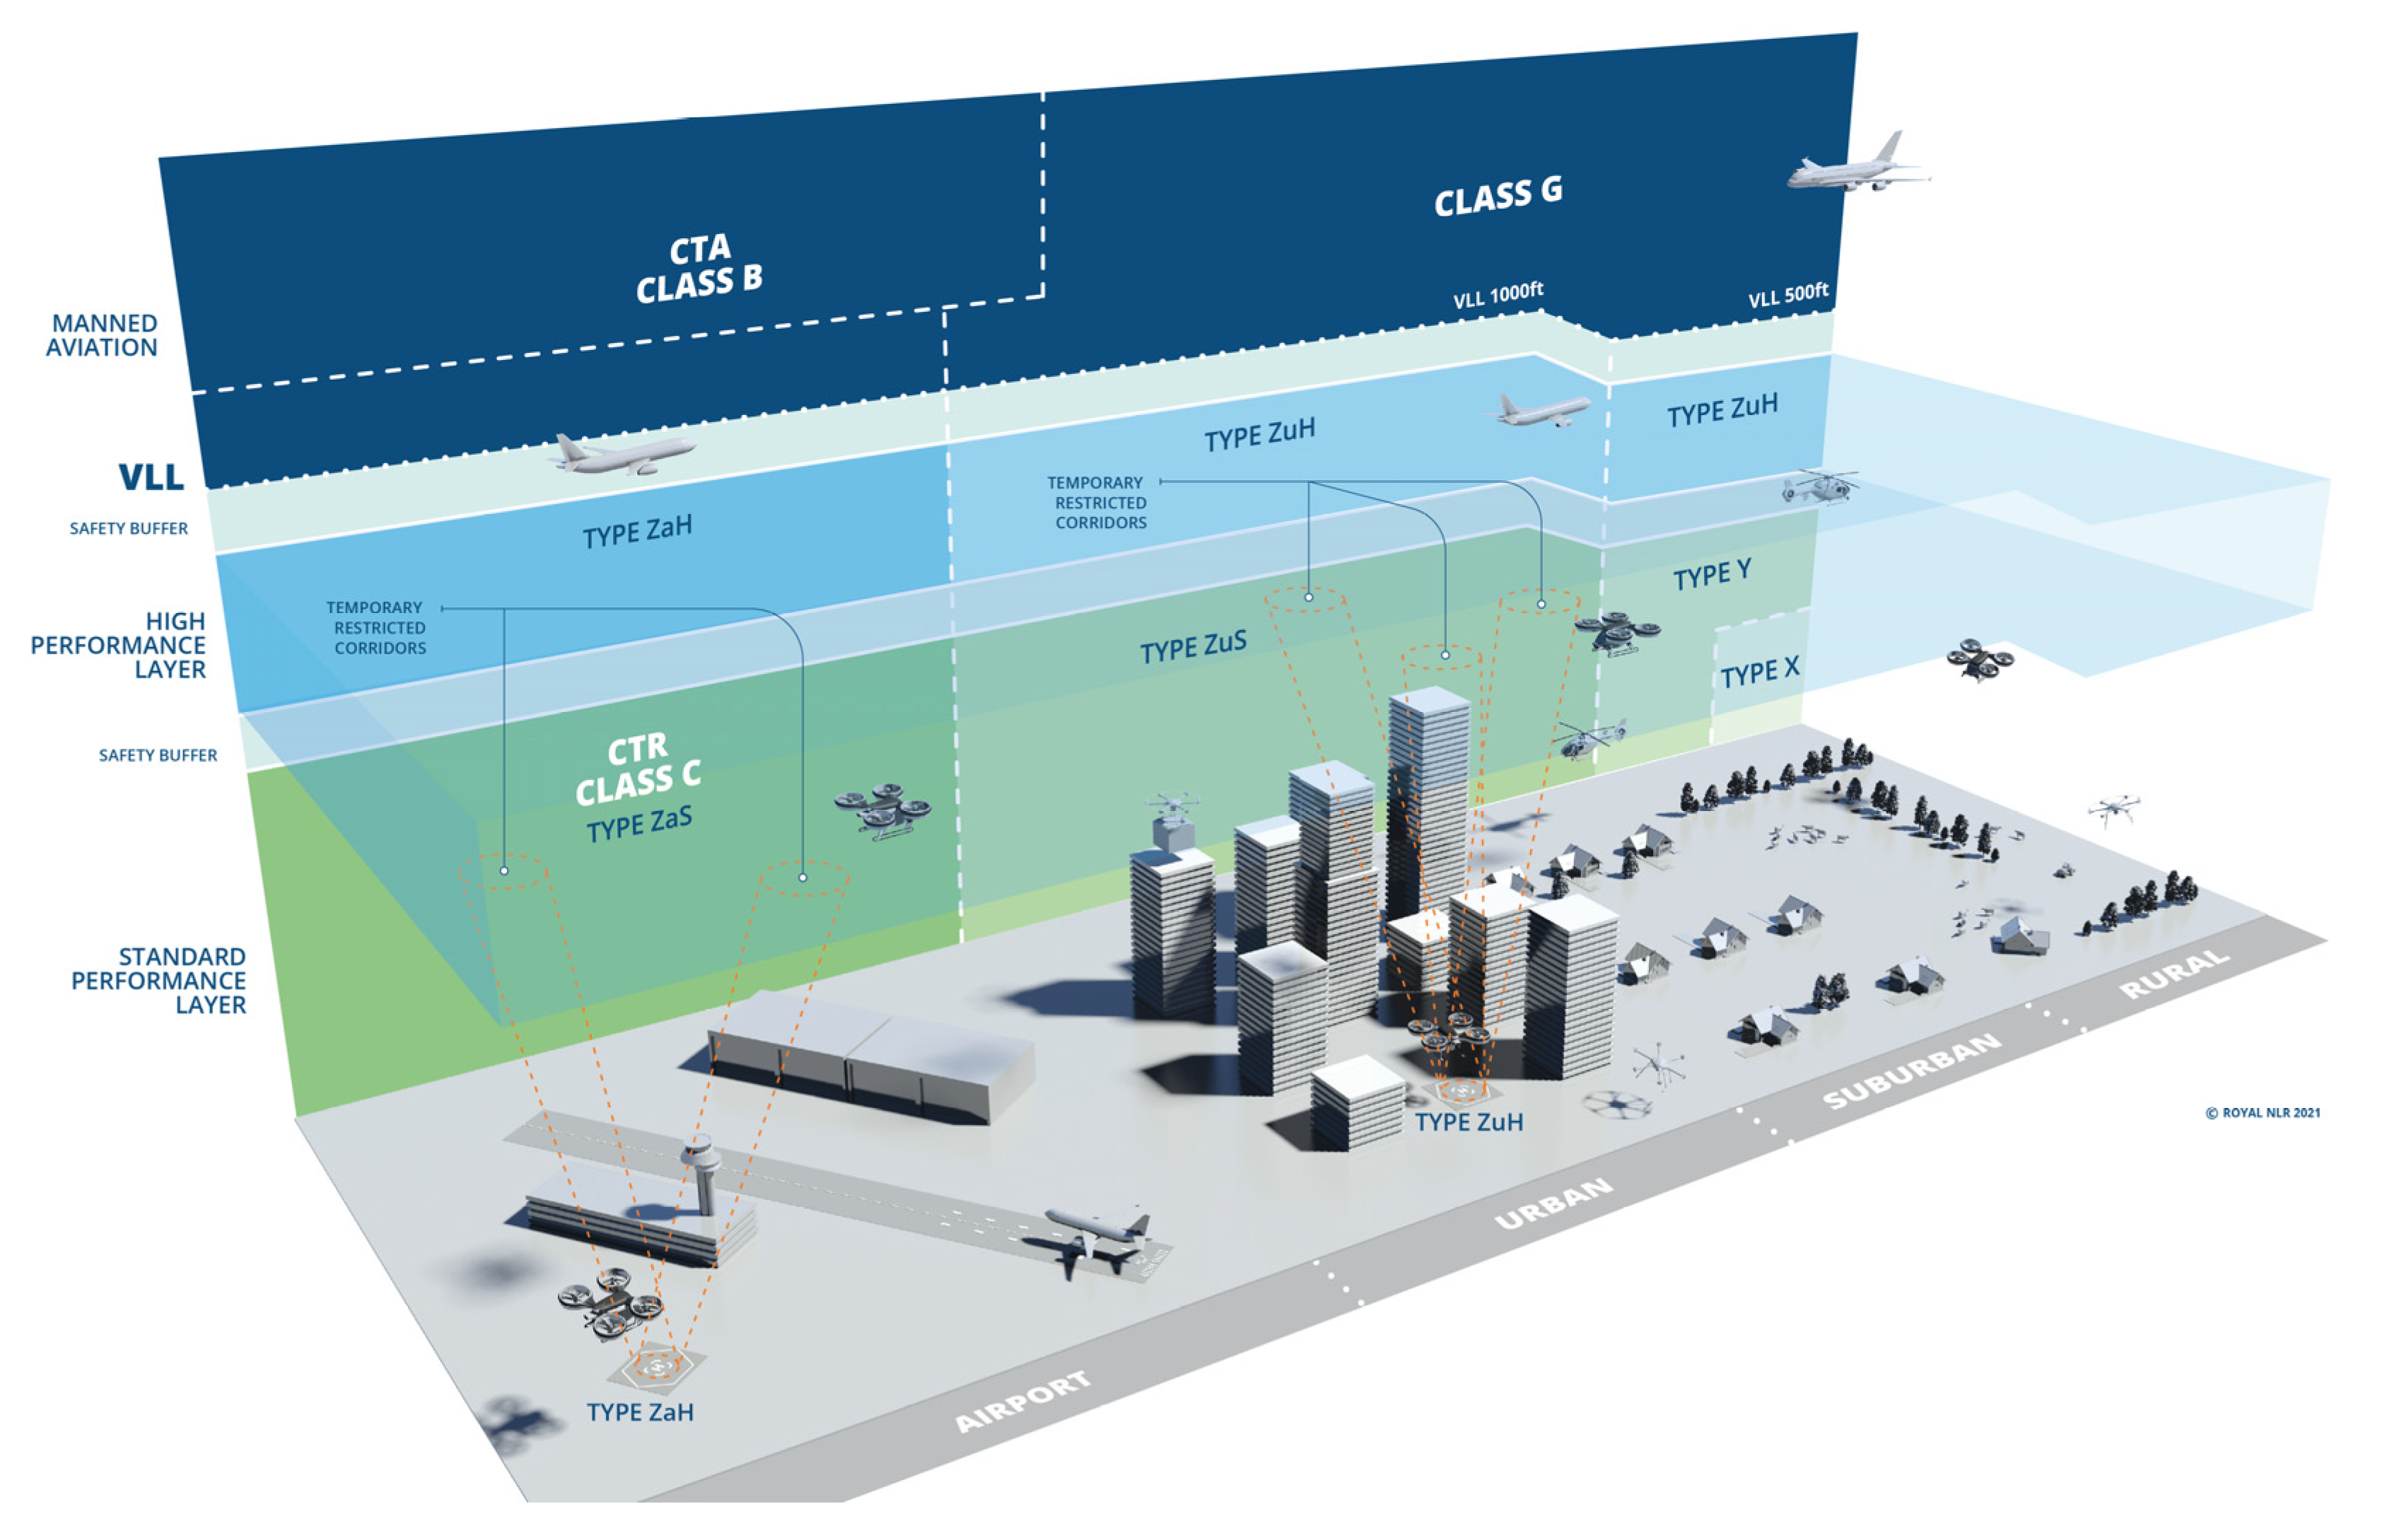
3. AMU-LED Airspace Structure

As explained, the integration of large eVTOL (e.g., air taxi, big cargo; from now on, High Performance Vehicles or HPVs) operations within an urban environment brings a number of challenges that need to be addressed. Above all, the main challenge is to assure the safety of these operations, considering that to remain well clear with manned VFR aviation and other small UAS (from now on, Standard Performance Vehicles or SPVs), HPVs cannot generally rely on pilot visibility if the pilot is not on-board. Additionally, when transporting passengers, the operational air risk, i.e., the risk of damages to people on board due to a collision, is much higher than for other UAS. Therefore, the safe and efficient integration of UAM operations needs to tackle several separation and conflict avoidance problems, which can be summarized as follows:
  • Separation between HPVs and manned aircraft:
    General Aviation (VFR) commonly lacks transponder/conspicuity means, which make non-visual separation very difficult.
    Having different altitude references for unmanned (GNSS) and manned aviation (barometric) is also an important concern.
    High cruise speeds, which make timely reactions to non-nominal or contingent operations difficult.
  • Separation between HPVs and SPVs:
    The limited range of existing drone remote eIdentification (eID) solutions (bluetooth/wifi) means that they are not applicable for separation assurance and DAA (Detect and Avoid) within UAM.
    ADS-B (Automatic Dependent Surveillance—Broadcast) cannot be generalised to every drone to avoid 1090 MHz saturation, and other surveillance systems are not yet widely used.
    SPVs and HPVs have different features and performances (speed, etc.).
    SPVs cannot be mandated to carry on board equipment with the same level of performance than those for HPVS, as the high cost and even size/weight could jeopardize the accessibility of these vehicles to the airspace.
  • U-space traffic management issues:
    U-space Service Providers (USSPs) have to provide an appropriate performance level at all times, but different performance requirements may coexist, depending on the aircraft needs and type of airspace.
    Having several USSPs collaborating, together with other actors like Air Traffic Control, increases complexity and requires important interfacing and procedures standardization efforts to provide their services.
    Tactical separation/deconfliction complexity, considering the manoeuvrability of rotorcraft and VTOL, the different types and sizes of SPVs/HPVs, and the lack of flight procedures/routes.
To cope with these problems, the project AMU-LED in its Concept of Operations for UAM [24] proposes a layered airspace structure that would enable the safe operation of different vehicles in a U-space environment, also facilitating the required flexibility and efficiency to avoid delays, which would limit the demand for HPV services. In this structure, all UAM operations would be developed in the VLL to guarantee safe separation from manned aircraft, but would be distributed in layers depending on the type of vehicle: upper layer or High-Performance Layer for HPVs, and lower layer or Standard Performance Layer for SPVs.
  • The high-performance layer—HPV layer—would be a CORUS type Z airspace [20] devoted mainly to HPV cruise operations and forbidden for common drones (SPVs), assuring sufficient separation between them. If the type Z airspace is located in controlled airspace, it is categorised as Za, with Zu being located in uncontrolled urban airspace. As this layer is still within the VLL, this also ensures separation with manned aviation. Moreover, manned aviation could enter this layer, provided that such manned vehicles adhere to the rules and procedures, carry on board the required technologies and make use of the required U-space services, in accordance with EU U-space Regulations [25,26]. Moreover, in controlled airspace, ATC could demand a dynamic airspace reconfiguration of the U-space volume to allow a temporary invasion of a manned aircraft (e.g., a police helicopter), but this reconfiguration would imply that every UAS (even HPV) would have to leave that portion of the airspace during the time required for the operation of the manned aircraft.
  • The standard-performance layer—SPV layer—would be assigned for the rest of UAS, including CORUS type Z, Y and X volumes, depending on the area needs (density of operations and complexity).
The AMU-LED solution would solve the separation problems among different types of airspace users identified previously during the cruise phase. Understandably, HPVs’ take-off and landing will be performed from Vertiports located in the SPL. To guarantee an appropriate segregation of HPVs from SPVs during these phases, the HPVs will be connected to those vertiports by means of promulgated restricted airspace volumes, so that when HPV operations are being carried out within the volumes, they cannot be breached by any other aerial vehicle.
  • These volumes will be published in the Drone Aeronautical Information as Restricted Access Volumes, so airspace users will be aware that entering these volumes will not be possible in certain moments; additionally, the publication will provide situational awareness of potential danger when flying in the vicinity.
  • However, as they will be promulgated as restricted access volumes, other SPV flight plans could be allowed to cross them when no HPV operations are expected, i.e., when they are not active. However, when a HPV operation is expected or is close to happening, the restricted volume will be activated (volume booked in the HPV flight authorisation) and any SPV flight plan crossing the volume will be rejected.
  • The USSP/Vertiport Operator will be responsible for the activation of the corresponding restricted airspace volume, as well as for its deactivation once the HPV’s operation is completed. Thus, restricted landing and take-off volumes allow for a maximization of the use of the airspace by other users when HPVs are not making use of them.
  • In the case of requested landings to unprepared locations (e.g., emergency landing) where no vertiport is available, a temporary segregation could be defined by means of a geo-fenced volume for the landing/take-off of these HPV vehicles, which would be distributed by the Geo-Awareness service [25].
The proposed Layered Structure is depicted in Figure 1, where safety buffers between these layers have been also considered. The CORUS airspace types (Za, Zu, Y or X) are also represented, differentiating the type Z airspaces in the HPL (ZaH or ZuH) from those in the SPL (ZaS or ZuS).
The buffer to segregate manned aircraft from HPVs must be wide enough to cope with the different vertical references of manned and unmanned aviation (barometric and GNSS, respectively). A vertical margin of 100 ft must therefore be considered to assure that drones and eVTOL are deemed to be separated from manned aircraft [27], which is the one currently approved for VLL drone operations in most States (i.e., drones are nowadays allowed to fly below 400 ft AGL or 900 ft AGL in urban environments) [11,28].
Regarding the separation between HPL and SPL, UAS will operate in a U-space environment [25], independently of the layer, so they are assumed to be Strategically Deconflicted (i.e., each UAS has submitted a flight plan or flight authorisation before the flight, which has to be free of intersection in space and time with any other notified UAS flight authorisations to be approved). However, the real trajectories of the UAS flights may differ from the nominal operation requested in the flight plan, and although all UAS in a U-space volume will have to report their position (network identification), considering the different performances and capabilities of HPVs and SPVs, it is not realistic to apply common means to solve tactical conflicts, so a buffer between the HPL and the SPL can also be necessary to guarantee an adequate separation both types of UAS.
The following sections present an evaluation of the minimum buffer required between the HPL and the SPL, applying a collision risk model to determine it.

4. Materials and Methods

Collision Risk Models can be applied to calculate the probability of mid-air collisions between drones and the derived fatality risk within a given volume of operation. This is the approach taken to determine the acceptability of the operations in the HPL and SPL layers proposed by AMU-LED and to identify the minimum vertical buffer required between both layers, i.e., between HPVs and SPVs. The collision risk in this layered structure will be compared, applying different buffers, to a Target Level of Safety (TLS) to determine the minimum required buffer between both layers.
The collision risk model applied has been developed as part of the SESAR DACUS Project [29]. As a starting point to identify potential collisions, the model applies the equations concerning relative velocities and distances between aircraft (as explained further on) from Annex 1 of the “Manual on airspace planning methodology for the determination of separation minima” [30] developed by ICAO.
The model applies a Monte Carlo simulation approach to estimate the mean collision risk per flight hour, generating scenarios with randomised UAS positions and speed vectors, based on nominal drone operation plans. These randomised trajectories are then projected forward in time, considering the following variables of each flight:
  • x i ( t ) 
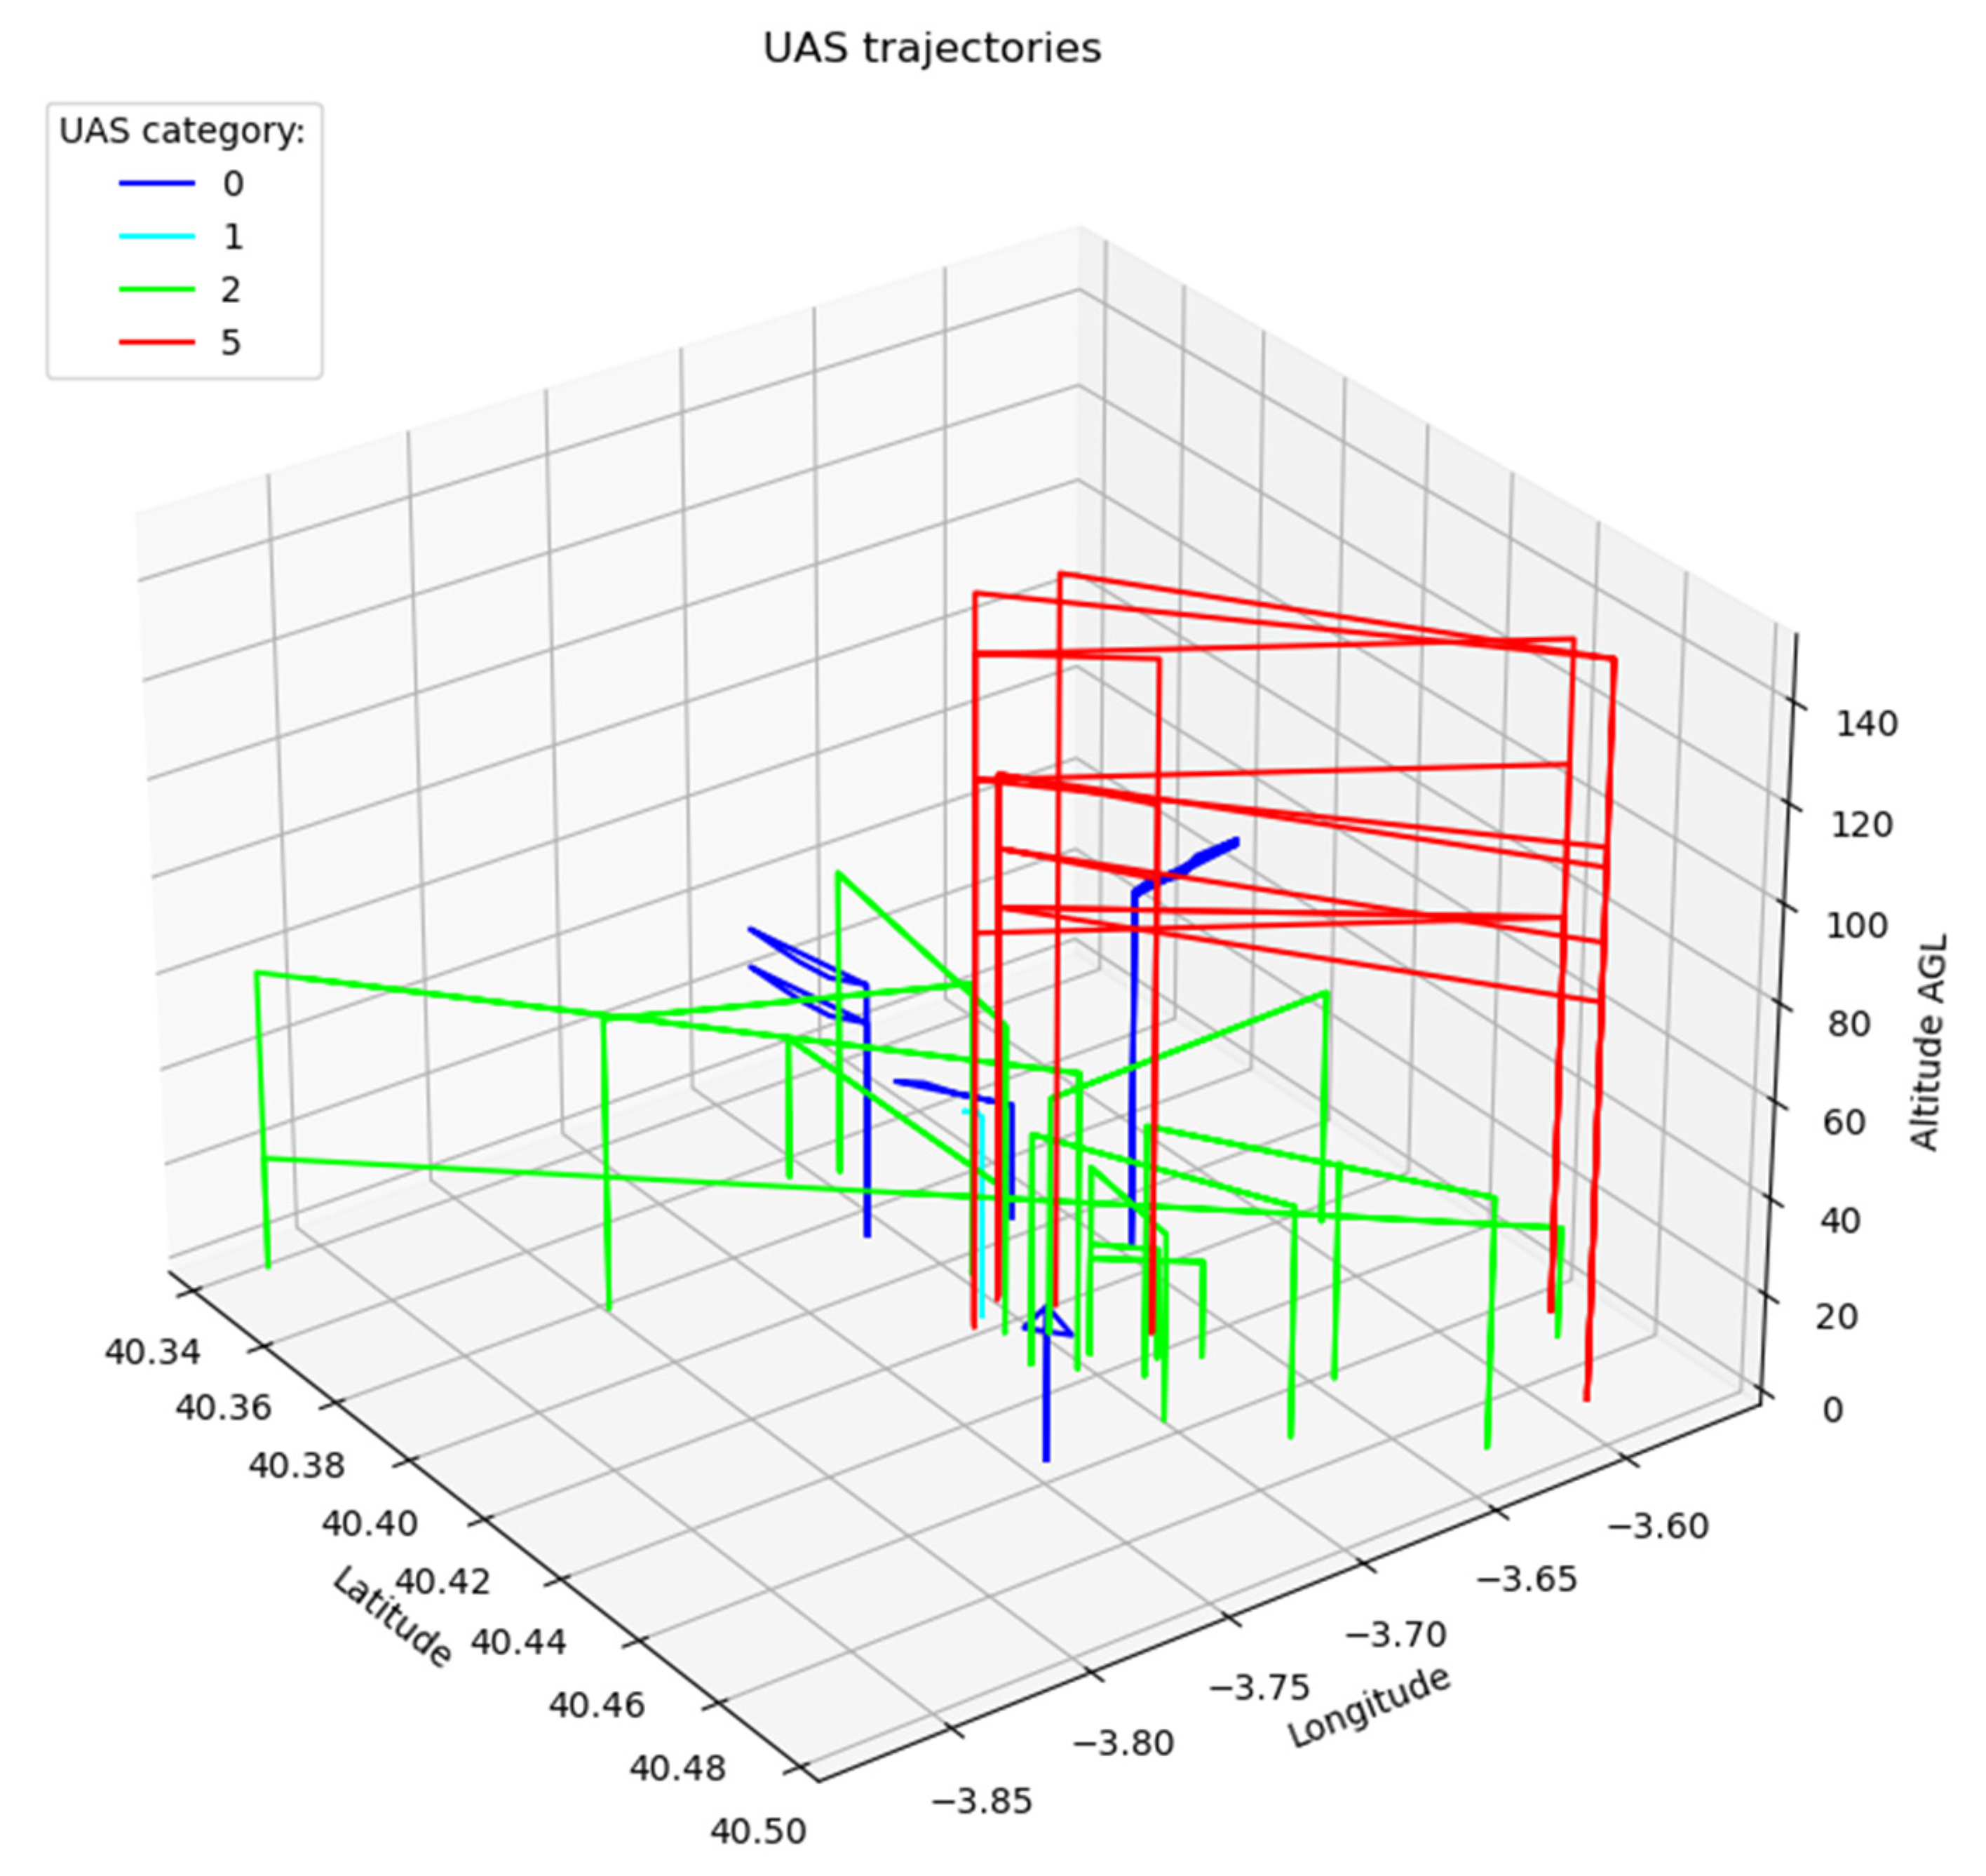
: Random position of UAS “i” in the east–west direction
  • y i t : Random position of UAS “i” in the north–south direction
  • z i ( t ) : Random altitude of UAS “i
  • v i t : Velocity of UAS “i
  • θ i t : Heading in the horizontal plane (x,y) of UAS “i
  • ϕ i t : Pitch in the vertical plane (y,z) of UAS “i”.
These values are then used to calculate the distance D between any UAS pair, as follows:
D i j t = D i j t 0 + V r e l _ i j 2 t 2 + 2 B t
This equation specifies the distance in an instant t between UAS i and j, where:
V r e l _ i j = v i 2 + v j 2 2 v i v j c o s ϕ i c o s ϕ j cos Δ θ + s i n ϕ i s i n ϕ j
and,
B = Δ x t 0 v i c o s ϕ i c o s θ i v j c o s ϕ j c o s θ j + Δ y t 0 v i c o s ϕ i s i n θ i v j c o s ϕ j s i n θ j + Δ z ( t 0 ) ( v i s i n ϕ i v j s i n ϕ j )
A collision is considered to occur when:
D i j ( t m i n ) < M A R G I N C O L L I S I O N
where ( t m i n : m i n i m u m   t i m e ) is the instant when distance D between UAS “i” and UAS “j” is minimum, and the margin of collision is the distance from which a pair of UAS are so close that they would collide, i.e., the distance would be lower than the sum of the characteristic dimensions of both UAS.
In the scope of this document, the aforementioned equations will be used to calculate the collision risk of HPVs (large eVTOL) with SPVs (small UAS), disregarding the collisions of HPVs with HPVs and SPVs with SPVs, as the objective of this paper is to evaluate the feasibility of a layered structure, to segregate both types of drones, and to determine the minimum required buffer between both layers. The paper assumes that the collision risk of vehicles of the same category within their respective layers will be mitigated by the U-space services providing strategic deconfliction, based on the flight plans, and tactical deconfliction during flight for HPVs, based on the detection of situations where the minimum safe separation between a pair of aircraft has been lost; the minimum separation needed is a complex matter which depends on the type of UAS, speed and relative direction of the aircraft, and it is beyond the scope of this paper.
As explained, Monte Carlo simulations will be used to estimate the collision risk between HPVs and SPVs, randomising time of operation and position errors with regard to a nominal scenario composed by a set of pre-defined drone operation plans (DOPs). The nominal scenario considered is the reference scenario modelled in DACUS D4.2 Experiment 4 [31], which represents the expected drone traffic in Madrid city in a typical day by the year 2035. This scenario foresees a wide range of small drones ranging from very small surveillance drones (less than 1 m in length and under 2 kg weight) to delivery drones of varying sizes with MTOW up to 18 kg, as well as large passenger-carrying air taxis (up to 13 m in length and 5600 kg MTOW). The numbers of SPV and HPV operations during the day in this reference scenario are shown in Figure 2.
Each DOP in this reference scenario is the initial planned mission 4D trajectory, which is created prior to flight execution, i.e., a deterministic trajectory. However, the real execution will present uncertainties both in time (delay or advance with regard to the nominal case) and in position/heading (navigation system error, i.e., difference between the position calculated and the real position of the UAS); therefore, different uncertainties in terms of time, position and headings must be introduced to assess the real collision risk associated with the foreseen operations of each HPV and SPV. To that end, given the scheduled trajectories in a period of time t i n i t i a l , t f i n a l , N different iterations introducing errors are generated for each t i   (n time samples in the analysed period) for every DOP, and the collisions which would take place among DOPs of pairs of HPVs-SPVs in each of these iterations are calculated and then averaged to obtain the expected collision risk in the considered time period. The collision risk per flight hour for that period of time would be:
C o l l   R i s k H P V S P V = t i = t i n i t i a l t i = t f i n a l i t = 1 i t = N C o l l i s i o n s   ( H P V S P V ) N × n × t i = t i n i t i a l t i = t f i n a l H P V = 1 H P V = n F l i g h t T i m e ( H P V )
It can be noted that the considered flight time is only that of the HPVs, as we are looking for the air risk, i.e., the risk of fatality of people on board an HPV due to a collision with an SPV. The total flight time is the sum of the time in the air of each HPV flying during the analysed time period.
To introduce the uncertainty in time, i.e., delays or advances with regard to the nominal timing, it is supposed that x t i ,   y t i ,   z t i ,   v t i ,   θ t i ,   ϕ t i   (Position ( x , y , z ), velocity ( v ), yaw ( θ ) and pitch ( ϕ )) are actually x t i * ,   y t i * ,   z t i * ,   v t i * ,   θ t i * ,   ϕ t i * in each simulation, where the relation between t i   and t i *   is a random time chosen from a Gaussian distribution centred in t i and assuming that for 95% of the times, the deviation is lower than T seconds (being T the period among time samples, t f = t i + n × T ): t i * N ( t i , T 1.98 ) .
To introduce the uncertainty in position in each simulation, i.e., the Total System Error, it is supposed that x , y , z , v , θ , ϕ t i * are actually x * , y * , z * , v , θ * , ϕ * ( t i * ) , which are random values from the positioning and heading Gaussian error distributions. The ICAO PBN Manual [32] details the components of the Total System Error (TSE), which are basically two: Navigation System Error (NSE) and Flight Technical Error (FTE).
The Navigation System Error is due to the accuracy of the Navigation System used by the aircraft and represents the unknown deviation with regard to the desired trajectory. The NSE values considered in those described in Table 1, which are consistent with the navigation accuracy declared by GNSS Service Providers, as can be seen in the GPS, Galileo, WAAS and EGNOS performance reports [33,34,35,36], as well as with the specifications of the manufacturers of GNSS receivers for UAS [37,38,39,40,41,42,43]. They are also consistent with existing literature on typical UAS Navigation System Errors, which provide results of UAS real flight data errors [44,45,46].
Similarly, the Flight Technical Error relates to the air crew or autopilot’s ability to follow the defined path, including pilot/autopilot errors, wind effects, etc., and is the known part of the deviation with regard to the desired trajectory. The FTE values considered are those presented in Table 2, which are based on the results provided by different UAS experiments [44,45,46,47].
Accordingly, simulated positions are defined following a normal distribution centered in nominal variables and deviation σ F T E , and summing and independent normal distribution centered in cero and with deviation σ N S E , based on CNS performance data (i.e., accuracy), as follows [37,38,39,40,41,42,43]:
x i * ~ N x i , σ F T E x 2 + σ N S E x 2
y i * ~ N y i , σ F T E y 2 + σ N S E y 2
z i * ~ N z i , σ F T E z 2 + σ N S E z 2
θ i * ~ N ( θ i , σ θ 2 ) ,   where   σ θ = ± 0.01 °
ϕ i * ~ N ( ϕ i , σ ϕ 2 ) ,   where   σ ϕ = ± 0.01 °
The results of the Monte Carlo simulations, developing a high enough number of iterations, allow for an estimation of the collision risk of HPVs with SPVs with different segregation structures: without layers (HPVs and SPVs operating in the same volume), with layers but no buffer, and with layers and different buffers between layers (5 m, 10 m, and 20 m).
Finally, to determine if the collision risk would be acceptable, they are compared with a pre-defined TLS. The TLS considered in this analysis is of 1 × 10⁻⁷ fatal accidents/flight hour, as proposed by [48], to reduce the average fatal accident risk of the civil aviation operations by at least six times compared with the historical data, in accordance with the work developed by [49]. This is a TLS considerably lower than the actual accident rate for general aviation and helicopters.
However, the proposed TLS is expressed in terms of fatal accidents and not in terms of collisions. As HPVs will be much bigger than SPVs, not every collision will cause major damage and ultimately become a fatal accident. The likelihood of a collision of an HPV with an SPV becoming a fatal accident will depend on the relative speeds, the weight of the SPV and the location of the impact on the SPV. Unfortunately, to estimate this probability there are no statistics available nowadays, nor specific models; accordingly, in this paper we have taken the statistics on bird strikes with helicopters as a reference [50], which states that in the USA, there were 1019 collisions of birds with helicopters from 2000 to 2014, but only 8 of them resulted in a fatality and 42 caused injuries. With these figures, and assuming that most SPVs will be bigger than a common bird, but also that an HPV will be more stable than a helicopter, we have assumed that only 1 SPV–HPV collision out of 50 will cause a fatal accident. Translating the proposed TLS in terms of collisions per flight hour determines that the maximum acceptable rate of collisions must be 5E−6 collisions per flight hour.

5. Results

This section presents the results from the Monte Carlo simulations developed to quantify the risk of collisions among HPVs and SPVs. The analysis was performed for five different scenarios with HPVs and SPVs operating in the VLL, in the cruise phase:
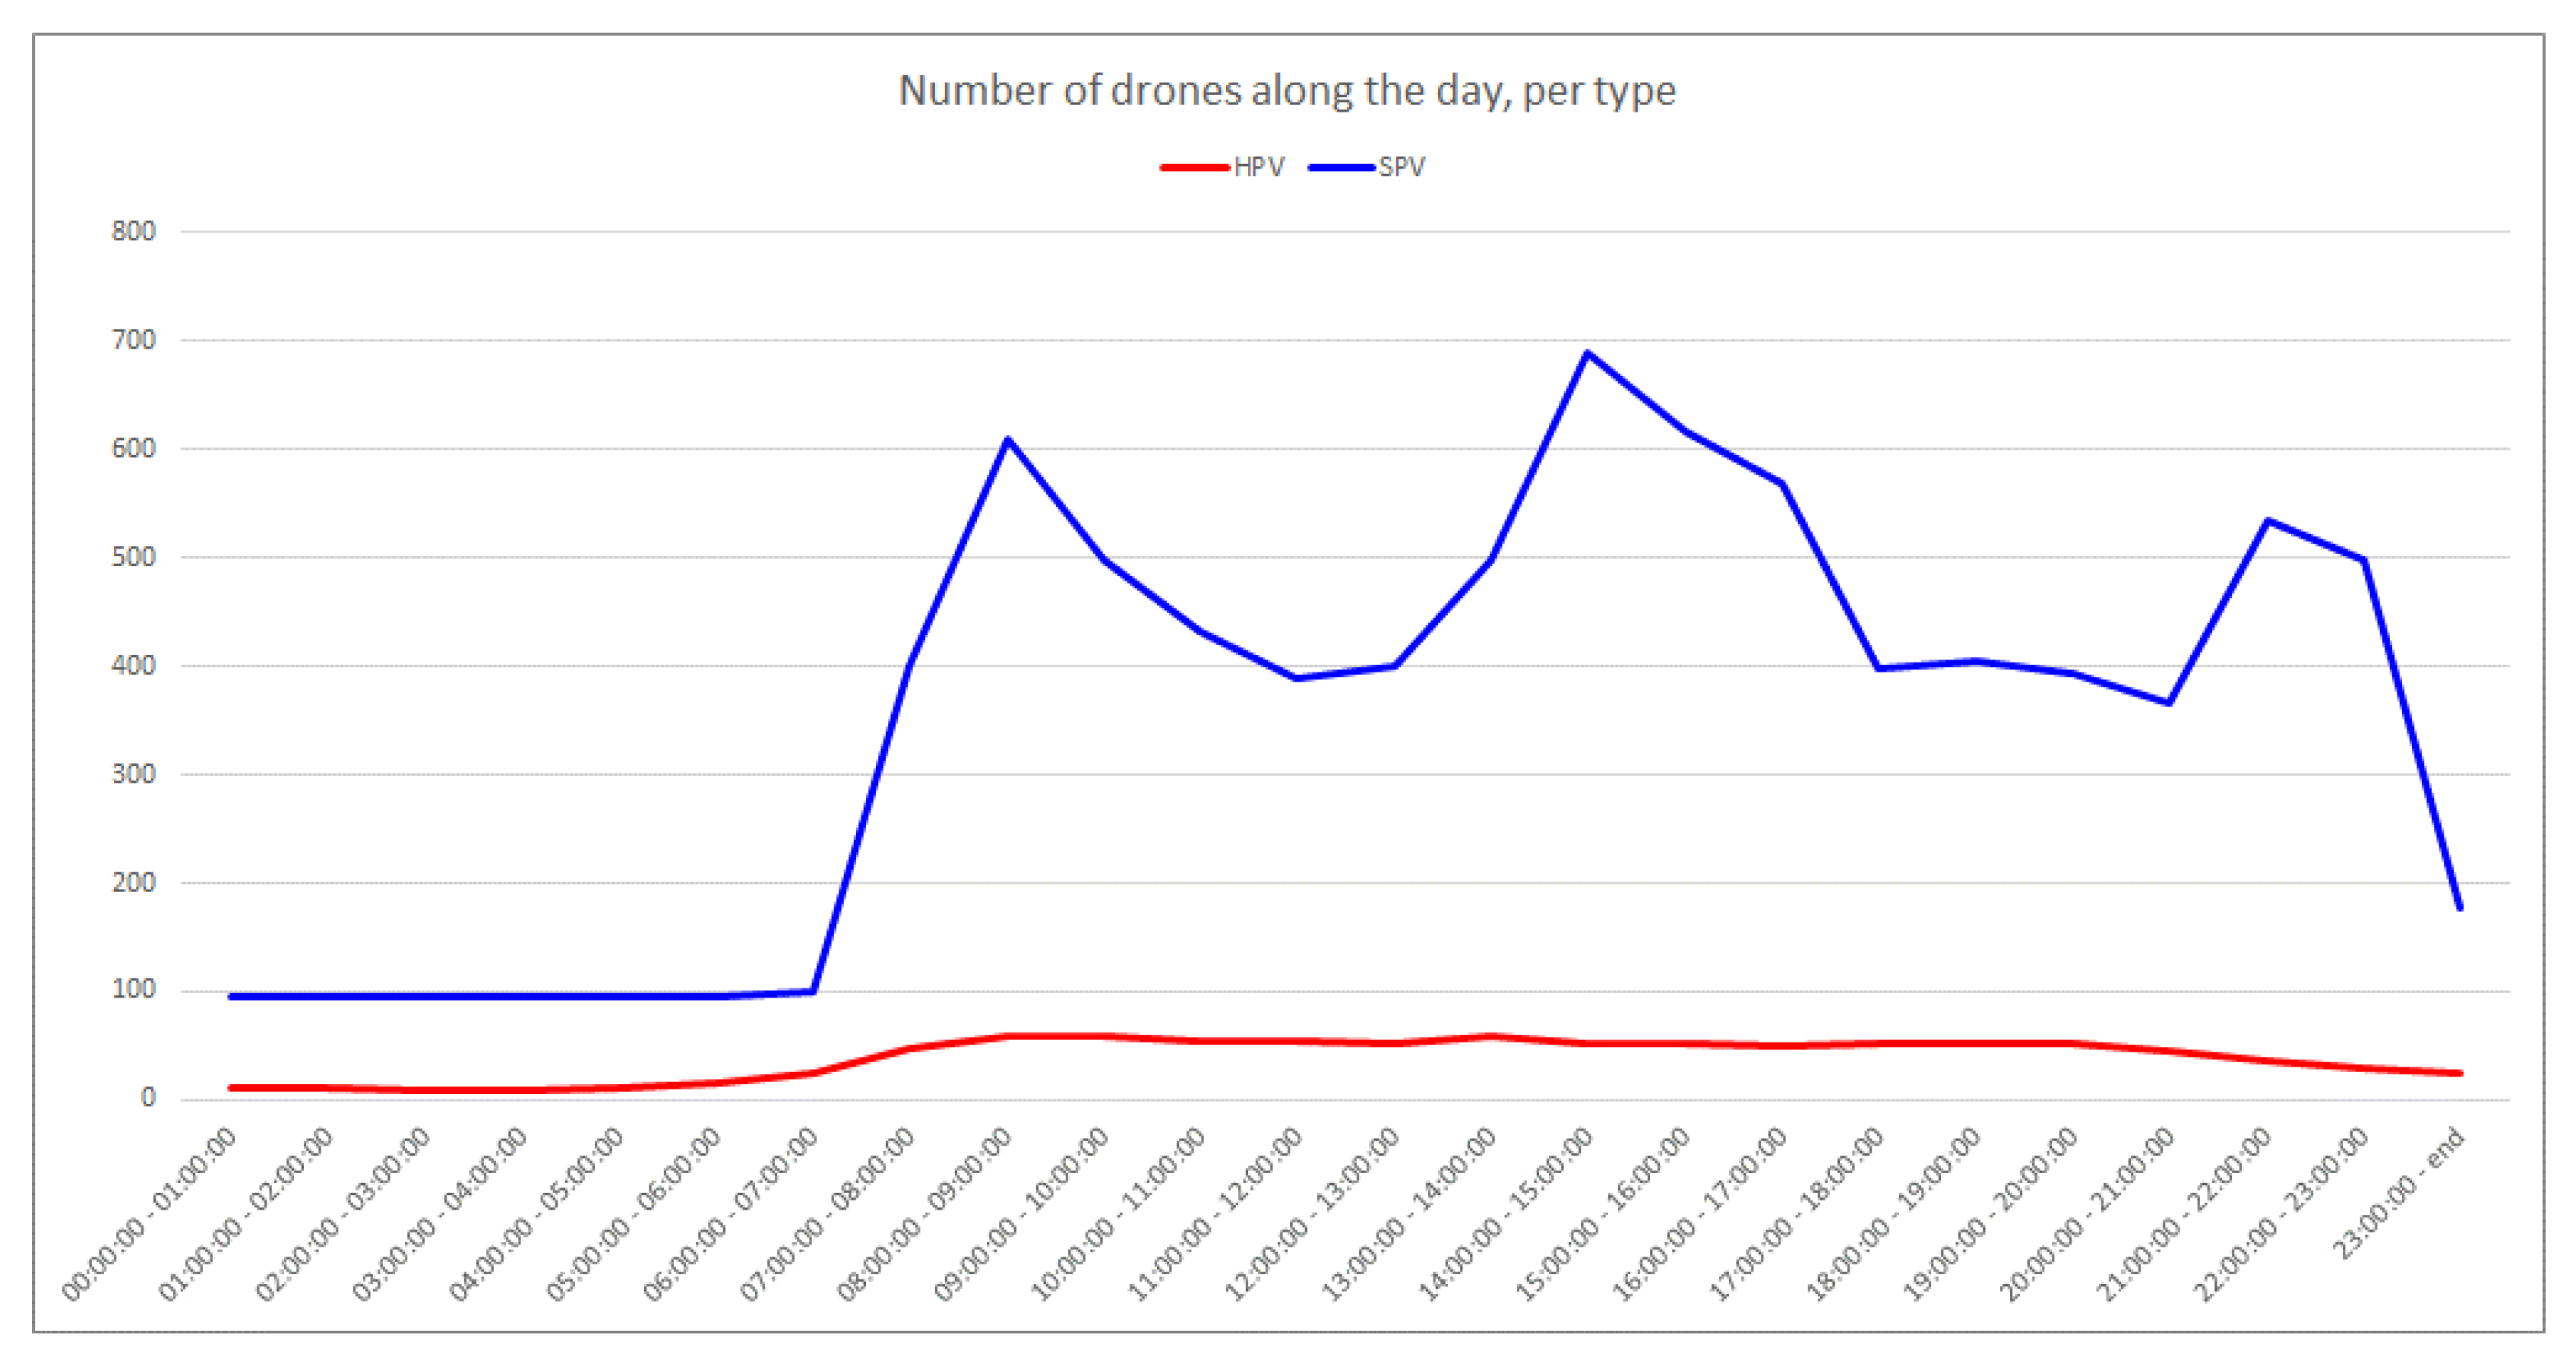
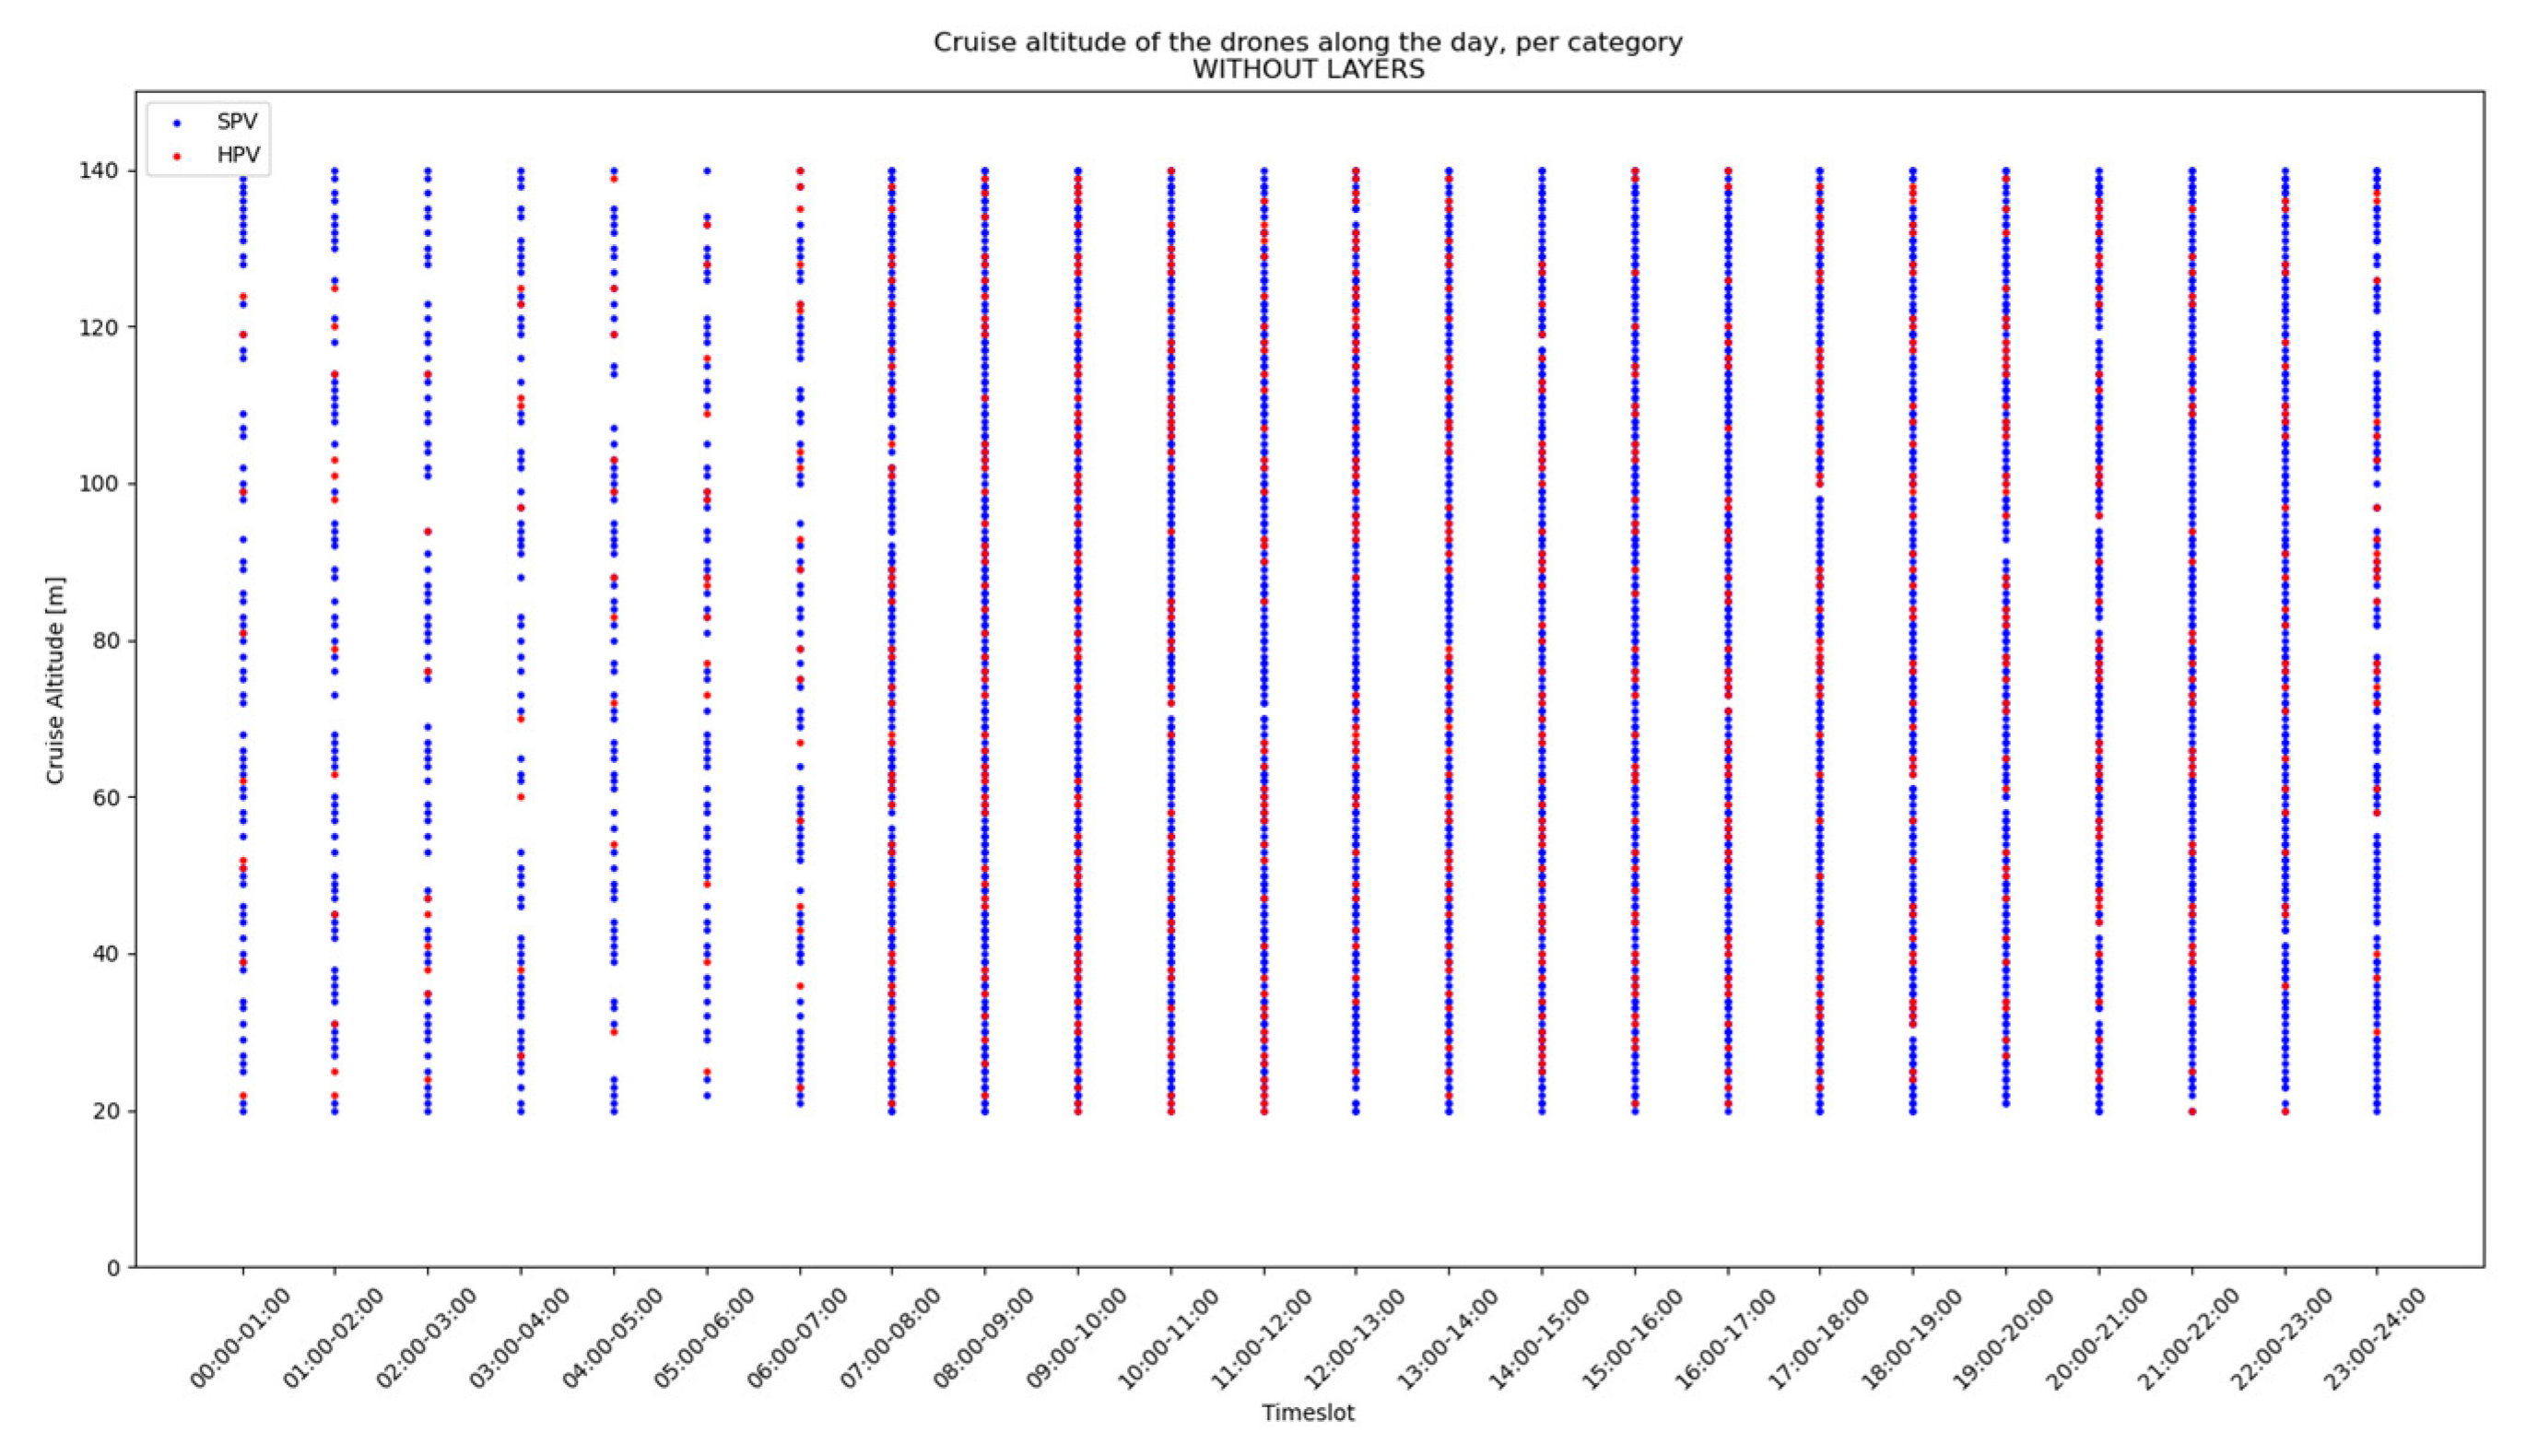
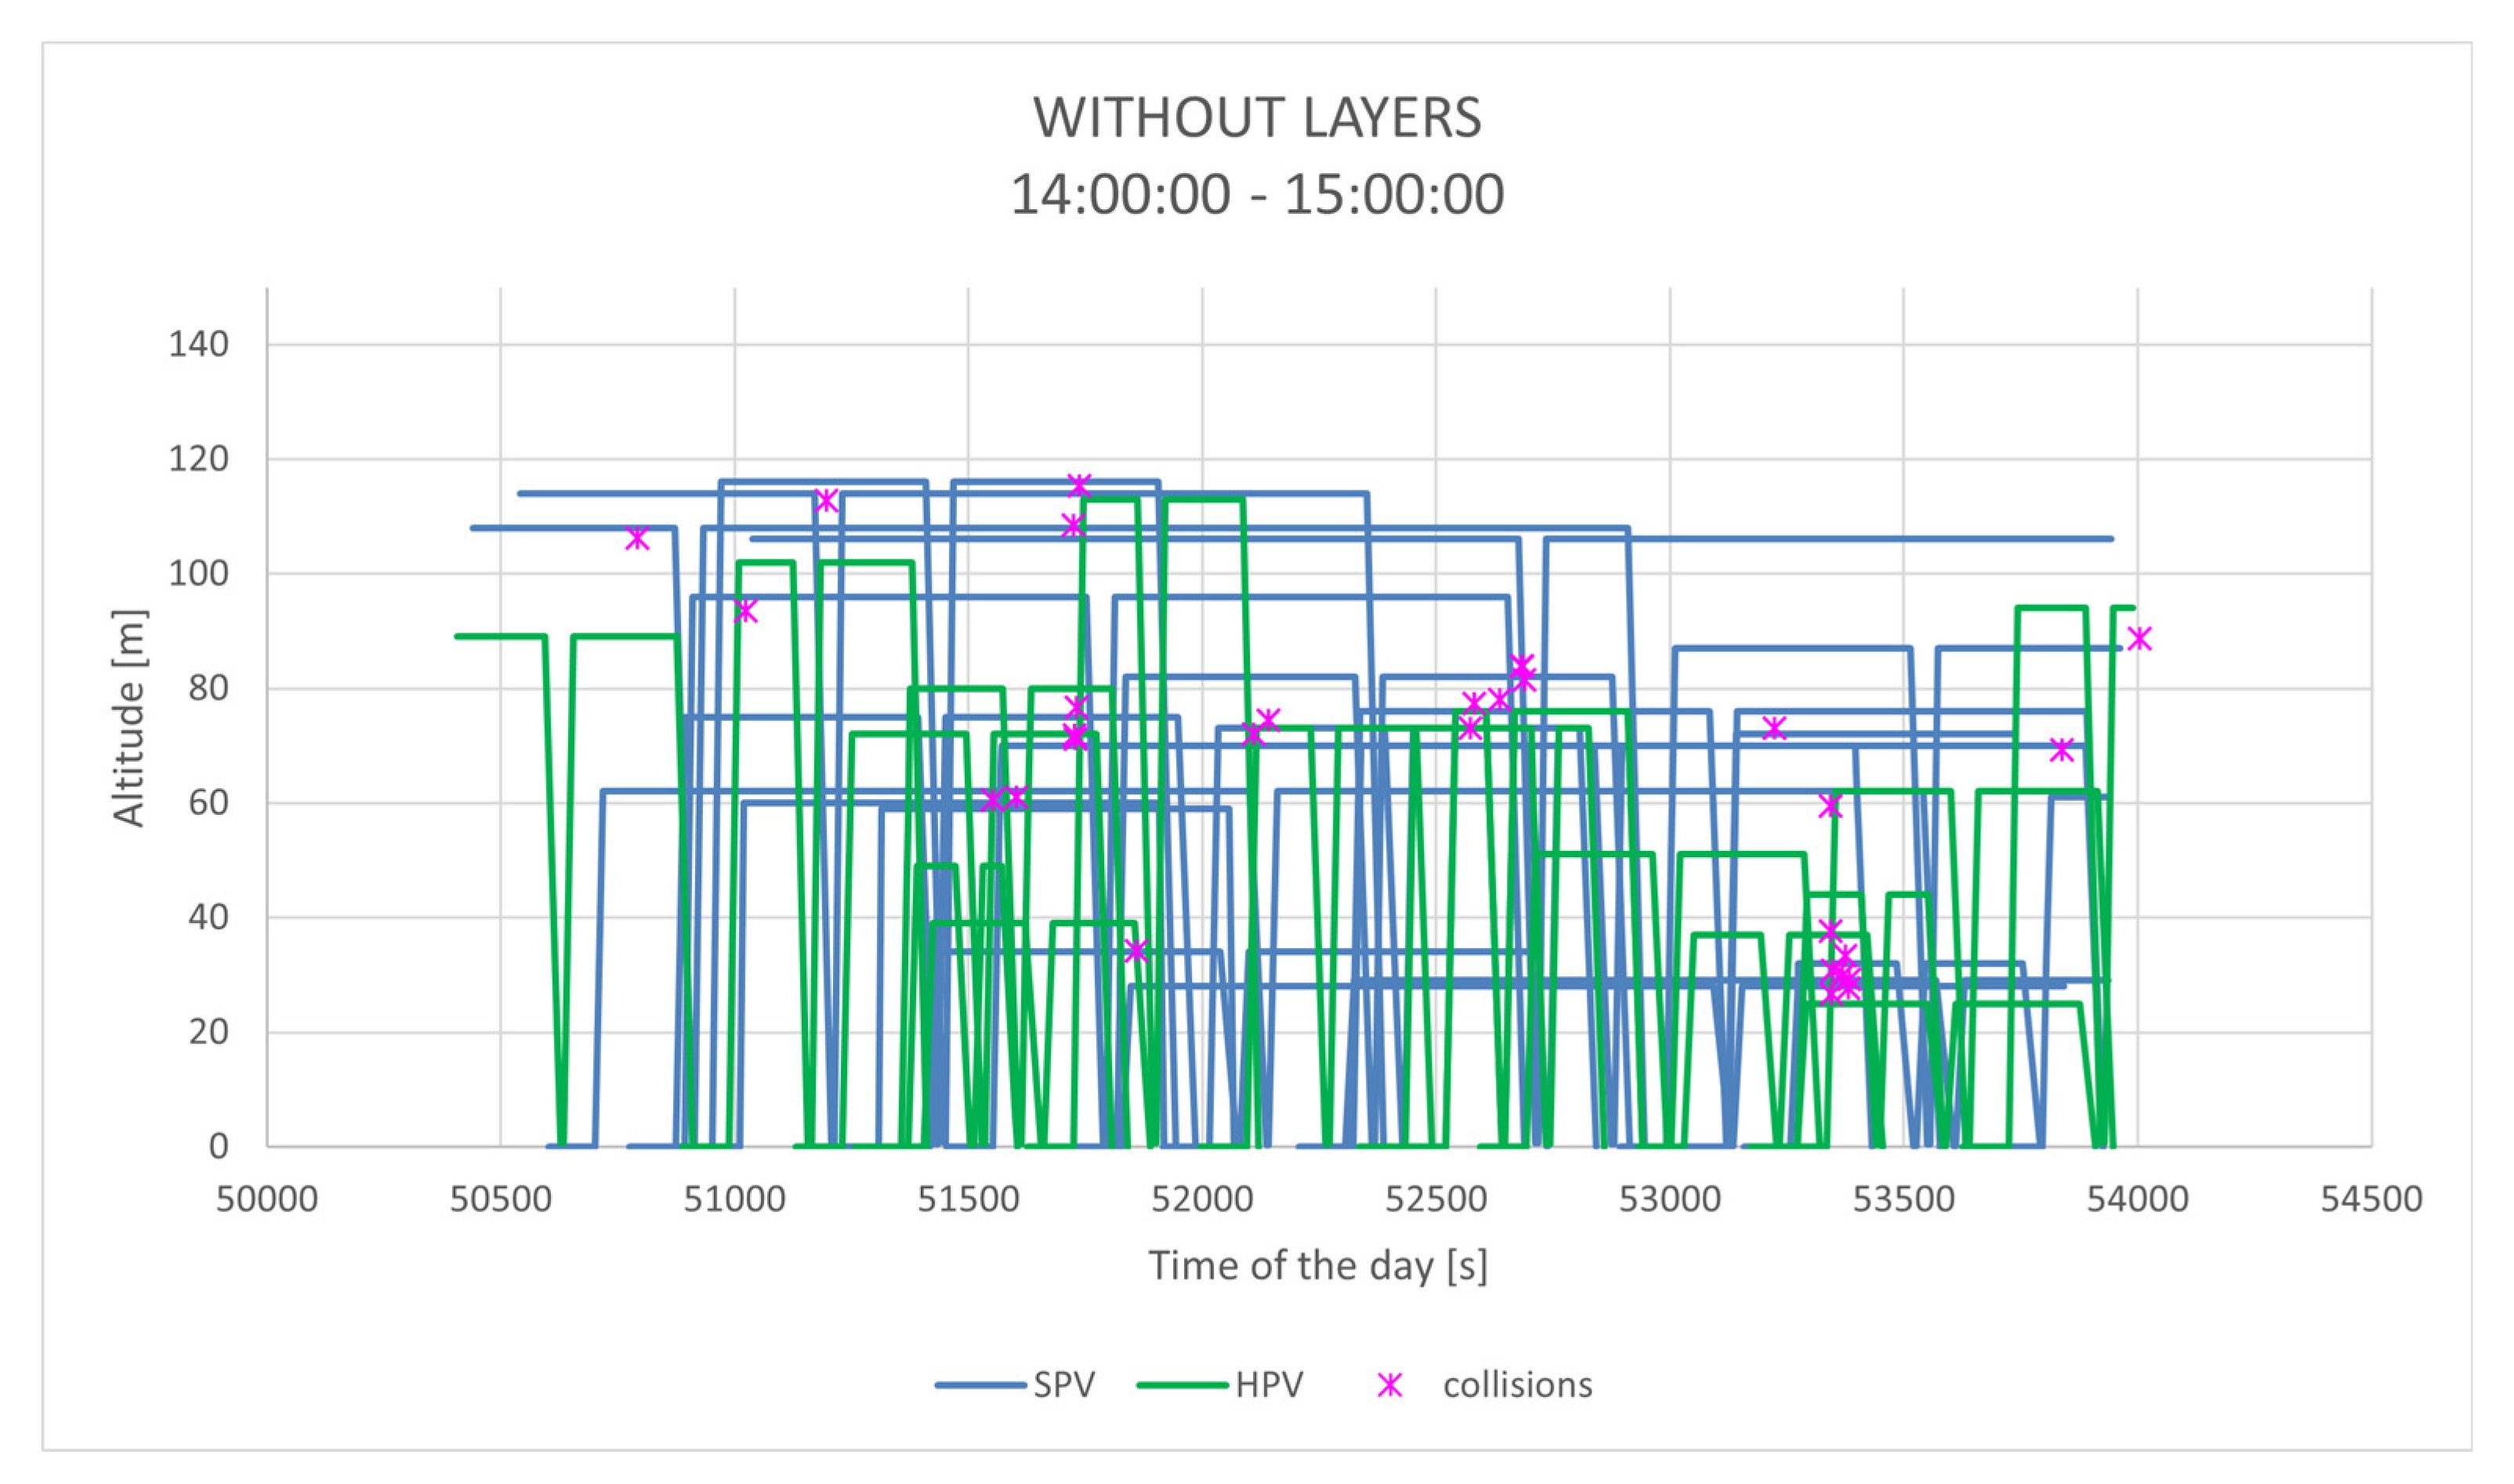
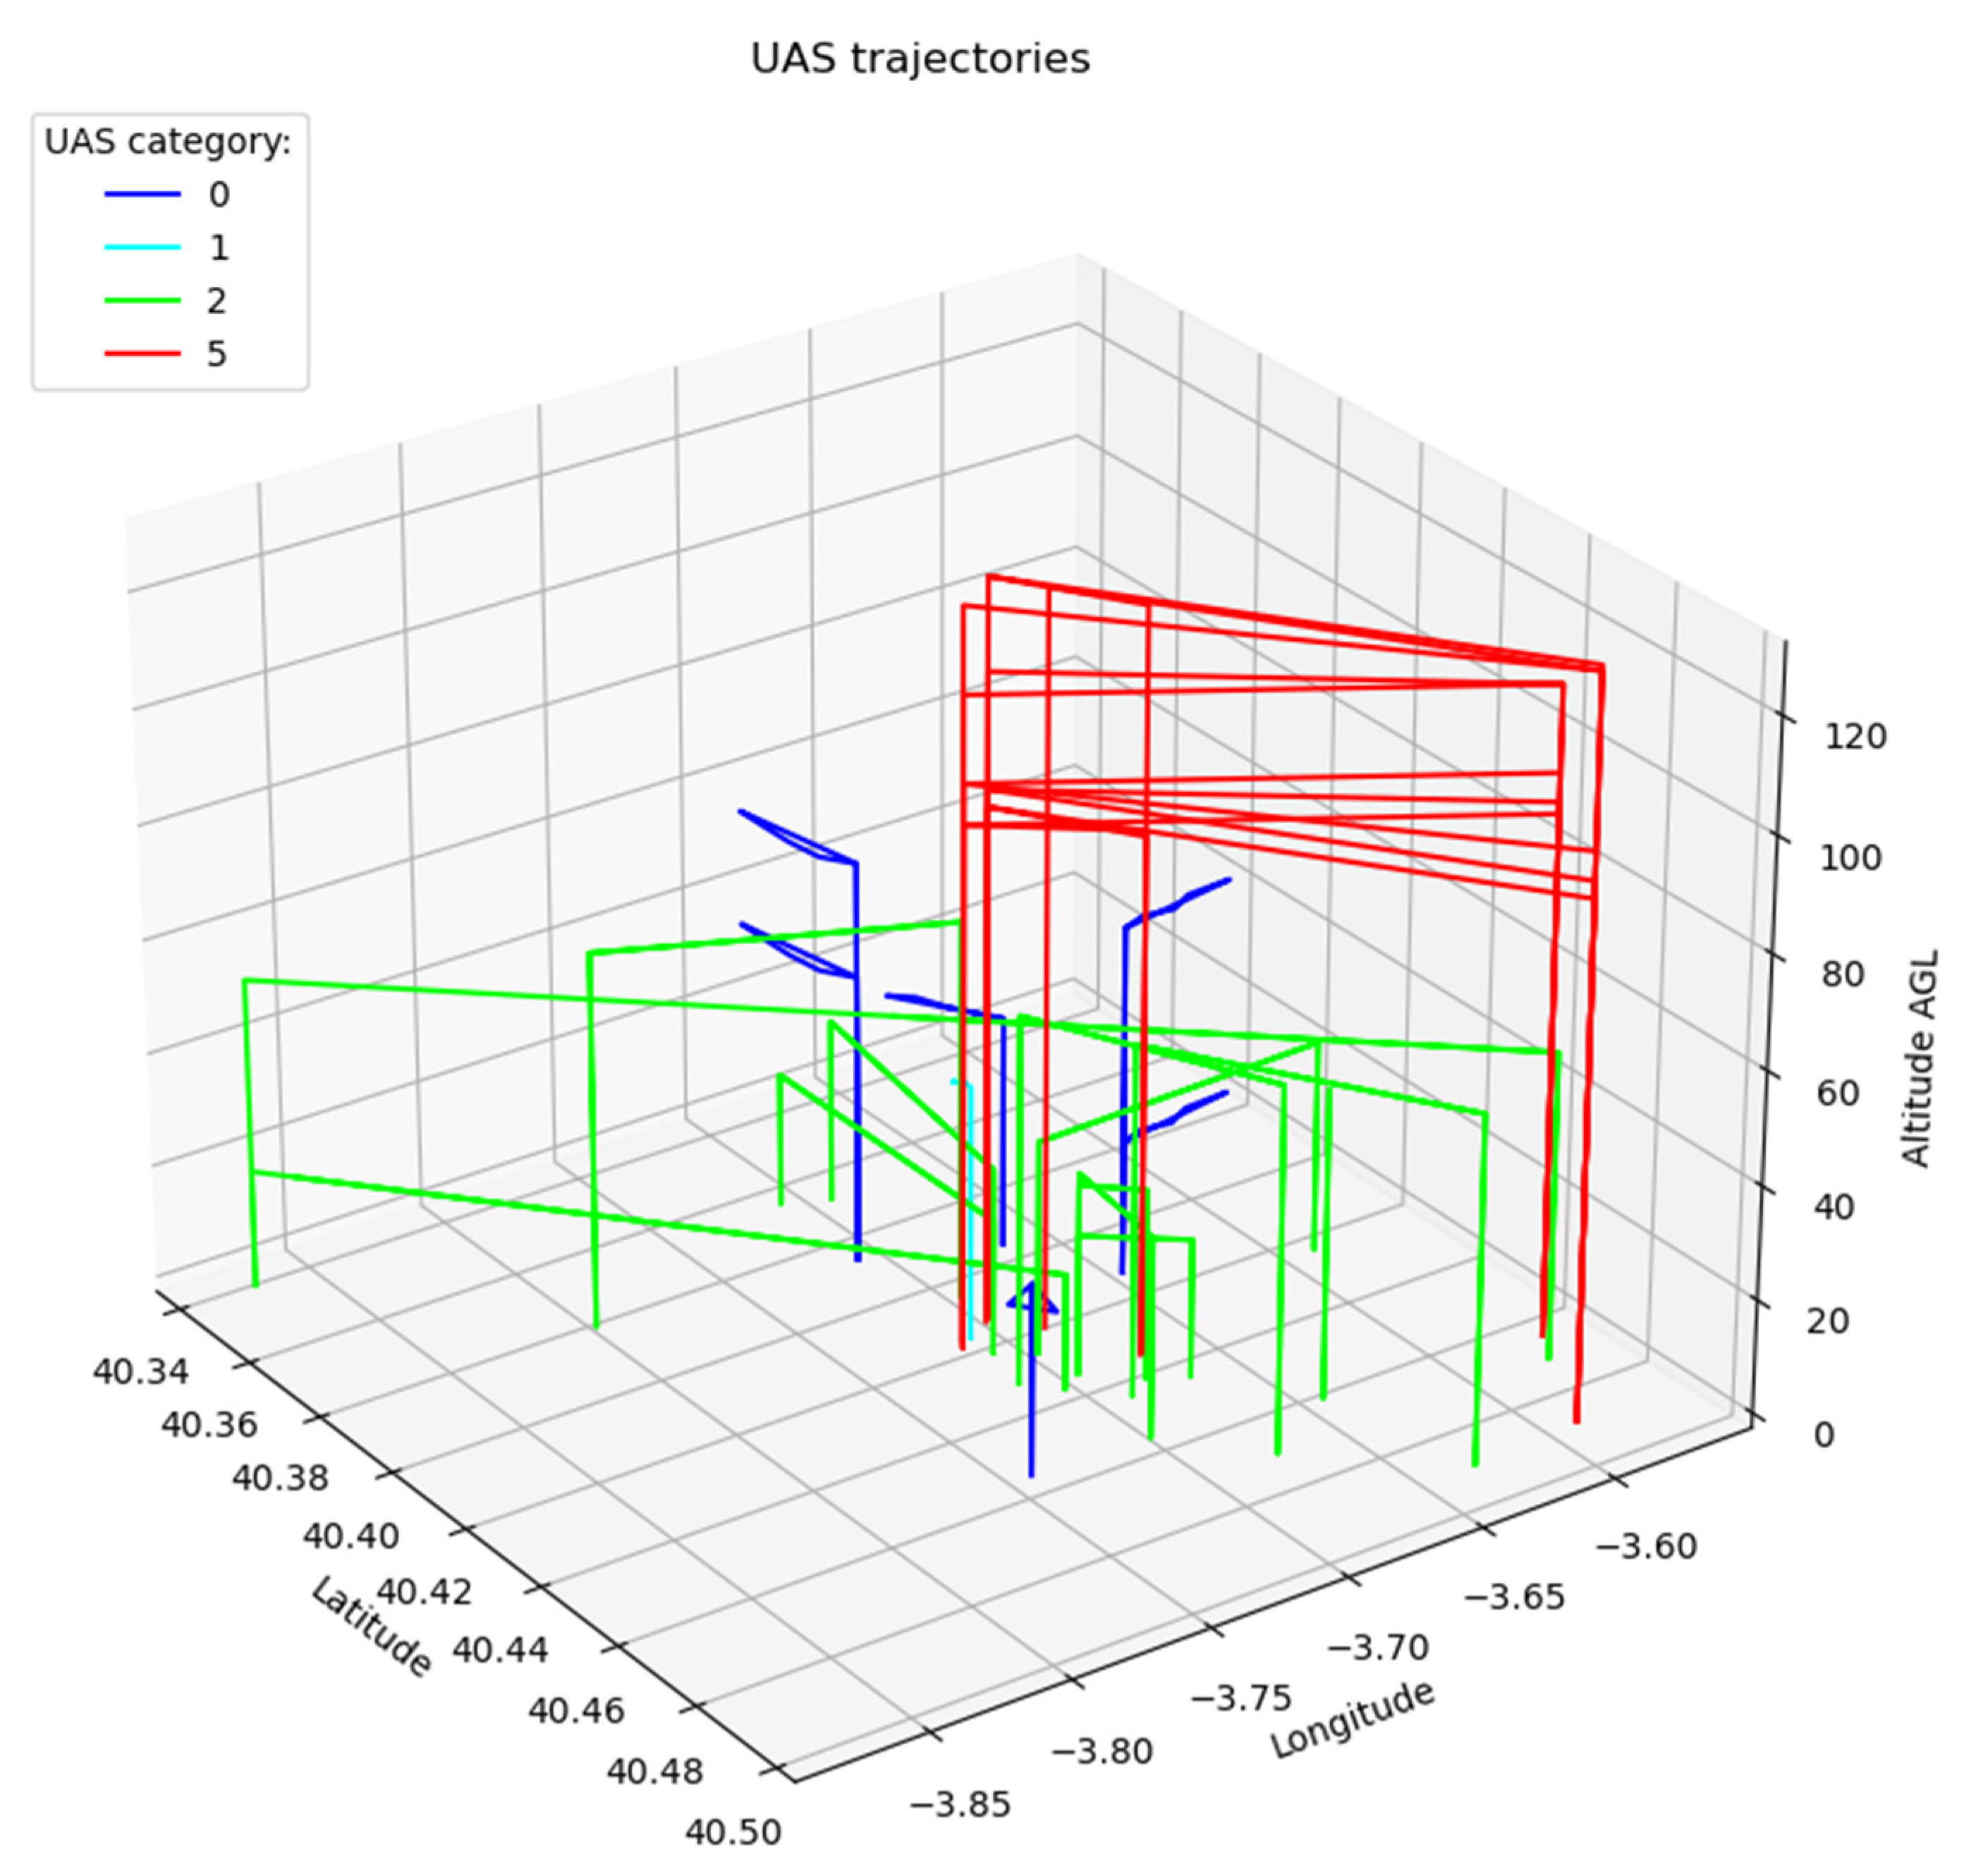
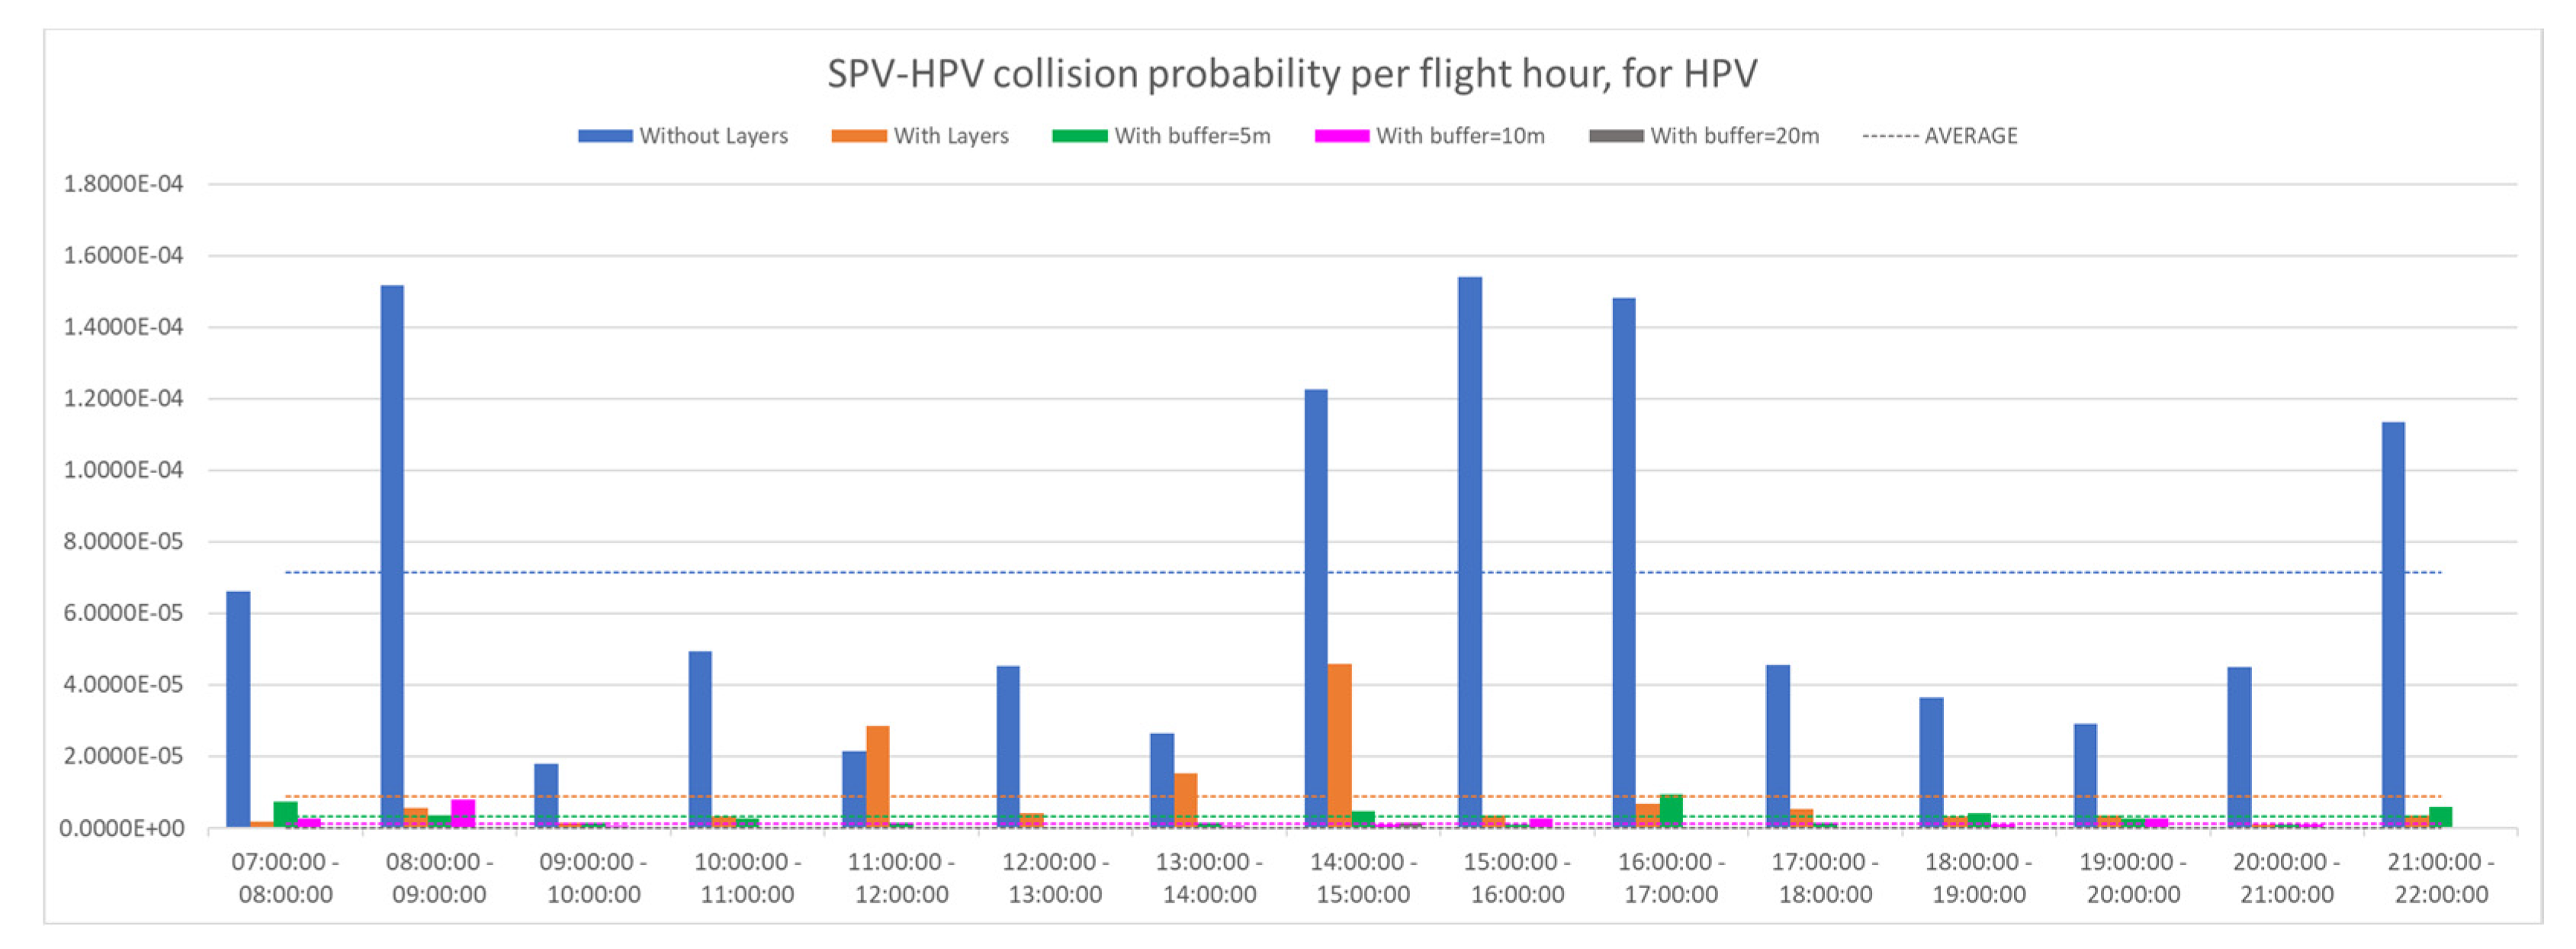
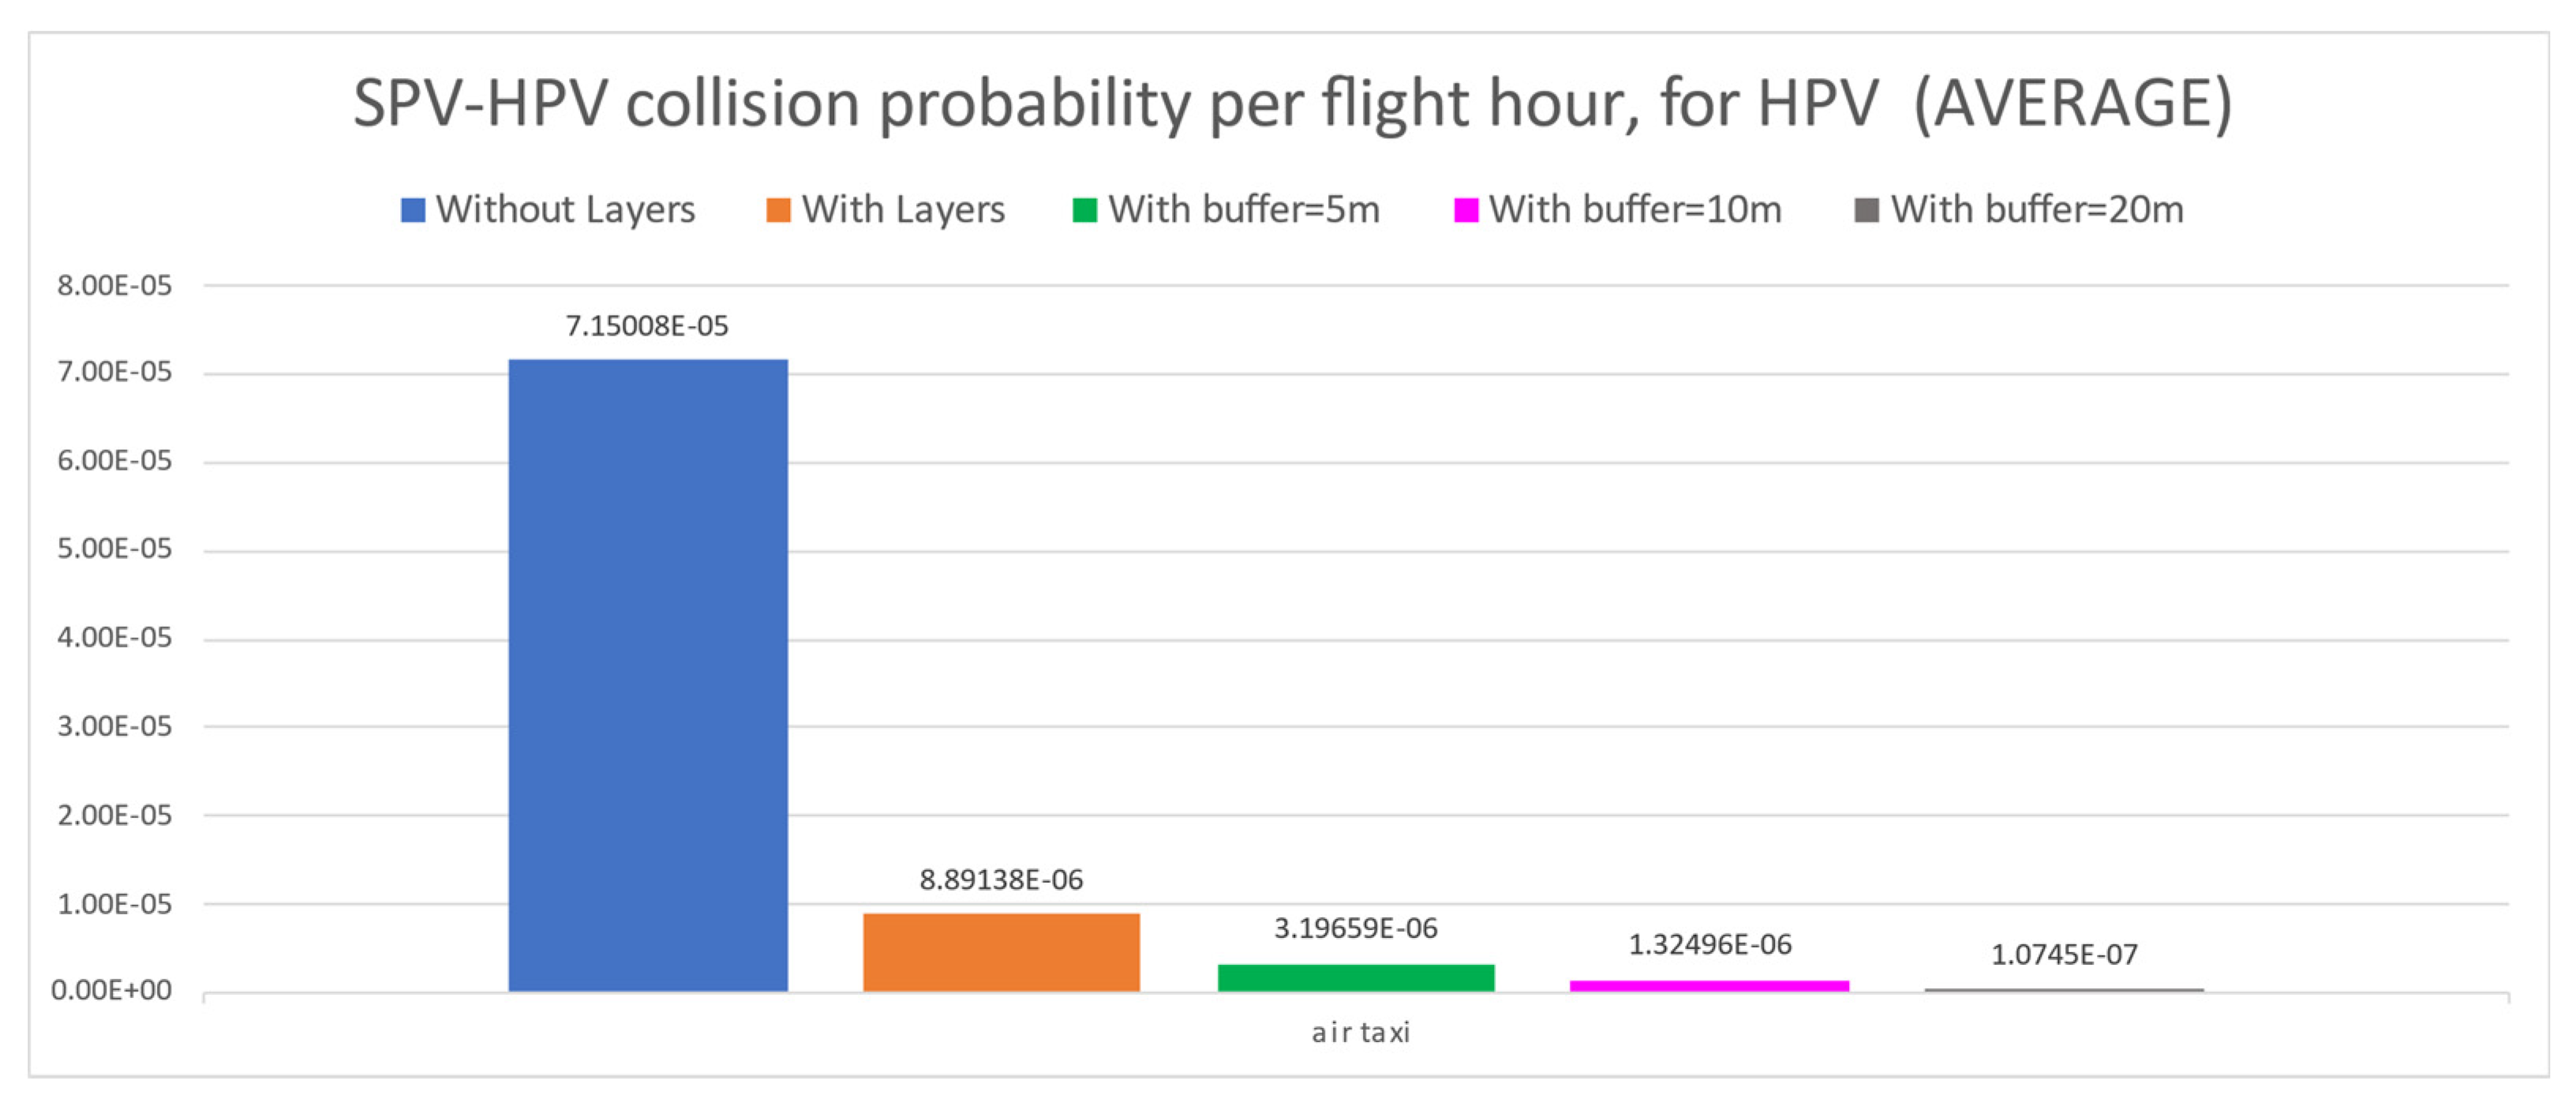
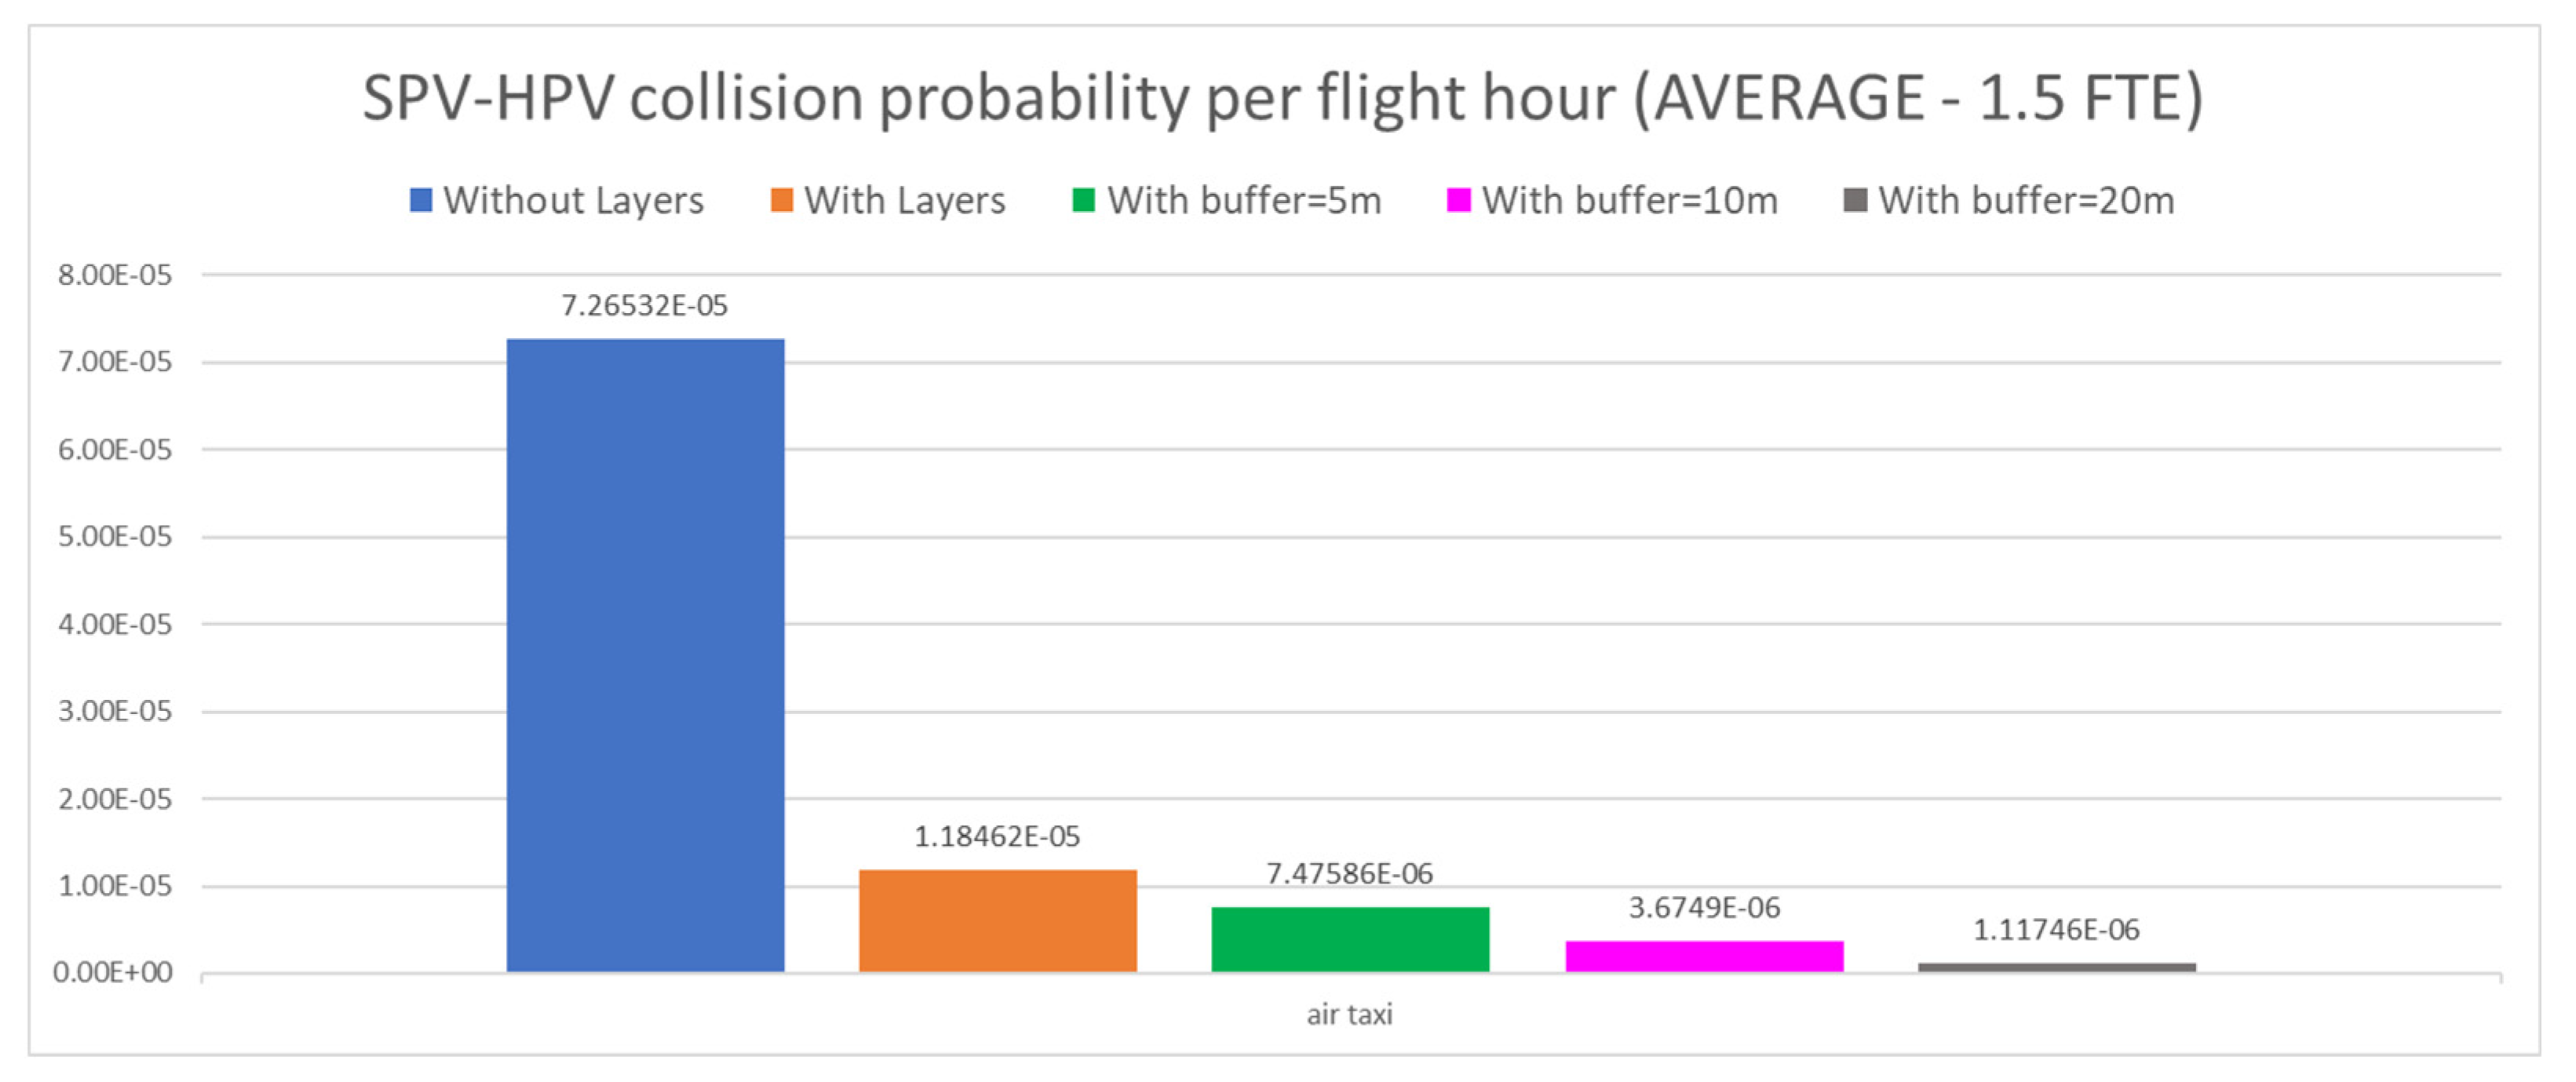
  • Without layers: HPVs and SPVs can fly in the entire volume of the VLL;
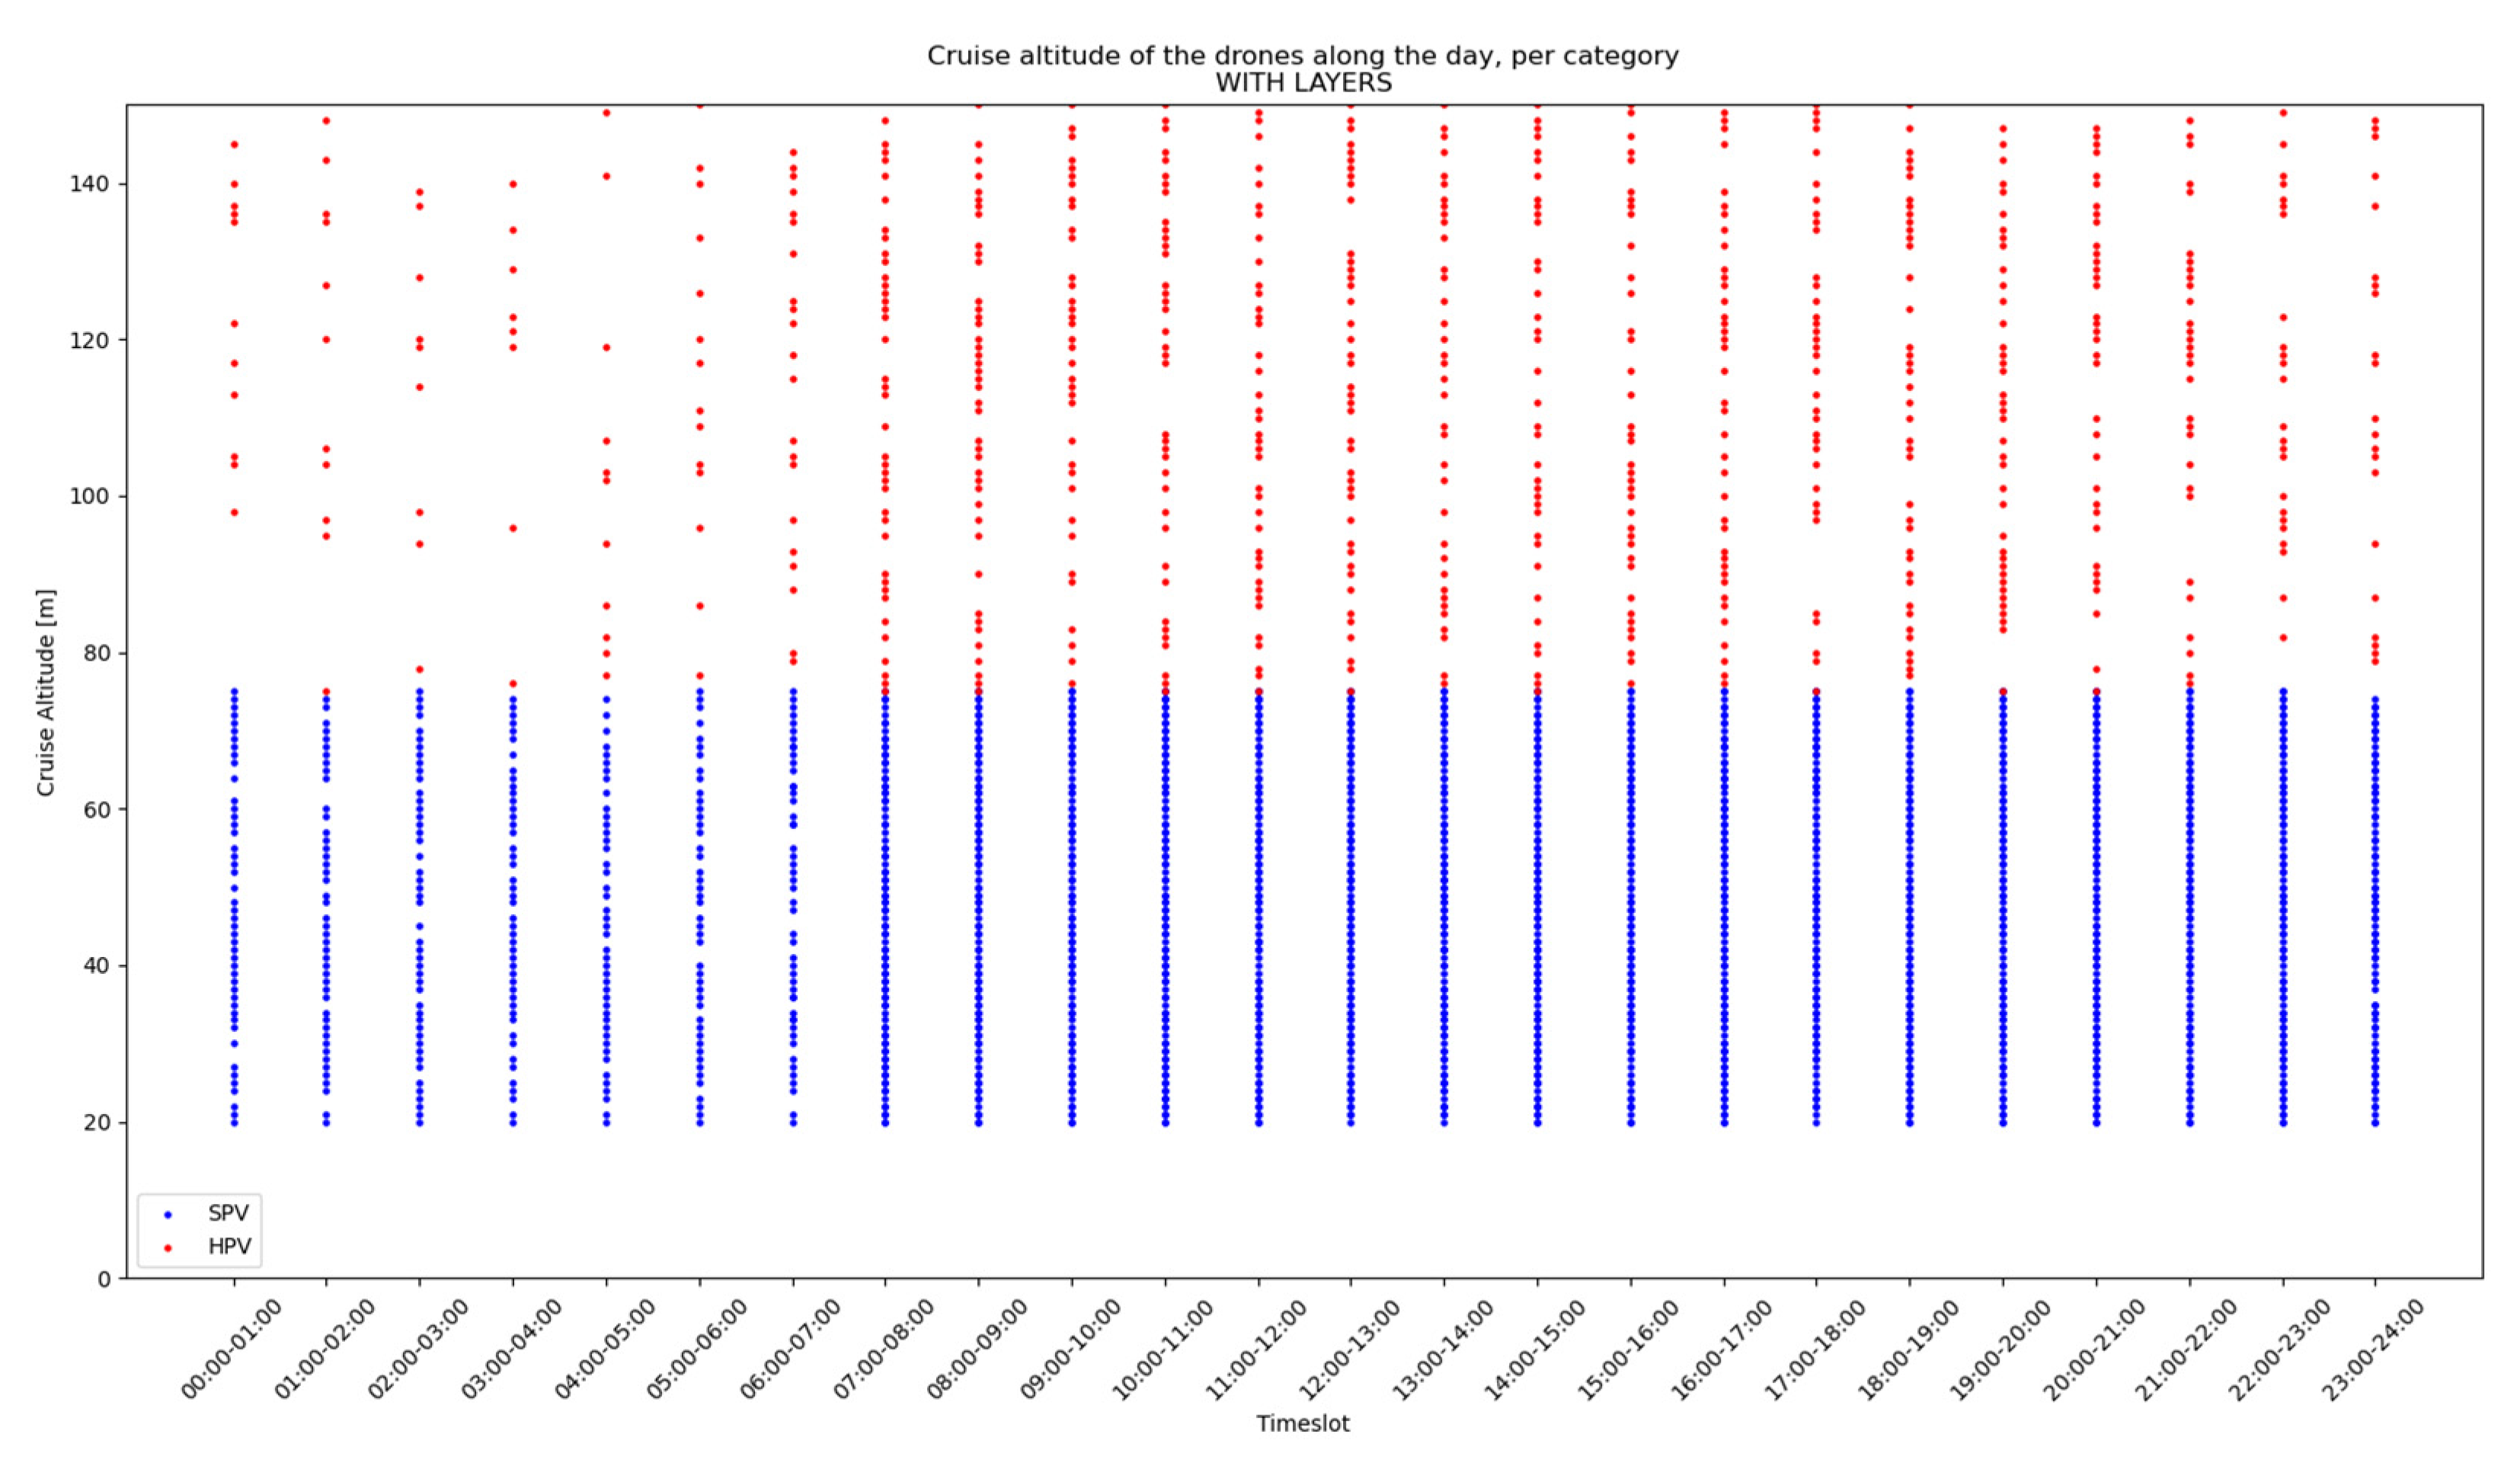
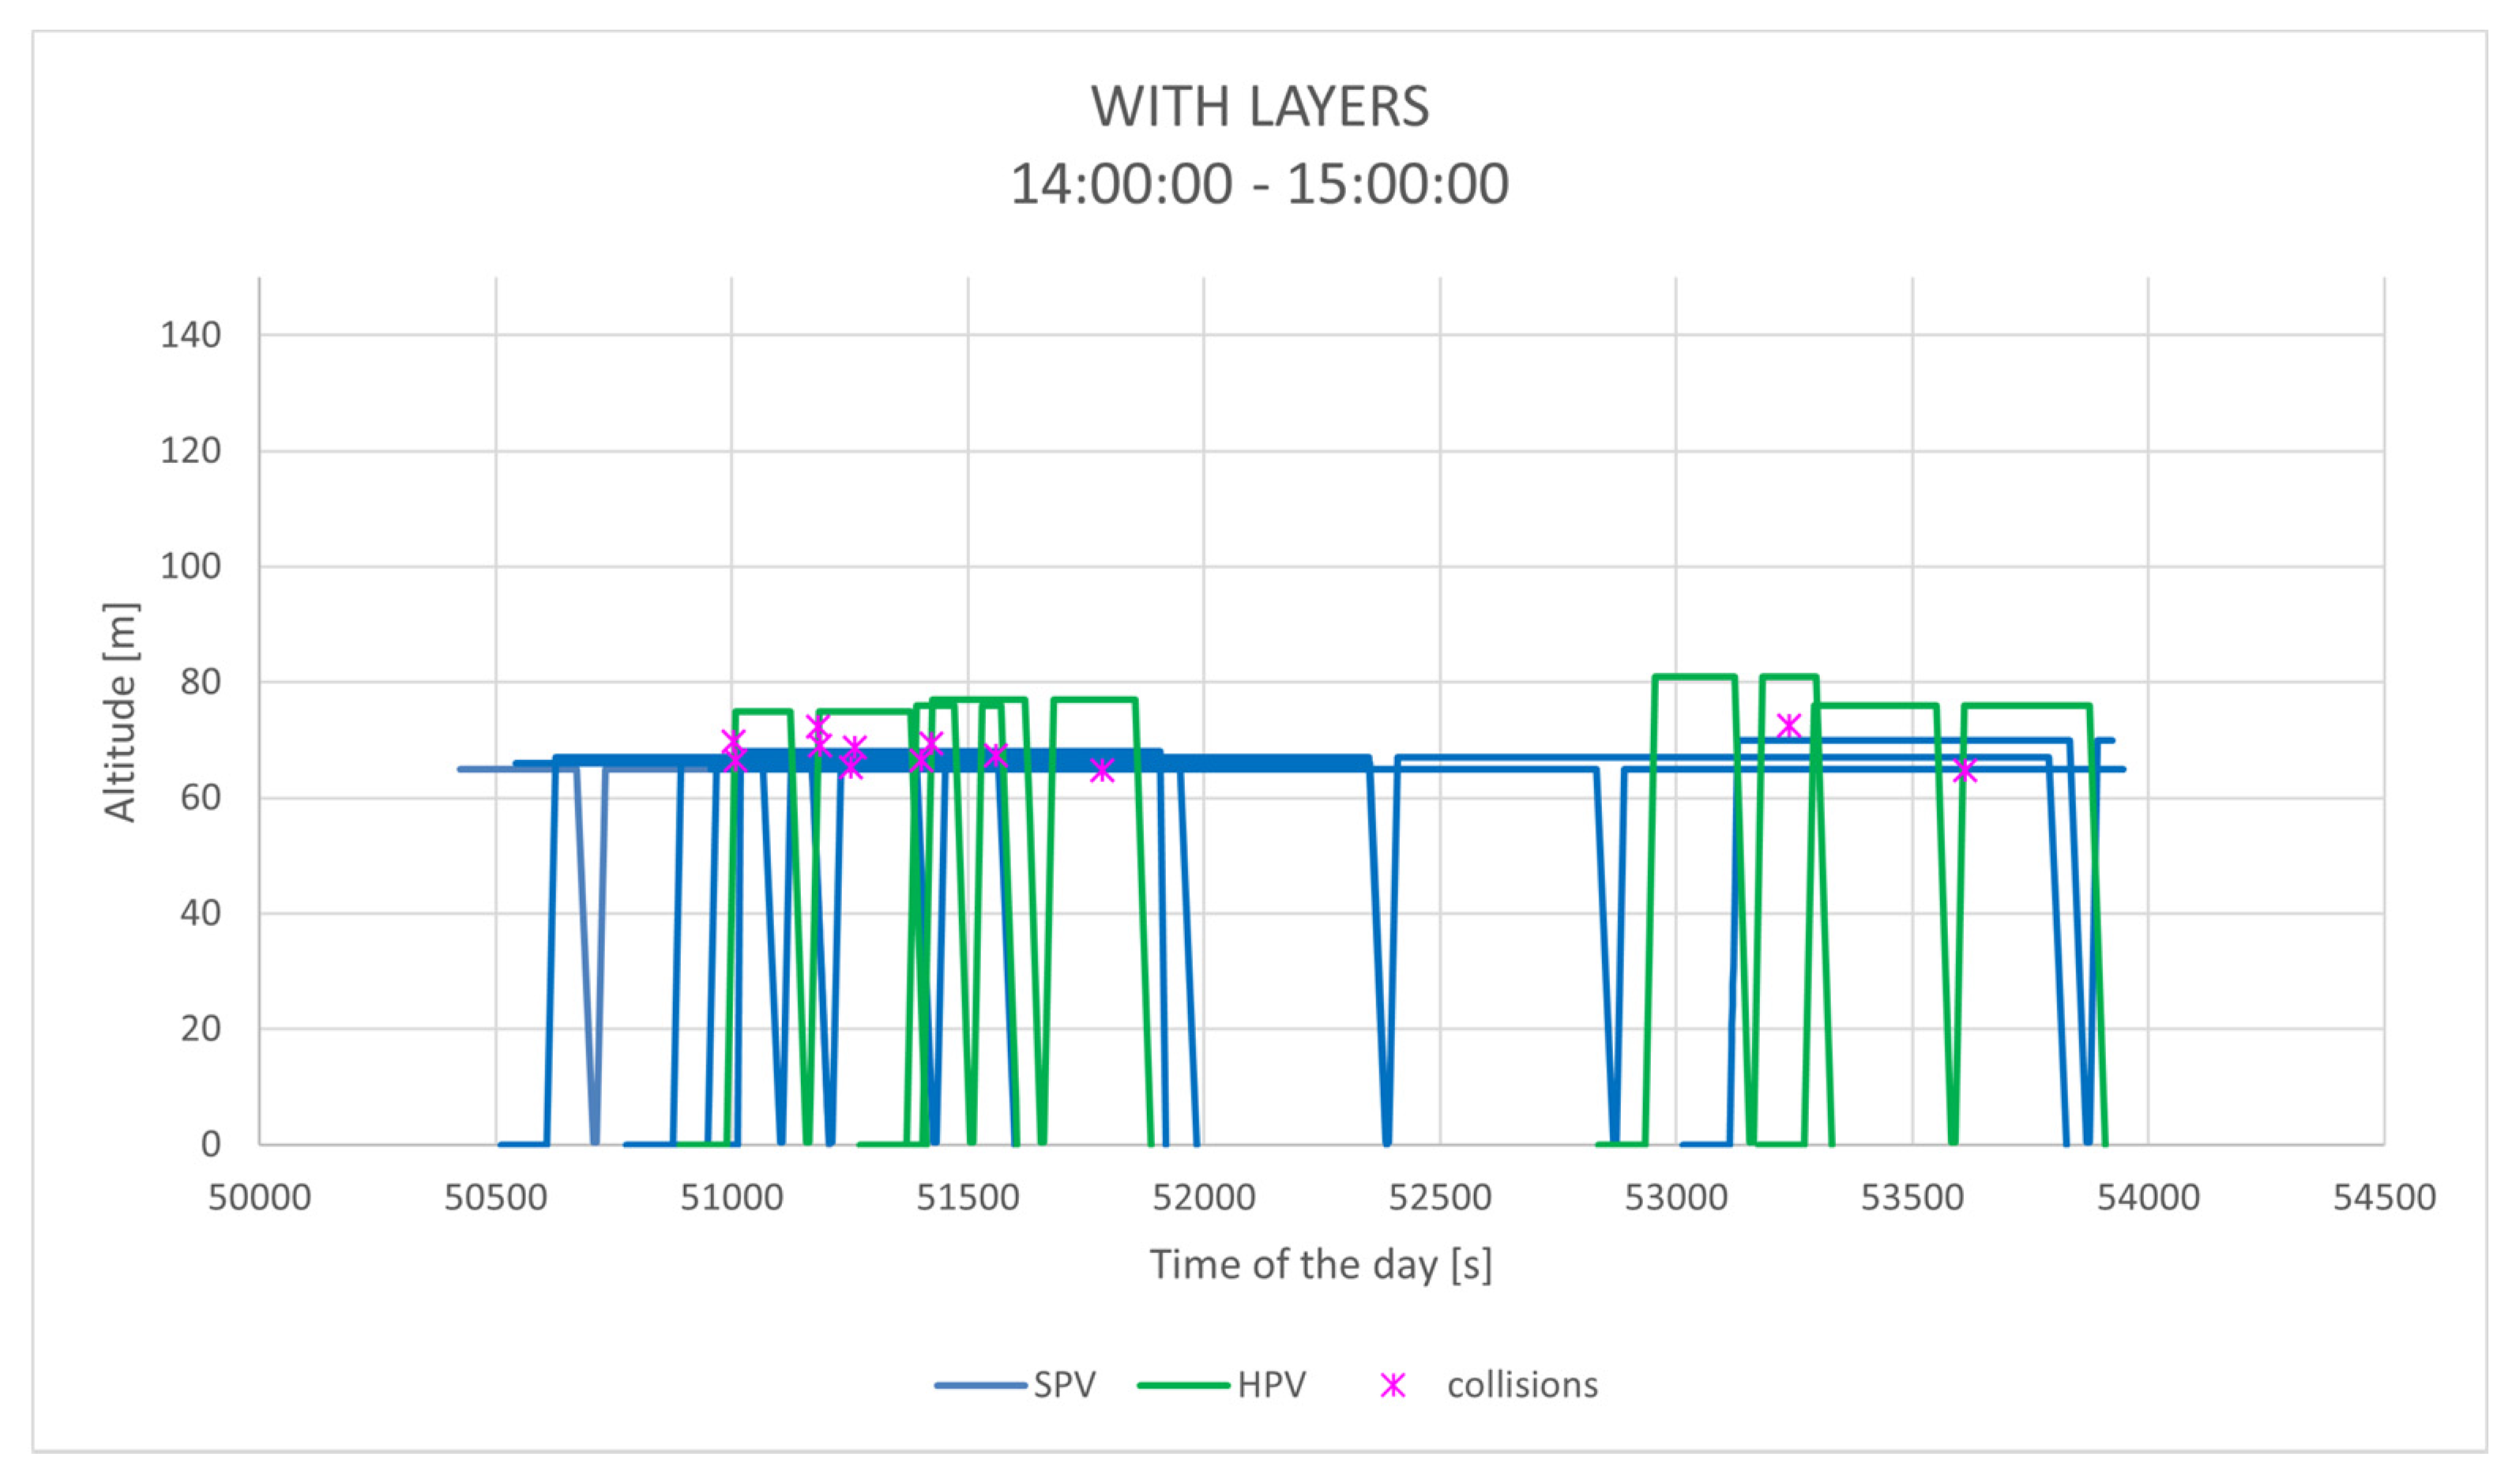
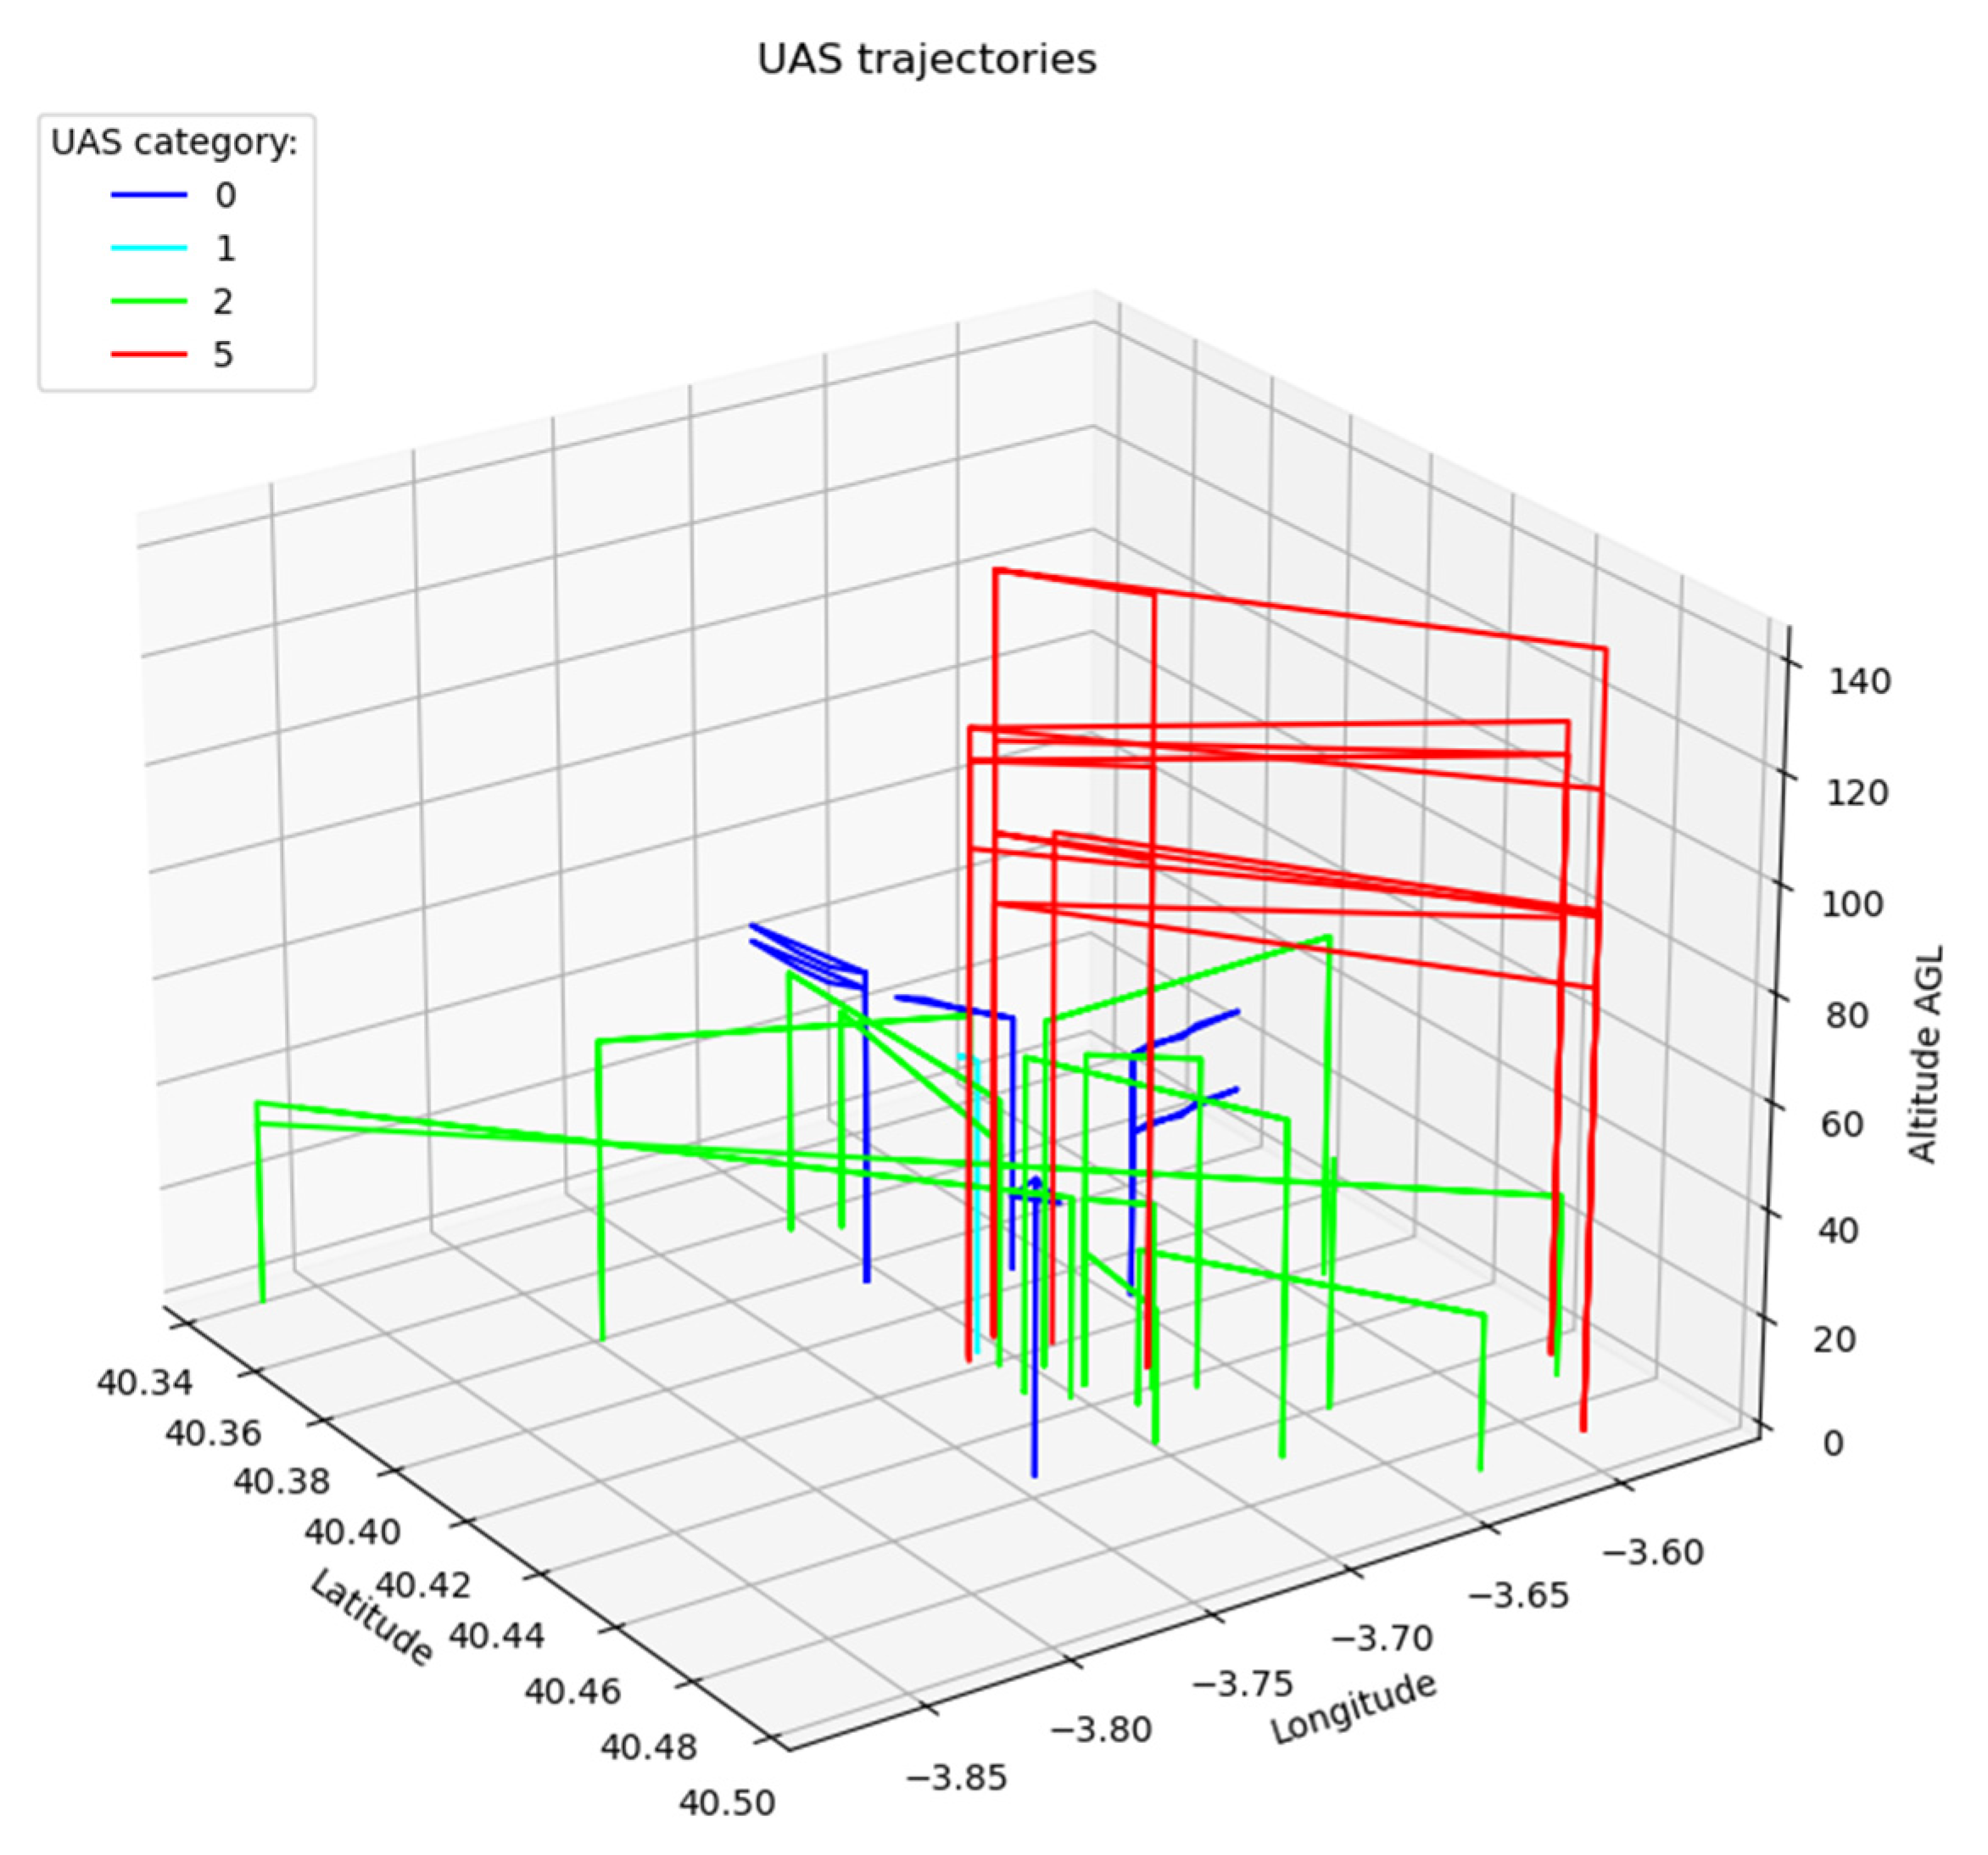
  • With layers: HPVs and SPVs are separated into layers (HPVs fly above 75 m and SPVs below 75 m), but there is no buffer between layers;
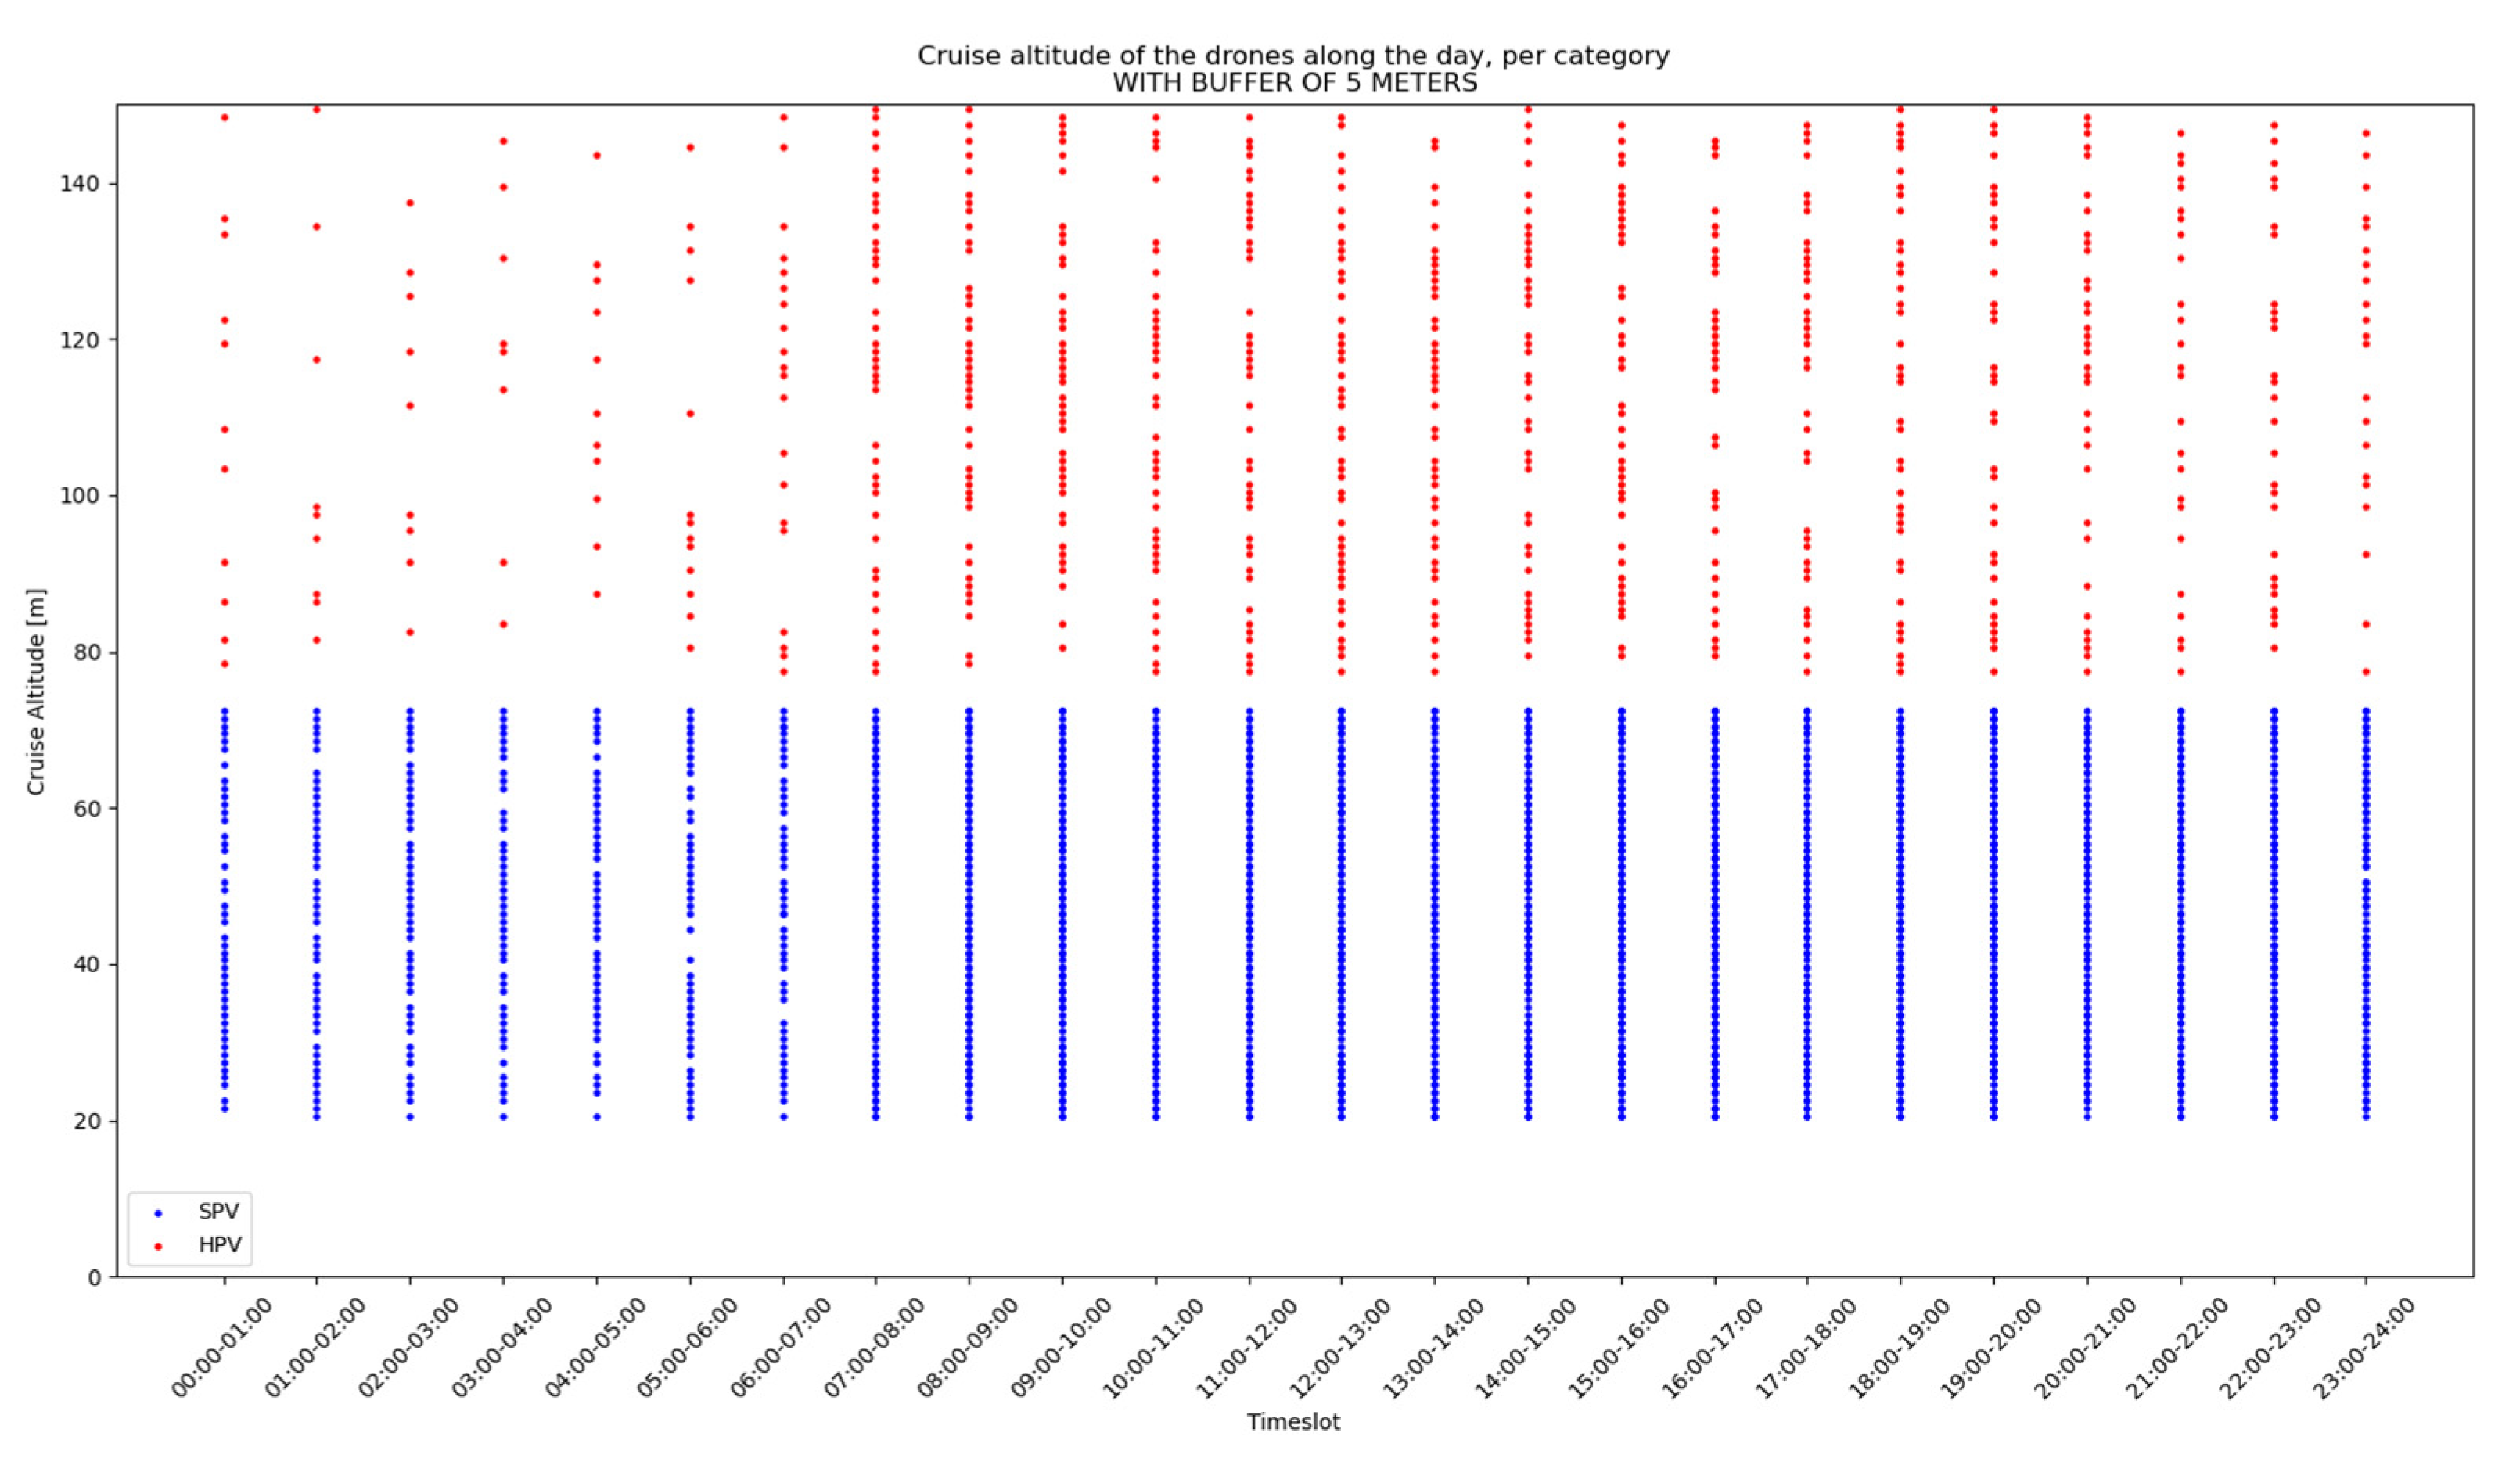
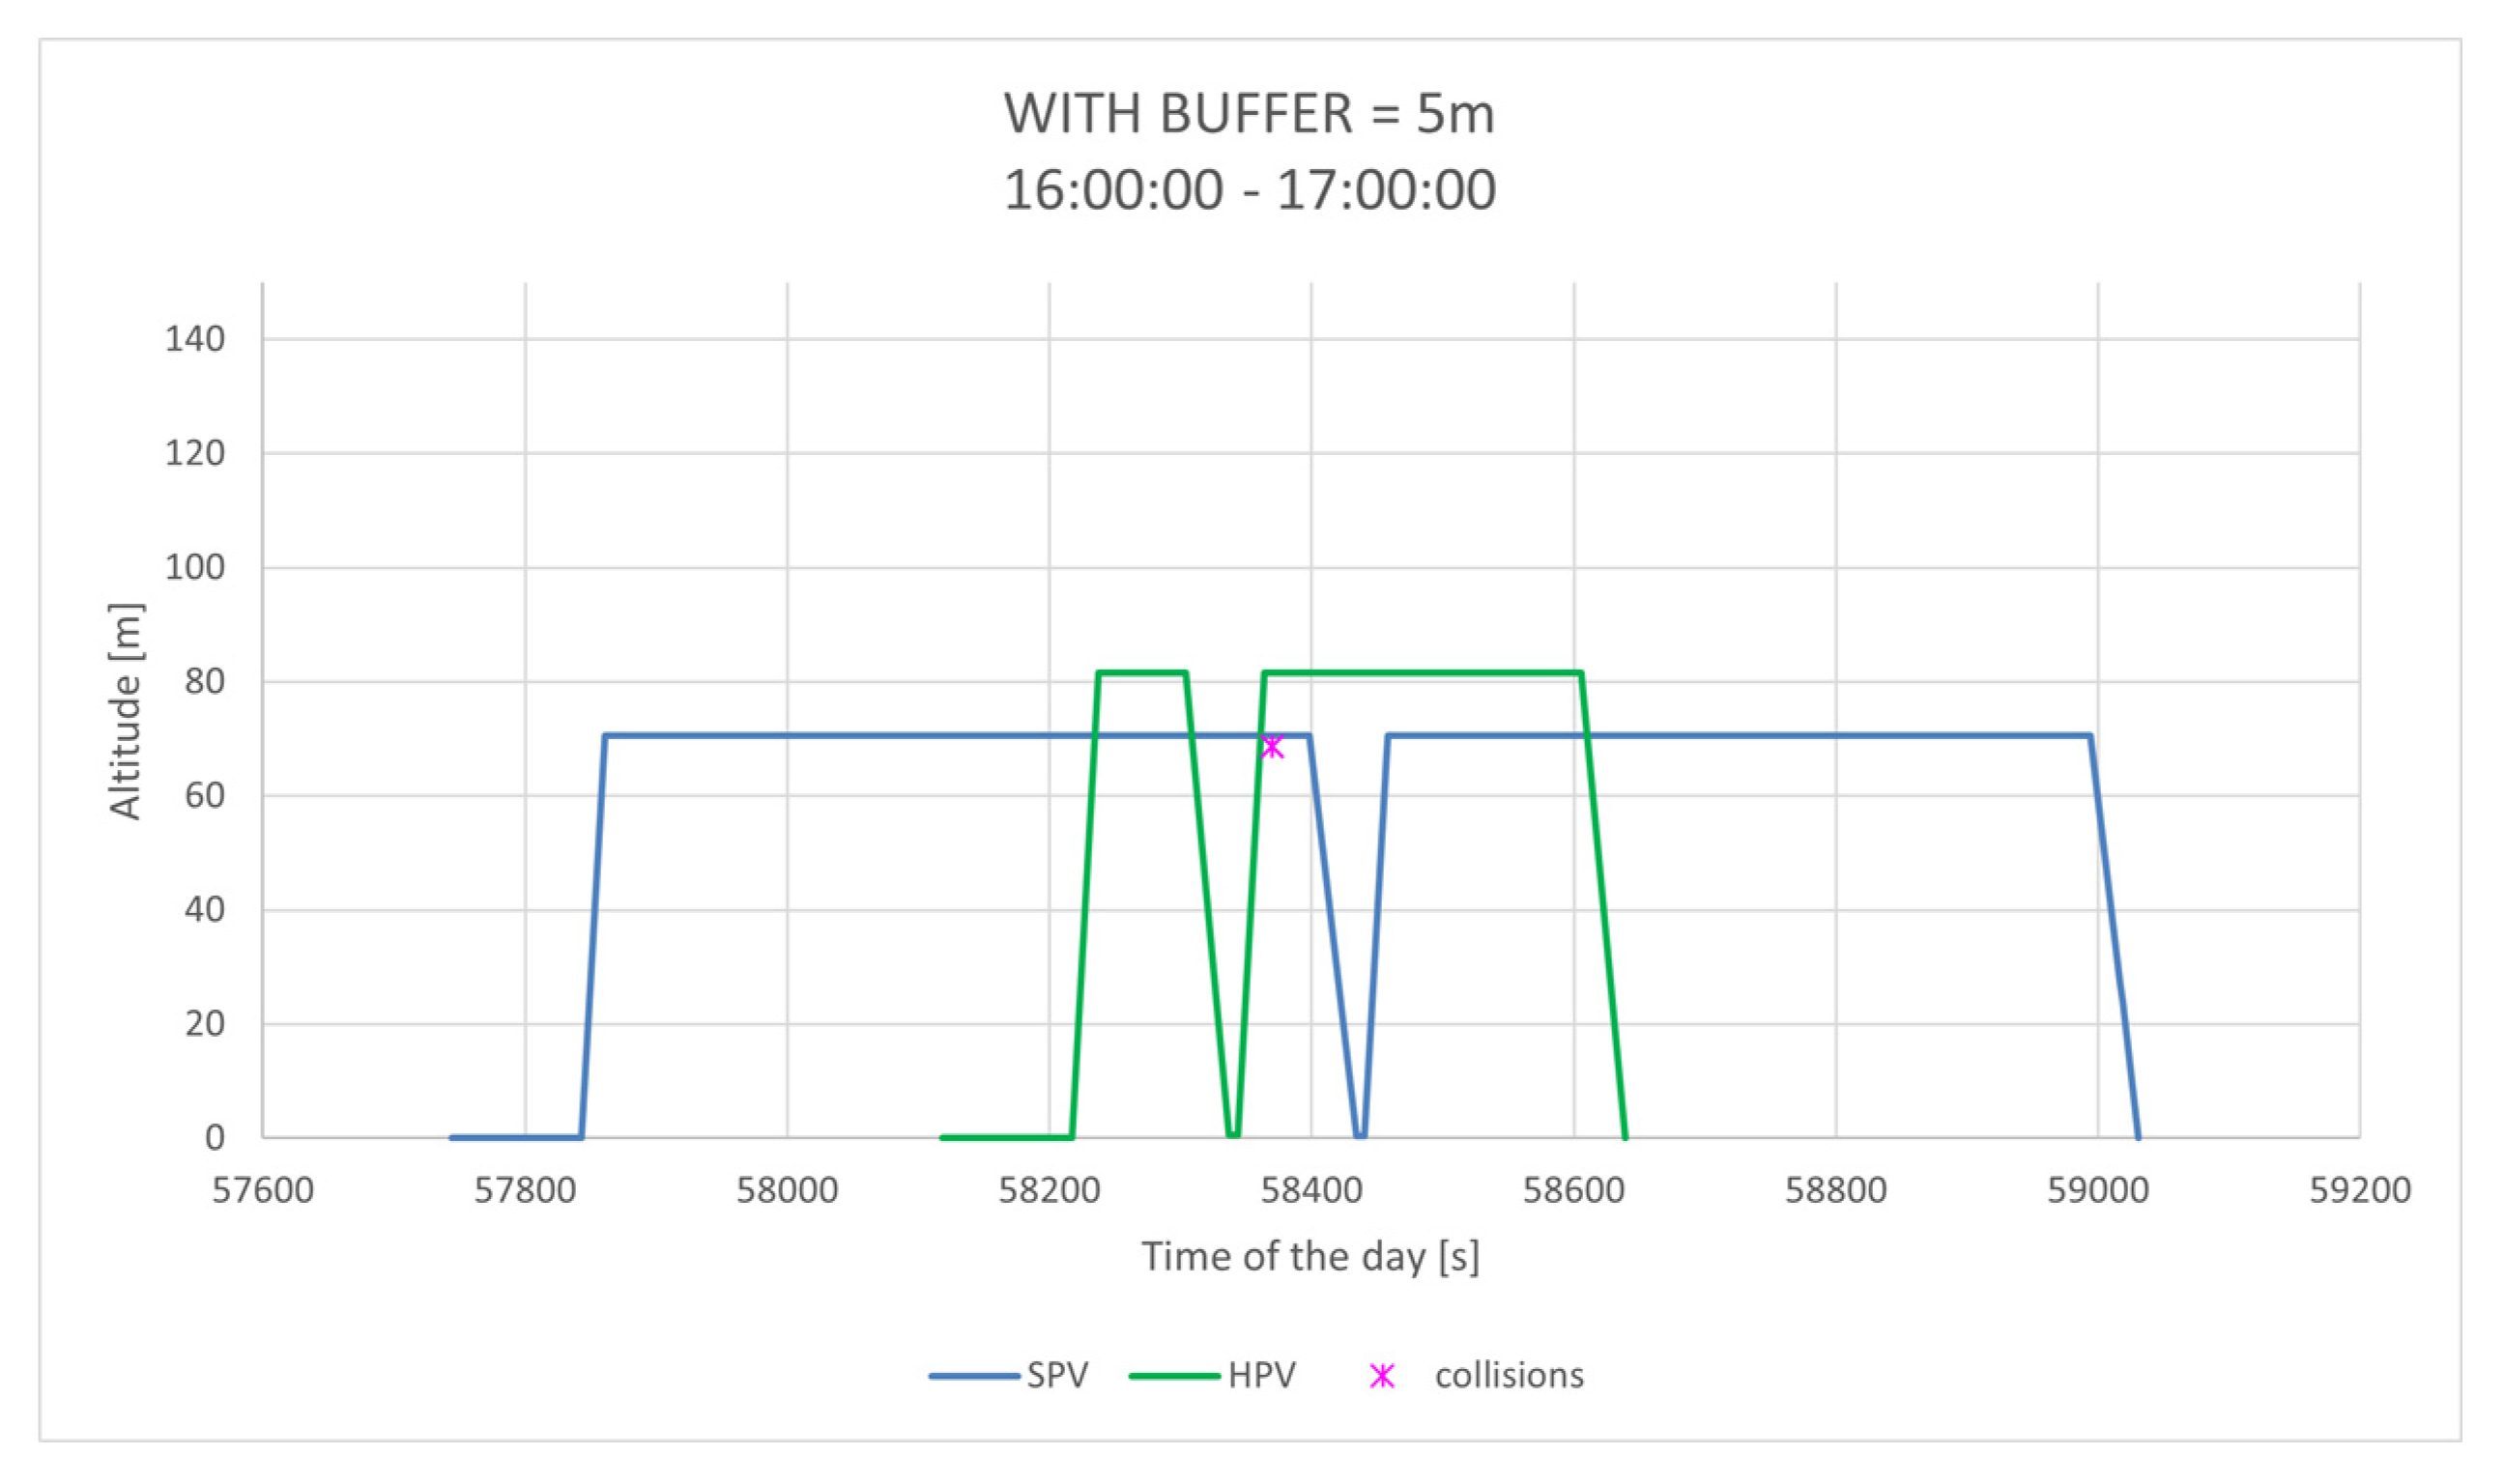
  • Buffer 5 m: HPVs and SPVs are separated into layers with a buffer of 5 m between them (HPVs fly above 77.5 m and SPVs below 72.5 m);
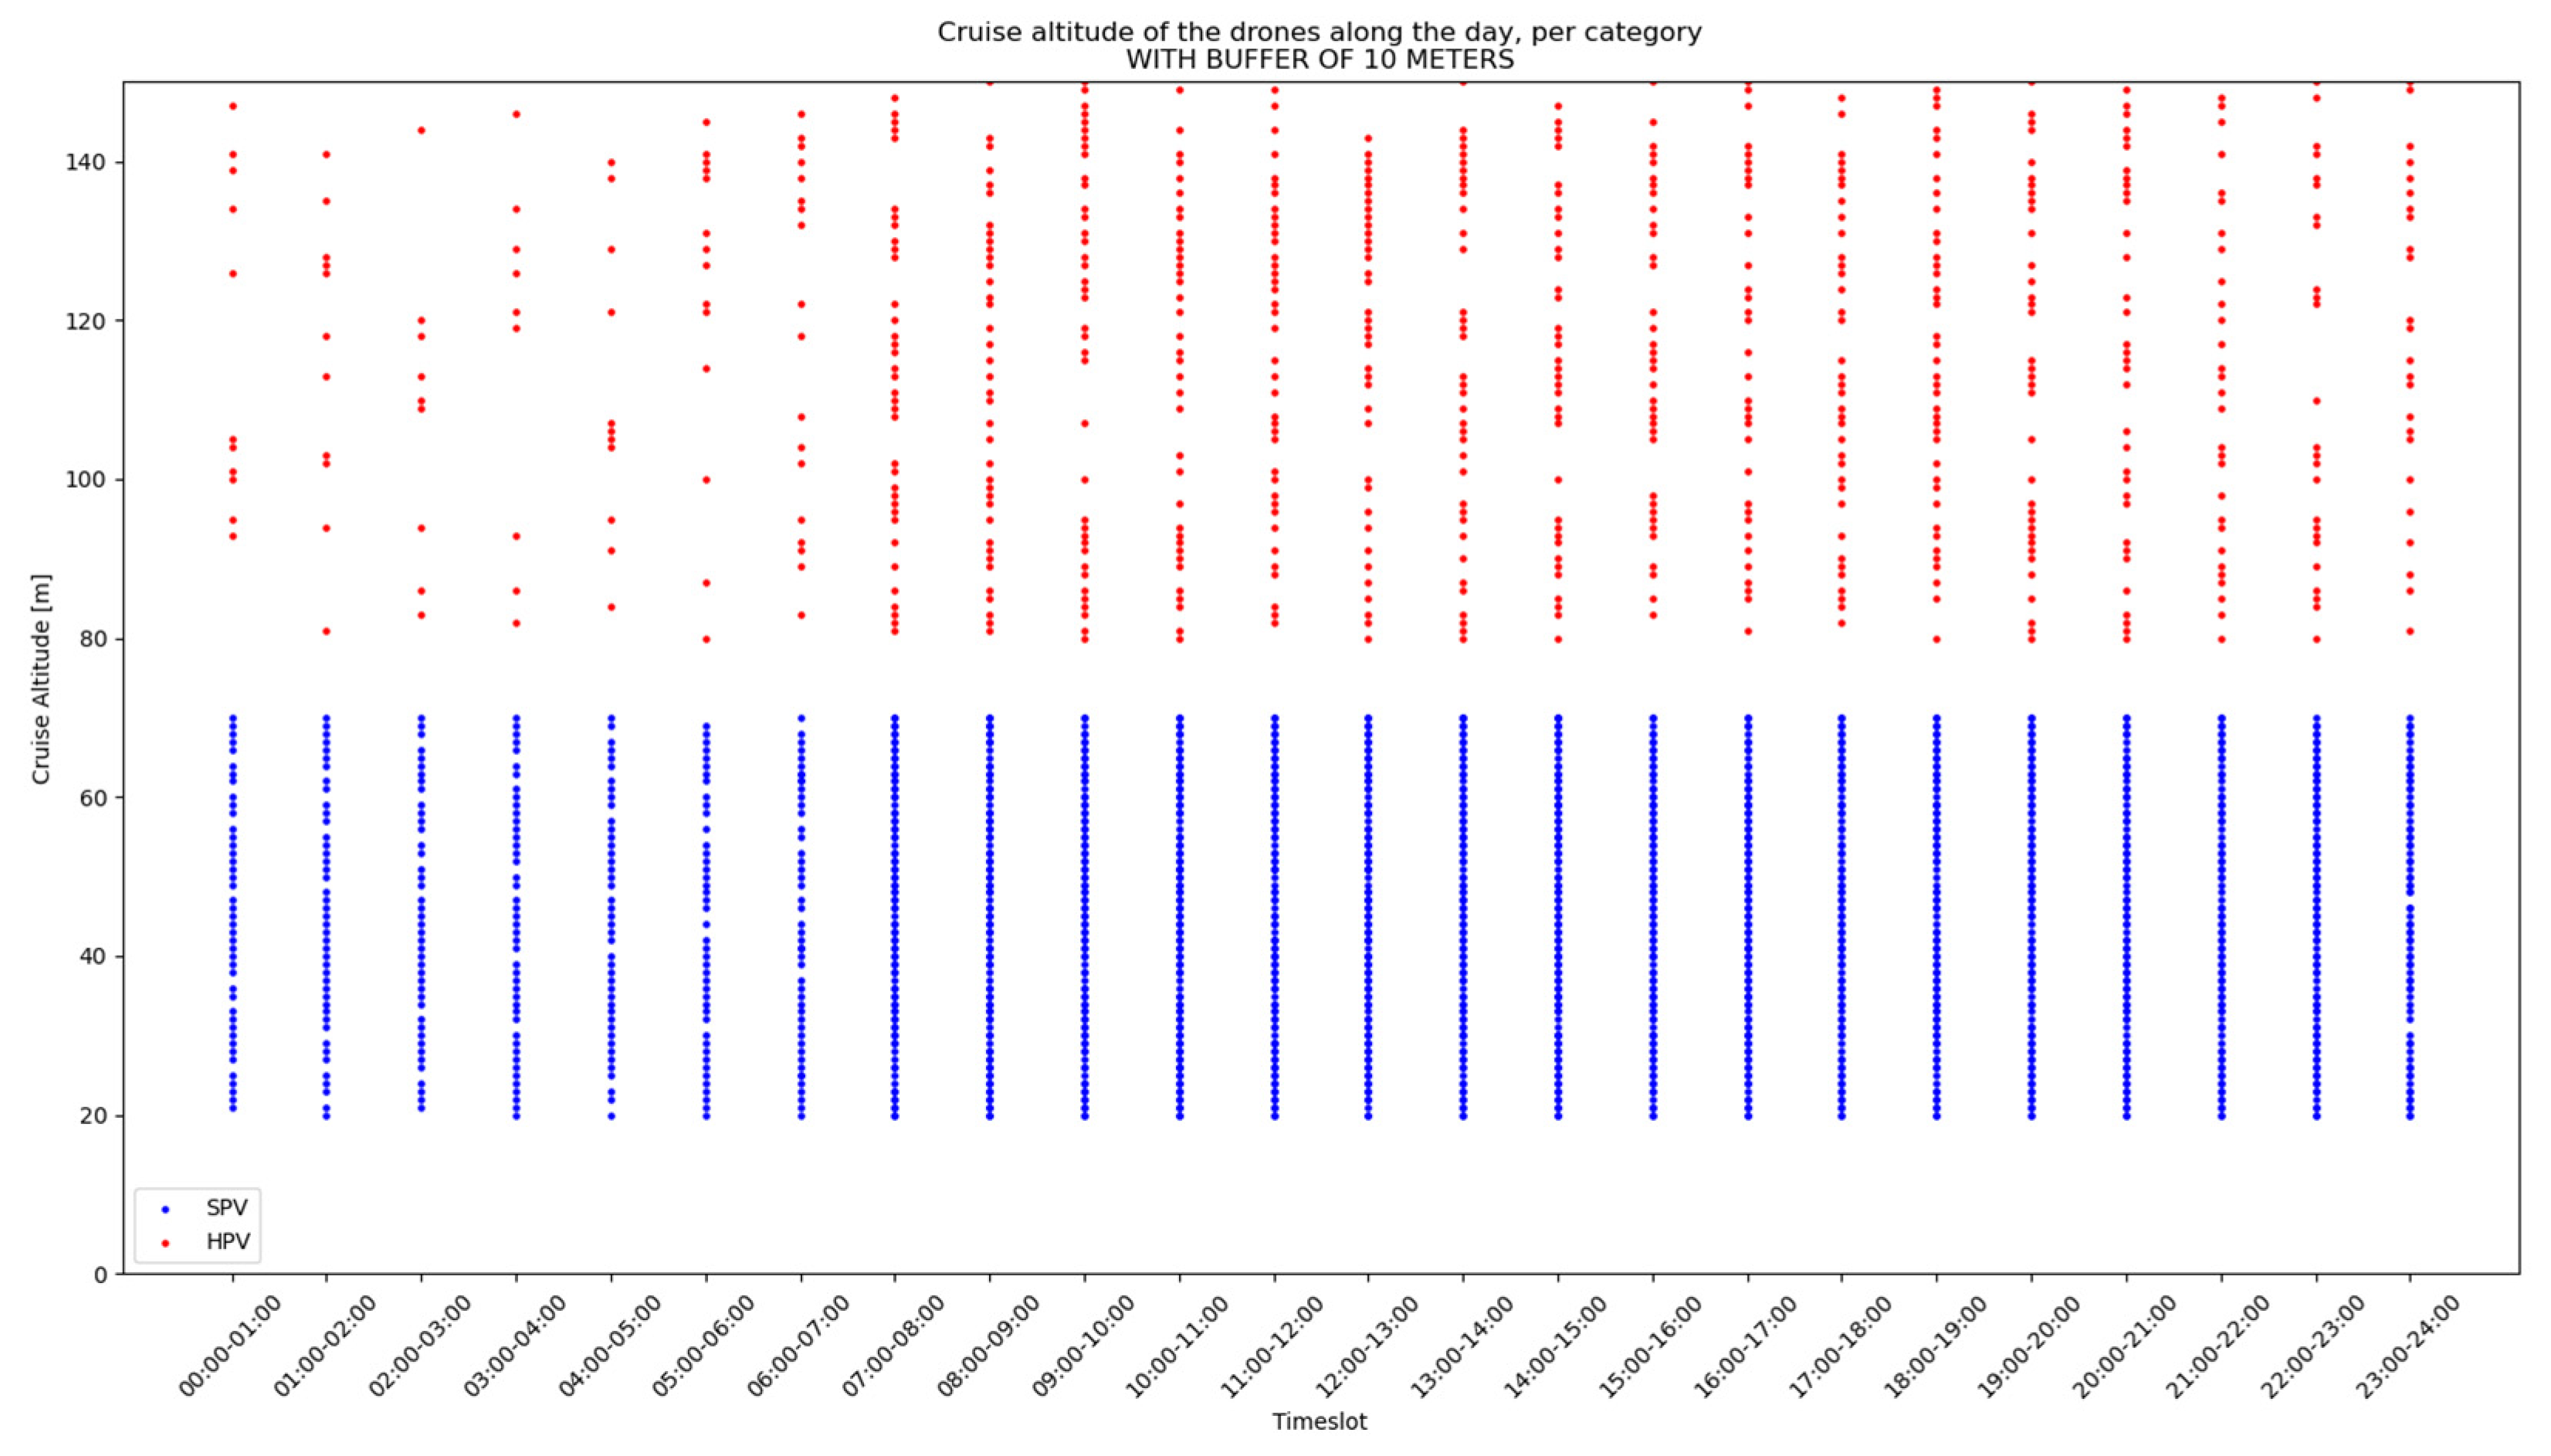
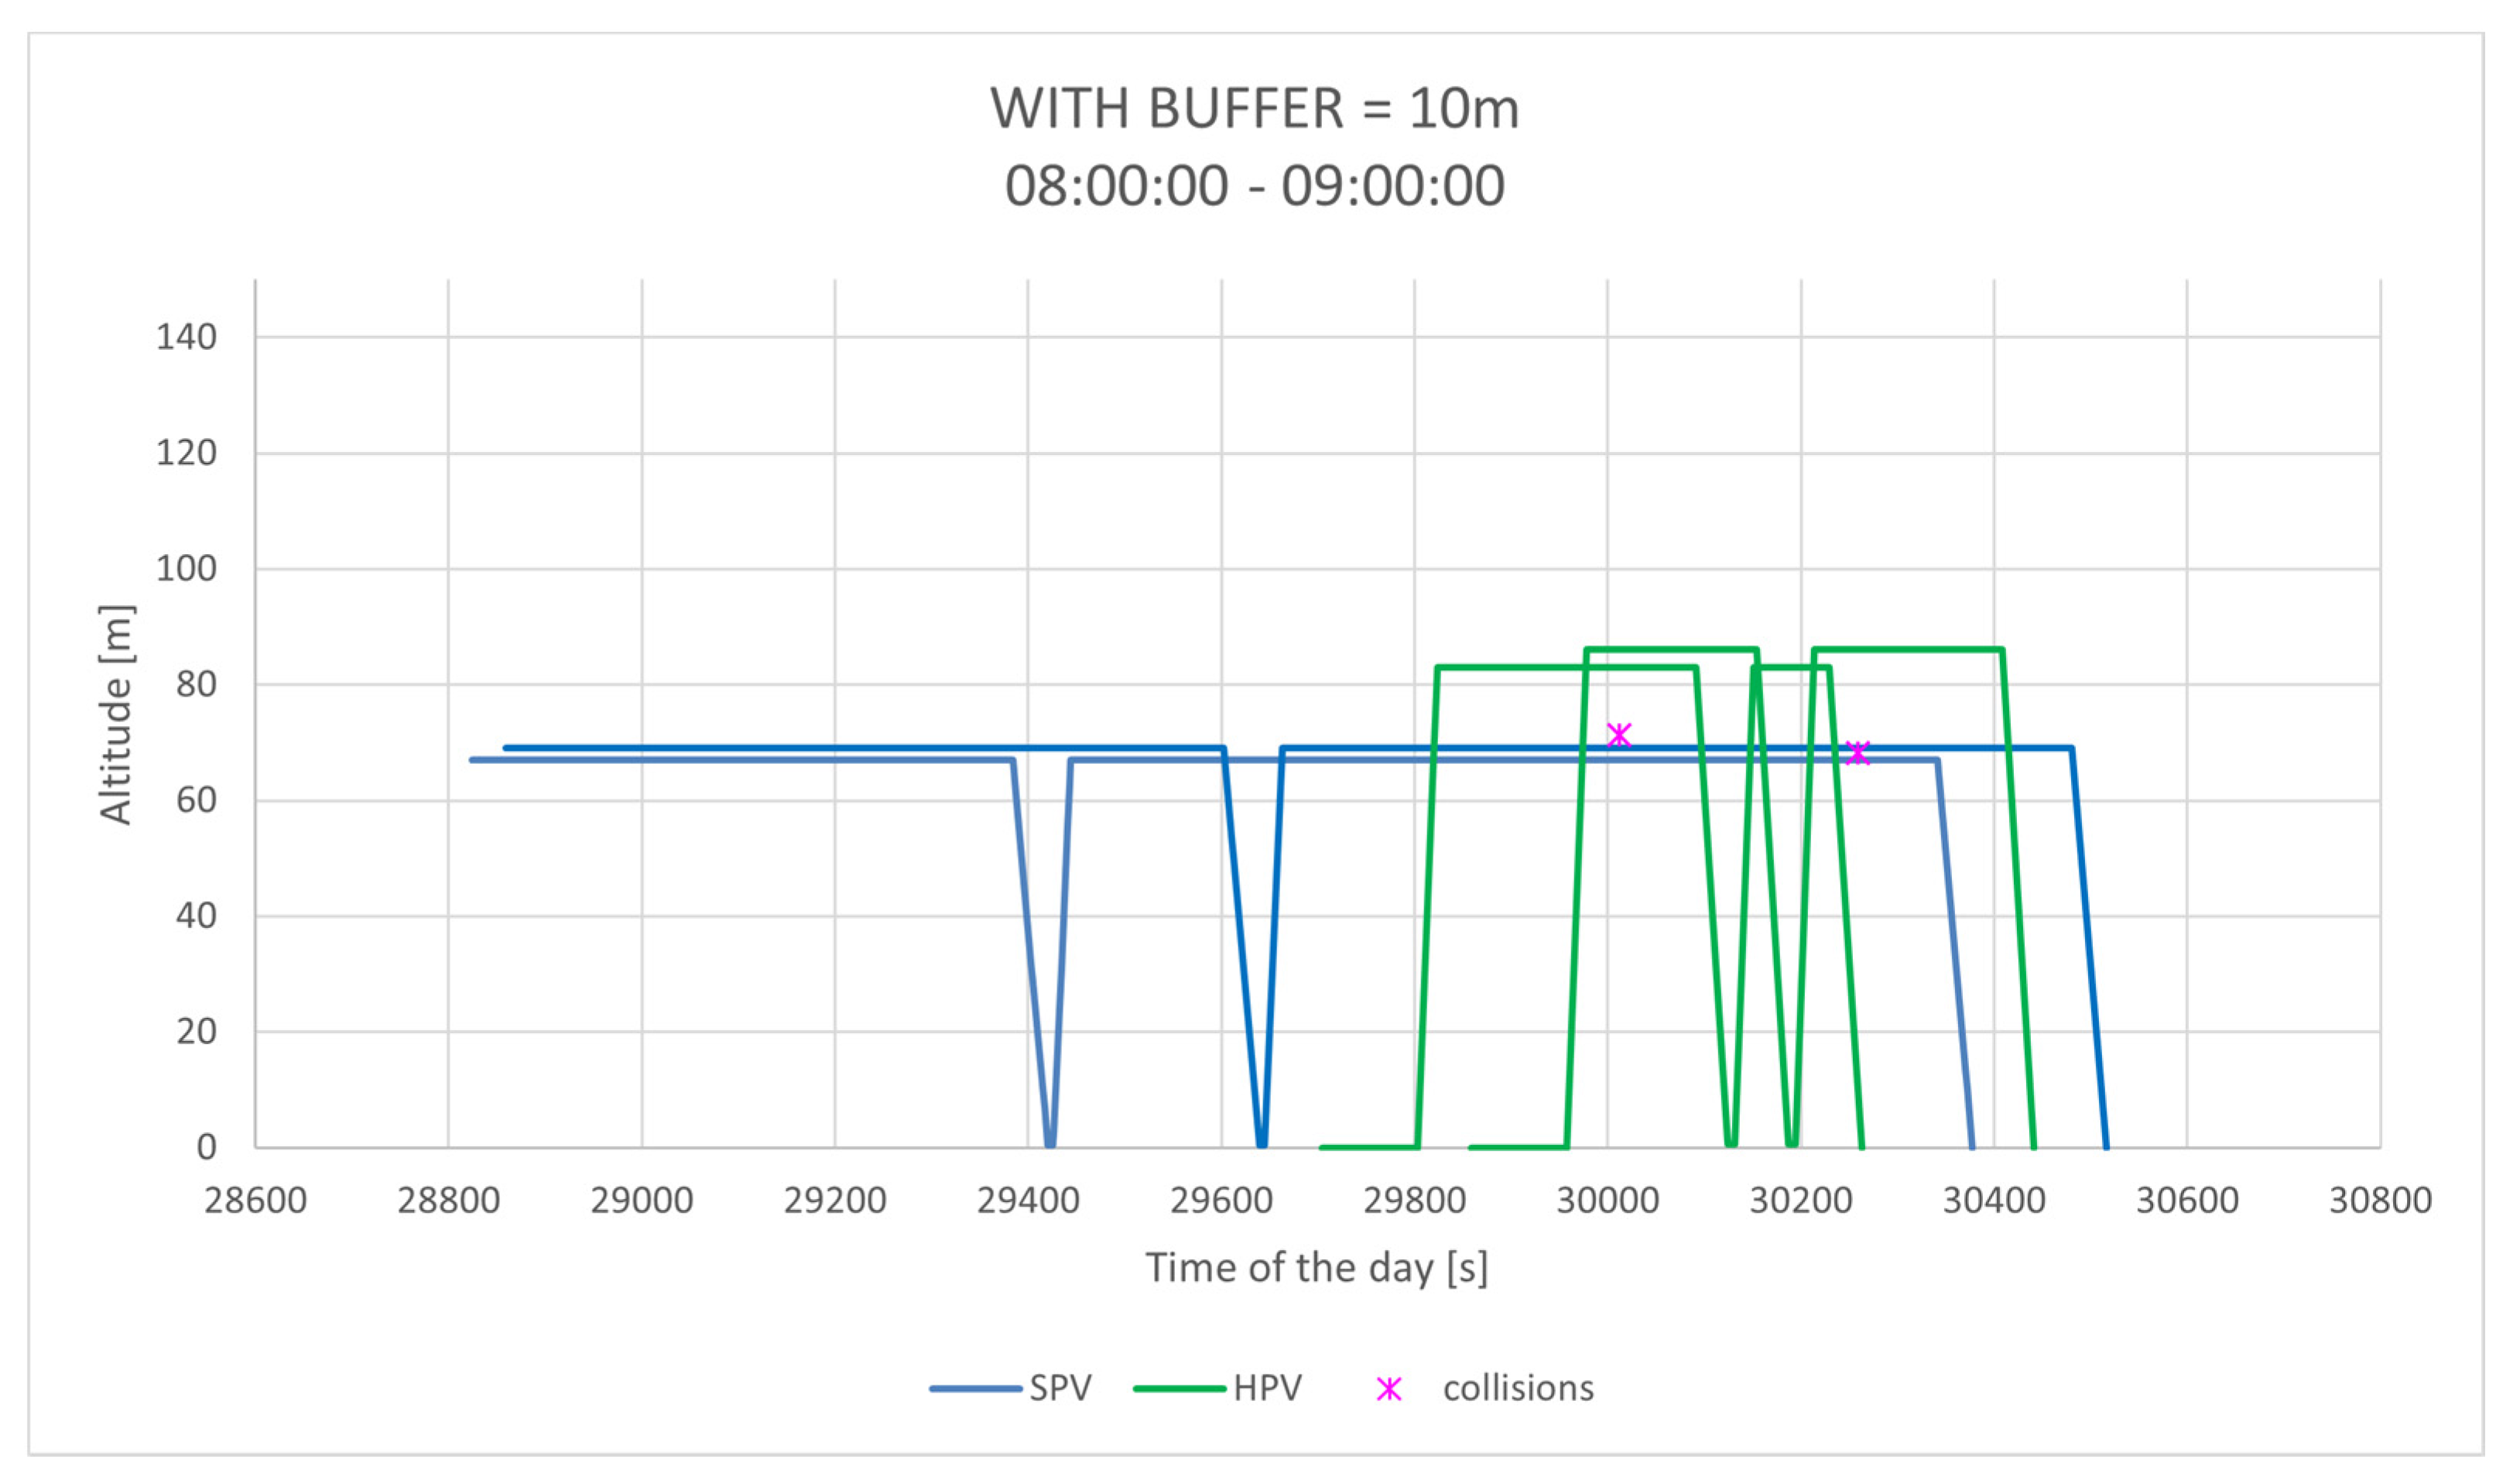
  • Buffer 10 m: HPVs and SPVs are separated into layers with a buffer of 10 m between them (HPVs fly above 80 m and SPVs below 70 m);
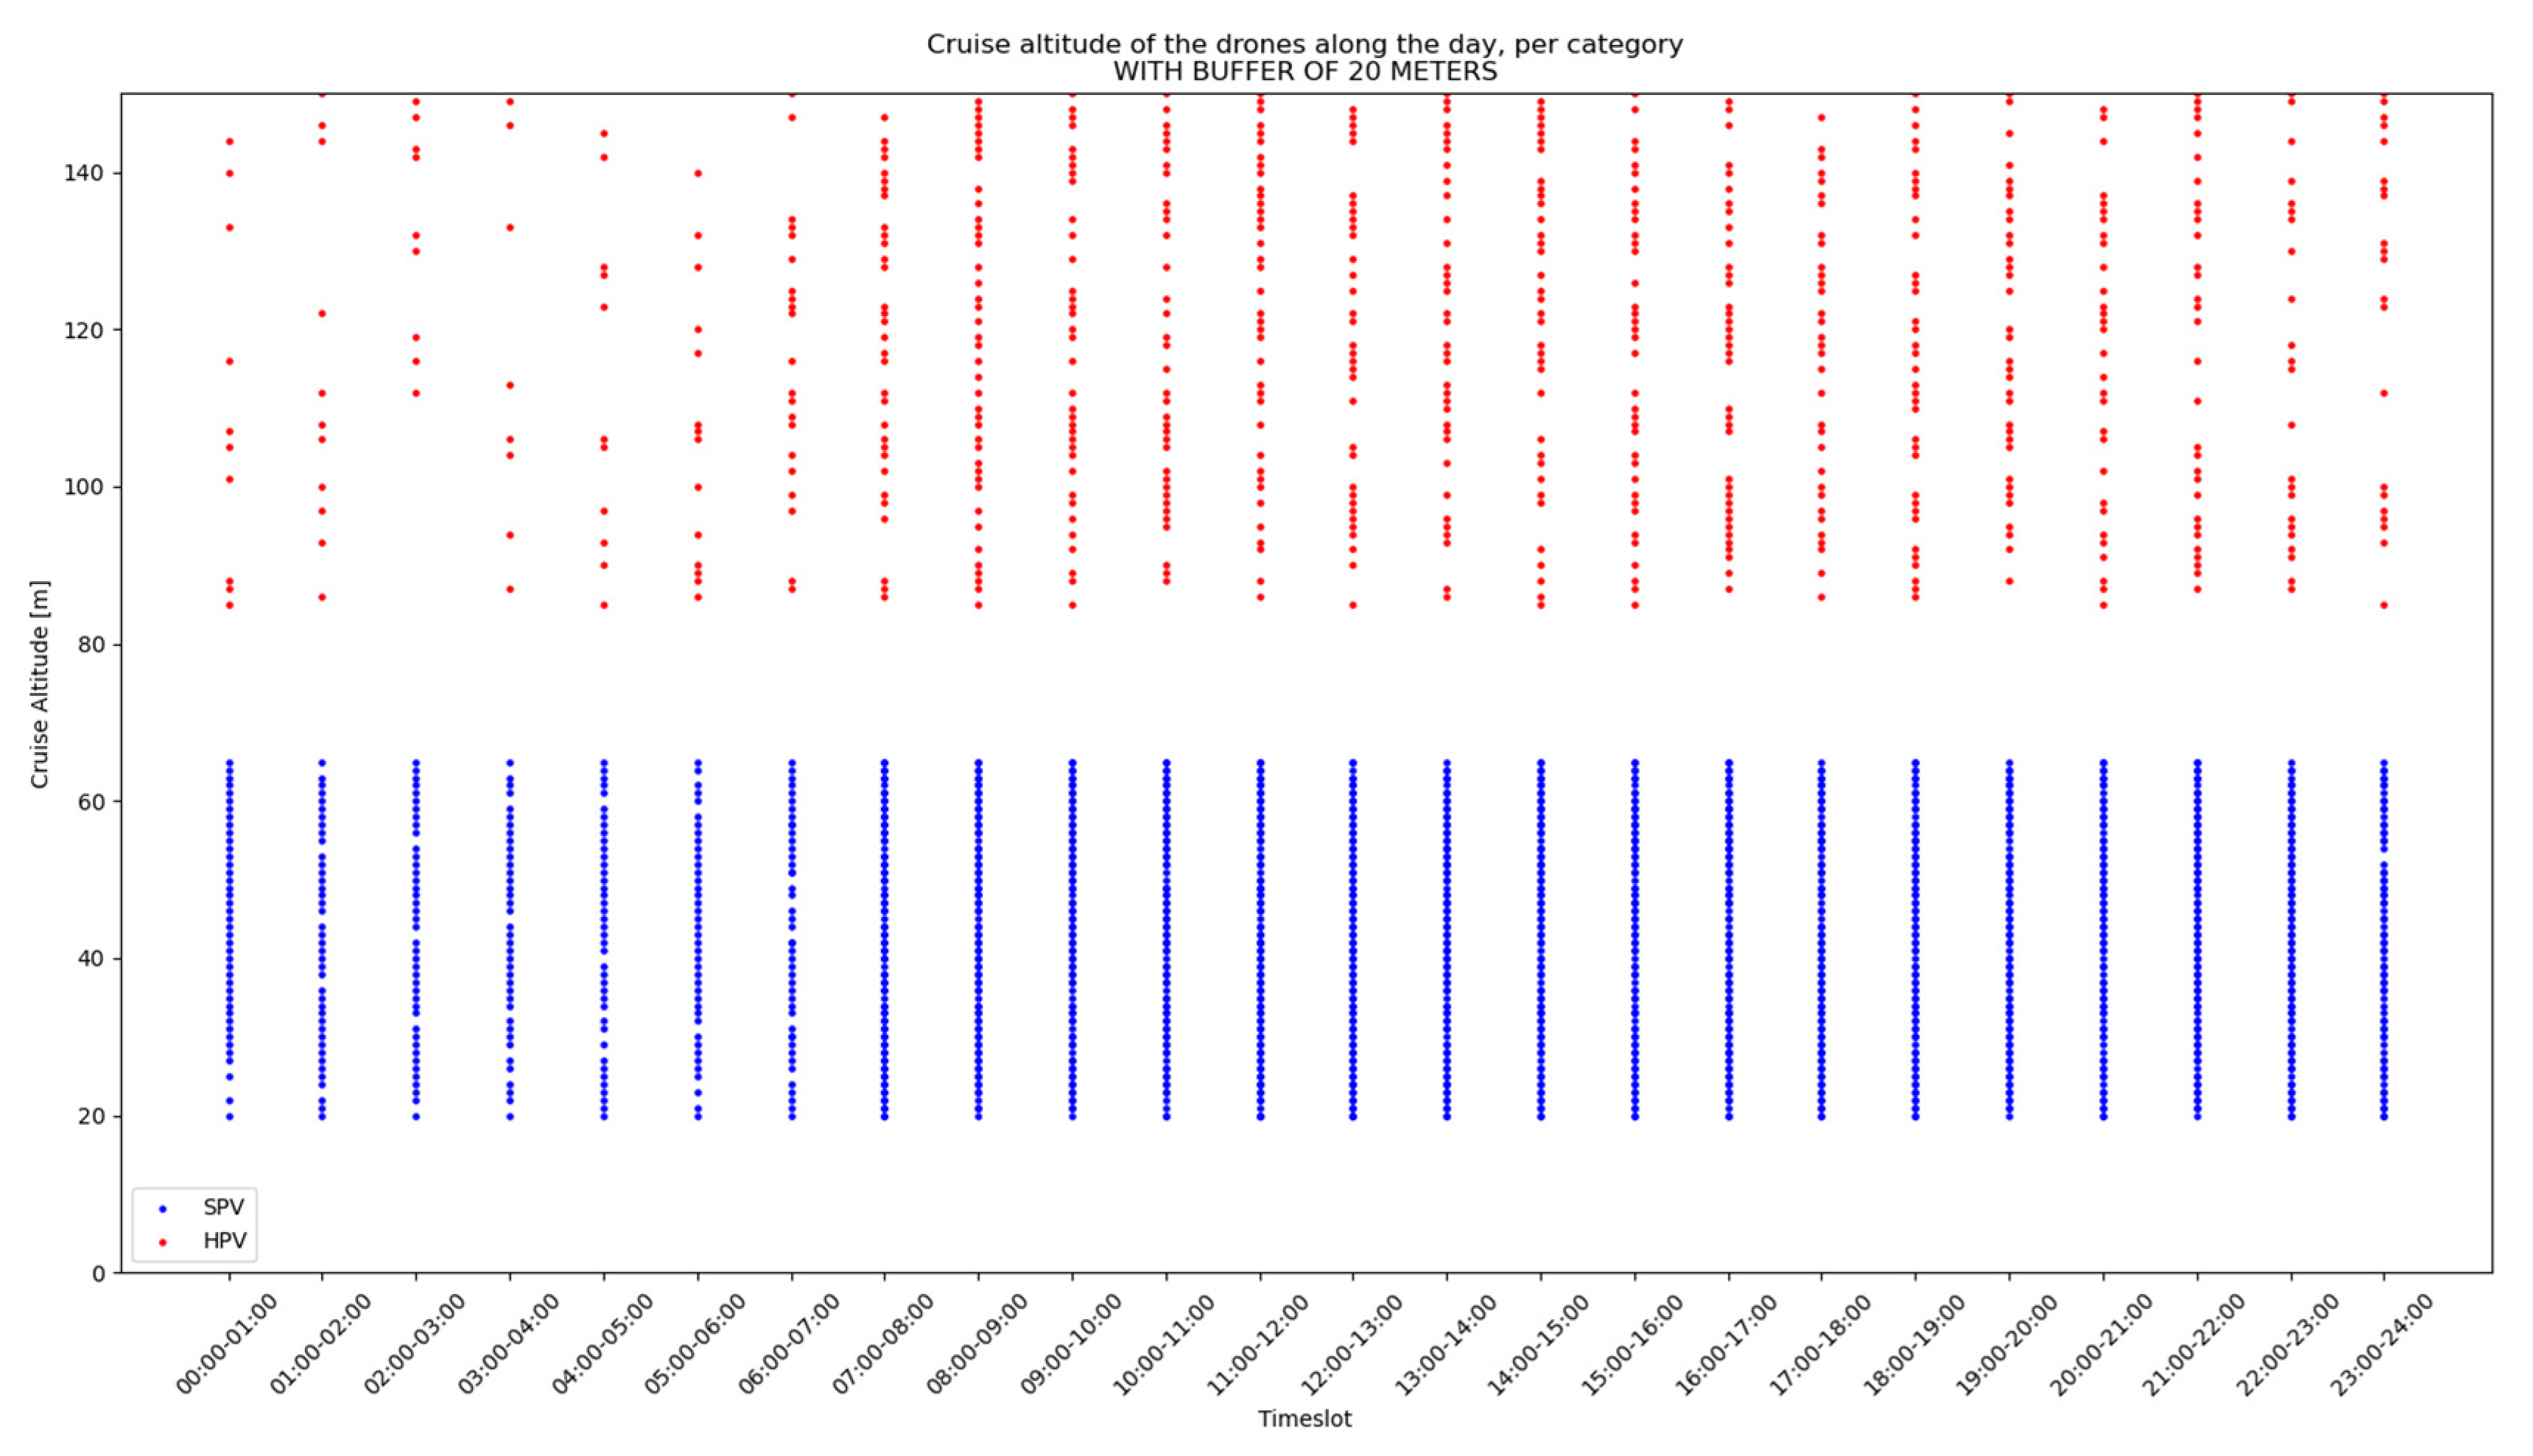
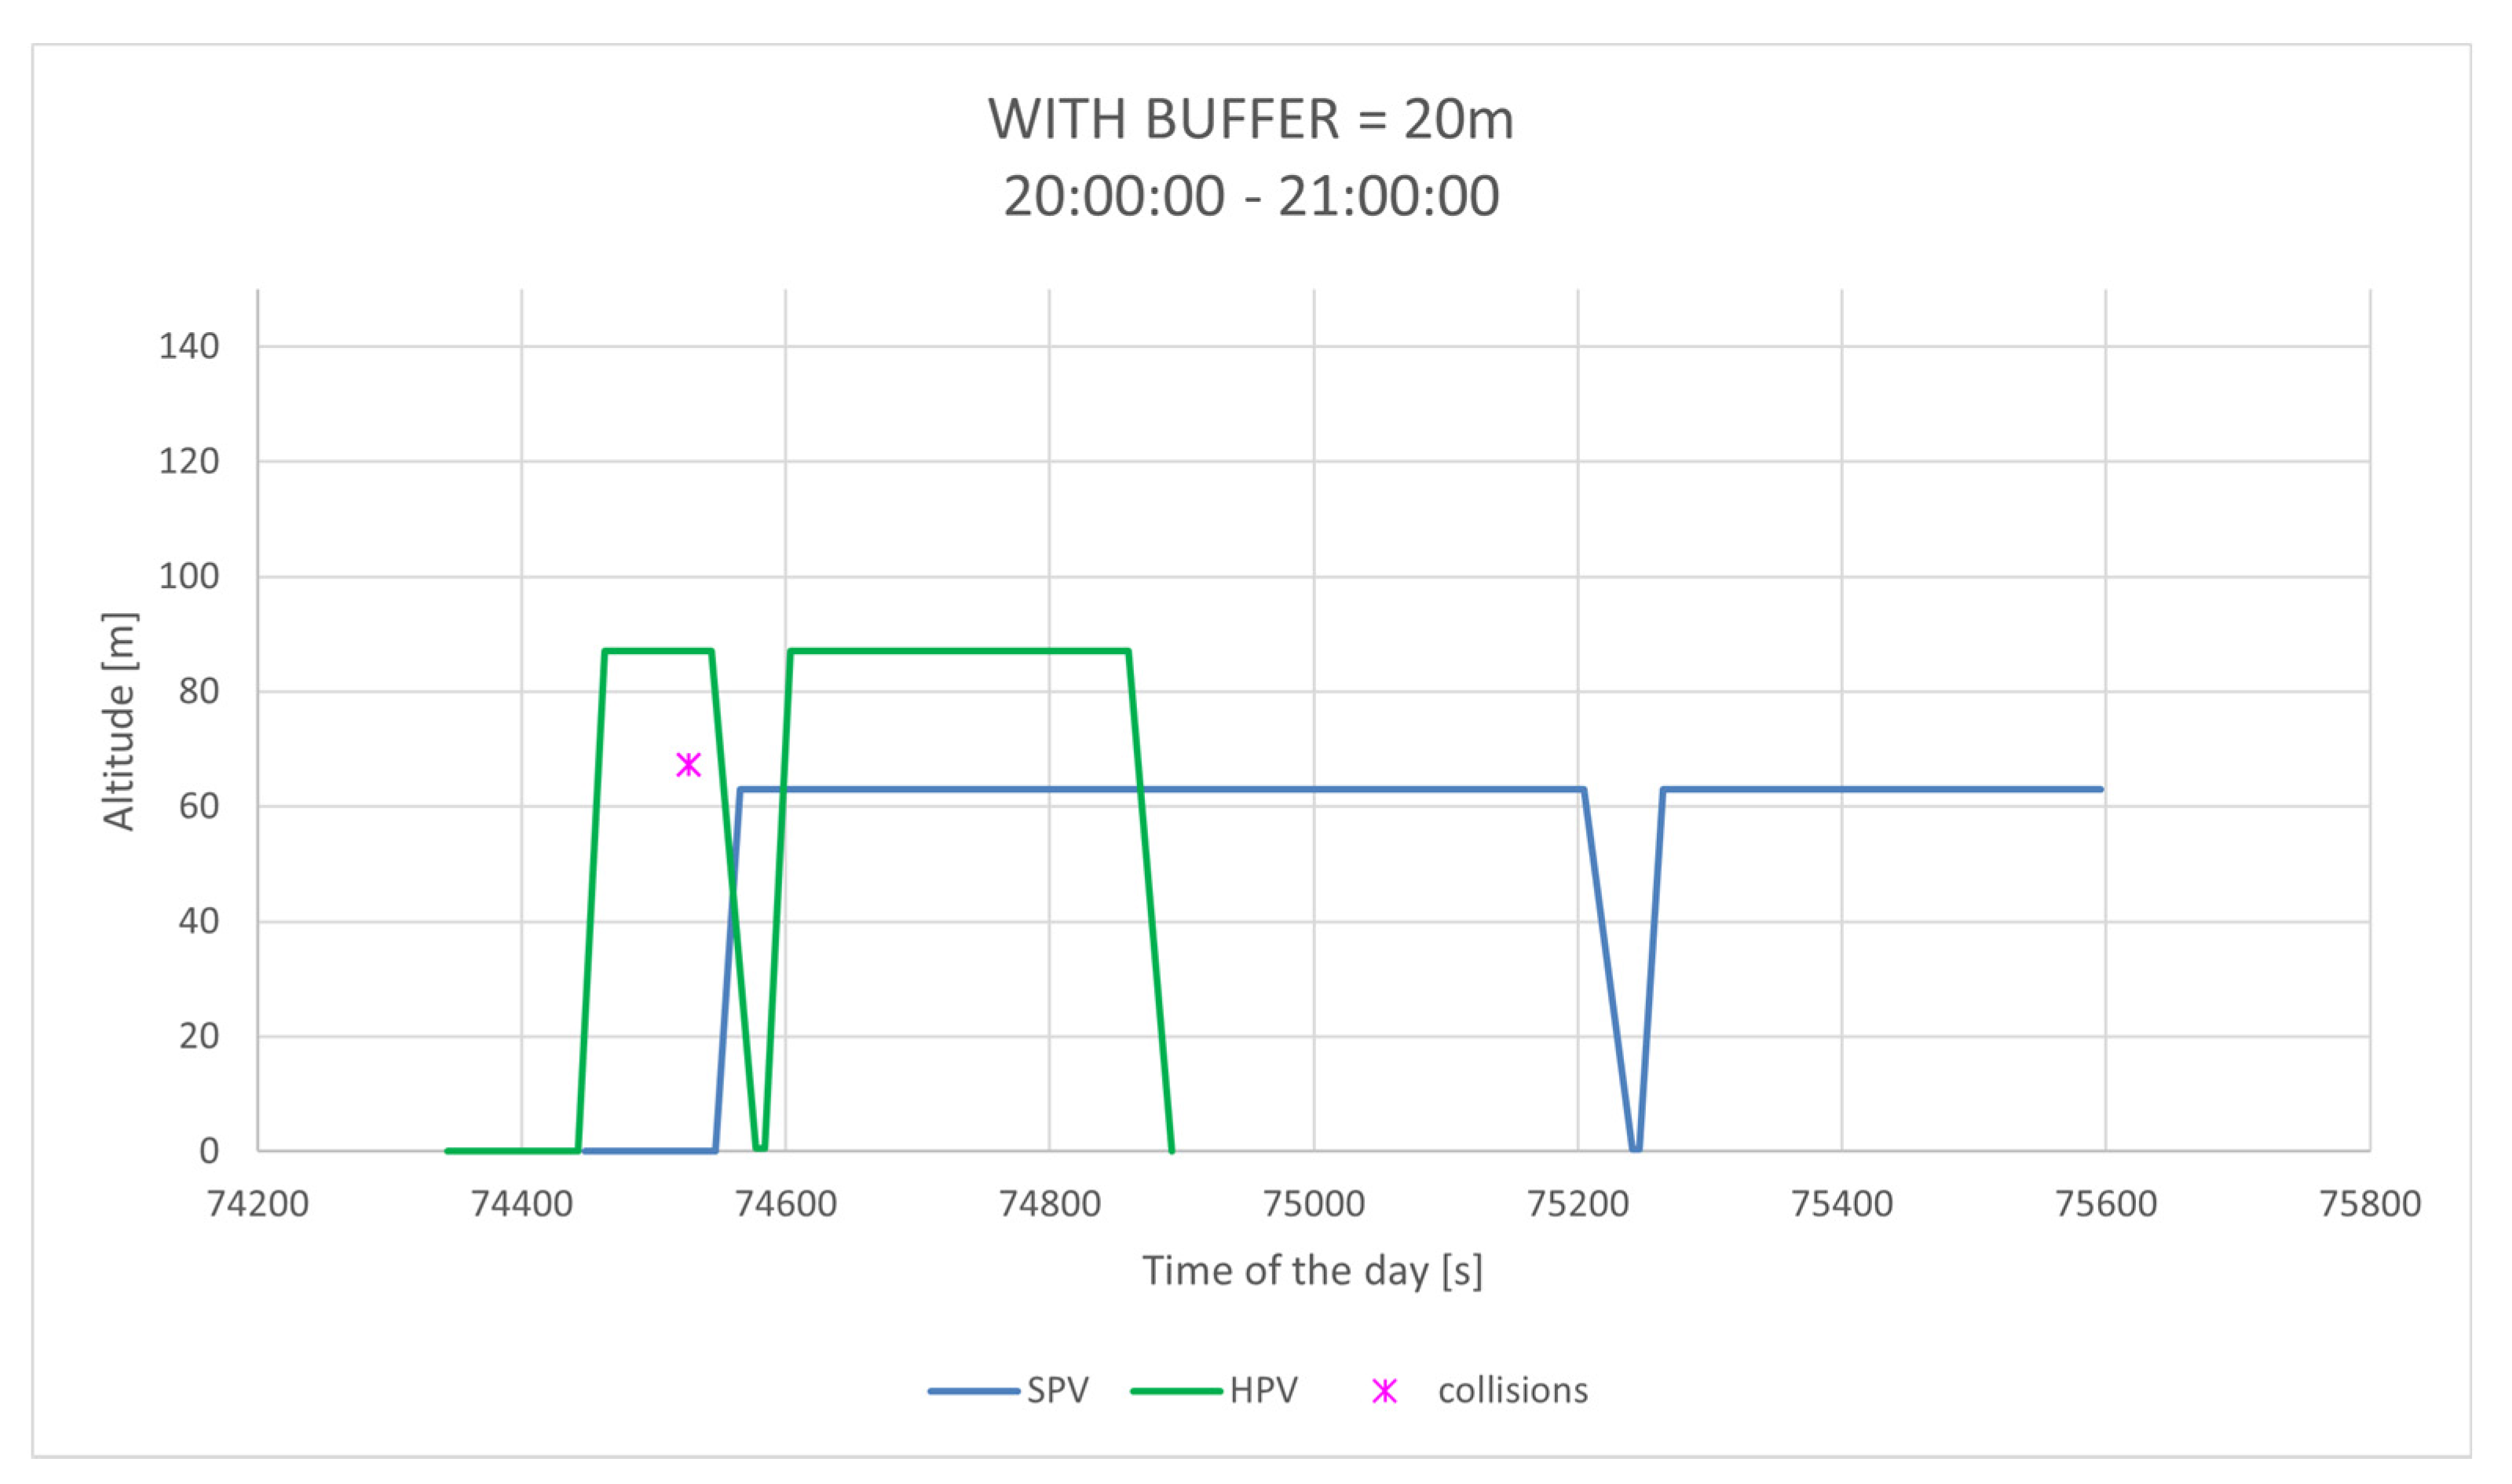
  • Buffer 20 m: HPVs and SPVs are separated into layers with a buffer of 20 m between them (HPVs fly above 85 m and SPVs below 65 m);
In each of these scenarios, the set of trajectories proposed in DACUS D4.2 [31] are taken as a reference, but the cruise altitudes are modified to random distributions within the height levels assigned to each type of UAS (HPV and SPV). This set of trajectories comprise 24 h with a total of 6372 drones flying and was simulated 5000 times for each scenario, which corresponds to a total of 300,000 simulated hours of flight.
The collision risk per flight hour calculated is compared to determine if it is below the proposed TLS or not, in which case, the airspace structure analysed in the scenario would not be considered safe enough. The nominal trajectories were not strategically deconflicted between one another, relying only on the airspace structure (layers and buffers) to keep the collision risk conveniently low.
The results for the different scenarios are presented hereafter.

5.1. Without Layers

In this scenario, HPVs and SPVs will not be segregated, operating simultaneously in the same volume of airspace even during the cruise phase of the flights. Figure 3 represents a set of these trajectories, considering different types of SPVs (categories 0, 1 and 2, which correspond to a small photography drone, an inspection drone and a delivery drone, respectively) and HPVs (category 5). It is worth noting that although the trajectories shown include the whole flight trajectory, from landing to take off, the analysis was developed only for the cruise phase.
The distribution of heights for HPVs and SPVs is shown in Figure 4.
The results of the simulations developed in this scenario are shown in Table 3, which shows an average fatality risk of 6.99 × 10⁻⁵ and peaks up to 1.54 × 10⁻⁴, far above the requested TLS. Accordingly, this airspace structure cannot be considered safe enough for air taxi operations with the levels of demand analysed in this paper.
The number of collisions is very high, as the HPVs and SPVs are not separated in their cruise phases. Figure 5 presents the nominal trajectories of HPVs and SPVs that would collide in a certain time frame, along the time of the day in seconds, as well as the heights of the collisions in the simulations. It can be seen that collisions are frequent and could occur at any height.

5.2. With Layers

In this scenario, HPVs and SPVs will be segregated into layers in the cruise phase, but without a buffer between them. Figure 6 represents a set of these trajectories.
The distribution of heights for HPVs and SPVs is shown in Figure 7.
The results of the simulations developed in this scenario are shown in Table 4, which shows an average fatality risk of 9.21 × 10⁻⁶ and peaks up to 4.59 × 10⁻⁵, which is slightly worse in average than the requested TLS. Therefore, this airspace structure cannot be accepted without an adequate buffer to reduce the risk of collision.
The number of collisions is less than a 15% compared to the scenario without layers. Figure 8 presents the nominal trajectories of HPVs and SPVs that would collide in a certain time frame, along the time of the day in seconds, as well as the heights of the collisions in the simulations. It can be seen that collisions would only happen close to a height of 75 m, but they would be still routinary to some extent.

5.3. Buffer 5 m

In this scenario, HPVs and SPVs will be segregated into layers in the cruise phase, with a buffer of 5 m between these layers. Figure 9 represents a set of these trajectories.
The distribution of heights for HPVs and SPVs is shown in Figure 10.
The results of the simulations developed in this scenario are shown in Table 5, which shows an average fatality risk of 3.09 × 10⁻⁶ and a peak of 9.47 × 10⁻⁶, which is below the requested TLS in average, but not during the peak hour. This airspace structure can be considered acceptable, as a peak value above the TLS is only reached in three timeframes; however, a greater buffer can be considered desirable.
The number of collisions is less than a 4.5% compared to the scenario without layers. Figure 11 presents the nominal trajectories of HPVs and SPVs that would collide in a certain time frame, along the time of the day in seconds, as well as the heights of the collisions in the simulations. It can be seen that collisions are very rare and would only happen close to a height of 75 m.

5.4. Buffer 10 m

In this scenario, HPVs and SPVs will be segregated into layers in the cruise phase, with a buffer of 10 m between these layers. Figure 12 represents a set of these trajectories.
The distribution of heights for HPVs and SPVs is shown in Figure 13.
The results of the simulations developed in this scenario are shown in Table 6, which shows an average fatality risk of 1.38 × 10⁻⁶ and a peak of 7.87 × 10⁻⁶, which is below the requested TLS both in average and in all the timeframes, except for the peak hour, which can be considered an outlier. This airspace structure can be considered acceptable.
The number of collisions is less than 2% compared to the scenario without layers. Figure 14 presents the nominal trajectories of HPVs and SPVs that would collide in a certain time frame, along the time of the day in seconds, as well as the heights of the collisions in the simulations. It can be seen that collisions are very rare and would only happen close to a height of 75 m.

5.5. Buffer 20 m

In this scenario, HPVs and SPVs will be segregated into layers in the cruise phase, with a buffer of 20 m between these layers. Figure 15 represents a set of these trajectories.
The distribution of heights for HPVs and SPVs is shown in Figure 16.
The results of the simulations developed in this scenario are shown in Table 7, which shows an average fatality risk of 1.1 × 10⁻⁷ and a peak of 1.62 × 10⁻⁶, which is below the requested TLS both in average and in peak hour. This airspace structure can be considered acceptable, as the likelihood of collision is negligible.
The number of collisions is less than a 0.2% compared to the scenario without layers. Figure 17 presents the nominal trajectories of HPVs and SPVs that would collide in a certain time frame, along the time of the day in seconds, as well as the heights of the collisions in the simulations. It can be seen that collisions are very rare and would only happen close to a height of 75 m.

5.6. Summary of Results

The Figure 18 and Figure 19 show, respectively, the probability of collisions between sUAS and air taxis at different times of day for the five different airspace structures considered, and the mean of the collision probability at different times of day. As discussed, the layered structure with a buffer of 10 m would provide a safety level that meets the requirements for air taxi operations in the cruise phase.

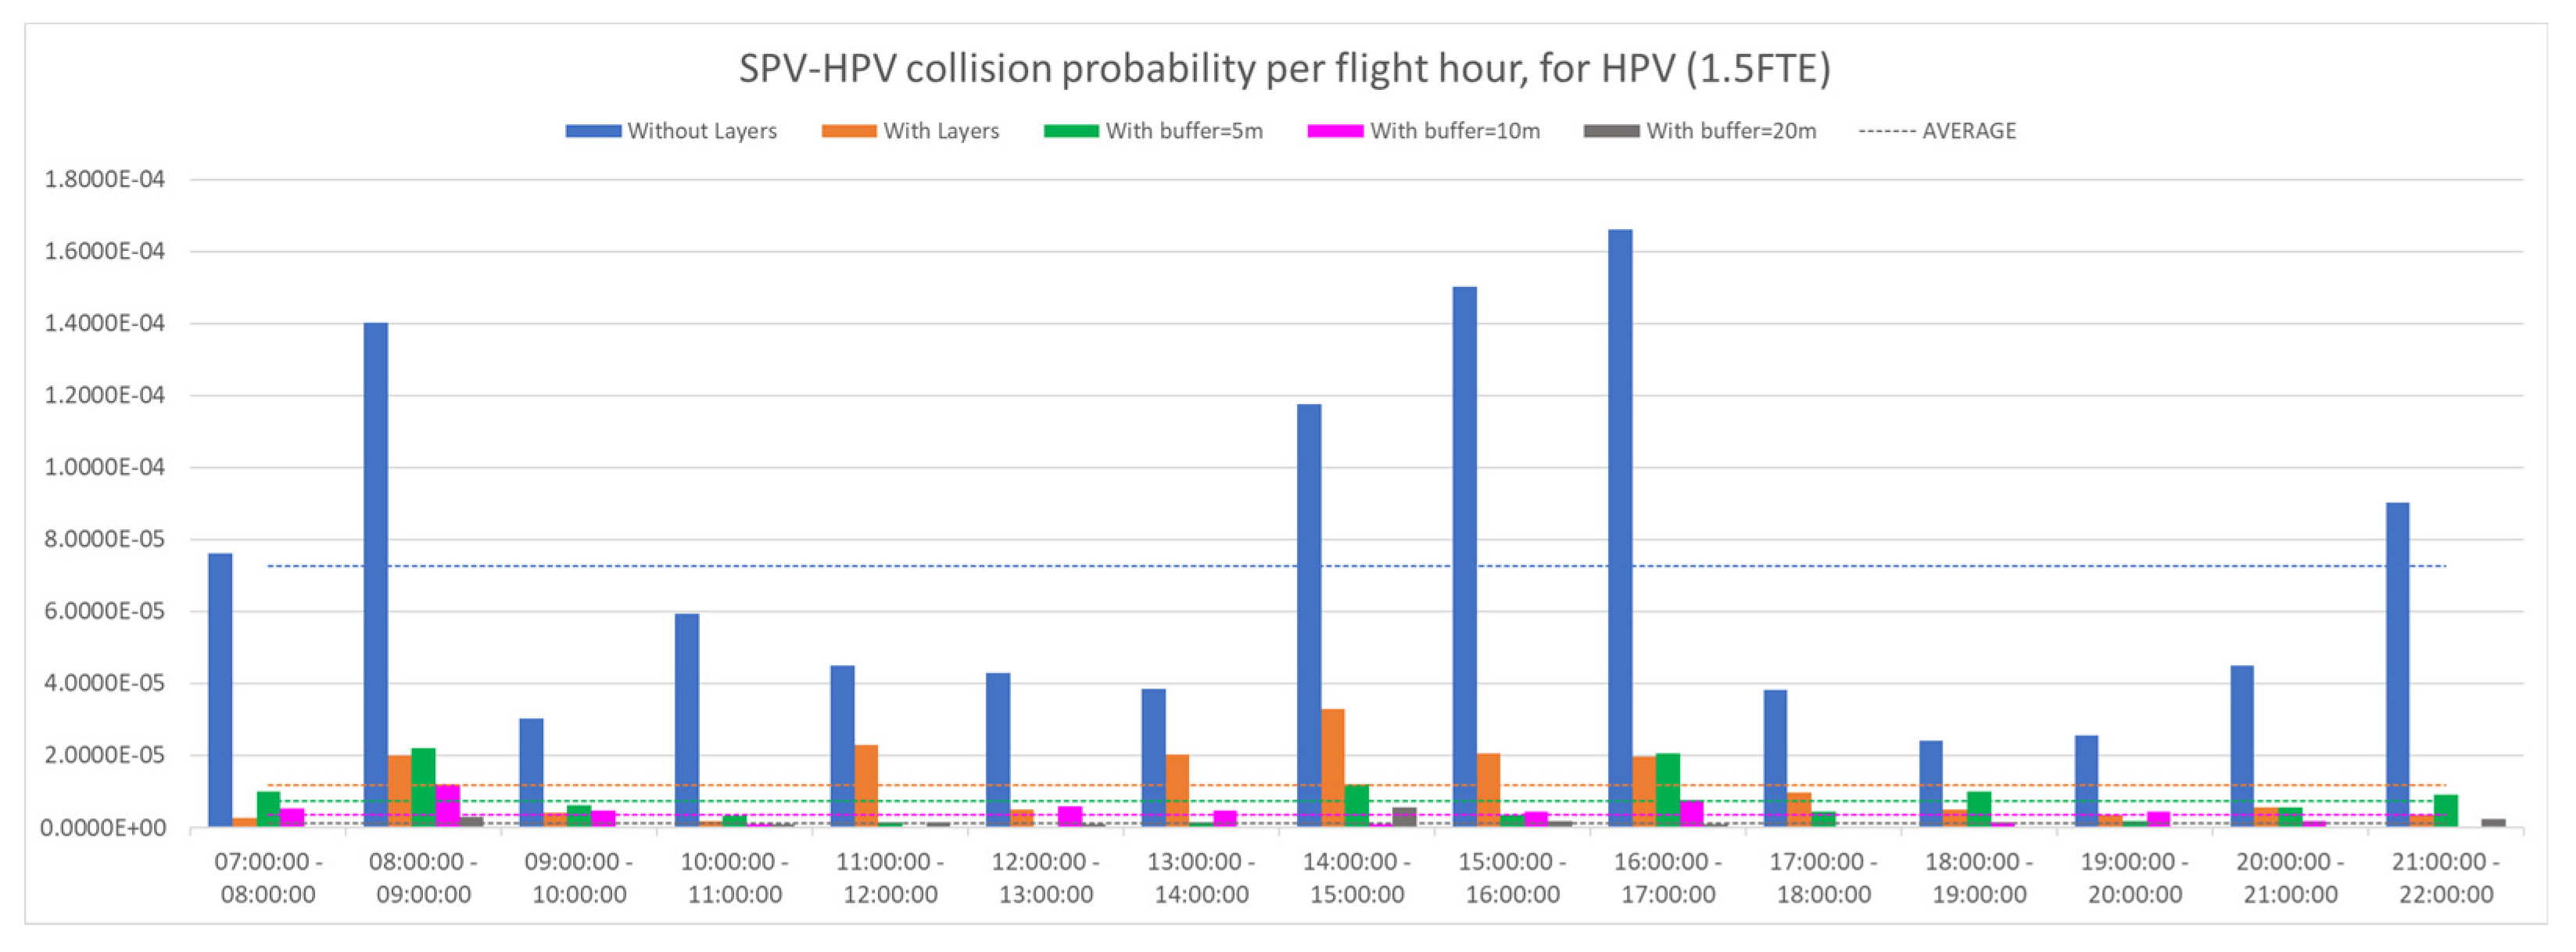
5.7. Sensitivity of Results with Regard to FTE

The results shown in the previous paragraphs depend on the vertical errors of the aircraft, i.e., NSE and FTE. GNSS performance is measured continuously by Service Providers and GNSS receivers are used routinely, with their specifications being well consolidated; accordingly, no great variations in NSE values can be expected. However, with regard to the FTE of UAS and particularly eVTOL, there are still very few data and literature available, so the values proposed must be confirmed in the future. Therefore, in order to understand the impact of a greater FTE, a new set of simulations were run, considering FTE values 50% greater than those presented in Table 2. The Figure 20 and Figure 21 show, respectively, the probability of collisions between sUAS and air taxis and the mean of the collision probability, obtained with such FTE values.
The results obtained show similar collision probability values for the cases of an airspace structure without layers and the case of layers without buffers; however, for the case of a 5 m buffer, the average collision probability is almost two times that with the nominal FTE and in the case of a 10 m buffer, almost three times the previous collision probability. For the 20 m buffer, the collision probability is ten times greater. However, even with such FTE values, the collision probability would be lower than the TLS for the layers with a 10 m buffer, although a buffer of 20 m would be preferable.

6. Discussion

The proposed airspace structure, based on layers in the VLL separating HPV from SPV, has been found to be feasible, reaching a safety risk below the defined TLS if a minimum buffer of 5 m, and preferably 10 m, among layers is introduced. Considering only the mean collision risk, separating the airspace into two layers considerably reduces the probability of collisions between sUAS and air taxis; the collision probability is 7.5 times smaller with layers than without layers. Adding a buffer within the layers reduces the probability of collisions 25 times with a buffer of 5 m, 50 times with a buffer of 10 m and up to 625 times with a buffer of 20 m.
The results obtained, however, are dependent on the vertical errors and, particularly, on the FTE. The sensitivity analysis developed shows that for FTE values 50% greater, a layered structure with a buffer of 10 m would still be acceptable, although a 20 m buffer would be preferable.
It is important to remark, anyhow, that these collision risk figures were obtained for trajectories which have not been strategically deconflicted between one another; therefore, as these operations are expected to be developed with support by U-space services, lower collision risks can be expected with a Strategic Conflict Resolution service in place.
Additionally, it is also important to consider that the collision risks were calculated dividing only into the HPV flying time (in cruise phase), whereas the risk also depends on the total flying time of SPVs. If we consider the total UAS flight time (both HPVs and SPVs), collision risks would have been 27.5 times lower.
In summary, the proposed airspace structure based on layers with a buffer of 10 m among them would meet the required safety levels for air taxi operations in the cruise phase. Therefore, as exhaustive analysis of urban airspace design initiatives shows that less structured airspace, such as the Free-Routes supported by the layered structure, allows for greater capacity and route efficiency [19] than restrictive structures, such as tubes and lanes, it can be concluded that the proposed airspace structure would be much more adequate to meet the requirements of Urban Air Mobility than the traditional approach based on corridors, especially when the demand for air taxis starts to grow as expected in big metropolises.

Other Considerations

Even though the two main goals necessary for sustainable air mobility services’ demand are met, i.e., high safety levels and efficient operations to provide time savings in congested urban areas, the proposed air space structure will not be feasible if the operations developed within it are not socially acceptable. Community acceptance will depend on an acceptable drones’ path separation from citizens to limit visual pollution, privacy concerns and, above all, noise annoyance.
With regard to noise, although electric engines create significantly lower noise than a helicopter engine, the propellers cause annoying high-frequency sounds; therefore, noise exposure should be controlled by means of appropriated route distance from residential areas. The Uber Elevate WhitePaper [51] considered that a reasonable goal would be a noise level below 67 dBA at ground level from an eVTOL at 250 ft altitude, which would be comparable to a Prius at 25 feet from the listener, driving by at 35 mph. This noise level is achievable by eVTOL. For example, Joby S4 was tested by NASA, recording 45.2 dBA on the ground when the aircraft flew at 500 m altitude at 185 kph [52]. As propeller sound decreases by about 6 dB with every doubling of distance from the source, this is equivalent to 61.5 dBA at 75 m (250 m) above the ground; this is the sound level of a normal conversation [53,54].
Ultimately, an eVTOL flying at 50 m will make much less noise than a helicopter flying at 500 m, which should favour their social acceptance, even flying in the VLL. During takeoff, eVTOL are also more than 100 times quieter than a helicopter: 65 dBA vs. 93 dBA.
On the other hand, technology will also have a word on the design of the airspace structure, especially battery life. The endurance of a battery imposes severe constraints on the operational time of an electric UAM aircraft, so trajectories will have to be carefully designed to minimise energy consumption. Energy efficiency drops with cruise altitude, so flying at lower altitudes and shallower descents is preferable. This is another advantage of the layered airspace structure compared to corridors, which would demand greater cruise altitudes.
Therefore, considering the analysis carried out and the two potential constraints described in the above paragraphs (impact of noise and technology limitations), we conclude that the layered approach defined in the AMU-LED project is feasible for medium demand scenarios while holding safety and efficiency levels to a sufficiently high standard.

Author Contributions

Conceptualization, V.G., A.F., E.V. and M.T.; methodology, V.G.; software, V.G. and I.B.; validation, V.G. and I.B.; formal analysis, Y.X., P.M.-P., J.P.-C. and L.P.S.; data curation, I.B.; writing—original draft preparation, V.G. and I.B.; writing—review and editing, A.F., E.V., M.T., Y.X., P.M.-P., J.P.-C. and L.P.S. All authors have read and agreed to the published version of the manuscript.

Funding

This work has been funded by the SESAR Joint Undertaking, a body of the European Commission, under Grant H2020-SESAR-2020-1 101017702.

Data Availability Statement

The traffic data samples and the results shown in Section 5 can be found in https://github.com/vgordo/AMULED_layers, accessed on 15 May 2023.

Acknowledgments

This paper uses data provided by the DACUS consortium. We want to thank them for their contribution.

Conflicts of Interest

The authors declare no conflict of interest. The funders had no role in the design of the study; in the collection, analyses, or interpretation of data; in the writing of the manuscript; or in the decision to publish the results.

References

  1. Rothfeld, R.; Straubinger, A.; Fu, M.; Al Haddad, C.; Antoniou, C. Chapter 13—Urban air mobility. In Demand for Emerging Transportation Systems, 1st ed.; Antoniou, C., Efthymiou, D., Chaniotakis, E., Eds.; Elsevier: Amsterdam, The Netherlands, 2020; pp. 267–284. [Google Scholar] [CrossRef]
  2. Marzouk, O.A. Urban air mobility and flying cars: Overview, examples, prospects, drawbacks, and solutions. Open Eng. 2022, 12, 662–679. [Google Scholar] [CrossRef]
  3. Reich, C.; Goyal, R.; Cohen, A.; Serrao, J.; Kimmel, S.; Fernando, C.; Shaheen, S. Urban Air Mobility Market Study; National Aeronautics and Space Administration: Washington, DC, USA, 2018; pp. 1–163. Available online: https://ntrs.nasa.gov/citations/20190001472 (accessed on 22 January 2023).
  4. Grandl, G.; Ostgathe, M.; Cachay, J.; Doppler, S.; Salib, J.; Ross, H. The Future of Vertical Mobility: Sizing the Market for Passenger, Inspection, and Goods Services Until 2035; Porsche Consulting: Stuttgart, Germany, 2018; pp. 1–36. Available online: https://www.porsche-consulting.com/fileadmin/docs/04_Medien/Publikationen/TT1371_The_Future_of_Vertical_Mobility/The_Future_of_Vertical_Mobility_A_Porsche_Consulting_study__C_2018.pdf (accessed on 22 January 2023).
  5. Roland Berger. Urban Air Mobility: The Rise of a New Mode of Transportation. 2018. Available online: https://www.rolandberger.com/en/Insights/Publications/Passenger-drones-ready-for-take-off.html (accessed on 22 January 2023).
  6. Brown, C.; Henig, E.; Anderson, J.; Wilkowski, M.; Taylor, J.; Labib, N.; Taspinar, O.; Reut-Gelbart, M. Passenger Use Cases in the Advanced Air Mobility Revolution; KPMG International: Dublin, Ireland, 2022; pp. 1–23. Available online: https://kpmg.com/ie/en/home/insights/2022/04/advanced-air-mobility-revolution-aviation.html (accessed on 22 January 2023).
  7. Goyal, R.; Reiche, C.; Fernando, C.; Cohen, A. Advanced Air Mobility: Demand Analysis and Market Potential of the Airport Shuttle and Air Taxi Markets. Sustainability 2021, 13, 7421. [Google Scholar] [CrossRef]
  8. Ahmed, S.S.; Fountas, G.; Eker, U.; Still, S.E.; Anastasopoulos, P.C. An exploratory empirical analysis of willingness to hire and pay for flying taxis and shared flying car services. J. Air Transp. Manag. 2021, 90, 3–13. [Google Scholar] [CrossRef]
  9. Al Haddad, C.; Chaniotakis, E.; Straubinger, A.; Plötner, K.; Antoniou, C. Factors affecting the adoption and use of urban air mobility. Transp. Res. Part A Policy Pract. 2020, 132, 696–712. [Google Scholar] [CrossRef]
  10. Kim, N.; Yoon, Y. Regionalization for urban air mobility application with analyses of 3D urban space and geodemography in San Francisco and New York. Procedia Comput. Sci. 2021, 184, 388–395. [Google Scholar] [CrossRef]
  11. EU. Commission Implementing Regulation (EU) 2019/947 of 24 May 2019 on the Rules and Procedures for the Operation of Unmanned Aircraft. OJ L 152; 11 June 2019. Available online: https://eur-lex.europa.eu/legal-content/EN/TXT/?uri=CELEX%3A32019R0947&qid=1653918578552 (accessed on 22 January 2023).
  12. EASA. Terms of Reference for Rule Making Task 0230: Introduction of a Regulatory Framework for the Operation of Unmanned Aircraft Systems and for Urban Air Mobility in the European Union Aviation System. 2021. Available online: https://www.easa.europa.eu/en/document-library/terms-of-reference-and-rulemaking-group-compositions/tor-rmt0230 (accessed on 5 February 2023).
  13. EASA. NPA 2022-06: Introduction of a Regulatory Framework for the Operation of Drones—Enabling Innovative Air Mobility with Manned VTOL-Capable Aircraft, the IAW of UAS Subject to Certification, and the CAW of Those UAS Operated in the ‘Specific’ Category. Available online: https://www.easa.europa.eu/en/document-library/notices-of-proposed-amendment/npa-2022-06 (accessed on 5 February 2023).
  14. FAA Advanced Air Mobility | Air Taxis. Available online: https://www.faa.gov/air-taxis (accessed on 5 February 2023).
  15. EASA. SC-VTOL-01: Special Condition for Small-Category VTOL Aircraft. 2019. Available online: https://www.easa.europa.eu/sites/default/files/dfu/SC-VTOL-01.pdf (accessed on 5 February 2023).
  16. ICAO. Annex 2—Rules of the Air, 10th ed.; ICAO: Montreal, QC, Canada, 2005. [Google Scholar]
  17. GAMA-IAOPA. European General Aviation Survey. 2021. Available online: https://www.generalaviation.eu/pdf/survey_20_print-v1-4.pdf (accessed on 5 February 2023).
  18. Tojal, M.; Hesselink, H.; Fransoy, A.; Ventas, E.; Gordo, V.; Xu, Y. Analysis of the definition of Urban Air Mobility—How its attributes impact on the development of the concept. Transp. Res. Procedia 2021, 59, 3–13. [Google Scholar] [CrossRef]
  19. Bauranov, A.; Rakas, J. Designing airspace for urban air mobility: A review of concepts and approaches. Prog. Aerosp. Sci. 2021, 125, 100726. [Google Scholar] [CrossRef]
  20. Barrado, C.; Boyero, M.; Brucculeri, L.; Ferrara, G.; Hately, A.; Hullah, P.; Martin-Marrero, D.; Pastor, E.; Rushton, A.P.; Volkert, A. U-Space Concept of Operations: A Key Enabler for Opening Airspace to Emerging Low-Altitude Operations. Aerospace 2020, 7, 24. [Google Scholar] [CrossRef]
  21. Pons-Prats, J.; Živojinović, T.; Kuljanin, J. On the understanding of the current status of urban air mobility development and its future prospects: Commuting in a flying vehicle as a new paradigm. Transp. Res. Part E Logist. Transp. Rev. 2022, 166, 102868. [Google Scholar] [CrossRef]
  22. FAA. Urban Air Mobility (UAM) Concept of Operations. V1.0; US Department of Transportation, Office of NextGen: Atlanta, GA, USA, 2020.
  23. Hoekstra, J.M.; Maas, J.; Tra, M.; Sunil, E. How do layered airspace design parameters affect airspace capacity and Safety? In Proceedings of the 7th International Conference on Research in Air Transportation, Philadelphia, PA, USA, 20–24 June 2016. [Google Scholar]
  24. AMU-LED Consortium. D2.2—High Level Concept of Operations for UAM; SESAR Joint Undertaking: Brussels, Belgium, 2022. [Google Scholar]
  25. EU. Commission Implementing Regulation (EU) 2021/664 of 22 April 2021 on a Regulatory Framework for the U-Space. OJ L 139. 23 April 2021. Available online: https://eur-lex.europa.eu/legal-content/EN/TXT—/?uri=CELEX%3A32021R0664 (accessed on 20 February 2023).
  26. EU. Commission Implementing Regulation (EU) 2021/666 of 22 April 2021 Amending Regulation (EU) No 923/2012 as Regards Requirements for Manned Aviation Operating in U-Space Airspace. OJ L 139. 23 April 2021. Available online: https://eur-lex.europa.eu/legal-content/EN/TXT/?uri=CELEX%3A32021R0666 (accessed on 20 February 2023).
  27. EUROCONTROL. UAS ATM Common Altitude Reference System; EUROCONTROL: Brussels, Belgium, 2018. [Google Scholar]
  28. FAA. Code of Federal Regulations, Title 14, Chapter I, Subchapter F—Part 107: Small Unmanned Aerial Systems. Available online: https://www.ecfr.gov/current/title-14/chapter-I/subchapter-F/part-107 (accessed on 10 May 2023).
  29. Janisch, D.; Gordo, V.M.; Jiménez, M.; Sánchez-Escalonilla, P. UAS Collision Risk as Part of U-space Demand and Capacity Balancing. In Proceedings of the SESAR Innovation Days, Online, 7–9 December 2021. [Google Scholar]
  30. ICAO. Doc 9689-AN/953—Manual on Airspace Planning Methodology for the Determination of Separation Minima, 1st ed.; International Civil Aviation Organization: Montreal, QC, Canada, 1998; Available online: https://www.icao.int/Meetings/anconf12/Document%20Archive/9689_cons_en.pdf (accessed on 20 February 2023).
  31. DACUS Consortium. D4.2—DACUS: Validation Test Results, KPI, and Suitability Metrics & Report; SESAR Joint Undertaking: Brussels, Belgium, 2022. [Google Scholar]
  32. ICAO. Doc 9613—Performance Based Navigation (PBN) Manual, 4th ed.; International Civil Aviation Organization: Montreal, QC, Canada, 2013. [Google Scholar]
  33. GPS. An Analysis of Global Positioning System Standard Positioning Service Performance for 2020. Available online: https://www.gps.gov/systems/gps/performance/2020-GPS-SPS-performance-analysis.pdf (accessed on 10 February 2023).
  34. Galileo. Performance Reports. Available online: https://www.gsc-europa.eu/news/galileo-performance-reports-of-q1-2022-available-for-download (accessed on 10 February 2023).
  35. NTSB. WAAS Quarterly Performance Analysis Report. Available online: https://www.nstb.tc.faa.gov/reports/2022_Q2_FAA_WAAS_PAN_Report_81_v1.0.pdf (accessed on 10 February 2023).
  36. ESSP. EGNOS Service Provision Yearly Report. Available online: https://egnos-user-support.essp-sas.eu/documents/egnos-service-provision-yearly-report-2021-2022 (accessed on 10 February 2023).
  37. Septentrio. AsteRx-iS UAS Datasheet. Available online: https://pdf.directindustry.com/pdf/septentrio/asterx-i-s-uas/183002-918468.html (accessed on 10 February 2023).
  38. U-Blox. M8P Datasheet. Available online: https://www.u-blox.com/sites/default/files/NEO-M8-FW3_DataSheet_UBX-15031086.pdf (accessed on 10 February 2023).
  39. Trimble. UAS1 Datasheet. Available online: https://assets-trimble.s3.us-west-2.amazonaws.com/wp-content/uploads/2020/09/06231141/Trimble-UAS1_DS_1219_LR.pdf (accessed on 10 February 2023).
  40. Novatel. OEM7600 Datasheet. Available online: https://hexagondownloads.blob.core.windows.net/public/Novatel/assets/Documents/Papers/OEM7600-Product-Sheet/OEM7600-Product-Sheet.pdf (accessed on 10 February 2023).
  41. Novatel. OEMStar Datasheet. Available online: https://hexagondownloads.blob.core.windows.net/public/Novatel/assets/Documents/Papers/OEMStar/OEMStar.pdf (accessed on 10 February 2023).
  42. Furuno. GN-87 Datasheet. Available online: https://furuno.ent.box.com/s/6iatb3vrpms27qqu5un9eznkqjxbc3ze (accessed on 10 February 2023).
  43. Teseo. LIV-3R Datasheet. Available online: https://www.st.com/en/positioning/teseo-liv3r.html (accessed on 10 February 2023).
  44. Geister, R.; Limmer, L.; Rippl, M.; Dautermann, T. Total system error performance of drones for an unmanned PBN concept. In Proceedings of the IEEE Integrated Communications, Navigation, Surveillance Conference (ICNS 2018), Herndon, VA, USA, 10–12 April 2018; pp. 2D4-1–2D4-9. [Google Scholar] [CrossRef]
  45. E-GNSS for Drone Operations WhitePaper, Section 4.1.1 Flight Demonstrations with EGNOS-Enabled Receivers. Available online: https://www.euspa.europa.eu/simplecount_pdf/tracker?file=uploads/drones_operations_whitepaper.pdf (accessed on 10 February 2023).
  46. Kallinen, V.; Martin, T.; McFadyen, A. Required Navigation Performance Specifications for Unmanned Aircraft Based on UTM Flight Trials. In Proceedings of the 2020 International Conference on Unmanned Aircraft Systems (ICUAS), Athens, Greece, 1–4 September 2020; pp. 196–203. [Google Scholar] [CrossRef]
  47. REALITY Consortium. REALITY: Empowering Drones with EGNOS—Final Workshop. EUSPA, October 2021. [REALITY—Empowering Drones with EGNOS]—FINAL WORKSHOP (BCN Drone Center, 2021-10-21)—YouTube. Available online: https://www.youtube.com/watch?v=rgRPLjl_108 (accessed on 20 February 2023).
  48. Lin, X.; Fulton, N.; Westcott, M. Target level of safety measures in air transportation—Review, validation and recommendations. In Proceedings of the IASTED International Conference on Modelling, Simulation, and Identification (MSI 2009), Beijing, China, 12–14 October 2009. [Google Scholar]
  49. Howard, R.W. Breaking through the 106 barrier. Aeronaut. J. 1992, 96, 260–270. [Google Scholar] [CrossRef]
  50. Hedayati, R.; Sadighi, M. Statistics. In Bird Strike: An Experimental, Theoretical and Numerical Investigation; Woodhead Publishing: Delhi, India, 2016; pp. 9–33. ISBN 9780081000939. [Google Scholar] [CrossRef]
  51. Uber Elevate. Fast-Forwarding to a Future of on-Demand Urban Air Transportation. Available online: https://evtol.news/__media/PDFs/UberElevateWhitePaperOct2016.pdf (accessed on 1 April 2023).
  52. Joby: Results of Noise Tests Show Aircraft Would Be Quiet Enough for Cities. Available online: https://aerospaceamerica.aiaa.org/joby-noise-test-results-show-aircraft-would-be-quiet-enough-for-cities/ (accessed on 1 April 2023).
  53. How Do You Measure Noise Levels? Available online: https://www.commodious.co.uk/knowledge-bank/hazards/noise/measuring-levels (accessed on 1 April 2023).
  54. Delta. Typically Noise Levels. Available online: https://eng.mst.dk/media/mst/69037/typically_noise_levels_1175.1.11.pdf (accessed on 1 April 2023).
Figure 1. AMU-LED airspace structure.
Aerospace 10 00609 g001
Figure 2. Drone traffic density in the Reference Scenario per timeframe.
Aerospace 10 00609 g002
Figure 3. Sample of HPV and SPV trajectories in the Scenario Without Layers.
Aerospace 10 00609 g003
Figure 4. HPV and SPV heights distribution in the Scenario Without Layers.
Aerospace 10 00609 g004
Figure 5. Sample of trajectories evolution along time and collisions in the Scenario Without Layers.
Aerospace 10 00609 g005
Figure 6. Sample of HPV and SPV trajectories in the Scenario With Layers.
Aerospace 10 00609 g006
Figure 7. HPV and SPV heights distribution in the Scenario With Layers.
Aerospace 10 00609 g007
Figure 8. Sample of trajectories evolution along time and collisions in the Scenario With Layers.
Aerospace 10 00609 g008
Figure 9. Sample of HPV and SPV trajectories in the Scenario Buffer 5 m.
Aerospace 10 00609 g009
Figure 10. HPV and SPV heights distribution in the Scenario Buffer 5 m.
Aerospace 10 00609 g010
Figure 11. Sample of trajectories evolution along time and collisions in the Scenario Buffer 5 m.
Aerospace 10 00609 g011
Figure 12. Sample of HPV and SPV trajectories in the Scenario Buffer 10 m.
Aerospace 10 00609 g012
Figure 13. HPV and SPV heights distribution in the Scenario Buffer 10 m.
Aerospace 10 00609 g013
Figure 14. Sample of trajectories evolution along time and collisions in the Scenario Buffer 10 m.
Aerospace 10 00609 g014
Figure 15. Sample of HPV and SPV trajectories in the Scenario Buffer 20 m.
Aerospace 10 00609 g015
Figure 16. HPV and SPV heights distribution in the Scenario Buffer 20 m.
Aerospace 10 00609 g016
Figure 17. Sample of trajectories evolution along time and collisions in the Scenario Buffer 20 m.
Aerospace 10 00609 g017
Figure 18. Air Taxi Collision risk with sUAS per timeframe for different structures.
Aerospace 10 00609 g018
Figure 19. Average Air Taxi Collision risk with sUAS for different structures.
Aerospace 10 00609 g019
Figure 20. Air Taxi Collision risk with sUAS per timeframe for different structures. 1.5FTE.
Aerospace 10 00609 g020
Figure 21. Average Air Taxi Collision risk with sUAS for different structures. 1.5FTE.
Aerospace 10 00609 g021
Table 1. Navigation System Errors considered for HPVs and SPVs (in meters).
Vehicle–ReceiverNSE_H RMS1NSE_V RMS1NSE_H 1 95%NSE_V 95%
SPV (GPS L1)1.632.553.9944.998
HPV (GPS/Galileo + SBAS)1.021.12.4992.156
1 Navigation errors are assumed to follow a normal distribution, so the 95% percentile corresponds to 2.45 times the Root Mean Square Error (RMS) for bi-dimensional distributions (Horizontal), and to 1.96 times the RMS for one-dimensional distributions (Vertical).
Table 2. Flight Technical Errors considered for HPVs and SPVs (in meters).
VehicleFTE_H 1 95%FTE_V 95%
SPV1.53.0
HPV6.57.0
1 Flight Technical Errors are also assumed to follow a normal distribution.
Table 3. Collision risk per time frame Scenario Without Layers.
Time FrameAir Taxi
Flight Time (h)
All UAS
Flight Time (h)
IterationsHPV-SPV
Collisions
Collision Risk
07:00:00–08:00:003.6779.775000736.6256 × 10−5
08:00:00–09:00:004.66166.5650002121.5172 × 10−4
09:00:00–10:00:004.84115.015000261.7900 × 10−5
10:00:00–11:00:003.9292.225000584.9311 × 10−5
11:00:00–12:00:004.2199.025000272.1388 × 10−5
12:00:00–13:00:003.8996.785000534.5417 × 10−5
13:00:00–14:00:004.77110.175000382.6553 × 10−5
14:00:00–15:00:004.14144.7750001521.2249 × 10−4
15:00:00–16:00:003.73124.7350001721.5391 × 10−4
16:00:00–17:00:003.87155.0650001721.4809 × 10−4
17:00:00–18:00:004.4599.965000614.5644 × 10−5
18:00:00–19:00:004.03104.025000443.6426 × 10−5
19:00:00–20:00:003.79100.955000332.9021 × 10−5
20:00:00–21:00:003.5694.845000484.4897 × 10−5
21:00:00–22:00:002.8894.285000981.1349 × 10−4
Average 6.9914 × 10⁻⁵
Table 4. Collision risk per time frame Scenario With Layers.
Time FrameAir Taxi
Flight Time (h)
All UAS
Flight Time (h)
IterationsHPV-SPV
Collisions
Collision Risk
07:00:00–08:00:003.6779.77500021.8152 × 10−6
08:00:00–09:00:004.66166.56500085.7254 × 10−6
09:00:00–10:00:004.84115.01500021.3769 × 10−6
10:00:00–11:00:003.9292.22500043.4008 × 10−6
11:00:00–12:00:004.2199.025000362.8517 × 10−5
12:00:00–13:00:003.8996.78500054.2846 × 10−6
13:00:00–14:00:004.77110.175000221.5373 × 10−5
14:00:00–15:00:004.14144.775000574.5935 × 10−5
15:00:00–16:00:003.73124.73500043.5793 × 10−6
16:00:00–17:00:003.87155.06500086.8877 × 10−6
17:00:00–18:00:004.4599.96500075.2379 × 10−6
18:00:00–19:00:004.03104.02500043.3114 × 10−6
19:00:00–20:00:003.79100.95500043.5178 × 10−6
20:00:00–21:00:003.5694.84500019.3535 × 10−7
21:00:00–22:00:002.8894.28500033.4741 × 10−6
Average 9.2151 × 10⁻⁶
Table 5. Collision risk per time frame Scenario Buffer 5 m.
Time FrameAir Taxi
Flight Time (h)
All UAS
Flight Time (h)
IterationsHPV-SPV
Collisions
Collision Risk
07:00:00–08:00:003.6779.77500087.2609 × 10−6
08:00:00–09:00:004.66166.56500053.5784 × 10−6
09:00:00–10:00:004.84115.01500021.3769 × 10−6
10:00:00–11:00:003.9292.22500032.5506 × 10−6
11:00:00–12:00:004.2199.02500021.5843 × 10−6
12:00:00–13:00:003.8996.78500000.0000
13:00:00–14:00:004.77110.17500021.3975 × 10−6
14:00:00–15:00:004.14144.77500064.8353 × 10−6
15:00:00–16:00:003.73124.73500018.9483 × 10−7
16:00:00–17:00:003.87155.065000119.4706 × 10−6
17:00:00–18:00:004.4599.96500021.4965 × 10−6
18:00:00–19:00:004.03104.02500054.1393 × 10−6
19:00:00–20:00:003.79100.95500032.6383 × 10−6
20:00:00–21:00:003.5694.84500019.3535 × 10−7
21:00:00–22:00:002.8894.28500055.7902 × 10−6
Average 3.0901 × 10⁻⁶
Table 6. Collision risk per time frame Scenario Buffer 10 m.
Time FrameAir Taxi
Flight Time (h)
All UAS
Flight Time (h)
IterationsHPV-SPV
Collisions
Collision Risk
07:00:00–08:00:003.6779.77500032.7228 × 10−6
08:00:00–09:00:004.66166.565000117.8724 × 10−6
09:00:00–10:00:004.84115.01500016.8844 × 10−7
10:00:00–11:00:003.9292.22500000.0000
11:00:00–12:00:004.2199.02500000.0000
12:00:00–13:00:003.8996.78500000.0000
13:00:00–14:00:004.77110.17500016.9875 × 10−7
14:00:00–15:00:004.14144.77500018.0588 × 10−7
15:00:00–16:00:003.73124.73500032.6845 × 10−6
16:00:00–17:00:003.87155.06500000.0000
17:00:00–18:00:004.4599.96500000.0000
18:00:00–19:00:004.03104.02500018.2786 × 10−7
19:00:00–20:00:003.79100.95500032.6383 × 10−6
20:00:00–21:00:003.5694.84500019.3535 × 10−7
21:00:00–22:00:002.8894.28500000.0000
Average 1.3795 × 10⁻⁶
Table 7. Collision risk per time frame Scenario Buffer 20m.
Time FrameAir Taxi
Flight Time (h)
All UAS
Flight Time (h)
IterationsHPV-SPV
Collisions
Collision Risk
07:00:00–08:00:003.6779.77500000
08:00:00–09:00:004.66166.56500000
09:00:00–10:00:004.84115.01500000
10:00:00–11:00:003.9292.22500000
11:00:00–12:00:004.2199.02500000
12:00:00–13:00:003.8996.78500000
13:00:00–14:00:004.77110.17500000
14:00:00–15:00:004.14144.77500021.61175 × 10−6
15:00:00–16:00:003.73124.73500000
16:00:00–17:00:003.87155.06500000
17:00:00–18:00:004.4599.96500000
18:00:00–19:00:004.03104.02500000
19:00:00–20:00:003.79100.95500000
20:00:00–21:00:003.5694.84500000
21:00:00–22:00:002.8894.28500000
Average 1.10361 × 10⁻⁷
Disclaimer/Publisher’s Note: The statements, opinions and data contained in all publications are solely those of the individual author(s) and contributor(s) and not of MDPI and/or the editor(s). MDPI and/or the editor(s) disclaim responsibility for any injury to people or property resulting from any ideas, methods, instructions or products referred to in the content.

