Article

An ML-Based Approach for HCF Life Prediction of Additively Manufactured AlSi10Mg Considering the Effects of Powder Size and Fatigue Damage

1
AVIC China Aero-Polytechnology Establishment, Beijing 100028, China
2
Laboratory of Quality Infrastructure Efficacy Research, AQSIQ, Beijing 100028, China
3
School of Aeronautic Science and Engineering, Beihang University, Beijing 100191, China
4
State Key Laboratory of Track Technology for High Speed Railway, Beijing 100081, China
5
Railway Engineering Research Institute, China Academy of Railway Sciences Corporation Limited, Beijing 100081, China
6
Institute of Biomechanics and Medical Engineering, Department of Engineering Mechanics, Tsinghua University, Beijing 100084, China
*
Authors to whom correspondence should be addressed.
Aerospace 2023, 10(7), 586; https://doi.org/10.3390/aerospace10070586
Submission received: 22 May 2023 / Revised: 6 June 2023 / Accepted: 25 June 2023 / Published: 27 June 2023
(This article belongs to the Special Issue State Monitoring and Health Management of Complex Equipment)

Abstract

:
As a popular technique, additive manufacturing (AM) has garnered extensive utilization in various engineering domains. Given that numerous AM metal components are exposed to fatigue loads, it is of significant importance to investigate the life prediction methodology. This study aims to investigate the high-cycle fatigue (HCF) behavior of AM AlSi10Mg, taking into account the influences of powder size and fatigue damage, and a novel ML-based approach for life prediction is presented. First, the damage-coupled constitutive model and fatigue damage model are derived, and the Particle Swarm Optimization method is employed for the material parameters’ calibration of M AlSi10Mg. Second, the numerical implementation of theoretical models is carried out via the development of a user-defined material subroutine. The predicted fatigue lives of AM AlSi10Mg with varying powder sizes fall within the triple error band, which verifies the numerical method and the calibrated material parameters. After that, the machine learning approach for HCF life prediction is presented, and the Random Forest (RF) and K-Nearest Neighbor (KNN) models are employed to predict the fatigue lives of AM AlSi10Mg. The RF model achieves a smaller MSE and a larger R2 value compared to the KNN model, signifying its superior performance in predicting the overall behavior of AM AlSi10Mg. Under the same maximum stress, a decrease in the stress ratio from 0.5 to −1 leads to a reduction in fatigue life for both powder sizes. As the powder size decreases, the rate of damage evolution accelerates, leading to shorter fatigue life.

1. Introduction

Additive manufacturing (AM), also referred to as 3D printing, is a technique that entails building three-dimensional objects through the layer-by-layer application of material [1,2]. Unlike traditional manufacturing methods that typically involve subtractive processes such as cutting or drilling, the AM process enables the creation of intricate geometries [3,4,5,6] and bespoke parts that exhibit a remarkable degree of precision and accuracy [7]. As such, the additive manufacturing technique has gained widespread acceptance in the production of metal components that find application in the engineering domain, including but not limited to aerospace, medical, automotive, and construction sectors [8]. It is important to note that many components produced using AM are subjected to fatigue loads; it is thus important to study the life prediction method of AM metals.
As one of the most commonly used metals, AlSi10Mg has several advantages as a material for additive manufacturing, including a high strength-to-weight ratio, good corrosion resistance, and excellent thermal conductivity [9,10]. However, there are also some challenges associated with additively manufacturing AlSi10Mg, including porosity, residual stress, surface roughness, and post-processing [11,12], which can have significant impacts on the mechanical properties of AM AlSi10Mg. For porosity, Laursen et al. [13] conducted a study examining the correlation between ductility and porosity in AM AlSi10Mg. The researchers discovered that while sample porosity showed some association with ultimate tensile strength, yield strength, and modulus, the most prominent relationship was observed between porosity and ductility. Pascual A. et al. [14] analyzed the influence of porosity on the mechanical properties of AlSi10Mg, and found that the porosity defects concentrated stresses and promoted the final failure driven by both void growth and coalescence. In terms of residual stress, Tridello A. et al. [15] studied the effects of residual stresses on the very-high-cycle fatigue response of SLM AlSi10Mg, and found that the impact of residual stresses on the fatigue behavior became more significant as the size of the defects increases. Sausto F. et al. [16] observed that the residual stress field altered the effective stress ratio experienced during cyclic loading, thereby influencing the fatigue characteristics of L-PBF AlSi10Mg. Regarding the surface roughness, Du Plessis et al. [17] examined the impact of as-built surface roughness on fatigue failure in L-PBF AlSi10Mg, while Leon et al. [18] analyzed the influence of surface roughness on the corrosion fatigue performance of SLM AlSi10Mg. Considering post-processing, Bagherifard S. et al. [19] found that post-processed parts had better fatigue strength compared to conventional material, and Maleki E. et al. [20] investigated the fatigue behavior of notched L-PBF AlSi10Mg specimens following thermal and mechanical surface post-processing. As mentioned above, these factors can all affect the fatigue performance of AM AlSi10Mg, making fatigue life prediction a challenge.
Many methods, including the critical plane, energy-based approach, probabilistic method, non-local approach, damage mechanics, fracture mechanics, crystal plasticity, phase field, molecular dynamics, and machine learning models, have been successfully employed in fatigue life prediction. Each method has its own characteristics and drawbacks. Luo et al. [21] utilized a notch critical plane approach to predict the multiaxial fatigue life of metallic notched specimens, while Mahtabi et al. [22] proposed a modified energy-based approach for predicting the fatigue life of super-elastic NiTi. Liao et al. [23] developed a probabilistic framework to assess the fatigue life of notched components, taking into account size effects. Gao et al. [24] proposed a non-local approach for predicting the fatigue life of notched specimens, considering stress/strain gradient and elastic–plastic fatigue damage, and Zhan Z. [25] used a damage mechanics-based approach for the fatigue life calculation of AM titanium alloy specimens. Wang H. et al. [26] employed an elastic–plastic fracture mechanics method to evaluate fatigue crack initiation size, and Cao M, et al. [27] studied fatigue response with respect to pores in AM aluminum alloys by a crystal plasticity approach. Carrara P. et al. [28] developed a variational phase-field approach to study the fatigue behavior of brittle materials. Yasbolaghi R. et al. [29] analyzed the micro-structure of crack propagation at an atomistic scale by the molecular dynamics method. Liu S. et al. [30] developed a novel ANN method to estimate the fatigue life of aluminum alloy, and Gao T. et al. [31] proposed a new defect-based fatigue model combined with an optimized ML model to predict the HCF fatigue of casting alloys. In the fields of metal fatigue analysis in additive manufacturing, empirical approaches and phenomenological fatigue theory models have made contributions, yet they still face the challenge of low accuracy in fatigue life prediction. These methods typically rely on physical mechanisms and principles, depending on idealized and simplified models, while emphasizing the importance of causal logic in the research framework. However, in practical applications, it is quite challenging to comprehensively consider the coupled effects of multivariable factors, such as scale correlation, powder material characteristics, and manufacturing process parameters, within theoretical models. Conversely, strategies based on machine learning (ML) are founded upon the interrelationships among data. Not only can they handle vast amounts of data and learn from it to make predictions, but they can also discern the coupled impacts of various complex factors on the fatigue life of additively manufactured metal materials.
In this study, the investigation delves into the high-cycle fatigue characteristics of additively manufactured AlSi10Mg, taking into account the influences of powder size and fatigue damage. Furthermore, a machine learning-based methodology is introduced for life prediction. The manuscript is structured and organized as follows. Section 1 presents the current research progress of fatigue behavior of AM AlSi10Mg and life prediction methods. In Section 2, the damage-coupled constitutive model and fatigue damage model are derived, and the Particle Swarm Optimization method is utilized for calibrating the material parameters of theoretical models for AM AlSi10Mg. In Section 3, the numerical implementation of the theoretical models is accomplished through the creation of a user-defined material subroutine. The fatigue lives of AM AlSi10Mg with various powder sizes are predicted and compared with the experimental results. In Section 4, the machine learning approach for predicting high-cycle fatigue life is introduced, utilizing the Random Forest and K-Nearest Neighbor algorithms to estimate the fatigue lives of AM AlSi10Mg. Section 5 presents the main results and discussions.

2. Theoretical Model

2.1. Damage-Coupled Constitutive Model

The definition of the damage degree D of the representative volume element (RVE) in continuum damage mechanics (CDM) [32] is defined as the ratio of the defective cross-sectional area, S D , to the total cross-sectional area, S, as follows:
D = S D S
The elastic stress–strain relationship in the presence of damage is expressed as a coupled form:
ε i j e = 1 + ν E σ i j 1 D ν E σ k k 1 D δ i j
where ε i j e is the elastic strain, E is the elastic modulus, ν is Poisson’s ratio, σ i j is the stress component, and δ i j is the Kronecker delta.
The yield function in the presence of damage, combined with the plastic flow criterion [33], can be expressed as follows:
F = σ i j 1 D α i j e q σ y
ε ˙ i j p = λ ˙ F σ i j = 3 2 λ ˙ 1 D σ i j 1 D α i j d e v σ i j 1 D α i j e q
p ˙ = 2 3 ε ˙ i j p ε ˙ i j p = λ ˙ 1 D
where ε i j p is the plastic strain, α i j is the back stress, σ y represents the yield stress, λ ˙ is the plastic multiplier, and p ˙ is the cumulative plastic strain rate. The hardening equation coupled with damage is
α i j = k = 1 K α i j k
α ˙ i j ( k ) = 1 D 2 3 C k ε ˙ i j p γ k α i j k p ˙
in which K is the number of back stress components, and C k and γ k are the material parameters.

2.2. Fatigue Damage Model

The fatigue damage evolution model for uniaxial high-cycle fatigue, as presented in reference [34], is expressed as follows:
D ˙ = d D d N f = a σ a 1 n σ m m 1 D β
where σ a represents the stress amplitude and σ m , a, β, m, and n are material parameters.
In the case of multiaxial high-cycle fatigue, the model for the evolution of fatigue damage is expressed as follows:
D ˙ = d D d N f = a σ a * 1 n σ m * m 1 D β
where σ * represents the damage equivalent stress.
σ * σ i j = σ e q 2 3 1 + ν + 3 1 2 ν σ H σ e q 2 1 2
σ a * = 1 2 σ * σ m a x σ m i n
σ m * = 1 2 σ * σ m a x + σ m i n
where σ H is the hydrostatic stress, σ e q is the equivalent stress, and ν is Poisson’s ratio. σ m a x is the maximum stress and σ m i n is the minimum stress. By performing the integration of Equation (8) from D = 0 to D = 1, we obtain the following result:
N f = 1 a 1 + β σ a 1 n σ m β
where N f is the number of loading cycles for crack initiation.

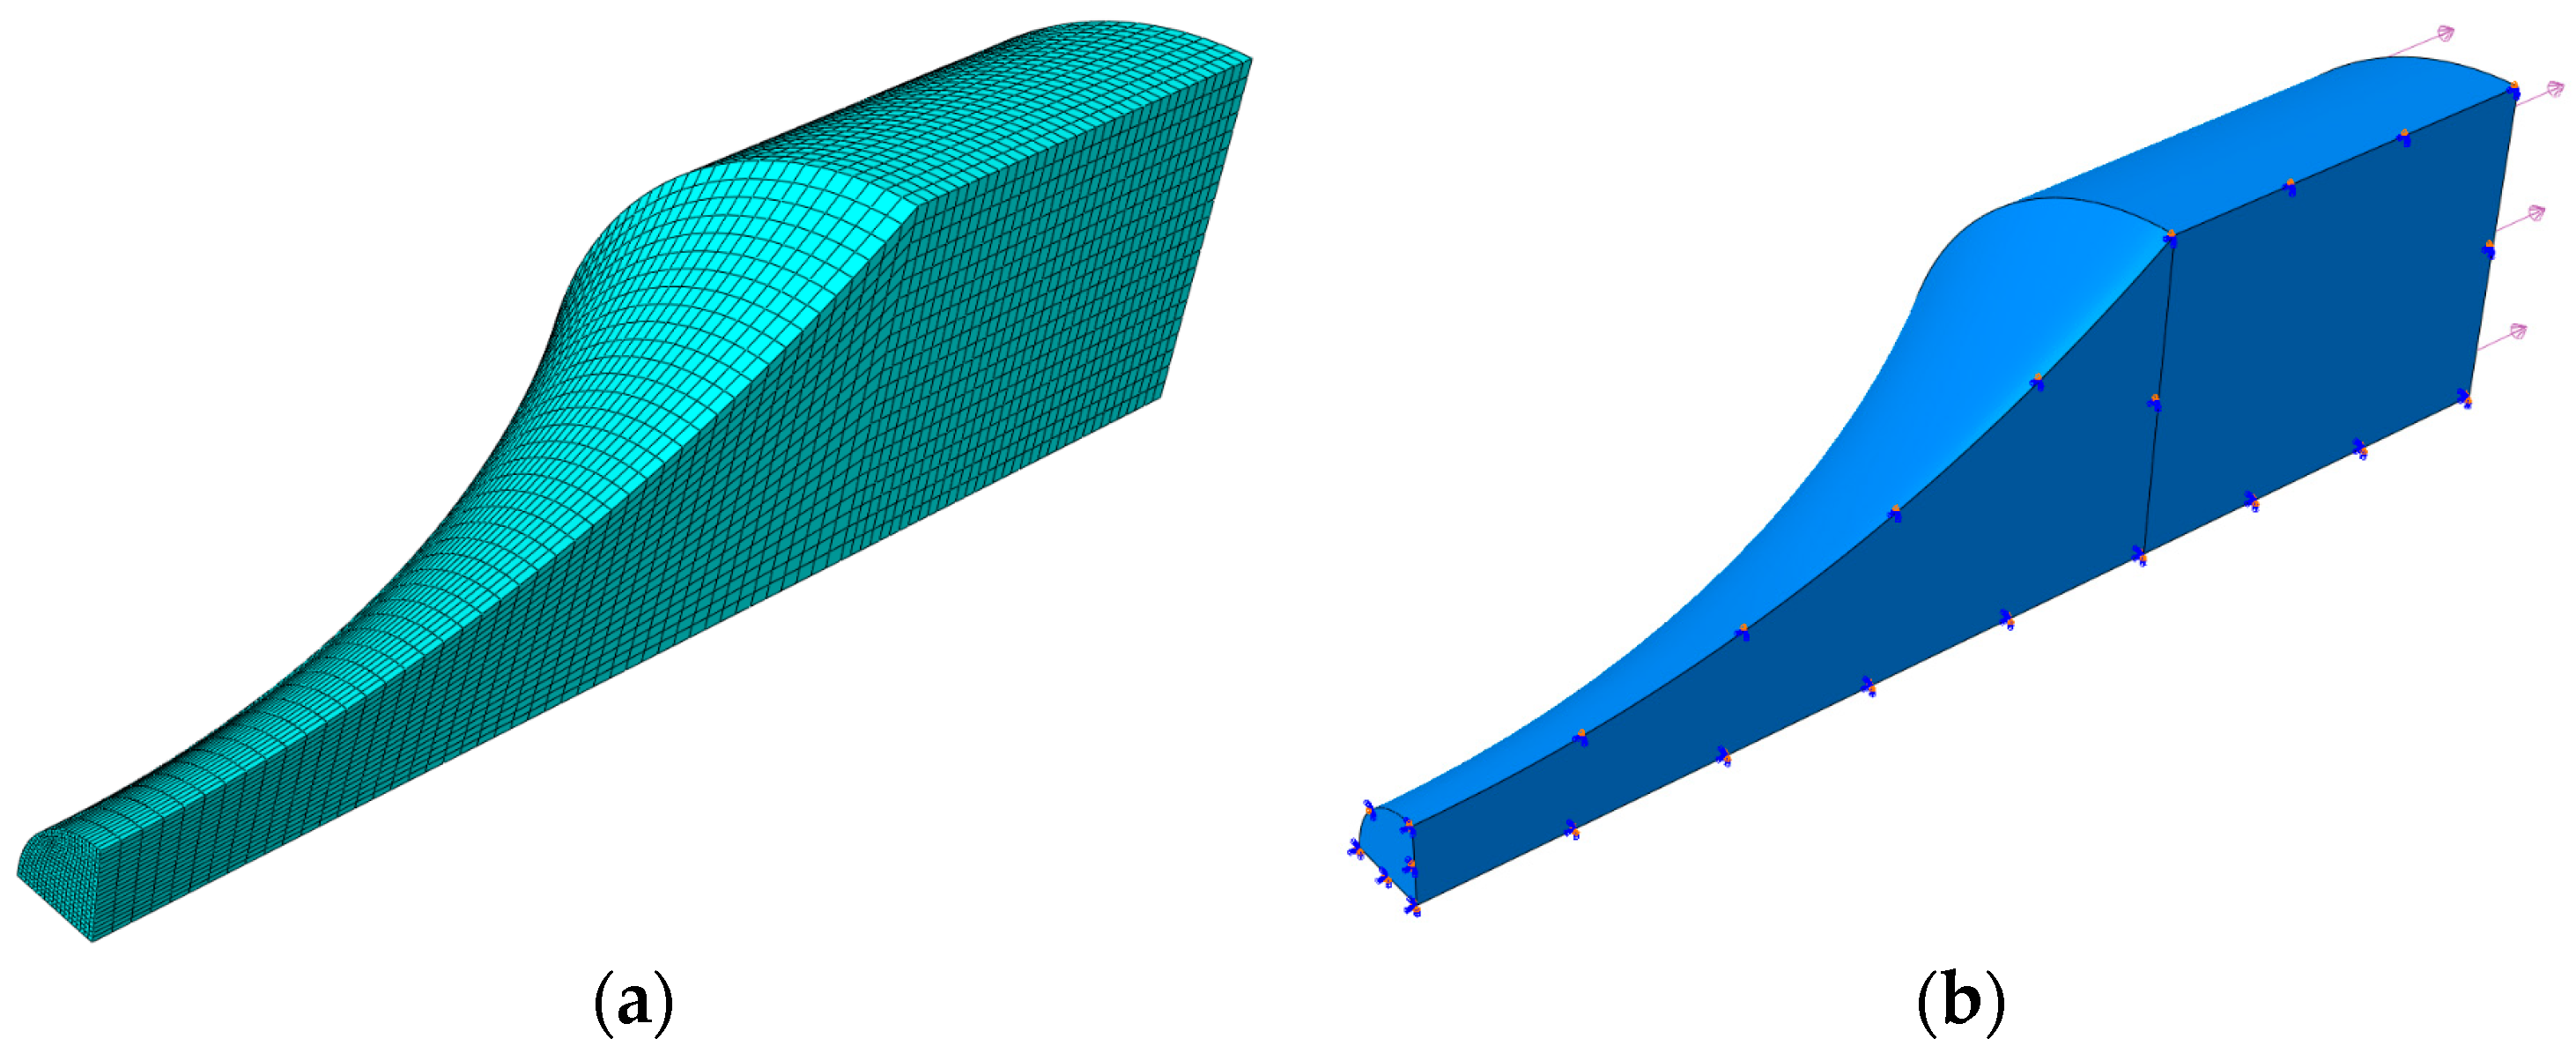
3. Numerical Simulation and Validation

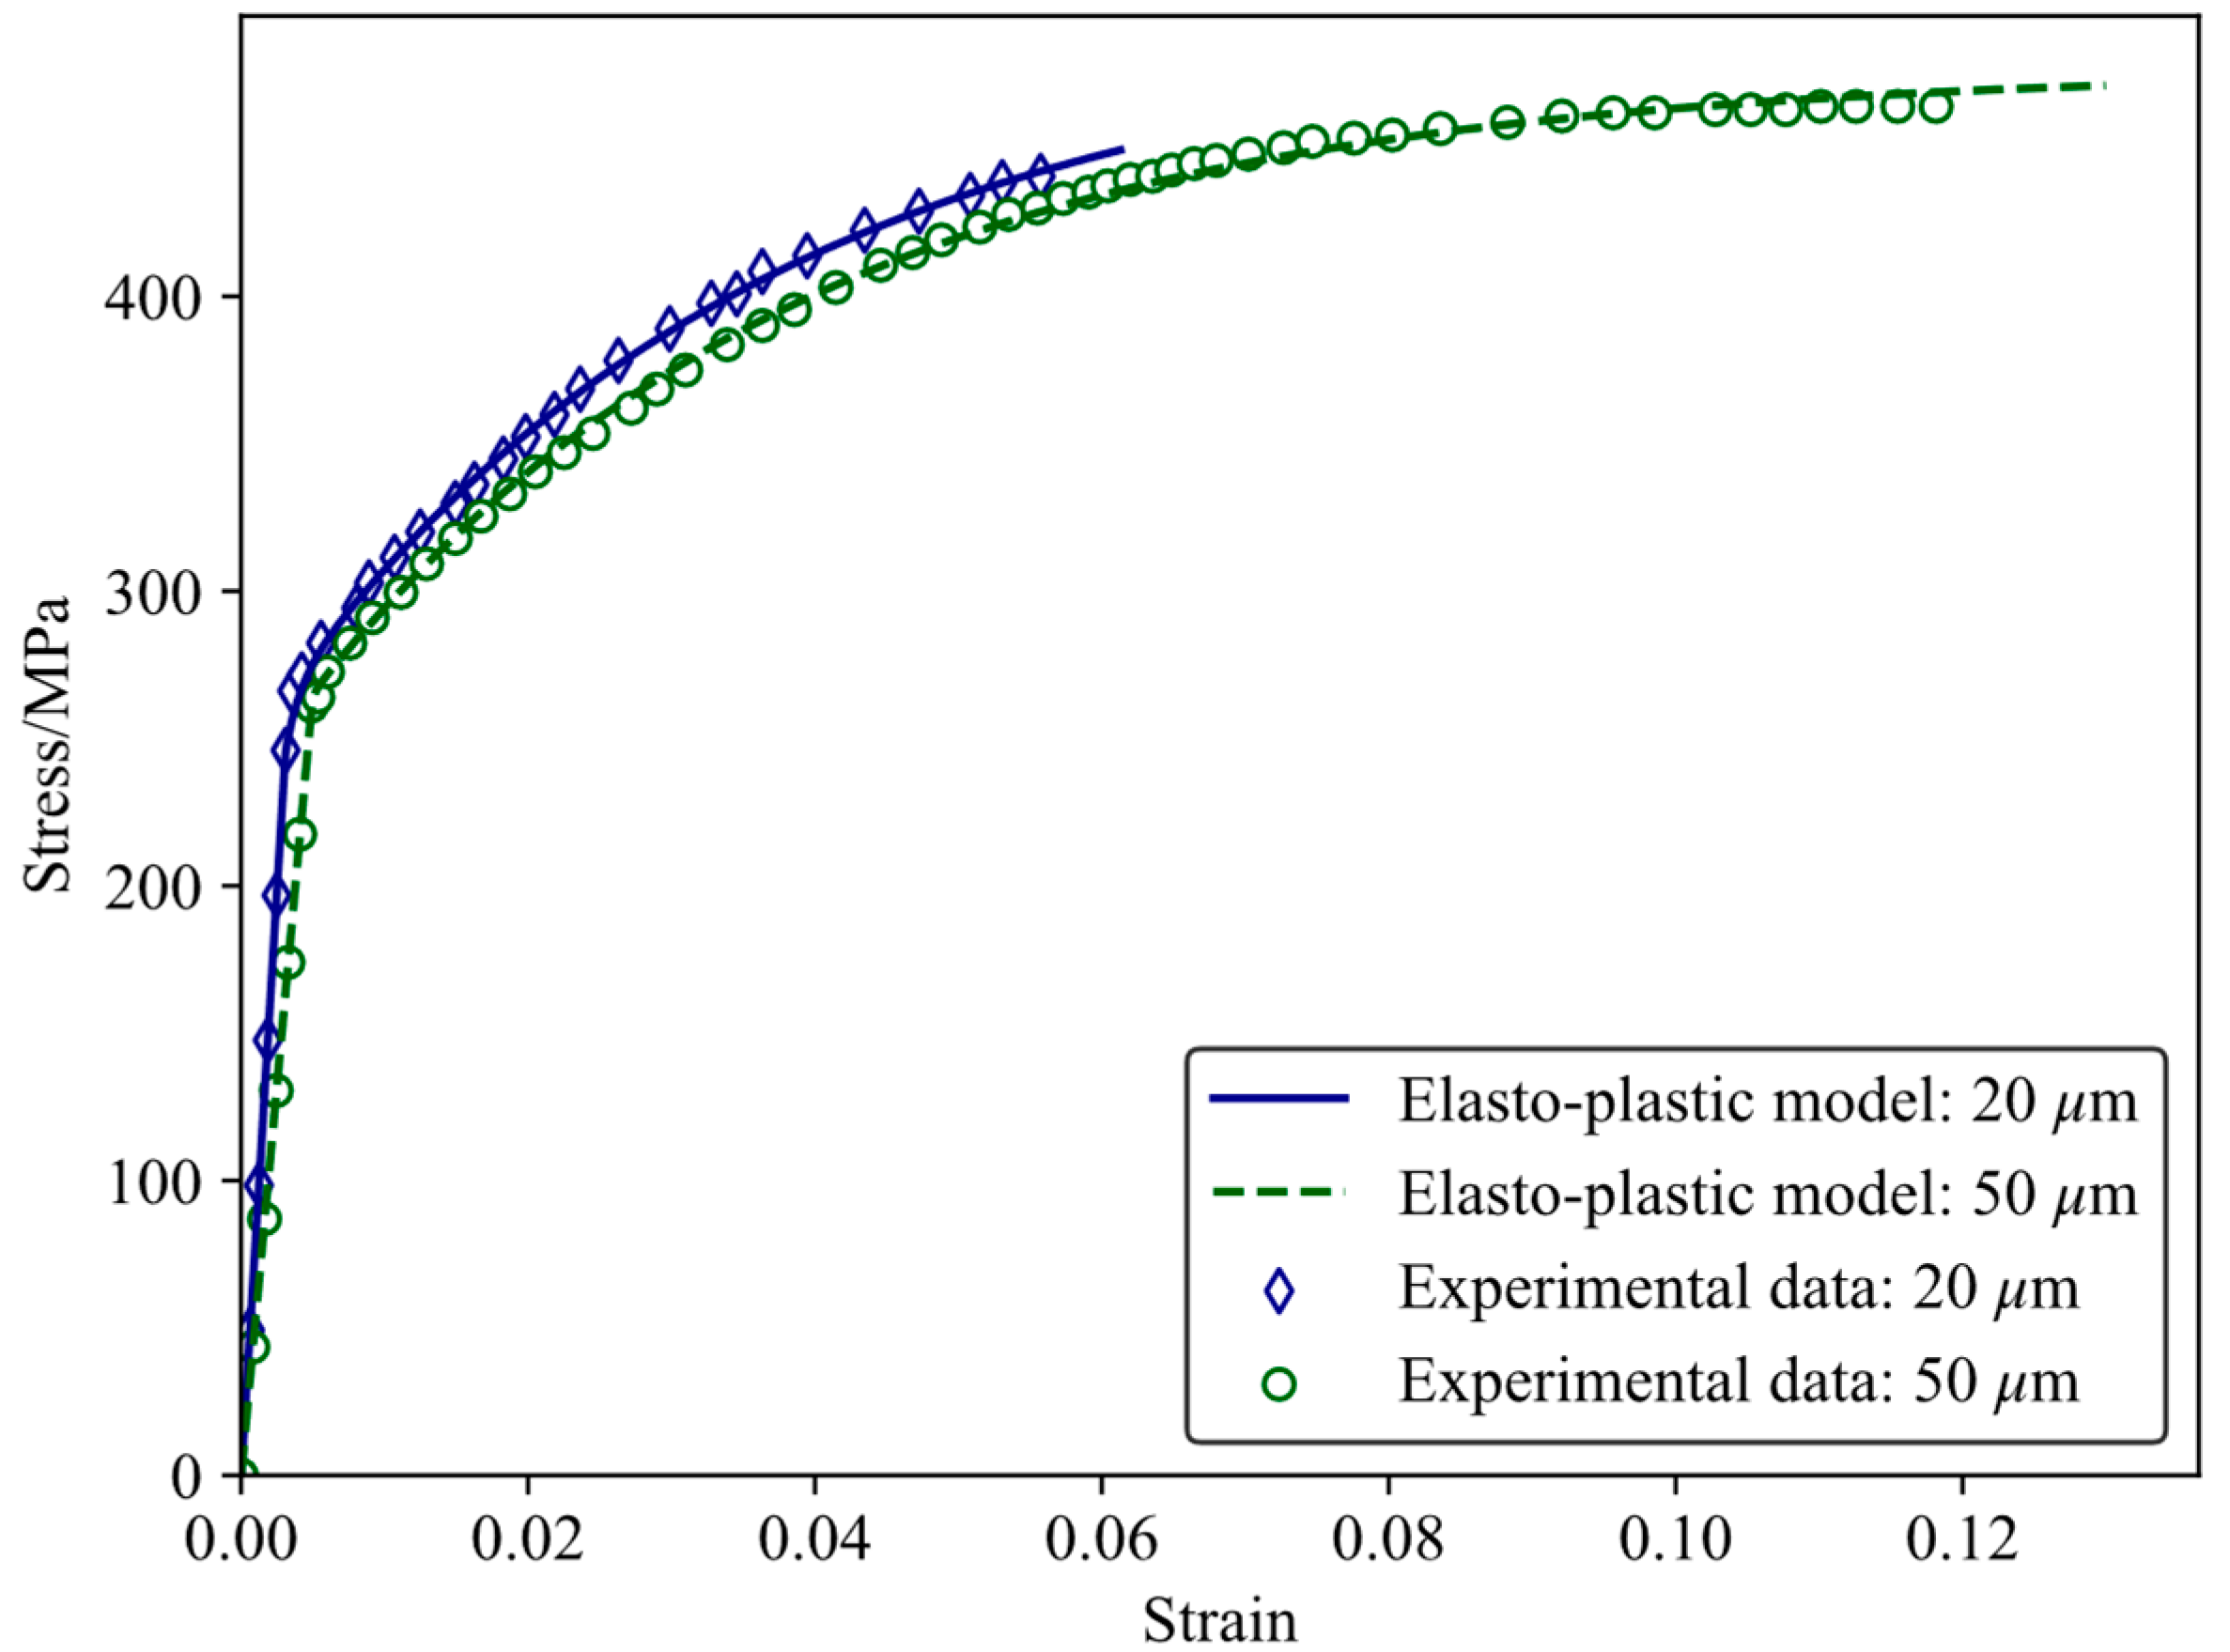
3.1. Material Parameters’ Calibration

In the theoretical models, the material parameters are calibrated using Particle Swarm Optimization (PSO) [35,36], which is a computational optimization methodology inspired by the collective behavior of swarms of animals, exemplified by the harmonious patterns exhibited by flocks of birds or schools of fish. The PSO algorithm operates by deploying an assembly of particles that traverse through a search space, with each particle representing a potential solution to an optimization problem. Each particle in the swarm is assigned a definite position and a velocity, both of which are updated at every iteration based on the particle’s own best-known position and that of its neighboring particles. The objective of the algorithm is to gradually adjust the velocities of the particles, steering them towards better solutions and ultimately obtaining the global optimum of a given objective function. The specific implementation procedure of the PSO algorithm is outlined below.
  • Initialize the swarm by generating a population of particles randomly throughout the search space.
  • Evaluate the fitness of each particle in the swarm by computing the objective function for each particle.
  • Update the velocity and position of each particle based on its own best-known position and the best-known position of its neighboring particles.
  • Assess the fitness of each particle again according to the updated position.
  • Compare the fitness of each particle with its previous best-known position and update it if the new position is better.
  • Determine the best particle in the swarm based on its fitness value.
  • Repeat steps 3 to 6 until the stopping criterion is attained and output the best solution found by the algorithm.
In this paper, the static performance parameters of AM AlSi10Mg are calibrated using uniaxial tensile stress–strain data [37] through the utilization of the aforementioned PSO method. The objective function employed during the calibration process is the sum of squares of residuals between the experimental data points and the constitutive model, which is minimized. Table 1 presents the calibrated material parameters, while Figure 1 illustrates the comparison between the stress–strain data and the fitted constitutive model. Regarding the fatigue damage evolution model, calibration is required for four material parameters, namely α, β, m, and n, based on the fatigue test data under different cyclic loads [37]. Notably, for each particle size, the parameter calibration is carried out in segments, with the fatigue life set as the boundary at 107. Table 2 displays the four material parameters acquired through this process.

3.2. Numerical Implementation of Theoretical Model

The paper employs the ABAQUS platform to execute the above theoretical models via the development of a user-defined material subroutine (UMAT) [38]. By simulating the damage evolution under cyclic loading, the fatigue life of AM AlSi10Mg with different powder sizes is calculated. The implementation process is outlined in the subsequent steps.
  • Initialize the material constitutive parameters, the parameters for the damage evolution model, and the damage itself.
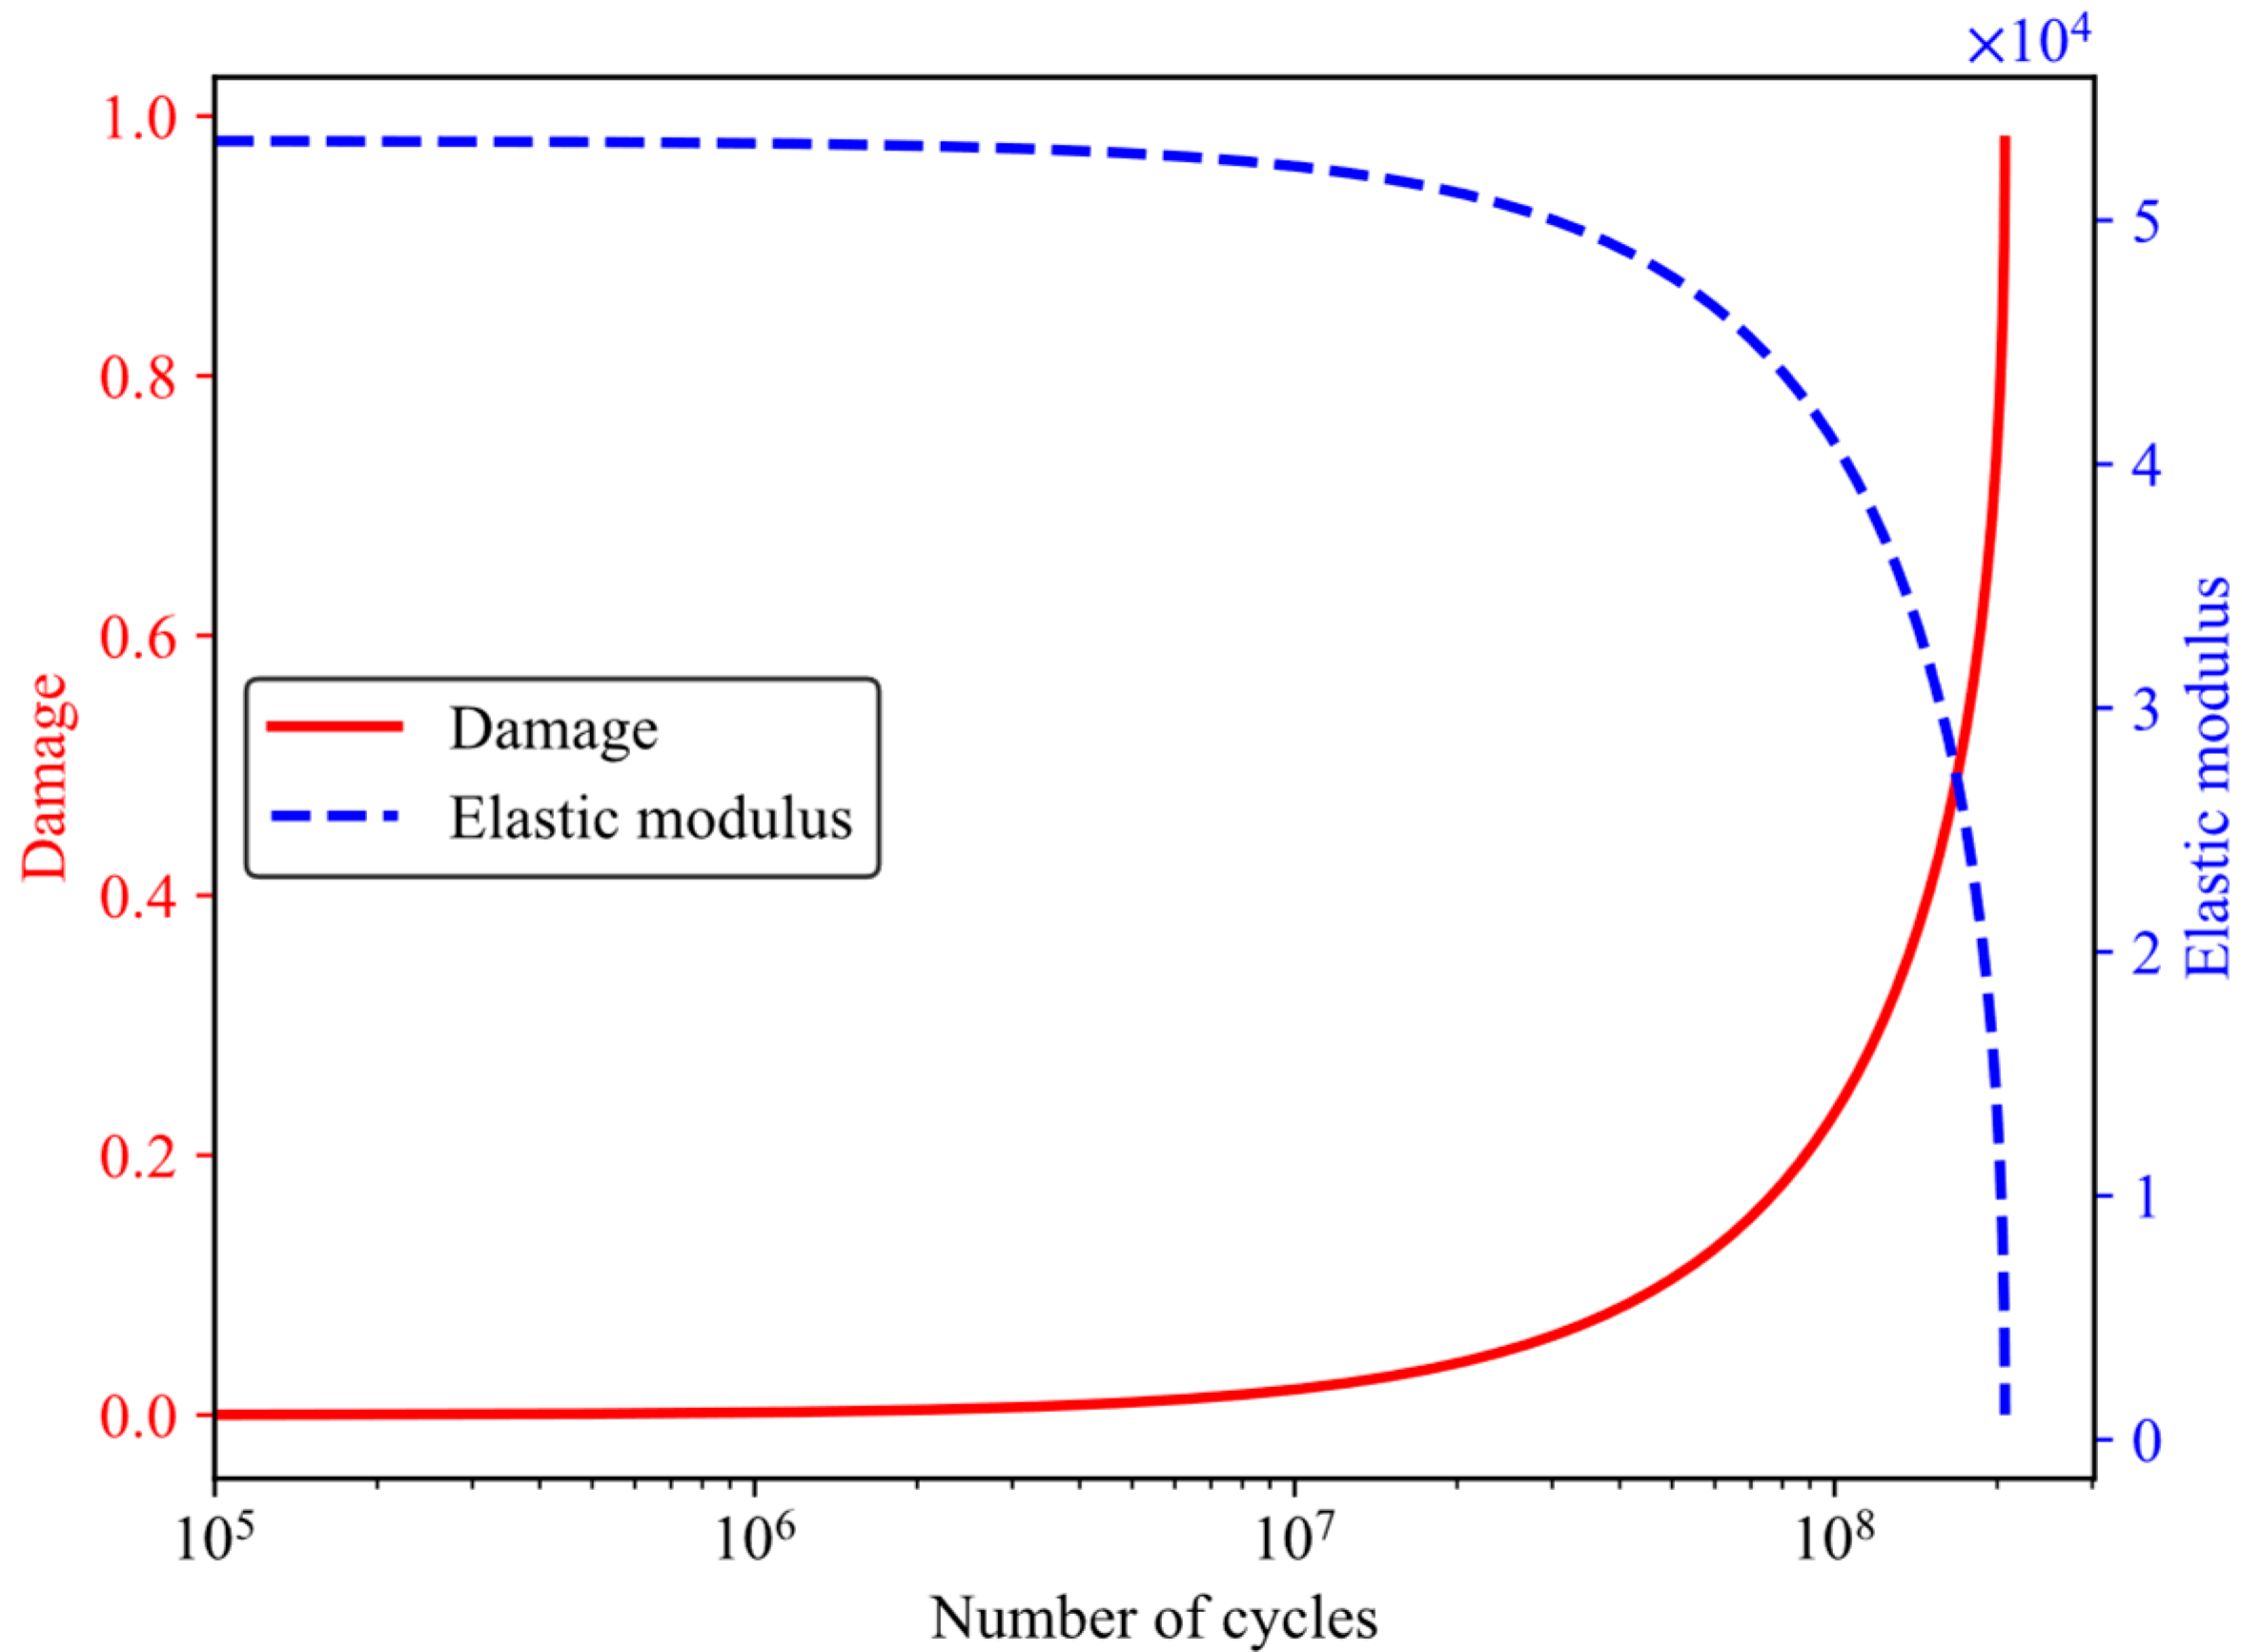
  • Update the elastic modulus based on the accumulated fatigue damage.
  • Calculate the stress–strain distribution at each integration point of the finite element model by employing the damage-coupled elasto-plastic constitutive model.
  • Determine the damage evolution rate and increment, and update the damage while utilizing the cycle-jumping method to reduce computational complexity. This method assumes that the damage evolution rate remains constant over a specific number of cycles.
  • Check whether the damage is greater than or equal to 1. If so, terminate the computation and consider the failure of the structural fatigue. Otherwise, return to step 2.

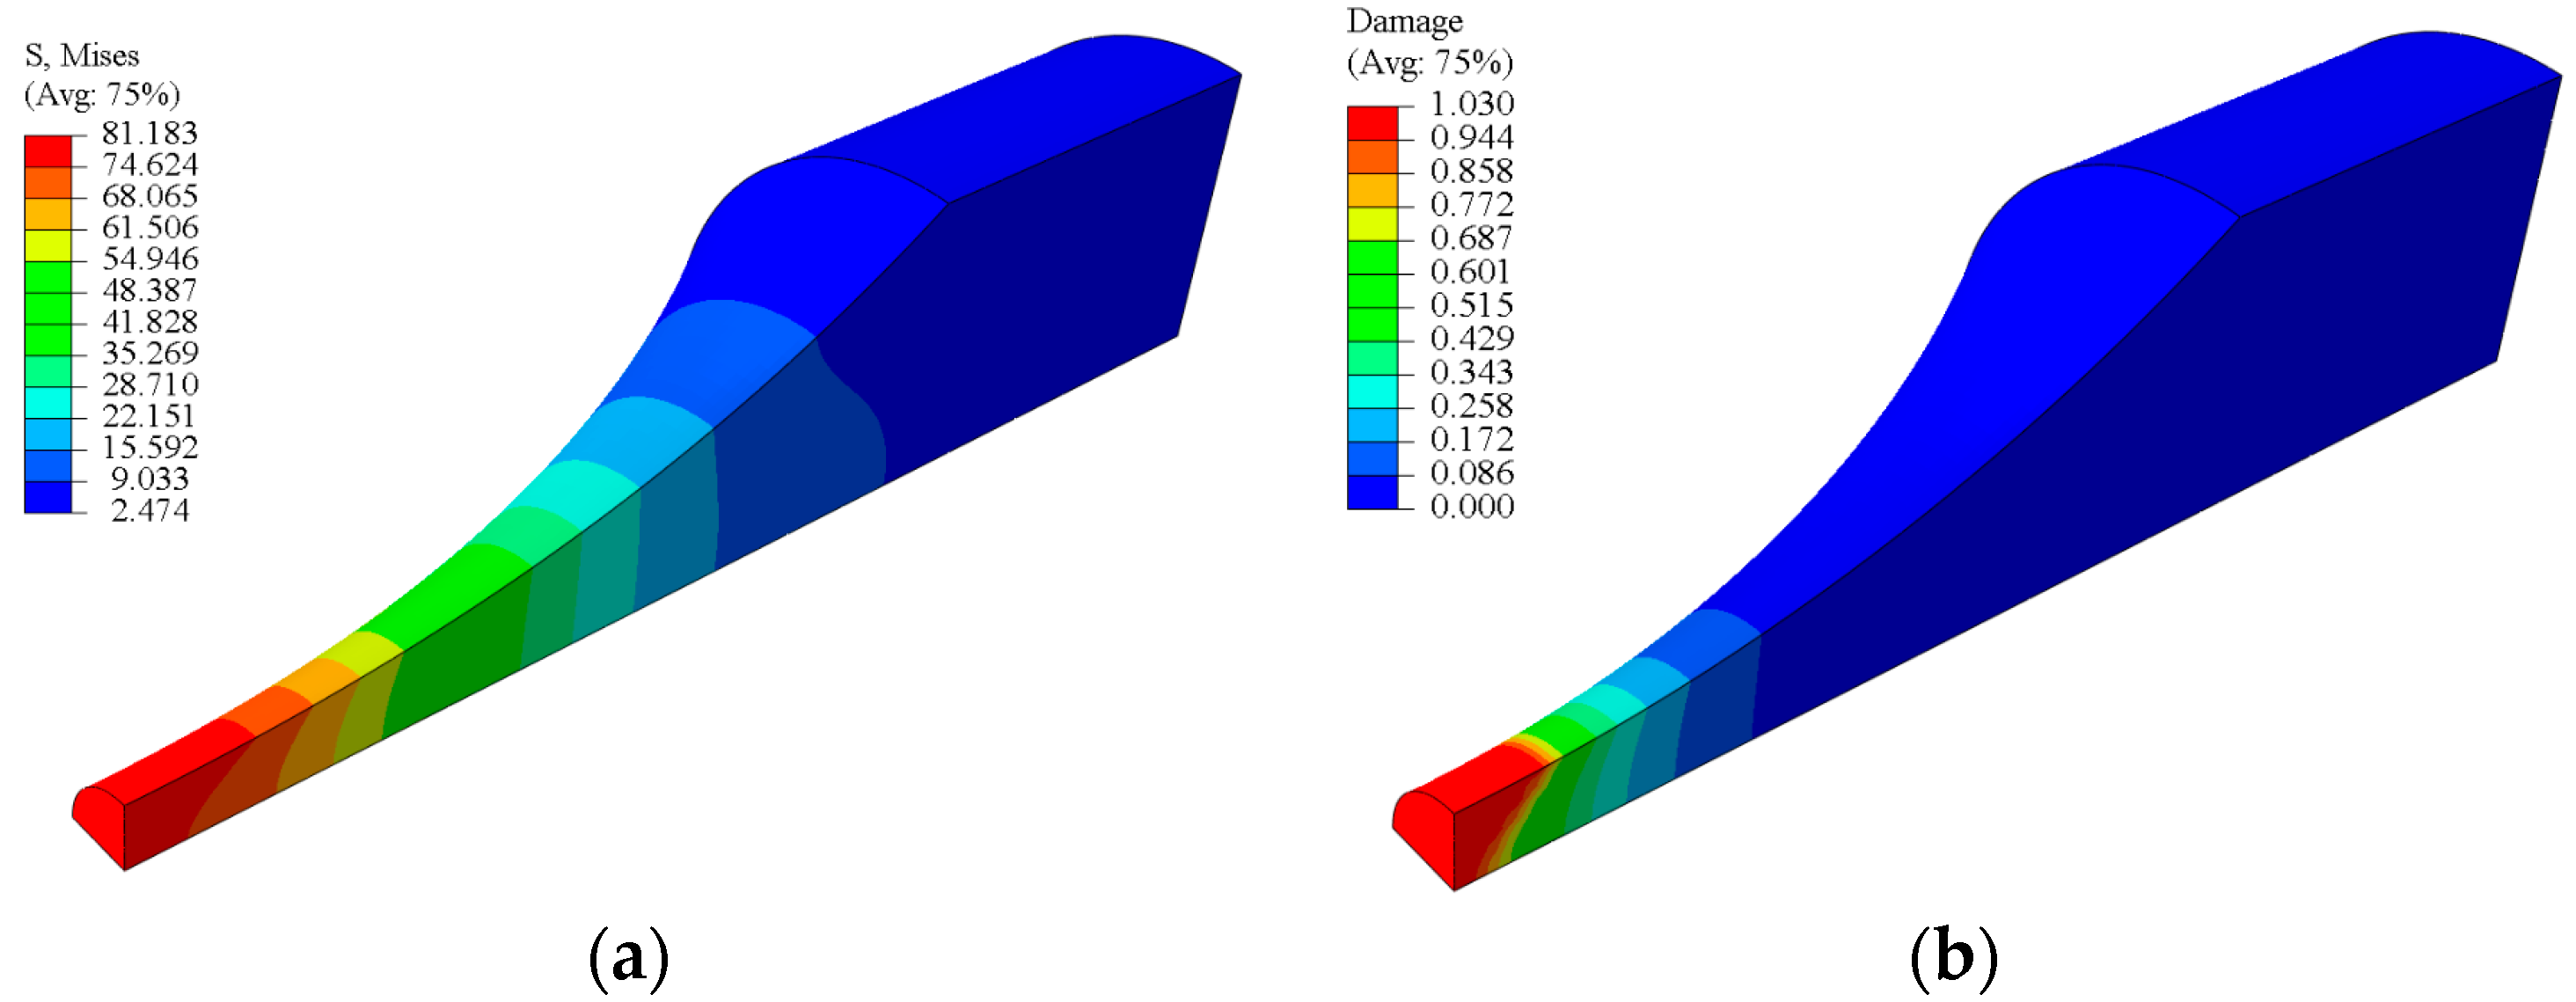
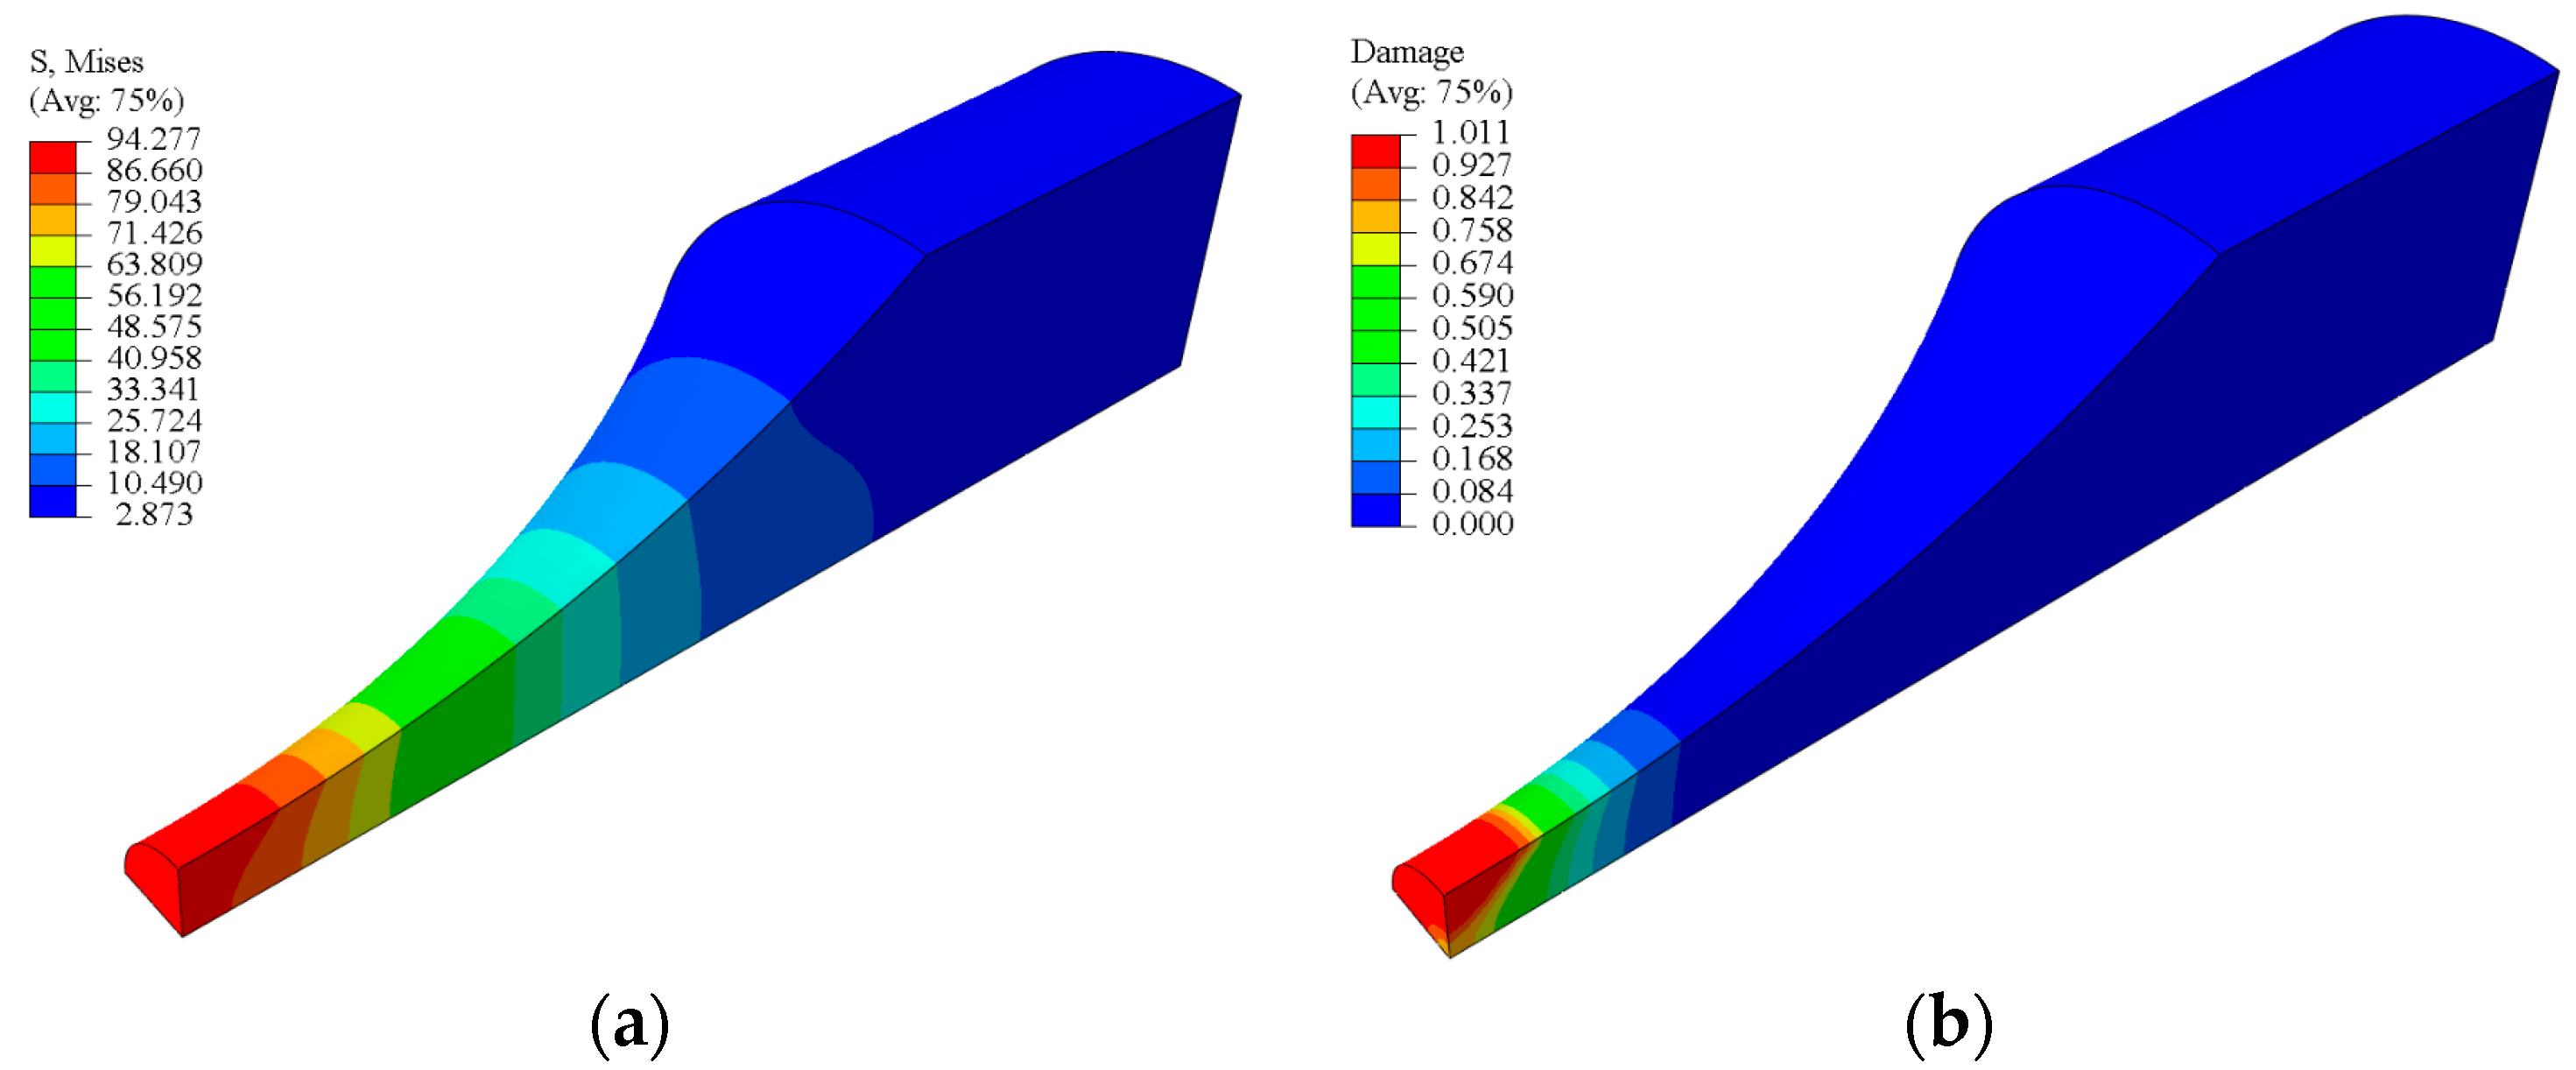
3.3. CDM-Based Numerical Results

Considering the axial symmetry of the AM AlSi10Mg fatigue specimen, a one-eighth FE (finite element) model, as shown in Figure 2a, is established for the numerical simulation. The fatigue loads are applied at the end of the FE model and the three symmetric constraints are applied on the corresponding symmetry plane, as shown in Figure 2b. Furthermore, verification of FE mesh independence is carried out to obtain the convergent results before the formal numerical simulation, and the minimum size of the FE mesh is 0.1 mm × 0.1 mm × 0.4 mm. Finally, the FE model of the AM AlSi10Mg specimen consists of 32,640 nodes and 29,309 C3D8 elements.
For the high-cycle-fatigue experiments, there are two kinds of powder sizes (20 μm and 50 μm) under three kinds of stress ratios (R = −1, 0, 0.5) and a wide stress range from 80 MPa to 280 MPa. For the AM AlSi10Mg specimen with the powder size of 20 μm under the fatigue loads of R = 0 , S m a x = 79.92   M P a , the distributions of von Mises stress and damage are shown in Figure 3. It is observed that the maximum stress and damage are located at the minimum cross-section, and the distribution pattern is basically consistent. Figure 4 is plotted for the variations in damage and elastic modulus against the number of cycles. We can see that the elastic modulus decreases slowly in the first half of fatigue life, while the elastic modulus quickly decreases in the last 20% of fatigue life, which is induced by the accumulated fatigue damage. In terms of the AM AlSi10Mg specimen with the powder size of 50 μm under the fatigue loads of R = 1 , S m a x = 92.81   M P a , it is seen from Figure 5 and Figure 6 that the distributions of von Mises stress and damage, and the variations in damage and elastic modulus against the number of cycles are similar.
The predicted fatigue lives for the AM AlSi10Mg specimens with different powder sizes are shown in Figure 7. We can see that most of the predicted results are within the triple error band, which verifies the numerical method and the calibrated material parameters. Furthermore, it is observed that the predicted results are better for the powder size of 20 μm with the fatigue life longer than 107, and for the powder size of 50 μm with the fatigue life shorter than 107.

4. Machine Learning Approach for HCF Life Prediction

4.1. Data Pre-Processing

Data pre-processing [39] is an important step in machine learning that involves cleaning, transforming, and preparing the data for analysis. The quality of the data and how they are processed can have a significant impact on the accuracy and reliability of the machine learning model. Here are some common steps involved in data pre-processing for machine learning.
  • Data cleaning: This involves removing or correcting any errors or inconsistencies in the data, such as missing values, outliers, or duplicate records. Missing values can be handled by either removing the affected rows or replacing the missing values with a value, and outliers can be detected.
  • Data transformation: Data transformation encompasses the process of converting the data into a format that is well-suited for analysis by a machine learning algorithm, with the aim of reducing the dimensionality of the data.
  • Data splitting: The pre-processed data are typically split into two or more sets, with one set used for training the machine learning model and another set used for testing or validating the model. It helps to evaluate the performance of the model on unseen data and avoid overfitting.
  • Data normalization: Normalizing the data involves ensuring that the input data have zero mean and unit variance. It helps the machine learning algorithm converge faster and improves the accuracy of the predictions.

4.2. Machine Learning Models

4.2.1. RF (Random Forest)

RF (Random Forest) [40] regression is a machine learning algorithm employed for regression tasks, aiming to forecast continuous numerical values. RF regression presents numerous merits, encompassing resilience towards noise and outliers, the capability to handle non-linear relationships, the assessment of feature importance, and proficiency in managing high-dimensional data. Within RF regression, the algorithm constructs an ensemble of decision trees, wherein each tree is trained on a distinct subset of the data through a technique known as bootstrap aggregating or bagging.
During the training process, each decision tree is built by recursively splitting the data based on different feature attributes and thresholds. The splitting process aims to minimize the variance within each split while maximizing the differences between splits. The number of features considered for splitting at each node is typically a square root or a logarithm of the total number of features. Once the ensemble of decision trees is trained, the RF regression model predicts the output value by averaging the predictions of all the individual trees. The averaging process helps to reduce overfitting and provides a more robust and accurate prediction. The RF algorithm [41] for regression can be summarized as follows:
  • Data Preparation. Prepare the dataset by splitting it into input features and the target variable.
  • Bootstrap Aggregating. Generate multiple bootstrap samples from the original dataset by randomly sampling the data with replacement.
  • Decision Tree Training. Build a decision tree for each bootstrap sample. At each node of the tree, a subset of input features is randomly selected, and the best split is determined based on a criterion to maximize the differences between the splits.
  • Ensemble Creation. Combine the individual decision trees to create the Random Forest ensemble. Each tree in the ensemble independently predicts the target variable based on the input features.
  • Prediction. For a new input instance, pass it through each decision tree in the Random Forest ensemble. The final prediction is obtained by averaging the predictions from all the trees.

4.2.2. K-Nearest Neighbor (KNN)

K-Nearest Neighbor (KNN) [42,43] is a simple but effective machine learning algorithm used for predictions. One of the advantages of KNN is that it can handle complex decision boundaries and works well with non-linear data. It is a non-parametric algorithm, and the number of neighbors K is a hyperparameter that needs to be specified. Generally, larger values of K lead to smoother predictions, while smaller values of K lead to more complex and possibly overfitting predictions. The optimal value of K can be chosen using cross-validation techniques. For KNN regression, the algorithm computes the average or median of the target values of the K nearest neighbors. The algorithm of KNN regression is as follows.
  • Given a training dataset with features X and target values y, and a new data point x for which we want to predict the target value.
  • For each data point in the training set, compute the distance between the feature vectors of that point and the feature vector of the new data point x. The distance metric used can be Euclidean distance, Manhattan distance, or any other distance metric.
  • Select the K training data points that are closest to the new data point x based on the computed distances.
  • Compute the average or median of the target values of the K nearest neighbors. This value is used as the predicted target value for the new data point x.
  • Repeat the above steps for all the new data points for which we want to make predictions.

4.3. Evaluation Metrics of ML Prediction

These are some of the commonly used evaluation metrics for machine learning models. The choice of metric depends on the problem being solved, the type of data, and the goals of the analysis. In this study, two evaluation metrics, i.e., MSE (mean squared error) and R2 (R-squared), are employed. The value of R2 ranges from 0 to 1, with higher values indicating a better fit. The formulas for MSE and R2 are presented below.
M S E ( N , N p r e ) = 1 m k = 1 m ( N k N k p r e ) 2
R 2 ( N , N p r e ) = 1 k = 1 m ( N k N k p r e ) 2 k = 1 m ( N k N m e a n ) 2
where N k represents the experimental data, N k p r e is the predicted data, N m e a n represents the mean value of the experimental results, and m is the number of samples in the dataset.

5. Results and Discussion

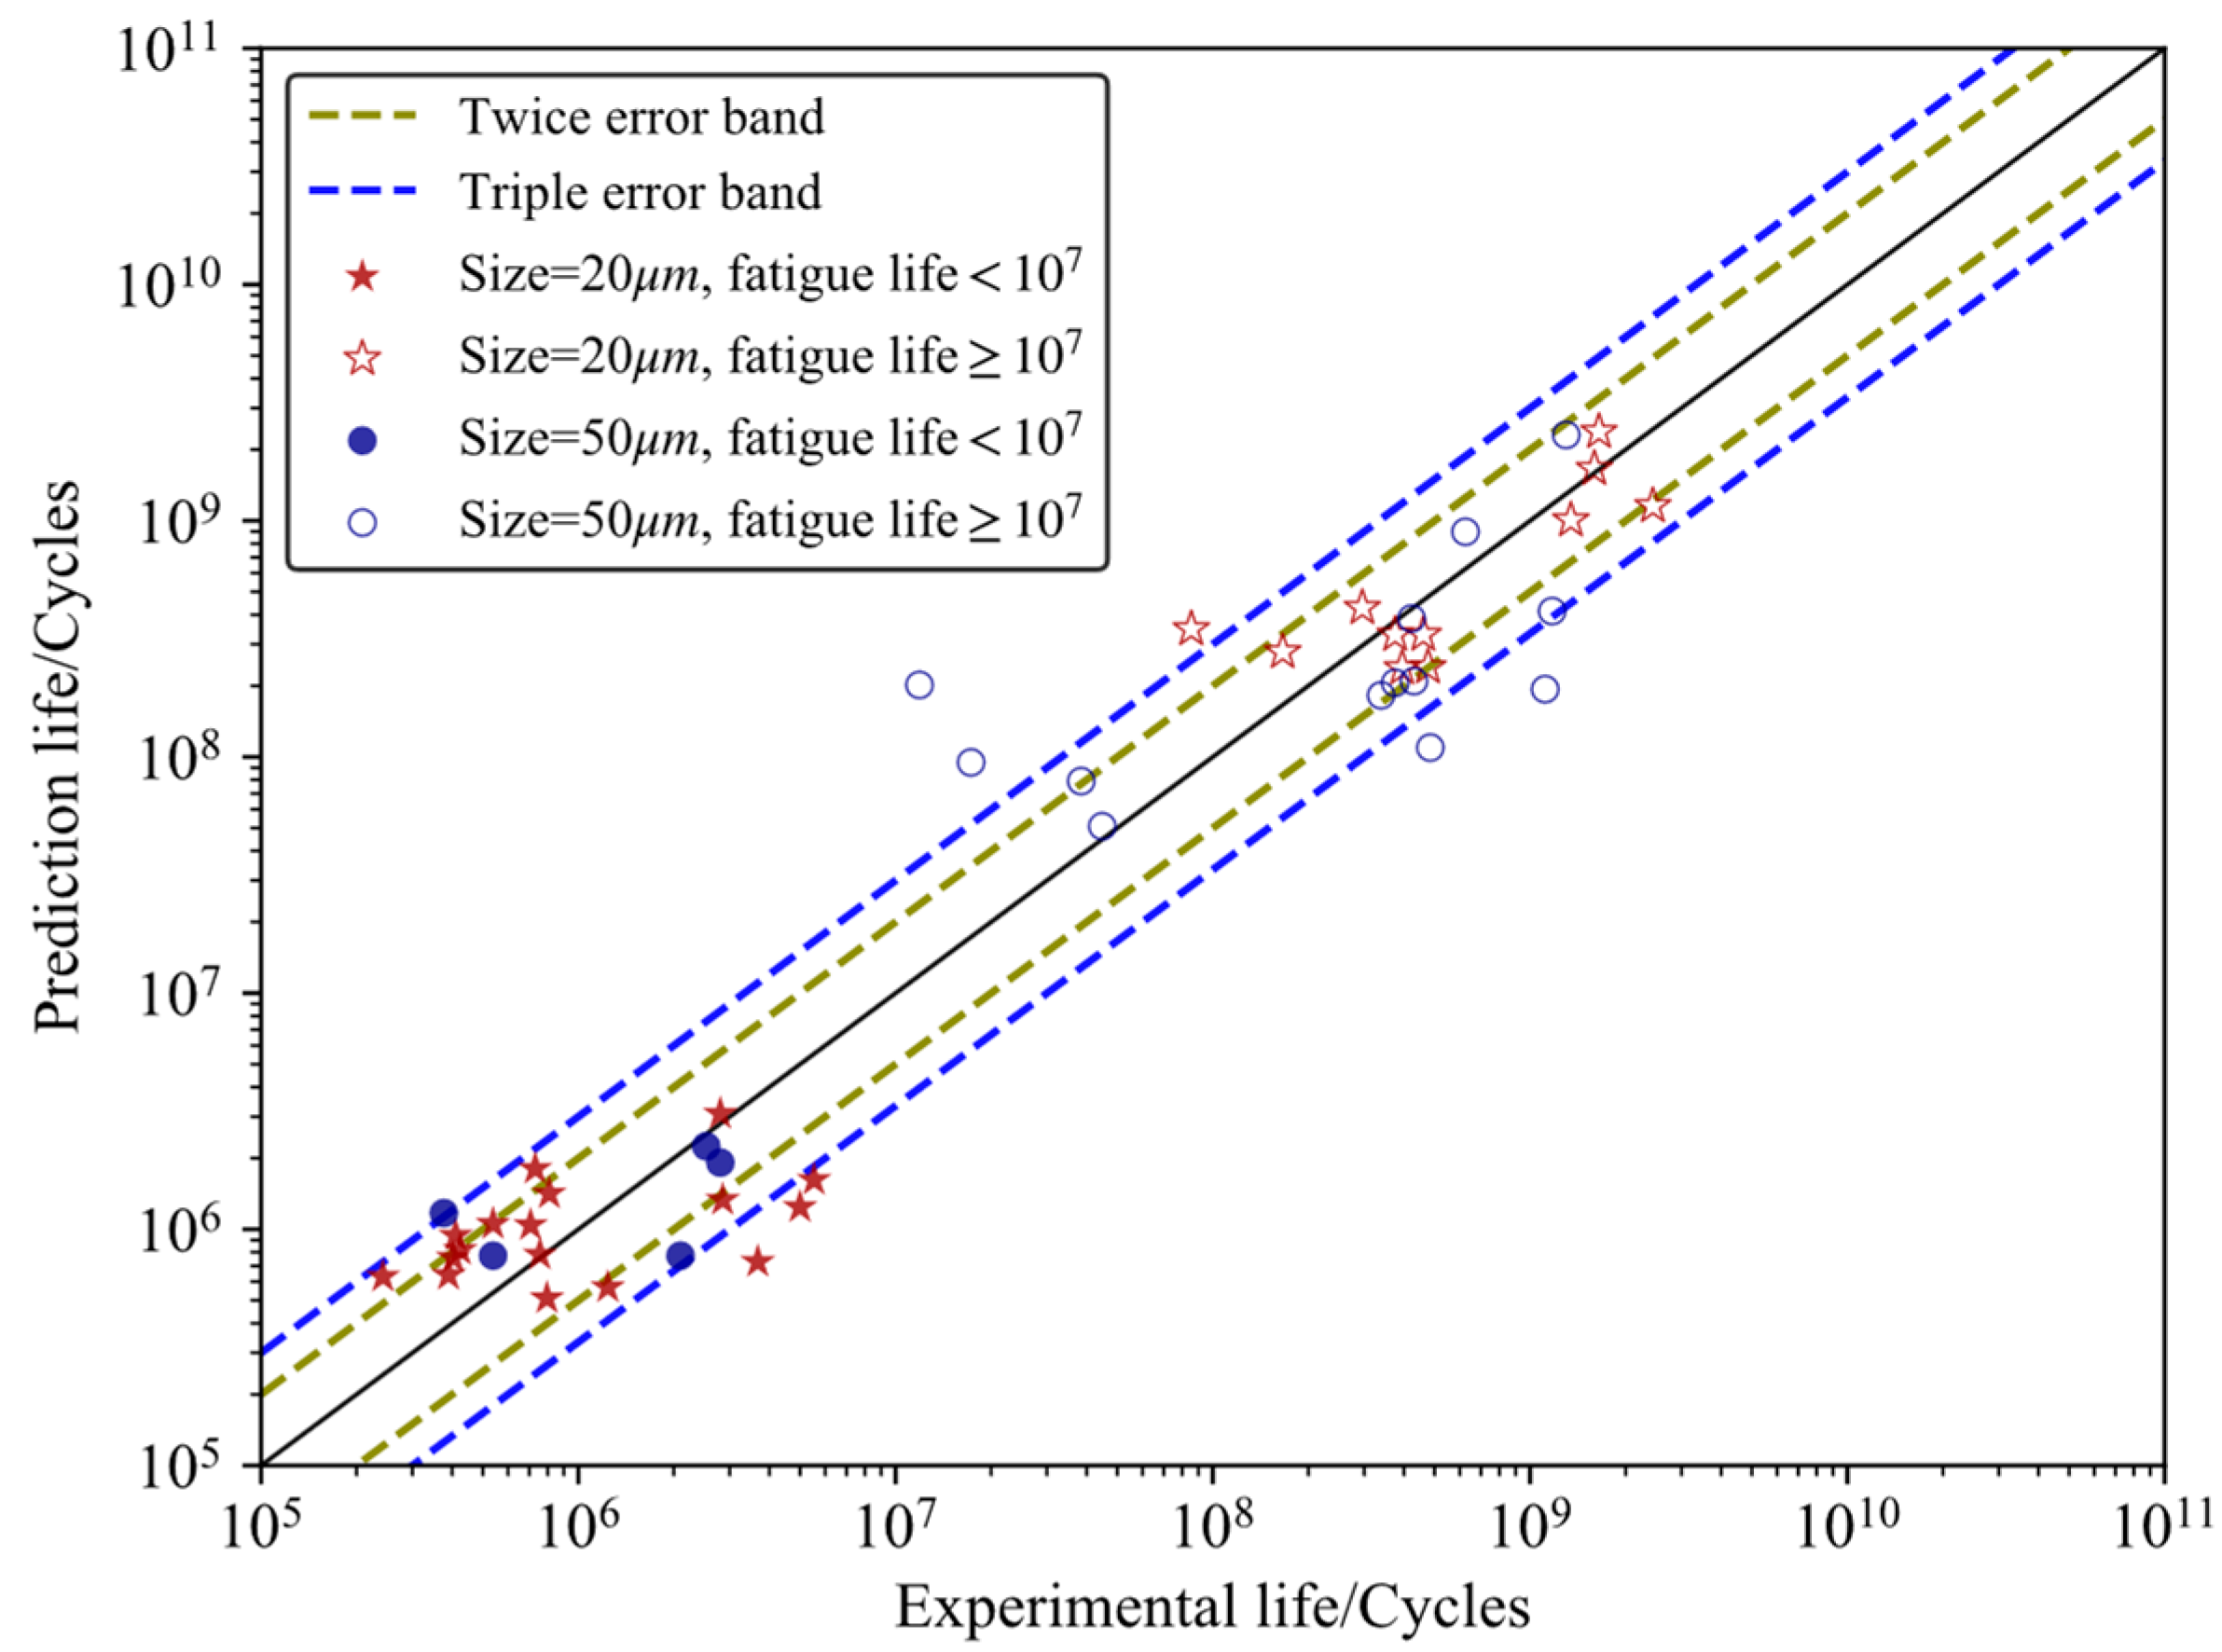
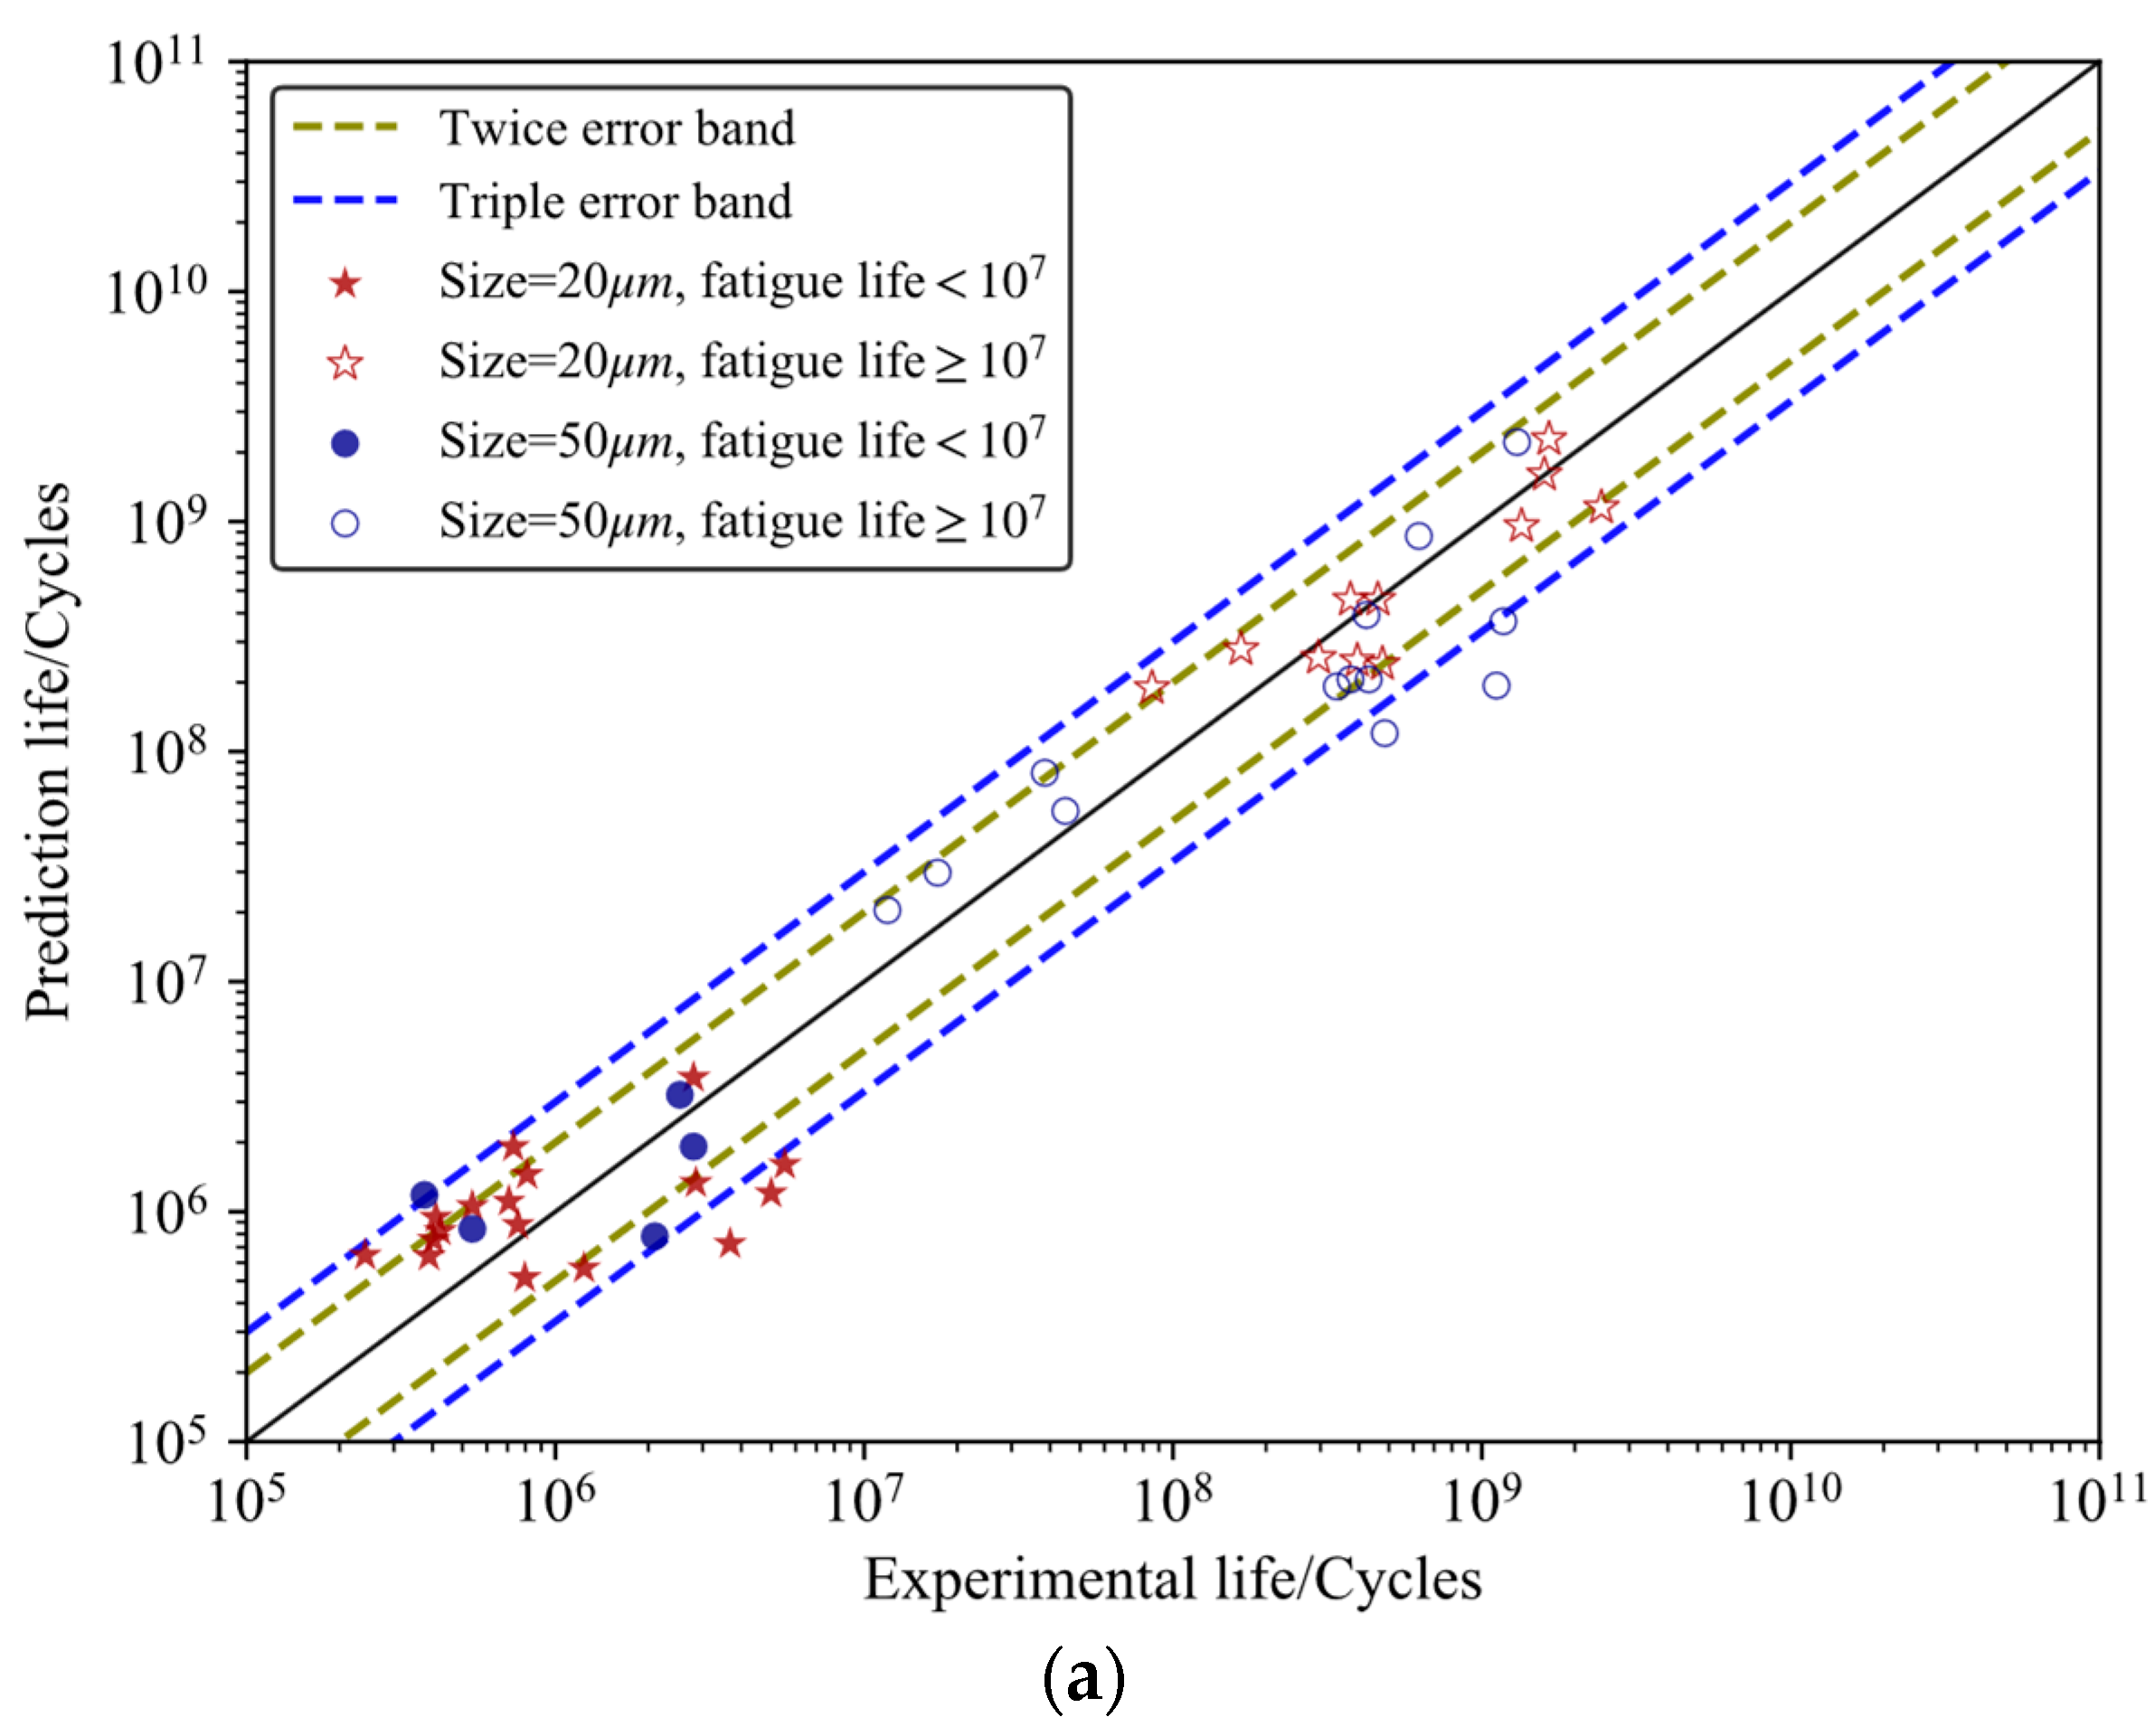
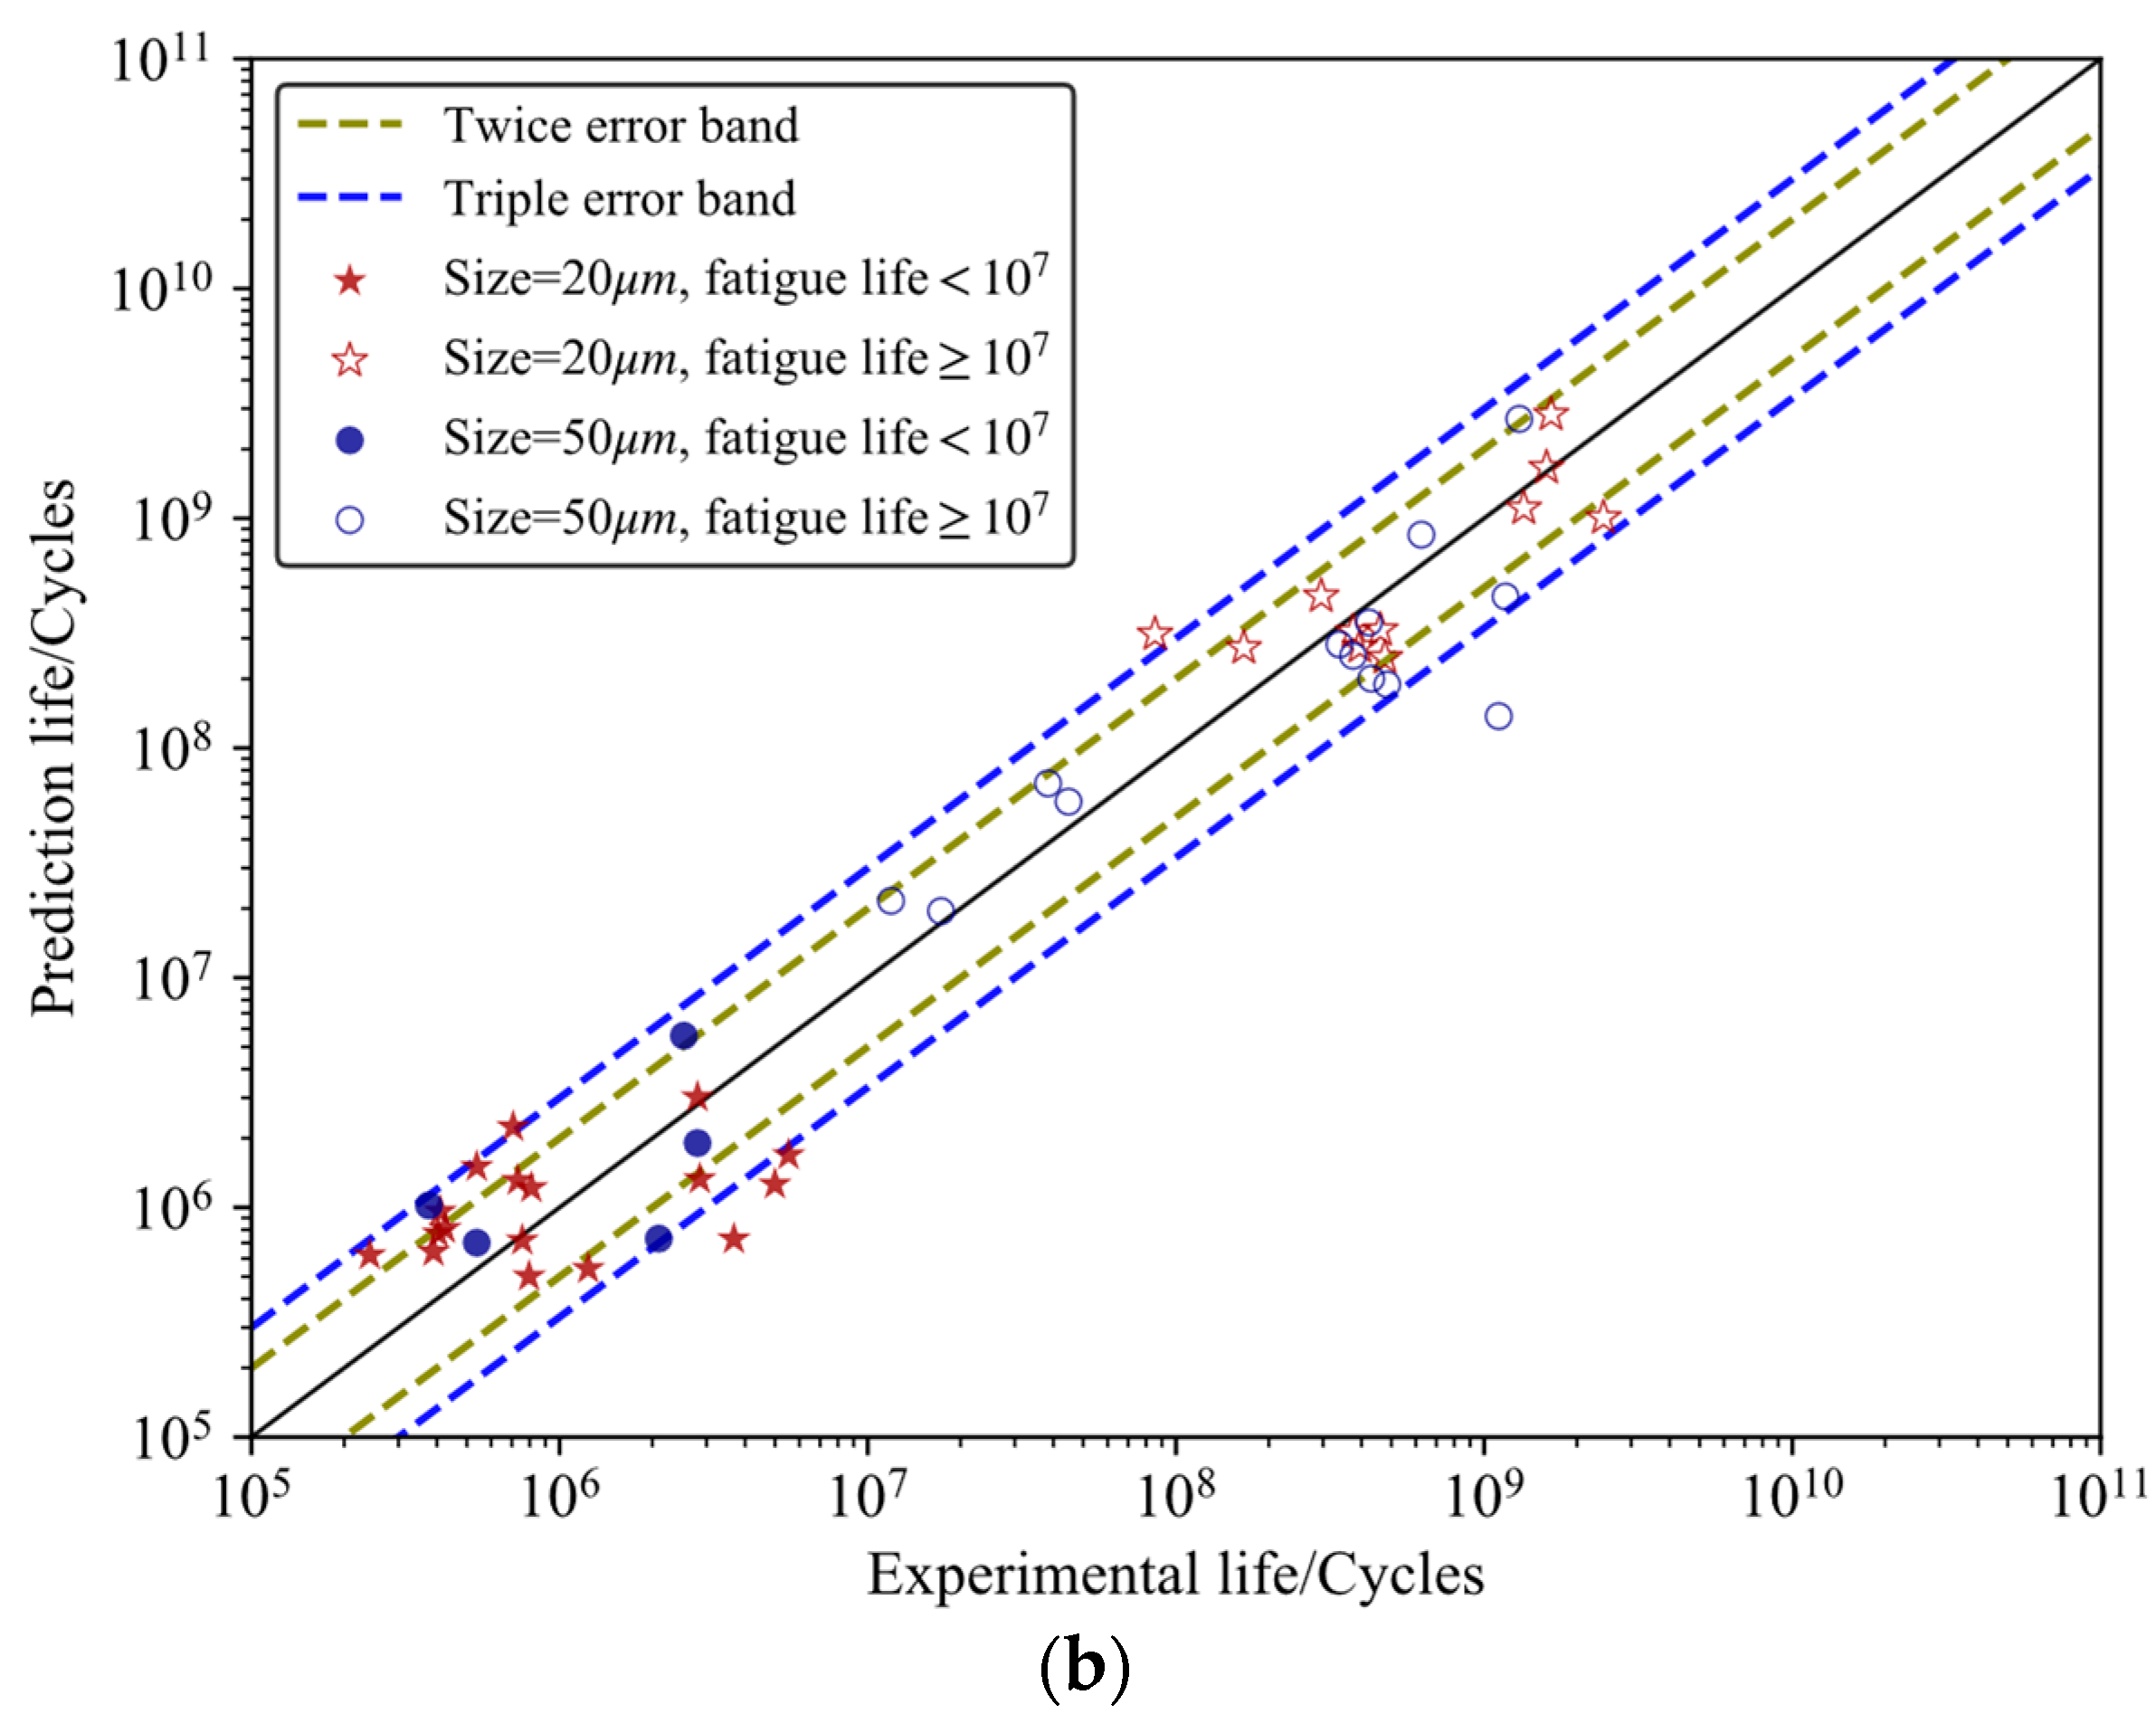
5.1. Predicted Fatigue Lives of AM AlSi10Mg by ML Models

Figure 8 displays a comparison between the predicted results and experimental data. It is seen that the majority of the predicted fatigue lives for AM AlSi10Mg obtained through the RF and KNN models fall within the triple error band. As shown in Figure 8a, for the fatigue life below 107, the RF model works better for the powder size of 50 μm than that of 20 μm. Meanwhile, when the fatigue life exceeds 107, the RF model performs better for the 20 μm powder size than the 50 μm powder size. Regarding the KNN-based predicted results, as shown in Figure 8b, it is noteworthy that only one predicted fatigue life for the 50 μm powder size falls outside the triple error band. In contrast, for the 20 μm powder size, the predicted results exhibit better performance when the fatigue life surpasses 107. The evaluation metrics for the ML and numerical model prediction are presented in Table 3, revealing that the RF model achieves the minimum MSE and the maximum R2 value compared to the KNN model and numerical model, indicating that the RF model works better for the overall predictive performance of AM AlSi10Mg. Furthermore, the overall prediction accuracy of the KNN model is higher than that of the numerical model.
The efficiency of the new approach can vary depending on several factors, including the complexity of the problem, the quality and quantity of data available, the choice of algorithms and models, and the computational resources utilized. One of the key advantages of machine learning is its ability to automate decision-making processes and extract patterns from large datasets that may be difficult or time-consuming to analyze. However, it is important to note that implementing machine learning successfully requires careful consideration and expertise. Acquiring high-quality, relevant, and diverse datasets is crucial for training accurate models. Additionally, choosing the appropriate algorithms and models that best suit the problem at hand is essential. Model selection depends on factors such as the nature of the data, the desired task, and available computational resources.
In terms of the future, the field of machine learning is expected to continue advancing rapidly. New algorithms and techniques are continuously developing to improve efficiency, interpretability, and generalization capabilities of machine learning models. Deep learning, a subfield of machine learning that focuses on neural networks with multiple layers, has seen tremendous progress in recent years, leading to breakthroughs in various domains. As the amount of available data continues to grow, and computational power becomes more accessible, machine learning models are likely to become even more powerful and capable of handling increasingly complex tasks.

5.2. Discussions

All data in this section are calculated using the CDM finite element numerical method, combined with the already calibrated parameters. In Section 5.2.1, the CDM finite element numerical method is employed to calculate the curves depicting the variation in fatigue life with maximum stress at different stress ratios within HCF and VHCF ranges for powder sizes of 20 μm and 50 μm. In Section 5.2.2, the CDM method is used to compute the curves representing the change in damage degree D and the damage evolution rate D ˙ versus cycle numbers under a certain stress level within the HCF range for powder sizes of 20 μm and 50 μm. Similarly, the curves of damage degree D and damage evolution rate D ˙ versus cycle numbers under a certain stress level within the VHCF range for powder sizes of 20 μm and 50 μm are calculated.

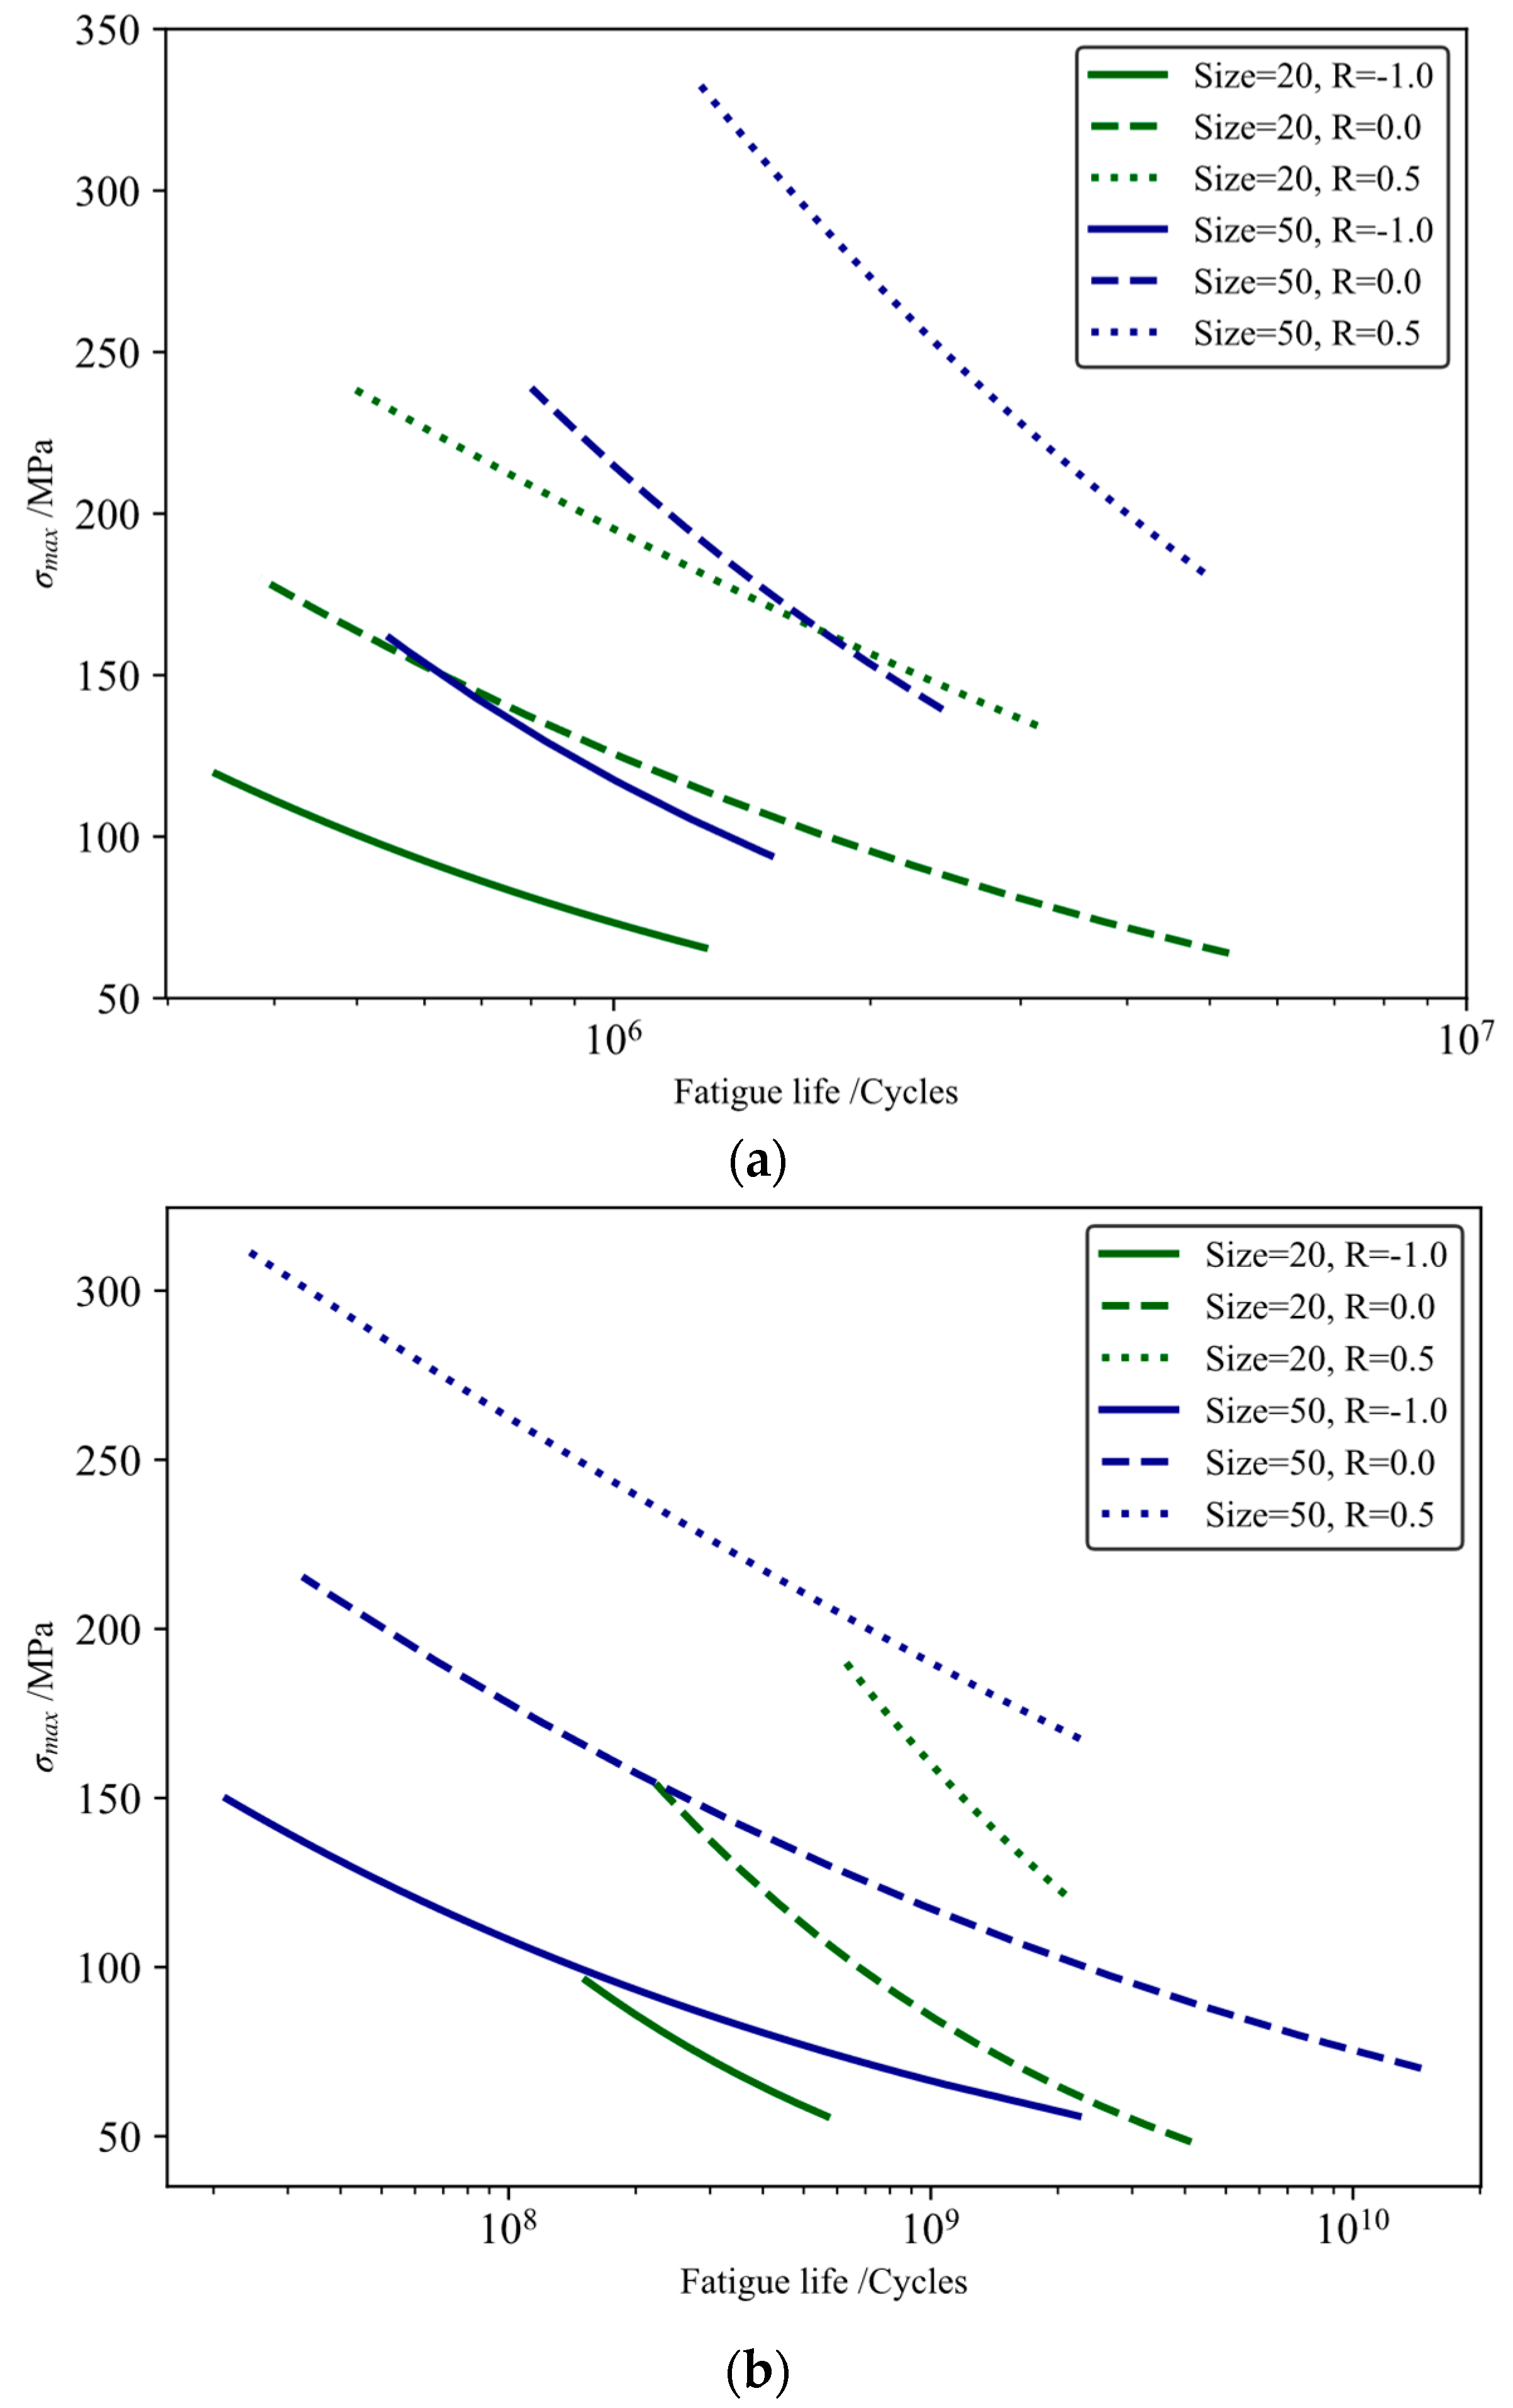
5.2.1. Influence of Stress Ratio and Maximum Stress on the Fatigue Life

As depicted in Figure 9a, it is evident that for fatigue lives below 107, the fatigue life associated with a powder size of 50 μm surpasses that of 20 μm under equivalent cyclic loads. Furthermore, under the same maximum stress, a decrease in stress ratio from 0.5 to −1 leads to a reduction in fatigue life for both powder sizes. Additionally, it is noteworthy that with an increase in maximum stress, the decline rate of fatigue life for the 50 μm powder size is more pronounced compared to that of 20 μm. Regarding fatigue lives exceeding 107, Figure 9b reveals that when the fatigue life is below 108, the fatigue behavior of the 20 μm powder size outperforms that of 50 μm. Conversely, for fatigue lives surpassing 109, the fatigue behavior of the 50 μm powder size proves superior to that of 20 μm.

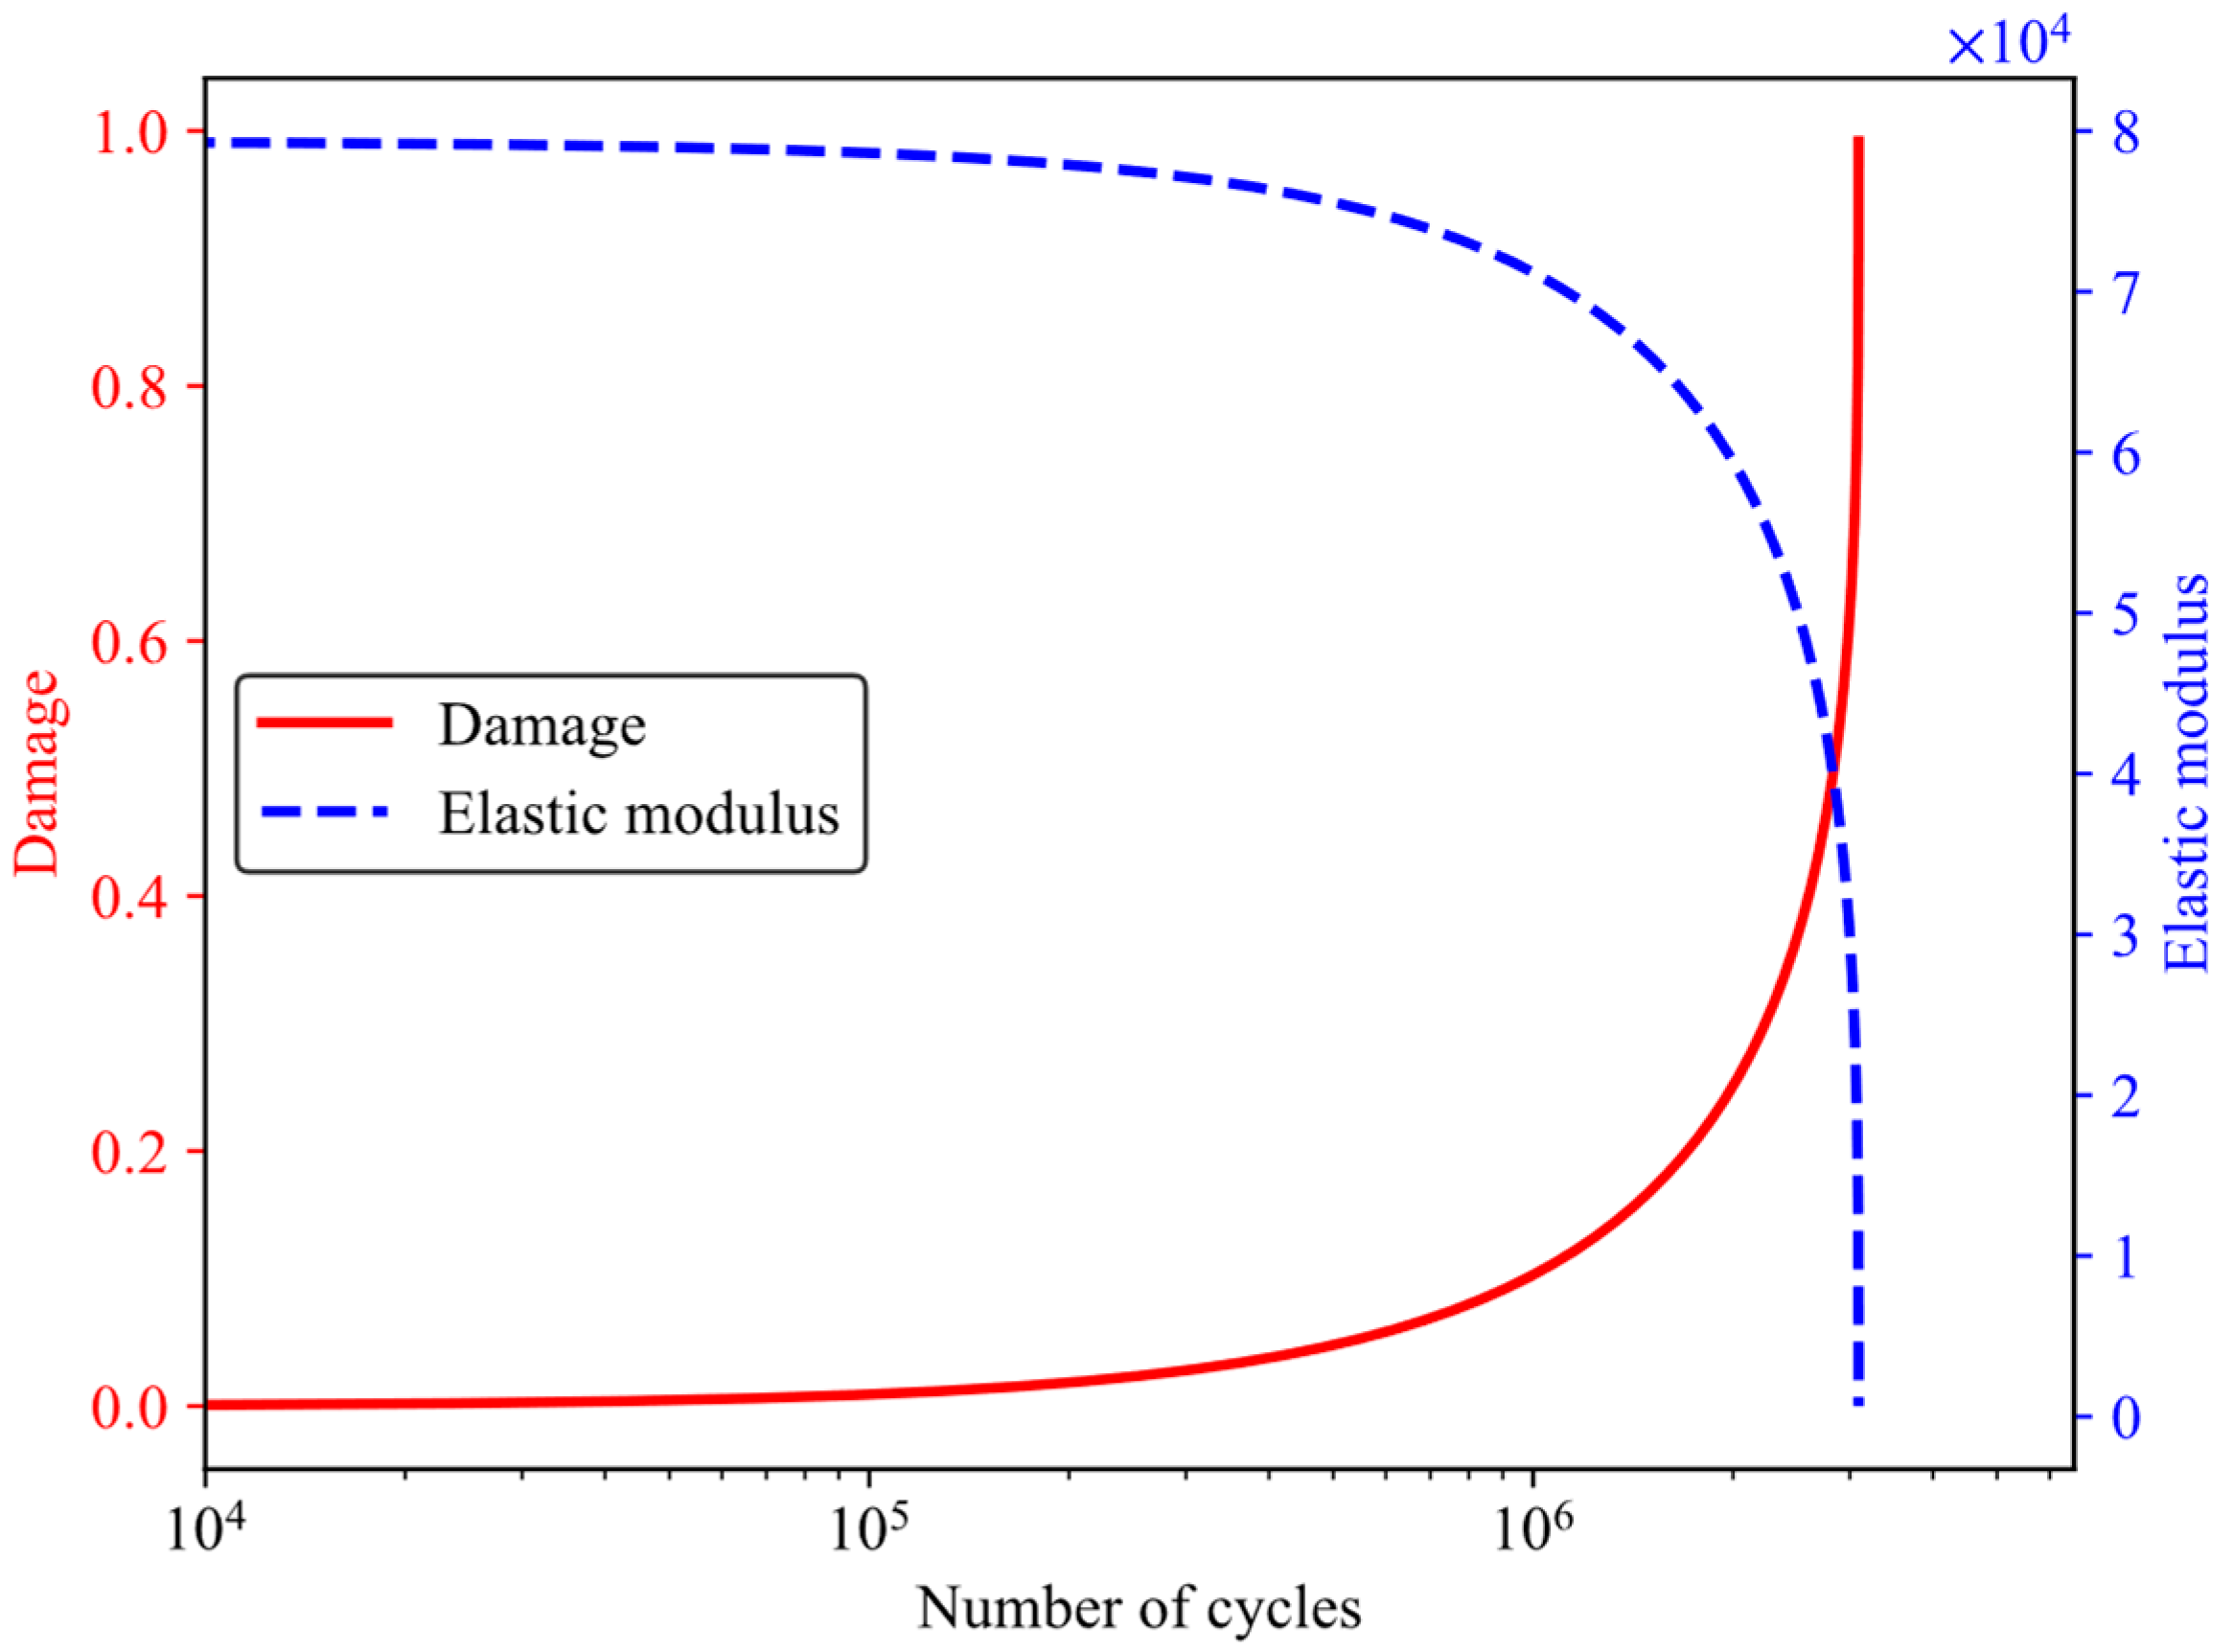
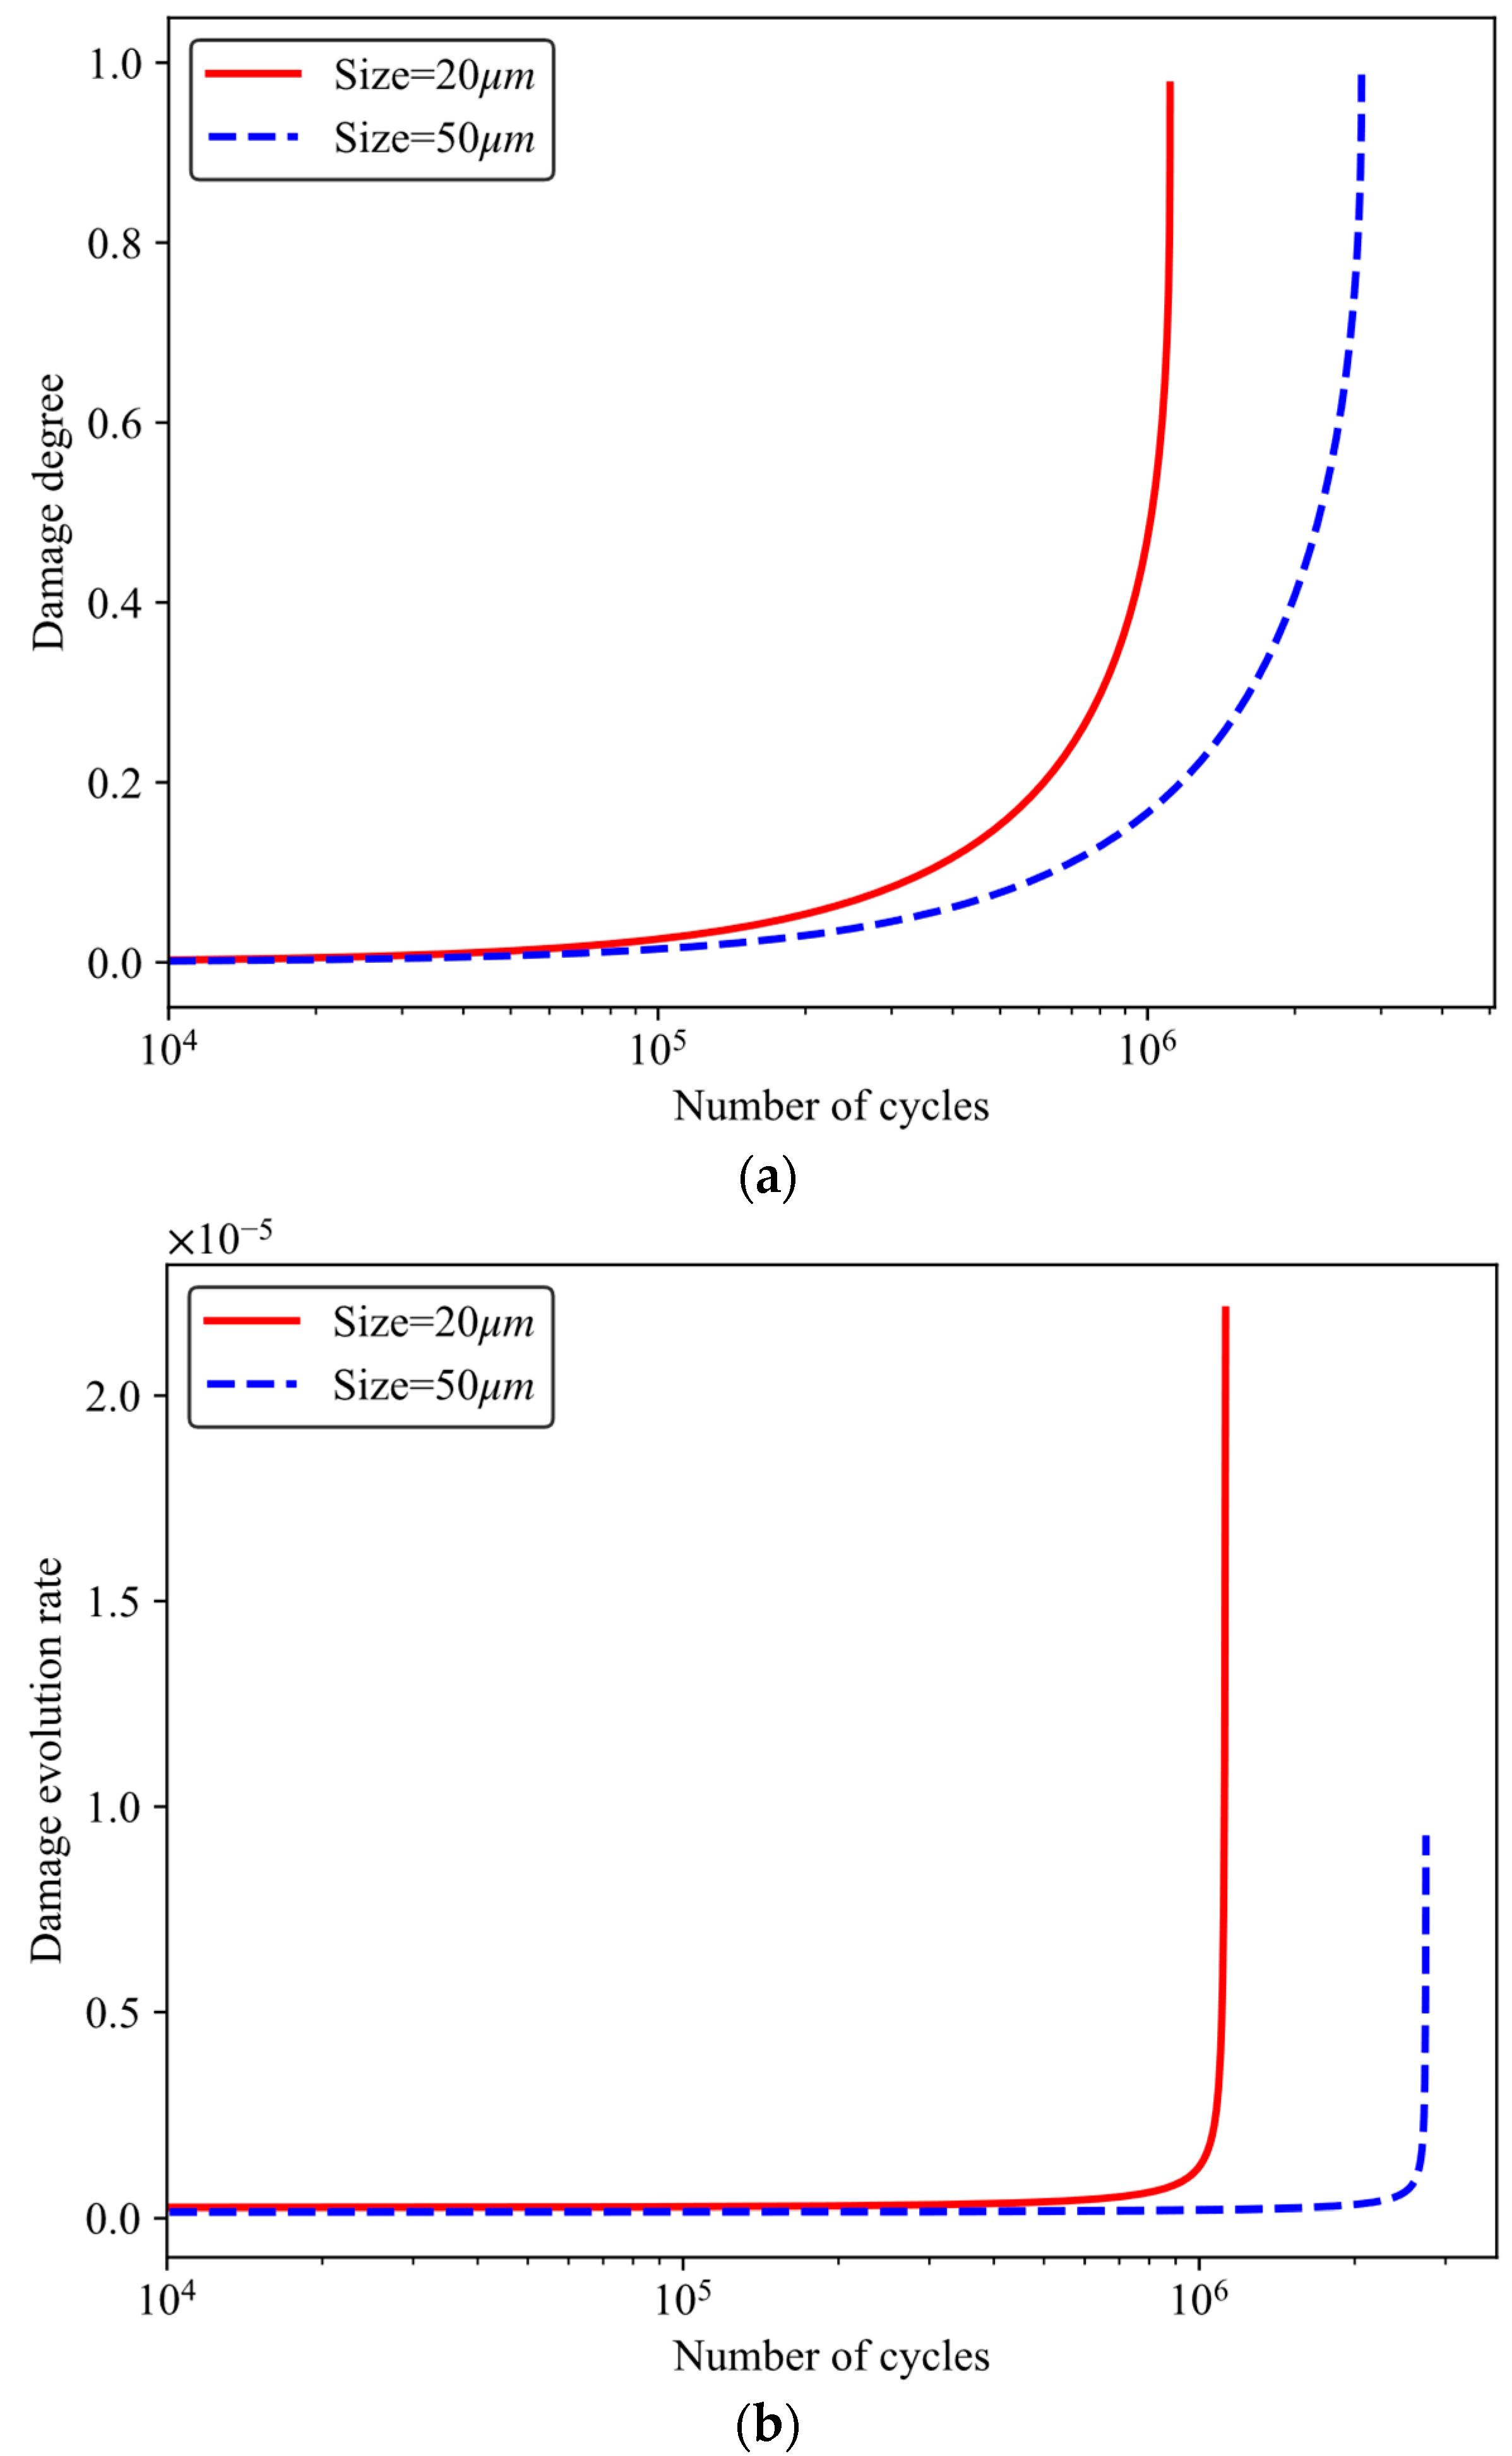
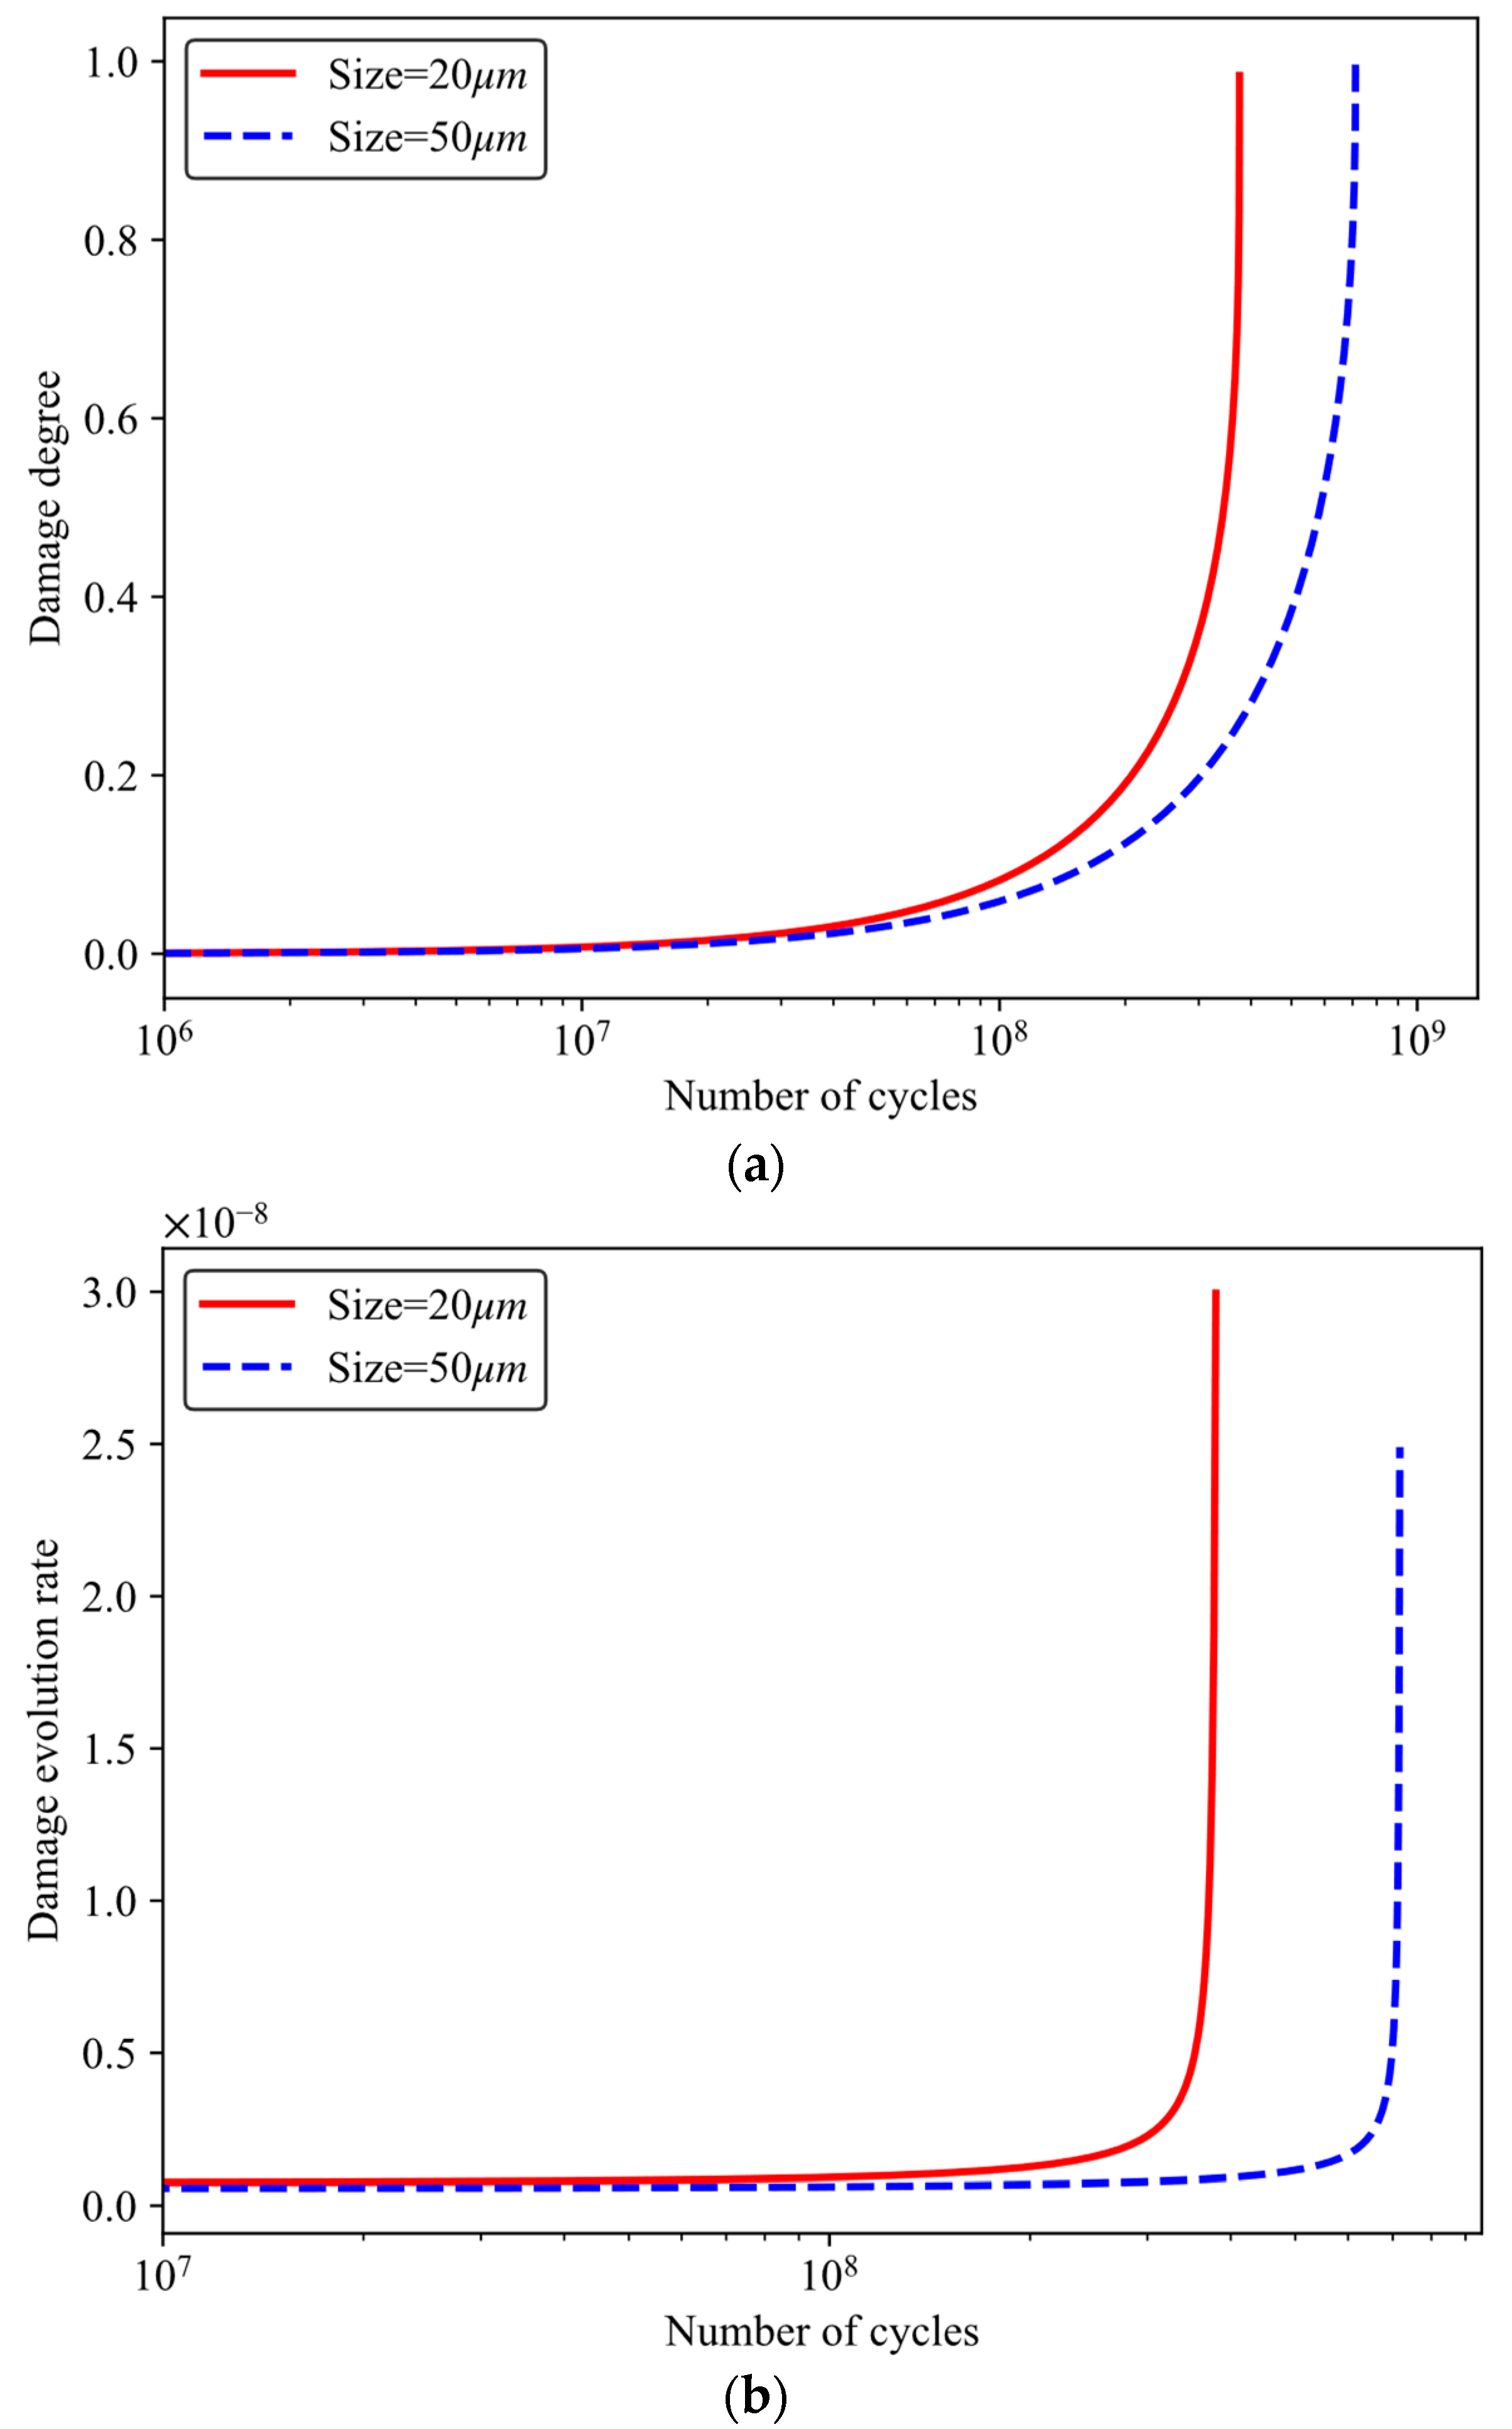
5.2.2. Influence of Powder Size on the Damage Accumulation and Evolution Rate

For the fatigue load of R = −1 and σmax = 70 MPa with fatigue life smaller than 107, the variation in damage degree D versus the number of cycles is plotted in Figure 10a, and the damage rate D ˙ versus the number of cycles is plotted in Figure 10b. Notably, it is observed that as the powder size decreases, the rate of damage evolution accelerates, leading to a shorter fatigue life. Furthermore, for both powder sizes, the damage degree exhibits a gradual increase during the initial 60% of the fatigue life, followed by a rapid escalation during the remaining 40%. Towards the end of the fatigue life, the damage evolution rate experiences a sharp increase. In Figure 11, the variation in the damage degree D and the damage rate D ˙ against the number of cycles is presented for the fatigue load of R = 0 and σmax = 125 MPa, where the fatigue life exceeds 107. Evidently, the fatigue life demonstrates an upward trend with increasing powder size under the same fatigue loads. Moreover, for a powder size of 20 μm, the damage degree exhibits a gradual increase during the initial 30% of the fatigue life, followed by a rapid escalation during the subsequent 60%. Conversely, for a powder size of 50 μm, the damage degree shows a slow increase during the first 20% of the fatigue life, followed by a swift escalation during the final 80%. Notably, the damage extent experiences a sharp rise during the last 10% of the fatigue life for both powder sizes.

6. Conclusions

In this investigation, the HCF and VHCF behaviors of AM AlSi10Mg, taking into account the effects of powder size and fatigue damage, were scrutinized, and a novel machine learning (ML)-based methodology for life prediction was introduced.
The research yields a damage-coupled constitutive model and a fatigue damage model, with the Particle Swarm Optimization method deployed for calibrating the material parameters within the theoretical models of AM AlSi10Mg. These theoretical models were then numerically implemented through the development of a user-defined material subroutine. The resulting predictions for the fatigue life of AM AlSi10Mg, under various powder sizes, fall within the triple error band, which substantiates the numerical methodology and the calibrated material parameters.
Furthermore, a machine learning methodology for HCF life prediction was proposed, utilizing both Random Forest (RF) and K-Nearest Neighbors (KNN) models to predict the fatigue lives of AM AlSi10Mg. Comparatively, the RF model resulted in a smaller mean squared error (MSE) and a larger R-squared value, indicating superior overall predictive performance for AM AlSi10Mg.
Additionally, it was observed that under identical maximum stress, a decrease in stress ratio from 0.5 to −1 results in reduced fatigue life for both powder sizes. With a decrease in powder size, the rate of damage evolution accelerates, thus leading to a shorter fatigue life. For both powder sizes, the damage degree shows a gradual increase during the initial 60% of the fatigue life, followed by a rapid increase in the remaining 40%.
This study offers a fresh perspective and tools for understanding and predicting the HCF behavior of AM AlSi10Mg. Future research will focus on other influencing factors, such as the effects of heat treatment and stress state on the fatigue behavior of AM AlSi10Mg, as well as further optimization and enhancement of the prediction model’s performance.

Author Contributions

Conceptualization, Z.B. and X.W.; Methodology, X.W. and W.H.; Software, T.G.; Validation, X.W. and C.S.; Formal Analysis, L.S. and Z.B.; Investigation, L.S. and X.C.; Resources, X.W. and Z.Z.; Data Curation, Z.B.; Writing—Original Draft Preparation, Z.B., X.W., T.G., C.S. and L.S.; Writing—Review and Editing, T.G., W.H., Z.Z., L.S. and X.C.; Visualization, L.S.; Supervision, T.G. and X.C.; Project Administration, T.G. All authors have read and agreed to the published version of the manuscript.

Funding

This research was funded by the scientific research project of China Academy of Railway Sciences Co., Ltd. (Grant number: 2021YJ069).

Data Availability Statement

Not applicable.

Acknowledgments

Xiao Chen sincerely acknowledges the support from Postdoctoral International Exchange Program (funded by China Postdoc Council).

Conflicts of Interest

The authors declare no conflict of interest.

References

  1. Praveena, B.A.; Lokesh, N.; Buradi, A.; Santhosh, B.; Praveena, B.L.; Vignesh, R. A comprehensive review of emerging additive manufacturing (3D printing technology): Methods, materials, applications, challenges, trends and future potential. Mater. Today Proc. 2022, 52, 1309–1313. [Google Scholar]
  2. Harshavardhana, N. Review on 3D printing of medical parts. In Additive Manufacturing; Woodhead Publishing: Cambridge, UK, 2021; pp. 63–84. [Google Scholar]
  3. Tao, W.; Leu, M.C. Design of lattice structure for additive manufacturing. In Proceedings of the 2016 International Symposium on Flexible Automation (ISFA), Cleveland, OH, USA, 1–3 August 2016; pp. 325–332. [Google Scholar]
  4. Ferro, C.G.; Varetti, S.; Maggiore, P.; Lombardi, M.; Biamino, S.; Manfredi, D.; Calignano, F. Design and characterization of trabecular structures for an anti-icing sandwich panel produced by additive manufacturing. J. Sandw. Struct. Mater. 2020, 22, 1111–1131. [Google Scholar] [CrossRef]
  5. Sing, S.L.; Wiria, F.E.; Yeong, W.Y. Selective laser melting of lattice structures: A statistical approach to manufacturability and mechanical behavior. Robot. Comput.-Integr. Manuf. 2018, 49, 170–180. [Google Scholar] [CrossRef]
  6. Guo, N.; Leu, M.C. Additive manufacturing: Technology, applications and research needs. Front. Mech. Eng. 2013, 8, 215–243. [Google Scholar] [CrossRef]
  7. Lowther, M.; Louth, S.; Davey, A.; Hussain, A.; Ginestra, P.; Carter, L.; Eisenstein, N.; Grover, L.; Cox, S. Clinical, industrial, and research perspectives on powder bed fusion additively manufactured metal implants. Addit. Manuf. 2019, 28, 565–584. [Google Scholar] [CrossRef] [Green Version]
  8. Srivastava, M.; Rathee, S. Additive manufacturing: Recent trends, applications and future outlooks. Prog. Addit. Manuf. 2022, 7, 261–287. [Google Scholar] [CrossRef]
  9. Yu, T.; Hyer, H.; Sohn, Y.; Bai, Y.; Wu, D. Structure-property relationship in high strength and lightweight AlSi10Mg microlattices fabricated by selective laser melting. Mater. Des. 2019, 182, 108062. [Google Scholar] [CrossRef]
  10. Ming, X.; Song, D.; Yu, A.; Tan, J.; Zhang, Q.; Zhang, Z.; Chen, J.; Lin, X. Effect of heat treatment on microstructure, mechanical and thermal properties of selective laser melted AlSi7Mg alloy. J. Alloys Compd. 2023, 945, 169278. [Google Scholar] [CrossRef]
  11. Raja, A.; Cheethirala, S.R.; Gupta, P.; Vasa, N.J.; Jayaganthan, R. A review on the fatigue behaviour of AlSi10Mg alloy fabricated using laser powder bed fusion technique. J. Mater. Res. Technol. 2022, 17, 1013–1029. [Google Scholar] [CrossRef]
  12. Zhao, L.; Song, L.; Macías, J.G.S.; Zhu, Y.; Huang, M.; Simar, A.; Li, Z. Review on the correlation between microstructure and mechanical performance for laser powder bed fusion AlSi10Mg. Addit. Manuf. 2022, 56, 102914. [Google Scholar] [CrossRef]
  13. Laursen, C.M.; DeJong, S.A.; Dickens, S.M.; Exil, A.N.; Susan, D.F.; Carroll, J.D. Relationship between ductility and the porosity of additively manufactured AlSi10Mg. Mater. Sci. Eng. A 2020, 795, 139922. [Google Scholar] [CrossRef]
  14. Pascual, A.; Ortega, N.; Plaza, S.; López de Lacalle, L.N.; Ukar, E. Analysis of the influence of L-PBF porosity on the mechanical behavior of AlSi10Mg by XRCT-based FEM. J. Mater. Res. Technol. 2023, 22, 958–981. [Google Scholar] [CrossRef]
  15. Tridello, A.; Fiocchi, J.; Biffi, C.A.; Chiandussi, G.; Rossetto, M.; Tuissi, A.; Paolino, D.S. Effect of microstructure, residual stresses and building orientation on the fatigue response up to 109 cycles of an SLM AlSi10Mg alloy. Int. J. Fatigue 2020, 137, 105659. [Google Scholar] [CrossRef]
  16. Sausto, F.; Carrion, P.E.; Shamsaei, N.; Beretta, S. Fatigue failure mechanisms for AlSi10Mg manufactured by L-PBF under axial and torsional loads: The role of defects and residual stresses. Int. J. Fatigue 2022, 162, 106903. [Google Scholar] [CrossRef]
  17. Du Plessis, A.; Beretta, S. Killer notches: The effect of as-built surface roughness on fatigue failure in AlSi10Mg produced by laser powder bed fusion. Addit. Manuf. 2020, 35, 101424. [Google Scholar] [CrossRef]
  18. Leon, A.; Aghion, E. Effect of surface roughness on corrosion fatigue performance of AlSi10Mg alloy produced by Selective Laser Melting (SLM). Mater. Charact. 2017, 131, 188–194. [Google Scholar] [CrossRef]
  19. Bagherifard, S.; Beretta, S.; Monti, S.; Riccio, M.; Bandini, M.; Guagliano, M. On the fatigue strength enhancement of additive manufactured AlSi10Mg parts by mechanical and thermal post-processing. Mater. Des. 2018, 145, 28–41. [Google Scholar] [CrossRef]
  20. Maleki, E.; Bagherifard, S.; Razavi, S.M.J.; Riccio, M.; Bandini, M.; Du Plessis, A.; Berto, F.; Guagliano, M. Fatigue behaviour of notched laser powder bed fusion AlSi10Mg after thermal and mechanical surface post-processing. Mater. Sci. Eng. A 2022, 829, 142145. [Google Scholar] [CrossRef]
  21. Luo, P.; Yao, W.; Li, P. A notch critical plane approach of multiaxial fatigue life prediction for metallic notched specimens. Fatigue Fract. Eng. Mater. Struct. 2019, 42, 854–870. [Google Scholar] [CrossRef]
  22. Mahtabi, M.J.; Shamsaei, N. A modified energy-based approach for fatigue life prediction of superelastic NiTi in presence of tensile mean strain and stress. Int. J. Mech. Sci. 2016, 117, 321–333. [Google Scholar] [CrossRef] [Green Version]
  23. Liao, D.; Zhu, S.P.; Keshtegar, B.; Qian, G.; Wang, Q. Probabilistic framework for fatigue life assessment of notched components under size effects. Int. J. Mech. Sci. 2020, 181, 105685. [Google Scholar] [CrossRef]
  24. Gao, T.; Tong, Y.; Zhan, Z.; Mei, W.; Hu, W.; Meng, Q. Development of a non-local approach for life prediction of notched specimen considering stress/strain gradient and elastic-plastic fatigue damage. Int. J. Damage Mech. 2022, 31, 1057–1081. [Google Scholar] [CrossRef]
  25. Zhan, Z. Fatigue life calculation for TC4-TC11 titanium alloy specimens fabricated by laser melting deposition. Theor. Appl. Fract. Mech. 2018, 96, 114–122. [Google Scholar] [CrossRef]
  26. Wang, H.; Liu, X.; Wang, X.; Wang, Y. Numerical method for estimating fatigue crack initiation size using elastic–plastic fracture mechanics method. Appl. Math. Model. 2019, 73, 365–377. [Google Scholar] [CrossRef]
  27. Cao, M.; Liu, Y.; Dunne, F.P.E. A crystal plasticity approach to understand fatigue response with respect to pores in additive manufactured aluminium alloys. Int. J. Fatigue 2022, 161, 106917. [Google Scholar] [CrossRef]
  28. Carrara, P.; Ambati, M.; Alessi, R.; De Lorenzis, L. A framework to model the fatigue behavior of brittle materials based on a variational phase-field approach. Comput. Methods Appl. Mech. Eng. 2020, 361, 112731. [Google Scholar] [CrossRef]
  29. Yasbolaghi, R.; Khoei, A. Micro-structural aspects of fatigue crack propagation in atomistic-scale via the molecular dynamics analysis. Eng. Fract. Mech. 2020, 226, 106848. [Google Scholar] [CrossRef]
  30. Liu, S.; Shi, W.; Zhan, Z.; Hu, W.; Meng, Q. On the development of error-trained BP-ANN technique with CDM model for the HCF life prediction of aluminum alloy. Int. J. Fatigue 2022, 160, 106836. [Google Scholar] [CrossRef]
  31. Gao, T.; Ji, C.; Zhan, Z.; Huang, Y.; Liu, C.; Hu, W.; Meng, Q. A novel defect-based fatigue damage model coupled with an optimized neural network for high-cycle fatigue analysis of casting alloys with surface defect. Int. J. Fatigue 2023, 170, 107538. [Google Scholar] [CrossRef]
  32. Lemaitre, J.; Desmorat, R. Engineering Damage Mechanics: Ductile, Creep, Fatigue and Brittle Failures; Springer Science & Business Media: Berlin, Germany, 2006. [Google Scholar]
  33. Liu, N.; Cui, X.; Xiao, J.; Lua, J.; Phan, N. A simplified continuum damage mechanics based modeling strategy for cumulative fatigue damage assessment of metallic bolted joints. Int. J. Fatigue 2020, 131, 105302. [Google Scholar] [CrossRef]
  34. Shen, F.; Zhao, B.; Li, L.; Chua, C.K.; Zhou, K. Fatigue damage evolution and lifetime prediction of welded joints with the consideration of residual stresses and porosity. Int. J. Fatigue 2017, 103, 272–279. [Google Scholar] [CrossRef]
  35. Wang, D.; Tan, D.; Liu, L. Particle swarm optimization algorithm: An overview. Soft Comput. 2018, 22, 387–408. [Google Scholar] [CrossRef]
  36. Marinakis, Y.; Iordanidou, G.R.; Marinaki, M. Particle swarm optimization for the vehicle routing problem with stochastic demands. Appl. Soft Comput. 2013, 13, 1693–1704. [Google Scholar] [CrossRef]
  37. Jian, Z.M.; Qian, G.A.; Paolino, D.S.; Tridello, A.; Berto, F.; Hong, Y.S. Crack initiation behavior and fatigue performance up to very-high-cycle regime of AlSi10Mg fabricated by selective laser melting with two powder sizes. Int. J. Fatigue 2021, 143, 106013. [Google Scholar] [CrossRef]
  38. Zhan, Z.; Li, H.; Lam, K.Y. Development of a novel fatigue damage model with AM effects for life prediction of commonly-used alloys in aerospace. Int. J. Mech. Sci. 2019, 155, 110–124. [Google Scholar] [CrossRef]
  39. Li, S.; He, H.; Li, J. Big data-driven lithium-ion battery modeling method based on SDAE-ELM algorithm and data pre-processing technology. Appl. Energy 2019, 242, 1259–1273. [Google Scholar] [CrossRef]
  40. Kaveh, A.; Dadras Eslamlou, A.; Javadi, S.M.; Geran Malek, N. Machine learning regression approaches for predicting the ultimate buckling load of variable-stiffness composite cylinders. Acta Mech. 2021, 232, 921–931. [Google Scholar] [CrossRef]
  41. Zhang, J.; Ma, G.; Huang, Y.; Sun, J.; Aslani, F.; Nener, B. Modelling uniaxial compressive strength of lightweight self-compacting concrete using random forest regression. Constr. Build. Mater. 2019, 210, 713–719. [Google Scholar] [CrossRef]
  42. Song, Y.; Liang, J.; Lu, J.; Zhao, X. An efficient instance selection algorithm for k nearest neighbor regression. Neurocomputing 2017, 251, 26–34. [Google Scholar] [CrossRef]
  43. Song, J.; Zhao, J.; Dong, F.; Zhao, J. A novel regression modeling method for PMSLM structural design optimization using a distance-weighted KNN algorithm. IEEE Trans. Ind. Appl. 2018, 54, 4198–4206. [Google Scholar] [CrossRef]
Figure 1. Stress–strain curve of AM AlSi10Mg with different powder sizes.
Aerospace 10 00586 g001
Figure 2. (a) One-eighth finite element model and (b) schematic diagram of boundary conditions.
Aerospace 10 00586 g002
Figure 3. For the AM AlSi10Mg specimen with the powder sizes of 20 μm under R = 0 and S m a x = 79.92   M P a , (a) von Mises stress distribution and (b) damage distribution.
Aerospace 10 00586 g003
Figure 4. The variations in damage and elastic modulus against the number of cycles for the powder size of 20 μm.
Aerospace 10 00586 g004
Figure 5. For the AM AlSi10Mg specimen with the powder sizes of 50 μm under R = 1 and S m a x = 92.81   M P a , (a) von Mises stress distribution and (b) damage distribution.
Aerospace 10 00586 g005
Figure 6. The variations in damage and elastic modulus against the number of cycles for the powder size of 50 μm.
Aerospace 10 00586 g006
Figure 7. The predicted fatigue life versus experimental data for the AM AlSi10Mg specimen.
Aerospace 10 00586 g007
Figure 8. Variation in the predicted fatigue lives versus experimental data (a) by the RF model and (b) by the KNN model.
Aerospace 10 00586 g008aAerospace 10 00586 g008b
Figure 9. With different stress ratios (R = −1, 0, 0.5) and powder sizes (20 μm and 50 μm), the variation in the maximum stress versus fatigue life (a) shorter than 107 and (b) longer than 107.
Aerospace 10 00586 g009
Figure 10. With the fatigue load of R = −1 and σmax = 70 MPa for both powder sizes, (a) variation in the damage degree versus the number of cycles and (b) variation in the damage evolution rate versus the number of cycles.
Aerospace 10 00586 g010
Figure 11. With the fatigue load of R = 0 and σmax = 125 MPa for both powder sizes, (a) variation in the damage degree versus the number of cycles and (b) variation in the damage evolution rate versus the number of cycles.
Aerospace 10 00586 g011
Table 1. Static performance parameters of AM AlSi10Mg with different powder sizes.
Powder SizeC1C2C3γ1γ2γ3
20 μm10,0006569.4210,000983.2529.34983.25
50 μm10,00061639673.034999.7629.064671.39
Table 2. Fatigue damage parameters of AM AlSi10Mg with different powder sizes.
Powder Size/μmFatigue Life Rangeαβnm
20<1072.18 × 10−112.60.0022842.20
≥1072.83 × 10−142.60.0007912.43
50<1074.56 × 10−111.50.0008021.90
≥1071.00 × 10−181.50.0019964.72
Table 3. Evaluation metrics of ML and numerical model prediction for AM AlSi10Mg.
RF ModelKNN ModelNumerical Model
MSE0.190.280.34
R20.710.630.58
Disclaimer/Publisher’s Note: The statements, opinions and data contained in all publications are solely those of the individual author(s) and contributor(s) and not of MDPI and/or the editor(s). MDPI and/or the editor(s) disclaim responsibility for any injury to people or property resulting from any ideas, methods, instructions or products referred to in the content.

