Article

Validating Automatic Speech Recognition and Understanding for Pre-Filling Radar Labels—Increasing Safety While Reducing Air Traffic Controllers’ Workload

1
German Aerospace Center (DLR), Institute of Flight Guidance, Lilienthalplatz 7, 38108 Braunschweig, Germany
2
Austro Control, 1030 Vienna, Austria
3
Idiap Research Institute, 1920 Martigny, Switzerland
4
École Polytechnique Fédérale de Lausanne (EPFL), 1015 Lausanne, Switzerland
*
Author to whom correspondence should be addressed.
Aerospace 2023, 10(6), 538; https://doi.org/10.3390/aerospace10060538
Submission received: 21 March 2023 / Revised: 15 May 2023 / Accepted: 22 May 2023 / Published: 5 June 2023

Abstract

:
Automatic speech recognition and understanding (ASRU) for air traffic control (ATC) has been investigated in different ATC environments and applications. The objective of this study was to quantify the effect of ASRU support for air traffic controllers (ATCos) radar label maintenance in terms of safety and human performance. Therefore, an implemented ASRU system was validated within a human-in-the-loop environment by ATCos in different traffic-density scenarios. In the baseline condition, ATCos performed radar label maintenance by entering verbally instructed ATC commands with a mouse and keyboard. In the proposed solution, ATCos were supported by ASRU, which achieved a command recognition rate of 92.5% with a command error rate of 2.4%. ASRU support reduced the number of wrong or missing inputs from ATCos into the radar label by a factor of two, which contemporaneously improved their situational awareness. Furthermore, ATCos where able to perform more successful secondary tasks when using ASRU support, indicating a greater capacity to handle unexpected events. The results from NASA TLX showed that the perceived workload decreased with a statistical significance of 4.3% across all scenarios. In conclusion, this study provides evidence that using ASRU for radar label maintenance can significantly reduce workload and improve flight safety.

1. Introduction on Speech Recognition and Understanding

Speech recognition technology has made significant progress since its inception in the 1950s, with advancements in machine learning and artificial intelligence leading to increasingly sophisticated systems. Today, speech recognition technology has become an integral part of everyday life, with applications ranging from virtual assistants such as Siri and Alexa to transcription services for the hard of hearing and support functions for air traffic controllers (ATCos). However, recognizing word sequences is not the final step in creating good assistance functionality. It is crucial to understand the meaning behind word sequences. By incorporating the extracted meaning of recognized word sequences into assistance functionalities, one can measure the benefit for human operators using these support systems. The higher the technology readiness level of these support systems, which encompass the entire chain from word recognition to meaning comprehension and assistant system integration, the more realistic experiments can be conducted to assess the expected impact on human factors such as usability, workload, and errors.

1.1. Study on Speech Recognition and Understanding in a Broad Air Traffic Control Context

In Section 1.1.1, the concept of automatic speech recognition and understanding (ASRU) will be explained. Thereafter, the main research fields will be addressed and ASRU will be placed within the context of the air traffic management (ATM) domain. This section will conclude with a summary on the findings of human factors in the air traffic control context.

1.1.1. What Is Automatic Speech Recognition and Understanding in Air Traffic Control?

The concept behind automatic speech recognition and understanding in air traffic control will be outlined in the following example: An ATCo utters the following in radiotelephony communication with a flight crew: “air serbia seven echo lima descend four thousand feet, QNH one zero one one” with a hesitation after the QNH. The definition of common rules for transcribing such utterances may seem straightforward, but it is necessary to facilitate data exchange and minimize potential information-lossy conversion methods. In the above transcription, there might be a few cases where different notations regarding word combinations, upper case letters, and verbal hesitations are reasonable, such as:
  • “air serbia” versus “airserbia”
  • “~q~n~h” versus “q n h“ versus. “QNH“ for spelled letters
  • “[hes]” for hesitations and thinking louds versus. “_aeh_”, “hmm”, “umm”
The HAAWAII project introduced transcription rules to normalize ATC communications [1].
The interpretation of the example transcription meaning could then be extracted as: “ASL7EL DESCEND 4000 ft, ASL7EL INFORMATION QNH 1011”. Furthermore, discussions regarding the rules for annotating utterances can help to maximize the use of automatic extraction algorithms, as can be understood from alternative suggestions on how the above ATCo utterance can be annotated:
  • ASL7EL descend 4000, qnh 1011
  • ASL 7EL DESCEND 4000 feet, QNH 1011
  • Asl7el desc 4000, Asl7el qnh 1011
The annotation rules, i.e., an ontology, for the above example in quotation marks, were first defined and agreed upon by the major European ATM stakeholders [2].
While the above transcription and annotation rules may appear straightforward, the challenge arises when dealing with greater variation in the utterances and especially deviations of ATC communications from the International Civil Aviation Organization (ICAO) phraseology [3]. Hence, the transcription of a potential pilot readback “serbia echo lima going down four thousand on the QNH one zero double one” should result in the same annotation as shown above for the ATCo utterance—with speaker “pilot” instead of “ATCo” and reason “readback”—in order to perform simple readback error checks. The complexity increases when numbers and terms are omitted or callsigns are abbreviated without adhering to defined abbreviation rules. Thus, ASRU in ATC is understood as the chain from receiving an audio signal via speech-to-text to extracting text-to-concepts in a defined format. These formats do not consider the storage method for communications inside software modules, i.e., using a structured data exchange format such as JavaScript Object Notation (JSON), and incorporating the information from different interpretation layers and recognition hypotheses.

1.1.2. What Are the Main Research Fields for Application of ASRU in ATM Domain?

The main research fields for applying ASRU in the ATM domain have varied over the last decades. Early applications focused on support in ATC training and reducing the workload of pseudo-pilots in simulations [4]. Subsequently, there was a shift towards offline analyses that assessed workload [5]. In this research, command types were extracted and counted over specific time periods [6].
In recent years, research has concentrated on quantifying the impacts of ASRU support on human performance and safety. Additionally, studies have analyzed the effects of support systems for radar label and flight strip maintenance on ATCo workload [7], resulting in changes in flight efficiency [8]. ATCos have historically used paper flight strips to manage their aircraft and corresponding clearances. These flight strips usually contained static information about the aircraft such as callsign, wake vortex categories, and designated route, as well as the aircraft’s dynamic clearances such as altitude, speed, and course. Currently, electronic flight strips or interactive on-screen aircraft labels are used. However, these systems still require manual input from ATCos to update clearances. Although ATCos are used to communicate and input clearances simultaneously, the manual input requires additional workload from ATCos. Conversely, ASRU systems can be employed for automatic radar label input to remedy this effect. ATCos only need to verify the automatic input and make corrections in rare cases. This can offset the workload increase while allowing mental capacity to be directed to other tasks.
In addition, the advancement of automatic readback error detection in ATC communication—one of the most complex tasks of ASRU in ATC—is progressing. However, despite efforts to group communication threads and compare command content based on real-life operational data, the progress remains limited [9]. Throughout these developments, the need for metrics to measure the ASRU performance arose. Different metrics, such as recognition rates and error rates for complete commands and callsigns, have emerged, which are related to precision and recall [10].
In general, the benefit of more recent applications is the greater amount of usable data and the utilization of machine learning techniques [11]. However, ASRU is still not yet in operational use in ATC.

1.1.3. Human Factors in an Air Traffic Control Context

The effect of ASRU support, with command error rates below 2%, on ATCo workload has already been validated in the project AcListant®–Strips (Active Listening Assistant) project [12]. To validate the effects of ASRU support on ATCo workload, it is important to understand the different dimensions of workload. In this context, the mental workload of ATCos is connected to the task performed and related requirements, as detailed in [13]. The time for maintaining radar labels with similar user interfaces with and without ASRU support was measured using the Dusseldorf approach on a single runway as early as 2015 [8]. The time for clicking and maintaining the radar labels was reduced by a factor of three for the eight German and Austrian ATCos when they were supported by ASRU. This resulted in a better use of their mental capacity, leading to more efficient aircraft trajectories and a reduction of 60 L of fuel consumption per aircraft [8]. Furthermore, the project “Digital Tower Technologies—HMI Interaction modes for Airport Tower” investigated the impact of ASRU support for electronic flight strip maintenance. The ten Lithuanian and Austrian ATCos experienced a reduction of workload based on a secondary task measurement when ASRU [7] achieved command recognition rates of 90% and callsign recognition rates of 94%.

1.2. Research Question

Based on above-mentioned conditions, the main research question of this paper can be summarized as follows: “how can we quantify the effect of ASRU support for ATCos in radar label maintenance in terms of safety and ATCos’ workload?”
To answer this main question, the following research questions are discussed in this paper:
  • How accurately does ASRU extract commands that influence radar label entries?
  • How many incorrect or missing radar label entries exist with and without ASRU support?
In addition to the previous derived questions, we also considered whether the ATCos corrected missing or wrong ASRU outputs.
Both questions were addressed using objective measurements, such as command recognition error rates.
  • What are the consequences of over-trust or under-trust in the ASRU system?
This question is addressed through subjective data based on post-run and post-validation questionnaires, as well as objective data recorded during the simulation runs.
  • How can we compensate for sequence effects induced by multiple runs under similar conditions?
The presented statistical approach allows us to obtain results with higher statistical significance without increasing the number of participants involved.

1.3. Structure of the Paper

In Section 2, the human-in-the-loop validation trials for radar label maintenance are described, including the study parameters, simulation framework, and the methods and techniques used. Additionally, the ASRU architecture is explained. Section 3 begins by presenting the subjective and objective measurements for workload, safety, and situational awareness. It then discusses the applied method to compensate for sequence effects within the objective results, considering both the ATCos’ performance and ASRU performance. This is followed by the presentation of the results and discussion in Section 4. Finally, Section 5 draws a conclusion based on the results.

2. Validation Trials and Methods

The aim of the validation trials was to provide a final assessment of the ASRU by quantifying its benefits on the ATCos’ performance, perceived workload, and flight safety. The difference between the baseline runs and the solution runs was the absence or presence of ASRU support for radar label maintenance in approach control. The ATC approach position was chosen as it is a highly dynamic area and is usually crowded with aircrafts at hub airports such as Vienna. The aircrafts that the ATCos needed to handle in the approach sector had already been handed over from en-route sectors and required guidance towards their final destination for a transfer of control to the tower. Therefore, it was expected that using ASRU for radar label maintenance would have an impact. In the following the general setup for the validation trials, the simulation scenarios, and the collection of results are discussed.

2.1. Infrastructure and Exercises

The ASRU validation trials were performed using the Air Traffic Management and Operation Simulator (ATMOS) at DLR’s Air Traffic Validation Center. The ATMOS provided a human-in-the-loop simulation environment [14,15], which EUROCONTROL recognizes as a suitable validation method [16] for systems in the pre-industrial development phase [17]. Furthermore, the ATMOS has been previously used in several validation campaigns including mental workload analysis for air traffic controllers [18], analysis of air traffic management security [19], and assessing the impact of spaceflights on air traffic management [20]. The NARSIM software (version 8.3) [21] was deployed as a generic real-time software. Aircraft performance was modeled using the Base of Aircraft Data (BADA) model, version 3.15, from EUROCONTROL [22]. Two controller working positions (CWP) and six simulation-pilot working positions (SWP) were configured. During a simulation run, only one CWP and a maximum five SWP were used, depending on the traffic load. The second CWP and SWPs served as backups to provide redundancy in case of system failure. Furthermore, during an active simulation run, the unused CWP was already prepared for the next simulation run, which saved time and reduced procedural errors.
The ATCos’ verbal utterances served as the voice input signal for the ASRU system, specifically the speech recognition engine, which was the first part of the chain. The communication between the ATCo and simulation-pilot was carried out according to the defined phraseology by ICAO [23]. Figure 1 shows the CWP setup, which included the main radar screen, a voice-over-IP (VoIP) headset, an ASRU log, and a secondary screen. These components will be explained in detail later on.
Simulation-pilots were responsible for steer their aircrafts and implementing aircraft clearances received from Approach ATCos. A DLR-developed human–machine interface (HMI) was used for the SWP. The HMI included a radar screen and a flight strip section. The flight strip section displayed aircraft performance data (such as velocity, flight level, and route) and contained a command line to enter clearances. CWP and SWPs, located in different rooms, were connected via VoIP.
The validation trials were structured in three iterative campaigns. The first two campaigns for preparing the main trials took place in autumn 2021 and spring 2022. The main campaign was carried out from 14 September until 3 November 2022. In total, twelve ATCos from the Austrian air navigation service provider (ANSP) Austro Control participated in the main campaign, consisting of eleven male ATCos and one female ATCo. The age of participants ranged from 25 to 44 years, with a mean age of 32 years and a standard deviation (SD) of SD = 7.3. Their work experience ranged from one to 20 years, with a mean work experience of eight years (SD = 6.8). During the preparation campaigns (autumn 2021, spring 2022) the ATCos wore face masks in accordance with COVID-19 pandemic rules. During the main campaign, no face masks were required for ATCos. Wearing face masks had no significant effect on ASRU performance.

2.2. Simulation Components

The simulation was implemented for the Vienna airport (LOWW) terminal maneuvering area (TMA), as shown in the approach chart of Vienna in Figure 2. Figure 3 shows the main radar screen for ATCos with LOWW airspace. The ATCos’ area of responsibility encompassed a combined pickup/feeder sector in Europe (feeder/final in the U.S.). LOWW consists of two dependent runways. During the simulation, runway 34 (RWY34) with a length of 3600 m was utilized. The ATCo was in charge of guiding the arrival streams to RWY34. No departures, overflights, or other types of traffic, such as visual flight rule traffic, were integrated into the simulation runs. There were no limitations regarding the aircraft type or simulated weather restrictions. Furthermore, no emergency situations or non-nominal situations such as bird strikes or runway closures were analyzed.
A within-subject design [25,26] with the two factors “traffic flow” and “use of ASRU” was used to examine the dependent variables including mental workload, safety, situational awareness, time for maintaining radar label cells, and number of remaining incorrect inputs. Although the present experiment was conducted with a limited number of participants in the specific airspace of Vienna using a prototypic non-operation user interface, the results yielded statistical significance and were consistent with the findings from the AcListant®–Strips project conducted using the Dusseldorf approach [8,12].
Two different simulation scenarios were developed: a medium-density traffic scenario (M) with 30 arrivals per hour and a high-density traffic scenario (H) with 42 arrivals per hour. Additionally, a training traffic scenario (T) with 20 arrivals per hour was used as introductory exercise. These scenarios were developed based on recorded operational data from LOWW. For that reason, traffic flow corresponded to typical numbers and types at LOWW. All simulation scenarios (M, H) lasted for 35 min. At the beginning of the simulation scenarios, the aircrafts were already located inside the TMA under the responsibility of the ATCo. The other aircrafts were initiated outside the TMA and followed standard arrival routes (STAR)s towards the area navigation (RNAV) routes, as depicted in Figure 2 and Figure 3. Before entering the TMA, simulation-pilots set the standard initial call according to the currently applied radio telephony procedures.
Each validation day consisted of five simulation sections per ATCo. These sections were distinguished by the following design factors: traffic flow (T, M, H) and use of ASRU. Simulation sections without ASRU support for the ATCos were referred as baseline runs. These runs represented the typical manual mouse-only input approach for radar label maintenance in the ATCo HMI. Simulation sections with ASRU support were labelled as solution runs. During the solution runs, ATCos were able to use the ASRU inputs and manual mouse input for potential corrections. Regarding the traffic flow, each ATCo started with a training run to familiarize themselves with the setup and input modalities. The support of ASRU was activated and deactivated during the training run. Afterwards, the ATCos started with an M run followed by an H run. Then, another M run was followed by the final H run. As for second decisive variable, seven ATCos started with a solution run. Among them, five of the ATCos had no ASRU support during the first simulation run. The indention was for a 50% distribution between starting with and without ASRU support. However, due to problems with the surveillance data, one runs was cancelled and needed to be repeated at the end. If an ATCo began with a solution run, she/he also ended with a solution run, with two baseline runs in between. The same procedure was applied in reverse if starting and ending with a baseline run.
Two ATCos were available on each of the six validation days. They started at 08:30 a.m. and finished the validation day at approximately 04:30 p.m. Following the previously described procedure, while one ATCo executed a simulation run, the other ATCo filled in questionnaires and rested. As a result, the ATCos did not work in parallel. All the questionnaires used in the study are described in Section 3.1. By alternating the order of simulation runs for approximately half of the ATCos, it was expected that any sequence effects or effects of exhaustion would be averaged out. While this approach helped to some degree, it still had undesired negative effects on the statistical significance of the results. In Section 3.3 a technique to compensate for these sequence effects will be presented.

2.3. HMI for Radar Label Maintenance

The ATCos were provided with three different screens, as shown in Figure 1. Figure 4a–d shows the aircraft labels in detail. Figure 4a displays the reduced data block with the following structure: the first row contained the callsign, the second row included flight level, cleared flight level, ground speed, and cleared ground speed, while the third row showed heading, waypoint, and RNAV route. In Figure 4b, the aircraft label is shown as a full data block in which the fourth label line was visibly activated through a mouse-over hovering function. The fourth label line additionally provided the present heading, remarks, and rate of climb/descent. The nine cells framed in white (highlighted for visualization purposes in the paper) could be interactively selected via a mouse click. Figure 4c shows the full data block with recognized clearances from ASRU displayed in purple. It also offers two checkmarks in the first label line. If an interactive cell was clicked, a correspondent drop-down menu appeared for value selection (see Figure 4d).
If ATCos were provided with ASRU support in solution runs, the content of their verbal utterances was automatically extracted and transformed into relevant ASRU output values. These recognized values appeared in purple, as shown in the label cells of Figure 4c. Additionally, a yellow Reject and green Accept checkmark appeared in the top line of the label. Thus, ATCos could confirm all of the proposed values or reject them by clicking on the buttons. The accepted values turned the light green, matching the color of the rest of the aircraft clearances. In rare cases of misrecognitions, the ATCos needed to correct values manually via drop-down menus. If the ATCo did not interact with the label, the recognized values were automatically accepted after ten seconds. This time parameter was determined based on [8,27].

2.4. Additional Components

Figure 5 shows the SpeechLog provided at the CWP, as shown on the left side of Figure 1. The SpeechLog was not essential for the ATCos to operate the setup. Instead, it served as a showcase and was not considered part of the experimental setup. Nevertheless, the SpeechLog displayed an overview of the recognized ATCo utterances (word level transcriptions) and meanings (annotations with ATC concepts following the defined ontology).
Finally, Figure 6 shows the SWP HMI of the simulation pilots. It provided flight strips for all aircraft within the airspace, displayed as purple strips, indicating upcoming aircrafts (left side) or those already in progress (middle). It also included a radar screen for an overview of the traffic situation (right side). Additionally, the simulation-pilots saw the ASRU word level output for comparison with or support of the self-recognized utterances. The ASRU word level output was provided in the lower left part.

2.5. Automatic Speech Recognition and Understanding

The validation software implemented the ASRU system as defined by the HAAWAII project (Highly Automated Air traffic controller Workstations with Artificial Intelligence Integration) [28]. The ASRU core mainly relied on four modules, as shown in Figure 7. The modules have already been described in detail in [29]. Here, we provide a brief summary of their functionality. In addition to the information provided in [29], we quantified the effect of the main modules to the final performance in Section 4.1 of the results.
Voice Activity Detection (VAD): The VAD process is relatively straightforward, as the push-to-talk (PTT) signal is readily available. It did not have a significant impact on the performance.
Speech-to-text (S2T): Whenever the VAD detects a transmission, the signal is forwarded to S2T, and the recognition process starts in real time. S2T delivers with a minimum latency when an ATCo starts speaking and updates the recognized words continuously until the end of the transmission when the PTT button is released.
Concept Recognition: Each time a recognized word sequence is forwarded, it is analyzed by the Concept Recognition module. The analysis result is then transformed into relevant ATC concepts as defined by SESAR project PJ.16-04 CWP HMI [2] and extended by the HAAWAII project [30], as shown in Figure 8.
A command at the semantic level consists of a type, values, unit, qualifier, etc., as shown in Figure 8. All these parts must be correctly extracted at the semantic level to be counted as a correct recognition. Otherwise, it is counted as an error or a rejection.
Callsign Prediction: This module considers surveillance data to determine if any recognized callsign could reasonably be part of an ATCo utterance. The output is used by S2T and Concept Recognition to enhance the recognition quality for both modules. Further details on callsign prediction and callsign extraction can be found in [31]. This model is highly critical, as indicated by the results in Section 4.1.3. It considers the callsigns of aircrafts that are currently in the relevant airspace.

3. Methods and Techniques

3.1. Subjective ATCo Feedback Techniques

This section describes the methods and experiments used to obtain subjective feedback from the participating ATCos during the validation trials. The subjective rating measures encompassed various aspects of mental workload, situation awareness, usability, and acceptance. An instantaneous self-assessment of workload (ISA) measurement was integrated into the radar screen of the CWP and had to be answered during the simulation runs. The answers on several questionnaires were captured after each simulation run. The set of questionnaires included the NASA-TLX (National Aeronautics and Space Administration Task Load Index) [32], Bedford Workload Scale [33], SUS (System Usability Scale) [34], CARS (Controller Acceptance Rating Scale) [35], and the three SHAPE questionnaires (Solutions for Human Automation Partnerships in European ATM) [36]—SASHA (Situation Awareness for SHAPE) ATCo, SATI (SHAPE Automation Trust Index), and AIM (Assessing the Impact on Mental Workload). All methods and experiments are explained in the following sections.

3.1.1. NASA Task Load Index (NASA TLX)

The NASA TLX was used to assess different dimensions of the workload [32]. The questionnaire includes subscales of mental demand, physical demand, temporal demand, performance, effort, and frustration. In total, the questionnaire consisted of six questions with ten answer possibilities from (1) Low to (10) High. The adapted questions can be found in Appendix A.1.
The unweighted NASA TLX was used instead of the weighted version, as previous ATC projects showed no further benefit from weighting parameters and it often caused confusion of the ATCos.
The ISA measures were used to obtain the ATCos’ perceived mental workload within a defined time period [37]. Each ATCo was prompted to rate their perceived mental workload during the simulation run every five minutes for the last five minutes [38,39]. Therefore, after five minutes of simulation time, the ATCos heard a sound signal on their headset as a five-point Likert scale [40] appeared on the lower part of the radar screen. They were able to rate their perceived mental workload on a scale of one [underutilized] to five [excessively busy]. The ISA data were used afterwards to examine the mental workload. It is worth noting that in previous projects and the current study, ATCos usually did not rate their workload as a five, even during extremely busy traffic hours. Thus, there is a need for a more objective measure. Therefore, a secondary task was implemented, as described in Section 3.2.

3.1.2. Bedford Workload Scale

The Bedford Workload Scale consists of two questions that inquire about the average workload and the peak workload, with ten possible answers ranging from (1) “Workload insignificant” to (10) “Task Unsustainable due to Workload”, as shown in Figure 9. Additionally, the applied Bedford Workload Scale questionnaire had the following final open-ended question: “Which factors/events/conditions have contributed to potentially high workload?”.

3.1.3. System Usability Scale (SUS)

The System Usability Scale, initially proposed by John Brooke [34], was used to assess the general usability with and without the ASRU support. This questionnaire consists of ten statements to be rated on a five-point scale, ranging from (1) “fully disagree” to (5) “fully agree”. The adapted questions can be found in Appendix A.2.

3.1.4. Controller Acceptance Rating Scale (CARS)

The CARS questionnaire, developed by NASA Ames [35], measures the operational acceptability and serves as an indicator for the satisfaction of human-system performance. CARS consist of a single question: “Please read the descriptors and score your overall level of user acceptance experienced during the run. Please check the appropriate number between 1 and 10”. The different answer options were color-coded with red, orange, and green, as shown in Table 1.

3.1.5. Solutions for Human Automation Partnerships in European ATM (SHAPE)

The SHAPE questionnaire was developed to evaluate the effects of automation on different human factors for ATCos, such as workload, situation awareness, and trust in the system [36]. It consists of three parts, as described in the following sections. Each question had seven answer possibilities, ranging from “never” to “always” or from “none” to “extreme”. The questions can be found in Appendix A.3, Appendix A.4 and Appendix A.5.
For quantitative analysis, the answers were mapped to numerical values between one and seven. A numerical value of one corresponded to a good system, whereas seven corresponded to a bad system.

3.1.6. Situation Awareness for SHAPE (SASHA)

The SASHA questionnaire is part of the SHAPE questionnaire and addresses different dimensions of situation awareness [36]. This questionnaire consisted of six statements with the seven answer possibilities: “never”, “seldom”, “sometimes”, “often”, “more often”, “very often”, and “always”. The questions are provided in Appendix A.3.

3.1.7. SHAPE Automation Trust Index (SATI)

The SATI questionnaire is also part of the SHAPE questionnaire. SATI provides questions to measure the human trust in ATC systems [36]. This questionnaire consisted of six statements with the seven answer possibilities: “never”, “seldom”, “sometimes”, “often”, “more often”, “very often”, and “always”. The questions are provided in Appendix A.4.

3.1.8. Assessing the Impact on Mental Workload (AIM)

The AIM questionnaire, developed by Doris M. Dehn [36], assesses the impact of changes in the ATM system on the mental workload of ATCos. This questionnaire consisted of 15 questions with seven answer possibilities: “none”, “very little”, “little”, “some”, “much”, “very much”, and “extreme”. The questions are provided in Appendix A.5.

3.2. Objective Secondary Task for Workload Assessment: “Stroop Test”

As previously addressed, a more objective task to gather the mental workload of ATCos was needed. Therefore, a secondary task [41] based on the Stroop Test was integrated into the touch device located on the right side at the CWP [42] (see secondary screen in Figure 1). The central idea is that ATCos have the mental capacity to fulfil a secondary task in addition to their primary ATC task if they are underutilized. Evaluating the results of the secondary task indicates the amount of mental workload an ATCo experienced during the different simulation runs.
Figure 10 displays the interface of the secondary task. The secondary task started ten minutes after the simulation onset and provided a ten-minute execution window. The ATCos were able to begin the tasks within this time period whenever they felt comfortable with respect to handling the primary task, as shown in Figure 10a. After pressing the START button, the name of a color was displayed in a different color than the name itself in the upper display part, as shown in Figure 10b. In a next step, the ATCos had to select the color that was used for printing from the available options. In the example shown in Figure 10b, the correct solution was GREEN because the word “RED” was printed in green. After submitting their choice, the ATCo could proceed to the next task by clicking the START button. A higher number of correct responses indicated greater mental spare capacity and less mental workload occupied by the primary task [43].

3.3. Compensation of Sequence Effects

As an example, Table 2 shows the answers to the question “How hard did you have to work to accomplish your level of performance?” from the NASA TLX questionnaire completed by the 12 ATCos. The answers ranged from one (low effort) to ten (high effort) for the medium traffic scenario. Columns “ATCo Id” show the identifier of the participant. Columns “Sol” and “Base” show the chosen answer value. The number “1/2” indicates whether the participant started with a baseline or solution run (“1”) and ended with a baseline or solution run (“2”).
Due to sequence effects, the results in the second run generally showed improvements compared to the first run for the ATCos. This would have averaged out, if 50% of the participants would have started with the baseline and 50% would have started with the solution run, but with a high standard deviation. Therefore, we decided to filter out the sequence effects not only on average, but for each participant. Furthermore, a run with ATCo ID 2 failed and was repeated, resulting in seven ATCos starting the medium scenario with solution runs and only five with baseline runs. Therefore, sequence effects do not even compensate on average. The following approach adapted from [8], was used to compensate for these sequence effects:
The average values of all 12 ATCos for the first run and the second run were calculated, as shown in the last and second-to-last rows of Table 2. The averages of the last row were used to correct the feedback values for the question. The average value of all ATCos’ answers was 5.50 for the first run in the medium traffic scenario (the averages of all values in column “Sol 1” and column “Base 1” are marked in light yellow). In the second run with medium traffic, the ATCos answered with an average value of 3.42 (the averages of columns “Base 2” and “Sol 2” are marked in light green), and the ATCos performed 2.08 units better on the scale with a maximum value of 10 units. Therefore, we corrected all entries of Table 2 by 1.04 units. As shown in Table 3, the first runs, marked in light yellow, were corrected by subtracting 1.04, and second runs, marked in light green, were corrected by adding 1.04.
The described sequence effect compensation technique (SECT) could result in values below one or even negative values, which could not be provided by the ATCos. However, this is not important for the performed t-tests, as described in the following section. Only the differences between runs with and without ASRU support for the same ATCo are important.
The difference between runs with ASRU support and those without ASRU support was minus 0.58 (calculated as 7 × 1.3 – 5 × 3.2)/12) in Table 2. After compensating for sequence effects as shown in Table 3, the average difference becomes minus 0.93 ((−7 × 0.8 − 5 × 1.1)/12)). If we had an equal number of runs starting with ASRU support and without ASRU support, the average value would not change. This will be the case for all heavy traffic scenarios. As demonstrated in the results section, even for medium traffic, the differences changed only slightly with and without compensating for sequence effects. More importantly, the standard deviation of the differences decreased in most cases when SECT was applied. It decreased from 2.6 in Table 2 to 1.37 in Table 3. After applying SECT, the average results of all first runs always matched the average values of all second runs.
To conclude, the experiments involved two independent variables: (i) with or without ASRU support and (ii) whether the ATCos received ASRU support in first runs or in the second runs. The presented technique can compensate for sequence effects, enabling clearer observation of the results of the ASRU support. In the presented example, the sequence effect influenced the result by 2.08 units out of 10, whereas ASRU support had only an effect of 0.58 units. By using the described technique, both effects can be separated, resulting in an ASRU effect of 0.93.

3.4. Paired T-Test to Evaluate Statiscal Significance

The differences between runs of the same ATCo in baseline and solution runs smaller now, indicating a decrease in the standard deviation sigma. This observation was also supported by the performed paired t-test, which was previously applied during the AcListant®–Strips project mentioned earlier to assess workload reduction benefits [12] and improvements in flight efficiency [8].
The null hypothesis H0 states, “ASRU support does not decrease the amount of work, how hard the ATCo needs to work to accomplish the required level of performance”. The test value is defined as follows:
T = ( M µ 0 ) n S D ,
The differences in how the ATCo needs to work (solution minus baseline runs) for each run in Table 3 were calculated, for example, for ATCo ID 3 as seven minus five. The number of differences (ATCos) is denoted as n (12 in the present case). M represents the mean value of the questionnaire answer differences “Diff” in Table 3, which in the present case is minus 0.93. SD refers to the standard deviation of the differences, which was 1.37 based on the values in Table 3. It is only important if the ASRU input results in lower value answers to the questions. Therefore, µ0 was set to 0. With these values, we calculated T as minus 2.35.
The value T follows a t-distribution with n − 1 degrees of freedom. The null hypothesis H0 can be rejected with probability of α (also known as p-value) if the calculated value for T is less than the value of the inverse t-distribution at position tn−1,1−α with n − 1 degrees of freedom (in our case, −1.80 for α = 0.05). Therefore, the hypothesis H0 is rejected because T = −2.35 < −1.80. Even the minimal α can be calculated, such that T < tn−1, 1−α still holds. In this case, α = 3.8%. If we repeated our experiments with the 12 ATCos 1000 times, we could expect that the H0 would not be rejected only in 38 cases. The results invalidate the negatively formulated null hypothesis, indicating that ASRU support does decrease the amount of work required for the ATCO to accomplish the required level of performance with a probability of α = 3.8%.
The probabilities of rejecting the null hypotheses for the heavy traffic scenario and for both scenarios combined were also calculated. These calculations are presented later in Table 10 in the following results section.
The effects of SECT in distinguishing between the effects of ASRU support and sequence effects are evident. Without SECT, the α value was 45.3%, compared to 3.8% after applying SECT. Without SECT, there was the need for strongly different ratings from ATCos to achieve statistical significance, even if the results were significant with only slightly different ratings. Further details are provided in [29].

4. Results and Discussion

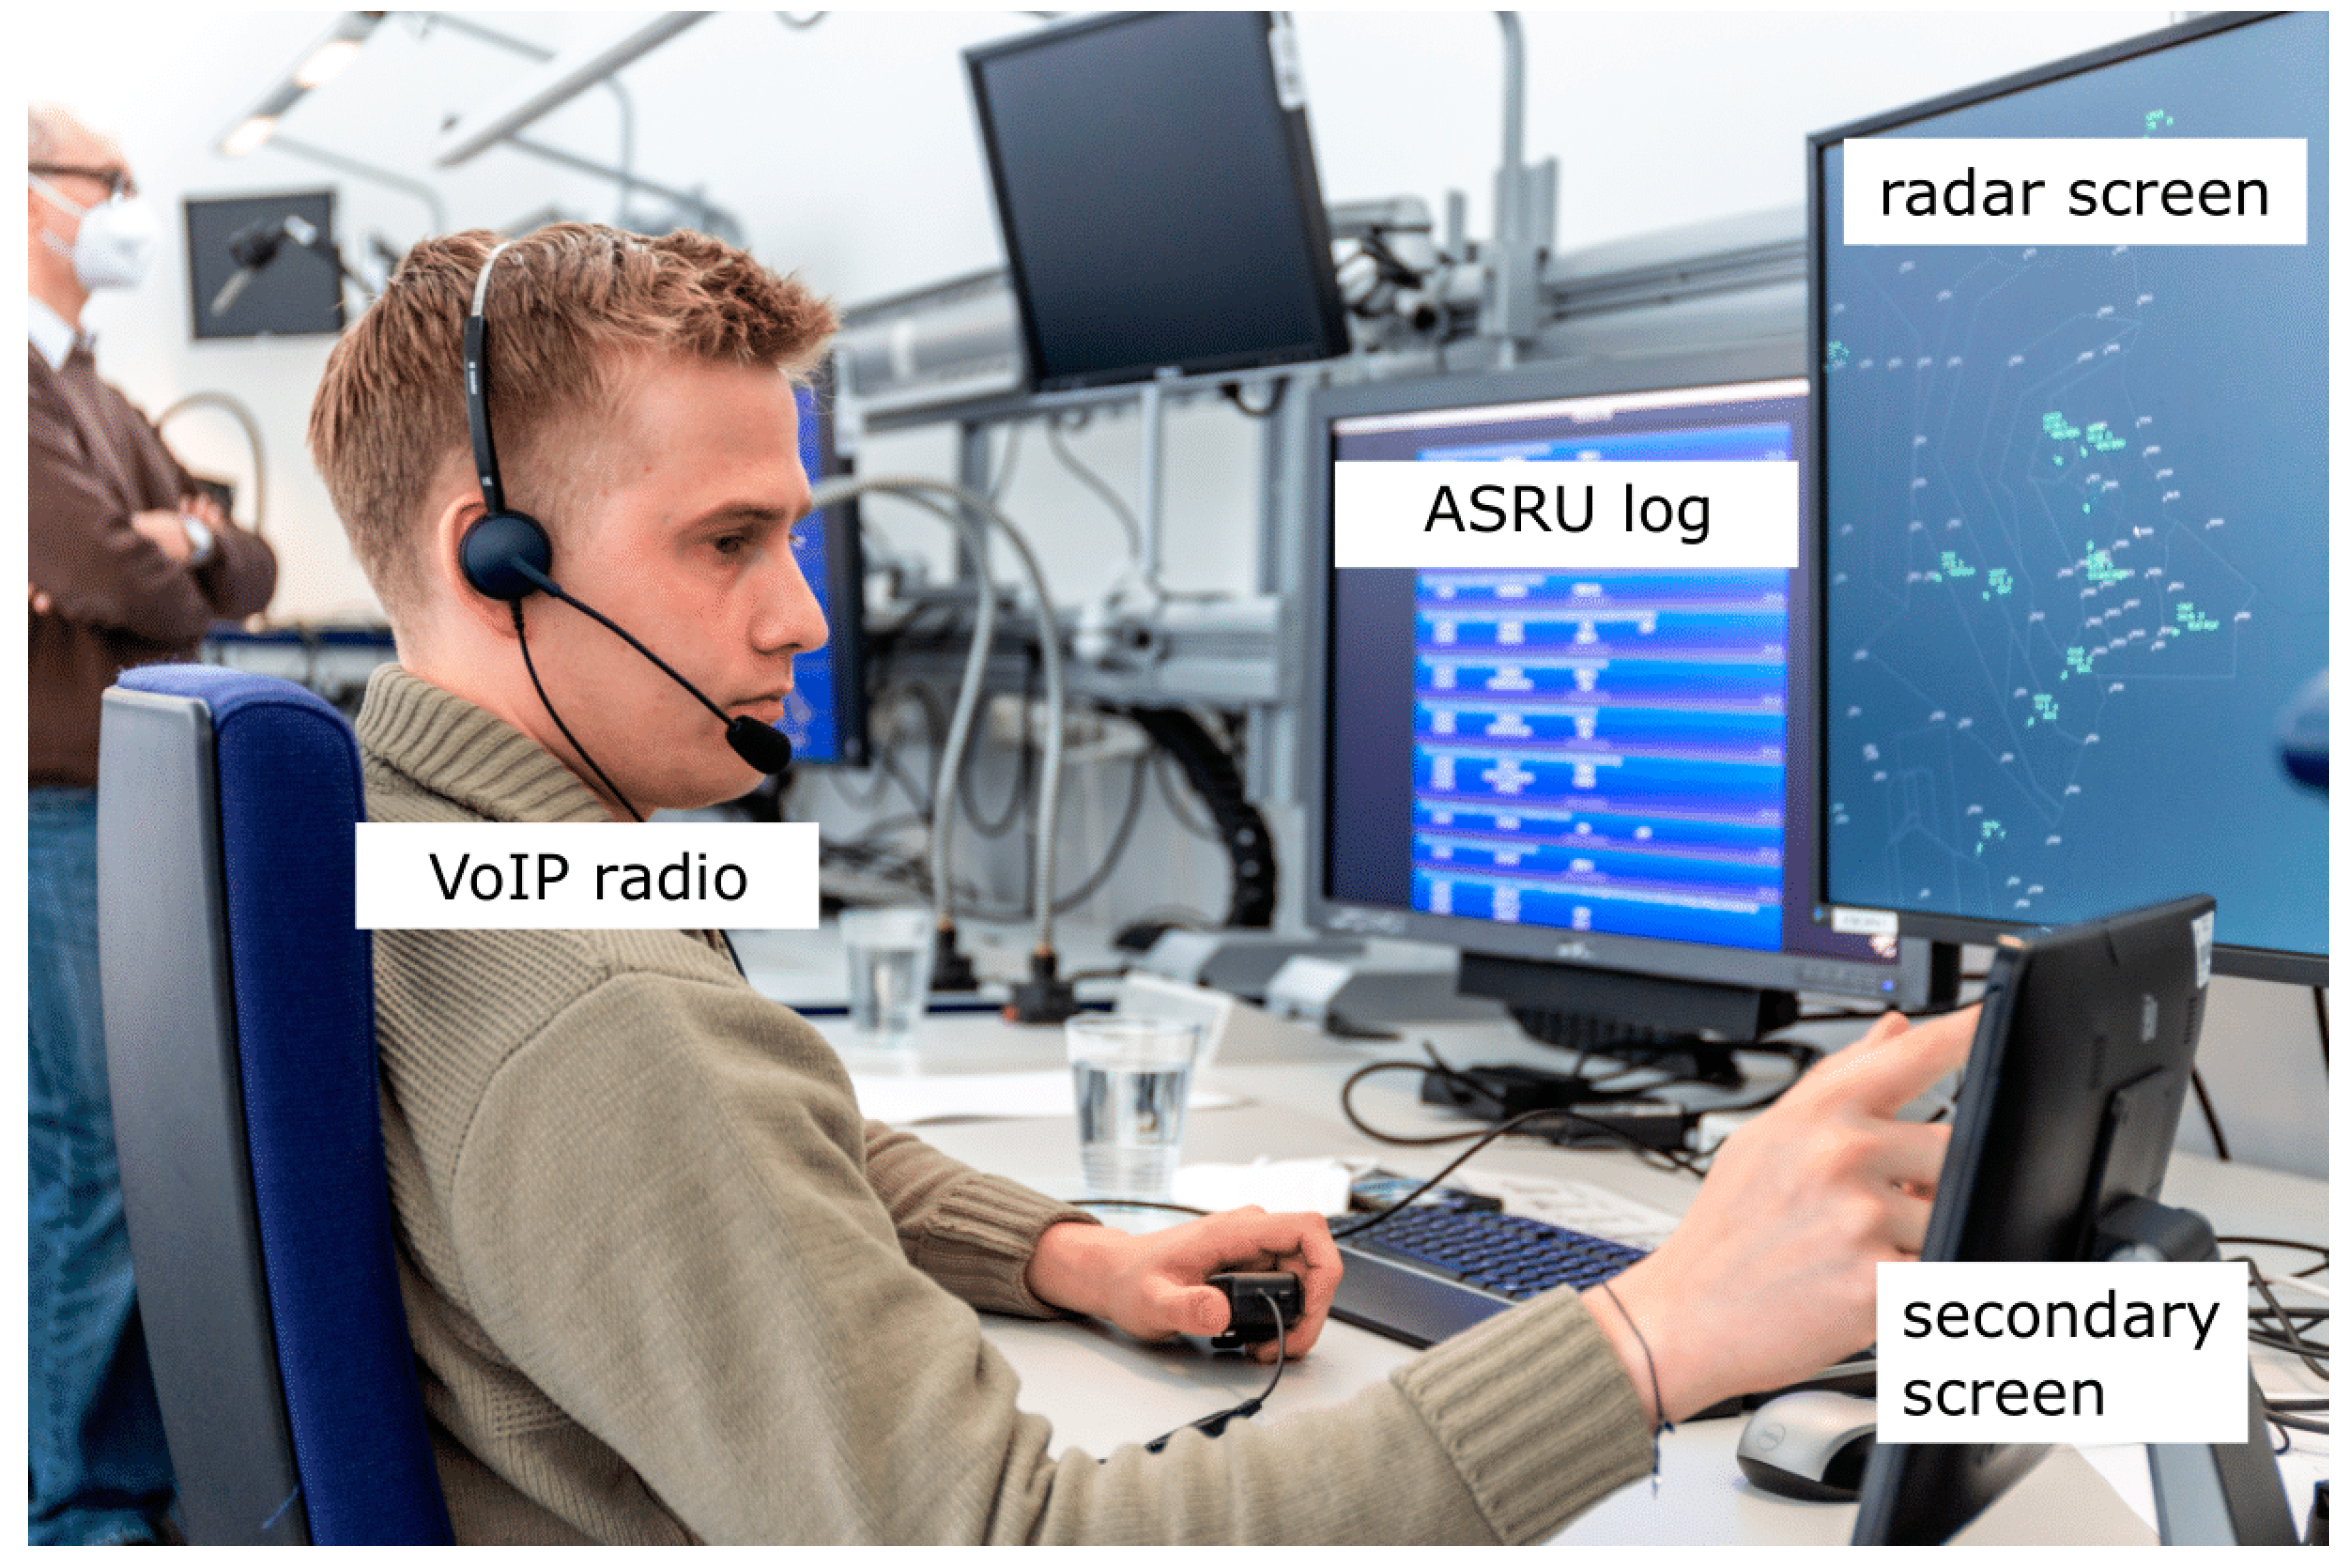
In this section, the performance of ASRU is first presented. Secondly, the subjective feedback from questionnaires is explained and discussed. Finally, the section concludes with the objective results from performance measurements.

4.1. Results of Speech Recognition and Understanding Performance

4.1.1. Performance at the Word Level

Table 4 shows the performance on a word level, which is based on the word error rate (WER), which represents the percentage of words that were not correctly recognized. The WER is calculated using the Levenshtein distance [44]. The table also includes the number of uttered words, as well as the number of substitutions (Subst), deletions (Del), and insertions (Ins), which indicate the differences between the recognized words and the actual uttered words. The best performance, i.e., lowest WER, for a single ATCo on all his/her four runs was 0.7%, while the worst performance was 8.2%.
It should be highlighted that there was a difference between the solution and baseline runs, with the ATCos speaking more clearly when supported by ASRU. In the baseline runs, the ATCos did not benefit from ASRU. Nevertheless, we recorded and evaluated their performance. It was also interesting to observe that the performance decreased as the number of aircrafts increased, although it did not result in a break-down of performance.
Table 5 shows the “top words” that were most often misrecognized, sorted by the number of absolute occurrences. The word “two” was recognized 32 times as a different word. It was recognized as another word (“substituted to”) 261 times and inserted 91 times, i.e., it was recognized, but no word was actually spoken. A total of 71 times, it was said, but no word was recognized at all. The sum of these four errors was 455. The word “two” was actually spoken 8841 times, and the number of recognitions, correct and wrong, was 9090 times. The word “two” was involved in incorrect word recognition in 5% of the instances compared to the times it was actually spoken. The word “to” was very often involved in these problems, more than one-third of the instances. The table also shows that many important ATC-related words were often involved in recognition problems.

4.1.2. Performance at the Semantic Level

Table 6 summarizes the performance of the Concept Recognition module on the semantic level. The table distinguishes between the medium and heavy traffic scenarios, as well as between the baseline and solution runs. We did not compensate for sequence effects in this analysis, as statistical significance is not provided.
The columns “Cmd-Recog-Rate” and “Cmd-Error-Rate” show the percentage of correctly and incorrectly recognized commands, respectively. The difference between the sum of these two columns and 100% corresponds to the percentage of rejected commands. The last two columns show the same metrics for the callsign only. Details regarding the metrics used can be found in [10].
The differences between baseline and solution runs, as observed in in Table 4 on the word level, also occurred on the semantic level. This is not surprising, as problems at the word level cannot be fully compensated for on the semantic level. The Concept Recognition module is robust, which is shown by a command recognition rate for full commands of 92.1% and a callsign recognition rate of 97.8% in Table 6, with a word error rate of over 3%. When the ATCos were supported by ASRU in solution runs, the understanding performance increased on both the command level and the callsign level. Table 7 shows the performance on the semantic level, considering different WER and analyzing the influence of different parts of the full command on the extraction performance.
The “Full Command” row represents the quality of all instruction elements, even those that were never shown in the radar label of this application, such as GREETING, CALL_YOU_BACK, DISREGARD. As our application only considered callsign, type, and value as important, the “Only Label” row shows the rates when unit, qualifier etc., are ignored, but still for all command types, independent of whether they were shown in the radar label. After the validation exercise, the rates were recalculated offline, considering the elimination of certain obvious software bugs. The recalculated rates for the “Only Label” row, based on the same word sequence inputs, are shown in the “Only Label, offline” row. These reported rates for all three rows received the same word sequences with an average WER of 3.1% as input. The output of the S2T block was the same, with a 3.1% WER in the offline row. Assuming a perfect S2T block with a word error rate of 0%, a command recognition rate of 99.3% is achieved. When considering the full command in “Full Command, gold” row, including also conditions, qualifiers etc., a command recognition rate of 99.1% is obtained. Both rows show that the Concept Recognition module effectively models the utilized phraseology, suggesting that improved S2T performance would further improve semantic-level performance.

4.1.3. Effects of Callsign Prediction on Semantic Extraction Performance

The two rows labeled “No Context” in Table 8 show the performance when context information is disregarded. The callsign recognition rate decreases from 99.9% to 81.6%, even with a perfect S2T engine (“gold”). For a detailed explanation, please refer to Section 4.2.2. The command recognition performance is only slightly lower at 80.6%. The row labeled “No Context, S2T” also shows the performance without using the available callsign information, but instead using a real S2T engine with a WER of 3.1%. In this case, the command recognition rate considerably decreases from 92.1% to 66.9%, and the callsign recognition rate decreases from 97.8% to 71.6%.
The results of this section, presented in Table 8, demonstrate the impact of using callsign prediction. Without callsign prediction, the system performance is insufficient. However, with command prediction, we generate benefits for the ATCo with respect to workload reduction, which is shown in the next two sections.

4.2. Subjective Results from ATCo Feedback

This section describes the results provided by the subjective ATCo feedback, which includes ISA, NASA-TLX, Bedford Workload Scale, SUS, CARS, and the three SHAPE questionnaires: (i) SASHA ATCo, (ii) SATI, and (iii) AIM, as described in the previous section.

4.2.1. Instantaneous Self-Assessment Measure

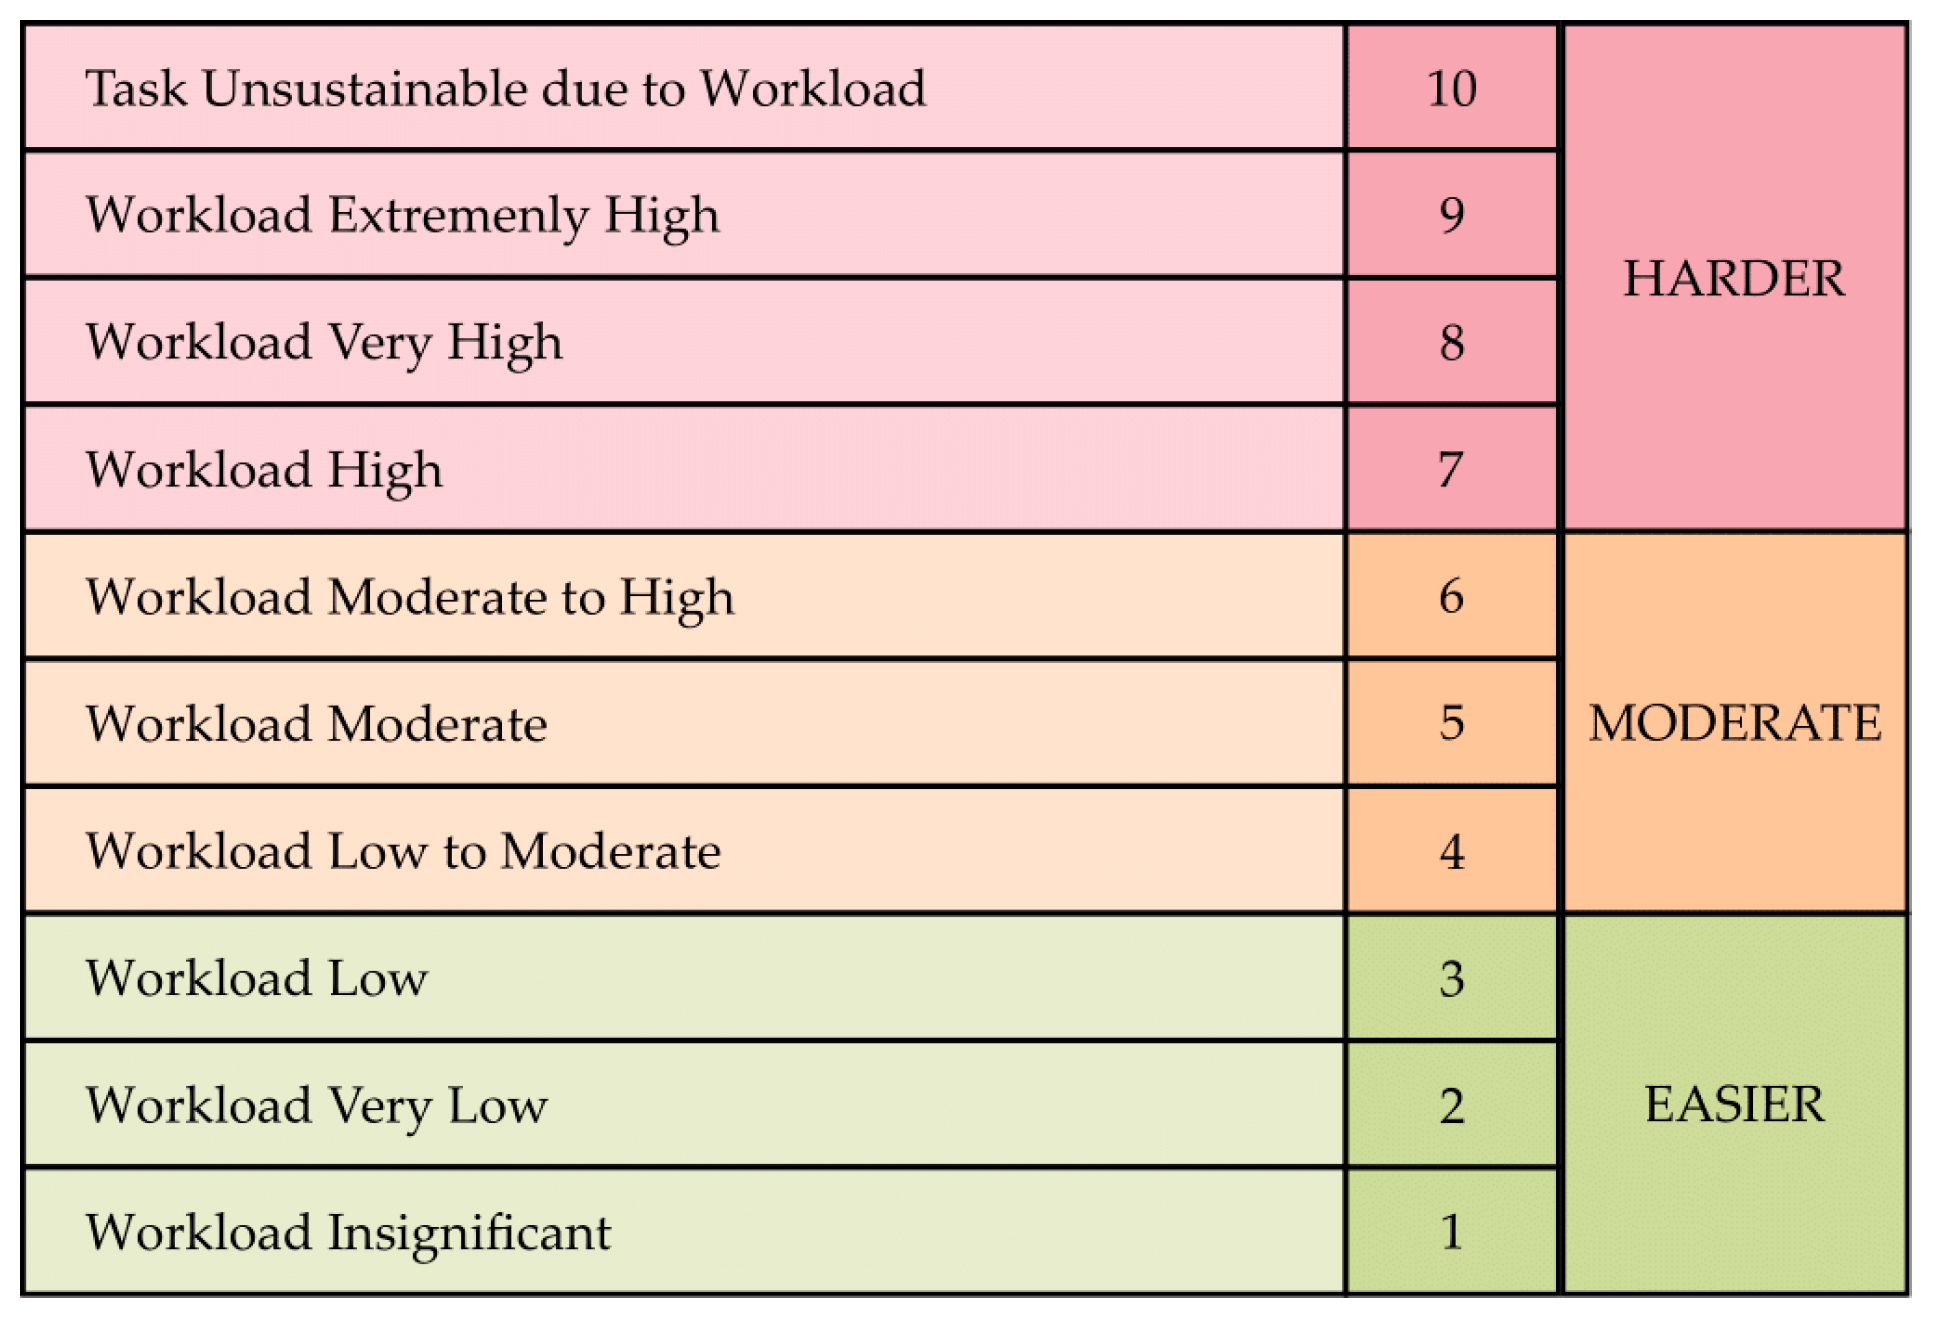
The results from ISA provide a retrospective self-assessment of the perceived mental workload by the ATCos. Table 9 shows the ISA results based on the paired t-test from the validation trials. The ISA mean values were calculated for both scenarios (M and H) under conditions with and without ASRU support. Delta ISA and min α were calculated with and without considering sequence effects. A negative delta ISA value indicates that the mean ISA value was lower in the solution run compared to the baseline run.
It can be observed that all delta ISA values are negative, independent of whether sequence effects are considered. This indicates that solution runs received lower mean ISA values, suggesting that using ASRU support reduces the perceived mental workload of ATCos. Furthermore, the impact of considering sequence effects can be seen. The consideration influences the mean ISA value, reduces sigma, and improves the statistical significance. The minimal alpha value (α min) decreases from 0.7% to 0.3%. Examining the ISA mean values reveals that supporting ATCos with ASRU lowers the mean ISA value in both the M and H scenarios. However, the greatest impact can be seen for the H scenario. Here, the mean ISA value over all simulation runs was almost 15% lower. This result indicates that ASRU support is particularly effective in reducing the ATCos’ perceived mental workload during high traffic hours, corresponding to the H scenario.

4.2.2. NASA TLX

Table 10 shows the differences in the six NASA TLX question ratings, which was calculated as the mean solution value minus the mean baseline value. The last row provides a summary by displaying the arithmetic average of all six ratings. Weights between 1 (low workload) and 10 (high workload) were possible, as described in Section 3.
The four columns labeled “Medium” show the results of the performed t-test for the medium traffic scenarios. The columns labeled “Heavy” show the results for the heavy scenario, and the columns below “Both” combine the “Medium” and “Heavy” columns. The six columns labeled “Diff” show the average differences in the answers between the runs with and without ASRU support. Negative values indicate a lower workload in the solutions runs with ASRU support. The “SE” columns contain the values before eliminating the sequence effects, while the “NSE” columns show the values afterward elimination. The six columns under “α” show the p-value, which indicates the statistical significance or the probability of the null hypothesis (see Section 3.3) being valid. In the following discussion, we will focus only on the values in the “NSE” columns. However, we also include the values in the “SE” columns to show the effectiveness of our SECT approach.
The differences in the “Diff” columns for the “Heavy” scenarios did not change when considering sequence effects. In the case of the medium traffic scenarios, the differences slightly vary because there were more solution runs as the first runs of the day compared to the baseline runs (with a ratio of seven to five). Therefore, the differences in columns “Both” also change.
In the majority of cases, the application of SECT led to an improvement in statistical significance, resulting in a decrease in the p-value. This shows the value of SECT in compensating for sequence effects. For the medium runs, statistically significant results (α < 5%) were obtained in two out of the six cases when the sequence effects were eliminated. Without eliminating the sequence effects, the results are not statistically significant. For the heavy traffic scenarios, the (color of the) statistical significance did not change, but in all cases, α decreased or did not change. For the combined scenarios, the statistical significance improved in five out of two cases, and in two cases, it “improves” to a different statistically significant range, transitioning from a yellow color code to light green or from light green to green.
Question “1” (MD) addresses the mental demand, which decreased by 0.5 units out of 10 in the heavy traffic scenarios, but with a high standard deviation. Question ”2” (PD) addresses the physical demand, which showed a statistically significant decrease in all runs. The same trend was observed for the related question (EF): “How hard did you have to work to accomplish your level of performance?”. The answers to (TD), “How hurried or rushed was the pace of the task”, did not exhibit statistically significant changes. The same applies to (FR) “discouraged, irritated, stressed” and (OP) “successfully accomplishing the task”. For the latter, there was even a tendency for the ATCos to subjectively believe that they performed better, at least in the heavy traffic runs without ASRU support. Later sections show that this was only a subjective feeling.
Question 4 (OP) “How successful were you in accomplishing, what you were asked to do?” is the only question for which the answer “low” corresponded to a poor performance. An explanation could be that some ATCos did not always recognize this when answering the questions. We mark these questions in the following tables in blue as the blue “OP” indicates in Table 10. It should be pointed out again, that we have transformed the answers already before presenting them in the table, so that negative differences mean “better with ASRU”.

4.2.3. Bedford Workload Scale

Table 11 displays the results from the Bedford Workload Scale after performing the t-test, as described previously. Medium, Heavy, and Both represent the corresponding results for the scenarios used during the validation trials. Columns indicated by SE show the results with sequence effects. Columns with NSE show the results after compensating for the sequence effects.
The average and peak workload change for ATCos in the M scenario ranged from [−0.33 to −0.49]. Thus, the average and peak workloads were lower with ASRU support. In the H scenario, the differences ranged from [−0.17 to −0.33]. The highest value for the difference was calculated for the average workload. The statistical significance for the H scenario remained largely unchanged with or without considering sequence effects, ranging from 16.2% to 34.1%. For both scenarios together, the differences between with and without ASRU support fall within the interval of [−0.25 to −0.41], indicating an overall improved perceived workload (lower) when using ASRU support. Statistical significance mostly improved after compensating for sequence effects. The results for the peak workload are not statistically significant, because the α values are still greater than 10%.
Overall, the results from the Bedford Workload Scale demonstrate that applying ASRU support for ATCos improved the results by lowering the perceived workload. Greater effects were recorded for the M scenario compared to the H scenario. Nevertheless, the relative change was minor. Compensating for the sequence effects significantly improved the statistical significance in all cases. In addition to the results from the Bedford Workload Scale, direct feedback was also gathered from ATCos. This feedback is summarized below.
There are three areas of feedback regarding the factors contributing to high workload for ATCos: (1) HMI aspects that were related to ASRU, (2) HMI aspects that were not related to ASRU, and (3) simulation aspects such as the amount of traffic, the simulation-pilots, and the requirement to enter all clearances into the system.
Regarding “HMI aspects that were related to ASRU”, the ATCos identified areas for improvement in the radar label interaction, such as reduced scrolling, using drop-down menus for inputs, and addressing issues with incorrect system inputs, especially if the callsign was wrongly recognized. However, some ATCos also acknowledged the potential usefulness of ASRU if they were more familiar with the new HMI. The aspect of “getting used to the HMI” was also the main criticism for the second feedback area, “HMI aspects that were not related to ASRU”. The differences between the TopSky system used in Vienna and the prototypic CWP in Braunschweig caused some difficulties, such as the unavailability of distance measuring or the number of required clicks for system input. Most of the feedback concerned the third area of simulation aspects, where ATCos faced a high traffic load in the high-density traffic scenario. This included radio frequency congestion due to many transmissions, different speed handling, sometimes uncommon flight profiles, a few inaccurate simulation-pilot inputs, and more traffic than they were accustomed to handling alone. The main difference may have been the requirement to enter all instructed commands into the ATC system, which the ATCos do not need to do in their usual system.

4.2.4. System Usability Scale (SUS)

Table 12 displays the results of the SUS after performing a t-test, as described previously. Medium, Heavy, and Both represent the corresponding results for the scenarios used during the validation trials. Columns indicated by SE show the results with the sequence effects. Columns with NSE show the results after compensating for the sequence effects.
The results from the SUS assessment show the highest changes in the M runs when comparing runs with and without ASRU support, which range between 0.22 and −1.46. Thus, in most reported cases, the ASRU support enabled a better usability of the system. Statistical significance (p-value) ranged between 3 × 10⁻⁸% and −50%. For the M runs, in three cases, a p-value larger than |20%| was reported (bold framed cells) after compensating for the sequence effects, which indicates no statistical significance. For the H scenario, the differences ranged from [−1.4 to 0.70]. In one case (question 4), the p-value of −1.8% indicated that the results were statistically significance and indicate a better performance without ASRU support. Row 4 indicates that “I think that I would need the support of a technical person to be able to use this system”. The same effect can be seen for that question, when analyzing the results of the t-tests for both scenarios combined, since the experience with the given system was relatively low compared to their general working experience with the TopSky system. However, when all 10 questions (row “summary”) were combined, the results indicated that the overall system had a higher usability while using the ASRU support during the common ATC task. The statistical significance was very high, with an average value of 8 × 10⁻⁵.

4.2.5. Controller Acceptance Rating Scale (CARS)

Table 13 shows the results of the CARS analysis. Medium, Heavy, and Both represent the corresponding results for the scenarios used during the validation trials. Columns indicated by SE show the results with sequence effects. Columns with NSE show the results after compensating the sequence effects.
The CARS results show that for each scenario (M and H) as well as when combining both scenarios (Both), the differences were between −1.12 (Heavy) and −1.36 (Both) on the 10-point scale after compensating for sequence effects. This suggests that the ATCo acceptance increased with the usage of ASRU support compared to simulation runs without ASRU support. The p-values for all three cases were below 5%, indicating that the null hypothesis is invalid and there is statistical significance with the usage of ASRU support.

4.2.6. Situation Awareness for SHAPE (SASHA)

Table 14 shows the results of the SASHA analysis. SASHA is the first of three assessments from the SHAPE questionnaire, which analyses the situational awareness of ATCos. Medium, Heavy, and Both represent the corresponding results for the scenarios used during the validation trials. Columns indicated by SE show the results with sequence effects. Columns with NSE show the results after compensating for the sequence effects.
The SASHA results show that for the M, H, and Both scenarios, the average differences were between −0.17 (Medium) and −0.33 (Heavy) after compensating for the sequence effects. This suggests that the situational awareness of the ATCos slightly increased across all scenarios when using the ASRU support during the simulation runs. The greatest positive impact on the ATCos’ situational awareness was recorded during the H scenario. The p-values after compensating for the sequence effects reduce for the Both scenarios combined (α = 1.8%) to below 5%. This indicates that the null hypothesis was invalid and the statistical significance improved with the use of the ASRU support. For the M scenario, the p-value after compensating for sequence effects was 8.6%, and for the H scenario, it was 5.3%. Here, the statistical significance was slightly improved with SECT. One possible explanation is that during the M scenarios, the ATCos had more time to verify their current planning process (situational awareness) and thus did not feel the need for any support system. However, during the H scenario, there was less time between different verbal ATC instructions to check their own planning process. In this case, the spare time obtained through the ASRU radar label input was valued even more, which improved the ATCos’ situational awareness.

4.2.7. SHAPE Automation Trust Index (SATI)

Table 15 shows the results of the SATI analysis. SATI was the second of three assessments from the SHAPE questionnaire, which analyzed the ATCos’ trust in the automated functions or systems. Medium, Heavy, and Both represent the corresponding results for the scenarios used during the validation trials. Columns indicated by SE show the results with sequence effects. Columns with NSE show the results after compensating for the sequence effects.
The SATI results show that for the M scenario, H scenario, and the combined Both scenarios, the average difference ranged from −0.48 (Medium) to −1.12 (Heavy) after compensating for sequence effects. This suggests that he ATCos’ trust in the system increased when using the ASRU support compared to the simulation runs without ASRU support. The highest average difference was recorded during the H scenario. The p-value ranged below 5% for the H scenario (α = 0.2%) and Both scenarios (α = 0.5%), indicating that the null hypothesis was invalid and the usage of ASRU support increased the statistical significance. For the M scenario, the average p-value was greater than 10% (α = 17.0%), which indicates that no increase in trust could be achieved by using ASRU support. This applies before and after compensating for sequence effects. During the M scenario, the ATCos might have had enough time to explore the system and were not dependent on ASRU support. This effect could have decreased the statistical significance compared to the H scenario, where there was less time to create doubts and the system had to be used as implemented.

4.2.8. Assessing the Impact on Mental Workload (AIM)

Table 16 shows the results of the AIM analysis. AIM was the third of three assessments from the SHAPE questionnaire used in this study, which analyzed the ATCos’ mental workload experienced. Medium, Heavy, and Both represent the corresponding results for the scenarios used during the validation trials. Columns indicated by SE show the results with sequence effects. Columns with NSE show the results after compensating for the sequence effects.
The AIM results show that for the M scenario, the average difference was 0.19 after compensating for sequence effects (row “Summary”, column “NSE”). This suggests that using the ASRU support increased the mental workload. For the H scenario and when combining both scenarios, the average difference ranged from −0.10 (Both) to −0.38 (Heavy) after compensating for sequence effects. These results indicate that the mental workload decreased during the simulation runs when using the ASRU support compared to the simulation runs without ASRU support.
The average p-value results for the M scenario (α = −27%) and when combining Both scenarios (α = 30%) were greater than |10%|. This indicates that no statistical significance could be achieved when using the ASRU support. For the H scenario, the average p-value was 2.5% after compensating for sequence effects. This indicates that for the H scenario, the null hypothesis was invalid and the mental workload was improved by using the ASRU support.

4.3. Objective Results

In this section, the results from the secondary task (Stroop test) and the performance measurements are analyzed and discussed.

4.3.1. Results from Secondary Task—Stroop Test

Table 17 shows the result when the ATCos’ successfully performed Stroop tests for the different traffic scenarios without and with compensating for the sequence effects. The results are obtained from [29].
The Stroop test results show that for each scenario (Medium and Heavy) as well as when combining both scenarios, the difference ranged from 13.9 (both) to 14.5 (Medium). This indicates that the ATCos were able to perform more successful Stroop tests using the ASRU support during the simulation runs. When supported by ASRU, the ASRU performs many tasks that the ATCos otherwise need to do manually. The average of successfully solved Stroop tests in the H scenario was 19.9 without ASRU support and 34.2 with ASRU support (not shown in Table 17). It is important to note that we do not plan to occupy the ATCo with an additional task. This observation demonstrates that in certain situations, such as an incident, the ASRU support provides some additional safety buffers in terms of workload capacity. In the M scenarios, the average number of successfully solved tests increased from 34.3 without ASRU support to 47.8 with ASRU support. The increase in both traffic situations was nearly the same, although the command recognition was slightly worse in the H scenarios, as shown in Table 6. The p-value results were below 5% across all scenarios. Thus, the null hypothesis was invalid and the number of possible additional tasks was improved by using the ASRU support.

4.3.2. Missing and Wrong Radar Label Cell Entries

Knowing now that ASRU support reduces ATCo workload, it is important to ensure the accuracy of the radar label contents after the ATCo has checked the ASRU output, i.e., if all the given commands show the actual situation in digital form. How often do we have missing or even wrong inputs? In theory, a person would need to count how often the radar label contents were different from the spoken commands. However, this approach is impractical. It is nearly impossible for someone to listen to ATCo utterances, completely understand them on a word level, transform to the meaning to a semantic level, and check the radar label contents with the required accuracy. A deviation of approximately 1% is expected. Transcription experiments with humans transcribing voice utterances has already shown that a word error rate of approximately 4% to 11% can be expected, especially when a person can only listen once [45]. A computer-based solution is required, which is described below.
During the experiments, all mouse clicks that changed the radar label cell contents were recorded, and Table 18 shows the results of these recordings. The correct contents of each cell for each callsign at any point in time is indirectly given. All ATCo voice transmissions were transcribed and annotated, creating what are known as gold annotations. These gold annotations were replayed and sent to the software that generated the contents of the radar label cells. As a result, the clicks are recorded again, but giving us this time the correct and complete contents of each cell for each callsign at any point in time. The cell contents during the experiments can then be compared to the correct/gold contents. The comparison of the label cell contents during the experiments to the correct contents can be done automatically, and the calculation can be automatically rerun whenever inconsistencies in the gold annotations are identified.
Table 18, taken from [29], shows the results for the baseline and the solution runs. The first column shows the number of clearances given for each cell. We did not count commands which cleared a value in a field, such as “own navigation” or “no speed restrictions”, but we considered them when a calculation was missing or when wrong cell entries were present. The “Gold” column contains the number of commands of this type, resulting from the replay of the manual annotations. “Clicks” counts the number of clicks in this cell, which changed the value of the cell, ignoring clicks that cleared the value.
The “Miss” column counts the number of cell values that were missing, and the “Add” column represents the number of cell values which were in the cells but not spoken at that time. “RR” is the command recognition rate for each type. The entries in the cells “Miss” and “Add” were corrected for sequence effects as described in Section 3.3. However, the compensation effects were much smaller than for the Stroop test. The greatest change was by 1.3 in absolute numbers. Some cells in Table 18 are marked in orange, which require a deeper analysis or additional explanations which are provided in [29]. The sum of clicks and missing commands did not correspond to the gold column. Sometimes, the same command was repeated with the same value, due to “say again” or a lack of response from the simulation-pilots. Additionally, a gold command may sometimes require two entries, such as when using DIRECT_TO to a waypoint, which should also delete the heading value.
The analysis of the results in Table 18 in [29] has given insights to improve the comparison between the correct and actual label values to better reflect how ATCos of Austro Control work in daily life. The improvements, which were not part of [29], are presented in Table 19.
  • A missing value was not considered twice. For example, if 250 knots were intended/said and the value 240 was accidently entered or wrongly recognized, and therefore incorrect, Table 18 counted this as missing 250 and as an additional value of 240 in the “Spd” row. In Table 19, missing label cell values were not counted twice if they already have an entry in the “miss” column for the same given command value. This and other corrections reduced the sum of column “Add” from 145 to 65 in the baseline runs. The effect in solution runs was a minor reduction from 73 to 68.
  • Missing entries for 2600 feet were not counted as “Miss” or “Add” because this was the interception altitude at the final approach fix, which was not instructed by ATCo after the “cleared ILS” instruction.
  • If a heading value was given together with an ILS clearance, we did not expect an entry in the heading cell. This reduced the number of missing heading values from 351 in Table 18 to 107 in Table 19 for the baseline runs.
The values in Table 19 shaded in blue were previously explained in [29]. The cells marked in orange require a deeper analysis.
  • In 70 instances, the ATCo missed entering the given speed value or entered a wrong value. No systematic reason was observed. CAS (calibrated air speed) speed values between 160 and 300 were involved, and the majority were between CAS 160 and CAS 220. It was assumed that the high workload prevented the ATCo from inputting the given speed value in some situations, accounting for 6.5% of the cases.
  • TRANSITION commands were not deemed as important for the ATCos of Austro Control. They did not input a given transition command in their operational TopSky system. Nevertheless, Austro Control had designed the experiment and the HMI in such a way that the ATCos should input the cleared transitions, which is a benefit of using ASRU support with respect to situation awareness.
  • The same applies for the given heading commands that were not input manually.
The initial question was how to verify the number of missing ATCo commands in the label cells with and without ASRU support. This was done by replaying the annotated utterances. The next question was if all the missing commands were corrected by the ATCo. The numbers in Table 19 show that this was not the case. However, it was also not the case when the ATCo manually inputs all commands. We performed paired t-tests as described in Section 3.3 to validate whether the differences were statistically significant. We used the data after compensating for the sequence effects from Table 19. The results without and with compensating sequence effects are shown in Table 20.
Table 20 shows that the results were highly statistically significant for almost all radar label cells, indicating that the correctness of radar label cells was much better if ATCos were supported by ASRU. However, statistical significance was not observed for the waypoint, rate and special radar label cells across all scenarios. The deviation for the “Spec” was intended by the design of experiment, as described in [29]. The entries of the “Spec” commands appeared in the forth label line, which was only visible for the ATCo, when the mouse was hovered over the corresponding radar label.
The results highlight that even with an ASRU command recognition rate of only 92%, which is already very good compared to other results reported in the context of SESAR-2 ASRU validation exercises [7], the ATCos workload and their human performance was not negatively impacted. Furthermore, there are an abundance of safety nets such as Monitoring Aids (MONA), Cleared Level Adherence Monitoring (CLAM), Route Adherence Monitoring (RAM), Short-term Conflict Alert (STCA), and Medium-term Conflict Detection (MTCD), which would prevent any critical safety event. Additionally, the use of eye-tracking to verify whether the ATCo visually scanned the ASRU output can help to further reduce the negative effect of ASRU errors. In case the ATCo did not check the ASRU output within a certain time period, auditory or visual attention guidance could be a possible solution.

5. Conclusions

The main research question was to quantify of the benefits of Automatic Speech Recognition and Understanding (ASRU) support for ATCos performing radar label maintenance in terms of safety and human performance. Therefore, an extensive human-in-the-loop study with twelve Austro Control ATCos was carried out at DLR Braunschweig. A method to compensate for sequence effects was introduced, which improved the statistical significance by a factor of two on average, thus reducing the number of required ATCos. Furthermore, for the first time, we were able to analyze how many radar label inputs were incorrect when ASRU support was provided and when it was not available.
The measured accuracy of speech-to-text and text-to-concept has shown that the ASRU technology functions reliably and robustly. For all radar cells, a command recognition rate of 92.5% with an error rate of 2.4% was achieved.
In terms of flight safety, the number of wrong or missing inputs from ATCos into the radar label was reduced by a factor of more than two through ASRU support usage (from 11% to 4%). Hence, ATCos had more mental spare capacity when using ASRU support for radar label maintenance, which is crucial for safety in unforeseen events such as an incident. This was demonstrated through a secondary task, where occupying less mental capacity in the primary task (air traffic control) increased the situational awareness among ATCos, which can be beneficial in safety-critical situations. These findings were confirmed by the results of the SASHA questionnaire, with a statistical significance of α = 1.8%. The reduction in workload was measured using NASA TLX, ISA, Bedford, SHAPE, and AIM questionnaires.
In addition to the impact of ASRU support on flight safety and workload, the ATCos reported an increased satisfactory and trust level in human-system performance when using the ASRU support. The results from the CARS and SATI questionnaire showed that ATCos acceptance increased, with α = 0.7%, and improved trust with high statistical significance (α = 0.5%). Overall, flight safety and human performance was significantly improved when ATCos use ASRU support for radar label maintenance.
The ANSP involved in the study designed the user interface in a way that required the ATCos to input all commands into the ATC system, which is not done by ATCos in their current operational system. In the future, ANSPs are strongly recommended to have all commands in digitized form, ensuring that the CWP offers a way to enter the commands without significantly increasing ATCo workload. The presented ASRU technology is a lightweight method to support this transition and increase situational awareness as an additional benefit when all commands are integrated into the ATC system.

Author Contributions

Conceptualization, H.H.; methodology, H.H.; software, H.H., M.K., O.O., J.Z.-G., N.A. and H.E.; validation, N.A., T.M. and H.H.; formal analysis, H.H.; investigation, H.H. and N.A.; resources, N.A., H.H. and L.K.; data curation, H.E., O.O., M.K., H.H. and J.Z.-G.; writing—original draft preparation, N.A., H.H. and O.O.; writing—review and editing, O.O., T.M., H.E., M.K, J.Z.-G. and L.K.; visualization, N.A., H.H., M.K., H.E., O.O. and T.M.; supervision, H.H.; project administration, H.H.; funding acquisition, H.H. All authors have read and agreed to the published version of the manuscript.

Funding

This project received funding from the SESAR Joint Undertaking under the European Union’s Horizon 2020 research and innovation program under grant agreement No. 874464.

Institutional Review Board Statement

Not applicable.

Informed Consent Statement

Informed consent was obtained from all subjects involved in the study.

Data Availability Statement

Not applicable.

Acknowledgments

The authors would like to thank all the ATCos from Austro Control who supported the validations with their feedback and their voice utterances. The authors would also like to thank the employees from DLR for completing tedious transcription and annotation work.

Conflicts of Interest

The authors declare no conflict of interest. The funders had no role in the design of the study; in the collection, analyses, or interpretation of data; in the writing of the manuscript; or in the decision to publish the results.

Appendix A

For the following questionnaires, different scales were applied to answer or rate the corresponding question or statement. These scales can be found in the correspondent section.

Appendix A.1. Questions Used for NASA TLX

  • How mentally demanding was the task?
  • How physically demanding was the task?
  • How hurried or rushed was the pace of the task?
  • How successful were you in accomplishing what you were asked to do?
  • How hard did you have to work to accomplish your level of performance?
  • How insecure, discouraged, irritated, stressed, and annoyed were you?

Appendix A.2. Statements Used for SUS Questionnaire

  • I think that I would like to use this system frequently.
  • I found the system unnecessarily complex.
  • I thought the system was easy to use.
  • I think that I would need the support of a technical person to be able to use this system.
  • I found the various functions in this system were well integrated.
  • I thought there was too much inconsistency in this system.
  • I would imagine that most people would learn to use this system very quickly.
  • I found the system very cumbersome to use.
  • I felt very confident using the system.
  • I needed to learn a lot of things before I could get going with this system.

Appendix A.3. Statements Used for SASHA Questionnaire

  • In the previous run, I was ahead of the traffic.
  • In the previous run, I started to focus on a single problem or a specific aircraft.
  • In the previous run, there was a risk of forgetting something important (such as inputting the spoken command values into the labels).
  • In the previous run I was able to plan and organize my work as wanted.
  • In the previous run I was surprised by an event I did not expect (such as an aircraft call).
  • In the previous run I had to search for an item of information.

Appendix A.4. Statements Used for SATI Questionnaire

  • In the previous working period, I felt that the system was useful.
  • In the previous working period, I felt that the system was reliable.
  • In the previous working period, I felt that the system worked accurately.
  • In the previous working period, I felt that the system was understandable.
  • In the previous working period, I felt that the system worked robustly (in difficult situations, with invalid inputs, etc.).
  • In the previous working period, I felt that I was confident when working with the system.

Appendix A.5. Questions Used for AIM Questionnaire

  • In the previous run, how much effort did it take to prioritize tasks?
  • In the previous run, how much effort did it take to identify potential conflicts?
  • In the previous run, how much effort did it take to scan radar or any display?
  • In the previous run, how much effort did it take to evaluate conflict resolution options against the traffic situation and conditions?
  • In the previous run, how much effort did it take to anticipate the future traffic situation?
  • In the previous run, how much effort did it take to recognize a mismatch of available data with the traffic picture?
  • In the previous run, how much effort did it take to issue timely commands?
  • In the previous run, how much effort did it take to evaluate the consequences of a plan?
  • In the previous run, how much effort did it take to manage flight data information?
  • In the previous run, how much effort did it take to recall necessary information?
  • In the previous run, how much effort did it take to anticipate team members’ needs?
  • In the previous run, how much effort did it take to prioritize requests?
  • In the previous run, how much effort did it take to scan flight progress data?
  • In the previous run, how much effort did it take to access relevant aircraft or flight information?
  • In the previous run, how much effort did it take to gather and interpret information?

References

  1. Shetty, S.; Ohneiser, O.; Grezl, F.; Helmke, H.; Motlicek, P. Transcription and Annotation Handbook. HAAWAII Deliverable D3; HAAWAII Project: Cologne, Germany, 2020. [Google Scholar]
  2. Helmke, H.; Slotty, M.; Poiger, M.; Herrer, D.F.; Ohneiser, O.; Vink, N.; Cerna, A.; Hartikainen, P.; Josefsson, B.; Langr, D. Ontology for transcription of ATC speech commands of SESAR 2020 solution PJ. 16-04. In Proceedings of the IEEE/AIAA 37th Digital Avionics Systems Conference (DASC), London, UK, 23–27 September 2018. [Google Scholar]
  3. International Civil Aviation Organization (ICAO). Procedures for Air Navigation Services (PANS)-Air Traffic Management (Doc 4444); International Civil Aviation Organization: Montreal, QC, Canada, 2001. [Google Scholar]
  4. Schäfer, D. Context-sensitive Speech Recognition in the Air Traffic Control Simulation. Ph.D. Thesis, University of Armed Forces, Neubiberg, Germany, 2001. [Google Scholar]
  5. Cordero, J.M.; Dorado, M.; de Pablo, J.M. Automated speech recognition in ATC environment. In Proceedings of the 2nd International Conference on Application and Theory of Automation in Command and Control Systems, London, UK, 29–31 May 2012. [Google Scholar]
  6. Cordero, J.M.; Rodriguez, N.; de Pablo, J.M.; Dorado, M. Automated Speech Recognition in Controller Communications Applied to Workload Measurement; 3rd SESAR Innovation Days: Stockholm, Sweden, 2013. [Google Scholar]
  7. Ohneiser, O.; Helmke, H.; Shetty, S.; Kleinert, M.; Ehr, H.; Murauskas, S.; Pagirys, T.; Balogh, G.; Tönnes, A.; Kis-Pál, G. Understanding Tower Controller Communication for Support in Air Traffic Control Display. In Proceedings of the 12th SESAR Innovation Days, Budapest, Hungary, 5–8 December 2022. [Google Scholar]
  8. Helmke, H.; Ohneiser, O.; Buxbaum, J.; Kern, C. Increasing ATM efficiency with assistant-based speech recognition. In Proceedings of the 12th USA/Europe Air Traffic Management Research and Development Seminar (ATM2017), Seattle, WA, USA, 27–30 June 2017. [Google Scholar]
  9. Helmke, H.; Ondrej, K.; Shetty, S.; Arilíusson, H.; Simiganosch, T.S.; Kleinert, M.; Ohneiser, O.; Ehr, H.; Zuluaga, J.-P. Readback Error Detection by Automatic Speech Recognition and Understanding-Results of HAAWAII project for Isavia’s Enroute Airspace. In Proceedings of the 12th SESAR Innovation Days, Budapest, Hungary, 5–8 December 2022. [Google Scholar]
  10. Helmke, H.; Shetty, S.; Kleinert, M.; Ohneiser, O.; Ehr, H.; Prasad, A.; Motlicek, P.; Cerna, A.; Windisch, C. Measuring Speech Recognition and Understanding Performance in Air Traffic Control Domain Beyond Word Error Rates. In Proceedings of the 11th SESAR Innovation Days, Virtual, 7–9 December 2021. [Google Scholar]
  11. Kleinert, M.; Helmke, H.; Siol, G.; Ehr, H.; Finke, M.; Srinivasamurthy, A.; Oualil, Y. Machine learning of controller command prediction models from recorded radar data and controller speech utterances. In Proceedings of the 7th SESAR Innovation Days, Belgrade, Serbia, 28–30 November 2017. [Google Scholar]
  12. Helmke, H.; Ohneiser, O.; Mühlhausen, T.; Wies, M. Reducing controller workload with automatic speech recognition. In Proceedings of the 35th Digital Avionics Systems Conference (DASC), Sacramento, CA, USA, 25–29 September 2016; pp. 1–10. [Google Scholar]
  13. Eggemeier, F.T.; O’Donnell, R.D. A Conceptual Framework for Development of a Workload Assessment Methodology; Wright State University: Dayton, OH, USA, 1982. [Google Scholar]
  14. Speelmann, V. Air Traffic Management and Operations Simulator (ATMOS). Deutsches Zentrum für Luft und Raumfahrt e.V. Available online: https://www.dlr.de/content/en/research-facilities/air-traffic-management-and-operations-simulator-atmos.html (accessed on 3 March 2023).
  15. Morlang, F. Validation Facilities in the Area of ATM Bottleneck Investigation. In Proceedings of the IEEE/AIAA 25th Digital Avionics Systems Conference, Portland, OR, USA, 15–19 October 2006. [Google Scholar]
  16. EUROCONTRL. European Operational Concept Validation Methodology; Version 3; EUROCONTROL: Brussels, Belgium, 2010. [Google Scholar]
  17. Mankins, J. Technology Readiness Level-A White Paper; Advanced Concept Office, Office of Space Access and Technology NASA: Washington, DC, USA, 6 April 1995. [Google Scholar]
  18. Fürstenau, N.; Radüntz, T. Power law model for subjective mental workload and validation through air traffic control human-in-the-loop simulation. Cogn. Technol. Work 2021, 24, 291–315. [Google Scholar] [CrossRef]
  19. Milan, R.; Michael, F. Using speech analysis in voice communication: A new approach to improve air traffic management security. In Proceedings of the 7th IEEE International Conference on Cognitive Infocommunications (CogInfoCom), Wroclaw, Poland, 16–18 October 2016. [Google Scholar]
  20. Kluenker, C.S. Enhanced Controller Working Position for Integrating Spaceflight into Air Traffic Management. In Advances in Human Aspects of Transportation, Proceedings of the AHFE 2021 Virtual Conference on Human Aspects of Transportation (Online), 25–29 July 2021; Springer Lecture Notes in Networks and Systems 270; Springer: Berlin/Heidelberg, Germany; pp. 543–550. [CrossRef]
  21. Have, J.T. The development of the NLR ATC Research Simulator (Narsim): Design philosophy and potential for ATM research. Simul. Pr. Theory 1993, 1, 31–39. [Google Scholar] [CrossRef]
  22. Nuic, A. Base of Aircraft Data (BADA) Product Management Document; EEC Technical Report No. 2009-008; EUROCONTROL: Brussels Belgium, March 2009. [Google Scholar]
  23. ICAO. ICAO Standard Phraseology: A Quick Reference Guide for Commercial Air Transport Pilots, Safety Initiative; EUROCONTROL: Brussels, Belgium, 2011. [Google Scholar]
  24. Aeronautical Information Publication. Austro Control, LOWW AD 2 MAP 11-2-4, Austro Control, Vienna Austria. Available online: https://eaip.austrocontrol.at/ (accessed on 22 April 2021).
  25. Charness, G.; Gneezy, U.; Kuhn, M.A. Experimental methods: Between-subject and within-subject design. J. Econ. Behav. Organ. 2012, 81, 1–8. [Google Scholar] [CrossRef]
  26. Greenwald, A.G. Within-subject designs: To use or not to use? Psychological Bull. 1976, 83, 314. [Google Scholar] [CrossRef]
  27. Kleinert, M.; Helmke, H.; Moos, S.; Hlousek, P.; Windisch, C.; Ohneiser, O.; Ehr, H.; Labreuil, A. Reducing Controller Workload by Automatic Speech Recognition Assisted Radar Label Maintenance. In Proceedings of the 9th SESAR Innovation Days, Athens, Greece, 2–5 December 2019. [Google Scholar]
  28. Helmke, H. The Horizon 2020 Funded HAAWAII Project. Deutsches Zentrum fuer Luft- und Raumfahrt e.V. Available online: https://www.haawaii.de/wp/ (accessed on 3 March 2023).
  29. Helmke, H.; Kleinert, M.; Ahrenhold, N.; Ehr, H.; Mühlhausen, T.; Ohneiser, O.; Klamert, L.; Motlicek, P.; Prasad, A.; Zuluaga Gomez, J.; et al. Automatic Speech Recognition and Understanding for Radar Label Maintenance Support Increases Safety and Reduces Air Traffic Controllers’ Workload. In Proceedings of the 15th USA/Europe Air Traffic Management Research and Development Seminar (ATM2023), Savannah, GA, USA, 17 May 2023. [Google Scholar]
  30. Kleinert, M.; Helmke, H.; Shetty, S.; Ohneiser, O.; Ehr, H.; Prasad, A.; Motlicek, P.; Harfmann, J. Automated Interpretation of Air Traffic Control Communication: The Journey from Spoken Words to a Deeper Understanding of the Meaning. In Proceedings of the IEEE/AIAA 40th Digital Avionics Systems Conference (DASC), San Antonia, TX, USA, 3–7 October 2021. [Google Scholar]
  31. Kleinert, M.; Shetty, S.; Helmke, H.; Ohneiser, O.; Wiese, H.; Maier, M.; Schacht, S.; Nigmatulina, I.; Saeed, S.; Motlicek, P. Apron Controller Support by Integration of Automatic Speech Recognition with an Advanced Surface Movement Guidance and Control System. In Proceedings of the 12th SESAR Innovation Days, Budapest, Hungary, 5–8 December 2022. [Google Scholar]
  32. Hart, S. NASA-task load index (NASA-TLX); 20 years later. In Proceedings of the Human Factors and Ergonomics Society Annual Meeting, Los Angeles, CA, USA, 16–20 October 2006; pp. 904–908. [Google Scholar]
  33. Roscoe, A. Assessing Pilot Workload in Flight; Royal Aircraft Establishment Bedford (United Kingdom): Bedford, UK, 1984. [Google Scholar]
  34. Brooke, J. SUS—A ‘Quick and Dirty’ Usability Scale. In Usability Evaluation in Industry; Jordan, P.W., Thomas, B., McClelland, I.L., Weerdmeester, B.A., Eds.; Taylor and Francis: London, UK, 1996; pp. 189–194. [Google Scholar]
  35. Lee, K.; Kerns, K.; Bone, R.; Nickelson, M. Development and validation of the controller acceptance rating scale (CARS): Results of empirical research. In Proceedings of the 4th USA/Europe Air Traffic Management R&D Seminar, Santa Fe, New Mexico, 4–7 December 2001. [Google Scholar]
  36. Dehn, D.M. Assessing the Impact of Automation on the Air Traffic Controller: The SHAPE Questionnaires. Air Traffic Control. Q. 2008, 16, 127–146. [Google Scholar] [CrossRef]
  37. Kirwan, B.; Evans, A.; Donohoe, L.; Kilner, A.; Lamoureux, T.; Atikinson, T.; MacKendrick, H. Human factors in the ATM system design life cycle. In Proceedings of the FAA/EUROCONTROL ATM R&D Seminar, Saclay, France, 16–20 June 1997. [Google Scholar]
  38. Tattersall, A.J.; Foord, P.S. An experimental evaluation of instantaneous self-assessment as a measure of workload. Ergonomics 1996, 39, 740–748. [Google Scholar] [CrossRef] [PubMed]
  39. Brennan, S.D. An Experimental Report on Rating Scale Descriptor Sets for the Instantaneous Self-Assessment (ISA) Recorder; Technical Report; DRA Maritime Command and Control Divison: Portsmouth, UK, 1992; Volume 92017. [Google Scholar]
  40. Joshi, A.; Kale, S.; Chandel, S.; Pal, D.K. Likert scale: Explored and explained. Br. J. Appl. Sci. Technol. 2015, 7, 396. [Google Scholar] [CrossRef]
  41. Kaber, D.B.; Riley, J.M. Adaptive Automation of a Dynamic Control Task Based on Secondary Task Workload Measurement. Int. J. Cogn. Ergon. 1999, 3, 169–187. [Google Scholar] [CrossRef]
  42. Stroop, J.R. Studies of interference in serial verbal reactions. J. Exp. Psychol. 1935, 18, 643–662. [Google Scholar] [CrossRef]
  43. Casner, S.M.; Gore, B.F. Measuring and evaluating workload: A primer. In NASA Technical Memorandum; 2010-216395; NASA Ames: Moffett Field, CA, USA, 2010. [Google Scholar]
  44. Levenshtein, V.I. Binary Codes Capable of Correcting Deletions, Insertions and Reversals; Doklady Akademiii Nauk SSSR, Translator; USSR Academy of Science, Leningrad Soviet Union: Moscow, Russia, 1966; Volume 163, pp. 845–848. [Google Scholar]
  45. Stolcke, A.; Droppo, J. Comparing Human and Machine Errors in Conversational Speech Transcription. Proc. Interspeech 2017, 137–141. [Google Scholar] [CrossRef] [Green Version]
Figure 1. CWP setup including headset for radio telephony, radar screen, ASRU log, and secondary screen.
Aerospace 10 00538 g001
Figure 2. Approach chart Vienna (LOWW) TMA adapted from aeronautical information publication (AIP) [24] with adding the four metering fixes BALAD, NERDU, PESAT, MABOD and the names WW* of selected waypoints.
Aerospace 10 00538 g002
Figure 3. Main radar screen with LOWW airspace: waypoints (grey), start of transitions (NERDU, MABOD, BALAD, PESAT), as well as aircraft symbols and labels (green). This is a screen shot, how the screen is shown to the ATCo with the exception that we added the four metering fixes NERDU, MABOD, BALAD and PESAT. Overlapping of information often happens and the ATCo knows how to deal with these challenges.
Aerospace 10 00538 g003
Figure 4. (a) Reduced (standard) aircraft data block, (b) full aircraft data block, (c) full aircraft data block with ASRU output, (d) drop-down menu to manipulate radar label cells.
Aerospace 10 00538 g004
Figure 5. SpeechLog at CWP.
Aerospace 10 00538 g005
Figure 6. SWP with the following three parts from left to right: strip view, workspace, radar.
Aerospace 10 00538 g006
Figure 7. ASRU component setup during validation trials.
Aerospace 10 00538 g007
Figure 8. Elements of instructions consisting of callsigns, commands, etc.
Aerospace 10 00538 g008
Figure 9. Screenshot of the Bedford Workload Scale questionnaire interface.
Aerospace 10 00538 g009
Figure 10. (a) Secondary task before start; (b) secondary task after start.
Aerospace 10 00538 g010
Table 1. Colored-coded answer options of the CARS questionnaire.
1. Improvement mandatory. Safe operation could not be maintained.
2. Major Deficiencies. Safety not compromised, but system is barely controllable and only with extreme controller compensation.
3. Major Deficiencies. Safety not compromised but system is marginally controllable. Considerable compensation is needed by the controller.
4. Major Deficiencies. System is controllable. Some compensation is needed to maintain safe operations
5. Very Objectionable Deficiencies. Maintaining adequate performance requires extensive controller compensation
6. Moderately Objectionable Deficiencies. Considerable controller compensation to achieve adequate performance.
7. Minor but Annoying Deficiencies. Desired performance requires moderate controller compensation
8. Mildly unpleasant Deficiencies. System is acceptable and minimal compensation is needed to meet desired performance.
9. Negligible Deficiencies. System is acceptable and compensation is not a factor to achieve desired performance.
10. Deficiencies are rare. System is acceptable and controller doesn’t have to compensate to achieve desired performance.
Color code: Pink: Not acceptable, Yellow: Changes necessary, Green: Acceptable.
Table 2. ATCos’ answers to the NASA TLX questions to determine the effort needed to accomplish the task.
ATCo IdSol 1Base 2DiffATCo IdBase 1Sol 2Diff
1752384−4
278−1574−3
4550732−1
6312973−4
84131162−4
10633
12330
Average5.03.71.3Average6.23.0−3.2
Average Run 15.50Average Run 23.42
Light yellow color shows the first run of an ATCo, light green shows his/her second run.
Table 3. ATCos’ answers to NASA TLX questions to evaluate the effort needed to accomplish the task after compensating for sequence effects.
ATCo IdSol 1Base 2DiffATCo IdBase 1Sol 2Diff
166−0.1375−0.9
269−3.1565−0.9
446−2.17231.1
622−0.1964−1.9
8320.91153−1.9
10540.9
1224−2.1
Average4.04.8−0.8Average5.24.0−1.1
Average Run 14.46Average Run 24.46
Light yellow color shows the first run of an ATCo, which are decremented by 1.04 compared to Table 2, light green shows his/her second run, which are incremented by 1.04. The values are rounded.
Table 4. Performance at the word level quantified as the word error rate (WER).
# WordsLevenshtein Distance# Subst# Del# InsWER
Total118,8163712185313245353.12%
Heavy64,441214810667293533.33%
Medium54,37515647875951822.88%
Solution59,18018058816862383.05%
Baseline59,63619079726382973.20%
# means “Number of”.
Table 5. Top 10 words with challenges on word level ordered by total recognitions.
WordSubst bySubst toInsDelSumSaidRecogn%
two322619171455884190905%
one321303344239812882153%
zero20101824153757676412%
four209104954376580456546%
three1073925117562456712%
eight997837200414542252388%
austrian1343525167497948283%
five7774109170374537435%
ILS700041111198818776%
air2452348100130912658%
Table 6. Performance at the semantic level for different traffic complexities and for baseline and solution runs.
Cmd-Recog-RateCmd-Error-RateCsgn-Recog-RateCsgn-Error-Rate
All Scenarios92.1%2.8%97.8%0.6%
Medium92.7%2.7%97.9%0.5%
Heavy91.7%2.9%97.8%0.6%
Baseline91.8%2.8%97.5%0.6%
Solution92.4%2.8%98.1%0.5%
Table 7. Performance at the semantic level quantified as recognition and error rates.
Level of EvaluationWERCmd-Recog-RateCmd-Error-RateCsgn-Recog-RateCsgn-Error-Rate
Full Command3.1%92.1%2.8%97.8%0.6%
Only Label92.5%2.4%97.8%0.6%
Only Label, offline93.4%1.7%97.9%0.5%
Only Label, gold0.0%99.3%0.3%99.9%0.1%
Full Command, gold99.1%0.4%99.9%0.1%
Table 8. Performance without using callsign prediction.
Full CommandWERCmd-Recog-RateCmd-Error-RateCsgn-Recog-RateCsgn-Error-Rate
No Context, gold0.0%80.6%14.4%81.6%14.1%
No Context, S2T3.1%66.9%22.1%71.6%20.9%
Table 9. ISA value results and significance analysis.
ValueCompositionMedium ScenarioHeavy ScenarioCombined
ISA meanwith ASRU2.392.872.63
without ASRU2.483.262.87
ISA deltaSE−0.09−0.39−0.25
min α10.6%0.5%0.3%
ISA deltaNSE−0.03−0.39−0.21
min α42.6%1.1%3.1%
SE = sequence effect; NSE = no sequence effect; minimal α values, shaded in green for 0% ≤ α < 5%, and in yellow for (|α| ≥ 10%).
Table 10. Results of NASA TLX questionnaires for the different traffic scenarios with and without compensating for sequence effects.
HypothesesMediumHeavyBoth
DiffαDiffαDiffα
SENSESENSESENSESENSESENSESENSE
MD−0.08−0.3544.2%14.0%−0.50−0.5017.9%17.5%−0.29−0.4222.8%8.5%
PD−0.42−0.5414.9%4.8%−1.08−1.082.5%2.0%−0.75−0.811.4%0.4%
TD−0.08−0.2643.2%23.6%−0.33−0.3324.3%20.8%−0.21−0.3026.9%13.6%
OP0.420.38−6.1%−7.6%−0.08−0.0844.8%44.7%0.170.15−31.5%−33.1%
EF−0.58−0.9322.6%1.9%−0.75−0.754.1%2.9%−0.67−0.846.5%0.2%
FR−0.33−0.5029.6%17.9%0.080.08−45.4%−44.7%−0.13−0.2139.6%30.7%
Summary−0.18−0.3734.0%9.2%−0.44−0.4415.9%13.0%−0.31−0.4115.6%4.4%
Minimal α values are shaded in green for 0% ≤ α < 5%, in light green for 5% ≤ α < 10%, in light red for light evidence (−10% ≤ α < −5%) that results were worse with ASRU support, and in yellow for the rest (|α| ≥ 10%). MD = mental demand, PD = physical demand, TD = temporal demand, OP = operational performance, EF = effort, FR = frustration. The blue color of “OP” is explained in the text below.
Table 11. Results of the Bedford Workload Scale for the different traffic scenarios with and without compensating for the sequence effects.
HypothesesMediumHeavyBoth
DiffαDiffαDiffα
SENSESENSESENSESENSESENSESENSE
Average−0.42−0.4911.1%6.1%−0.33−0.3318.7%16.7%−0.38−0.416.7%3.8%
Peak−0.33−0.4415.9%4.6%−0.17−0.1734.4%34.3%−0.25−0.3117.2%10.4%
Summary−0.38−0.4711.9%4.2%−0.25−0.2523.6%22.7%−0.31−0.369.0%4.6%
Minimal α values are shaded in green for 0% ≤ α < 5%, in light green for 5% ≤ α < 10%, and in yellow for the rest (|α| ≥ 10%). The columns were previously explained in the NASA TLX results Section 4.1.2.
Table 12. Results of system usability scale for the different traffic scenarios with and without compensating for the sequence effects.
HypothesesMediumHeavyBoth
DiffαDiffαDiffα
SENSESENSESENSESENSESENSESENSE
1−1.10−1.062.4%2.7%−1.00−1.000.9%0.8%−1.05−1.030.1%0.1%
2−1.20−1.180.3%0.4%−0.80−0.801.5%1.5%−1.00−0.992 × 10−42 × 10−4
3−1.50−1.463 × 10−66 × 10−6−1.00−1.000.3%0.3%−1.25−1.233 × 10−73 × 10−7
40.200.22−24.3%−21.9%0.700.70−1.8%−1.8%0.450.46−2.1%−1.8%
5−0.80−0.842.2%1.5%−1.00−0.941.6%1.5%−0.89−0.890.1%0.1%
6−0.40−0.357.4%8.5%0.000.00NR−50.0%−0.20−0.1715.9%16.9%
7−0.20−0.2224.3%22.5%−0.30−0.3016.0%15.9%−0.25−0.2611.1%10.3%
8−1.29−1.280.1%0.1%−1.40−1.400.6%0.7%−1.35−1.351 × 10−41 × 10−4
9−0.80−0.760.9%1.1%−0.70−0.704.8%3.6%−0.75−0.730.2%0.2%
10−0.30−0.3922.2%15.2%−0.10−0.1037.3%36.6%−0.20−0.2520.8%15.0%
Summary−0.75−0.740.2%0.2%−0.55−0.550.8%0.8%−0.65−0.648 × 10−58 × 10−5
Minimal α values are shaded in green for 0% ≤ α < 5%, in light green for 5% ≤ α < 10%, in orange if we had high evidence (−5% ≤ α < 0%) that the results were worse with ASRU support, and in yellow for the rest (|α| ≥ 10%). “NR” means “no result”, i.e., the average deviations are 0.0%. The columns were previously explained in the NASA TLX results section. Sometimes, not all ATCos answered all questions. In rare cases, a different number of answer pairs were obtained for starting with baseline or starting with solutions runs. Therefore, the entries in columns SE and NSE for the heavy traffic scenarios can be different, as shown for question 5. The blue colors in column 1 are already explained at the end of Section 4.2.2.
Table 13. Results of the controller acceptance rating scale (CARS) for the different traffic scenarios with and without compensating for sequence effects.
HypothesesMediumHeavyBoth
DiffαDiffαDiffα
SENSESENSESENSESENSESENSESENSE
Maturity−1.90−1.722.3%3.7%−1.22−1.122.7%4.6%−1.50−1.360.3%0.7%
Minimal α values are shaded in green for 0% ≤ α < 5%, see the NASA TLX results Section 4.2.2 for column names.
Table 14. Results of situation awareness using SHAPE for the different traffic scenarios with and without compensating for sequence effects.
HypothesesMediumHeavyBoth
DiffαDiffαDiffα
SENSESENSESENSESENSESENSESENSE
1−0.09−0.1335.6%25.4%−0.50−0.501.1%0.9%−0.30−0.323.2%1.4%
20.180.16−21.0%−22.6%−0.17−0.1720.9%20.9%0.00−0.01NR47.8%
3−0.55−0.581.0%0.2%−0.42−0.4212.5%9.5%−0.48−0.491.4%0.5%
4−0.27−0.2812.8%11.7%−0.33−0.3314.2%11.2%−0.30−0.316.1%4.3%
50.00−0.01NR47.2%0.000.00NRNR0.00−0.01NR49.1%
6−0.09−0.1842.8%32.0%−0.58−0.587.7%2.8%−0.35−0.3913.8%5.5%
Summary−0.14−0.1721.5%8.6%−0.33−0.338.2%5.3%−0.24−0.265.4%1.8%
Minimal α values are shaded in green for 0% ≤ α < 5%, in light green for 5% ≤ α < 10%, and in yellow for |α| ≥ 10%, “NR” means “no result”, i.e., the average deviations are 0.0%. The columns itself and the blue color in column 1 were previously explained in the NASA TLX results Section 4.2.2.
Table 15. Results of the SHAPE Automation Trust Index (SATI) for the different traffic scenarios with and without compensating for sequence effects.
HypothesesMediumHeavyBoth
DiffαDiffαDiffα
SENSESENSESENSESENSESENSESENSE
1−1.10−1.214.4%2.7%−2.09−2.072 × 10−42 × 10−4−1.62−1.661 × 10−45 × 10−5
20.100.14−42.6%−39.8%−0.45−0.4512.5%12.7%−0.19−0.1727.9%29.8%
30.100.21−42.6%−34.0%−0.64−0.605.8%5.9%−0.29−0.2119.4%24.8%
4−0.70−0.669.4%10.4%−1.09−1.050.8%0.6%−0.90−0.870.4%0.4%
5−0.10−0.1243.3%41.9%−1.45−1.453 × 10−43 × 10−4−0.81−0.821.5%1.4%
6−1.10−1.236.8%3.7%−1.18−1.116.2%5.9%−1.14−1.171.5%0.8%
Summary−0.47−0.4817.7%17.0%−1.15−1.120.2%0.2%−0.83−0.820.5%0.5%
Minimal α values are shaded in green for 0% ≤ α < 5%, in light green for 5% ≤ α < 10%, and in yellow for |α| ≥ 10%. The columns were previously explained in the NASA TLX results Section 4.2.2.
Table 16. Results of assessing the impact on mental workload for the different traffic scenarios with and without compensating for sequence effects.
HypothesesMediumHeavyBoth
DiffαDiffαDiffα
SENSESENSESENSESENSESENSESENSE
10.330.22−22.7%−29.1%−0.08−0.0839.3%37.1%0.130.07−32.1%−38.5%
20.420.29−20.8%−26.5%−0.67−0.672.3%1.8%−0.13−0.1934.4%25.7%
30.00−0.14NR36.9%−0.75−0.753.5%3.3%−0.38−0.4412.0%6.3%
40.250.15−28.5%−35.4%−0.50−0.506.2%6.0%−0.13−0.1732.5%25.3%
50.750.60−4.7%−5.3%0.000.00NRNR0.380.30−8.3%−10.0%
60.820.63−4.1%−7.8%0.180.21−31.2%−28.0%0.500.42−4.7%−6.9%
70.08−0.07−43.2%43.2%−0.42−0.4213.7%13.3%−0.17−0.2429.5%18.8%
80.580.54−8.6%−10.0%−0.17−0.1732.2%29.0%0.210.19−22.9%−23.7%
9−0.17−0.3937.5%12.6%−0.67−0.678.2%8.1%−0.42−0.5311.9%3.4%
100.17−0.03−37.2%47.1%−0.25−0.2522.2%21.6%−0.04−0.1444.5%28.5%
110.500.40−11.1%−14.7%−0.30−0.2820.5%22.1%0.100.06−35.9%−41.0%
120.580.54−4.9%−5.9%−0.42−0.424.2%4.1%0.080.06−35.4%−38.8%
130.580.46−9.4%−12.1%−0.58−0.582.9%2.5%0.00−0.06NR40.3%
140.08−0.10−43.0%39.1%−0.50−0.501.1%1.1%−0.21−0.3021.3%7.3%
150.170.00−35.6%NR−0.42−0.422.3%2.2%−0.13−0.2130.8%14.8%
Summary0.320.19−20.4%−27.3%−0.38−0.382.6%2.5%−0.03−0.1044.3%30.2%
Minimal α values are shaded in green for 0% ≤ α < 5%, in light green for 5% ≤ α < 10%, in orange, if we have high −5% ≤ α < 0% or in light red for (−10% ≤ α < −5%), and yellow is used for the rest (|α| ≥ 10%), when we have no statistical significance in any direction. “NR” means “no result”, i.e., the average deviation was 0.0%. The columns were previously explained in the NASA TLX results Section 4.2.2.
Table 17. Number of successfully performed Stroop Tests.
MediumHeavyBoth
DiffαDiffαDiffα
SENSESENSESENSESENSESENSESENSE
11.313.59.3%3.6%14.314.33.6%2.3%12.813.91.3%0.3%
Minimal α values are shaded in green for 0% ≤ α < 5%, see the NASA TLX results Section 4.2.2 for column names.
Table 18. Number of errors in radar-label cells after compensating for sequence effects for the heavy and medium scenarios.
BaselineSolution
TypeGoldClicksMissAddRRGoldClicksMissAddRR
Alti *19501906622095%197828191695%
Spd *11021074703589%11833417389%
Head *936572351894%8947301194%
WP *598589291485%60420182587%
Tran *301216891285%289723188%
Rate *637413467%64116174%
Spec *1367936141593%137219341592%
* Row “Alti” shows the number of commands, which were spoken and would require an input into the altitude cell in the radar label. “Spd” denotes the speed cell, “Head” denotes the heading cell, “WP” denotes the waypoint cell, “Tran” denotes the “Transition/Route” cell, “Rate” denotes the descent rate cell, and “Spec” denotes the ILS/approach clearance and the change frequency command type cell. Cells marked in orange, are analyzed in more detail in [29].
Table 19. Number of errors in radar label compensating sequence effects and considering the special situation of the Vienna Approach Control.
BaselineSolution
Type *GoldClicksMissAddRRGoldClicksMissAddRR
Alti19501906581195%197828191595%
Spd11021074701589%11833417289%
Head936572108494%8947131094%
WP598589291185%60420182487%
Tran301216901185%289722188%
Rate637413267%64116074%
Spec1367936131293%137219341592%
Sum6317536738065 638412613068
* The rows are already explained in the footer of Table 18. The blue and orange color coding of the cells is explained in the text below.
Table 20. Minimum alpha values for the hypothesis that ASRU improves the correctness of radar label cell contents without and with compensating for sequence effects.
HypothesesMediumHeavyBoth
SENSESENSESESNE
Alti.5.0 × 10−45.0 × 10−49.2%8.1%2.2 × 10−44.7 × 10−4
Spd2.0%2.0%0.6%5.4 × 10−32.8 × 10−45.7 × 10⁻⁴
Head6.2%6.0%1.1%5.6 × 10−31.9 × 10−32.8 × 10⁻³
WP18.7%17.0%8.6%8.5%4.8%5.1%
Tran2.8%1.3%8.2 × 10−44.7 × 10−45.1 × 10−51.5 × 10−4
Rate−24.3%−20.7%3.5%2.9%11.4%11.8%
Spec−6.8%−7.1%−9.3%−9.0%−2.6%−2.9%
Sum2.9 × 10−32.7 × 10−32.3 × 10−42.3 × 10−43.5 × 10−73.8 × 10⁻⁶
Minimal α values are shaded in green for 0% ≤ α < 5%, in light green for 5% ≤ α < 10%, in orange if we have evidence that results were worse with ASRU support (–5% ≤ α < 0%), in light red for (–10% ≤ α < 5%), and in yellow for the rest (|α| ≥ 10%).
Disclaimer/Publisher’s Note: The statements, opinions and data contained in all publications are solely those of the individual author(s) and contributor(s) and not of MDPI and/or the editor(s). MDPI and/or the editor(s) disclaim responsibility for any injury to people or property resulting from any ideas, methods, instructions or products referred to in the content.

