3.1. Aerodynamic Loading Performance
In the present work, the rotor blade was configured in an edgewise inflow condition relative to the air stream, similar to conventional helicopters in level forward flight operations. The mean inflow velocity, , was set to a range from 10 m/s to 22 m/s, while the rotation speed, , was maintained at a constant rotational speed of 5500 rpm. This setting corresponded to an advance ratio , between 0.1 to 0.25, which was calculated as the ratio between the freestream velocity and the tip velocity , where R was the blade radius. Under conditions of zero wind speed, the rotational speed setting corresponded to a tip Mach number of 0.26 for the tested blade size. The edgewise rotor experienced two different behaviours in every rotation, depending on the blade’s azimuthal position or velocity vector relative to the freestream. The relative air velocity normal to the blade was maximum at the advancing blade side, and minimum at the retreating blade side. This velocity differential would generate more lift on the advancing side than on the retreating side, because the blades were rigidly connected to the hub, and there was no flapping hinge. In the present work, the aerodynamic performance was evaluated using the loading data measured from the load cell transducer mounted behind the motor. The data corresponded to the total load generated along the blade’s rotational axis, comprised of the thrust (T) force acting in the normal direction against the plane of rotation and the angular force torque (Q).
The measured averaged thrust and torque forces are plotted in
Figure 3 for different inflow velocities at a constant rotational speed. The results present the variation of loading generated when tested in laminar and grid inflow conditions. The standard deviation errors are also shown for repeated data measurements. The results indicate that ingesting both the grid turbulences slightly increased the magnitude of thrust generated by the rotor blade at less torque than in laminar inflow condition at any given inflow velocity. This trend suggests that an additional radial force component was exerted and transmitted to the rotor shaft, due to the ingestion of an unsteady and turbulent flow field [
30].
The aerodynamic coefficients were calculated from the measured loading data, in terms of coefficient of thrust (
) and coefficient of power (
), which were calculated as
where
A was the area of the rotor disc,
was the propeller’s rotational speed in rad/s, and
was the air density.
The results in
Figure 4a demonstrate that at a constant rotational speed, thrust increased with inflow velocity irrespective of the inflow condition. Meanwhile, the power required by the rotor blade, to generate the same amount of lift as the flight speed, increased. This trend suggests a relatively advantageous operation at a higher advance ratio, as indicated by the plots of the power coefficient in
Figure 4b. Notably, in laminar inflow, the rotor blade consumed relatively more power at
, while producing slightly less thrust than in the Grid A and Grid B turbulent inflows: the differences, however, can be considered negligible.
3.2. Far-Field Noise Spectrum
Propeller noise is classified into harmonic tonal noise and broadband noise [
26,
31]. For this section, power spectral analyses were used, to characterise the aeroacoustics feature of the rotor blade under various turbulent inflow and operating conditions (blade rotational speed and streamwise inflow speed), using far-field microphone signals. The noise radiations of the energy content in the spectrum were also analysed, to reveal its directivity feature. The time-averaged flow field analyses revealed insights into the flow properties across the blade disc, and its associative links to the tested inflow turbulence.
The acoustics spectra are presented in this section, to characterise the frequency–energy content in the radiated noise. The energy content in the noise spectra are presented in terms of the power spectral density (PSD) of the spectrum of noise, which was calculated using
where
was the PSD of the measured acoustic pressure, and
was the conventional reference pressure of 20
Pa.
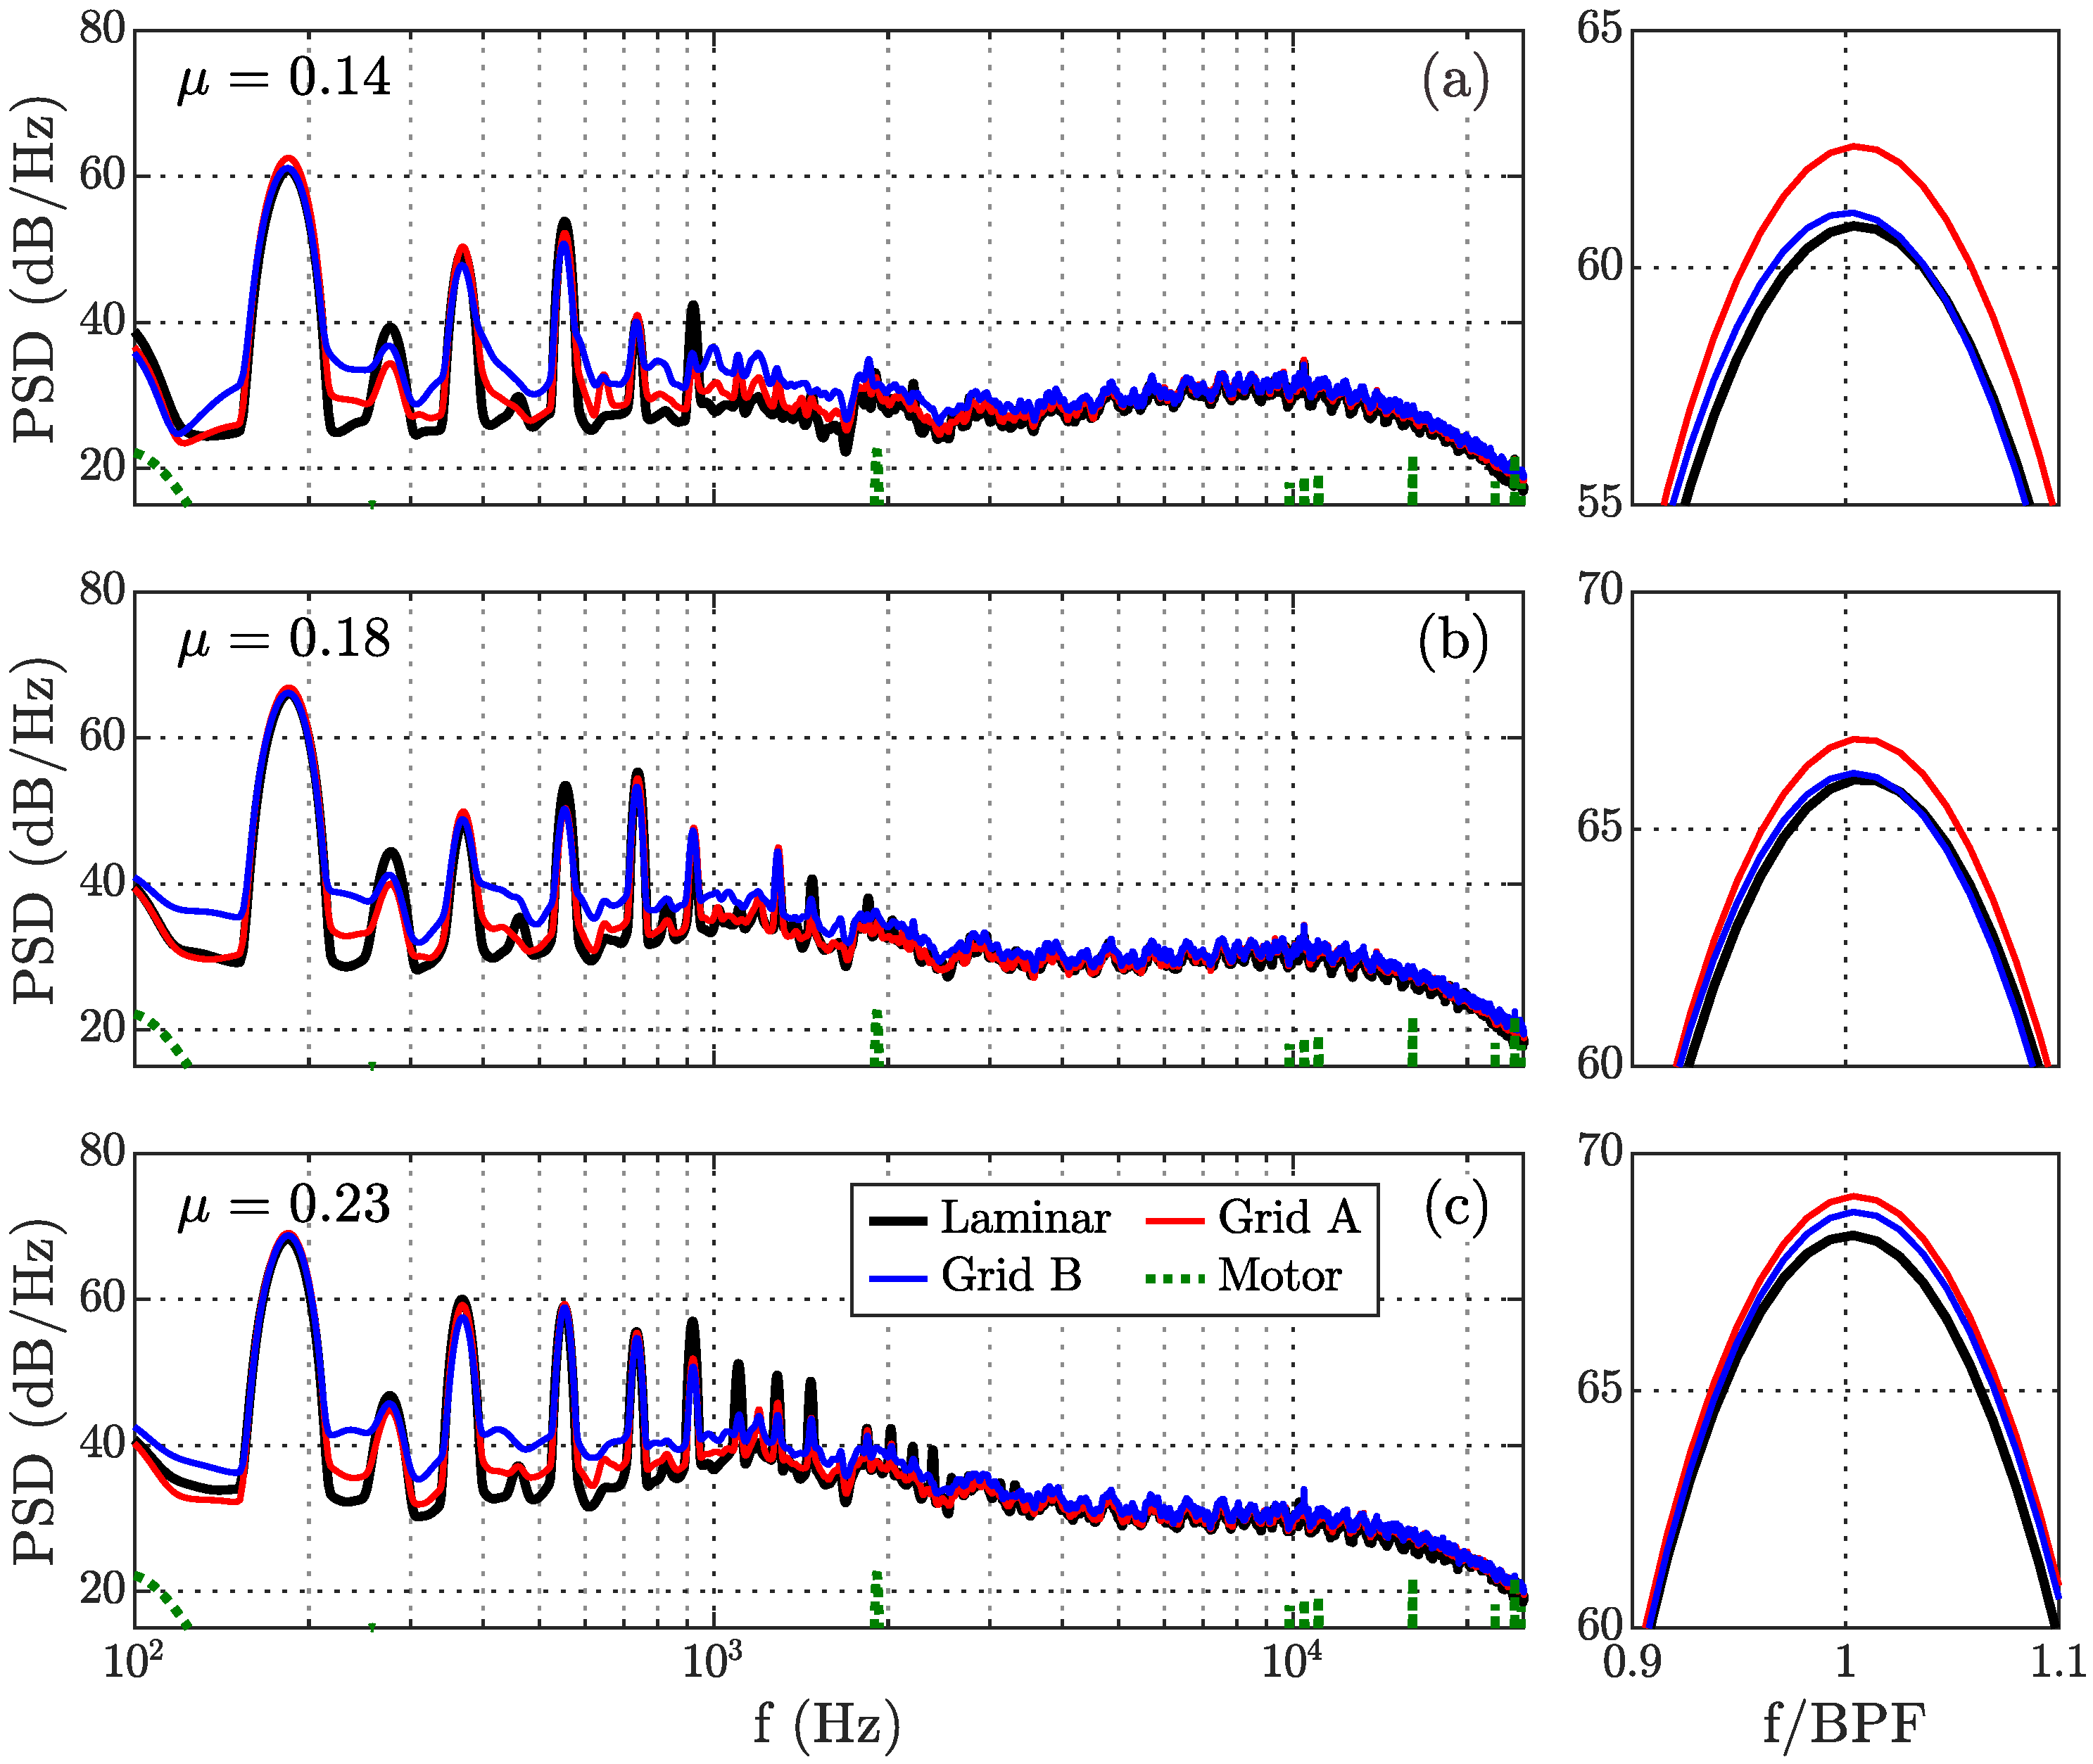
Figure 5 shows the top plane acoustic spectrum obtained from the polar microphone arrays, which were located above the plane of rotation of the rotor. The laminar inflow data were compared to the Grid A and B turbulent inflows for three advance ratio operating conditions: 0.14, 0.18, and 0.3. These PSD data were measured at a fixed rotational speed of 5500 rpm. The presented results were measured from the polar microphone position of
, perpendicular to the upstream direction. The results at the fundamental blade pass frequency (
) were magnified, and presented on the side of a larger frequency envelope, ranging between 100 Hz and 30 kHz, for the comparison.
It can be seen that the results of the laminar, Grid A, and Grid B inflows compared reasonably well, in terms of their tonal and broadband noise content, regardless of the rotor’s operating advance ratio. However, the multiples of tonal frequencies due to BPF increased at a higher advance ratio. This trend is evident from the total number of high-amplitude tonal peaks that can be seen in the lower-to-mid-frequency region, between 100 and 10,000 Hz, where BPF multiples with amplitudes above 50 dB/Hz increased from three harmonics at to around seven harmonics at . In a closer look at the fundamental BPF ( Hz), the Grid A results demonstrated the highest amplitude at all tested advance ratio operations. Meanwhile, the laminar and Grid B inflows results were noticeably similar, at and 0.18. Nevertheless, at , a distinct increase in the BPF amplitude for the Grid B turbulence case can be seen, compared to the laminar inflow results. This trend suggests potential noise source mechanisms related to the rotor operating conditions, intensifying the effects of turbulence ingestions, particularly for the fundamental blade pass frequency of the tonal noise.
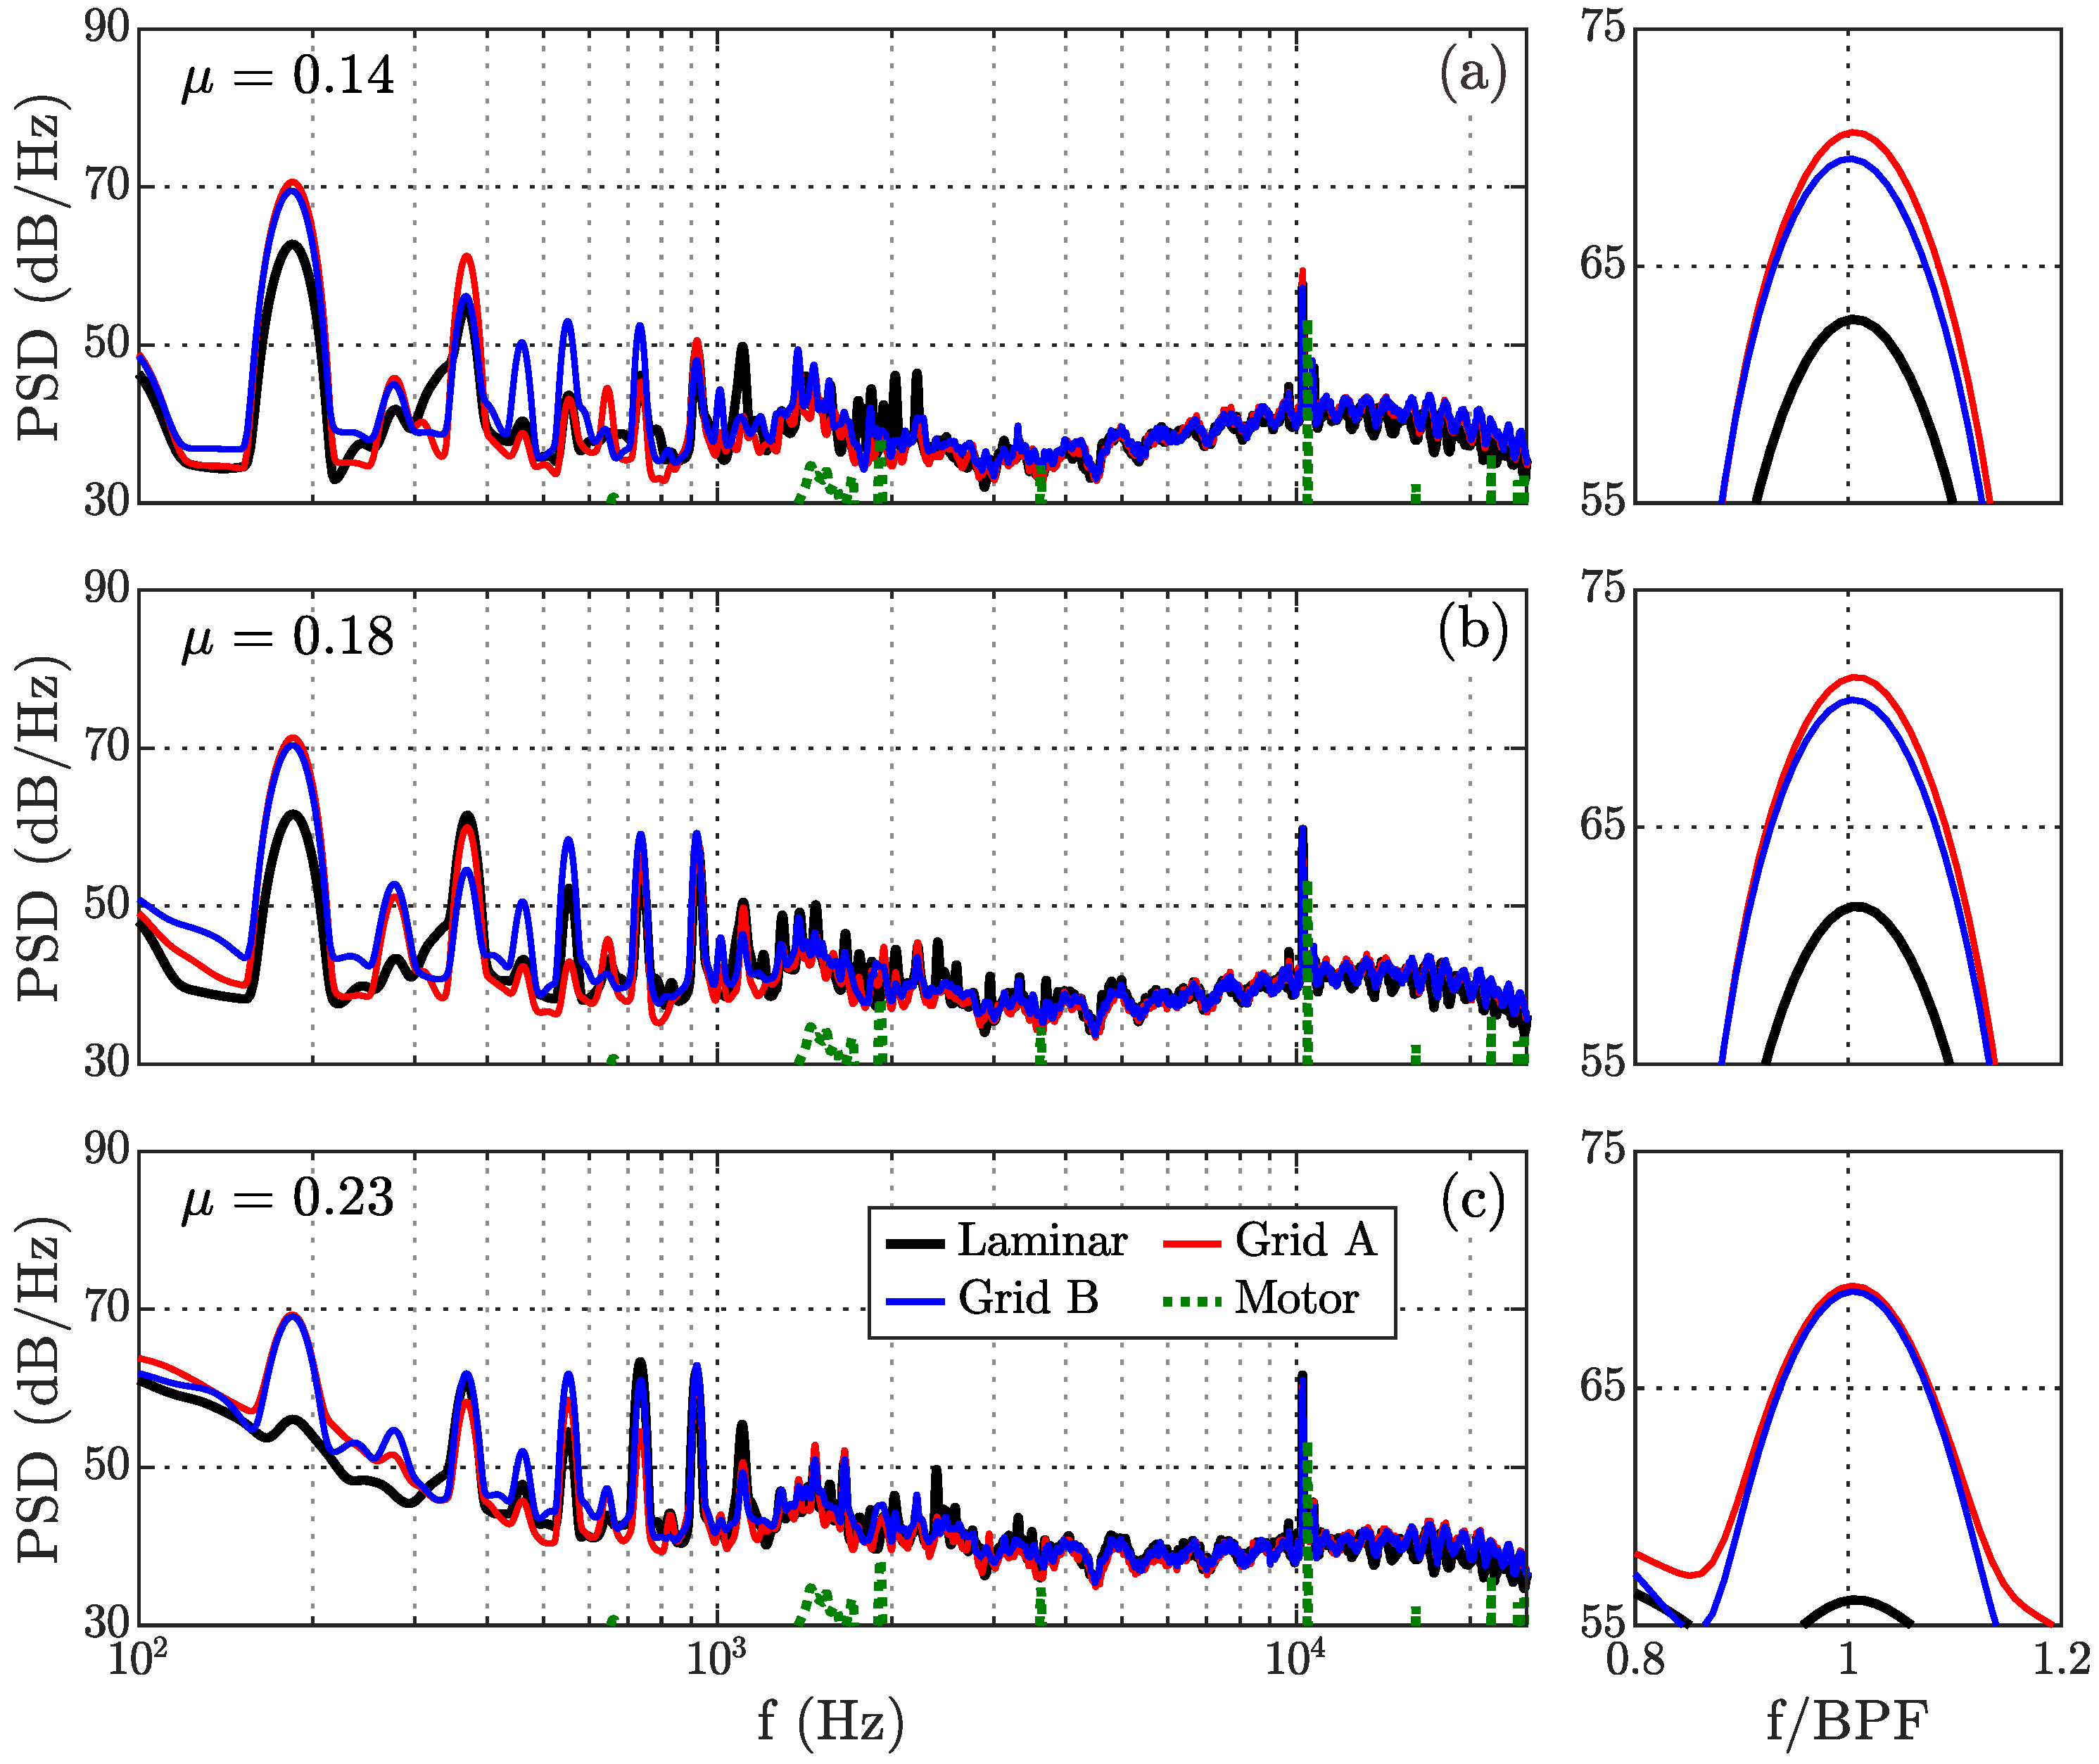
The acoustic spectra of the same rotor operational settings measured from the side plane of the rotor disc are shown in
Figure 6. The results represent an azimuthal observation position of
, as indicated in
Figure 1. It is important to note that a distance correction factor was applied to the data, to compare both microphone arrays (top and side), assuming spherical wave propagation in a free field. Significant differences can be seen, for the first harmonic tonal noise, between the laminar inflow and the grid turbulence cases. The Grid A and B cases recorded an increase of blade pass frequency tones of approximately 8 dB/Hz, relative to the laminar inflow for the operational range between
and 0.23. It can also be seen that the side plane acoustic spectrum exhibited features that contained higher harmonics tonal peaks that were more spread out over the low-frequency range (100–1000 Hz) at all tested advance ratios, as compared to the aforementioned top plane spectrum.
It is important to note that the motor-only noise (dashed green line) depicted a significant energy content at around 10.3 kHz, with a magnitude larger than 50 dB/Hz. This high-frequency noise component appeared in the vicinity of approximately
×
, which may have been related to the 18 electromagnetic poles of the motor used in the experiment, similarly reported by Baars et al. [
32]. This additional energy content from the motor may generate an additional noise source of a similar frequency range for laminar and grid turbulent cases, as seen in the spectrum.
3.3. Noise Radiation Directivity
The acoustic energy of the observed rotor noise spectra was investigated over a resolved frequency range, to explore the directivity features over the top and side planes. The noise magnitude is presented in terms of the overall sound pressure level (OASPL), which was calculated by integrating the energy spectrum with respect to frequency using,
where PSD was the power spectral density of the sound pressure, derived using Welch’s method based on unsteady pressure fluctuation [
33].
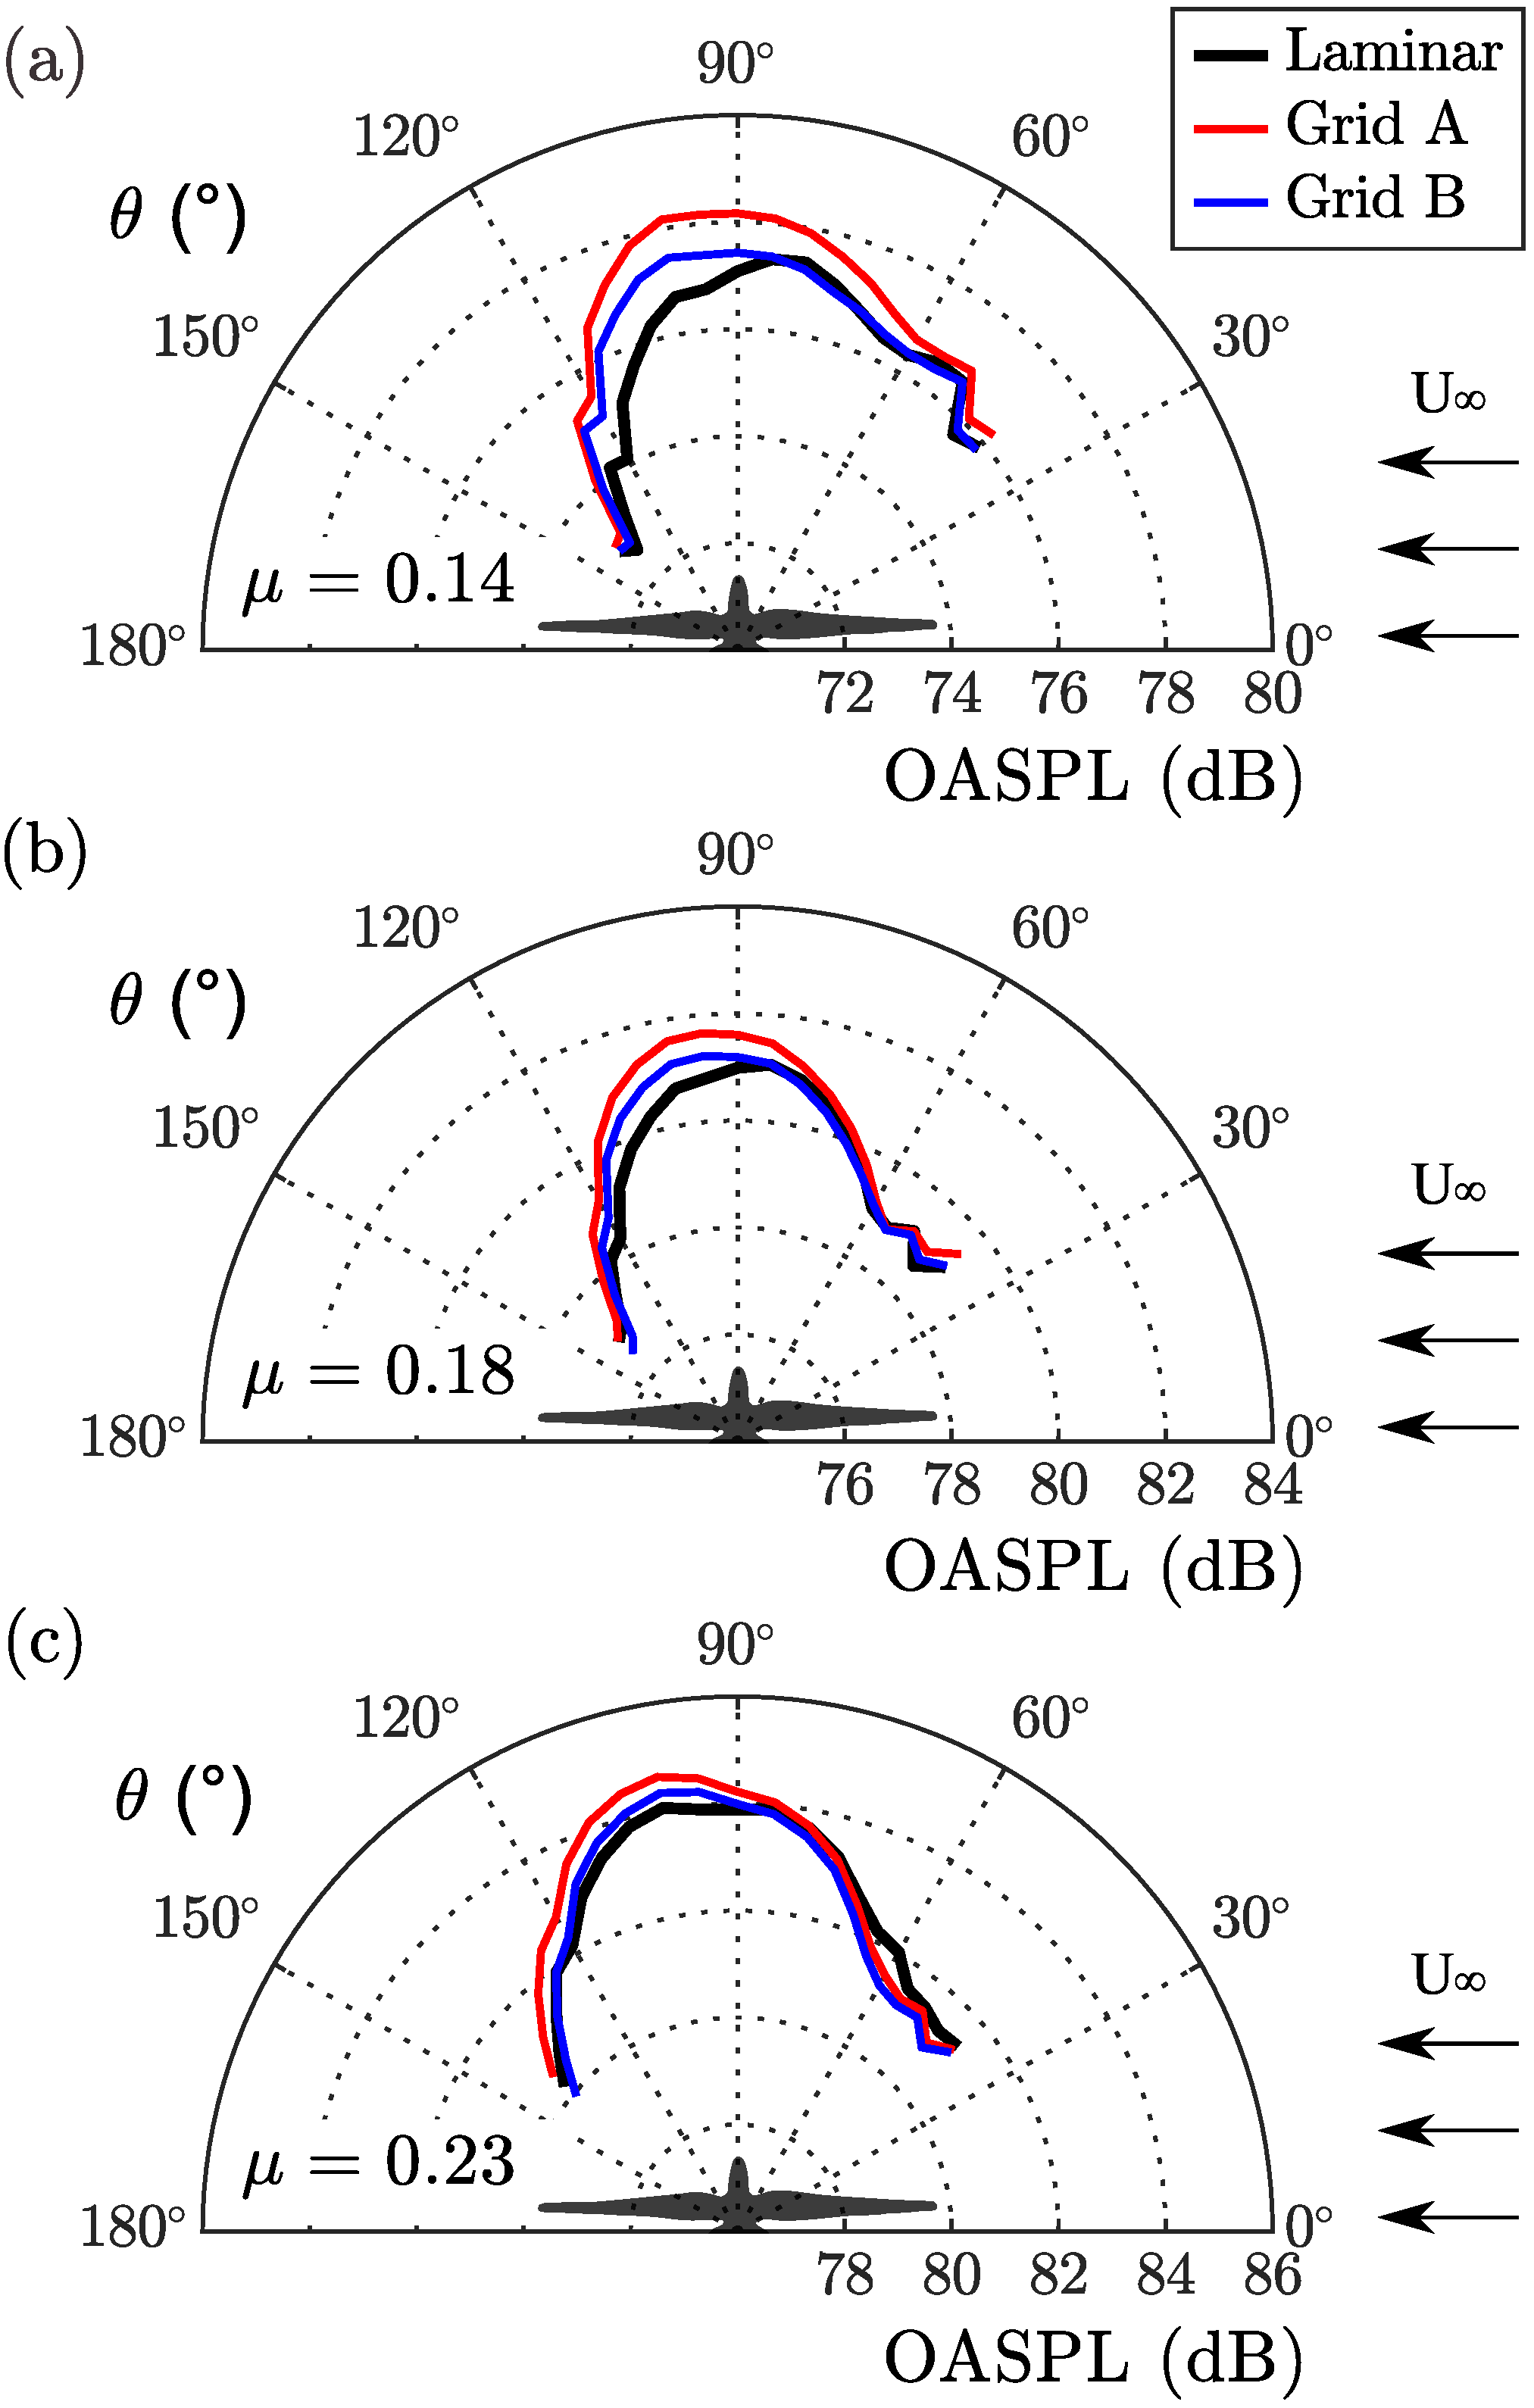
Figure 7 and
Figure 8 present the far-field noise directivities at the polar and streamwise planes, measured from the top and side microphone arrays, respectively. These results were computed using a resolved frequency,
f, ranging from 100 Hz to 30 kHz, and are shown for advance ratio operations of 0.14, 0.18, and 0.23 at a fixed rotation speed of 5500 rpm. The noise directivities in the top plane, as shown in
Figure 7, resemble a distribution of concentric rings, regardless of the rotor operation setting and inflow conditions. This concentric ring feature was slightly directed downstream from the rotation plane, and may have been related to the tonal noise component associated with loading and the geometrical feature of the blade, as previously seen by Qi et al. [
34]. The highest levels of overall sound pressure were observed near the rotation axis, directed towards the wake of the rotor (between
to
). A notable increase in the OASPL can be seen for the Grid A inflow cases, compared to the laminar and Grid B inflows, especially in the downstream observation angles.
The noise directivities in the side plane, as shown in
Figure 8, resembled a cardioid dipole feature, with its centre axis aligned to the rotor’s plane of rotation (
). Regardless of the inflow conditions, the results exhibited apparent cardioid-shaped directivity trends that were not observed in the top plane, where the minimum levels of noise magnitude were recorded at
. A substantial increase in the OASPL could be seen between laminar inflow cases and grid turbulence, especially in the region above the rotor disc (between
and
; however, the differences between the two grid cases were insignificant.
The directivities of the tonal noise radiation were also investigated, using a similar OASPL analysis, except that the calculations only considered a smaller domain of low-frequency range. The magnitudes of the sound pressure levels (SPL) of the tonal noise were calculated within a narrowband frequency range of ±10 Hz of the integer multiples of blade pass frequency. The results are presented in the first-, second-, and third-order harmonics of BPF, corresponding to a resolved frequency range between 173 to 193 Hz, 356 to 376 Hz, and 540 to 560 Hz, respectively.
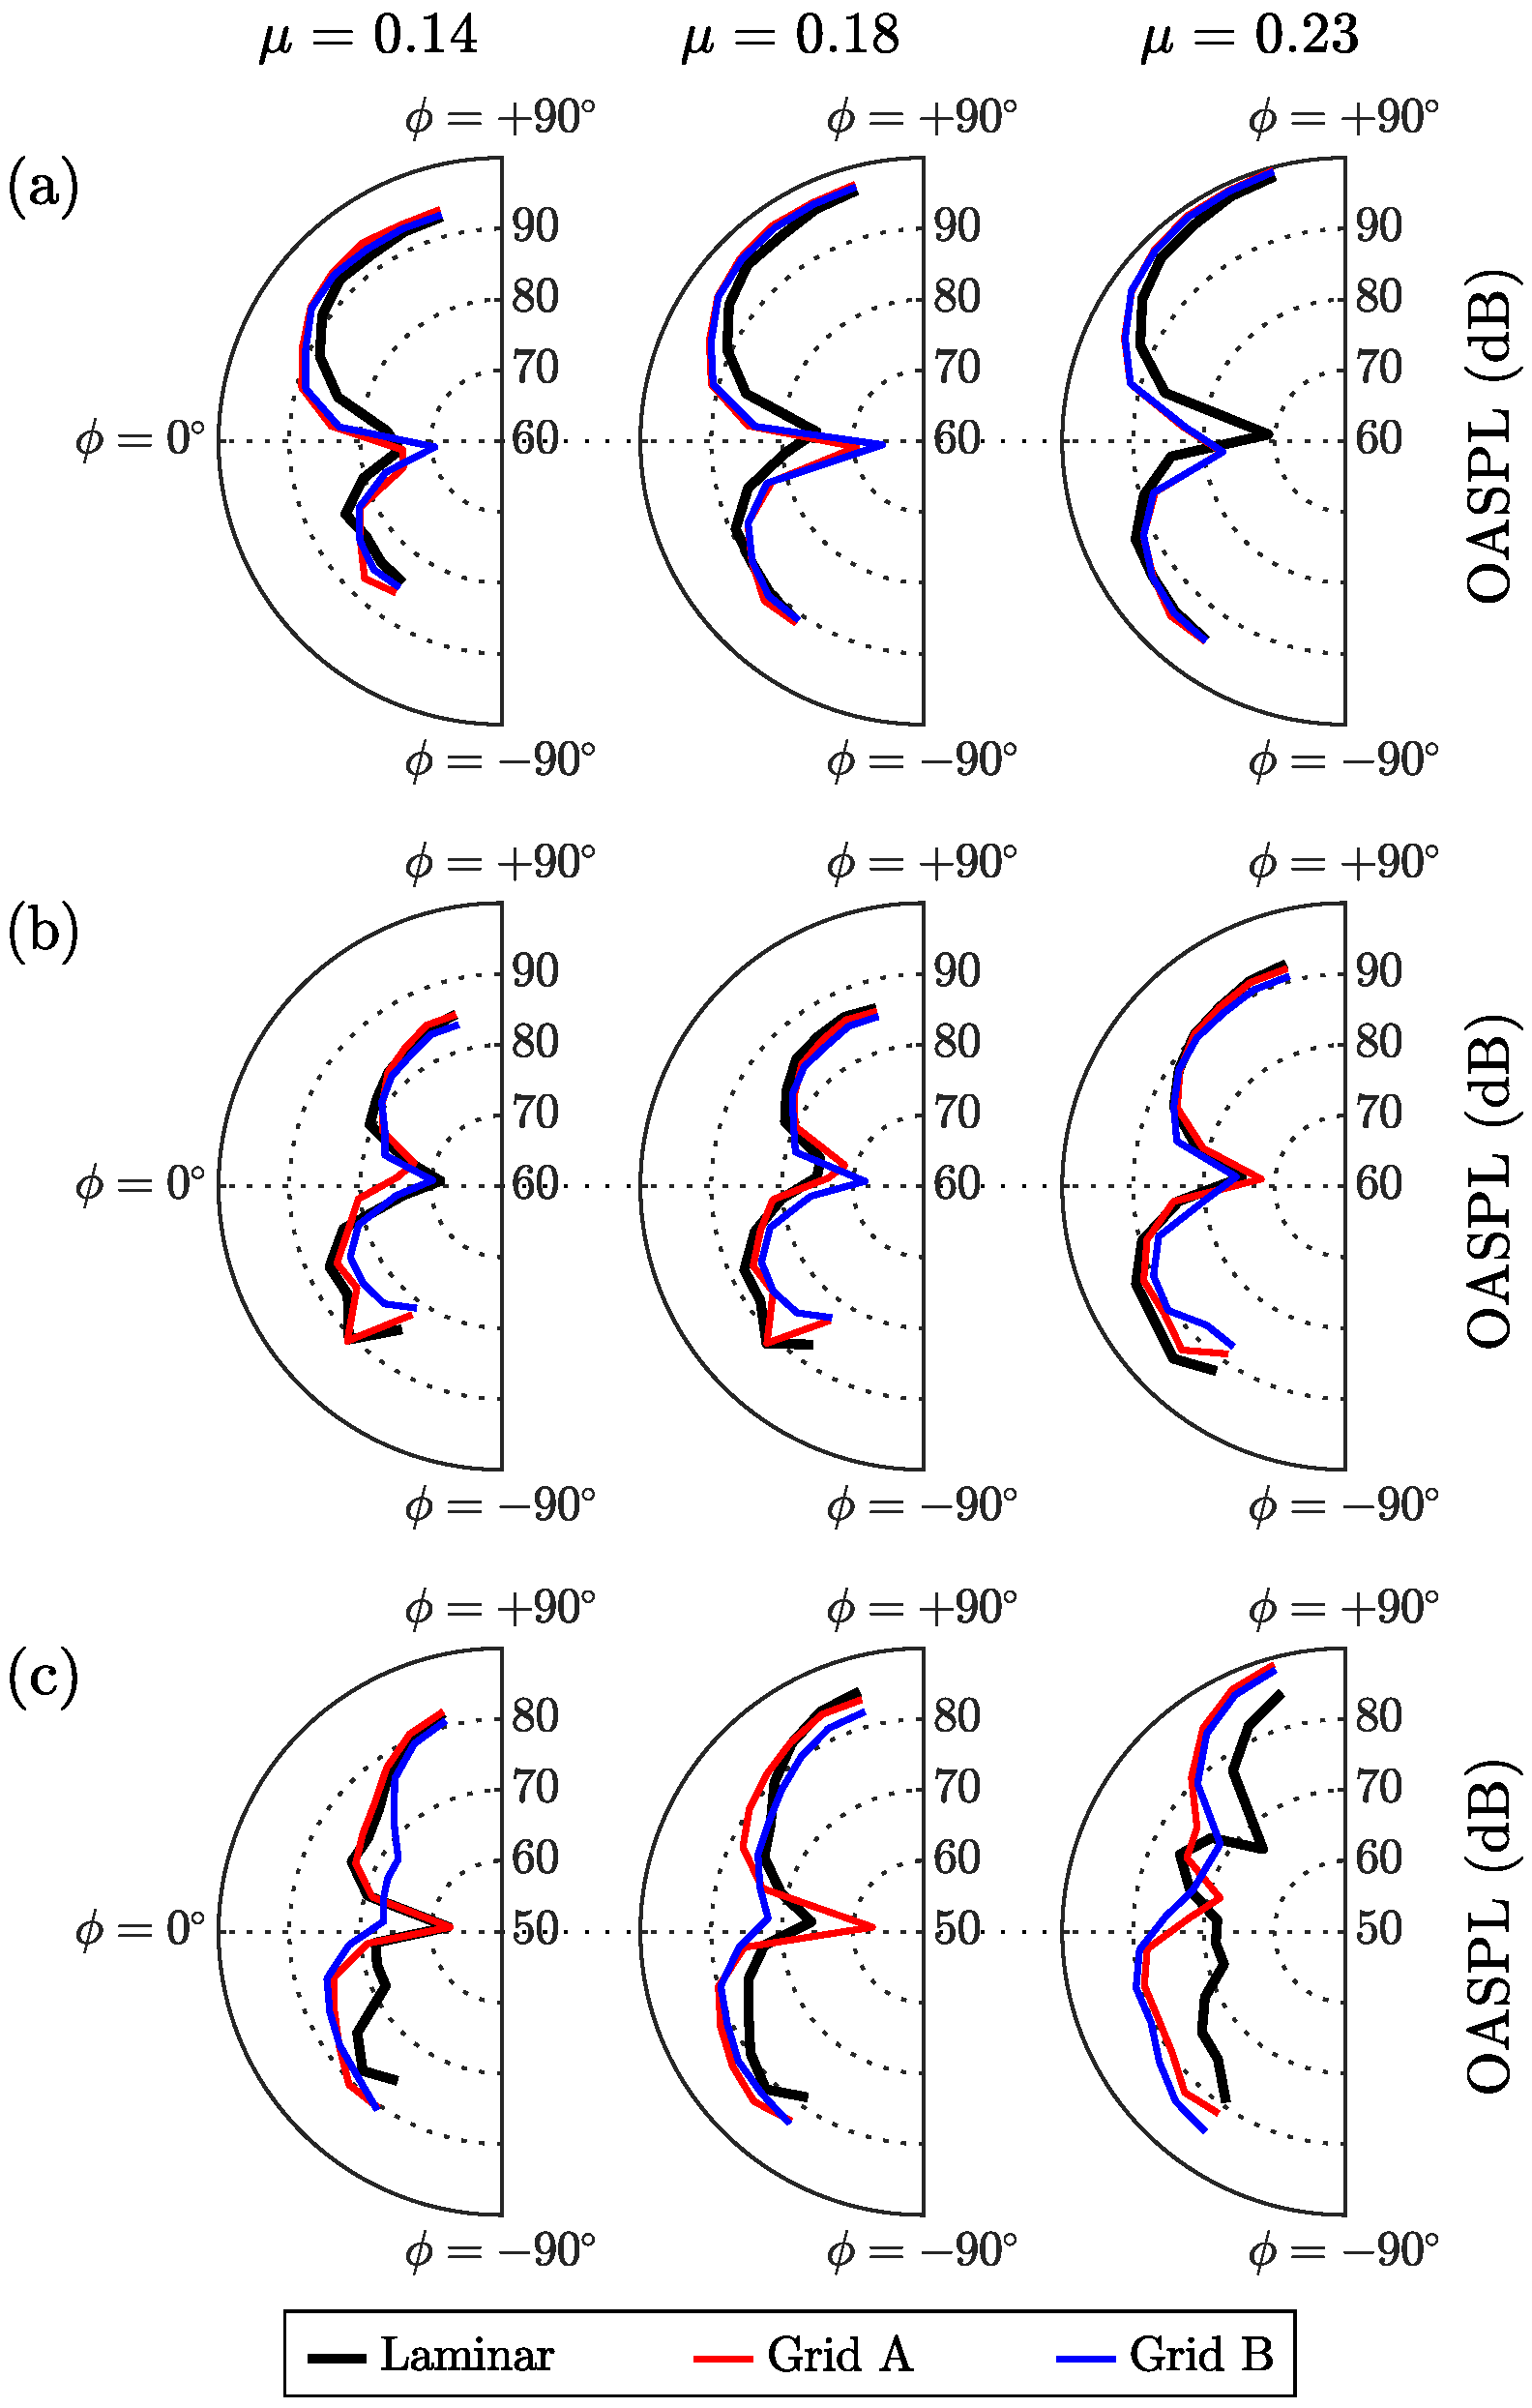
The polar radiation patterns of harmonic noise on the top plane are presented in
Figure 9 for three advancing ratio operations. The noise directivity of the first harmonics of BPF (see
Figure 9a) were highly oriented towards the downstream flow region, with maximum levels recorded near the blade rotation axis, which closely resembled the concentric rings directivity trends previously seen in
Figure 7. At higher advance ratio operations, the noise magnitudes noticeably increased at all polar angle observation points, regardless of the inflow conditions. The Grid A inflow results exhibited the highest levels of the OASPL, compared to Grid B and laminar inflow, at all tested advance ratios.
The directivity of the second-order harmonics of BPF, as shown in
Figure 9b, demonstrated a slight decrease in magnitude, compared to those from the first-order. Meanwhile, its radiation at all tested advance ratios obeyed no real patterns, and exhibited multiple peaks and pits in noise magnitude levels across the observation angles. A further decrease in noise magnitude across all polar angles could be observed for the third-harmonic noise, as presented in
Figure 9c. However, for all tested advance ratio operations, the radiation patterns appeared to be more consistent, with an apparent content of major lobes oriented downstream (
to
), and comparatively smaller side lobes upstream (
to
).
Figure 10 presents the radiation directivities of narrowband harmonic noise in the side planes, measured from a range of azimuthal points of observation. The BPF harmonic noise radiation patterns exhibited the expected dipole feature for all tested advance ratios, where the characteristics remained evident in the first-, second-, and third-order harmonics, presented in
Figure 10a–c, respectively. The dipolar patterns were mostly centred and aligned to the rotor’s plane of rotation, at
, and were highly oriented toward the upper region of the rotor disc. The results of the Grid A and B turbulence inflow cases appeared relatively comparable; however, throughout the azimuthal positions, there was a considerable increase in noise magnitude relative to the laminar inflow for the first- and third-order harmonics of BPF.
3.4. Time-Averaged Flow Field
To further understand the impact of turbulence ingestion on the wake development, measurements were made with PIV at a flow velocity of
= 16 m/s, and a blade rotation speed of 5500 rpm, corresponding to an advance ratio of
. This section presents the time-averaged flow quantities of the flow field surrounding the blade at both upstream and downstream locations, between
and
, where
R represents the radius of the blade. The measurements were taken on the x-z plane near the hub of the rotor blade, at the laminar, Grid A, and Grid B inflows. The measurements were made for a field view of 310 mm × 310 mm, which corresponded to a domain of 2
R × 2
R in the streamwise and vertical directions, as shown schematically in
Figure 11. The effects of turbulence ingestion were analysed from the variation of the magnitude of the total velocity (
) and the mean turbulent kinetic energy (
) associated with eddies in the streamwise flow. Due to the structural limitation, the laser sheet was placed at an offset location in the
y-axis, by approximately 0.2
R, where
.
The total velocity variation was presented as the normalised, time-averaged inflow velocity (
), where
was the magnitude of total velocity, and
was the freestream velocity. Meanwhile, the mean turbulent kinetic energy was calculated as half the sum of the root mean square of the measured velocity components, using
where
and
were the root mean square values of the vertical and streamwise velocity components, respectively.
Figure 12 illustrates the contour of the time-averaged, normalised total velocity
around the rotor disc, with and without turbulence ingestion. The total velocity,
, was resolved from the streamwise (
u) and vertical (
v) velocity components in the flow field. The velocity vectors, which were also comprised of the streamwise and vertical velocity components, are presented on top of each contour, to illustrate the evolution in the streamline’s direction within the flow field domain. The results show the presence of a distinct velocity gradient across the streamwise plane, indicating that the rotor blade surface was interacting with the flow. It should be noted that these PIV measurements were taken between the tips of the blade: hence, the accelerated flow at the further upstream and downstream locations was indiscernible. The results show that, regardless of the inflow conditions, variations in velocity gradient were evident in two main domains: the first was in the upstream domain above the rotor’s streamtube (
, while the second was downstream, at the wake of the blade (−1 ≤
≤ 0). The results from the Grid B case, with a larger turbulence length scale, demonstrated a relatively broader area of localised flow acceleration upstream of the streamtube than the laminar and Grid A inflows. Meanwhile, the downstream field near the wake of the blade exhibited a noticeably larger region of accelerated flow during laminar operation, as opposed to both of the grid inflows.
In order to better visualise the parametric variations at specific locations in the flow field, statistical turbulent flow quantities were extracted, and computed from the velocity contour. The evolution of velocity profile and development of vortex in the flow field, specifically within the blade disc area, could be assessed by looking into the airflow acceleration and the levels of turbulent kinetic energy in the flow field. The results are presented in Cartesian graphs, as shown in
Figure 13 and
Figure 14. A total of 10 streamwise locations are included, spanning from the tip of the blade downstream (
) to the tip of the blade upstream (
), at every increment of
. It should be noted that the rotor’s plane of rotation, or the rotor disc, was located at a vertical location of
, and that the shaded blade areas are included in the results, for illustration.
Figure 13 shows the normalised total inflow velocity (
) versus the non-dimensional vertical location (
). The results show that the airflow accelerated in the upper region of the streamtube (
), and peaked at around
, just over the blade surface, which was near the rotor’s plane of rotation. This characteristic could be seen in the upstream flow region, where the Grid A and B results indicated a noticeable increase in streamwise velocity, compared to the laminar inflow. Meanwhile, the airflow slightly decelerated above the blade’s rotation plane, as it travelled further downstream. At the same time, an increasing streamwise flow acceleration was apparent below the plane of rotation (
). Another interesting observation within this domain was that the Grid B inflow was less accelerated, as opposed to the laminar and Grid A inflows, which appeared to be fairly comparable.
The variation of normalised turbulent kinetic energy
is presented in
Figure 14 against the non-dimensional vertical location,
. The results indicate a significant increase in the levels of turbulent kinetic energy across a short domain of
, which was near the upper and lower regions of the blade disc. It can be seen that both grid inflow results display a significant increase in TKE throughout the upstream blade regions, as opposed to the laminar inflow, which is elongated in the streamwise direction, from
to
. The wake development in the downstream blade regions can be seen in the figure, where the levels of TKE vary progressively in the induced flow field at the wake of the rotor, corresponding to a vertical domain between
to
. More importantly, the Grid B results in those domains show an increase in TKE of up to 95% compared to the laminar; whereas, in the case of Grid A—which had a smaller turbulence length scale—the TKE increased by approximately half that of Grid B.
The results in
Figure 14 also reveal a difference in TKE levels between the laminar and grid cases within the downstream domain from
to
: this discrepancy may be attributed to the energy transfer from the rotating blade to the surrounding fluid. When the rotor operated under laminar inflow conditions, it operated more efficiently, as less energy was used in overcoming drag and turbulence; consequently, more of the input energy could be used to generate lift and thrust, unlike when the rotor was under turbulent inflow conditions. Further analysis of the root mean square (r.m.s) of the velocity fluctuations, in both streamwise and radial directions, showed a notable increase in laminar inflows compared to turbulence inflows within this domain. Although the r.m.s plots are not presented, for brevity, it is important to note that TKE was a function of the r.m.s of the velocity fluctuations in both the streamwise and the radial directions.

 ,
, 


