
Experimental Evaluation of Fatigue Strength of AlSi10Mg Lattice Structures Fabricated by AM


Abstract
:1. Introduction
2. Materials and Methods
2.1. Design of Experiment (DOE)
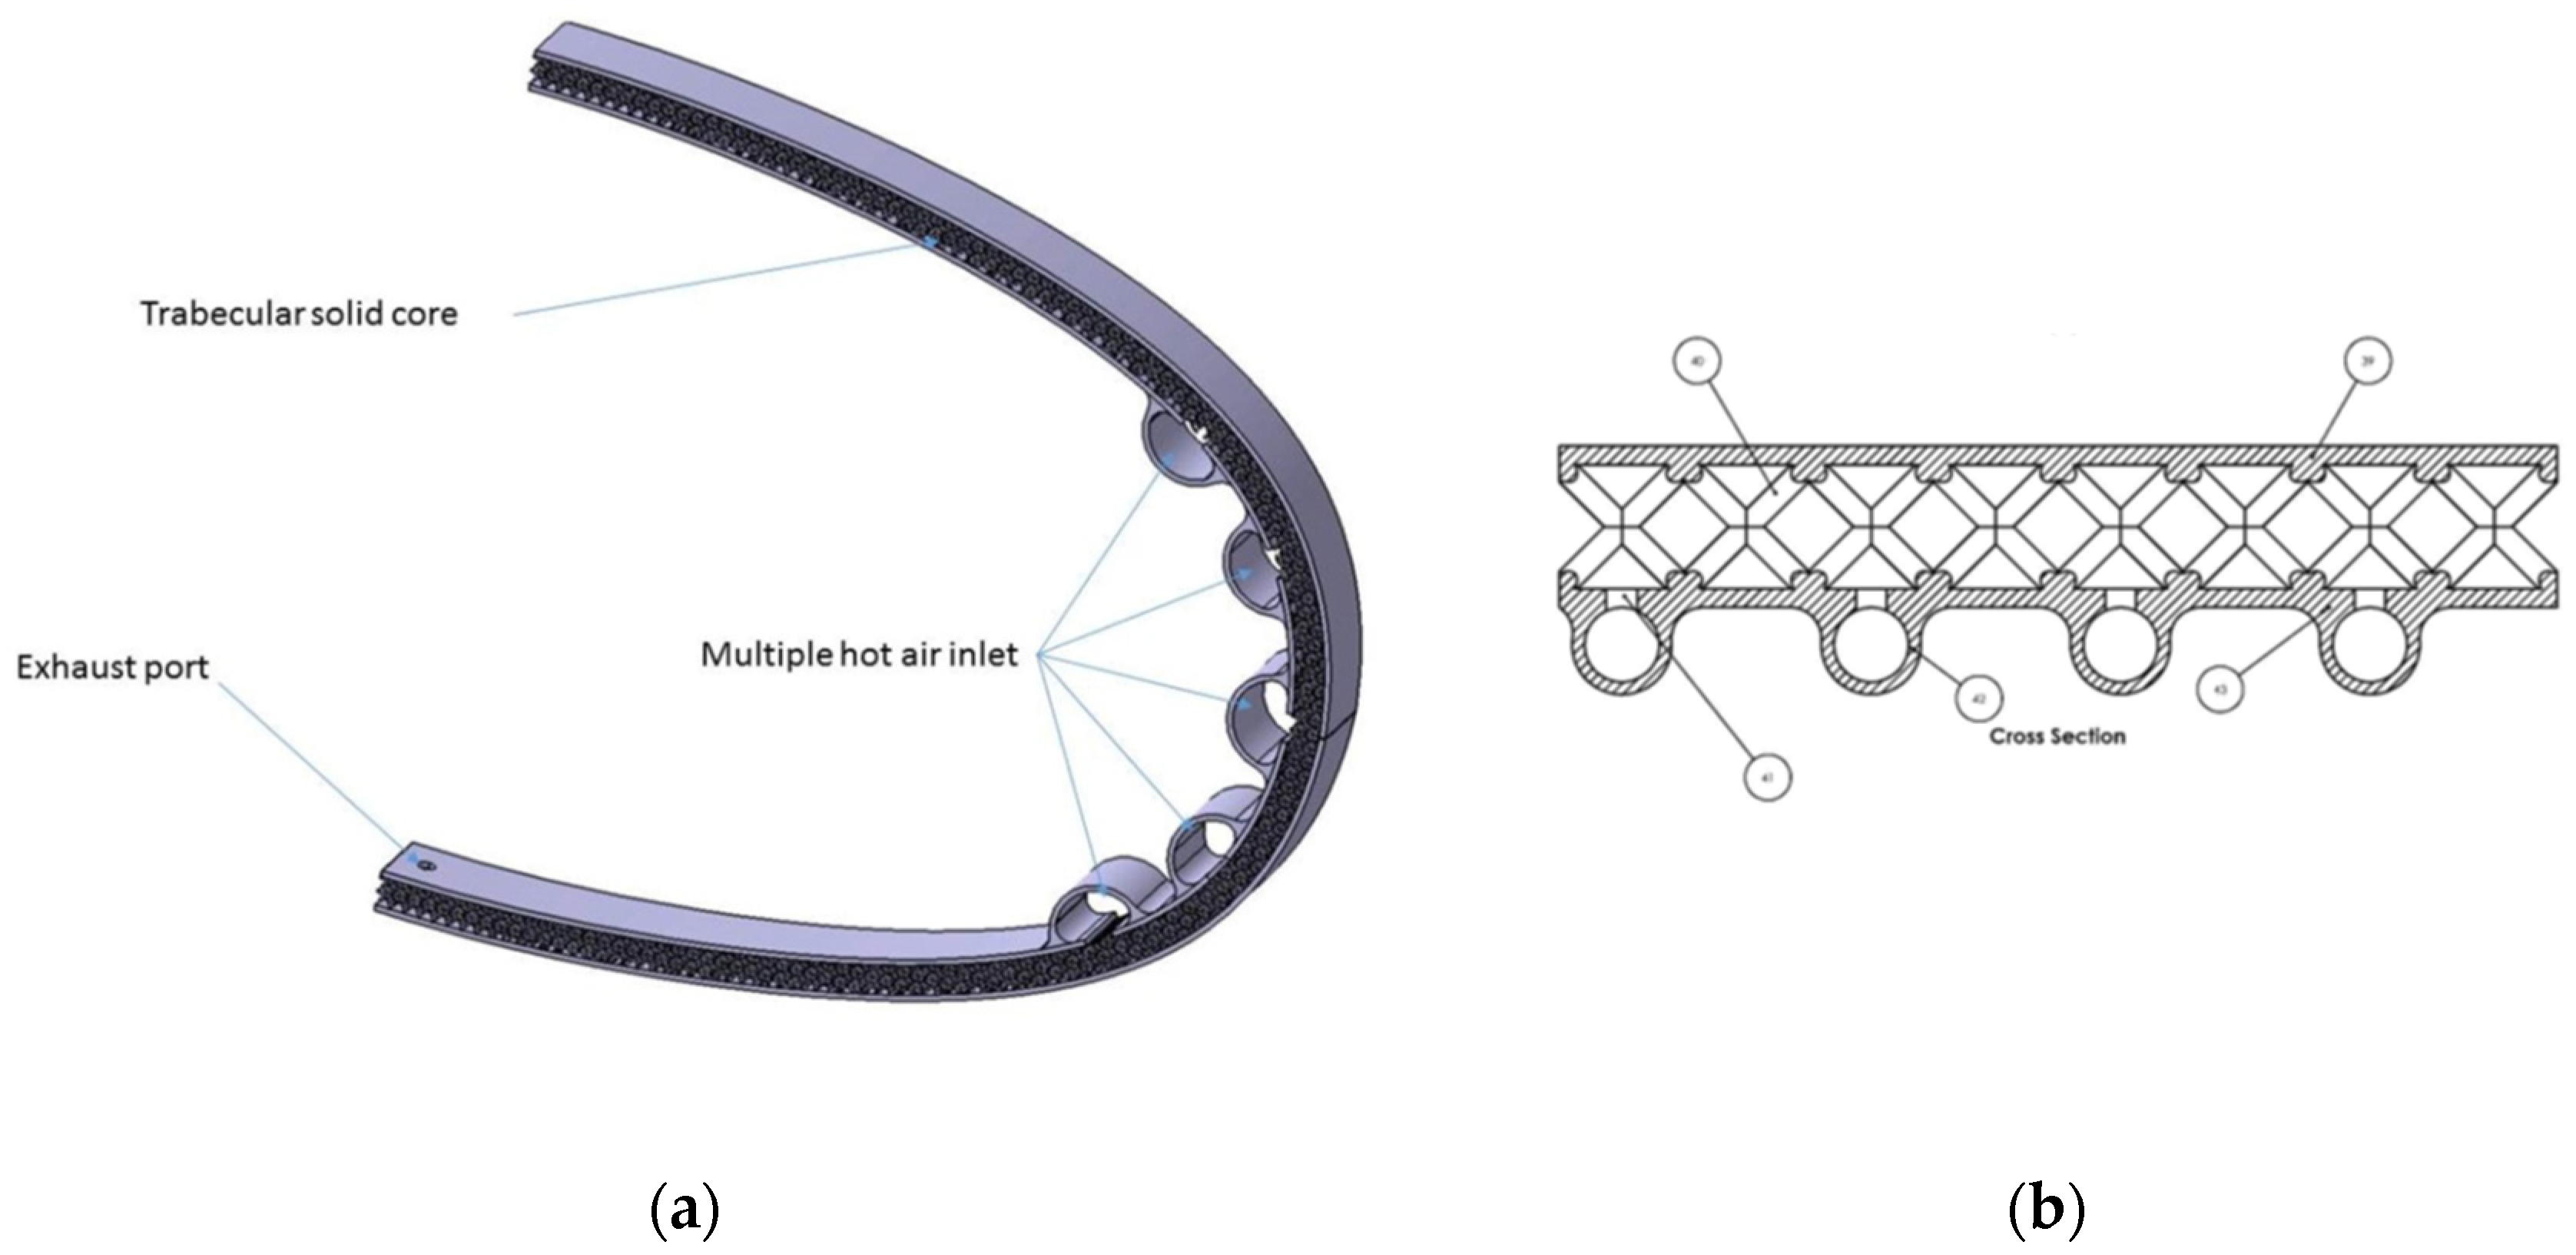
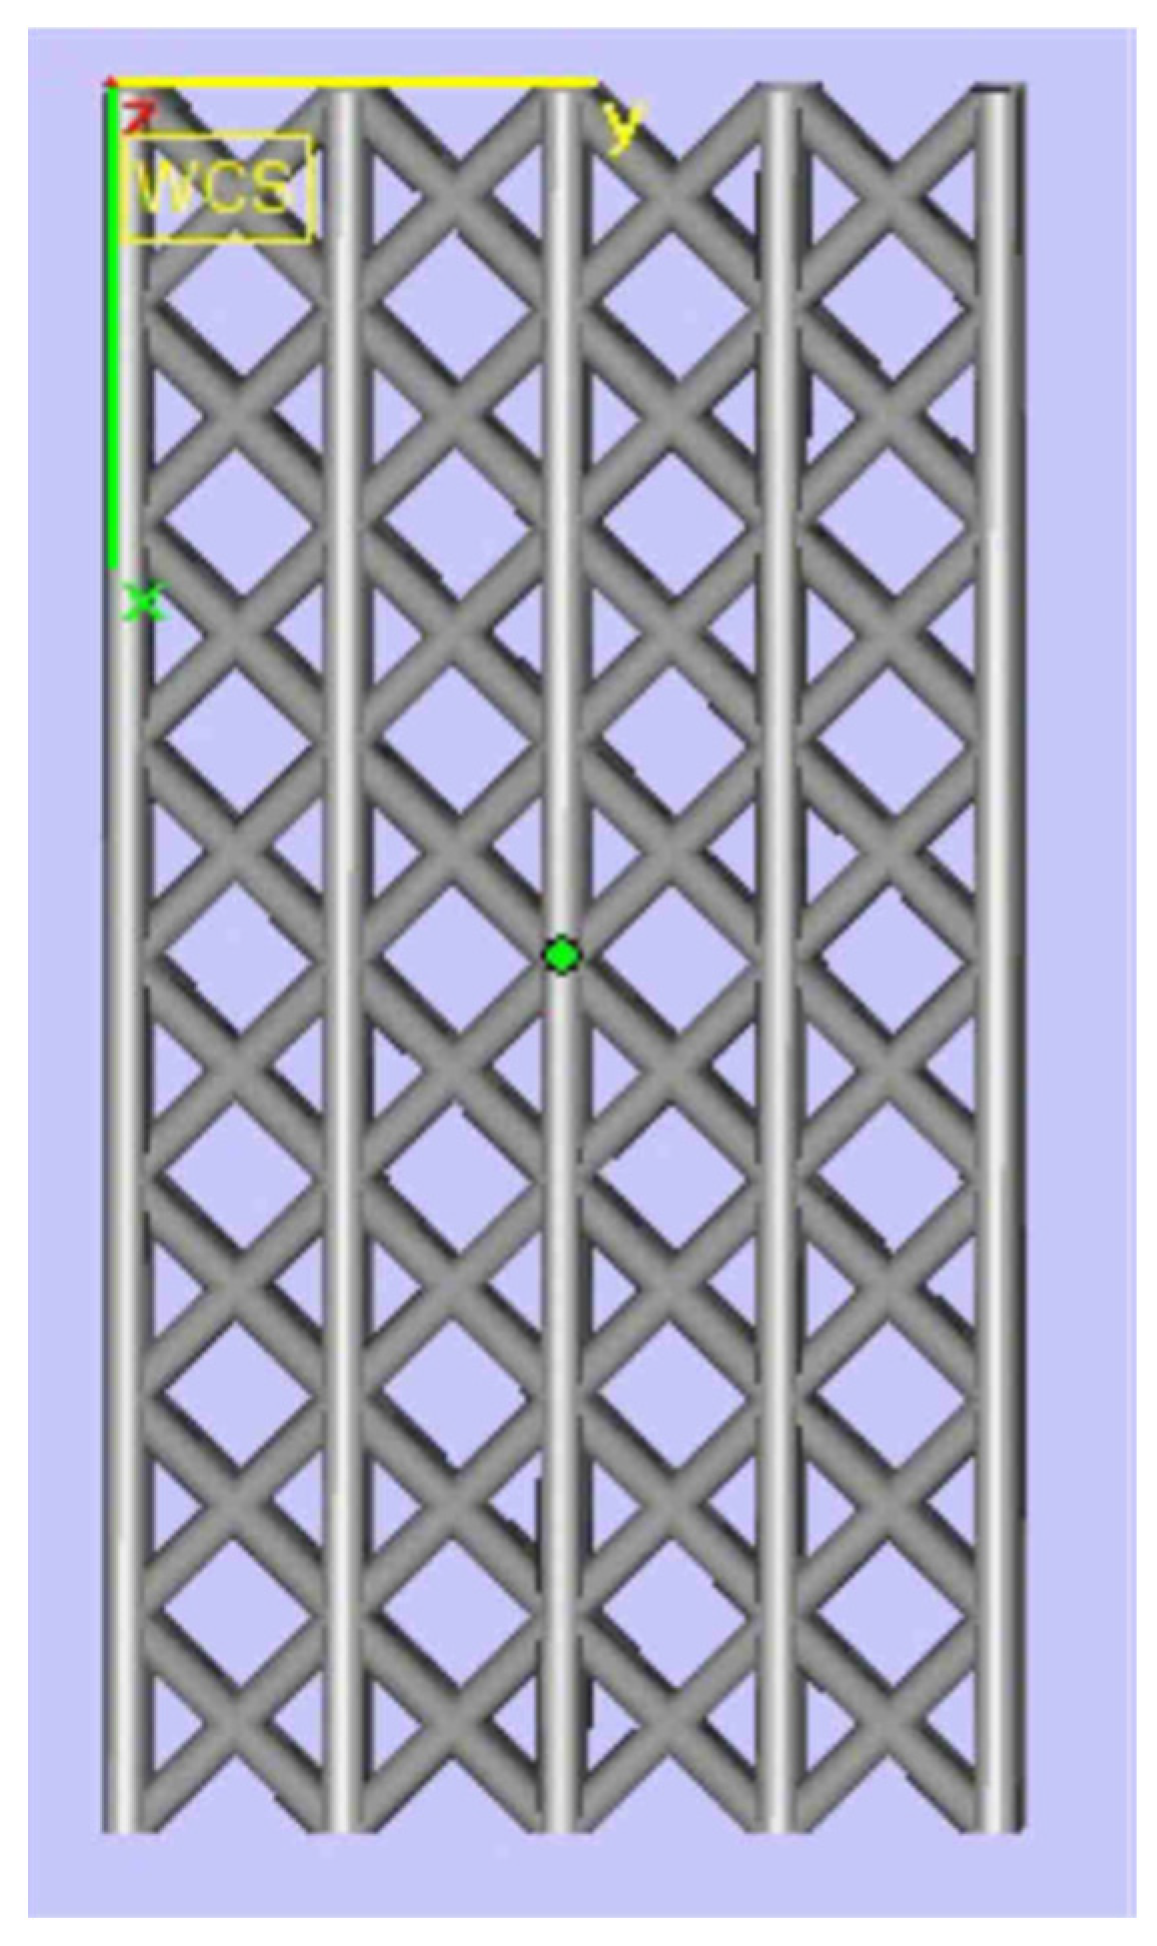
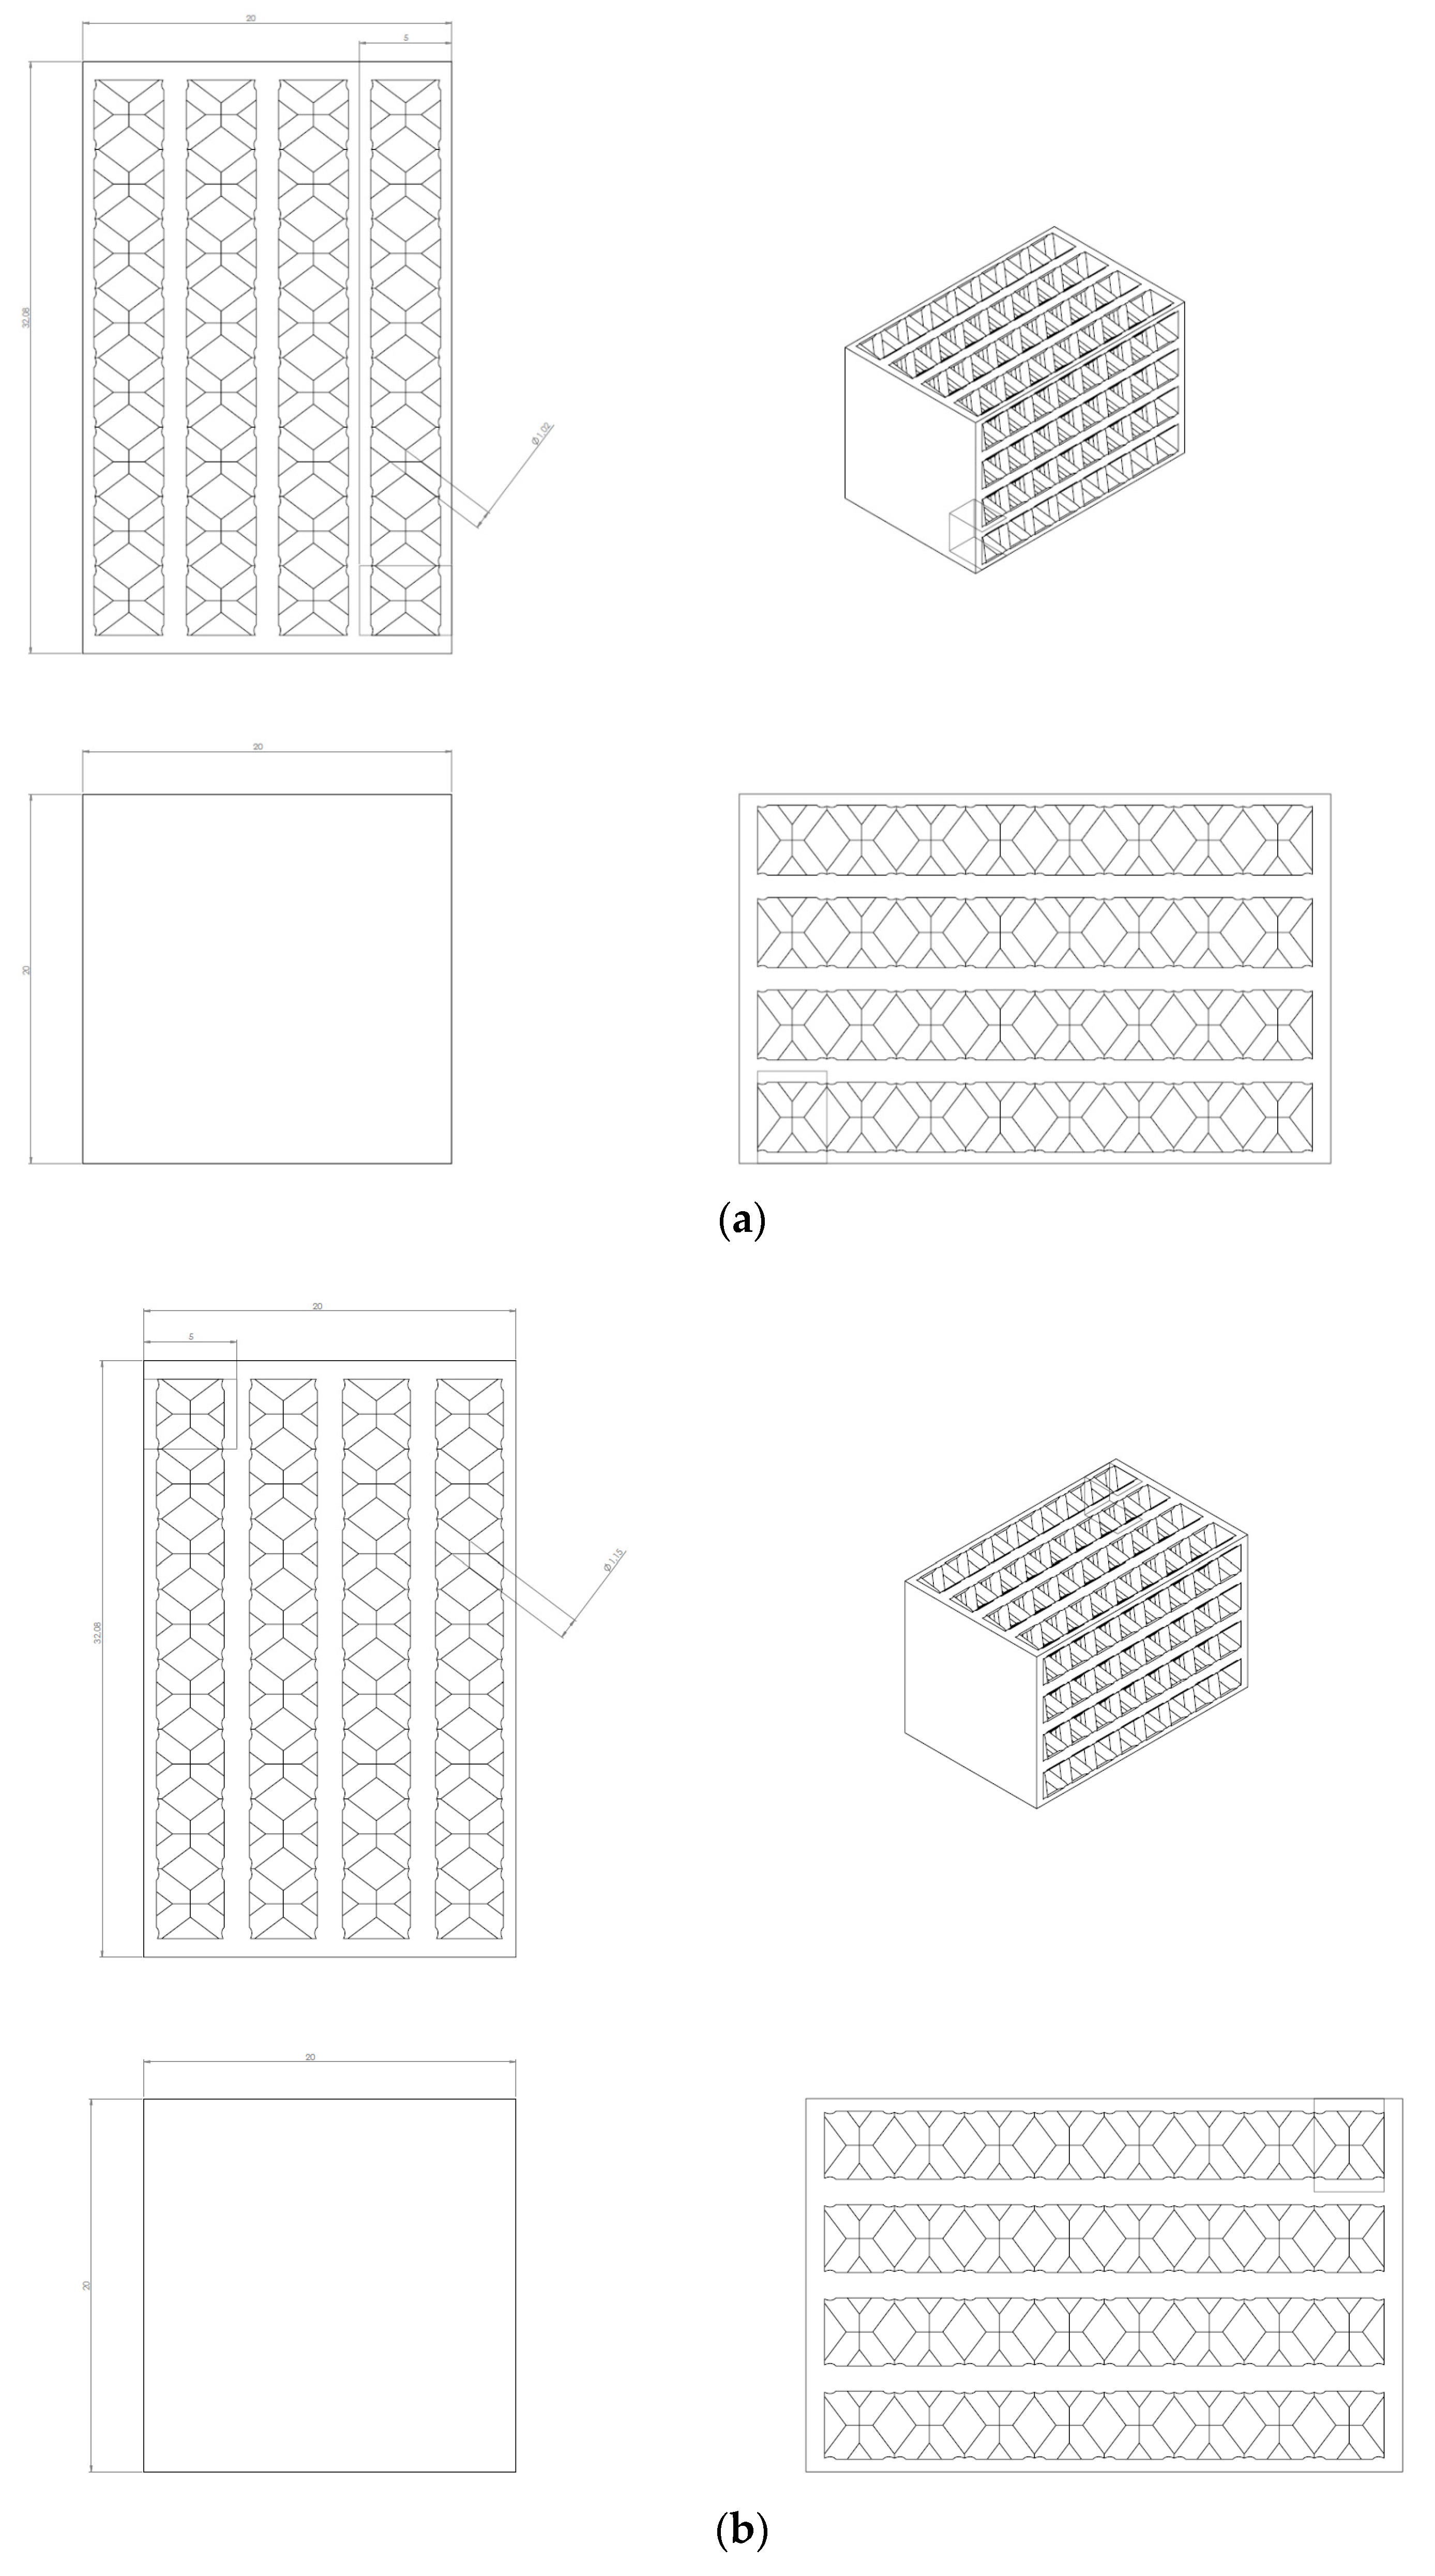
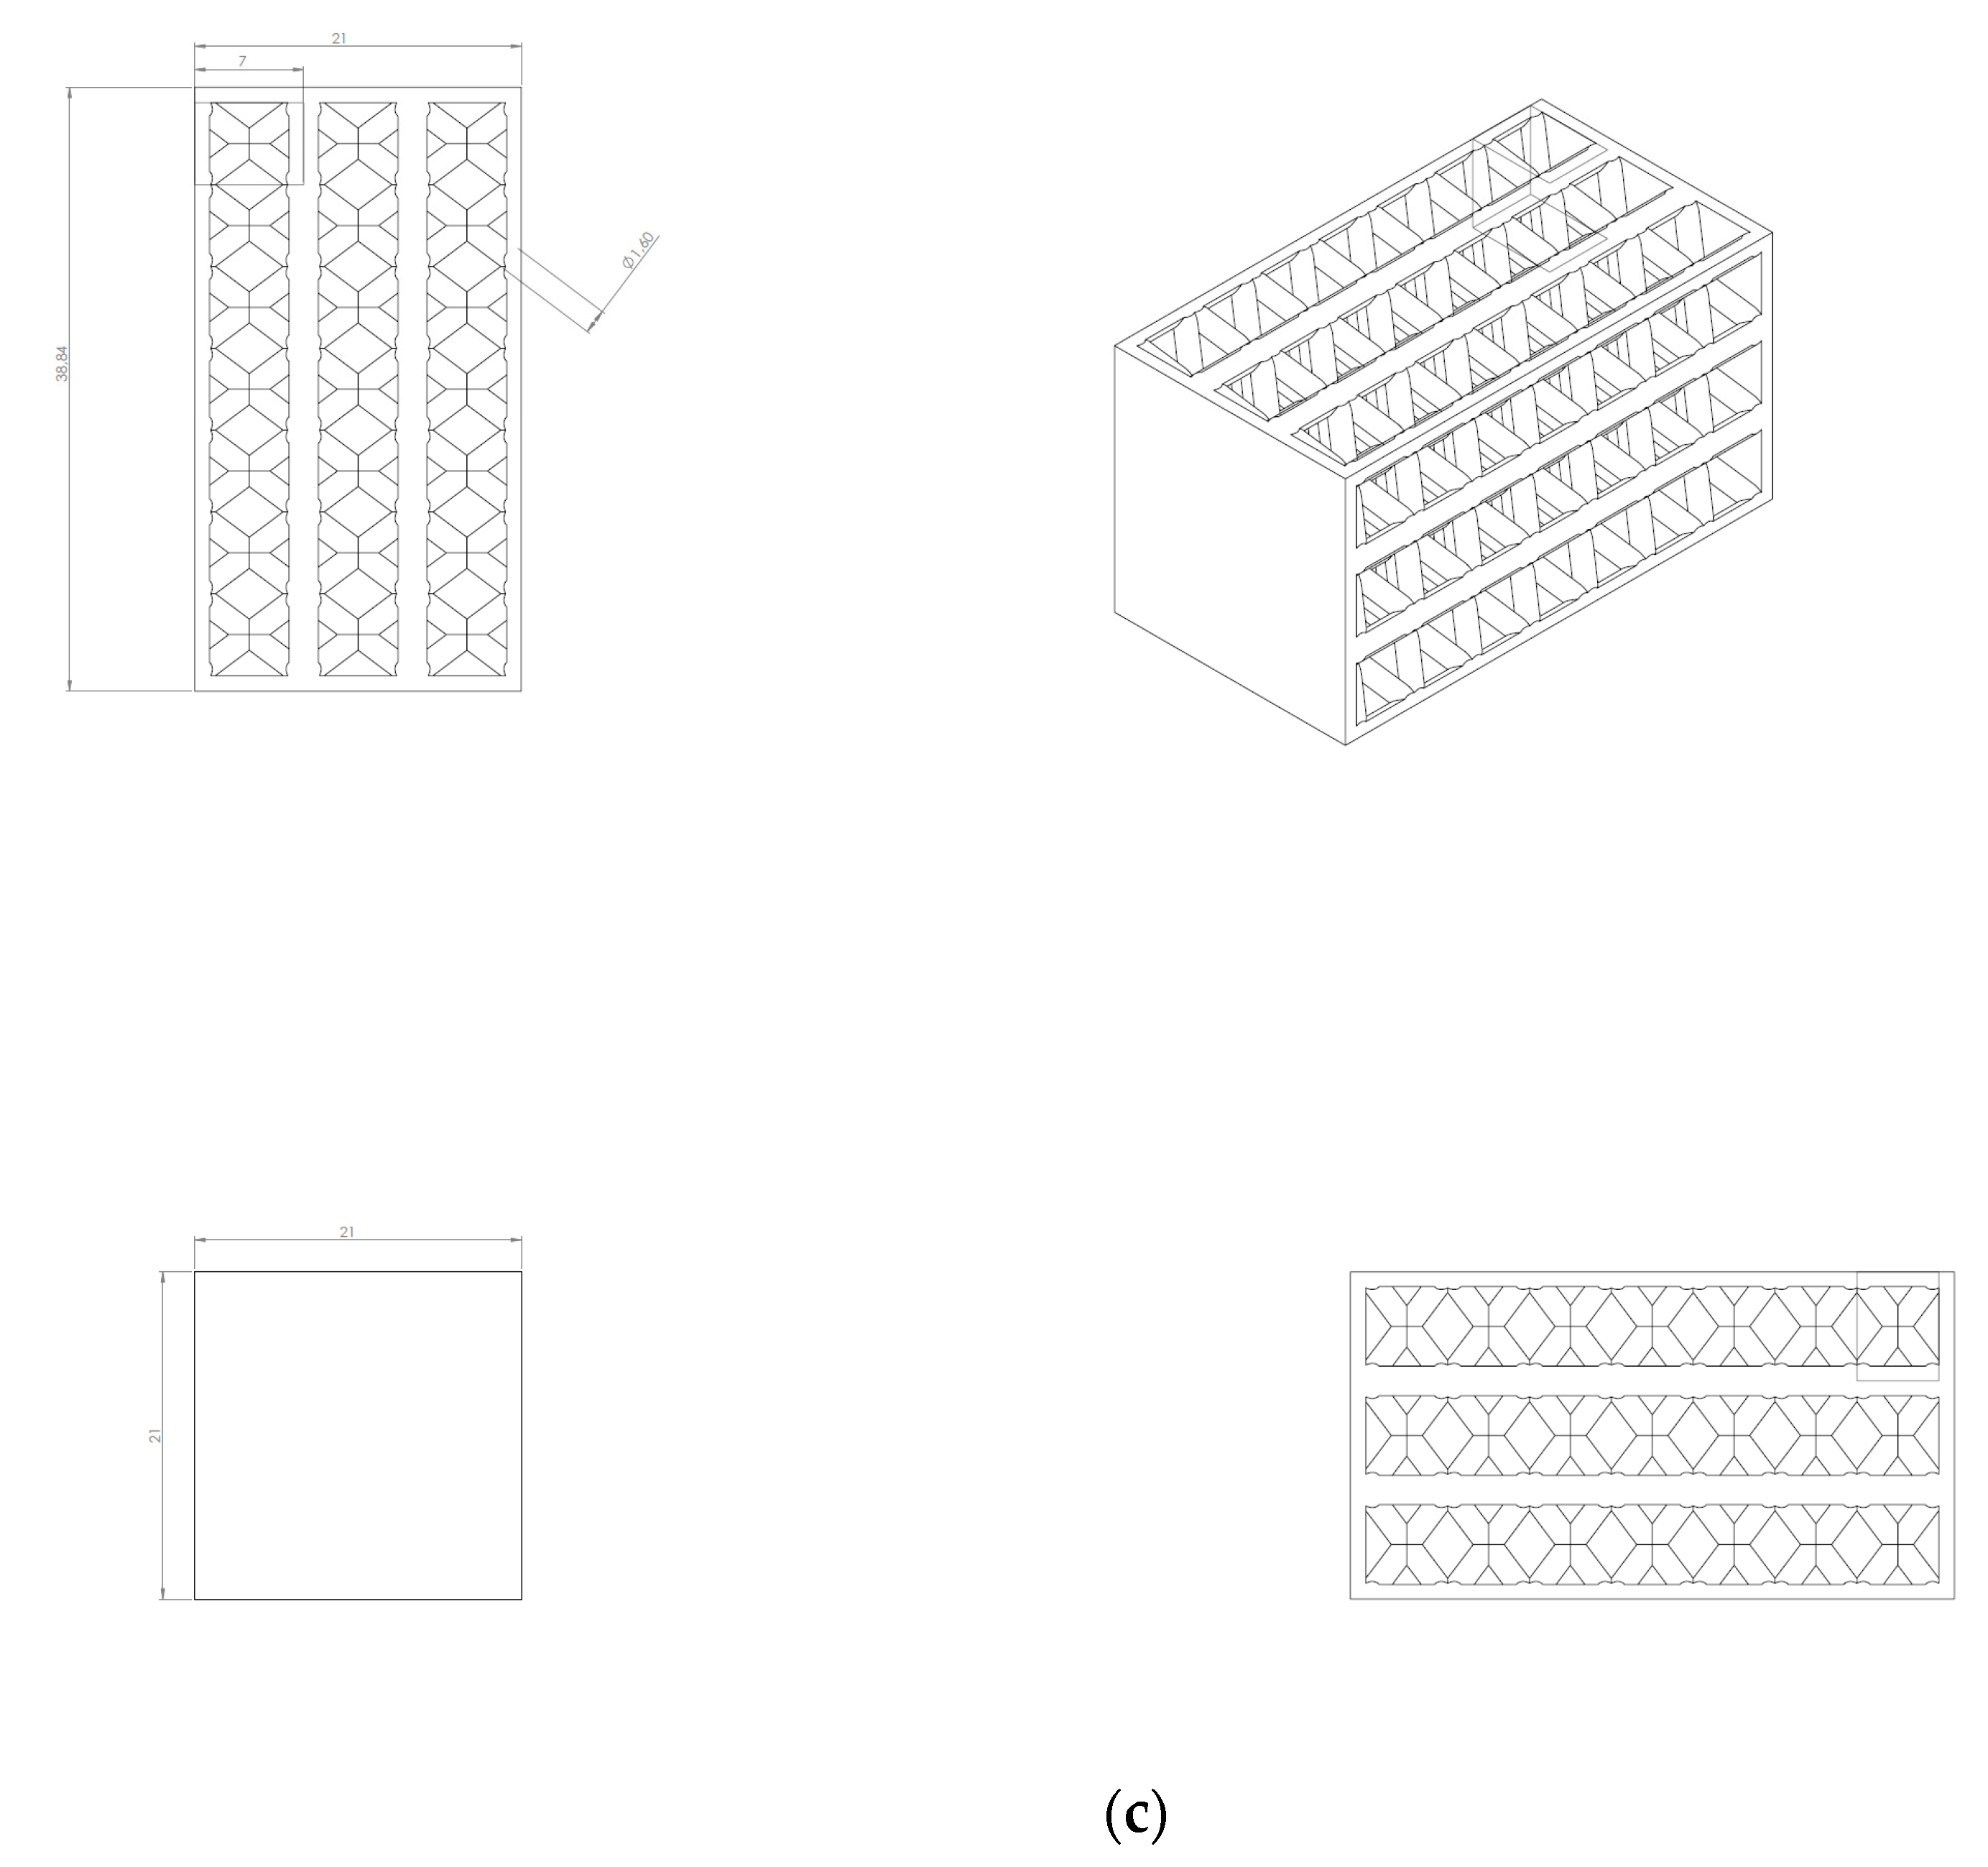
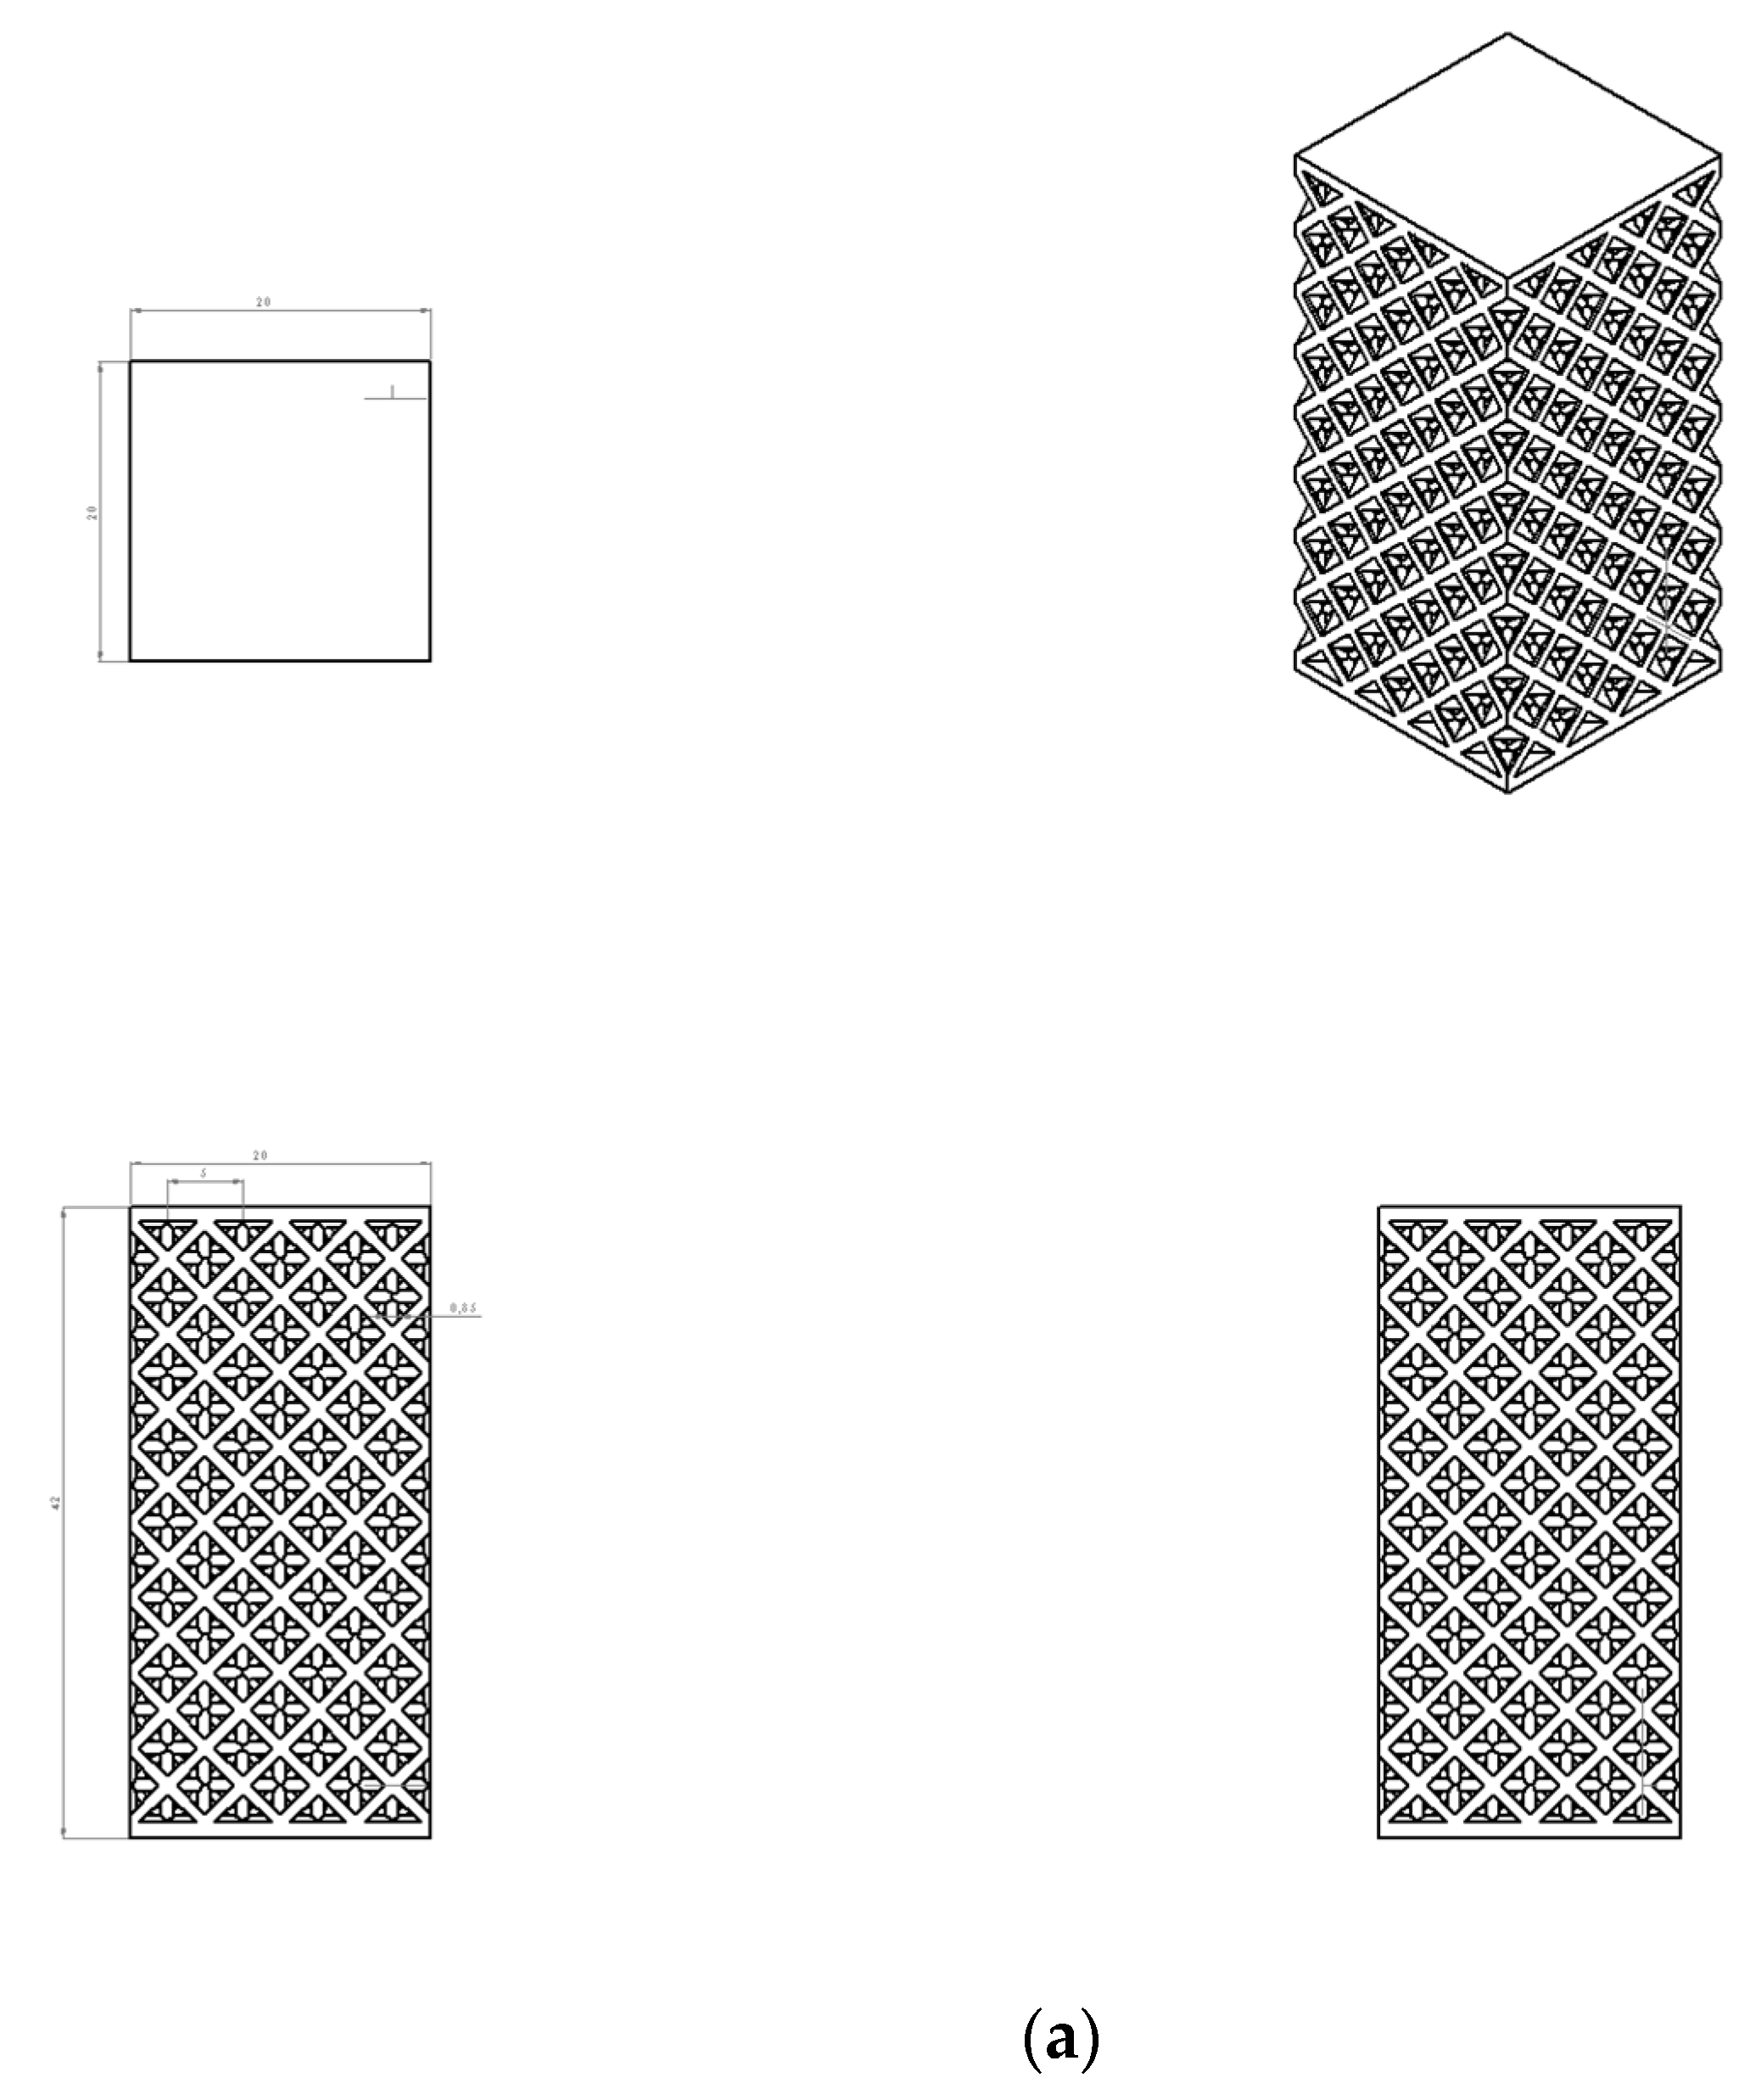
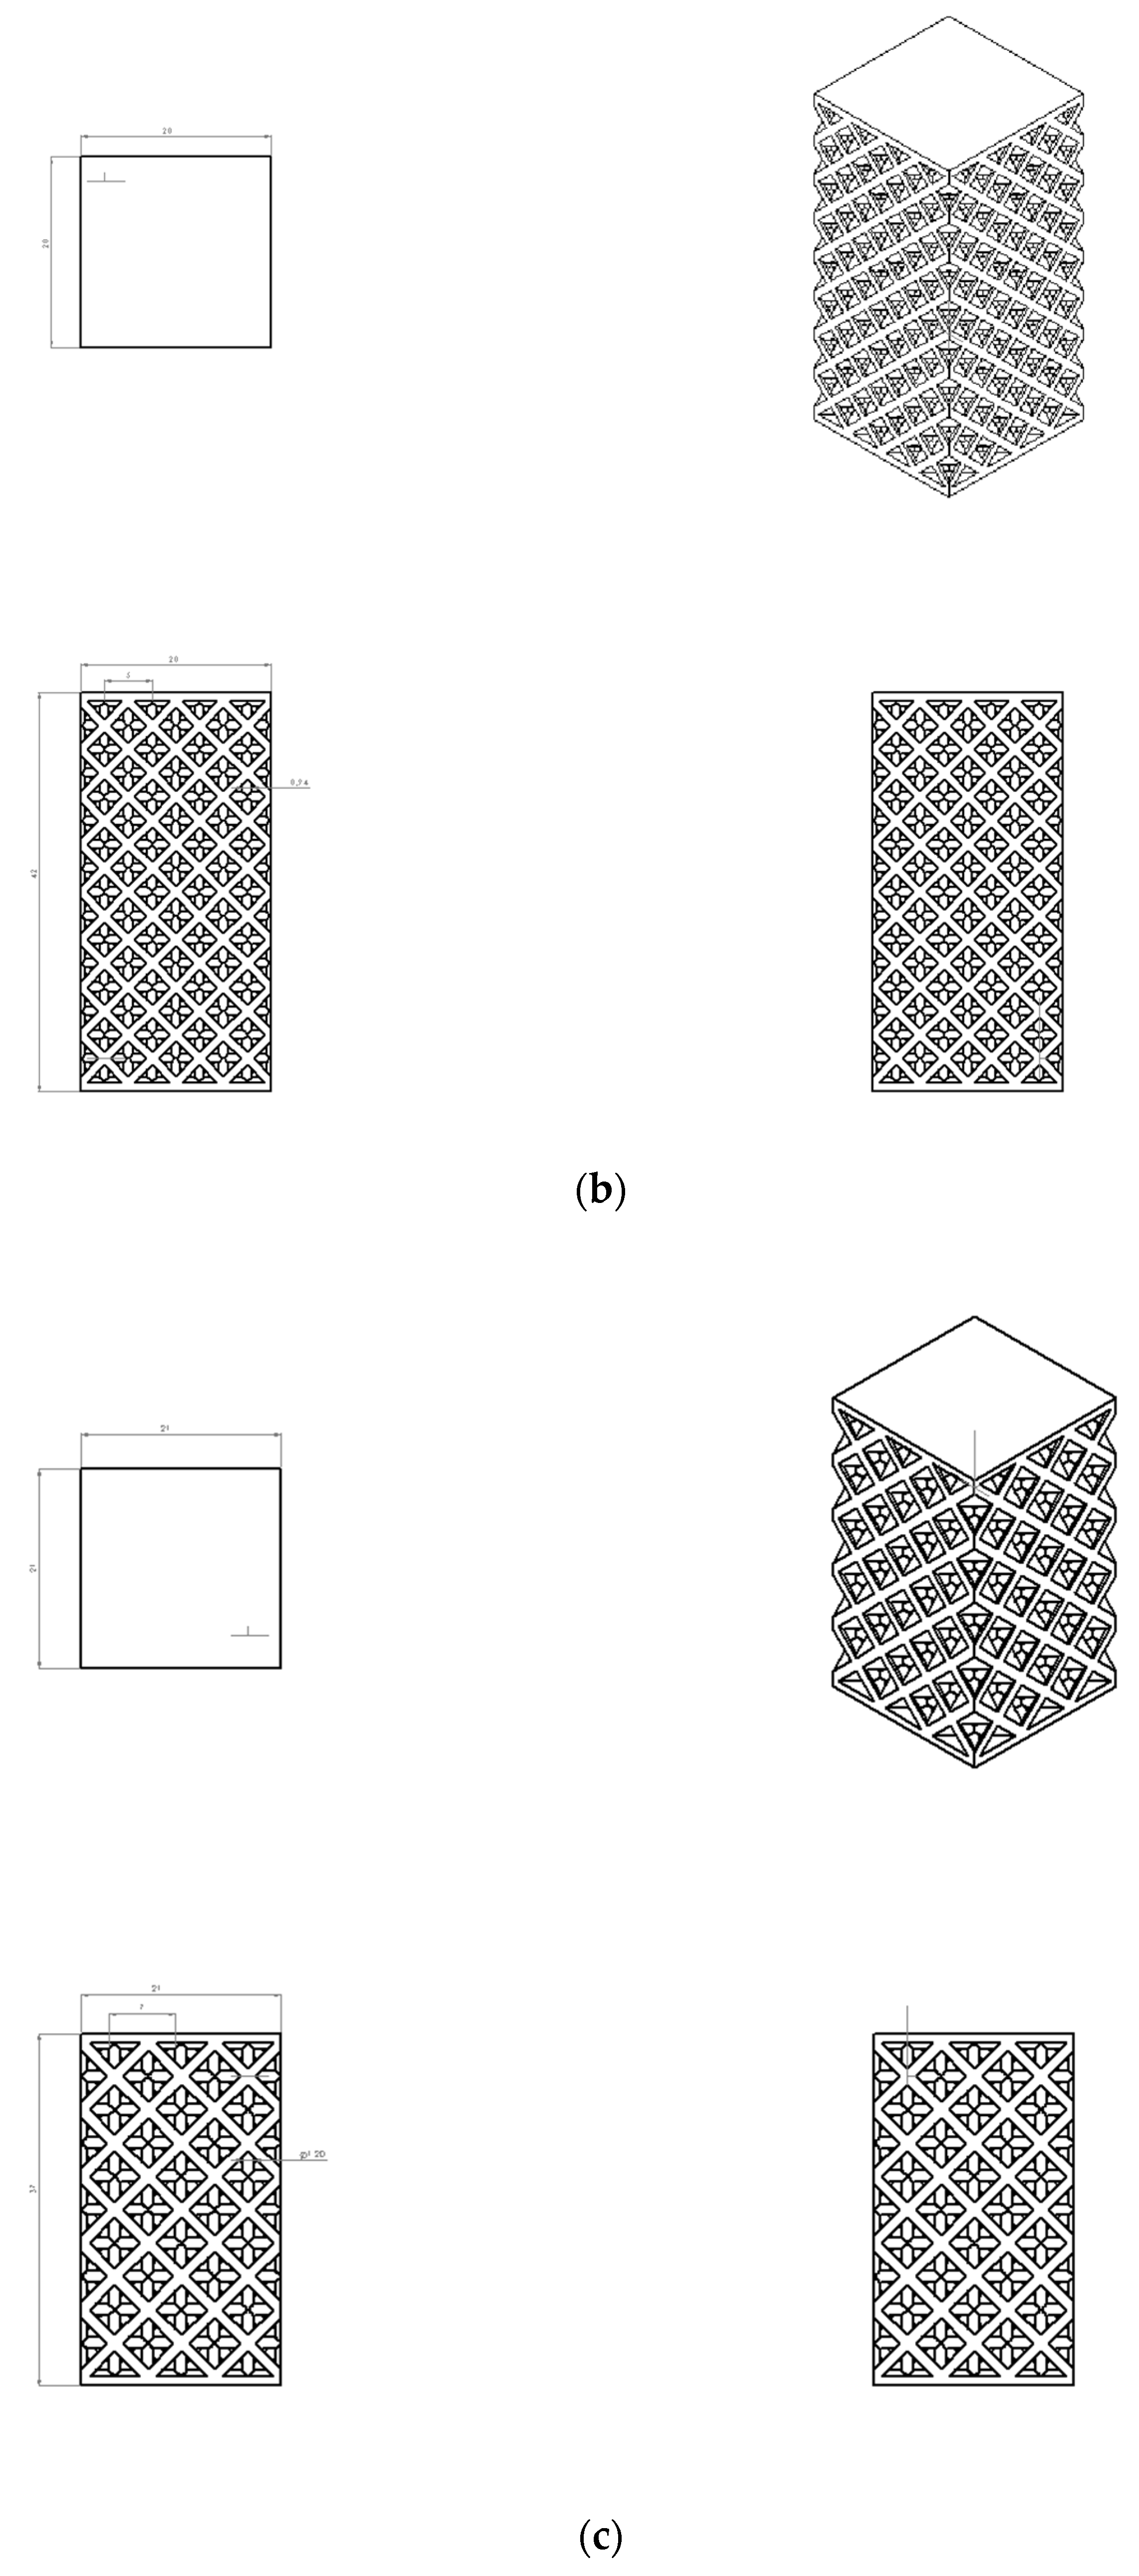
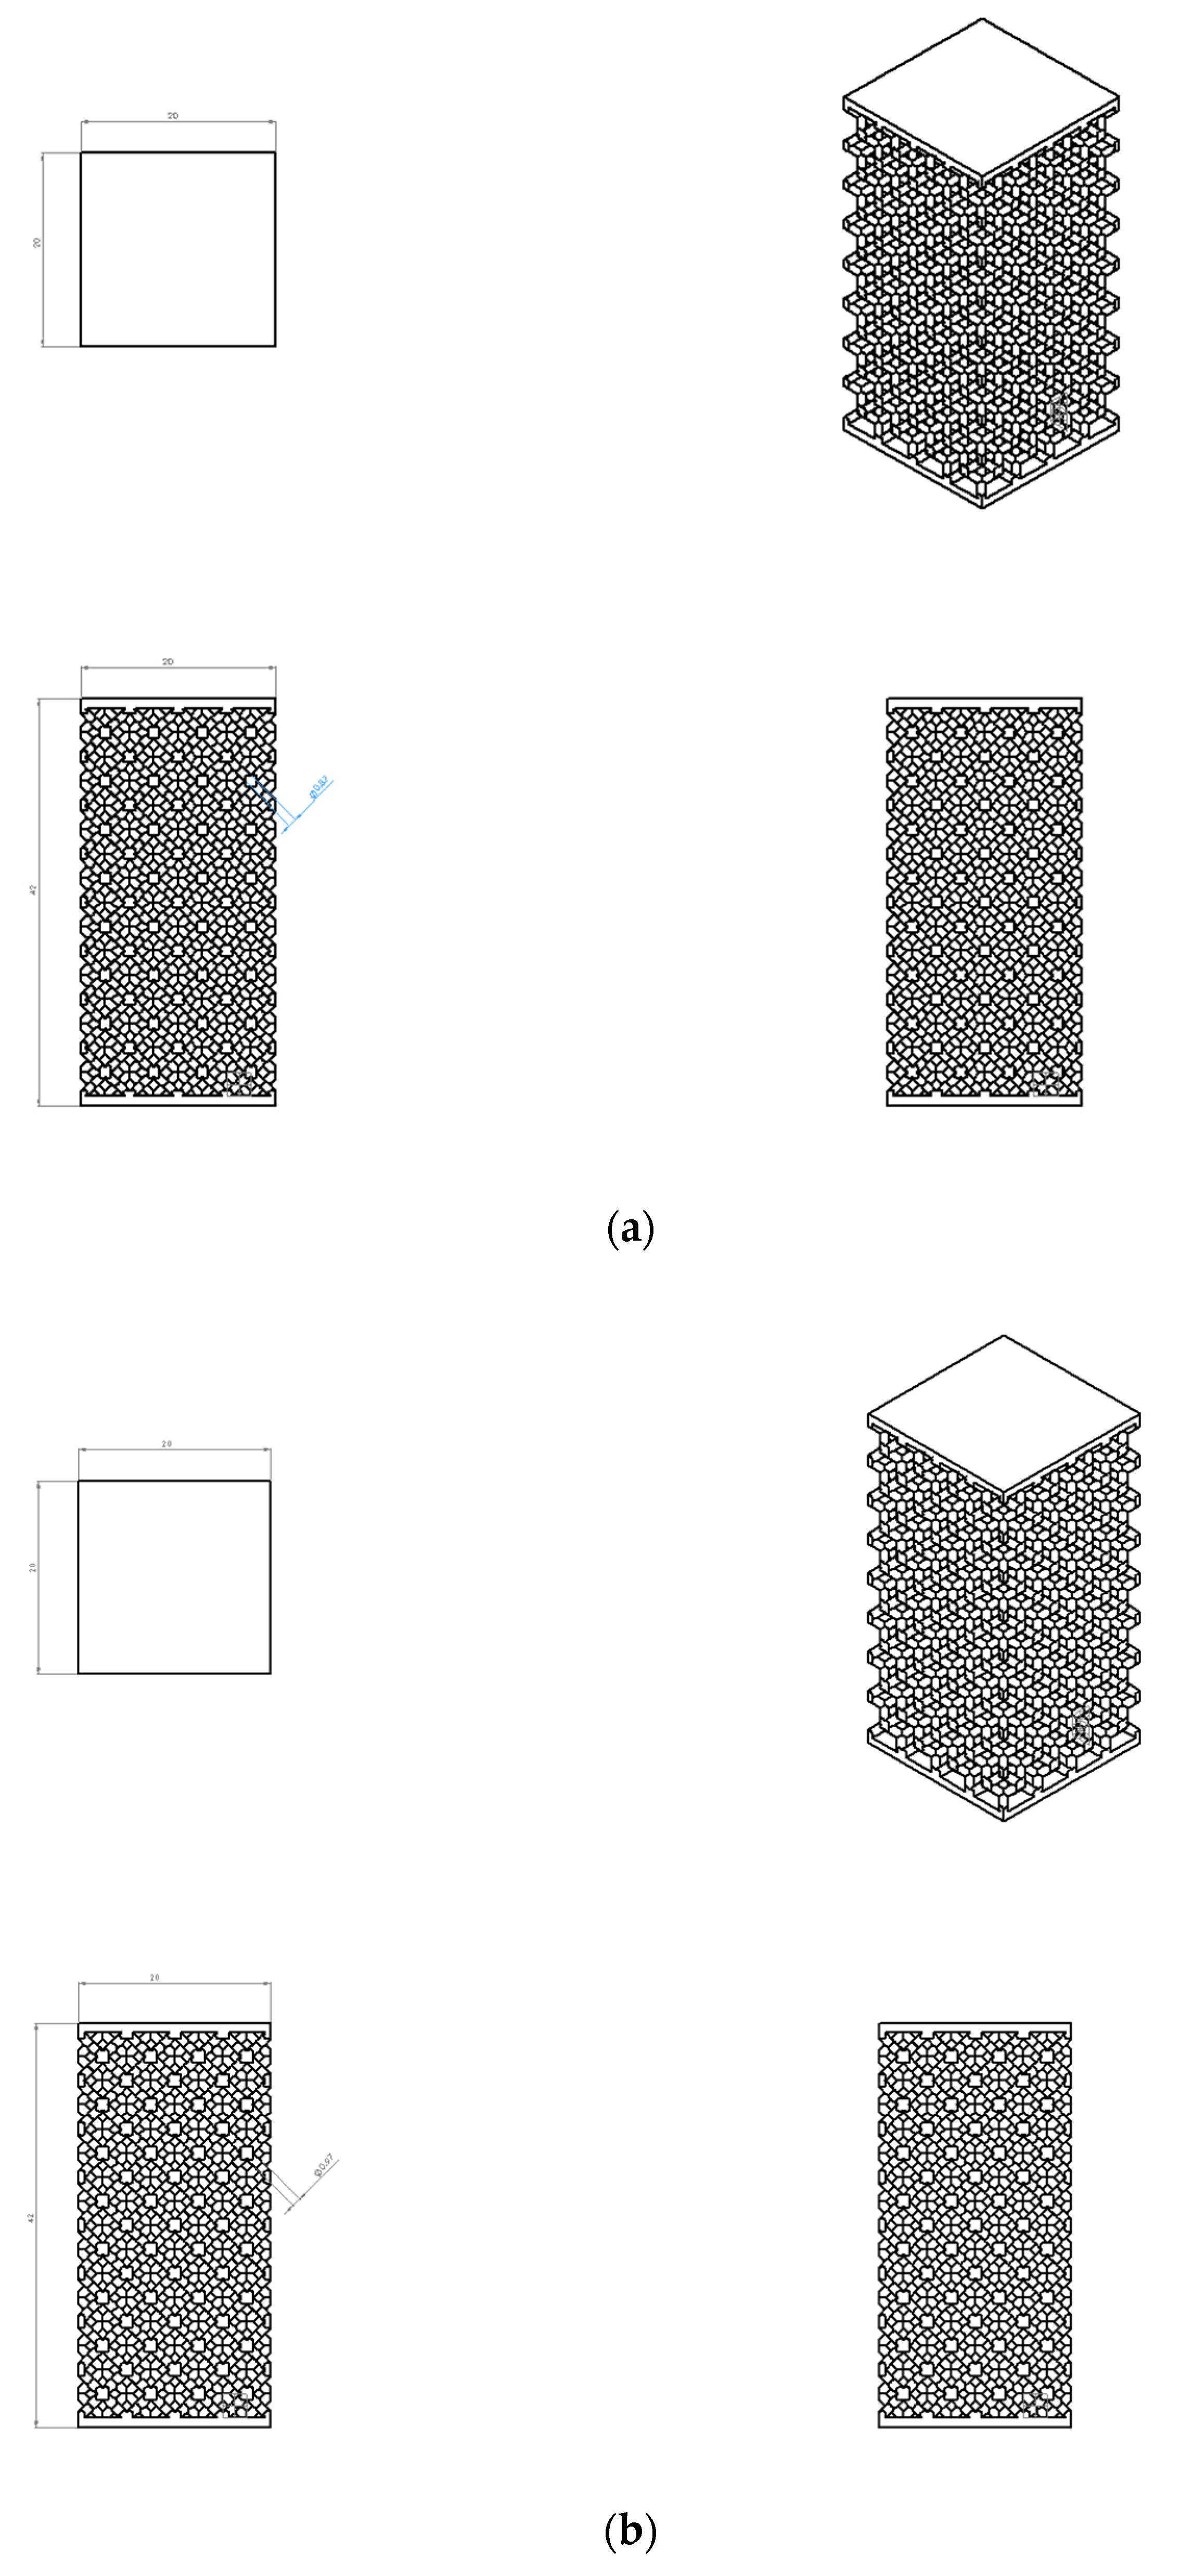
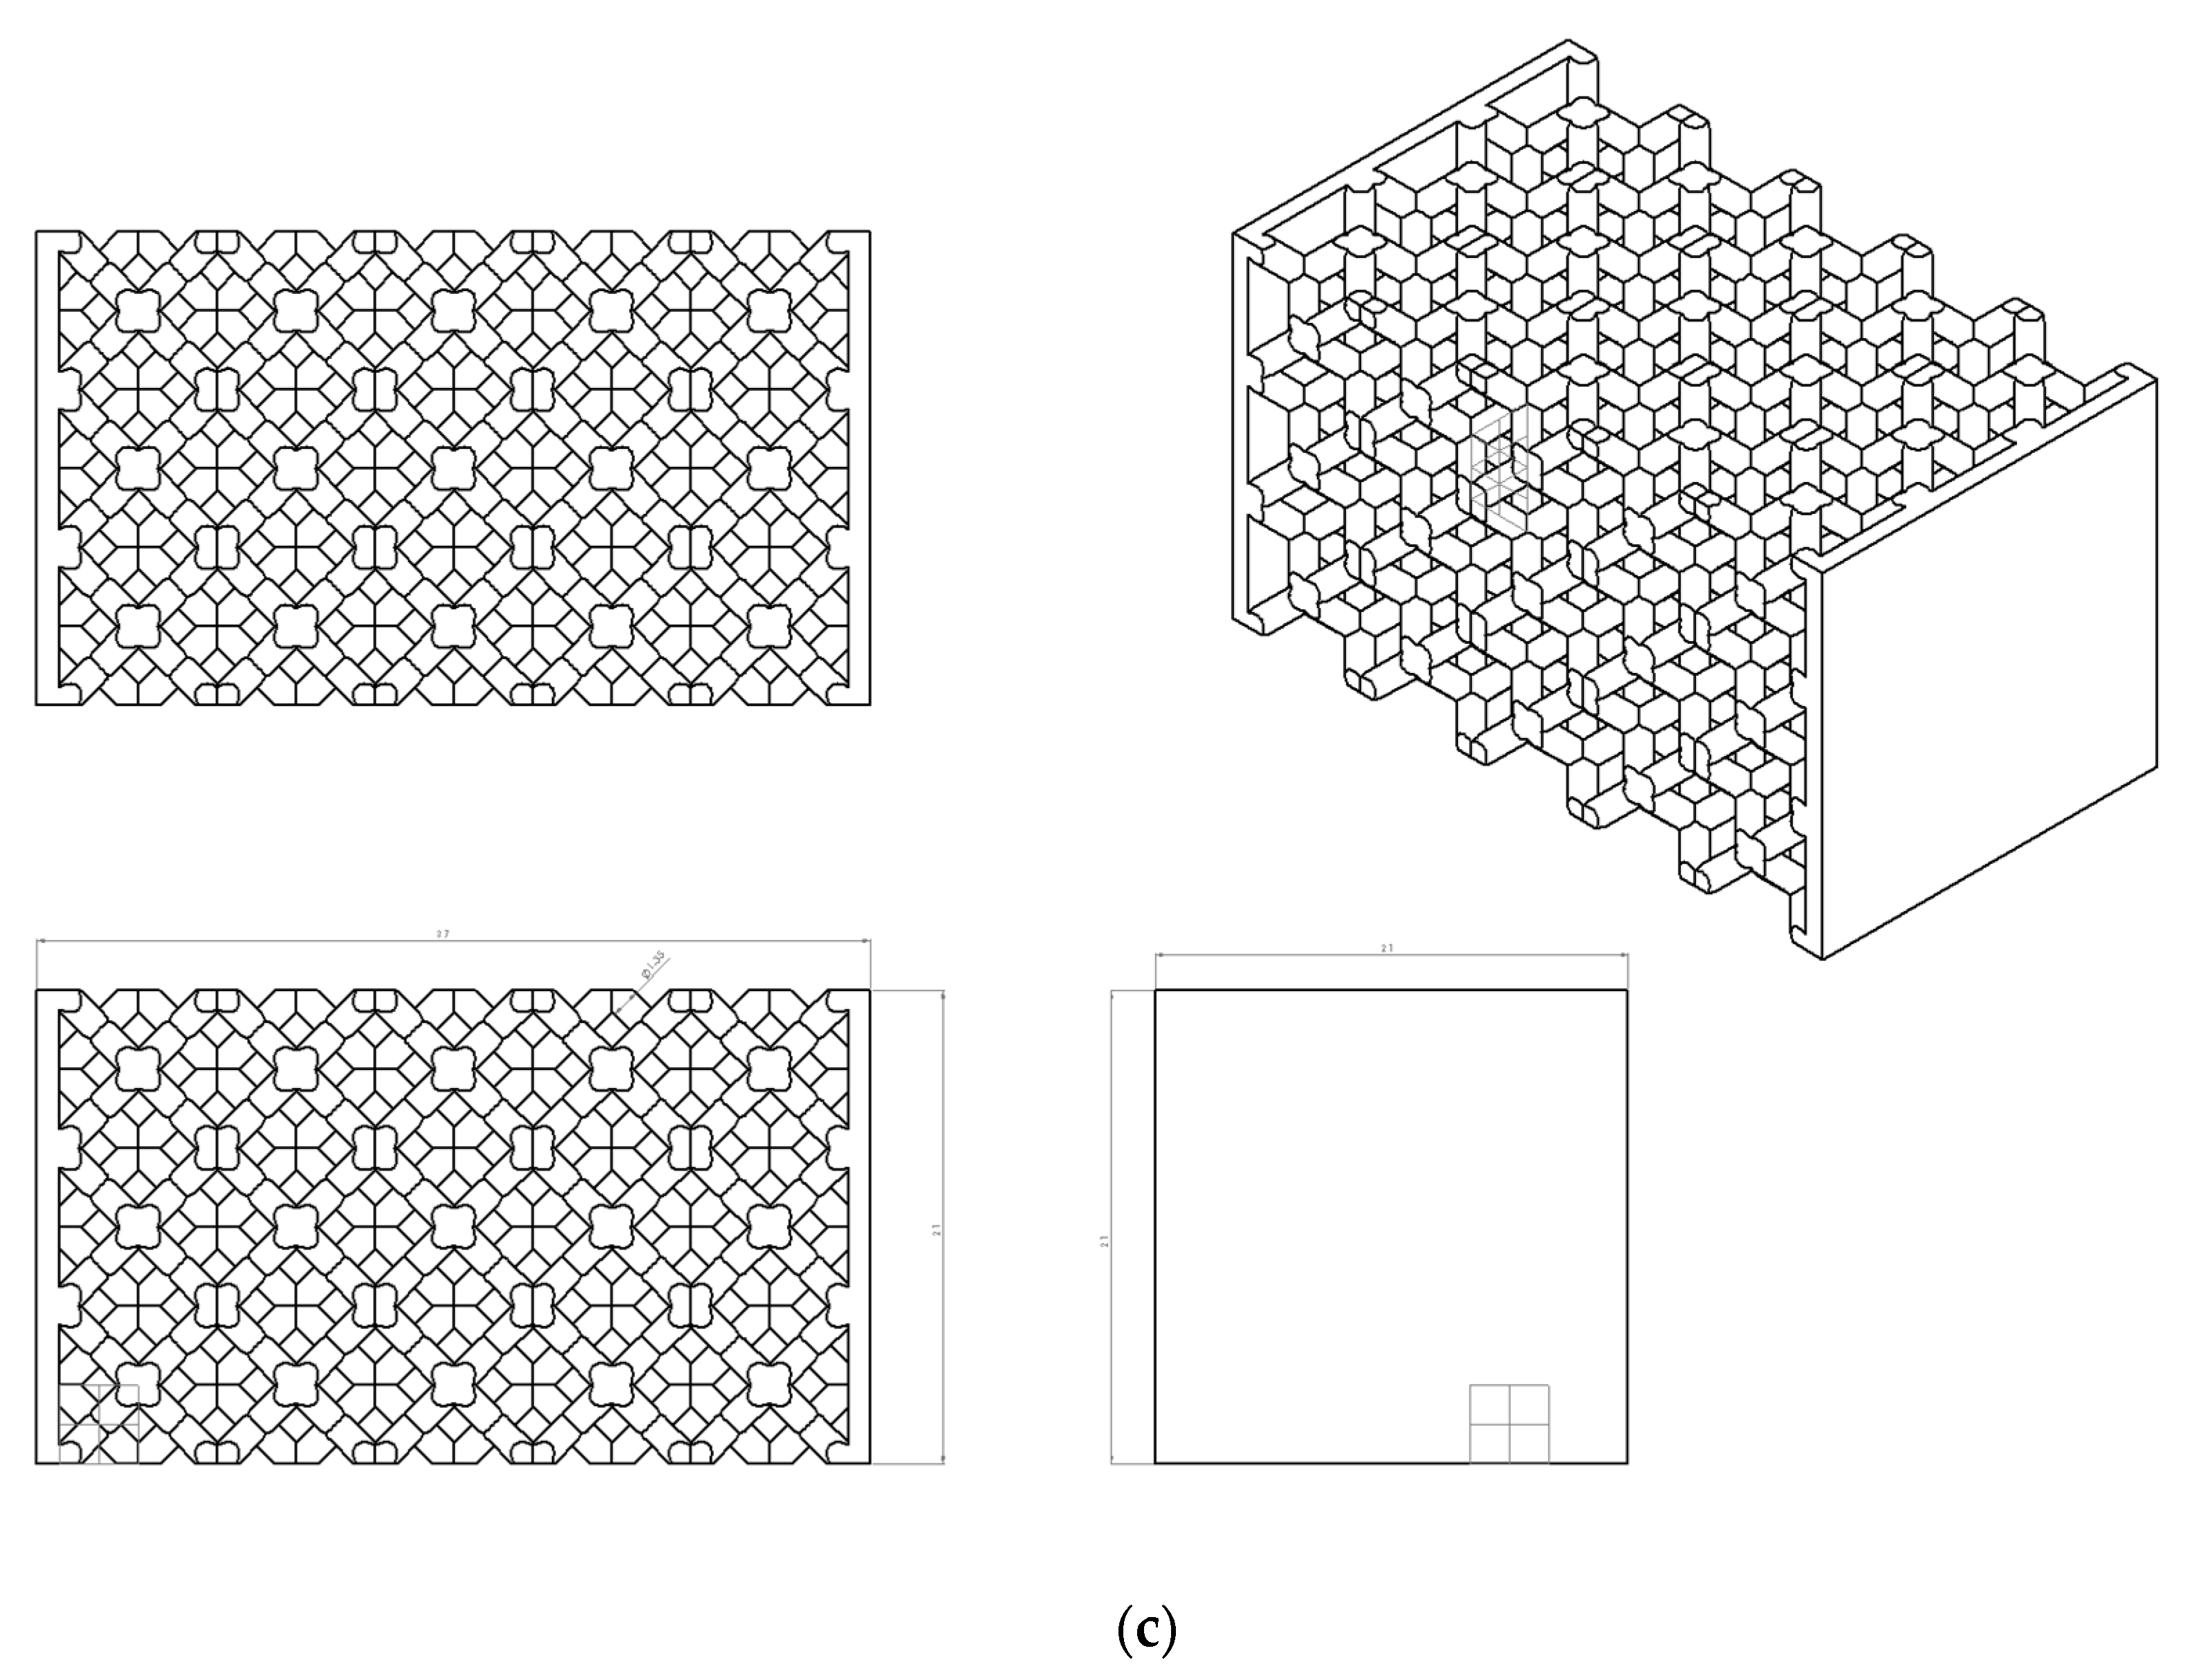
2.2. Specimen Design
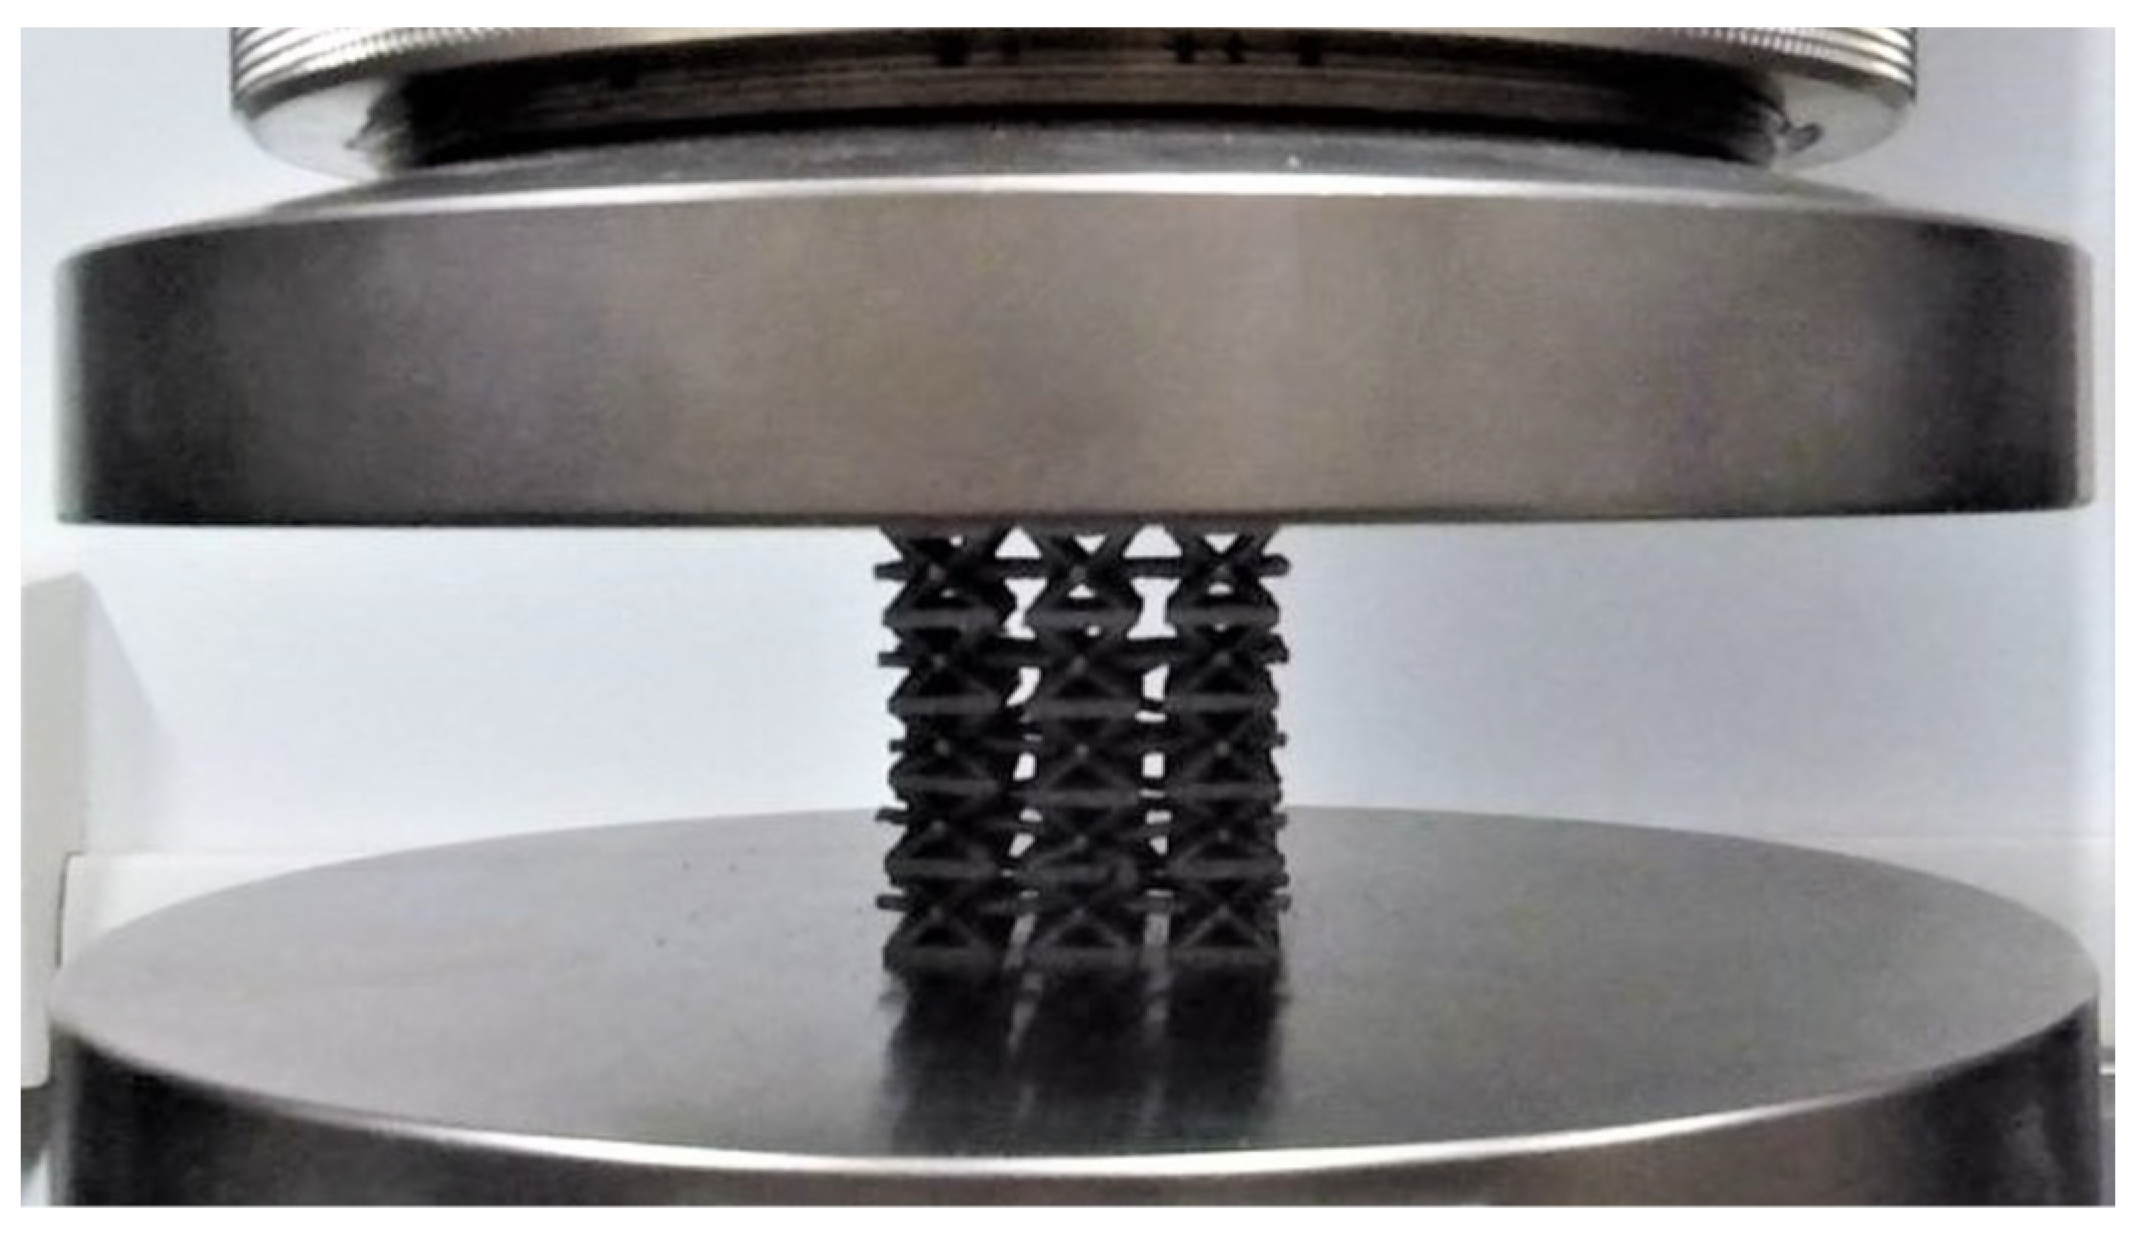
2.3. Fatigue Test Setup
3. Results
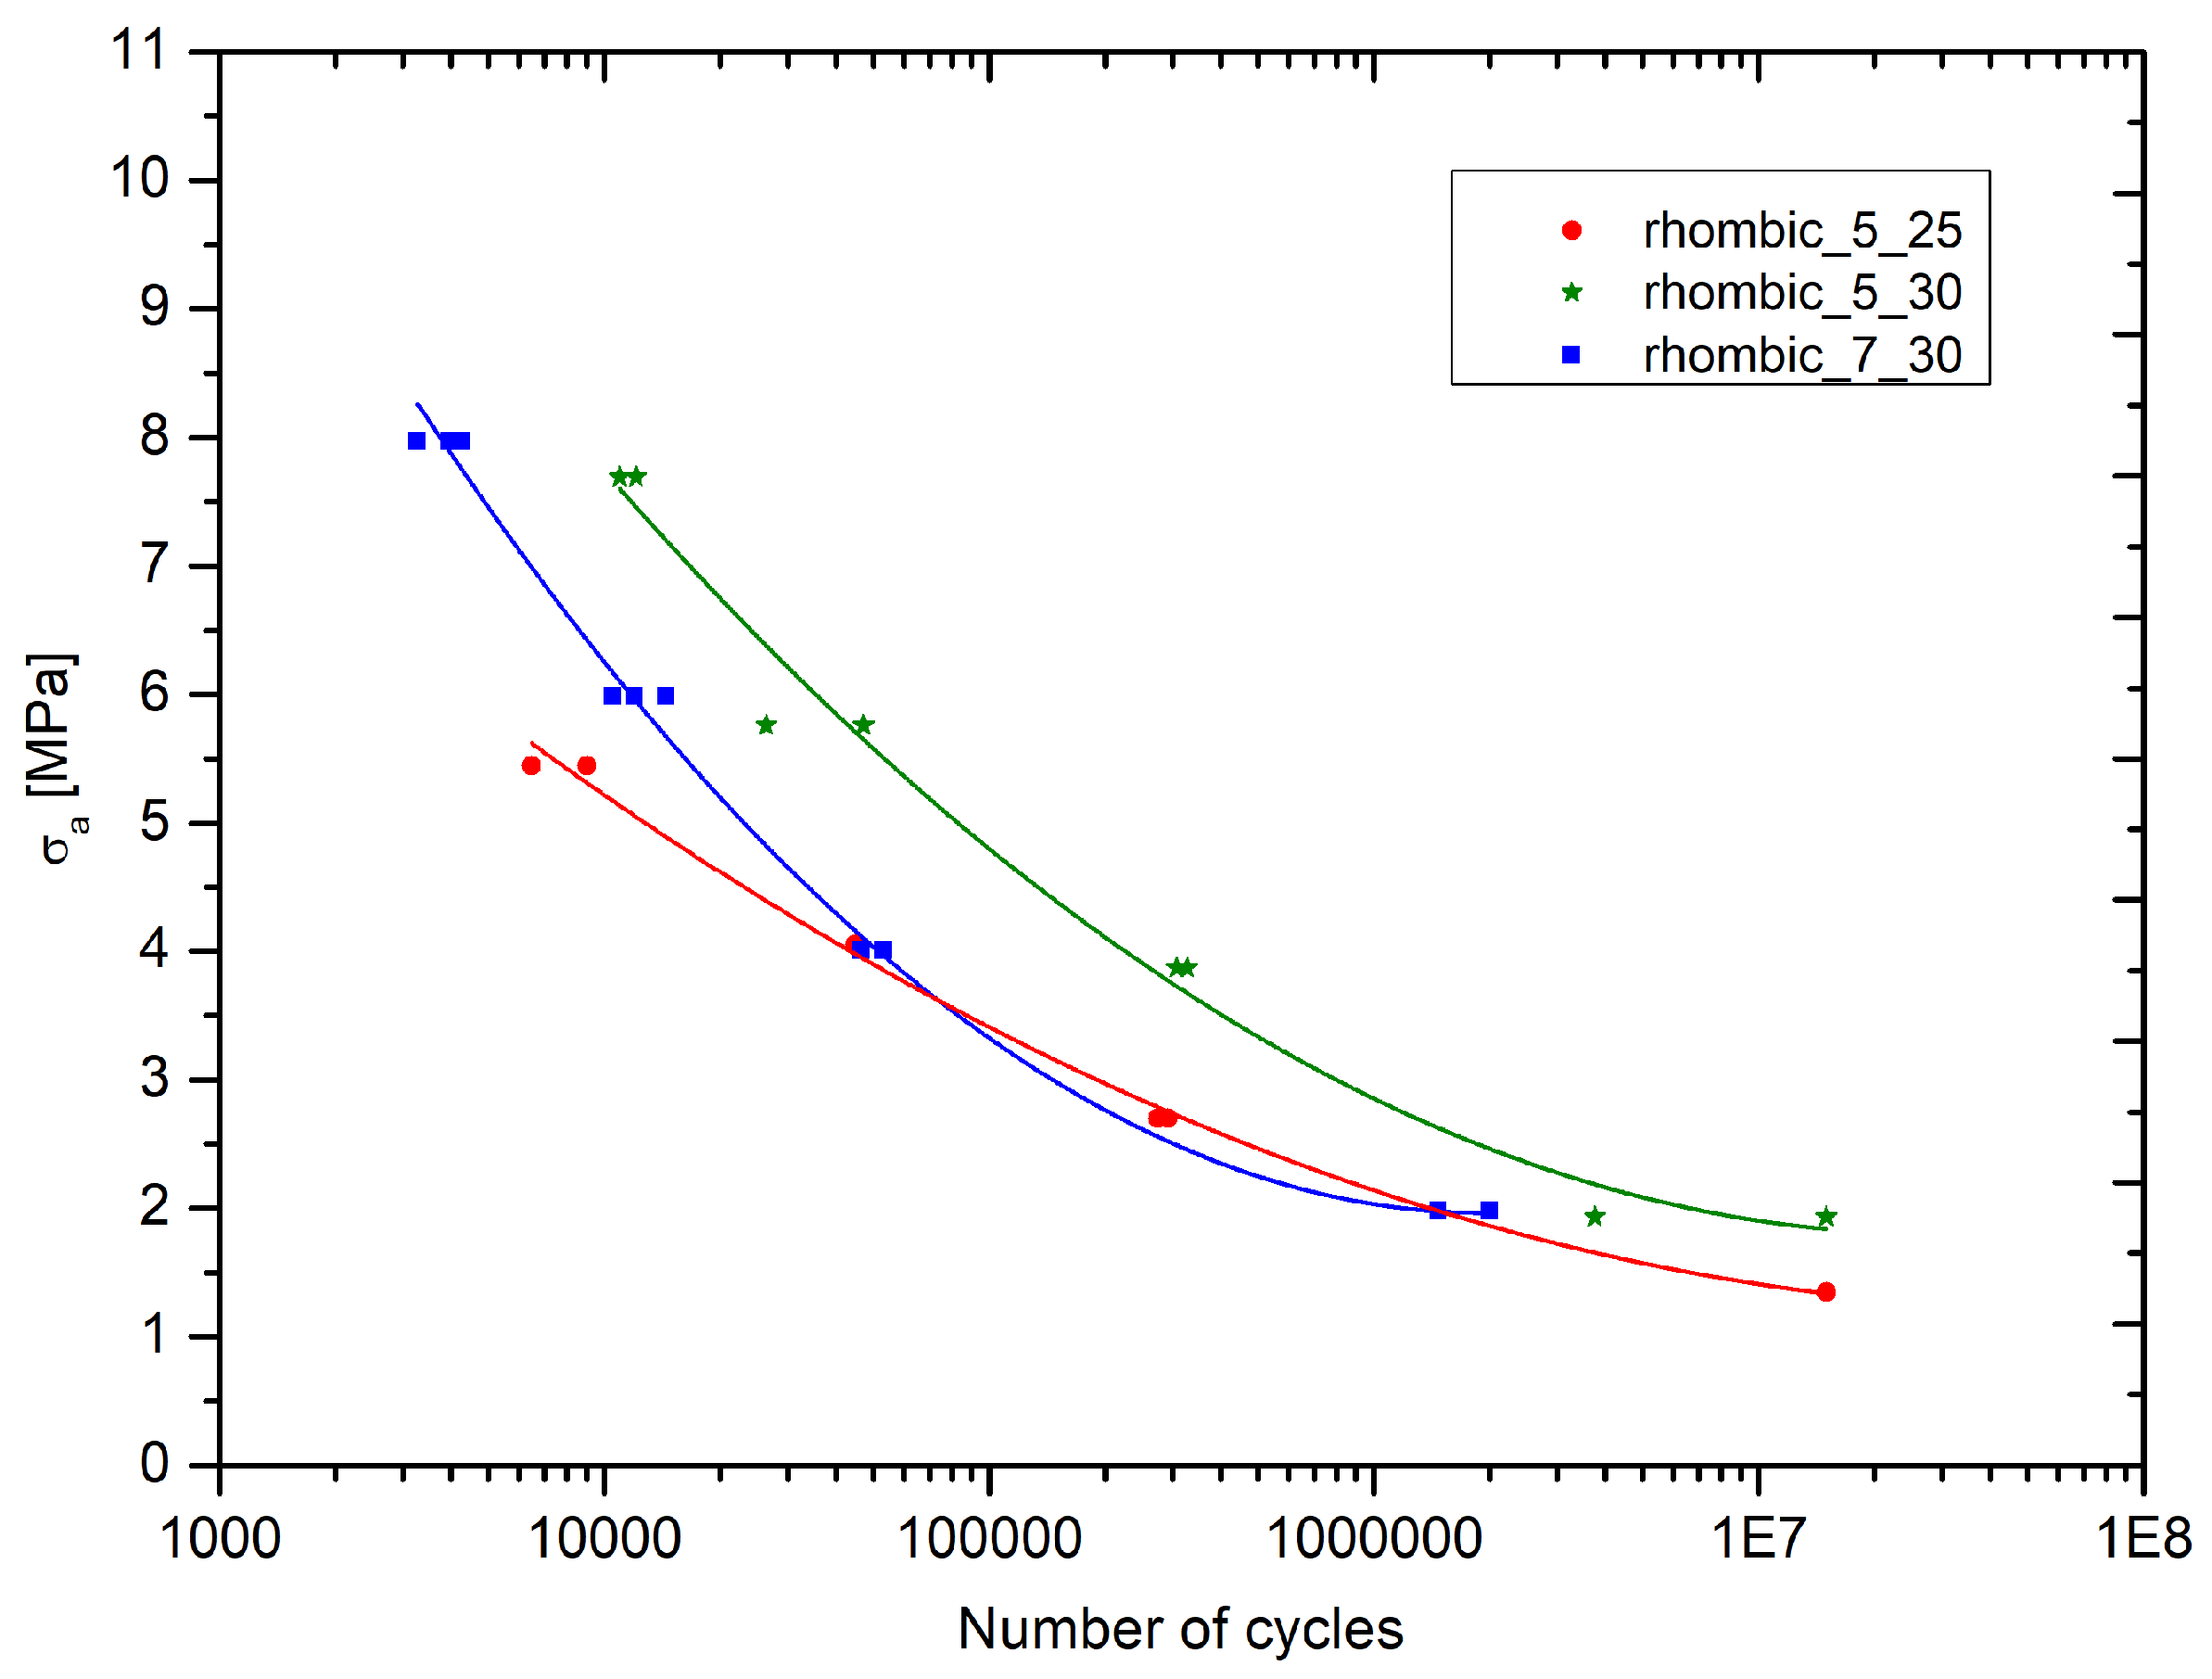
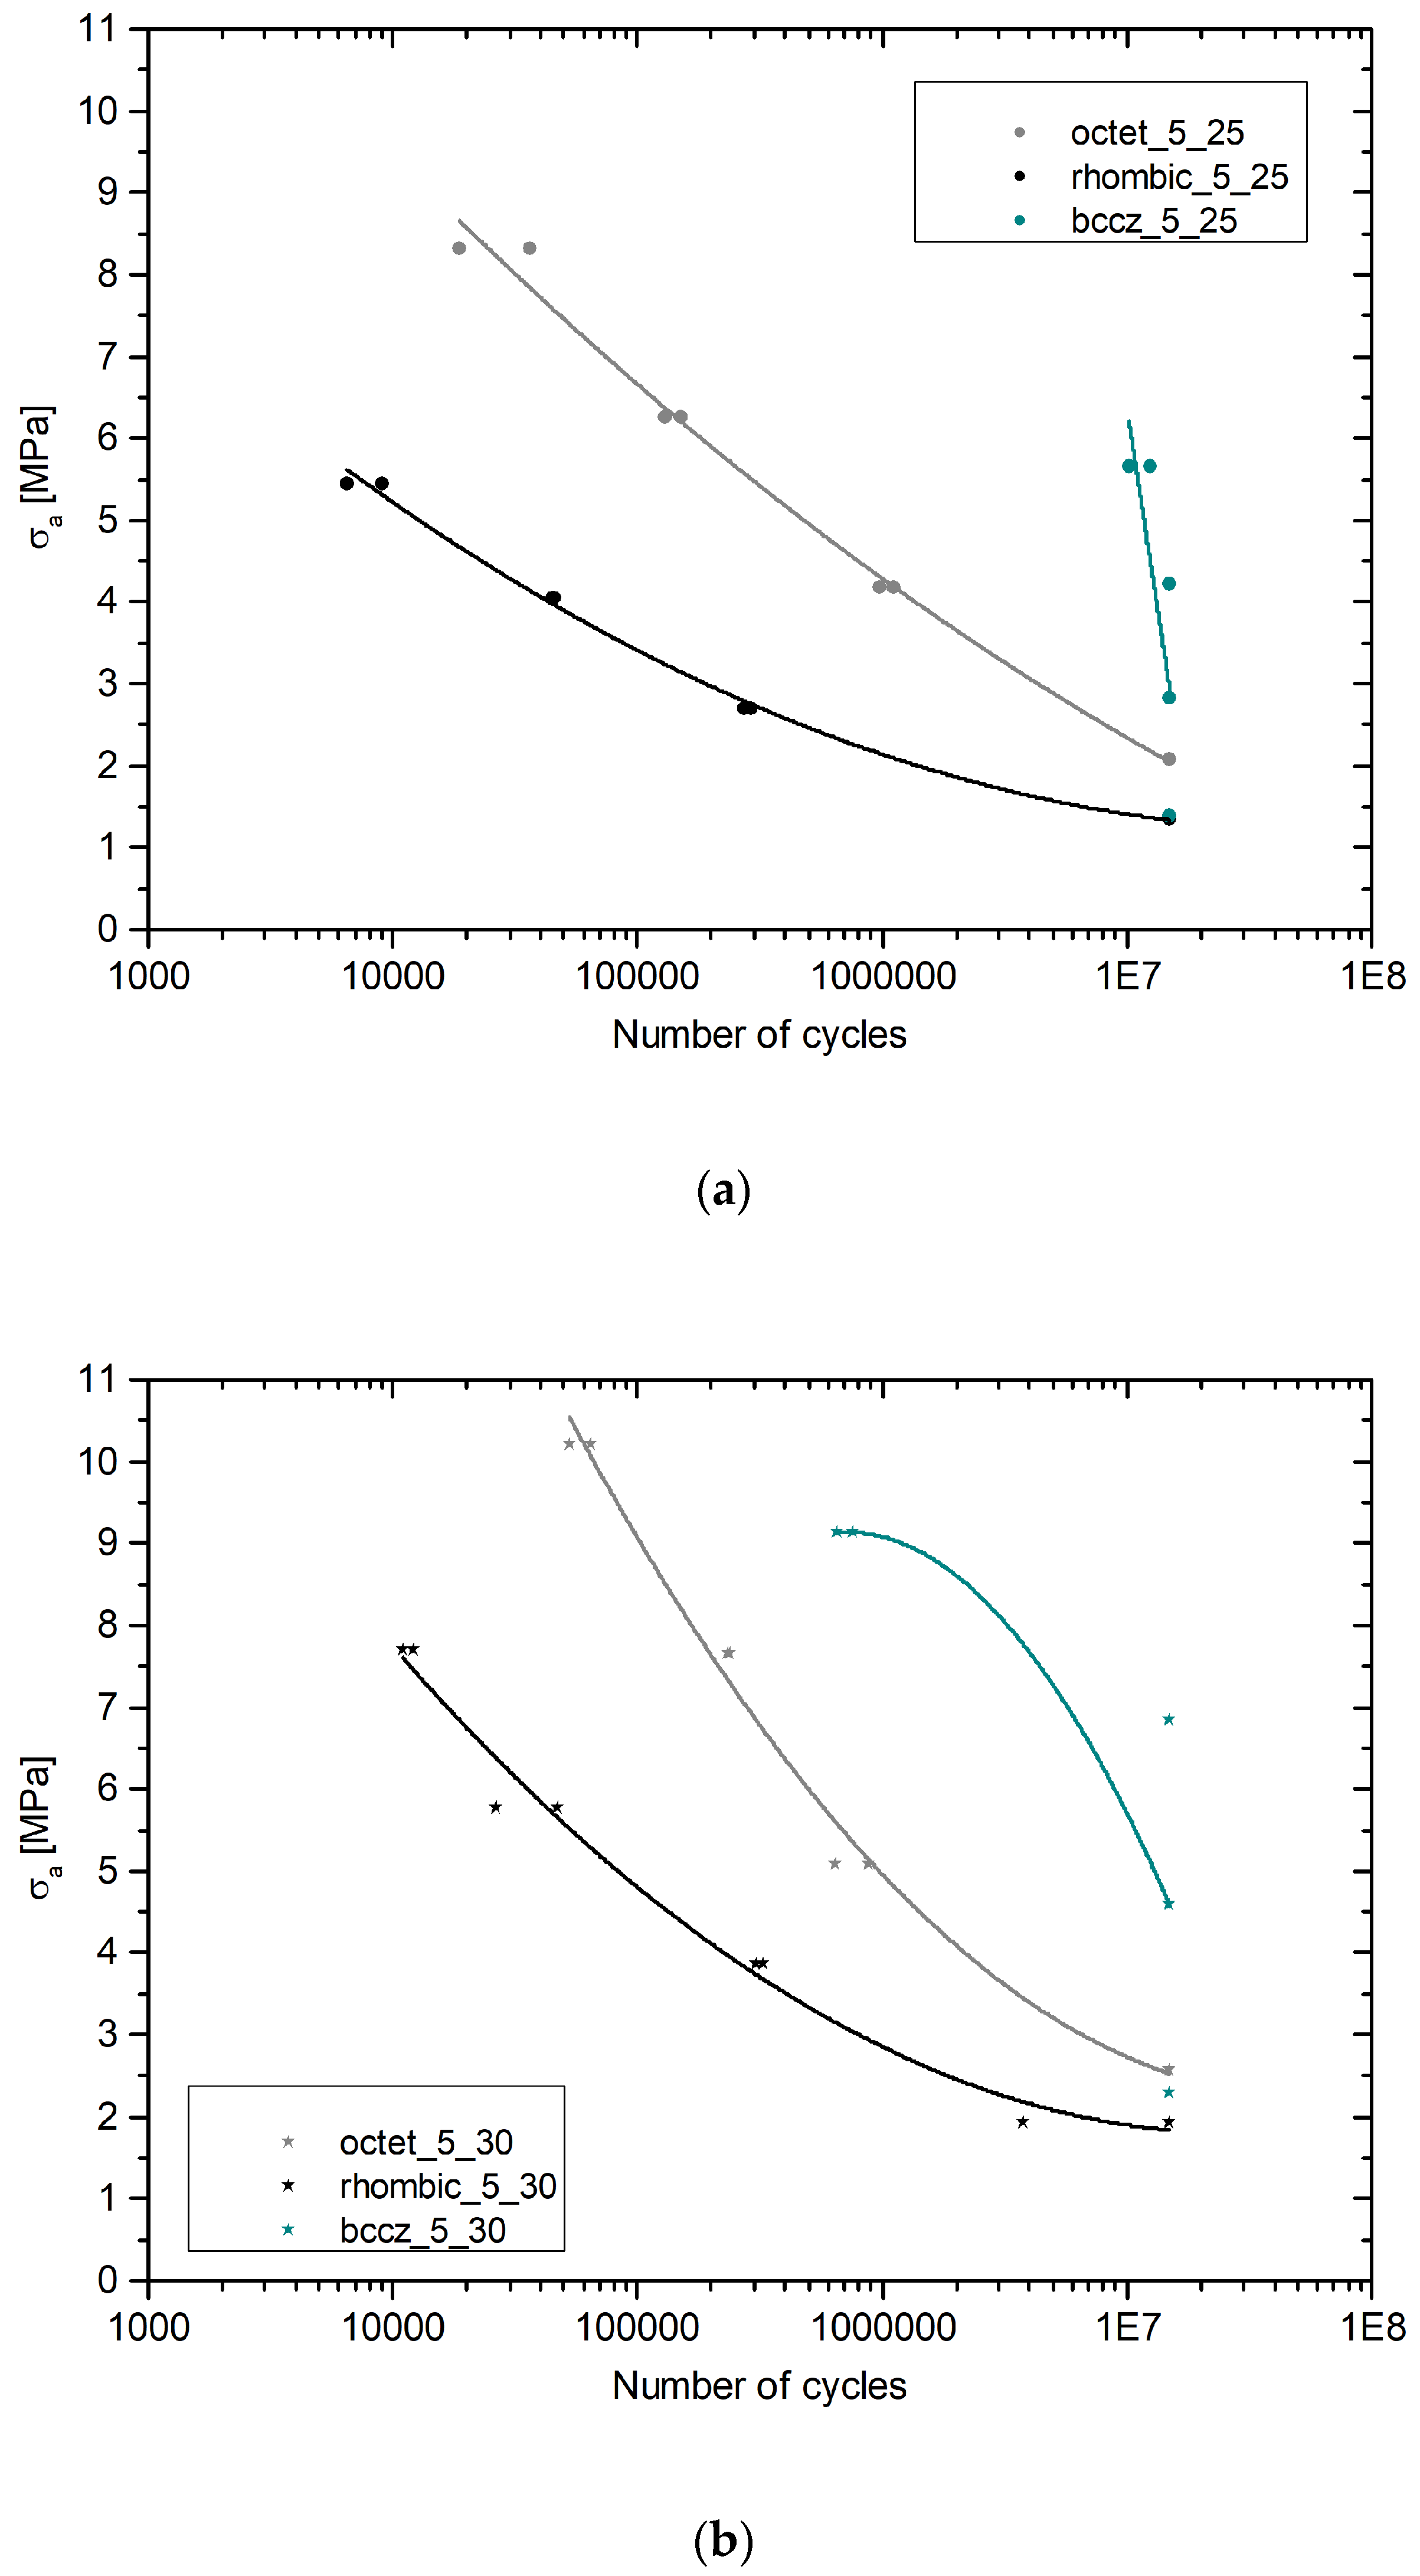
3.1. Rhombic Dodecahedron
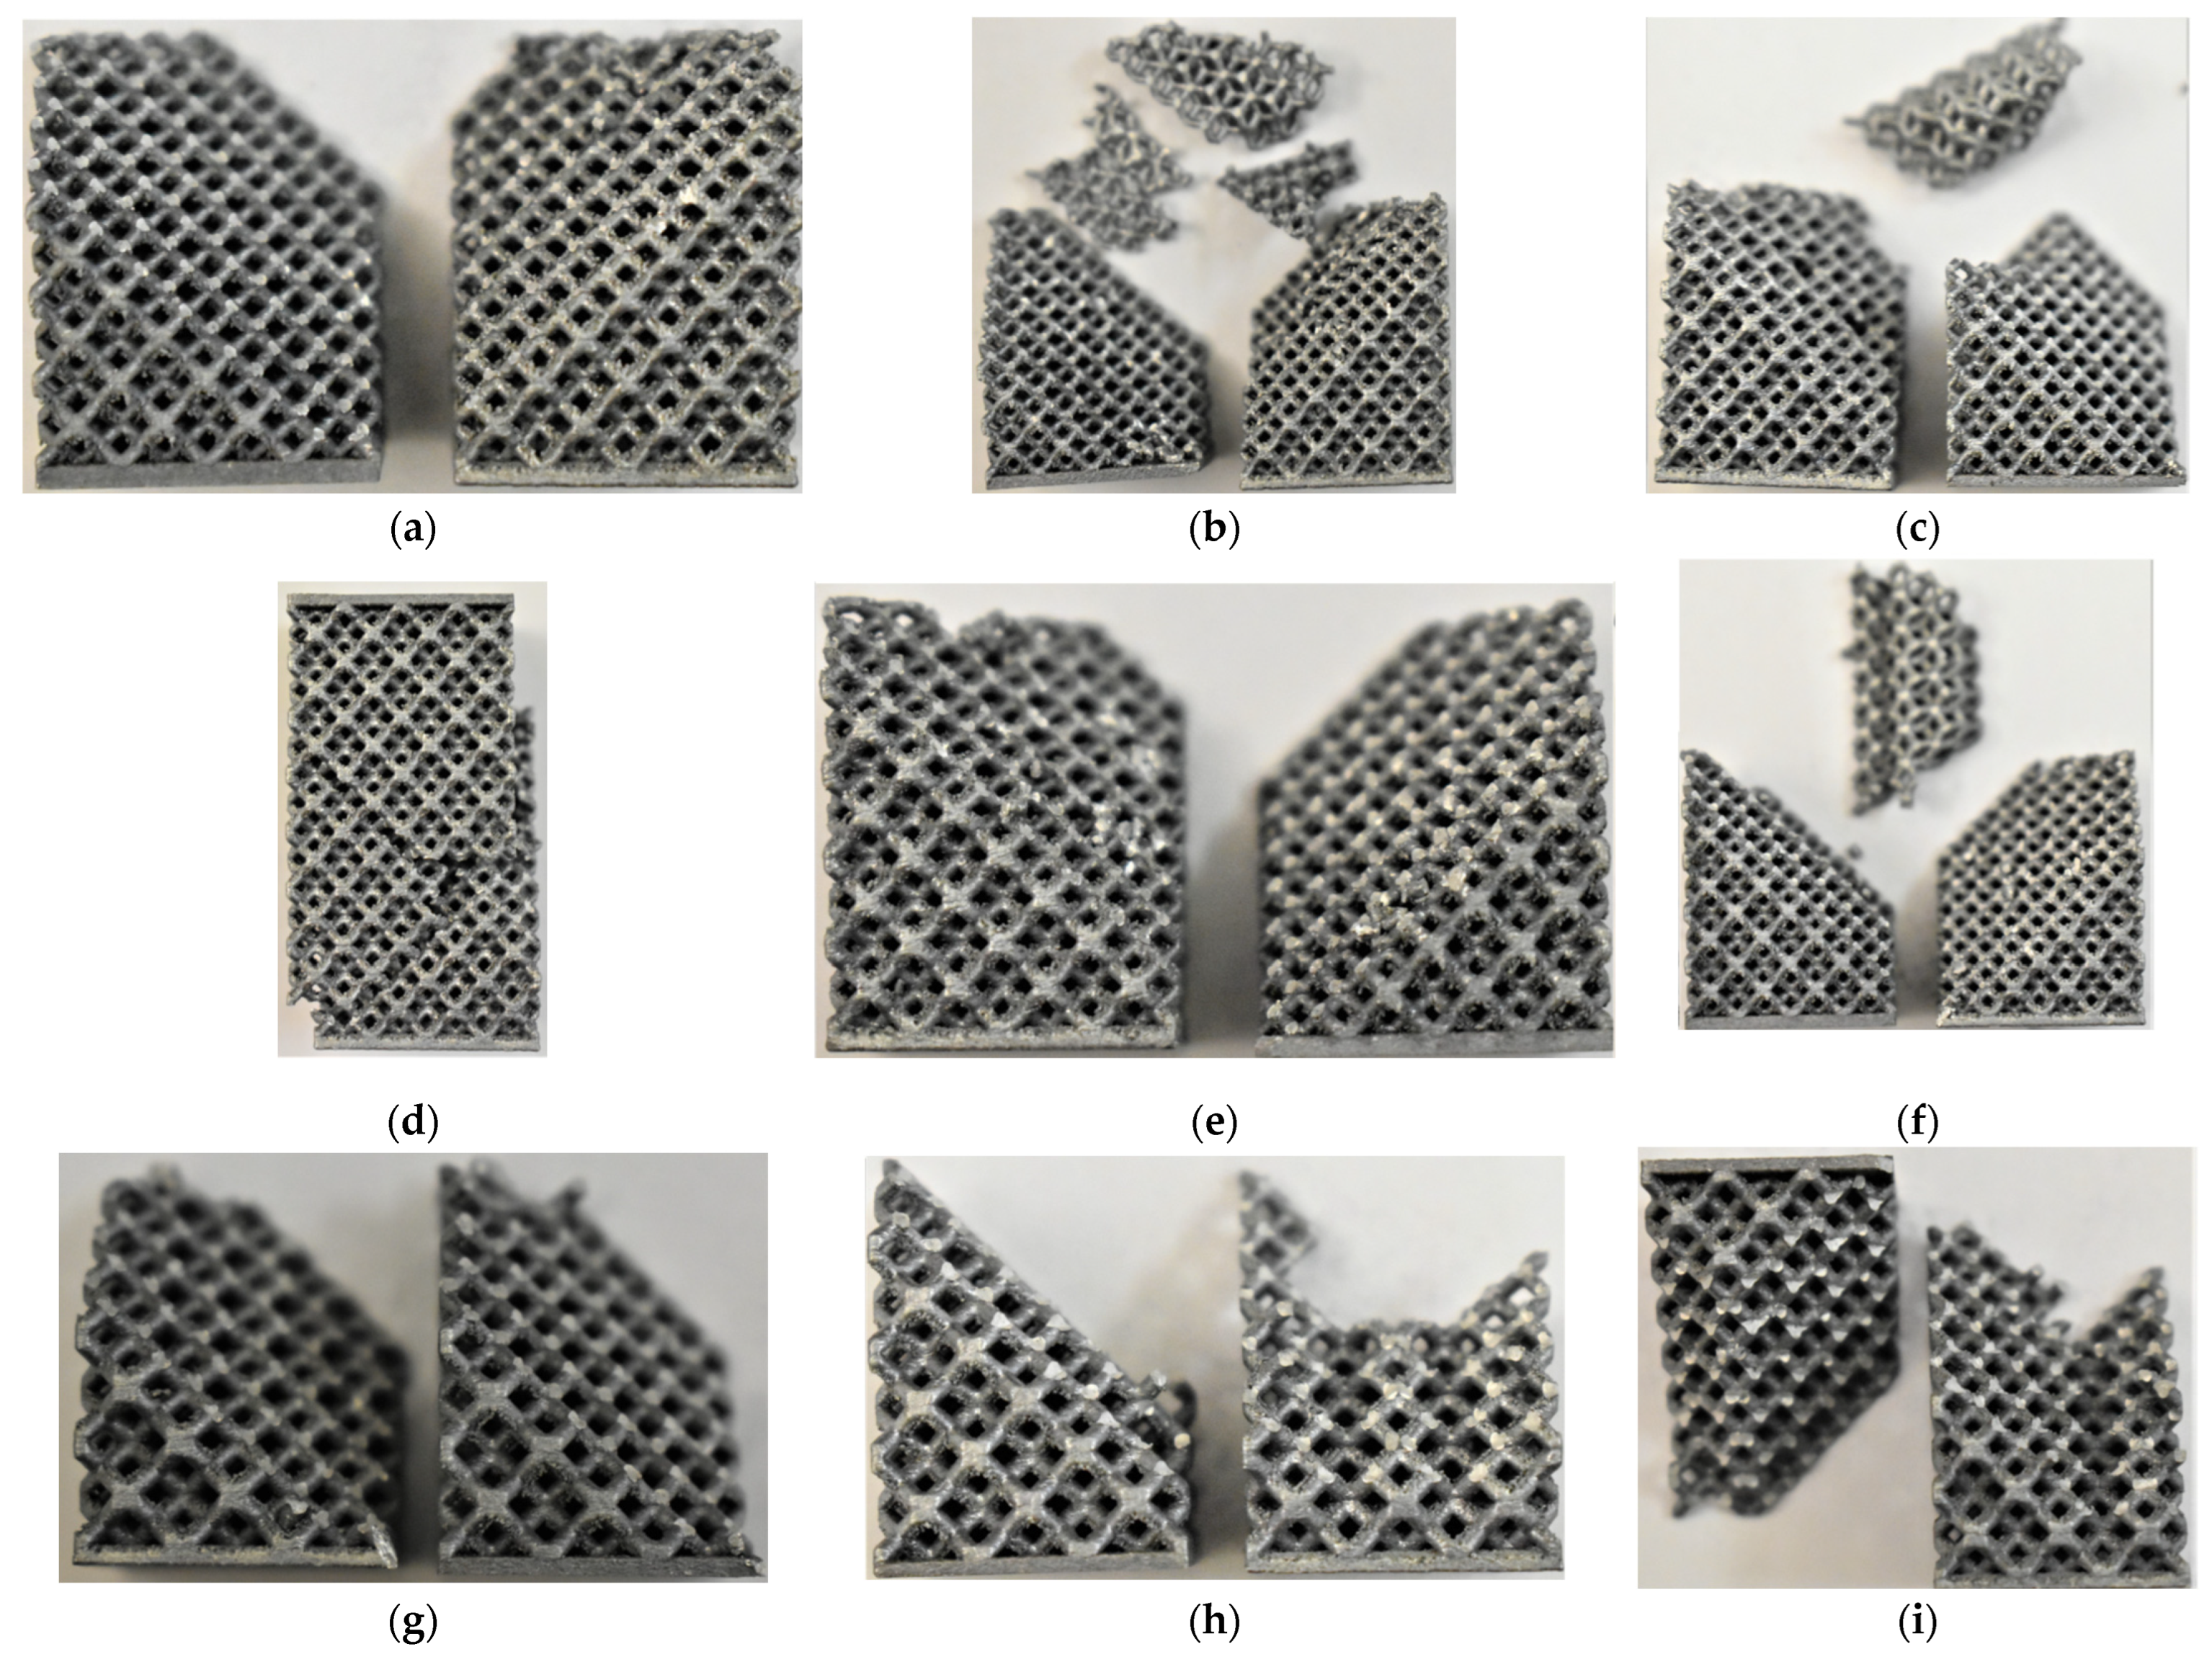
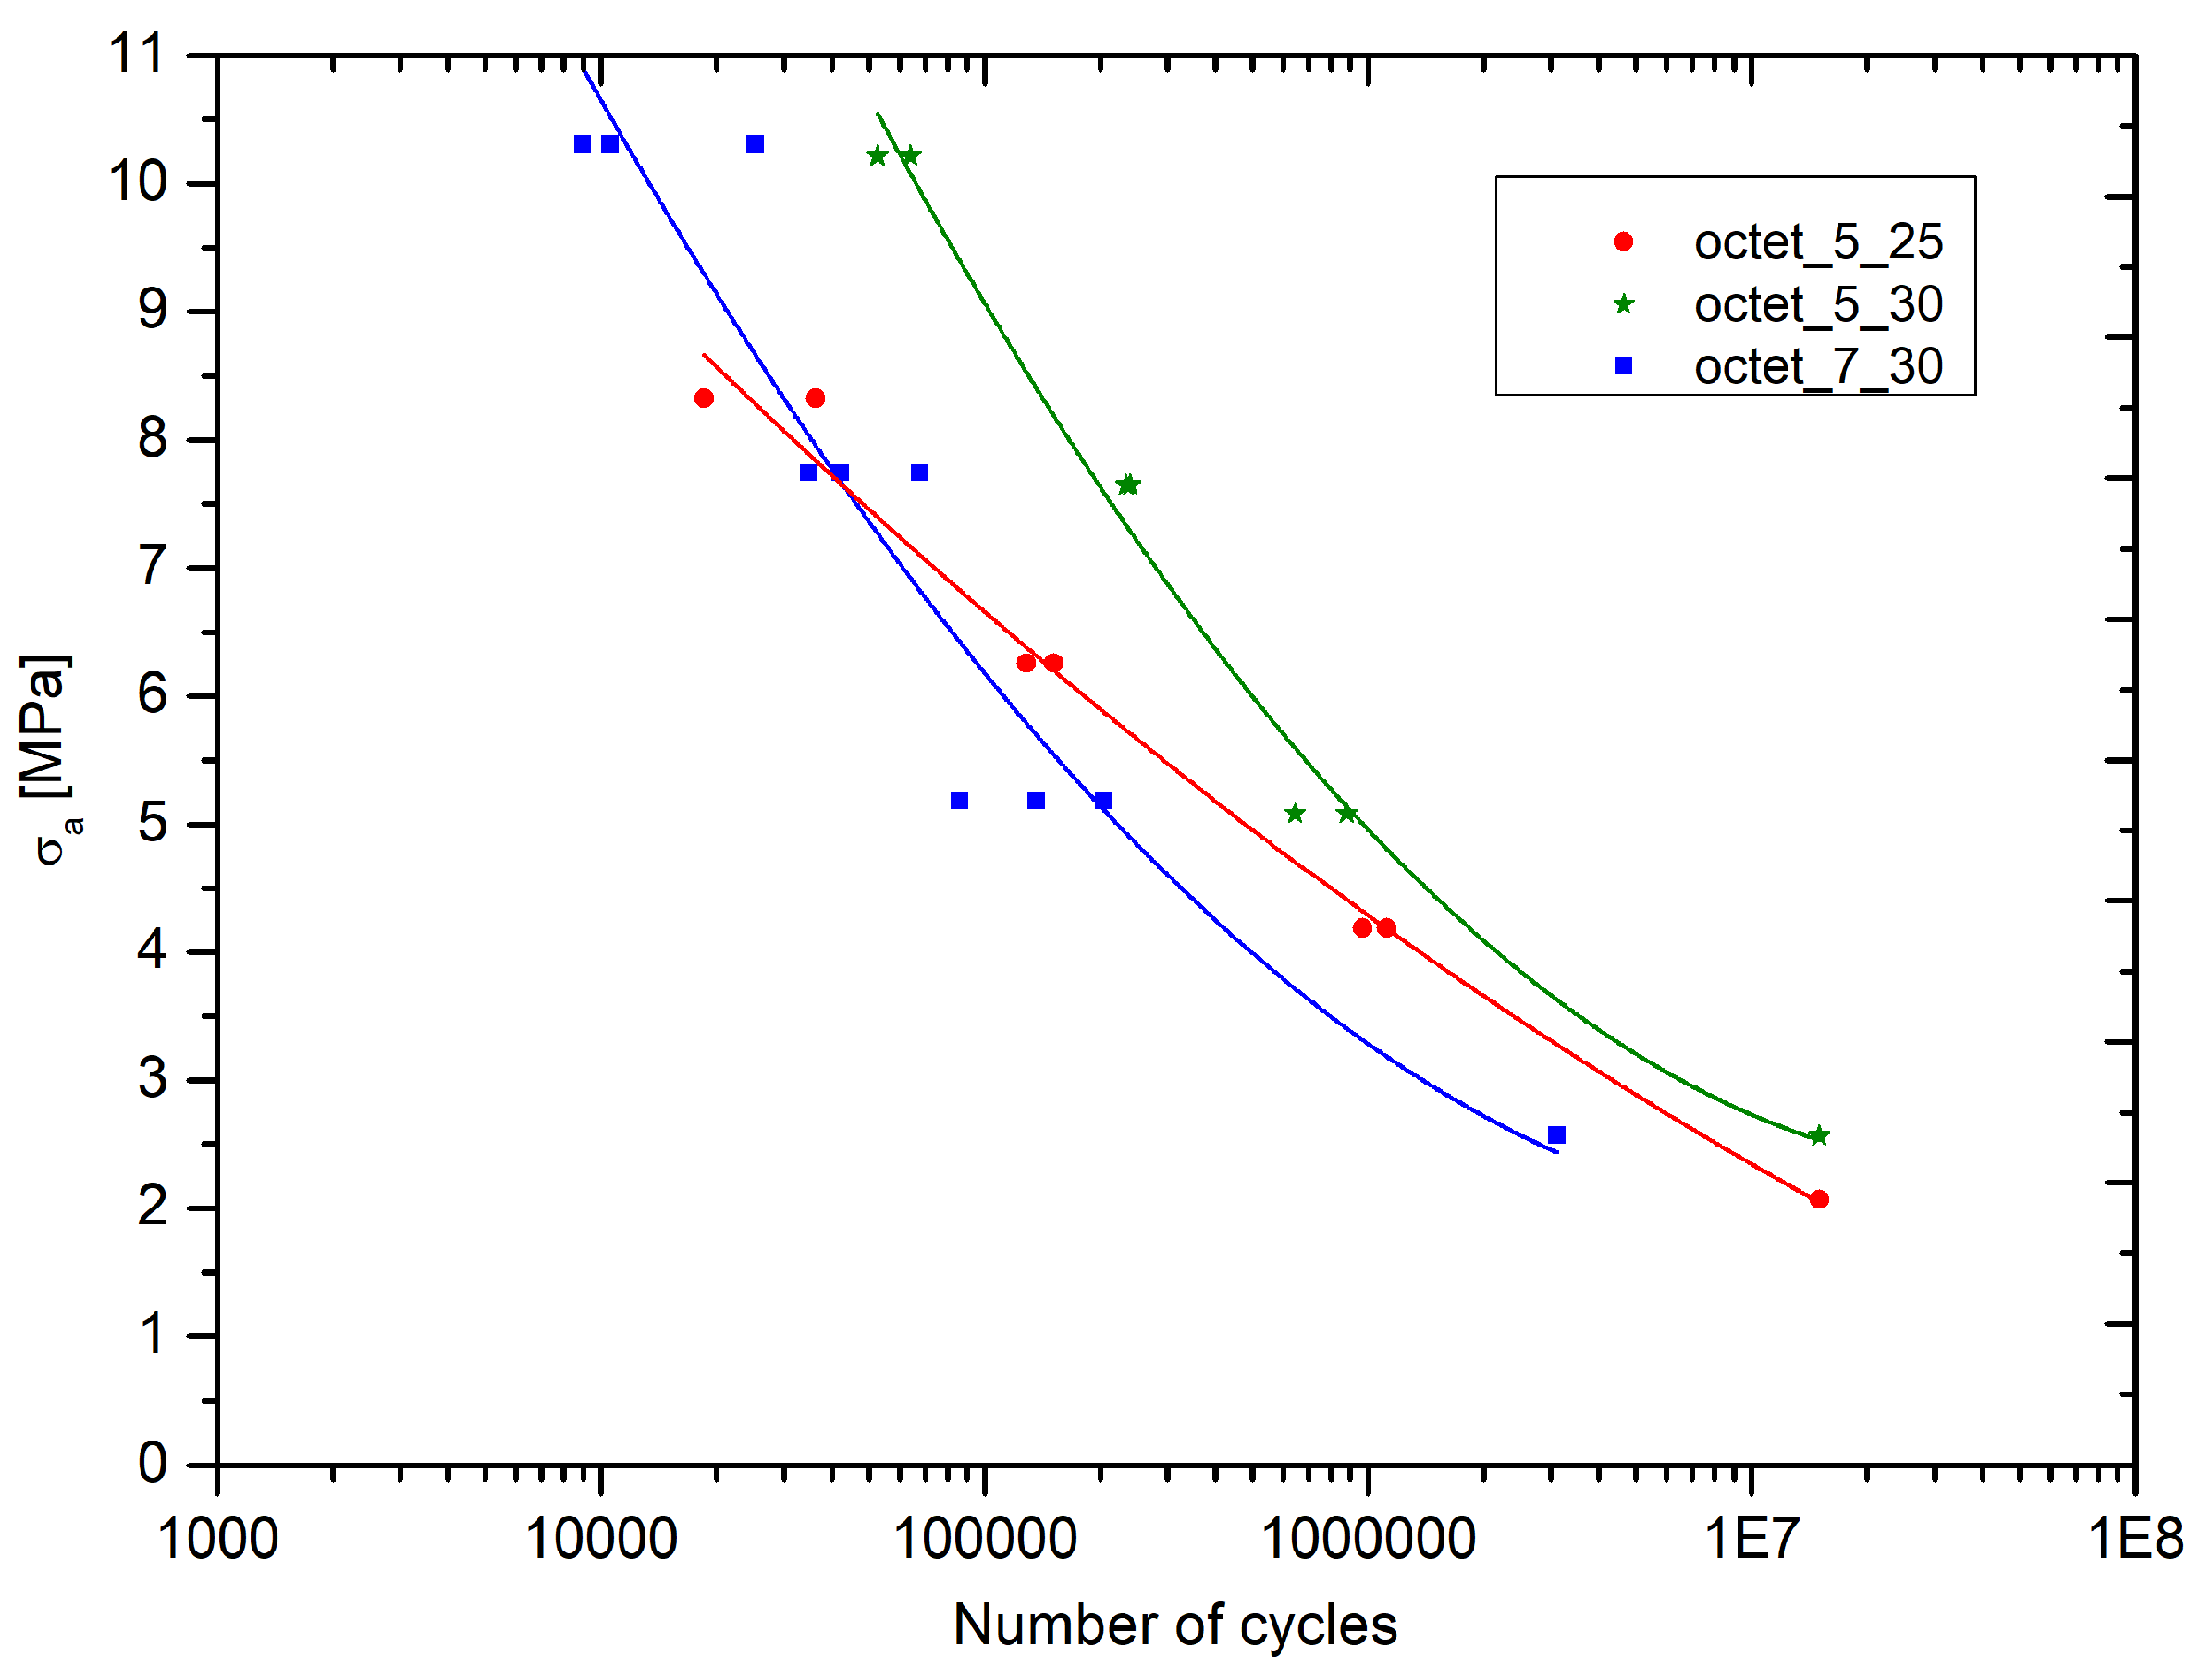
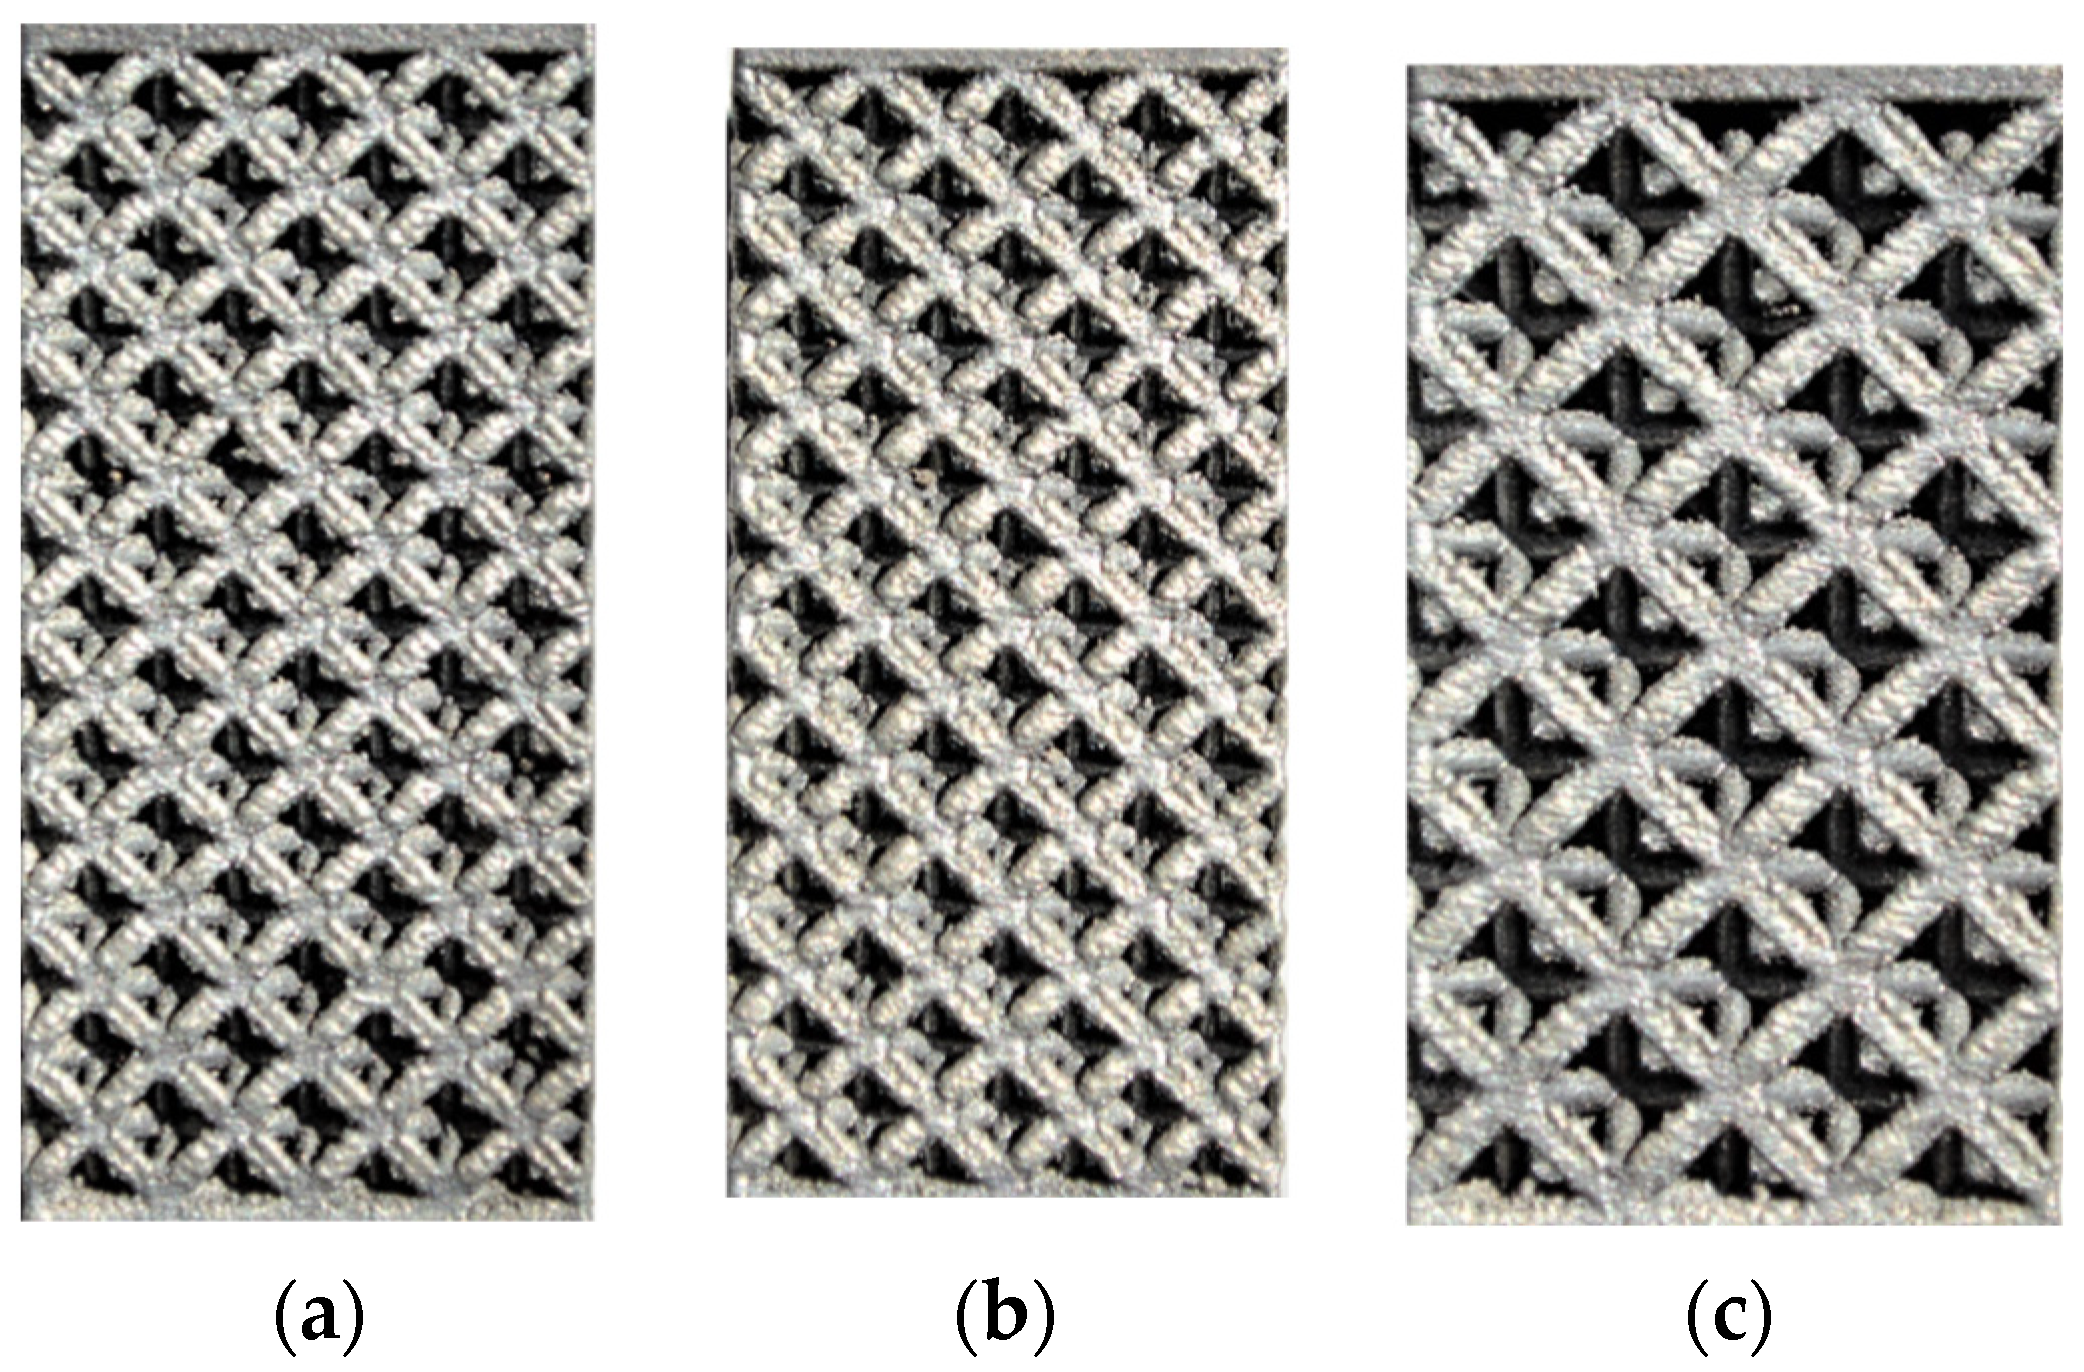
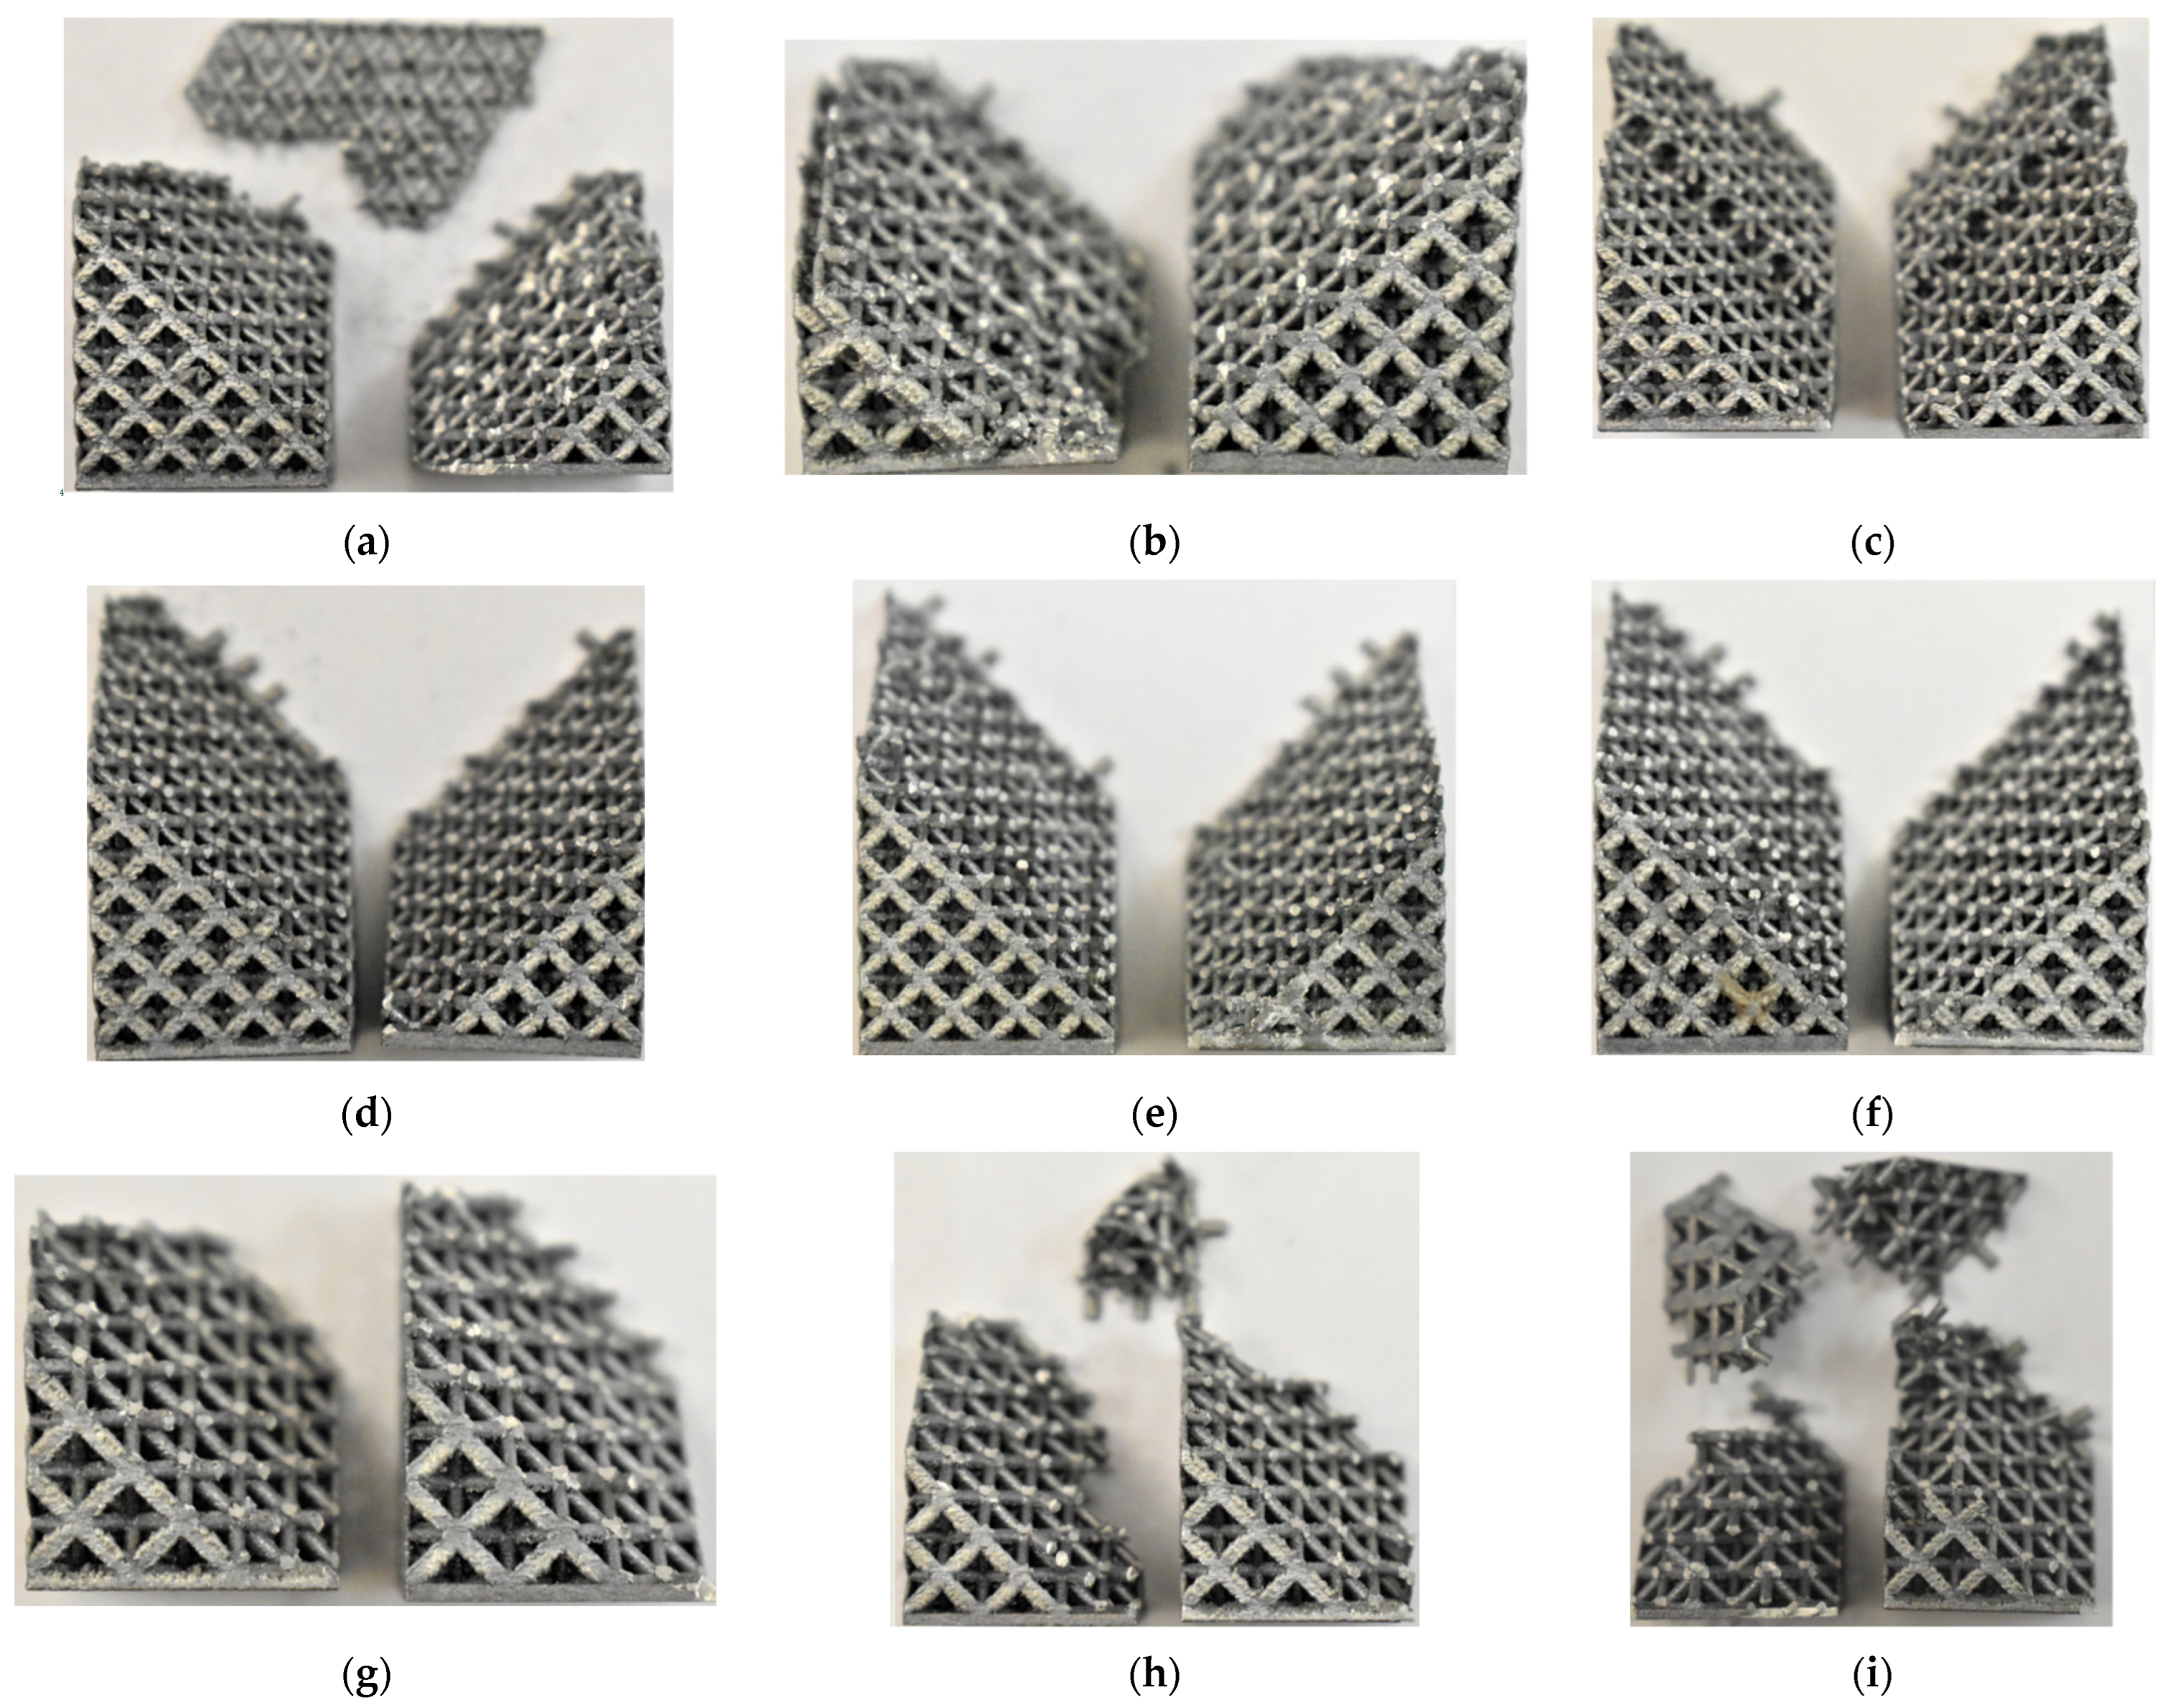
3.2. Octet Truss
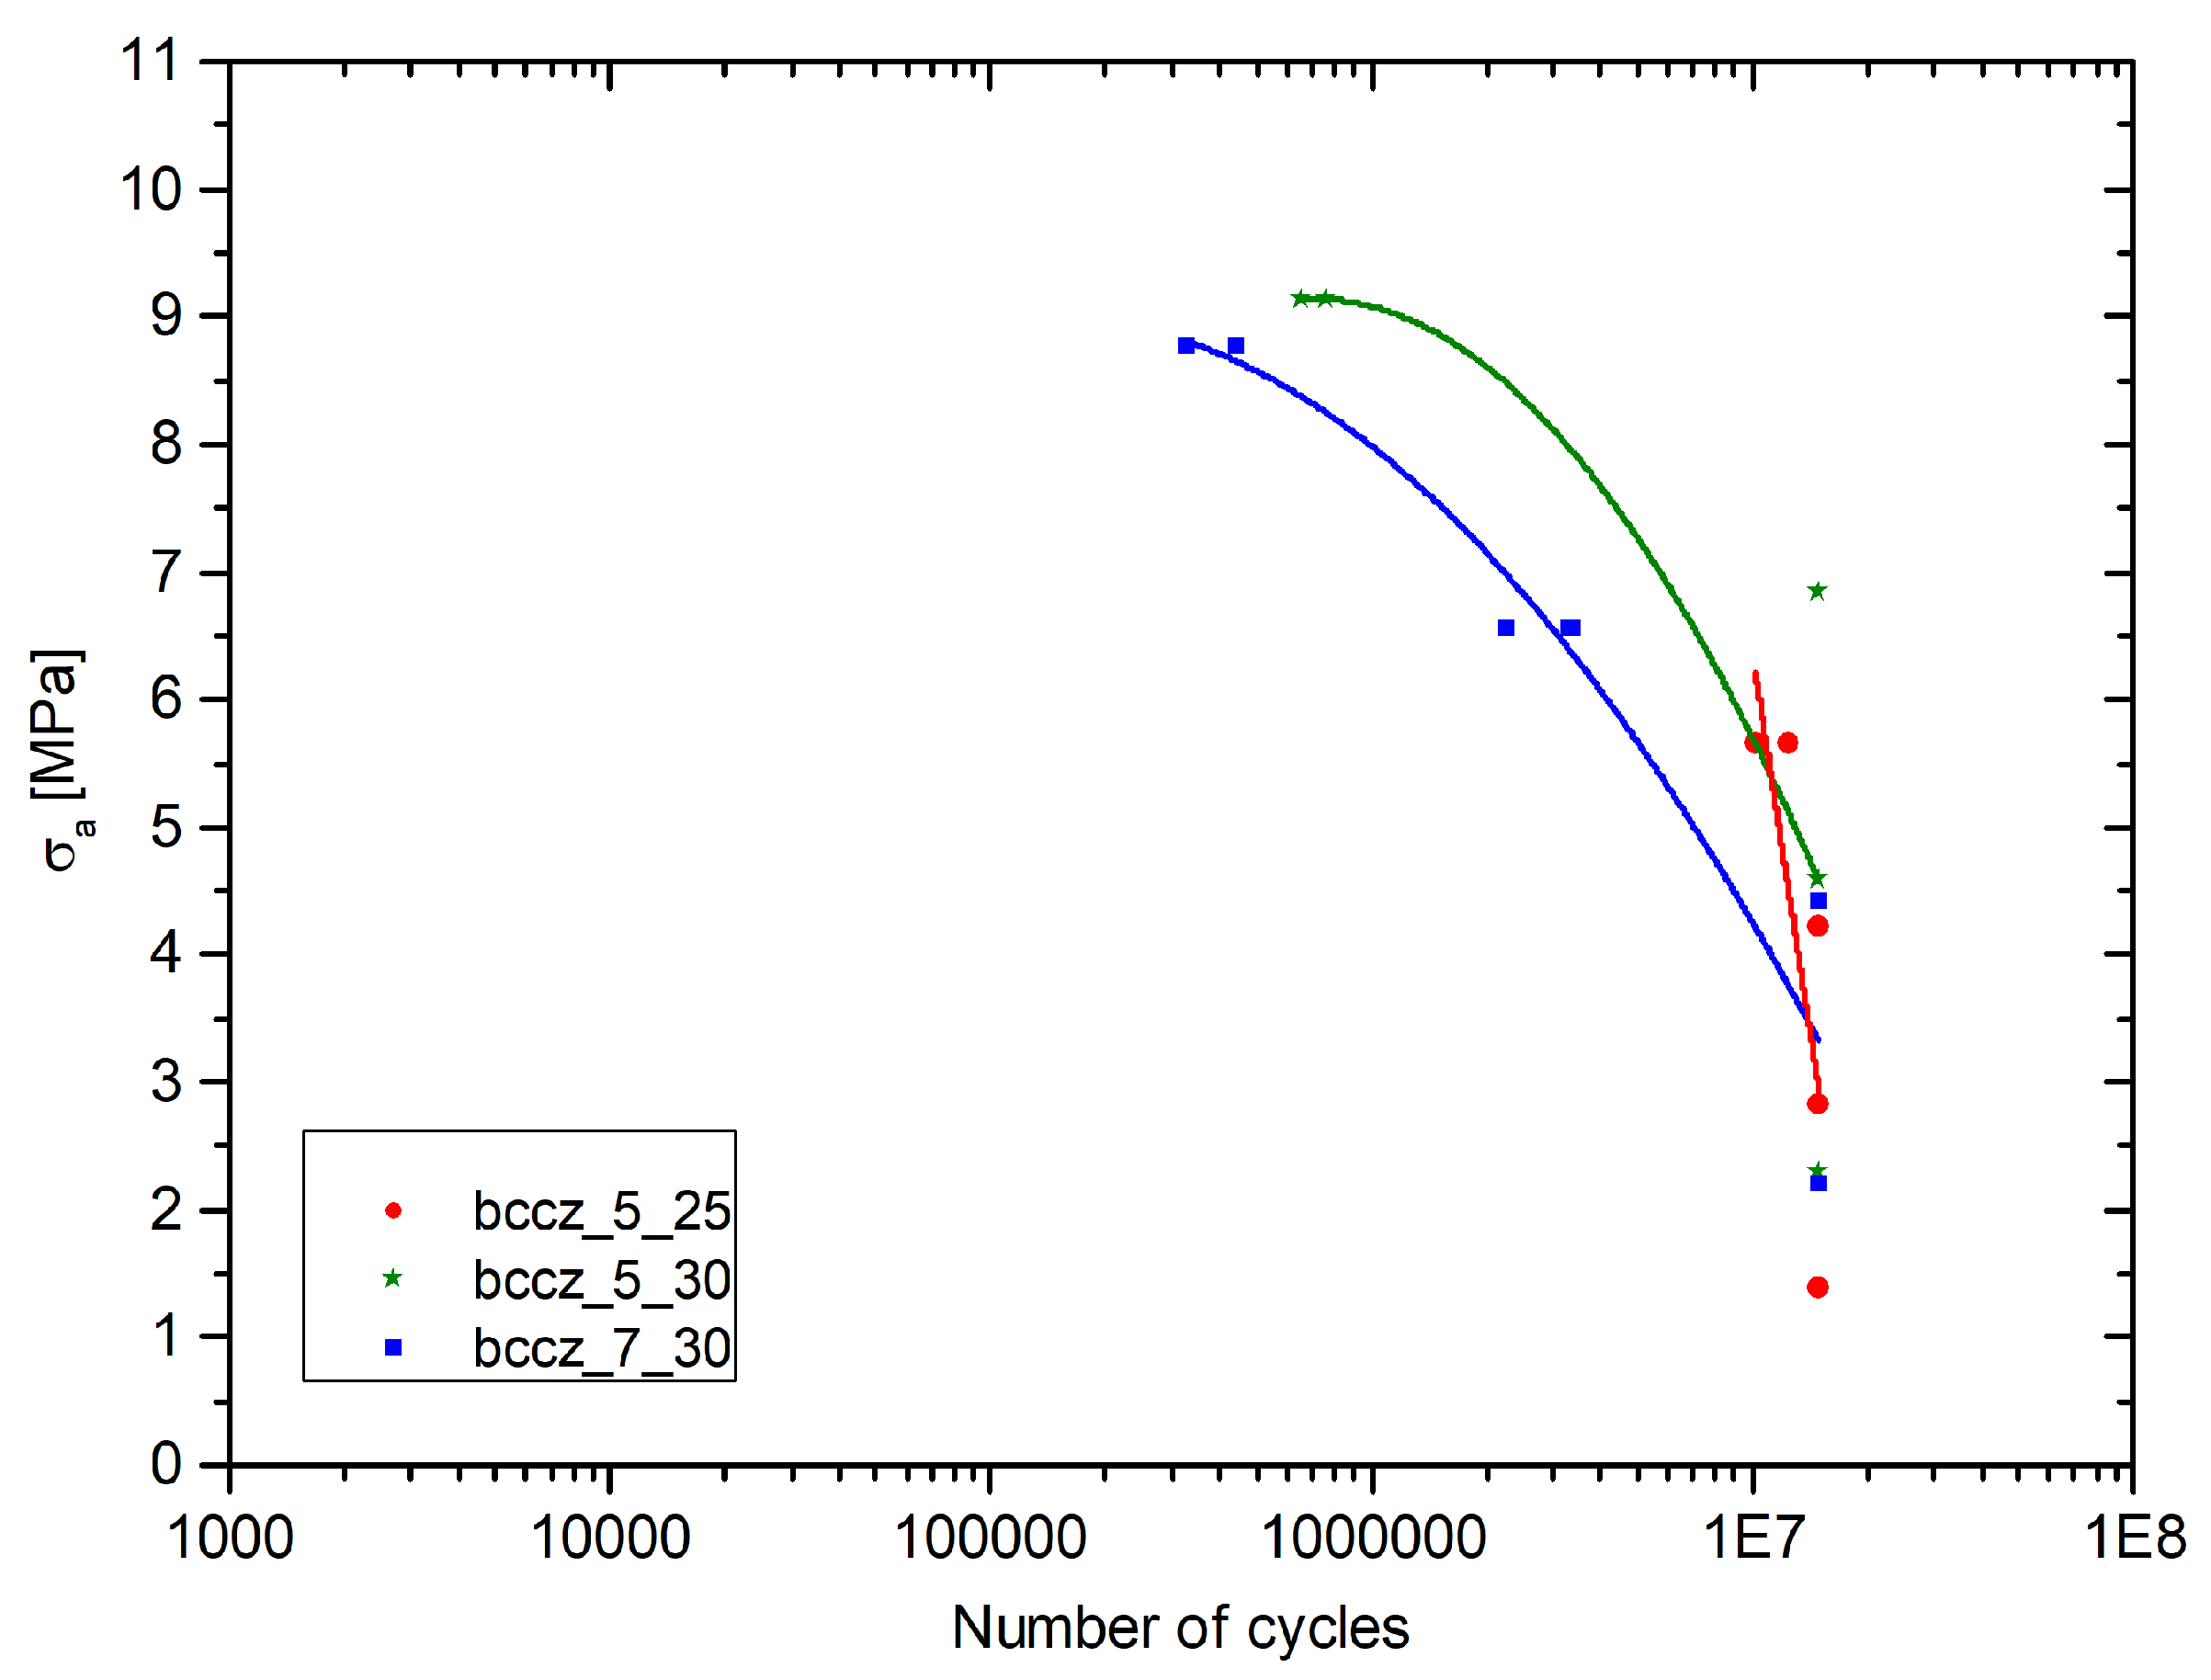
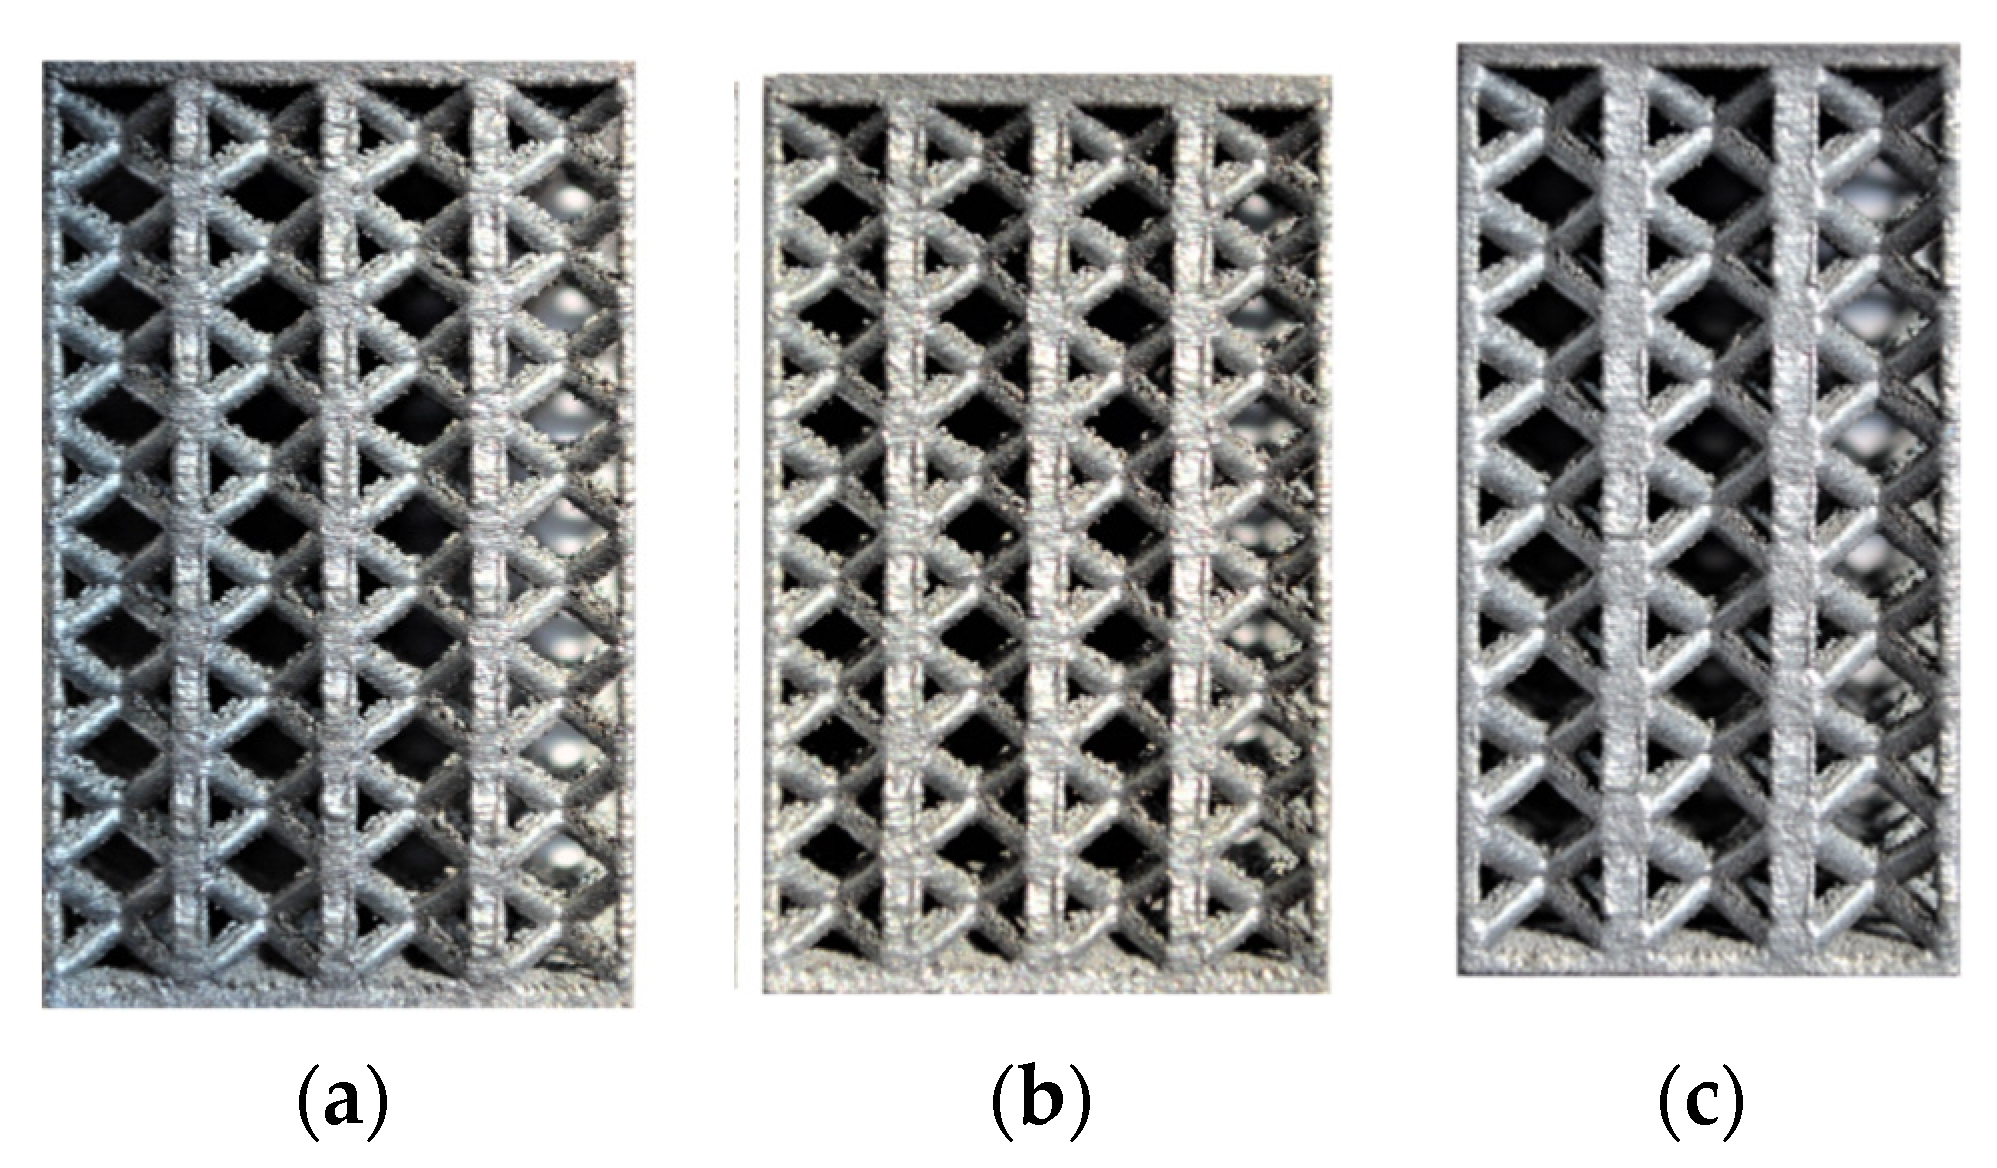
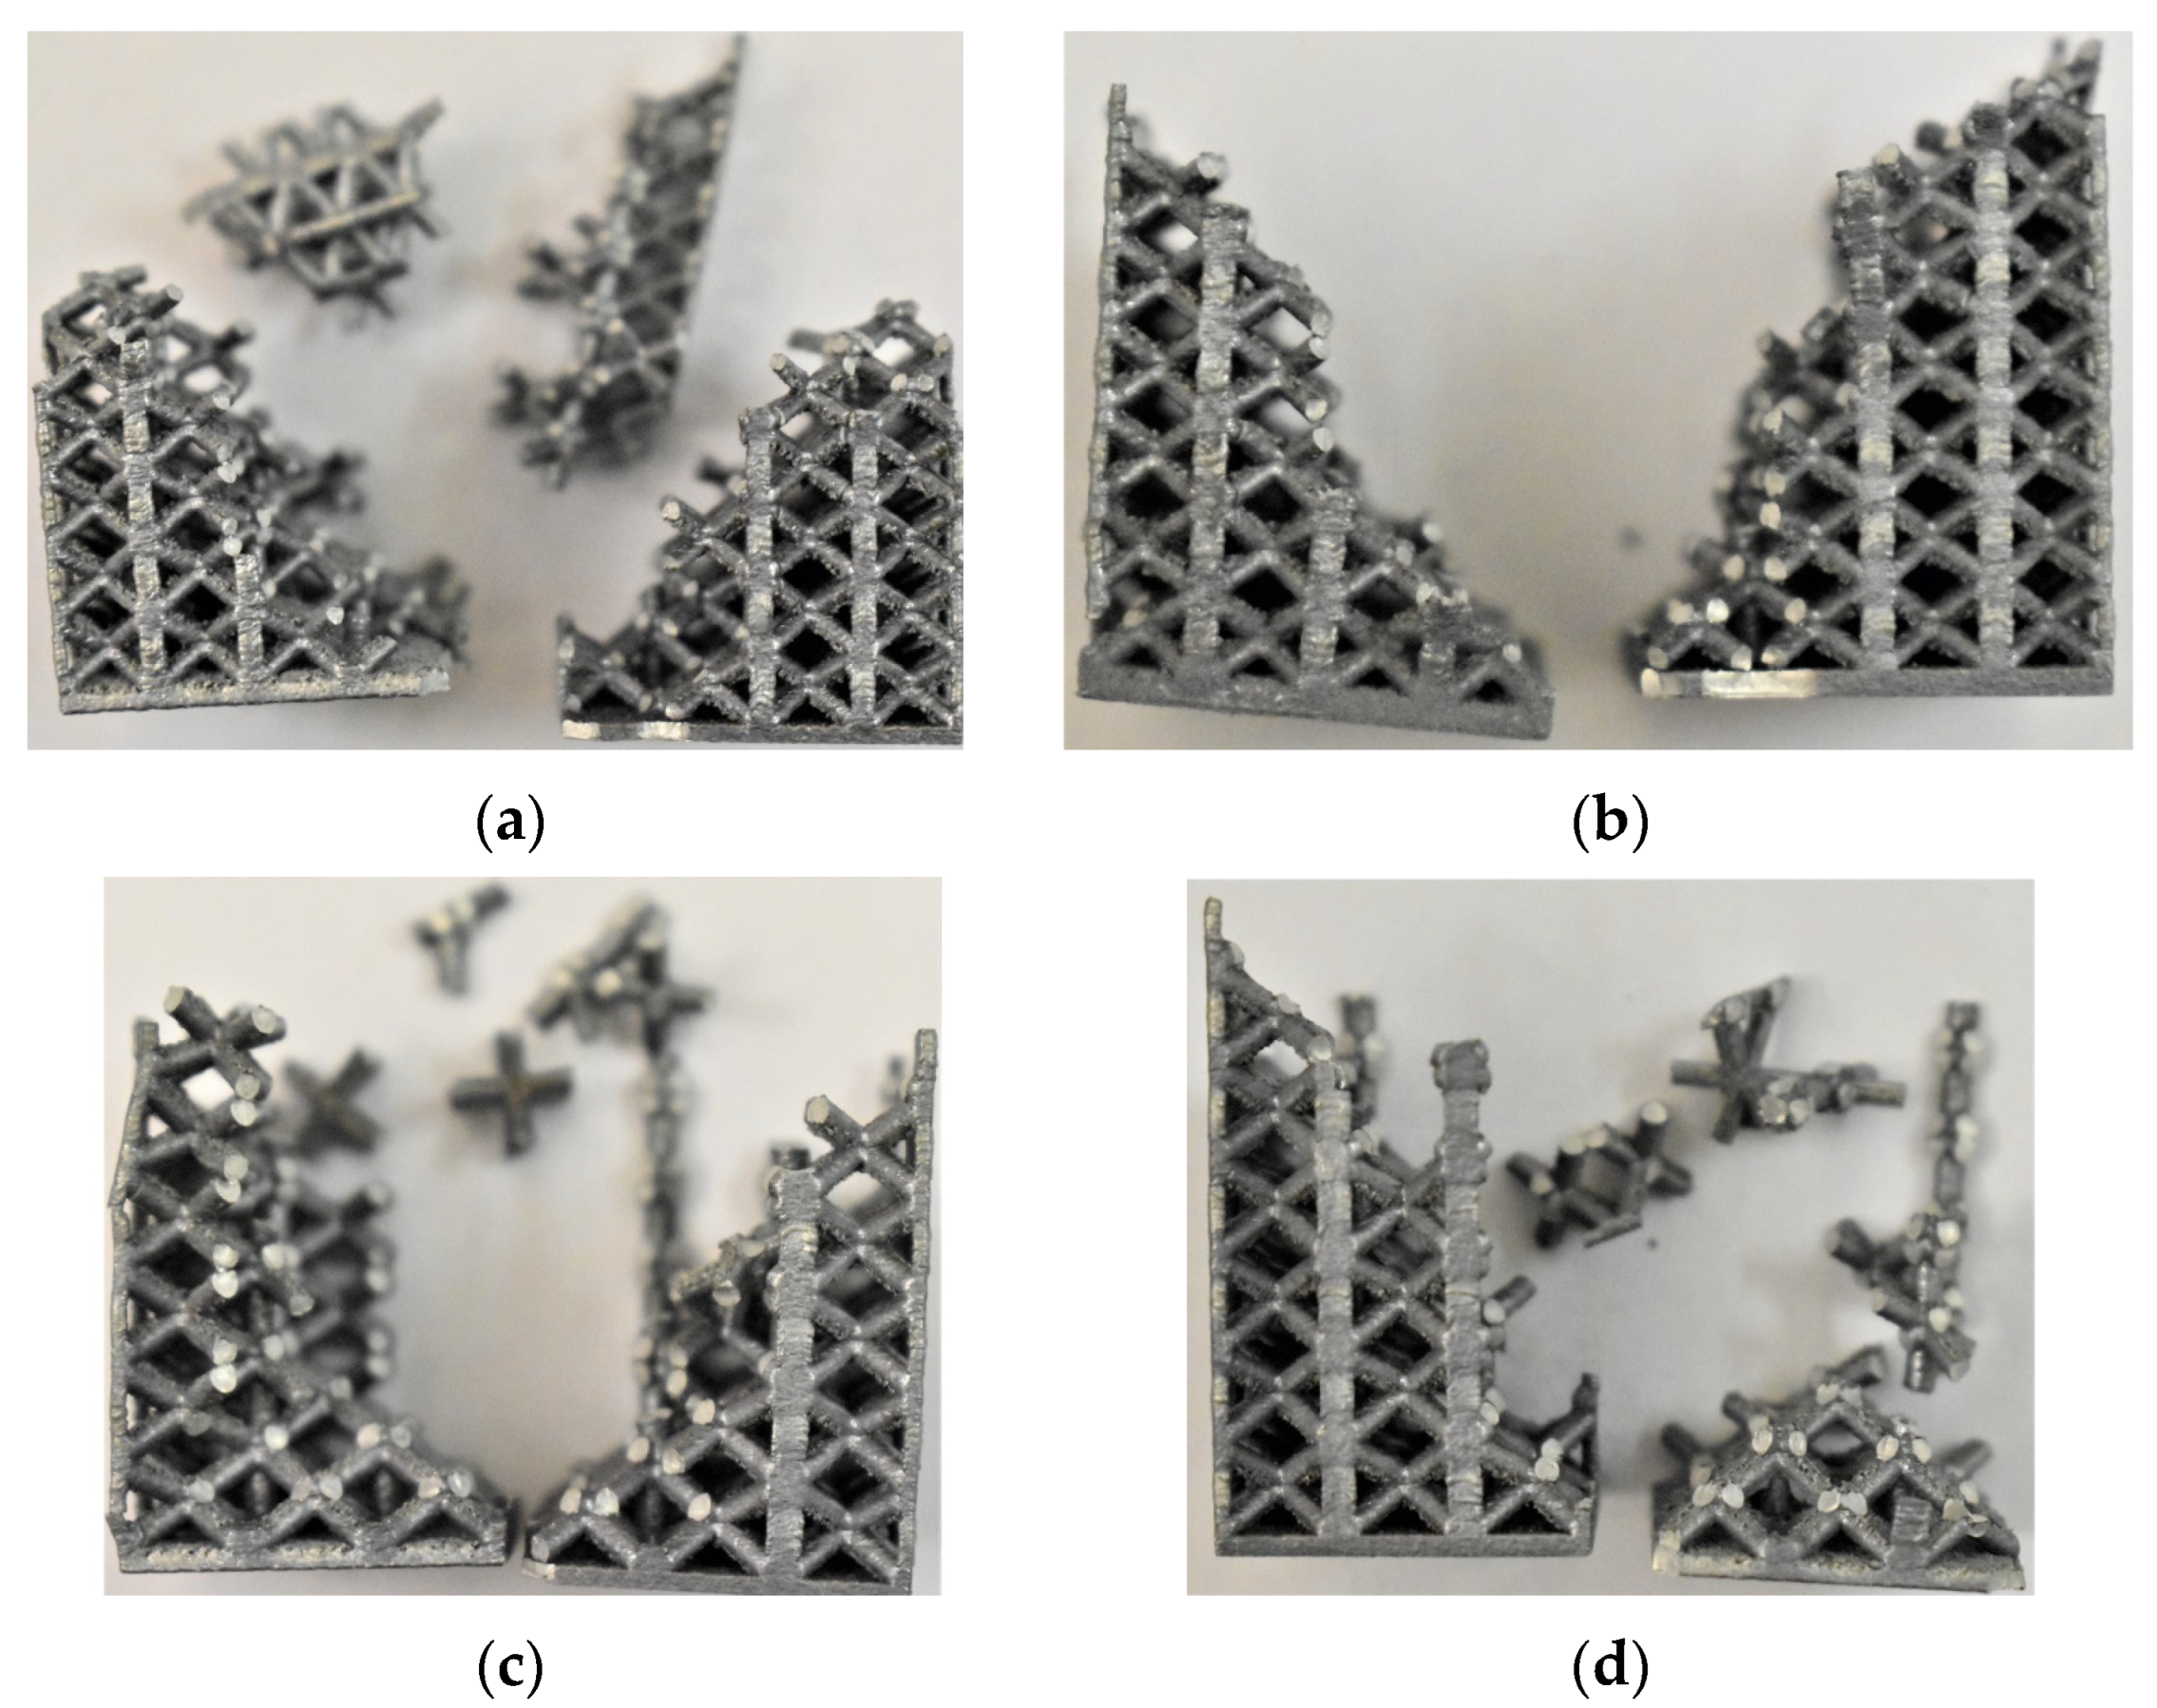
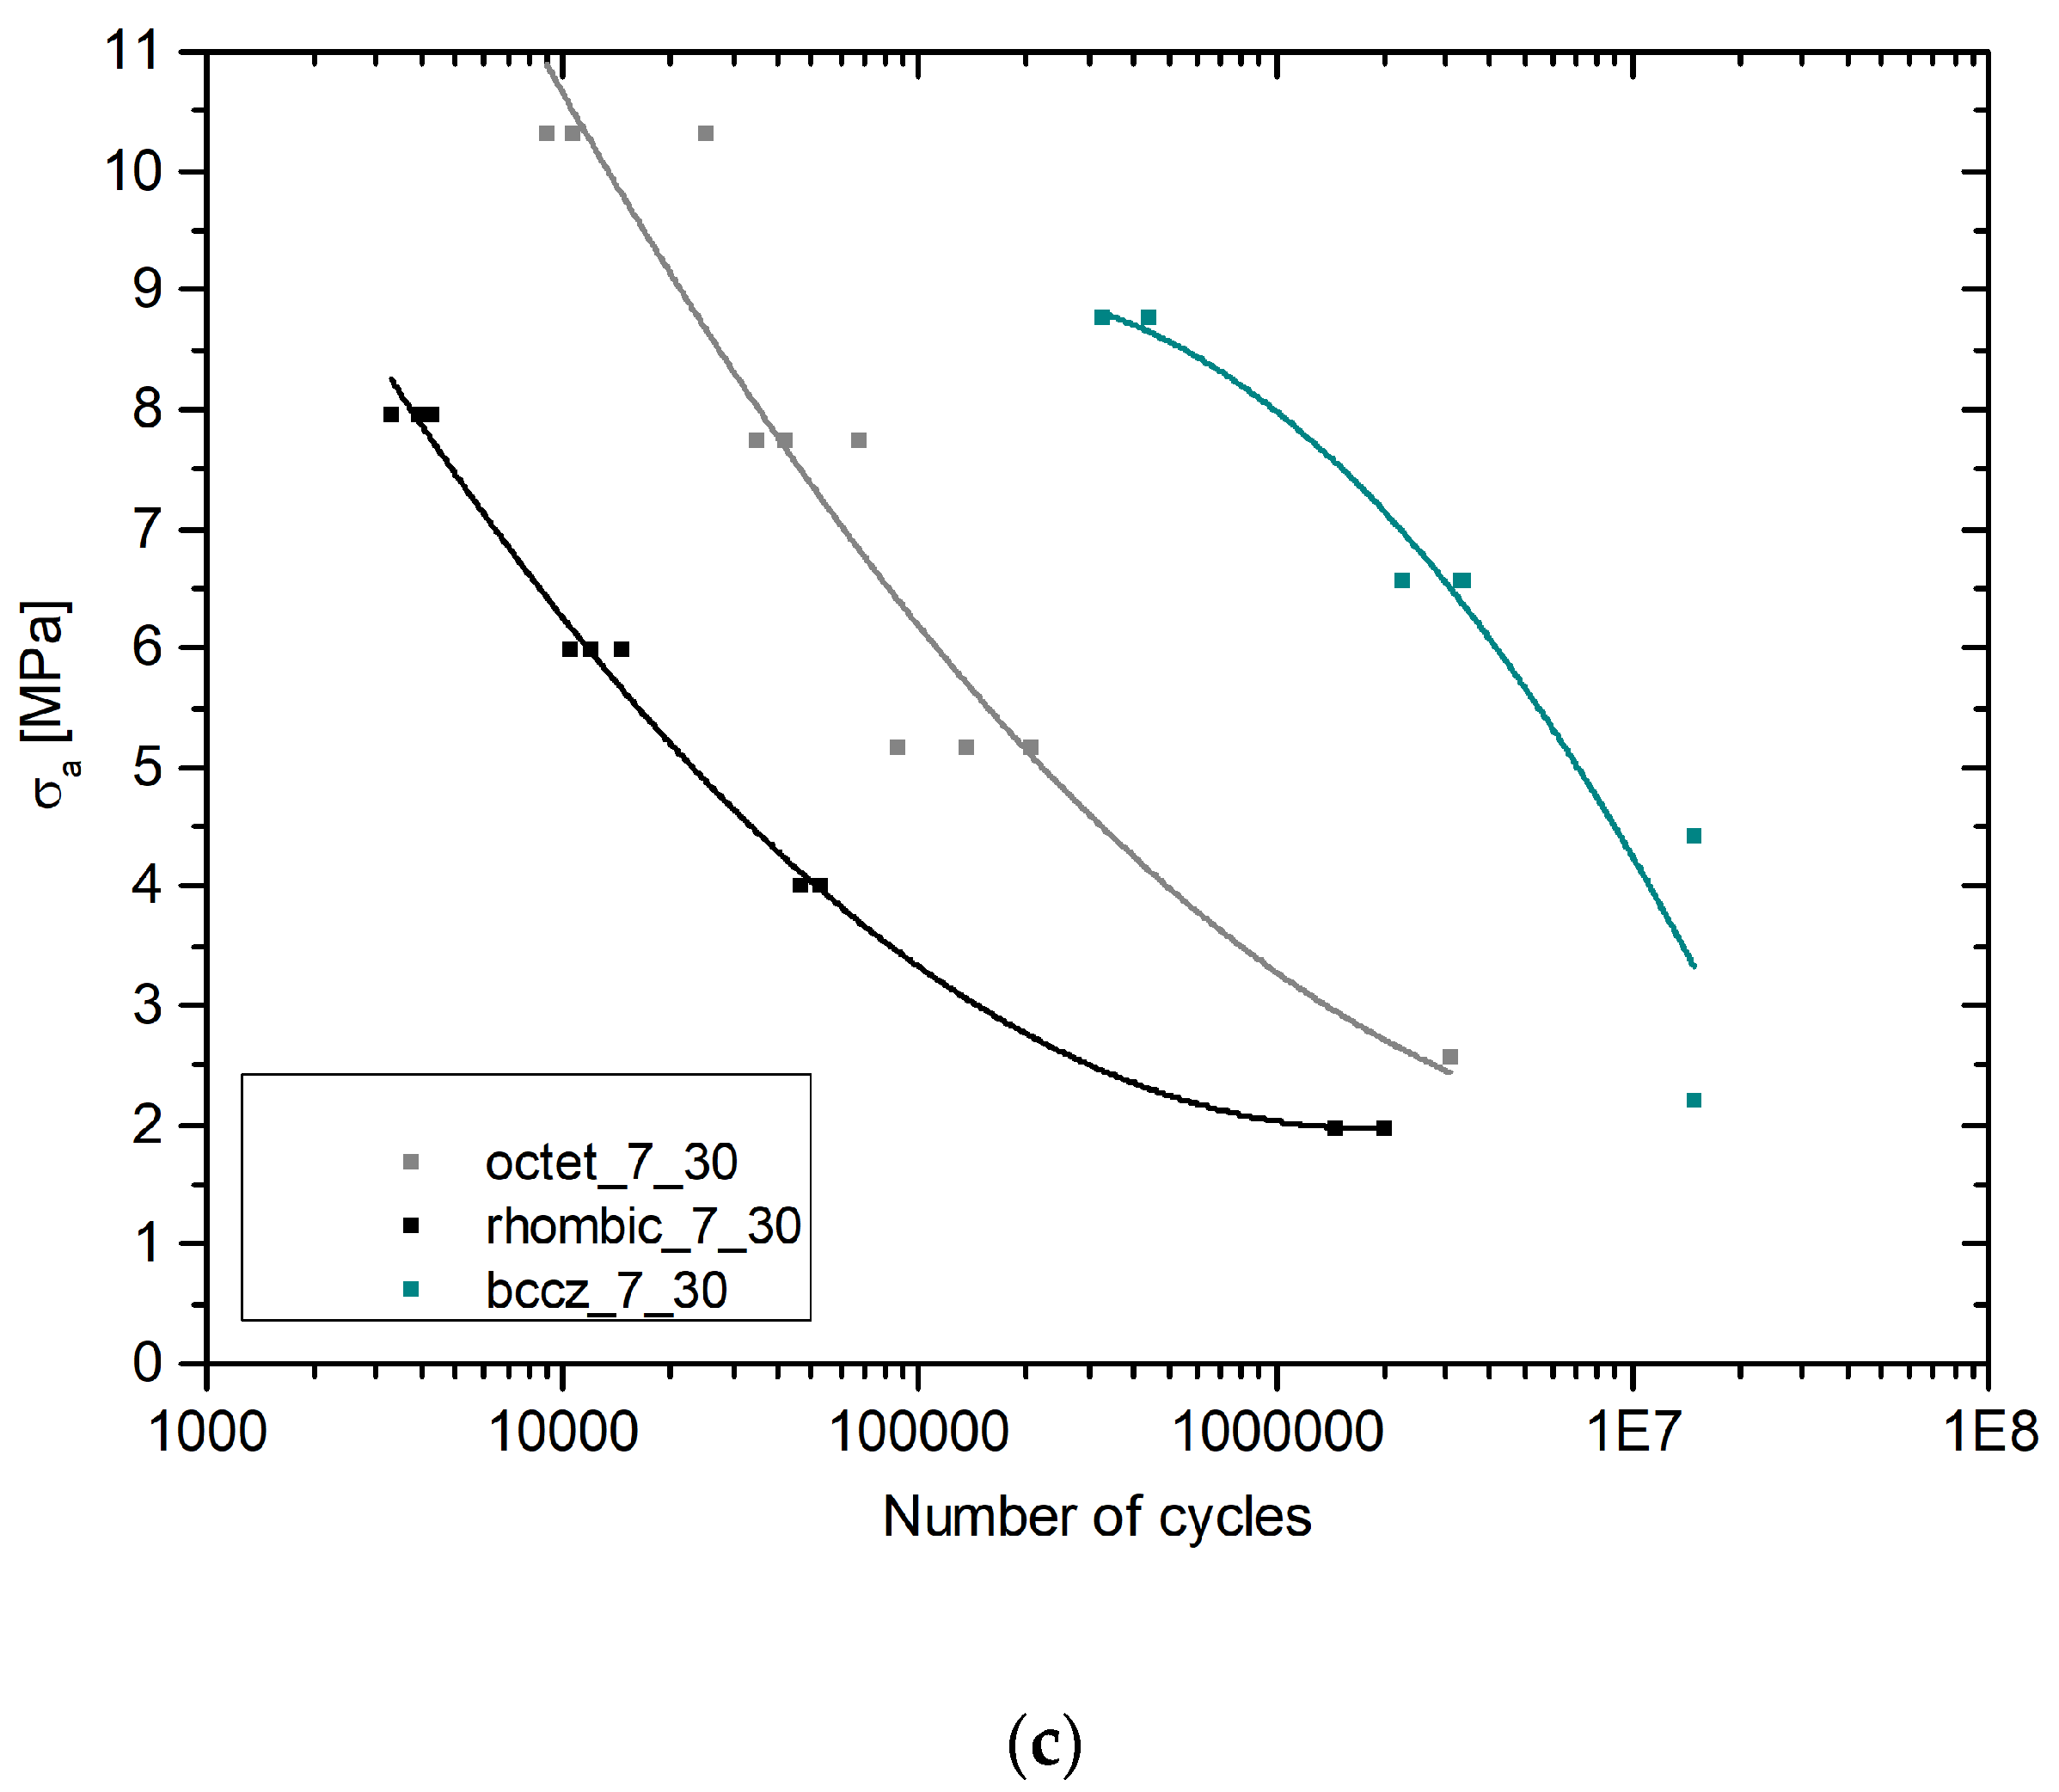
3.3. Bccz
4. Discussion
5. Conclusions
6. Patents
Author Contributions
Funding
Data Availability Statement
Conflicts of Interest
Appendix A

| Id Code | σM [MPa] | σm [MPa] | σa [MPa] | N |
|---|---|---|---|---|
| Bccz-5-25-1 | 12.6 | 1.26 | 5.67 | 10,178,091 |
| Bccz-5-25-2 | 12.6 | 1.26 | 5.67 | 12,441,038 |
| Bccz-5-25-3 | 12.6 | 1.26 | 5.67 | - |
| Bccz-5-25-4 | 9.4 | 0.94 | 4.23 | >15,000,000 |
| Bccz-5-25-5 | 9.4 | 0.94 | 4.23 | >15,000,000 |
| Bccz-5-25-6 | 9.4 | 0.94 | 4.23 | - |
| Bccz-5-25-7 | 6.3 | 0.63 | 2.84 | >15,000,000 |
| Bccz-5-25-8 | 6.3 | 0.63 | 2.84 | >15,000,000 |
| Bccz-5-25-9 | 6.3 | 0.63 | 2.84 | - |
| Bccz-5-25-10 | 3.1 | 0.31 | 1.40 | >15,000,000 |
| Bccz-5-25-11 | 3.1 | 0.31 | 1.40 | >15,000,000 |
| Bccz-5-25-12 | 3.1 | 0.31 | 1.40 | - |
| Bccz-5-30-1 | 20.3 | 2.03 | 9.14 | 654,563 |
| Bccz-5-30-2 | 20.3 | 2.03 | 9.14 | 762,810 |
| Bccz-5-30-3 | 20.3 | 2.03 | 9.14 | - |
| Bccz-5-30-4 | 15.2 | 1.52 | 6.84 | >15,000,000 |
| Bccz-5-30-5 | 15.2 | 1.52 | 6.84 | >15,000,000 |
| Bccz-5-30-6 | 15.2 | 1.52 | 6.84 | - |
| Bccz-5-30-7 | 10.2 | 1.02 | 4.59 | >15,000,000 |
| Bccz-5-30-8 | 10.2 | 1.02 | 4.59 | >15,000,000 |
| Bccz-5-30-9 | 10.2 | 1.02 | 4.59 | - |
| Bccz-5-30-10 | 5.1 | 0.51 | 2.30 | >15,000,000 |
| Bccz-5-30-11 | 5.1 | 0.51 | 2.30 | >15,000,000 |
| Bccz-5-30-12 | 5.1 | 0.51 | 2.30 | - |
| Bccz-7-30-1 | 19.5 | 1.95 | 8.78 | 326,837 |
| Bccz-7-30-2 | 19.5 | 1.95 | 8.78 | 440,166 |
| Bccz-7-30-3 | 19.5 | 1.95 | 8.78 | 326,161 |
| Bccz-7-30-4 | 14.6 | 1.46 | 6.57 | 3,362,847 |
| Bccz-7-30-5 | 14.6 | 1.46 | 6.57 | 3,331,678 |
| Bccz-7-30-6 | 14.6 | 1.46 | 6.57 | 2,249,586 |
| Bccz-7-30-7 | 9.8 | 0.98 | 4.41 | >15,000,000 |
| Bccz-7-30-8 | 9.8 | 0.98 | 4.41 | >15,000,000 |
| Bccz-7-30-9 | 9.8 | 0.98 | 4.41 | >15,000,000 |
| Bccz-7-30-10 | 4.9 | 0.49 | 2.21 | >15,000,000 |
| Bccz-7-30-11 | 4.9 | 0.49 | 2.21 | >15,000,000 |
| Bccz-7-30-12 | 4.9 | 0.49 | 2.21 | >15,000,000 |
| Id Code | σM [MPa] | σm [MPa] | σa [MPa] | N |
|---|---|---|---|---|
| Rhom-5-25-1 | 12.1 | 1.21 | 5.45 | 9044 |
| Rhom-5-25-2 | 12.1 | 1.21 | 5.45 | 6480 |
| Rhom-5-25-3 | 12.1 | 1.21 | 5.45 | - |
| Rhom-5-25-4 | 9 | 0.9 | 4.05 | 45,544 |
| Rhom-5-25-5 | 9 | 0.9 | 4.05 | 45,031 |
| Rhom-5-25-6 | 9 | 0.9 | 4.05 | - |
| Rhom-5-25-7 | 6 | 0.6 | 2.70 | 291,522 |
| Rhom-5-25-8 | 6 | 0.6 | 2.70 | 274,062 |
| Rhom-5-25-9 | 6 | 0.6 | 2.70 | - |
| Rhom-5-25-10 | 3 | 0.3 | 1.35 | >15,000,000 |
| Rhom-5-25-11 | 3 | 0.3 | 1.35 | >15,000,000 |
| Rhom-5-25-12 | 3 | 0.3 | 1.35 | - |
| Rhom-5-30-1 | 17.1 | 1.71 | 7.70 | 12,100 |
| Rhom-5-30-2 | 17.1 | 1.71 | 7.70 | 10,947 |
| Rhom-5-30-3 | 17.1 | 1.71 | 7.70 | - |
| Rhom-5-30-4 | 12.8 | 1.28 | 5.76 | 47,132 |
| Rhom-5-30-5 | 12.8 | 1.28 | 5.76 | 26,329 |
| Rhom-5-30-6 | 12.8 | 1.28 | 5.76 | - |
| Rhom-5-30-7 | 8.6 | 0.86 | 3.87 | 327,084 |
| Rhom-5-30-8 | 8.6 | 0.86 | 3.87 | 307,454 |
| Rhom-5-30-9 | 8.6 | 0.86 | 3.87 | - |
| Rhom-5-30-10 | 4.3 | 0.43 | 1.94 | >15,000,000 |
| Rhom-5-30-11 | 4.3 | 0.43 | 1.94 | 3,755,825 |
| Rhom-5-30-12 | 4.3 | 0.43 | 1.94 | - |
| Rhom-7-30-1 | 17.7 | 1.77 | 7.97 | 4281 |
| Rhom-7-30-2 | 17.7 | 1.77 | 7.97 | 3281 |
| Rhom-7-30-3 | 17.7 | 1.77 | 7.97 | 3970 |
| Rhom-7-30-4 | 13.3 | 1.33 | 5.99 | 14,484 |
| Rhom-7-30-5 | 13.3 | 1.33 | 5.99 | 12,010 |
| Rhom-7-30-6 | 13.3 | 1.33 | 5.99 | 10,550 |
| Rhom-7-30-7 | 8.9 | 0.89 | 4.01 | 53,097 |
| Rhom-7-30-8 | 8.9 | 0.89 | 4.01 | 46,449 |
| Rhom-7-30-9 | 8.9 | 0.89 | 4.01 | 46,723 |
| Rhom-7-30-10 | 4.4 | 0.44 | 1.98 | 1,471,143 |
| Rhom-7-30-11 | 4.4 | 0.44 | 1.98 | 2,004,674 |
| Rhom-7-30-12 | 4.4 | 0.44 | 1.98 | - |
| Id Code | σM [MPa] | σm [MPa] | σa [MPa] | N |
|---|---|---|---|---|
| Oct-5-25-1 | 18.5 | 1.85 | 8.33 | 18,568 |
| Oct-5-25-2 | 18.5 | 1.85 | 8.33 | 36,394 |
| Oct-5-25-3 | 18.5 | 1.85 | 8.33 | - |
| Oct-5-25-4 | 13.9 | 1.39 | 6.26 | 128,641 |
| Oct-5-25-5 | 13.9 | 1.39 | 6.26 | 151,236 |
| Oct-5-25-6 | 13.9 | 1.39 | 6.26 | - |
| Oct-5-25-7 | 9.3 | 0.93 | 4.19 | 971,841 |
| Oct-5-25-8 | 9.3 | 0.93 | 4.19 | 1,119,612 |
| Oct-5-25-9 | 9.3 | 0.93 | 4.19 | - |
| Oct-5-25-10 | 4.6 | 0.46 | 2.07 | >15,000,000 |
| Oct-5-25-11 | 4.6 | 0.46 | 2.07 | 15,000,000 |
| Oct-5-25-12 | 4.6 | 0.46 | 2.07 | - |
| Oct-5-30-1 | 22.7 | 2.27 | 10.22 | 64,099 |
| Oct-5-30-2 | 22.7 | 2.27 | 10.22 | 52,684 |
| Oct-5-30-3 | 22.7 | 2.27 | 10.22 | - |
| Oct-5-30-4 | 17 | 1.7 | 7.65 | 239,878 |
| Oct-5-30-5 | 17 | 1.7 | 7.65 | 234,151 |
| Oct-5-30-6 | 17 | 1.7 | 7.65 | - |
| Oct-5-30-7 | 11.3 | 1.13 | 5.09 | 880,174 |
| Oct-5-30-8 | 11.3 | 1.13 | 5.09 | 645,908 |
| Oct-5-30-9 | 11.3 | 1.13 | 5.09 | - |
| Oct-5-30-10 | 5.7 | 0.57 | 2.57 | >15,000,000 |
| Oct-5-30-11 | 5.7 | 0.57 | 2.57 | >15,000,000 |
| Oct-5-30-12 | 5.7 | 0.57 | 2.57 | - |
| Oct-7-30-1 | 22.9 | 2.29 | 10.31 | 10,607 |
| Oct-7-30-2 | 22.9 | 2.29 | 10.31 | 9009 |
| Oct-7-30-3 | 22.9 | 2.29 | 10.31 | 25,343 |
| Oct-7-30-4 | 17.2 | 1.72 | 7.74 | 42,201 |
| Oct-7-30-5 | 17.2 | 1.72 | 7.74 | 68,178 |
| Oct-7-30-6 | 17.2 | 1.72 | 7.74 | 35,084 |
| Oct-7-30-7 | 11.5 | 1.15 | 5.18 | 136,536 |
| Oct-7-30-8 | 11.5 | 1.15 | 5.18 | 86,464 |
| Oct-7-30-9 | 11.5 | 1.15 | 5.18 | 204,722 |
| Oct-7-30-10 | 5.7 | 0.57 | 2.57 | 3,108,586 |
| Oct-7-30-11 | 5.7 | 0.57 | 2.57 | - |
| Oct-7-30-12 | 5.7 | 0.57 | 2.57 | - |
Appendix B


Appendix C


References
- Ferro, C.; Grassi, R.; Seclì, C.; Maggiore, P. Additive Manufacturing Offers New Opportunities in UAV Research. Procedia CIRP 2016, 41, 1004–1010. [Google Scholar] [CrossRef]
- Stornelli, G.; Gaggia, D.; Rallini, M.; Di Schino, A. Heat Treatment Effect on Maraging Steel Manufactured by Laser Powder Bed Fusion Technology: Microstructure and Mechanical Properties. Acta Metall. Slovaca 2021, 27, 122–126. [Google Scholar] [CrossRef]
- Benedetti, M.; du Plessis, A.; Ritchie, R.; Dallago, M.; Razavi, S.; Berto, F. Architected cellular materials: A review on their mechanical properties towards fatigue-tolerant design and fabrication. Mater. Sci. Eng. R Rep. 2021, 144, 100606. [Google Scholar] [CrossRef]
- Blakey-Milner, B.; Gradl, P.; Snedden, G.; Brooks, M.; Pitot, J.; Lopez, E.; Leary, M.; Berto, F.; du Plessis, A. Metal additive manufacturing in aerospace: A review. Mater. Des. 2021, 209, 110008. [Google Scholar] [CrossRef]
- Korkmaz, M.E.; Gupta, M.K.; Robak, G.; Moj, K.; Krolczyk, G.M.; Kuntoğlu, M. Development of lattice structure with selective laser melting process: A state of the art on properties, future trends and challenges. J. Manuf. Process. 2022, 81, 1040–1063. [Google Scholar] [CrossRef]
- Cao, Y.; Tan, W.; Wu, Z. Aircraft icing: An ongoing threat to aviation safety. Aerosp. Sci. Technol. 2018, 75, 353–385. [Google Scholar] [CrossRef]
- Ferro, C.G.; Varetti, S.; Maggiore, P.; Lombardi, M.; Biamino, S.; Manfredi, D.; Calignano, F. Design and characterization of trabecular structures for an anti-icing sandwich panel produced by additive manufacturing. J. Sandw. Struct. Mater. 2020, 22, 1111–1131. [Google Scholar] [CrossRef]
- Maggiore, P.; Vitti, F.; Ferro, C.G.; Sara, V. Thermal Anti Ice System Integrated in the Structure and Method for Its Fabrication. U.S. Patent 102016000098196, 2016. [Google Scholar]
- Goraj, Z. An Overview of the Deicing and Anti-Icing Technologies with Prospects for the Future. In Proceedings of the 24th International Congress of the Aeronautical Sciences, Yokohama, Japan, 29 August–3 September 2004. [Google Scholar]
- Pellissier, M.P.C.; Habashi, W.G.; Pueyo, A. Optimization via FENSAP-ICE of aircraft hot-air anti-icing systems. J. Aircr. 2011, 48, 265–276. [Google Scholar] [CrossRef]
- Al-Khalil, K.M.; Keith, T.G.; DeWitt, K.J.; Nathman, J.K.; Dietrich, D.A. Thermal analysis of engine inlet anti-icing systems. J. Propuls. Power 1990, 6, 628–634. [Google Scholar] [CrossRef]
- Papadakis, M.; Wong, S.-H.; Yeong, H.-W.; Vu, G. Icing Tunnel Experiments with a Hot Air Anti-Icing System. In Proceedings of the 46th AIAA Aerospace Sciences Meeting and Exhibit, Reno, NV, USA, 7–10 January 2008. [Google Scholar] [CrossRef]
- Morency, F.; Tezok, F.; Paraschivoiu, I. Heat and mass transfer in the case of anti-icing system simulation. J. Aircr. 2000, 37, 245–252. [Google Scholar] [CrossRef]
- Manogharan, G. Analysis of Non-Stochastic Lattice Structure Design for Heat Exchanger; NC State University: Raleigh, NC, USA, 2009. [Google Scholar]
- Tancogne-Dejean, T.; Spierings, A.B.; Mohr, D. Additively-manufactured metallic micro-lattice materials for high specific energy absorption under static and dynamic loading. Acta Mater. 2016, 116, 14–28. [Google Scholar] [CrossRef]
- Hao, L.; Raymont, D.; Yan, C.; Hussein, A.; Young, P. Design and Additive Manufacturing of Cellular Lattice Structures. In Proceedings of the The International Conference on Advanced Research in Virtual and Rapid Prototyping (VRAP), Leiria, Portugal, 28 September–1 October 2011; pp. 249–254. [Google Scholar] [CrossRef]
- Zargarian, A.; Esfahanian, M.; Kadkhodapour, J.; Ziaei-Rad, S.; Zamani, D. On the fatigue behavior of additive manufactured lattice structures. Theor. Appl. Fract. Mech. 2019, 100, 225–232. [Google Scholar] [CrossRef]
- Burr, A.; Persenot, T.; Doutre, P.-T.; Buffiere, J.-Y.; Lhuissier, P.; Martin, G.; Dendievel, R. A numerical framework to predict the fatigue life of lattice structures built by additive manufacturing. Int. J. Fatigue 2020, 139, 105769. [Google Scholar] [CrossRef]
- Agenbag, N.; McDuling, C. Fatigue Life Testing of Locally Additive Manufactured AlSilOMg Test Specimens. R&D J. 2021, 37, 19–25. [Google Scholar] [CrossRef]
- Tommasi, A.; Maillol, N.; Bertinetti, A.; Penchev, P.; Bajolet, J.; Gili, F.; Pullini, D.; Mataix, D.B. Influence of surface preparation and heat treatment on mechanical behavior of hybrid aluminum parts manufactured by a combination of laser powder bed fusion and conventional manufacturing processes. Metals 2021, 11, 522. [Google Scholar] [CrossRef]
- Bici, M.; Brischetto, S.; Campana, F.; Ferro, C.G.; Seclì, C.; Varetti, S.; Maggiore, P.; Mazza, A. Development of a multifunctional panel for aerospace use through SLM additive manufacturing. Procedia CIRP 2018, 67, 215–220. [Google Scholar] [CrossRef]
- Yan, C.; Hao, L.; Hussein, A.; Bubb, S.L.; Young, P.; Raymont, D. Evaluation of light-weight AlSi10Mg periodic cellular lattice structures fabricated via direct metal laser sintering. J. Mater. Process. Technol. 2014, 214, 856–864. [Google Scholar] [CrossRef]
- Perello, M. Numerical Simulation and Experimental Validation of Lattice Structures for an Innovative Anti-Ice Leading Edge. 2018. Available online: http://webthesis.biblio.polito.it/id/eprint/9219 (accessed on 1 March 2023).
- Hussein, A.; Hao, L.; Yan, C.; Everson, R.; Young, P. Advanced lattice support structures for metal additive manufacturing. J. Mater. Process. Technol. 2013, 213, 1019–1026. [Google Scholar] [CrossRef]
- Maconachie, T.; Leary, M.; Lozanovski, B.; Zhang, X.; Qian, M.; Faruque, O.; Brandt, M. SLM lattice structures: Properties, performance, applications and challenges. Mater. Des. 2019, 183, 108137. [Google Scholar] [CrossRef]
- du Plessis, A.; Razavi, S.M.J.; Benedetti, M.; Murchio, S.; Leary, M.; Watson, M.; Bhate, D.; Berto, F. Properties and applications of additively manufactured metallic cellular materials: A review. Prog. Mater. Sci. 2022, 125, 10918. [Google Scholar] [CrossRef]
- Seharing, A.; Azman, A.H.; Abdullah, S. A review on integration of lightweight gradient lattice structures in additive manufacturing parts. Adv. Mech. Eng. 2020, 12, 1687814020916951. [Google Scholar] [CrossRef]
- Mahmoud, D.; Elbestawi, M.A. Elbestawi, Lattice structures and functionally graded materials applications in additive manufacturing of orthopedic implants: A review. J. Manuf. Mater. Process. 2017, 1, 13. [Google Scholar] [CrossRef]
- Muhammad, M.; Nezhadfar, P.; Thompson, S.; Saharan, A.; Phan, N.; Shamsaei, N. A comparative investigation on the microstructure and mechanical properties of additively manufactured aluminum alloys. Int. J. Fatigue 2021, 146, 106165. [Google Scholar] [CrossRef]
- Ferro, C.G.; Varetti, S.; Vitti, F.; Maggiore, P.; Lombardi, M.; Biamino, S.; Manfredi, D.; Calignano, F. A robust multifunctional sandwich panel design with trabecular structures by the use ofadditive manufacturing technology for a new de-icing system. Technologies 2017, 5, 35. [Google Scholar] [CrossRef]
- Zilio, C.; Patricelli, L. Aircraft anti-ice system: Evaluation of system performance with a new time dependent mathematical model. Appl. Therm. Eng. 2014, 63, 40–51. [Google Scholar] [CrossRef]
- Montgomery, D.C. Design and Analysis of Experiments; John Wiley & Sons, Inc.: Scottsdale, AZ, USA, 2019; p. 684. [Google Scholar]
- Lambert, D.; Adler, M. IN718 Additive Manufacturing Properties and Influences. In Proceedings of the JANNAF Propulsion Meeting, Nashville, TN, USA, 1–4 June 2014. [Google Scholar]
- McCullough, K.Y.G.; Fleck, N.A.; Ashby, M.F. Stress-life fatigue behaviour of aluminum alloy foams. Fatigue Fract. Eng. Mater. Struct. 2000, 23, 199–208. [Google Scholar] [CrossRef]
- Zhao, S.; Li, S.; Hou, W.; Hao, Y.; Yang, R.; Misra, R. The influence of cell morphology on the compressive fatigue behavior of Ti-6Al-4V meshes fabricated by electron beam melting. J. Mech. Behav. Biomed. Mater. 2016, 59, 251–264. [Google Scholar] [CrossRef] [PubMed]
- Zenkert, D.; Burman, M. Tension, compression and shear fatigue of a closed cell polymer foam. Compos. Sci. Technol. 2009, 69, 785–792. [Google Scholar] [CrossRef]
- Zhai, Y.; Galarraga, H.; Lados, D.A. Microstructure, static properties, and fatigue crack growth mechanisms in Ti-6Al-4V fabricated by additive manufacturing: LENS and EBM. Eng. Fail. Anal. 2016, 69, 3–14. [Google Scholar] [CrossRef]
- Varetti, S. Study and Development of an Innovative L-PBF Demonstrator and an Anti-Ice Solution Based on Trabecular Structures; Politecnico di Torino: Turin, Italy, 2020. [Google Scholar]
- Lazzeri, R. A comparison between safe life, damage tolerance and probabilistic approaches to aircraft structure fatigue design. Aerotec. Missili Spaz. 2002, 81. [Google Scholar]
- Li, Y.; Pavier, M.; Coules, H. Compressive fatigue characteristics of octet-truss lattices in different orientations. Mech. Adv. Mater. Struct. 2022, 29, 6390–6402. [Google Scholar] [CrossRef]
- Li, Y.; Pavier, M.; Coules, H. Experimental study on fatigue crack propagation of octet-truss lattice. Procedia Struct. Integr. 2021, 37, 41–48. [Google Scholar] [CrossRef]
- Ashby, M.F. The properties of foams and lattices. Philos. Trans. R. Soc. A Math. Phys. Eng. Sci. 2006, 364, 15–30. [Google Scholar] [CrossRef] [PubMed]


| Cell Type | Cell Size [mm] | Relative Density [%] |
|---|---|---|
| Bccz | 5 | 25 |
| Bccz | 5 | 30 |
| Bccz | 7 | 30 |
| Rhombic Dodecahedron | 5 | 25 |
| Rhombic Dodecahedron | 5 | 30 |
| Rhombic Dodecahedron | 7 | 30 |
| Octet Truss | 5 | 25 |
| Octet Truss | 5 | 30 |
| Octet Truss | 7 | 30 |
Disclaimer/Publisher’s Note: The statements, opinions and data contained in all publications are solely those of the individual author(s) and contributor(s) and not of MDPI and/or the editor(s). MDPI and/or the editor(s) disclaim responsibility for any injury to people or property resulting from any ideas, methods, instructions or products referred to in the content. |
© 2023 by the authors. Licensee MDPI, Basel, Switzerland. This article is an open access article distributed under the terms and conditions of the Creative Commons Attribution (CC BY) license (https://creativecommons.org/licenses/by/4.0/).
Share and Cite
Ferro, C.G.; Varetti, S.; Maggiore, P. Experimental Evaluation of Fatigue Strength of AlSi10Mg Lattice Structures Fabricated by AM. Aerospace 2023, 10, 400. https://doi.org/10.3390/aerospace10050400
Ferro CG, Varetti S, Maggiore P. Experimental Evaluation of Fatigue Strength of AlSi10Mg Lattice Structures Fabricated by AM. Aerospace. 2023; 10(5):400. https://doi.org/10.3390/aerospace10050400
Chicago/Turabian StyleFerro, Carlo Giovanni, Sara Varetti, and Paolo Maggiore. 2023. "Experimental Evaluation of Fatigue Strength of AlSi10Mg Lattice Structures Fabricated by AM" Aerospace 10, no. 5: 400. https://doi.org/10.3390/aerospace10050400