Article

Decarbonised Future Regional Airport Infrastructure

1
Institute of Power Electronics, Friedrich-Alexander-Universität Erlangen-Nürnberg, 90429 Nuermberg, Germany
2
Rotterdam the Hague Innovation Airport, 3045 AP Rotterdam, The Netherlands
3
Department of Industrial Engineering, Universitá degli Studi di Napoli Federico II, 80138 Naples, Italy
4
Fraunhofer Institute for Integrated Systems and Device Technology IISB, 91058 Erlangen, Germany
5
SmartUp Engineering srl, 80123 Naples, Italy
6
Section for Quantitative Sustainability Assessment, Department of Environmental and Resource Engineering, Technical University of Denmark, 2800 Kongens Lyngby, Denmark
*
Author to whom correspondence should be addressed.
Aerospace 2023, 10(3), 283; https://doi.org/10.3390/aerospace10030283
Submission received: 23 February 2023 / Revised: 9 March 2023 / Accepted: 10 March 2023 / Published: 13 March 2023

Abstract

:
Sustainability and, especially, emission reductions are significant challenges for airports currently being addressed. The Clean Sky 2 project GENESIS addresses the environmental sustainability of hybrid-electric 50-passenger aircraft systems in a life cycle perspective to support the development of a technology roadmap for the transition to sustainable and competitive electric aircraft systems. This article originates from the GENESIS research and describes various options for ground power supply at a regional airport. Potential solutions for airport infrastructure with a short (2030), medium (2040) and long (2050) time horizon are proposed. This analysis includes estimating the future energy demand per day, month and year. In addition, the current flight plan based on conventional aircraft is adapted to the needs of a 50-PAX regional aircraft. Thus, this article provides an overview of the energy demand of a regional airport, divided into individual time horizons.

1. Introduction

Sustainability and reducing emissions are significant challenges for airports. Frankfurt airport will reduce CO2 emissions by around 65% until 2030 and operate in 2045 without any CO2 emissions. A total of 34% of the vehicles in the airport in Frankfurt are hybrid-electric or hydrogen-based. With this advantage, it was possible to reduce the CO2 emissions on this German airport by around 35% since 2010 [1]. Aircraft manufacturers such as Airbus plan to introduce hydrogen planes by 2035. With the code ZEROe (short for zero emissions), Airbus plans three types of passenger planes that rely on liquid hydrogen (LH2) as fuel [2]. Aircraft manufacturers have already initiated a transition to sustainable aviation, which the airports strive to follow. However, there are enormous challenges, such as the generation of hydrogen or electricity from renewable energies, to decarbonising the industry entirely. The electrification of aircraft systems raises the question of whether airports will be among the largest electricity consumers in our infrastructure in the future. At the small Corisco International Airport, Source [3] proposes the renewable energy generation of 307.42 MWh/year with an energy surplus of 41.30% by integrating wind turbines (WTs), photovoltaics and diesel generators. This integration will reduce annual greenhouse gas emissions on the island by 98.50% [4]. The Soekarno-Hatta Airport Railink Project is one of the projects the Indonesian government prioritizes to ensure reliable mass transport to and from Soekarno-Hatta International Airport [5,6]. In this study, the electricity demand for the operation of the Soekarno-Hatta airport railway is discussed and compared with the demand for the existing substation. The results of this study show that the substations will require a small amount of additional capacity. However, overall, the existing substations will remain reliable even though additional capacity will be required in 2030 to maintain the reliability of the electricity supply for two different services. According to the calculations, the cost of the additional capacity is USD 4.3 million. Electricity costs are estimated at USD 85,000 to 100,000/month for the first year, with 89 trips per day [6]. These examples show that both small and very large airports are currently investing heavily in electrification to drive the electrification of the entire aviation industry. The first simulations of energy supply technologies for a regional airport show that the energy demand of a regional airport with 13 gates will increase from 6 GWh to 22.53 GWh by operating 49 hybrid-electric aircraft per day [7]. As part of the Clean Sky 2 ENhanced electrical energy MAnagement (ENIGMA) project, a centralised smart supervisory control (CSS) with enhanced electrical energy management (E2-EM) capability was developed for an Iron Bird electrical power generation and distribution system (EPGDS) [8]. These projects show that this is a very current and important research topic.
The Rotterdam The Haque Airport (RTHA) is a subcontracting partner of the Clean Sky 2 GENESIS project (Gauging the ENvironmEntal Sustainability of electrIc and hybrid aircraft Systems) and seeks to change its infrastructure to adopt hybrid-electric aircraft (HEA). To accomplish this, RTHA plans to electrify around 70% of its aircraft traction fleet from 2030 onwards and aims to replace the remaining 30% with hydrogen-powered aircraft by 2050 [9]. Therefore, they must develop and adapt their ground power supply strategies to meet the demand for HEA (Hybrid-Electric-Aircraft) traffic. The study aims to determine the energy requirements for a regional airport’s operation and the expected emissions. This paper is framed in the context of GENESIS, which corresponds to the EU theme JTI-CS2-2020-CFP11-THT-13 under the Clean Sky 2 programme for Horizon 2020 and presents a forward-looking view focusing on the assessment of appropriate energy supply technologies for ground energy storage, grid connection and power transmission to aircraft. Based on these technologies, a flight plan and the design of a 50 PAX HEA developed in the project, the energy requirements for operations at a regional airport can be estimated [10]. The fuel types for HEA change depending on the time horizon. The energy demand of the developed HEA was used to classify the energy demand of a conventional aircraft (ATR 42 with a Pratt and Whitney PW127 engine). In the short-term (2025–2035) and medium-term (2035–2045), a direct comparison between kerosene and a mixture of kerosene and sustainable aviation fuels (SAF) can be made. This study also assumes that LH2 and a battery in the medium-term can power HEA. In the long-term (2045–2055+) horizon, hybrid-liquid–hydrogen aircraft are assumed exclusively. Based on the energy requirements of the aircraft, which were provided by two partners of the consortium UniNa (Università degli Studi di Napoli Federico II) and SmartUp Engineering, the flight plan and the number of take-offs and landings, the emissions can be estimated. In addition, a flight plan is being developed to replace conventional aircraft with HEA and thus enable more environmentally friendly air traffic. Table 1 provides the key figures of the conventional aircraft and HEA designed with GENESIS, with information on the amounts of fuel (kerosene, SAF and LH2) and battery energy consumed per kilometre. Results are presented in this table for two separate missions: a 600 nmi mission, which was used to size both conventional aircraft and HEA concepts, and a shorter 200 nmi mission, more representative of the typical mission for a regional turboprop aircraft.

2. Methodology

2.1. Supply Technologies under Consideration

The electrification of aircraft comes with immense stress to the airport’s electrical system due to the vastly increased power demand for charging airplanes. In addition, a mid-to-long-term infrastructure should aim to improve the airports’ entire energy system, including information technology (IT) and control systems, lighting, and general-use low voltage supply. Furthermore, building a hydrogen infrastructure with a new generation of tanks, pipelines, and supply possibilities to refuel the aircraft is also necessary. Instead of overhauling the existing system, the short-term (2025–2035) analysis will focus on an electrical grid whose sole purpose is to charge aircraft on the airfield. The medium-term (2035–2045) time perspective includes more fast-charging stations and the possibility of including a hydrogen infrastructure. As assessed for the regional airport, the needed hydrogen infrastructure onsite will provide only storage on wheels and tanks. The hydrogen production will be off-site in a nearby harbour. The components currently limiting the airport infrastructure and required to be installed and/or revised are (i) connection to the main grid, (ii) local photovoltaic supply, (iii) charger for aircraft, (iv) charger for airfield support vehicles, (v) local battery storage and (vi) local hydrogen storage.
Even with a local supply of electricity from the airside solar park and storage, the grid feed-in for an infrastructure capable of charging multiple aircraft and support vehicles will need to be connected to the medium-voltage grid (6 kV to 60 kV) due to the high-power demand. The distribution network on the airport premises should then be realised on a low-voltage level (or according to the low voltage directive 2014/35/EU) due to safety reasons. The AC (analog current)-concept utilises a common AC bus for the distribution system. It is a standard electrical installation, as it is common in most of the world [11].
Photovoltaic power generation, fuel cell technology, stationary battery storage, and mobile batteries in aircraft and escort vehicles are DC (direct current)-based by nature. A second concept links all components to a low-voltage DC grid (<1500 V). This DC grid must be rebuilt entirely at an airport [11]. This possibility is mentioned in this article for completeness but is not considered in more detail in the scenarios, as the RTHA airport operates with an AC-based grid. Section 2.1.1 and Section 2.1.2 briefly describe the type of supply voltage and the basic connection of a Fast-Charging-Station to the airport grid.

2.1.1. Voltage on the Grid

Compared with the DC-based method, the AC based approach benefits from being the currently established technology at the airport side. Therefore, a large selection of installation components is available, as are trained technical staff to work with standard grids. However, from a technical perspective, the DC approach has multiple benefits. For example, integrating additional battery storage units and photovoltaic systems is simplified by eliminating the AC/DC or DC/AC conversation stages for all DC-based devices. Therefore, fewer conversation stages are needed between local battery storage, photovoltaic generators, and consumers (e.g., DC chargers). In addition, a DC-based grid increases the system’s efficiency and decreases complexity. Furthermore, DC-connected systems are easier to control than AC-connected systems [11].
There is also an advantage when it comes to power distribution cables. An AC system uses a four-wire setup for the power distribution network. As such, the transported power results in Equation (1).
P A C = 3 · U p e a k · I e f f · cos ( φ )
with the effective current ( I e f f ), the peak voltage ( U p e a k ) and the power factor ( cos ( φ ) ). Using the same four-wire setup for a DC system with two wires used for positive and negative, the maximum current per wire matches the effective AC to not overload the conductor. For AC systems, the insulation rates for the peak voltage. As such, the nominal voltage in a DC system can be U p e a k , and the power in a four-wire DC system results in Equation (2).
P D C = 2 · U p e a k · I e f f
Comparing the DC and AC power results in Equation (3):
P D C P A C = 2 · U p e a k · I e f f 3 · U p e a k · I e f f · cos ( φ ) = 2 3 · cos ( φ )
Even with a power factor cos ( φ ) of 1, the same wire system can transport about 15% higher power using a DC system. Using the reciprocal reduces the required copper cross-section of the wiring system to approximately 85% for the same power. Despite the many advantages of a DC network, however, the AC network is considered in this study because, as already mentioned, the AC network is an established technology, trained specialists are available, and the airport is equipped with an AC network. However, developing a DC network could also become a key element in the future.

2.1.2. Fast-Charging-Stations

According to safety standards [12], galvanic isolation must be guaranteed between the main distribution 3-phase AC-grid and the charging station. This can either be realised by utilizing a low frequency (LF-) transformer or an isolating DC-DC converter (MF-transformer), which operates in the medium frequency (MF) range. These two possibilities are visualised in Figure 1 as “Topology 1” and “Topology 2”. Higher frequencies allow for lower material effort, and hence the size of the passive devices. Therefore, Topology 2 provides benefits over Topology 1 in the form of a less “bulky” transformer. However, a transformer connects the regional airport to the medium-voltage grid. Accordingly, “Topology 1” is considered in this study.

2.1.3. Hybrid-Electric-Aircraft Configurations

First, Figure 2 visualises an overview of a 50 PAX hybrid-electric aircraft with a gas turbine and battery as an energy source and the drivetrain’s arrangement, valid for two different reference entry-into-service (EIS) years 2030 and 2040 [10].
The propulsive architecture adopted for the short- and medium-term scenarios was based on a serial/parallel partial hybrid configuration with two distinct propulsive lines. This choice made it possible to use the distributed electric propulsion during the ground phases to increase the lifting capabilities of the aircraft, compensating for the increased mass due to the advanced powerplant. At cruise, in light of the lower efficiency of distributed propellers, delivering all the shaft power through the primary line is preferable, redirecting the energy from the electric storage. New secondary electric machines were designed based on nominal RPMs equal to 8000 since it was found that it is optimal to delegate to gearboxes the task of adapting the number of revolutions to that of the propellers. The specific fuel consumption reflects the usage of pure hydro-processed esters and fatty acids synthetic paraffinic kerosene (HEFA-SPK) as fuel [10].
The second HEA configuration deals with a Proton Exchange Membrane Fuel Cell and a battery (PEMFC + Battery). Figure 3 gives a short introduction and overview of the aircraft design and the arrangement of the components. The main difference concerning the Internal combustion engine (ICE) + Battery scenario is that there is only a single-drivetrain, referred to as primary in the present context, with five engines of equal power attached to each semi-wing. For this reason, the electric machines will generate thrust through the propeller for the aircraft in all phases of flight. Since there is no distinction between primary and secondary propulsion lines, the production costs, as well as the maintenance costs of the aircraft, would benefit from having installed electric machines all rated at the same power. The propulsive architecture with Proton Exchange Membrane Fuel Cell (PEMFC) is based on a full-electric configuration, where part of the electricity is produced directly by the fuel cells through the reaction of hydrogen with air. The atmospheric air is supposed to be supplied through suitable air intakes and compressed up to the operating pressure of the fuel cells using a centrifugal compressor. Based on the power and energy requirements, Li-S batteries were identified to be the best choice for this application.

2.1.4. Airport Infrastructure Scenarios

This paper is about the energy requirements of an airport for the operation of hybrid-electric aircraft, so only the most necessary supply technologies are briefly presented here. In principle, a Photovoltaic (PV) system, battery storage, wind power and an on-ground electrolyser/fuel cell also make sense to include in an airport network. However, this would go beyond the scope of this paper, which is therefore limited to the necessary components to describe the methodology, which applies to both presented scenarios in the following. Figure 4 shows possible airport infrastructure for a conventional fuel supply and fast-charging stations for the HEAs. This configuration is used with ICE + Battery HEA for the short-term and medium-term horizon. A 10 kV/400 V transformer connects the medium-voltage and 400 V AC airport grid. The left side of Figure 4 shows this connection to the medium-voltage grid. The AC/DC converters and DC/DC boost converters are connected to the airport AC grid, as described in simplified form in Section 2.1.2, to provide the necessary high charging currents. For the sake of simplicity, the regular 3-phase AC grid is shown here with a line for a better overview. In addition, the airport is connected to the AC grid as an electric load to supply the terminals, lightning, etc., with electric energy. Furthermore, charging possibilities for baggage cars, busses and other airport vehicles are connected to the airport. Finally, the lower part of Figure 4 shows the kerosene and SAF mixture ratio supply as fuel.
Figure 5 shows possible airport infrastructure for a LH2 and battery hybrid electric aircraft. This configuration is used for the medium-term and long-term horizon with PEMFC + Battery HEA. The connection to the medium voltage grid on the left side above is shown in Figure 5. The AC lines are shown with one single line similarly to Figure 4. Furthermore, the AC/DC and DC/DC boost converters for the fast charging stations are shown in the upper part of Figure 5. The hydrogen production for the airport hydrogen supply is done off-site at a port near the airport. Wind energy is converted into electrical energy. This electrical energy is converted into hydrogen via electrolysers and liquefied (i, ii). Trailer trucks transport liquid hydrogen to the airport, and the aircraft can be refuelled directly (iii). This process can be seen on the bottom right-hand side of Figure 5.

2.2. Scenario Definitions

This section introduces the individual scenarios for consideration at a regional airport of the future. These scenarios give an insight into which assumptions were made.
Based on the configurations and assumptions prepared by UNINA for the aircraft, these were further developed for the benefit of the regional airport. The flights of the HEA have been fitted into RTHA’s flight schedule based on the following assumptions formulated by UNINA. Due to the COVID-19 pandemic, a flight plan from 2019 was used because air traffic was not restricted in 2019. These data form the basis for the operation of the hybrid-electric aircraft in the scenarios of a regional airport of the future.
  • Analysis of the Air Traffic Data for 2019, collected from RTHA and elaborated to collect the necessary key figures;
  • The flight data from RTHA 2019 were used to select the flights relevant to the HEA: commercial flights with a destination with of maximum distance of 1111.2 km;
  • These data were used to replace the fossil flights with HEA with max 50 PAX and a maximum distance of 1111.2 km;
  • HEA flights replace fossil flights with 50 passengers or fewer, with a maximum of 50 passengers;
  • Two HEA flights replace fossil flights with more than 50 passengers but fewer than 100, with a maximum of 50 passengers;
  • Three HEA flights would replace a flight with more than 100 passengers but fewer than 150, with a maximum of 50 passengers each;
  • Four HEA flights would replace all other flights with more than 150 passengers.
To calculate the energy required, an extra 330 km is added to the distance of 1111.2 km for any possible calamities (holding/diversion, etc.). Partly in connection with this choice, the gradual transition of aviation will accelerate the introduction of smaller but environmentally friendly aircraft with smaller passenger capacity. This may mean that aircraft such as a Boeing 737 will eventually be replaced by 2–4 environmentally friendly aircraft with a capacity of 50 passengers, followed by hybrid/electric aircraft with 100–150 passengers. For the first period, this means a severe increase in aircraft and flight movements at the airport. This will also have a massive impact on the infrastructure and organisation at the airport, with the comment that this transition will be gradual to allow the airport to prepare for it. Airport infrastructure is geared to existing aircraft for take-off, landing, taxiing, refuelling, loading/unloading, etc. Thus, it will change when adopting other disruptive aircraft propulsive technologies. The future regional airport infrastructure design focuses on the HEA, suitable for 50 PAX with a flight range of 1111.2 km.
  • For 2025–2035, aircraft with combustion engines fuelled by 90% kerosene and 10% SAF and electric engines powered by batteries are assumed (ICE + Battery-2030). The SAF fuel will be HEFA (Hydroprocessed Esters and Fatty Acids), briefly explained in [13];
  • In 2035–2045, aircraft with combustion engines fuelled by 75% kerosene and 25% SAF and electric engines powered by batteries are assumed (ICE + Battery-2040). In addition, some flights will be replaced by HEA with electric engines and PEMFC powered by liquid hydrogen (PEMFC + Battery-2040);
  • In 2045–2055+, all HEA flights will use fuel cells and electric motors. There will be a further developed PEMFC (PEMFC + Battery-2050) installed.
In calculating the energy requirements in the different scenarios, a distinction has been made between typical mission (200 nmi) and design mission (600 nmi) flights. For all flights, the possibility of diversions, etc., corresponding to 330 additional km per flight has been included.

2.3. Emmisions

UNINA and SmartUp presented in [14] a general approach for emissions estimation, based on the results, produced with a gas turbine engine performance calculation tool, the semi-empirical approach illustrated in [15] and average data included in [16]. This emission model requires a manageable amount of input data: the engine’s overall pressure ratio, fuel flow rate, operating conditions and ambient conditions are the only information required. The output of this model consists of the emission indices (EIs) for the following species: nitrogen oxides (NOx), carbon monoxide (CO), hydrocarbons (HC), carbon dioxide (CO2), water vapor (H2O) and sulphur dioxide (SO2). For the EIs of CO2, H2O and SO2, constant average values listed in Table 2 were assumed.
It can be assumed that the approach adopted by UNINA and SmartUp can be considered reliable as long as the fuel is conventional jet fuel (i.e., Jet A-1). For this reason, in the case of HEFA-SPK blends, calibration factors to correct the EI of the above species were considered in [14]. Specifically:
  • A correction for CO2 EI as a function of HEFA-SPK mixtures has been established. According to [14], a reduction in CO2 EI of 0.78% can be obtained for 50% blends. For pure HEFA-SPK, the reduction doubles (−1.56%);
  • For the water vapor EI, a linear regression law was obtained for the percentage changes as a function of the HEFA-SPK mixing ratio. According to this law, an increase of 10% can be expected for pure HEFA-SPK [17];
  • For CO and SO2 EIs, linear regression laws were determined instead using the data collected by [18]. According to the equations obtained from these data, the use of pure HEFA-SPK could lead to a reduction of −22% in CO-EI and −74% in SO2-EI;
  • Finally, for NOx and HC-EIs, [18] suggests a negligible impact of biofuel blends. Consequently, no percentage changes were considered.
These deviations were all applied to the reference EI values calculated with the original approach established for conventional aviation fuel. With the help of these methods and estimates, the emission impact in the different scenarios can be estimated [14].

2.4. Economic Aspect

In addition to the environmental and conservation benefits, switching from fossil fuels to sustainably produced fuels is also financially attractive for airports, airlines and travellers. The results of several studies indicate a reduction in fuel costs ranging from 15% to 40%, depending on the study assumptions. The results of a recent Swedish study [19] show the total costs for routes and aircraft in Table 3 below in euros (EUR). Table 3 shows that costs increase with distance. Previous studies concluded that the operating costs of electric aircraft are between 30 and 40% lower. In contrast to the previous study, the table shows the difference between the conventional Jetstream JS31 (19 PAX) aircraft and the Swedish ES-19 (19PAX) aircraft. The difference is between 15 and 22% per route.
Combining the cost difference from Table 3 with other data from the literature in Table 4 and internal information from RTHA, costs can be estimated and determined for the HEA and are listed in Table 4.
Based on the fundamental literature research on the costs of the individual energy parameters and carbon tax for the HEA aircraft, an estimate can be made for future typical mission (200 nmi) and design mission (600 nmi) flights. For now, only the lower energy requirements for the different scenarios were used in these cost estimates. Fuel costs and landing fees account for 30% of the ticket price. For this reason, the fuel cost is calculated on the price per kilometre. Then, the fuel saving per kilometre can be calculated on an aircraft basis. Finally, ticket price savings can be calculated and stated on an aircraft basis, with 30% of the total ticket price.

3. Results

Section 3.1 and Section 3.2 will describe the procedure in the medium-term scenario in more detail. The approach to determining energy demand, emissions and ticket prices is similar for all time horizons. Therefore, the methodology described in Section 2 is carried out once here. However, the different aircraft configuration already indicated in 
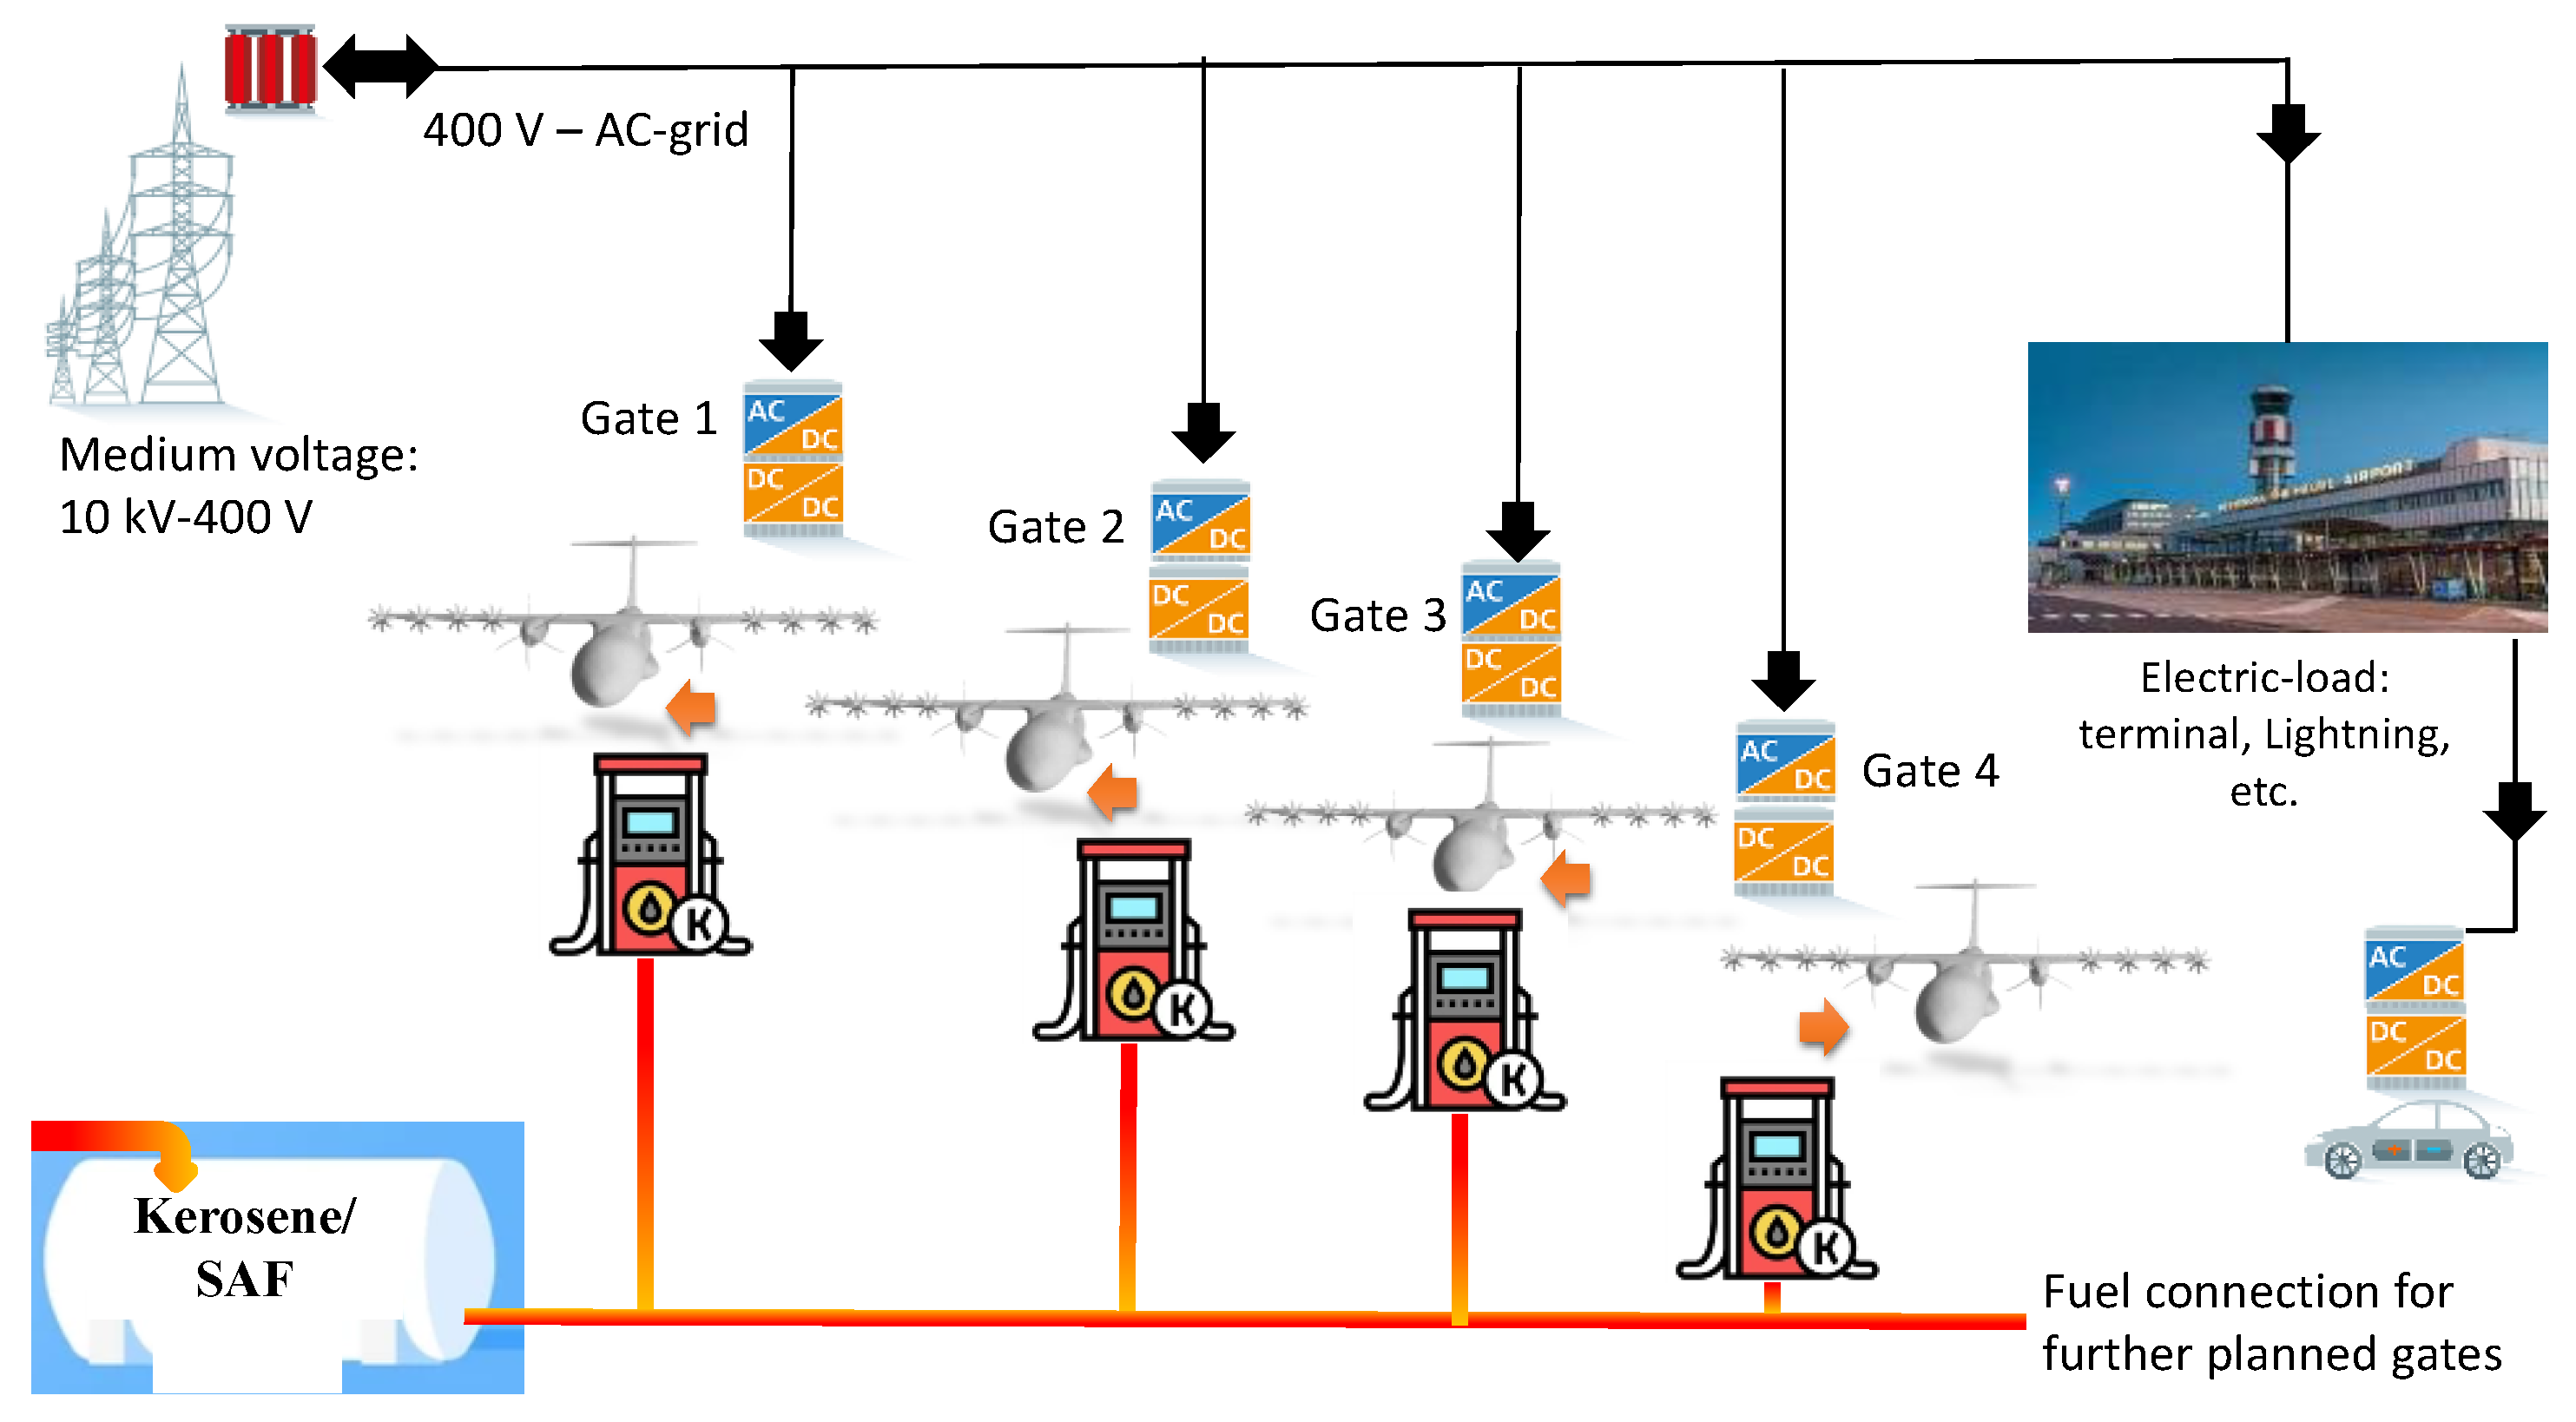
Table 1 was used. The fuel mix ratio in the medium-term (ICE + Battery) is 75% kerosene and 25% SAF, and the infrastructure is shown in Figure 4.
For the aircraft configuration PEMFC + Battery, the infrastructure was considered as in Figure 5. The results for an HEA with FC and battery are also described in Section 3.1 and Section 3.2. A PEMFC is used for the fuel cell technology. This allows a direct comparison between the operation of an ICE + Battery and a PEMFC + Battery HEA.

3.1. Determining Energy Demand ICE + Battery and PEMFC + Battery HEA

Based on information from the relevant commercial flight and the configuration of the HEA, an overview of the fuel requirements for the eligible flights was made. To determine the maximum fuel and electricity supplies, one of the busiest days was selected for flights up to 1111 km to the destination.
For the medium term, based on these assumptions, the amount of electricity which the HEA flights would potentially require on a busy day at a regional airport is reported in Table 5. The departure airport in this study is Rotterdam. Table 5 lists the destinations and the amount of kerosene, SAF and electrical energy or LH2 and electrical energy required for the HEA in parentheses. The electrical energy demand for ICE + Battery HEA is listed as “Electric ICE [kWh]”. The electrical energy demand for PEMFC + Battery HEA is listed as “Electric ICE [kWh]” in Table 5. These destinations are determined from the number of PAX and the distance, as already described in 
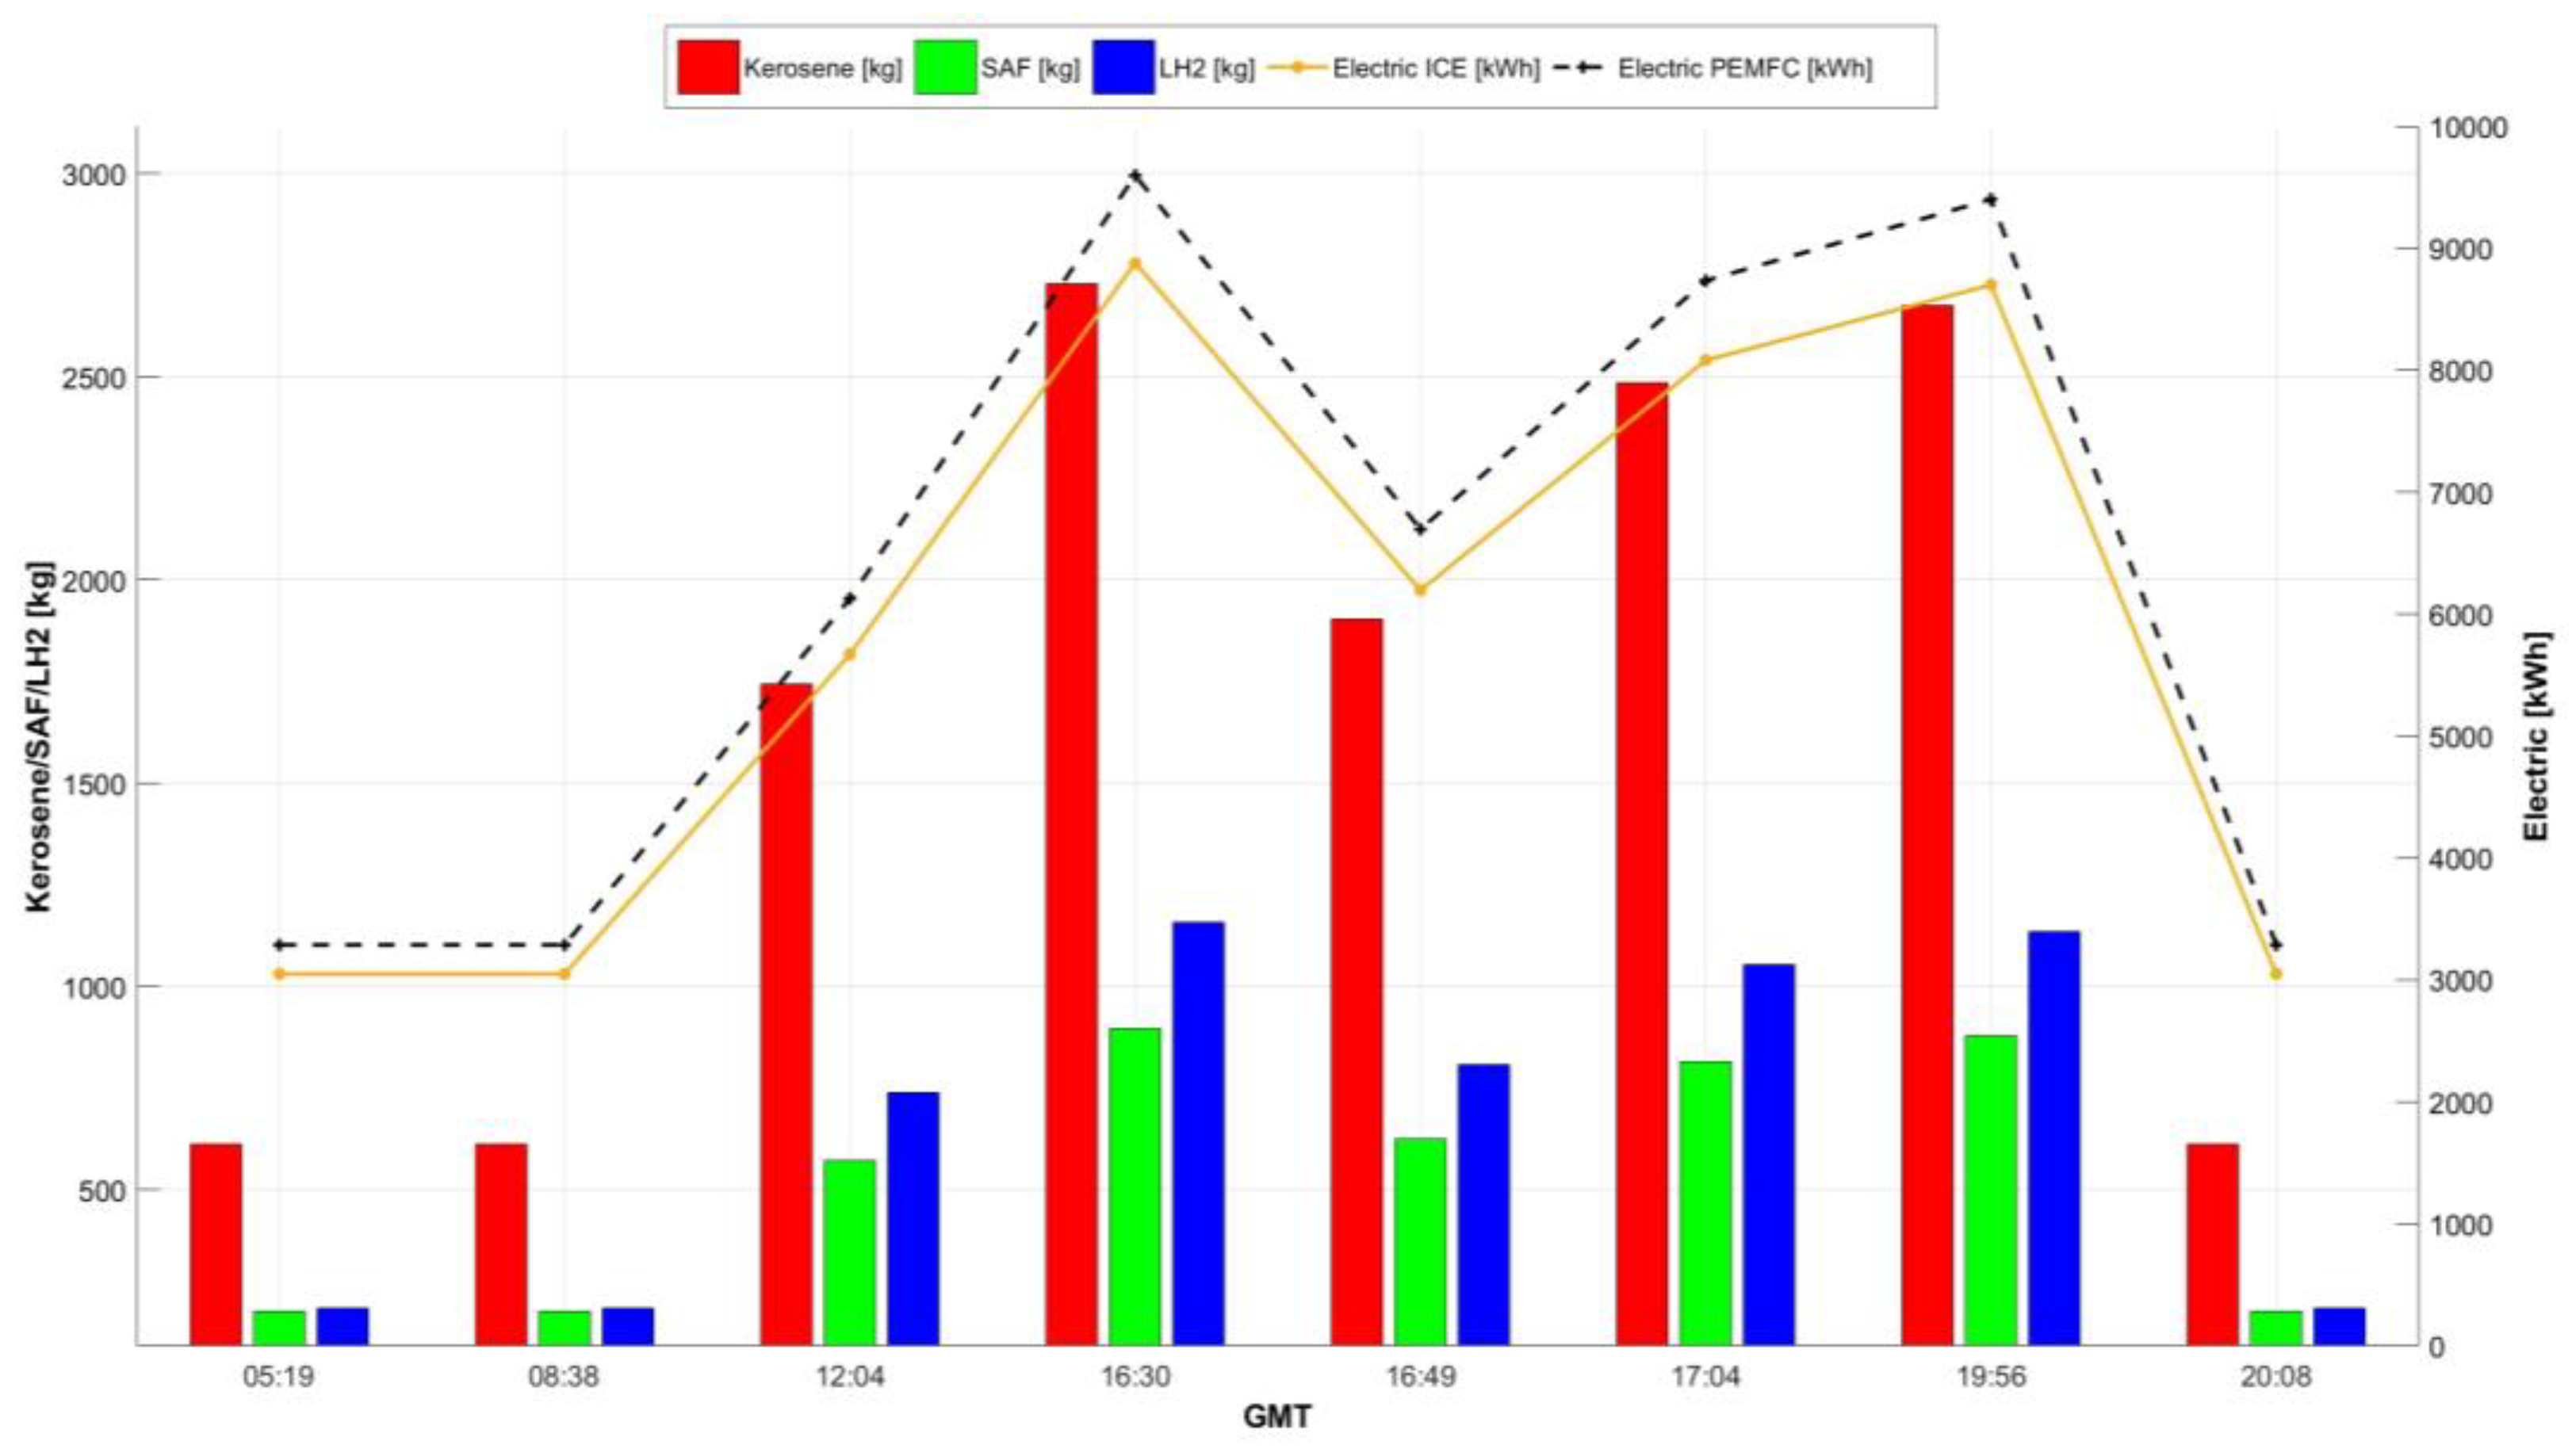
Section 2.3. It can be seen that several flights would have to take off at the same time. This is, of course, not possible, but it should serve here as an introduction to show the potential energy demand of the HEA. Energy consumption per flight is high in the morning and evening for the London destination and average for European flights. The total capacity required is highest in the late afternoon, shown in Figure 6. This high capacity is because three flights with many passengers depart in the afternoon. Figure 6 illustrates the high capacity of the period from 16:30 to 17:04. The initial calculations and simulations show that the short-term scenario requires a daily kerosene demand of 13.37 tonnes, an SAF demand of 4.39 tonnes and an electrical energy demand of 46.68 MWh (yellow line).
To compare the impact of LH2, based on the combination of information from the respective RTHA traffic flight and the configuration of the newly developed medium-term HEA with PMFC + Battery, an overview of the fuel requirements for the considered flights is shown in Table 5 as “LH2” and “Electric PEMFC”. Initial calculations and simulations show that the HEA in the medium-term scenario with PMFC + Battery no longer requires the daily kerosene demand of 23.5 tonnes (short-term) and 13.37 tonnes (medium-term-ICE + Battery). Similarly, the SAF demand of 2.55 tonnes (short-term) and 4.39 tonnes (medium-term-ICE + Battery) is no longer needed. Instead, a liquid hydrogen requirement of 5.523 tonnes is now determined to fuel the aircraft. In addition, the PEMFC + Battery medium-term HEA will be fitted with a battery of higher capacity and power, increasing the demand for electrical energy from 26.05 MWh (short-term) and 46.68 MWh (medium-term-ICE + Battery) to 50.425 MWh (black line).
In order to replace these flights with hybrid-electric flights, a new flight schedule with new departure times must be created. This new flight schedule is presented in Table 6. In this table, the old departure times of the original flight plan are listed again. New departure times are introduced in the column to the right with the destination abbreviation. These new departure times are based on the original time, and an average time of 10 min assumed between the departure times. These 10 min are for taxiing from the gate to the runway and subsequent take-off. The kerosene, SAF and electrical energy consumption of each HEA is given and composed of typical mission (200 nmi) and design mission (600 nmi) flights. The maximum number of passengers per flight is 50. The maximum range of the potential flights was kept below 1111.2 km to represent a realistic scenario.
As in the scenarios before, PEMFC + Battery HEA should replace conventional aircrafts in this medium-term scenario. These energy requirements are also listed in Table 6 on the right side as “LH2” and “Electric PEMFC”.
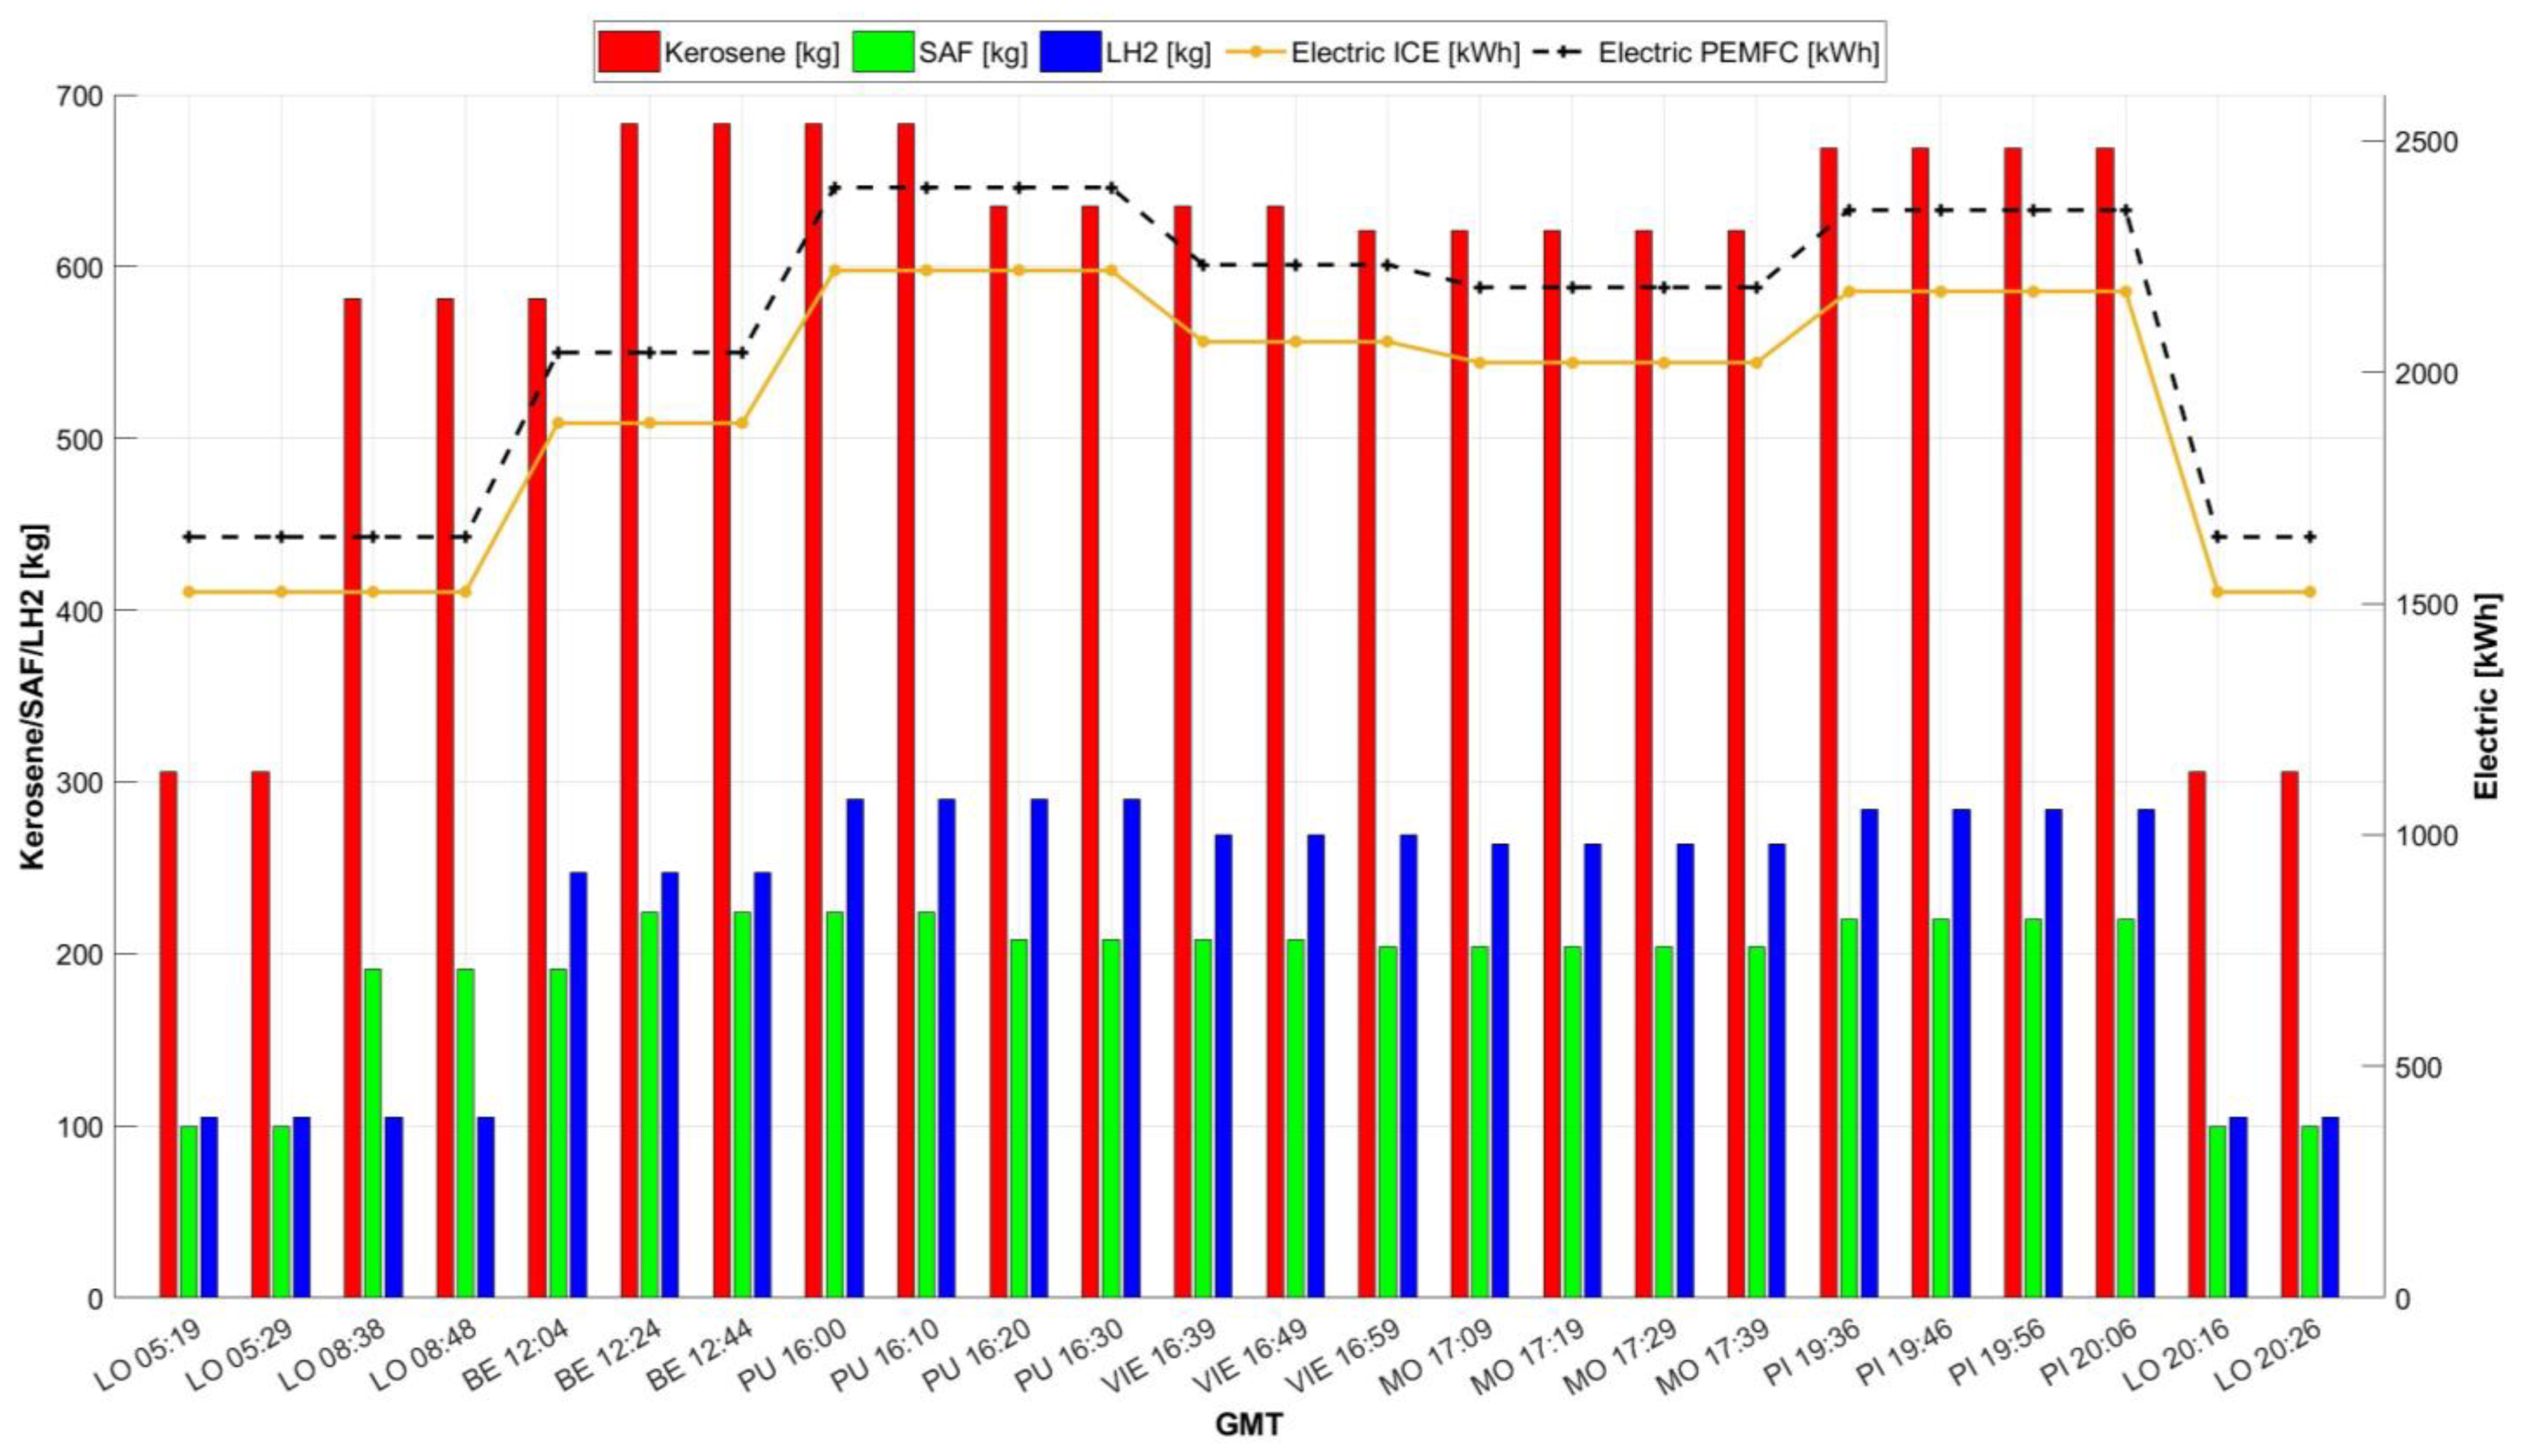
Figure 7 shows the new flight plan’s results and the energy required. It is apparent that in the early morning, for the flights to London (LO), 1525 kWh of electrical energy is required to charge the aircraft and refuel them for the flight. The kerosene quantity is 306 kg, and the SAF quantity is 100 kg, with the previously defined specifications of 75% kerosene and 25% SAF. The equalisation of the flights to Pula (PU), Vienna (VIE) and Montpellier (MO) show an electrical energy demand of 2220 kWh to 2021 kWh. The flight schedule was equalised, and the electrical energy required from 16:00 to 17:29. The kerosene/SAF requirement of a maximum of 683 kg/flight can also be easily provided. Four take-offs to Pisa (PI) are required in the evening, with an electrical energy quantity of 2175 kWh and a kerosene quantity of 669 kg/flight. As soon as the last flight at 20:26 to London has taken off with an electrical energy quantity of 1525 kWh and 306 kg of kerosene, the electrical energy consumption of the airport can be reduced again.
As in the scenarios before, the HEA’s kerosene, SAF and electrical energy consumption are now eliminated. Figure 7 shows the results of the new flight plan for required LH2 (blue) and electrical energy (black). Early morning flights to London (LO) require 1644 kWh of electrical energy in the medium term to recharge the aircraft and refuel for the flight. This is because a more powerful battery is installed in the PEMFC aircraft than in the previous time horizon. The liquid hydrogen quantity is 105 kg instead of the paraffin quantities of 306 kg (medium-term) and 557 kg (short-term). The reconciliation of the flights to Pula (PU), Vienna (VIE) and Montpellier (MO) resulted in an electrical energy demand of 2399 kWh to 2184 kWh, which is significantly higher than in the previous scenarios, as expected. The flight schedule was adjusted, and electrical energy is required from 16:00 to 17:29. The kerosene/SAF requirement of a maximum of 1191 kg/flight in the short term and a maximum of 683 kg/flight (medium-term) is now also omitted here. A maximum of 290 kg of liquid hydrogen is required for the flight to Pula. Four take-offs to Pisa (PI) are required in the evening, with an electrical energy quantity of 2351 kWh. The paraffin amounts of 1167 kg/flight in the short-term horizon and 669 kg/flight in the medium horizon with ICE + Battery are omitted, and 284 kg liquid hydrogen per flight is required. Once the last flight has taken off at 20:26 to London with an electrical energy quantity of 1644 kWh and 105 kg of liquid hydrogen, the electrical energy consumption of the airport can be reduced again. In the long term, storing electrical energy not needed in large batteries or converting it into liquid hydrogen can be considered.
Finally, the annual energy demand for the short-term scenario is given in Table 7. 
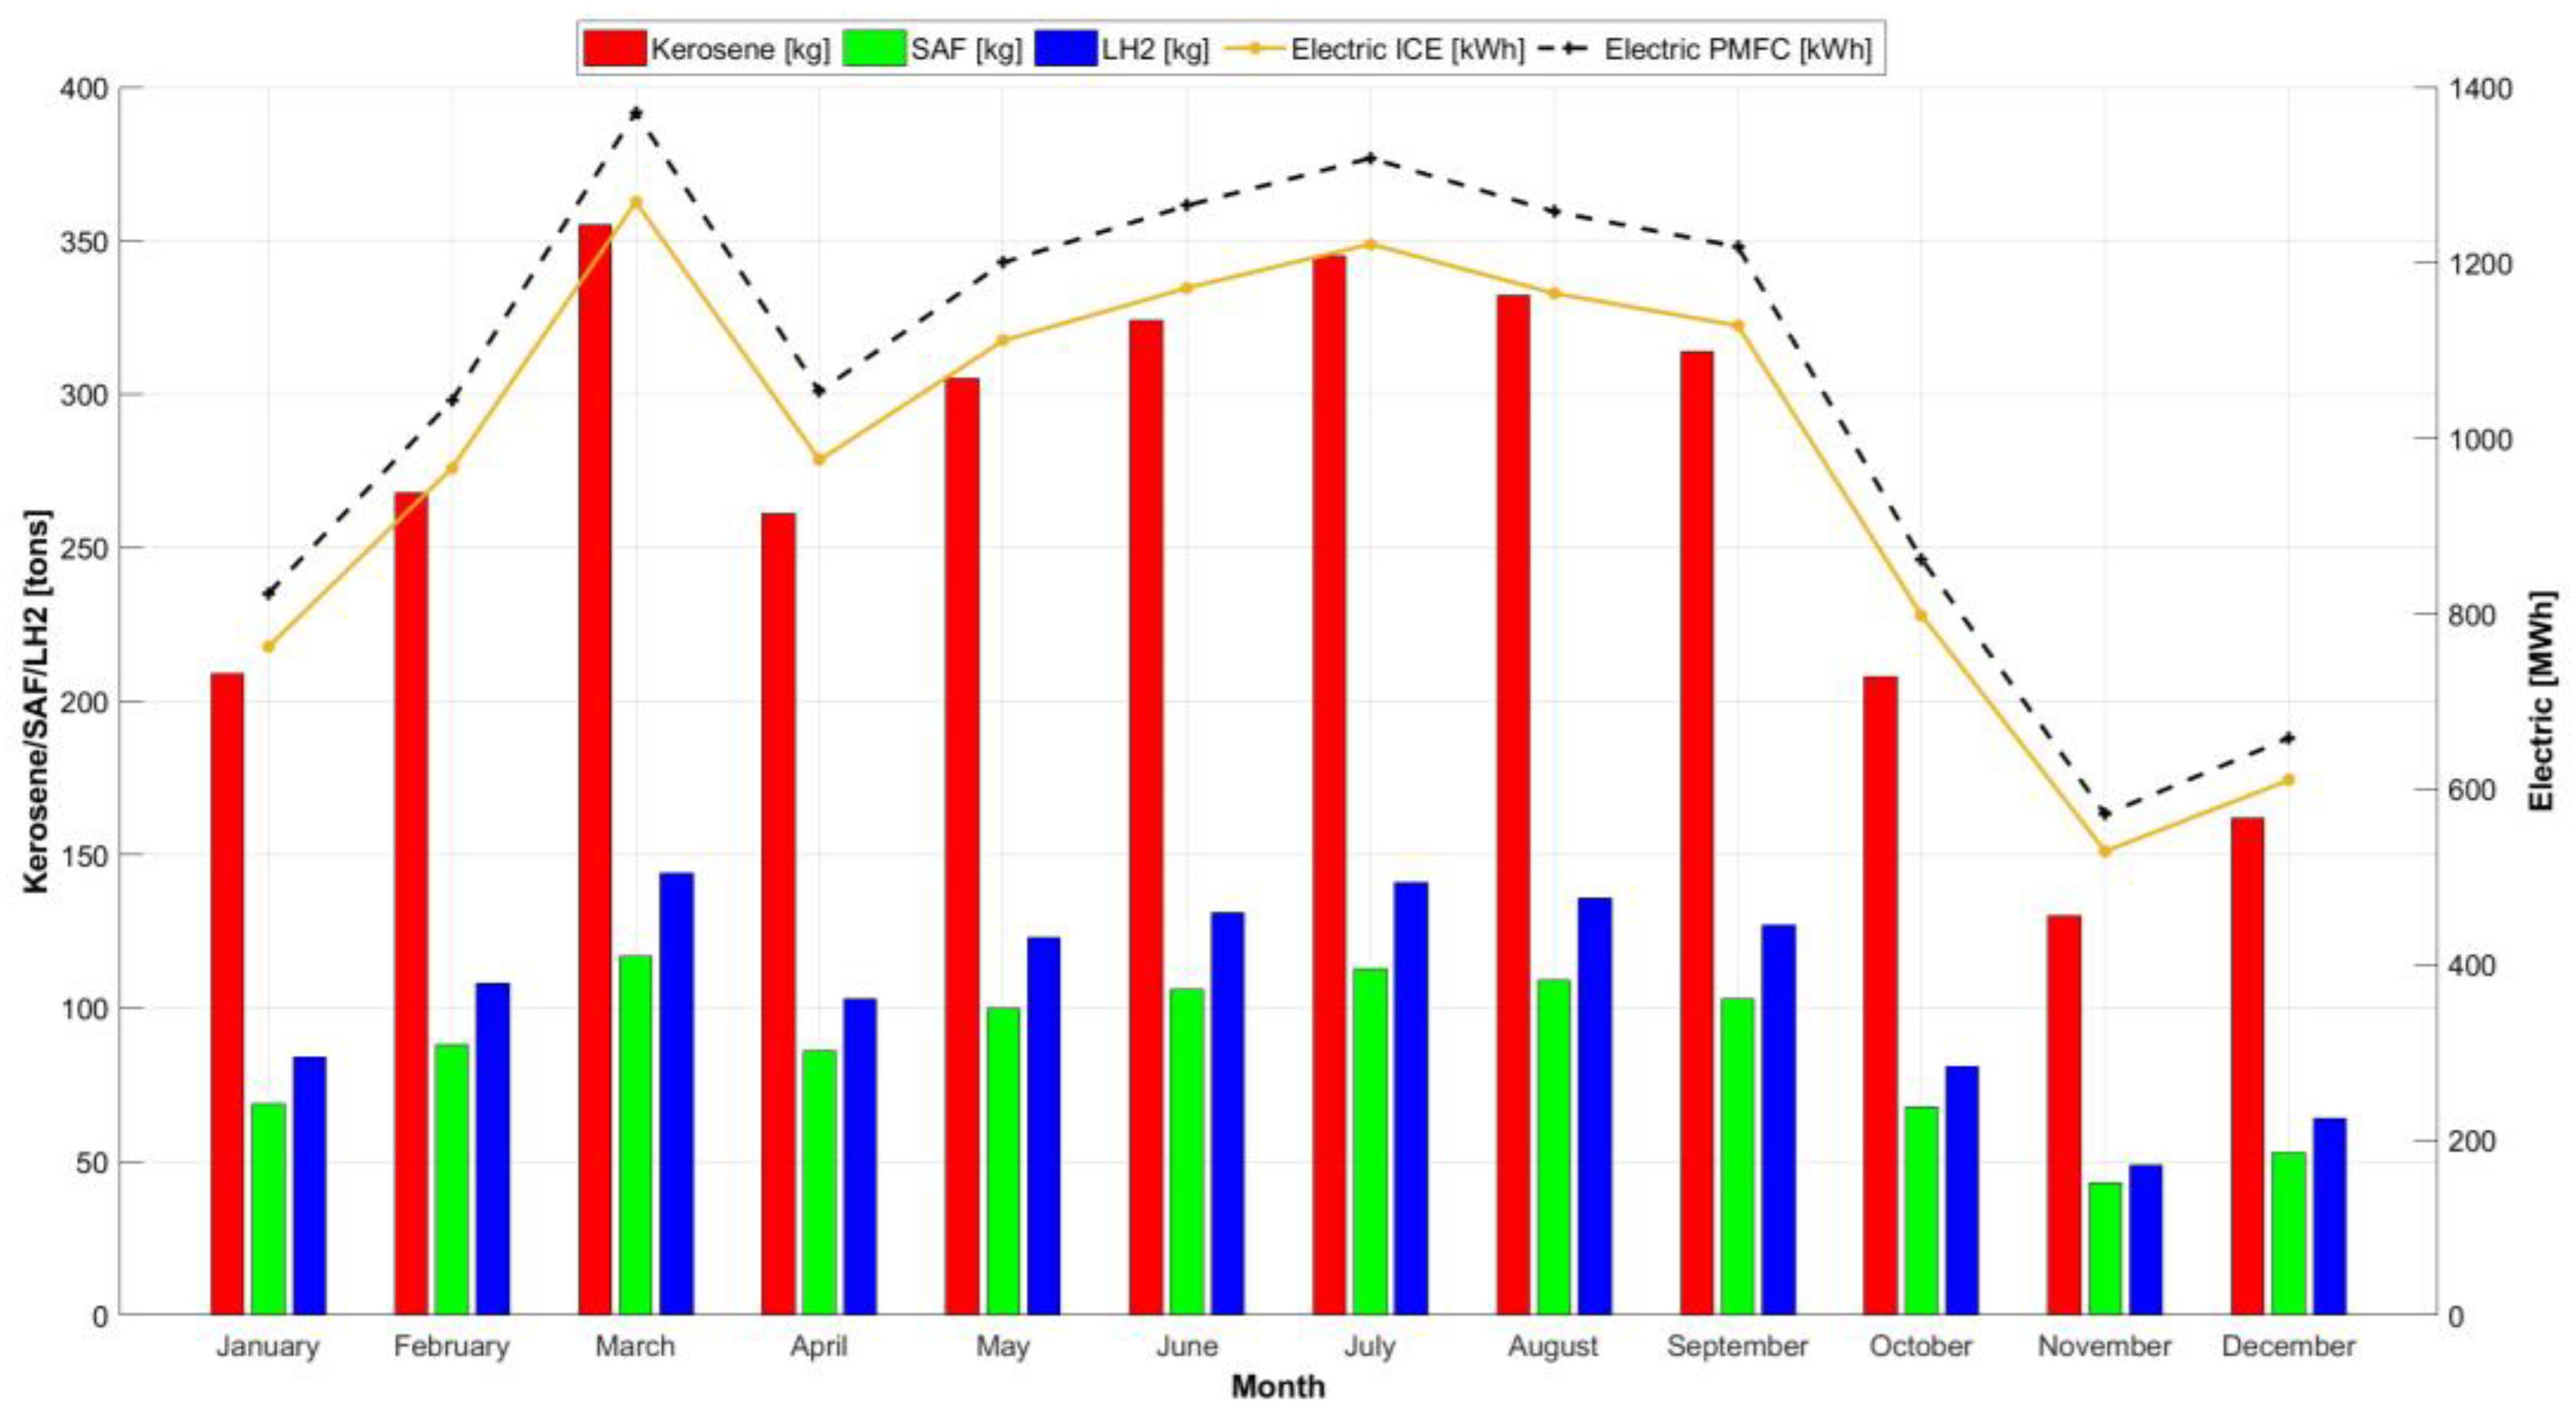
Table 7 shows the energy demand for hybrid-electric flights in 2030 per month to determine the loading and refuelling energy for one year in 2030. It was concluded that 3215 tonnes of kerosene, 1056 tonnes of SAF and 11.704 GWh of electrical energy would be required in the short-term horizon to operate the HEA. These calculations were made with a fuel mix ratio of 75% kerosene, 25% SAF and an HEA configuration.
For the PEMFC + Battery aircraft, the energy demand is listed on the right side of Table 7 as “LH2 [tons]” and “Electric PEMFC” [MWh]. This table shows the energy demand for HEA flights in 2040 per month to determine the loading and refuelling energy for one year in 2040. It was found that, instead of 3215 tonnes (medium-term-ICE + Battery), 1291 tonnes of liquid hydrogen are now required to operate the HEA in the medium-term scenario. The requirement of 1056 tonnes of SAF in the medium-term horizon are eliminated accordingly. The demand for electrical energy of 11.704 GWh (medium-term-ICE + Battery) increases to 12.640 GWh (black line). The demand for electrical energy is 74% higher than for the short-term horizon (Table 13). The demand for electrical energy in the medium-term with PEMFC is almost 8% higher than in the medium-term scenario with ICE + Battery. This is due, on the one hand, to the increased battery capacity in the PEMFC aircraft, and on the other hand to the use of liquid hydrogen. The charging and refuelling energy for the HEA is shown in Figure 8.

3.2. Determining Cost Estimations and Emissions for the Short-Term

In this section, a cost and emission forecast for the period 2025–2035 will be given. First, it should be explained how the data were obtained. It is important to read Section 2.2 and Section 2.3 first. Gilbarco Tritium RT175-S DCFC Fast Charge Single Electric Vehicle 175 kW Charging Stations have a list price of USD 105,000 each. For a charging station with double capacity, an investment of USD 175,000 is considered [23]. Costs for maintenance have not yet been released.
Capex and Opex of the Maeve Recharge 30-ft container with 8 MW battery capacity and control module have also not yet been released. The battery pack cost will be lower than the market price for new batteries because it is reused from electric aircraft. The final megawatt charging system (MCS) standard is expected to be published in 2024 [24,25].
For the ticket price calculation in the short-term scenario, the data and calculations in Section 2.3 were used as a base Then, using the flight distance, the information from RTHA and the composition of the current ticket price, the price of a passenger per km can be given. It is further assumed that fuel costs and landing fees account for 30% of the ticket price. Furthermore, three possible environmental price increases offered by Lufthansa [26,27] were included and applied to the ERJ 190 and B737. A number is given in the brackets after the respective conditions, indicating which scenarios were considered in the following tables. These three environmental price increases amount to:
  • A 100% climate project subsidy (100% describes that, with this selection, the full 2.6%, which is additionally paid by the client, goes into climate projects)—2.6% → (1);
  • An 80% climate project subsidy and 20% SAF fuel—21% → (2);
  • A 100% SAF fuel and CO2 emissions reduced—by 96% → (3).
In addition, an average inflation rate of 2.44% was assumed, which resulted over the last 50 years in Germany [28]. This inflation rate is also included in the ticket prices, to give a realistic estimate of the prices for different time horizons.
  • 2.44% inflation rate in terms of 2040 → (4).
For the price comparison per ticket with the GENESIS flight, Scenario 2 was assumed in the short term. Therefore, this scenario is considered with 20% SAF fuel and is comparable with the HEA case study. The calculated costs for the short-distance flight are shown in Table 8, and the costs for the medium-distance flight are in Table 9. These calculations and data show that HEA ticket prices are somewhat higher than conventional ticket prices for typical mission flights such as to London. However, in the medium-term scenario, the ticket price for a flight with ICE + Battery HEA is 1.8 below the comparable ticket price with 20% SAF. The expected ticket price for design mission flights is 11.8% below the comparable price when using an HEA. As soon as HEA flights with PEMFC + Battery can be offered, the ticket price difference is considered very attractive purely on the basis considered: a price saving of 46.7% is expected for typical mission flights and 40.4% for design mission flights.
Table 10 shows an estimate of the ticket development for 2040, which can be derived using the presented method. This table illustrates very well the impact of inflation and the environmental bonus in the categories on different routes. According to this, the EIS of PEMFC + Battery HEA results in competitive ticket prices for HEA PEMFC tickets. The tickets for the flight to Pisa are 17% more expensive than the expected ticket prices without subsidy (4). As soon as customers want to fly with “80% climate project subsidy and 20% SAF fuel (2,4)”, the ticket PEMFC HEA is already 4% cheaper. Nonetheless, it should always be mentioned that the calculation was made without the high investment research and operating costs.
Nevertheless, the savings on the expected ticket price per passenger offer a first estimate to make these investments lucrative for airlines and to justify the initial investments with a long view into the future. This fact confirms the previously established thesis that HEA flights have the potential to be financially attractive and environmentally friendly.
Finally, the HEA flights’ estimated emissions for the short-term scenario are given for an average day, month and year. The calculation basis was the methods described in Section 2.3. The results are presented in Table 11. The HEA produce daily emissions of almost 58 tonnes of CO2. Annual emissions of nearly 13 863.65 tonnes of CO2 are expected. The NOx values are 49.619 tonnes per year, whereas 20.04 tonnes of CO are expected to be emitted annually. The values were estimated according to the procedure presented in Section 2.3. These high emissions indicate the urgency of transitioning towards sustainable hybrid-electric aviation.
For further classification and comparison purposes, a conventional aircraft from D1.2 [13] was used in Table 12. These flights were considered with kerosene only. By comparing the emissions of Table 11 and Table 12, it can be deduced that, by flying with PEMFC + Battery HEA, 49.5% CO2, 51.1% NOx and 48% H2O saving can be achieved. Flying with a PEMFC + Battery HEA, 100% CO2, 100% NOx and 77.9% H2O savings can be achieved.

3.3. Results over All Time Horizons

This section summarises all data for the operation of a regional airport for the different time horizons and aircraft configurations. The results for the short-term scenario (ICE + Battery—2030) follow the procedure described in Section 3.1 and Section 3.2, but here the fuel composition is, as already mentioned, 90% kerosene and 10% SAF. In addition, a lower powerful battery is installed. The results for the long-term scenario (PEMFC + Battery—2050) are obtained according to the procedure also described in Section 3.1 and Section 3.2. Here, a further developed PEMFC and further developed battery are included in the aircraft configuration. For more detailed information on the aircraft configuration, please refer back to [10] or [13].
The already-presented results of the medium-term scenario (ICE + Battery) and medium-term scenario (PEMFC + Battery) are taken up in the following tables. They can be classified as short-term (ICE + Battery—2030) and long-term (PEMFC + Battery—2050). Table 13 shows the annual energy demand for the process of the HEA in different time horizons. It was found that, instead of 5608 tonnes of paraffin (short term), 3215 tonnes (medium term ICE + Battery) and 1291 tonnes of liquid hydrogen (medium term PEMFC + Battery), 1234 tonnes of liquid hydrogen would now be required to operate the HEA in the long-term scenario. The electrical energy demands of 7233 GWh (short term), 11,704 GWh (medium term -ICE + Battery) and 12,640 GWh (medium term -PEMFC + Battery) are now 11,622 GWh. The demand for electrical energy is 60% higher than in the short term. The demand for electrical energy in the medium-term scenario with PEMFC is almost 0.7% lower, and thus almost identical to the medium-term scenario ICE + Battery. Overall, the demand for electrical energy in the medium-term scenario with PEMFC + Battery is 8.1% lower than in the short-term scenario.
Table 14 shows the expected and extrapolated ticket prices for the different time horizons. The approach was the same as in Section 2.2, Section 3.1 and Section 3.2. The HEA ticket price is expected to be 49.4% cheaper for typical mission flights and 45.7% for design mission flights in the long-term PEMFC + Battery scenario. The list was compiled without the high investment, research and operating costs. As described in the respective sections, the price calculations considered environmental aspects and expected inflation rates.
However, the high savings in the expected ticket price per passenger offer an excellent field to make these investments lucrative for airlines and passengers through hybrid-electric typical and design mission flights. This fact confirms the previously established thesis that hybrid-electric flights have the potential to be financially attractive and environmentally friendly. The assumed costs for CO2 compensation are justified here, as more and more institutions, such as FAU, are obliged to pay CO2 compensation on ticket prices for business trips.
Table 15 summarises the extrapolated and expected emissions of the different time horizons and aircraft types. The mentioned reference aircraft (ATR 42 with a Pratt and Whitney PW127 engine) is listed first under the 2012 category for comparison purposes.

4. Conclusions

This paper presents the results of an energy demand analysis for a future regional airport over three different time horizons. This study presents different options for the ground power supply of a regional airport and possible solutions for the airport infrastructure with a short (2030), medium (2040) and long (2050) time horizon. The results include estimating the future energy demand per day, month and year and the energy demand. To accommodate the increasing number of flights, the flight plan was adapted to the needs of a 50-PAX regional aircraft. This new flight plan provides the opportunity to present an overview of the results for the energy demand of a regional airport, broken down by individual time horizons. The result of this work describes the energy demand for the airport’s operation, the expected emissions and an estimate of ticket prices. The findings confirm that airports will require an enormous amount of electrical energy due to the electrification of air traffic. Accordingly, the infrastructure of airports will also have to change. Furthermore, the study shows that the transition to sustainable hybrid-electric aviation is attractive due to lower emissions and adjusted ticket prices.
In future work, a full-fledged prospective Life Cycle Assessment (LCA) in accordance with the methodology proposed by [29] needs to be performed to consider all relevant life cycle stages and additional environmental impacts besides climate change. The inclusion of additional emerging propulsion systems (e.g., direct H2 use in the gas turbine), aircraft types (besides the regional HEA), and other means of reducing airport/aircraft emission (e.g., air traffic management) would broaden the scope and enrich the discussion of the transition of airports.

Author Contributions

This section reports the main contributions of each author according to the Contributor Roles Taxonomy (CRediT) (https://www.mdpi.com/data/contributor-role-instruction.pdf). Conceptualisation: M.M. (Markus Meindl), C.d.R. and F.H. Methodology: M.M. (Markus Meindl), C.d.R., V.M., M.D.S., M.R., F.H. and L.L. Data collection: M.M. (Markus Meindl), C.d.R., V.M., M.D.S. and M.R. Validation: M.M. (Markus Meindl), C.d.R., V.M. and M.D.S. Data maintenance: M.M. (Markus Meindl), C.d.R., V.M. and M.D.S. Writing—original draft preparation: M.M. (Markus Meindl). Writing—review and editing: M.M. (Markus Meindl), C.d.R., V.M., M.D.S., M.R., F.N., F.H., N.T., K.S.-R., A.L. and M.M. (Martin Maerz). Supervision: M.M. (Martin Maerz). Project administration: A.L. and M.M. (Martin Maerz). Funding acquisition: M.M. (Martin Maerz). All authors have read and agreed to the published version of the manuscript.

Funding

This study is part of the GENESIS project (https://www.genesis-cleansky.eu/ (9 March 2023)). The GENESIS project has received funding from the Clean Sky 2 Joint Undertaking (JU) under Grant Agreement n° 101007968. The JU receives support from the European Union´s Horizon 2020 research and innovation programme and the Clean Sky 2 JU members other than the Union. This study only reflects the authors’ views; the JU is not responsible for any use that may be made of the information it contains.
Aerospace 10 00283 g009

Data Availability Statement

Not applicable.

Acknowledgments

This study was conducted as part of the GENESIS project (https://www.genesis-cleansky.eu/ (9 March 2023)). The authors are grateful to all project partners for the fruitful discussions and expert advice about the main elements of hybrid-electric architectures, which formed a solid theoretical foundation for the studies presented in this work.

Conflicts of Interest

The authors declare no conflict of interest. The funders had no role in the design of the study; in the collection, analyses, or interpretation of data; in the writing of the manuscript; or in the decision to publish the results.

Abbreviations

The following abbreviations are used in this manuscript:
AbbreviationMeaning
ACAlternating Current
CO2Carbon Dioxide
DCDirect Current
EIEmission Indices
FAU-LEEFriedrich Alexander University—Lehrstuhl für Leistungslektronik
FCFuel Cell
GENESISGauging the ENvironmental sustainability of electrIc aircraft Systems
HEAHybrid-Electric-Aircraft
ICEInternal Combustion Engine
LCALife Cycle Assessment
LFLow Frequency
LH2Liquid hydrogen
ITInformation Technology
MCSMegawatt Charging System
MWMegawatt
NOxNitrogen Oxide
PAXPersons approximately
PEMFCProton Exchange Membrane Fuel Cell
PVPhotovoltaic
RTHARotterdam The Hague Airport
SAFSustainable Aviation Fuel
TLARTop-level Aircraft Requirements
UNINAUniversita degli Studi di Napoli Federico II

References

  1. Steinike, S. Die grüne Basis: Flughäfen sind bei den Themen Lärmschutz und Emissionssenkung schon lange aktiv. Für die Umstellung auf neue Antriebsenergien, wie batterieelektrisches FLiegen und Brennstoffzellen, stehen ihnen aber ein aufwendiger Umbau der Infrastruktur vor. Flug Revue 2022, 32–37. [Google Scholar]
  2. Airbus. ZEROe. Available online: https://www.airbus.com/en/innovation/zero-emission/hydrogen/zeroe (accessed on 15 February 2023).
  3. Metar-Taf. Corisco International Airport|OCS|Piloten-Infos. Available online: https://metar-taf.com/de/airport/OCS (accessed on 22 February 2023).
  4. Kilimi, M.G.R.; Motjoadi, V.; Bokoro, P.N. Improvement of an Off-grid Electricity Supply System: A Case Study in Corisco International Airport. In Proceedings of the 2021 International Conference on Electrical, Computer, Communications and Mechatronics Engineering (ICECCME), Flic en Flac, Mauritius, 7–8 October 2021; pp. 1–8. [Google Scholar]
  5. Jakarta Airport Guide—Jakarta Soekarno-Hatta International Airport. Available online: https://www.jakartaairportonline.com/ (accessed on 22 February 2023).
  6. Untari, I.; Raharjo, H.S.; Nayusrizal, N.; Hudaya, C. Analysis of Electricity Power Consumption and Cost Impact of Soekarno-Hatta Airport Railink Project. In Proceedings of the 2019 IEEE 2nd International Conference on Power and Energy Applications (ICPEA), Singapore, 27–30 April 2019; pp. 28–32. [Google Scholar]
  7. Meindl, M.; Weber, K.J.; Maerz, M. Ground-Based Power Supply System to Operate Hybrid-Electric Aircraft for Future Regional Airports. In Proceedings of the ESARS-ITEC Europe-Venice (Italy), Vinece, Italy, 29 March 2023; 29 March 2023. [Google Scholar]
  8. Sumsurooah, S.; He, Y.; Torchio, M.; Kouramas, K.; Guida, B.; Cuomo, F.; Atkin, J.; Bozhko, S.; Renzetti, A.; Russo, A.; et al. ENIGMA—A Centralised Supervisory Controller for Enhanced Onboard Electrical Energy Management with Model in the Loop Demonstration. Energies 2021, 14, 5518. [Google Scholar] [CrossRef]
  9. Rotterdam the Hague Airport. A Vision for Hydrogen Flying at Rotterdam The Hague Airport; Rotterdam the Hague Airport: Rotterdam, The Netherlands, 2022. [Google Scholar]
  10. Marciello, V.; Di Stasio, M.; Ruocco, M.; Trifari, V.; Nicolosi, F.; Meindl, M.; Lemoine, B.; Caliandro, P. Design Exploration for Sustainable Regional Hybrid-Electric Aircraft: A Study Based on Technology Forecasts. Aerospace 2023, 10, 165. [Google Scholar] [CrossRef]
  11. Srdic, S.; Lukic, S. Toward Extreme Fast Charging: Challenges and Opportunities in Directly Connecting to Medium-Voltage Line. IEEE Electrific. Mag. 2019, 7, 22–31. [Google Scholar] [CrossRef]
  12. Deutsche Kommission Elektrotechnik Elektronik Informationstechnik. Konduktive Ladesysteme für Elektrofahrzeuge. DIN EN IEC 61851-1 (VDE 0122-1):2019-12. Available online: https://www.vde-verlag.de/normen/0100544/din-en-iec-61851-1-vde-0122-1-2019-12.html (accessed on 18 January 2023).
  13. Marciello, V.; Nicolosi, F.; Di Stasio, M.; Ruocco, M. GENESIS D1.2-Scenarios & Requirements for Future Electric/Hybrid Propulsion and Conventional A/C: Università degli Studi di Naples “Federico II” (UNINA), Neapel. 2022. Available online: https://www.genesis-cleansky.eu/deliverables/ (accessed on 9 March 2023).
  14. Mario Di Stasio (UNINA), Manuela Ruocco (SMARTUP), Valerio Marciello (UNINA), Fabrizio Nicolosi. Turbine/ICE Generator Set Technology Analysis: GENESIS D2.5. 2023. Available online: https://www.genesis-cleansky.eu/deliverables/ (accessed on 9 March 2023).
  15. Filippone, A.; Bojdo, N. Statistical model for gas turbine engines exhaust emissions. Transp. Res. Part D Transp. Environ. 2018, 59, 451–463. [Google Scholar] [CrossRef] [Green Version]
  16. Eurocontrol. Forecasting Civil Aviation Fuel Burn and Emissions in Europe—Interim Report. Available online: https://www.eurocontrol.int/publication/forecasting-civil-aviation-fuel-burn-and-emissions-europe-interim-report (accessed on 22 February 2023).
  17. Narciso, M.; de Sousa, J.M.M. Influence of Sustainable Aviation Fuels on the Formation of Contrails and Their Properties. Energies 2021, 14, 5557. [Google Scholar] [CrossRef]
  18. National Academies of Sciences, Engineering, and Medicine. ACRP Web-Only Document 41: Alternative Jet Fuels Emissions: Quantification Methods Creation and Validation Report; Transportation Research Board: Washington, DC, USA, 2019. [Google Scholar]
  19. Shahwan, K. Operating Cost Analysis of Electric Aircraft on Regional Routes. Bachelor’s Thesis, Lingköping University, Norrköping, Sweden, 2021. [Google Scholar]
  20. Blair Comley, Paul Boulus, Pip Best, Fiona Hancock, Steve Hatfield-Dodds, Emma Herd, Mathew Nelson, Matthew Cowie, Andrew Lee and Jarrod Allen. Essential, Expensive and Evolving: The Outlook for Carbon Credits and Offsets: An EY Net Zero Centre Report, EY, Sydney. 2022. Available online: https://assets.ey.com/content/dam/ey-sites/ey-com/en_au/topics/sustainability/ey-net-zero-centre-carbon-offset-publication-20220530.pdf (accessed on 9 March 2023).
  21. Kos, J.; Peerlings, B.; Lim, M.N.A.; Lammen, W.F.; Posada Duque, A.; van der Sman, E.S. Novel Propulsion and Alternative Fuels for Aviation towards 2050: Promising Options and Steps to Take (TRANSCEND Deliverable D3.2). 2022. Available online: https://reports.nlr.nl/server/api/core/bitstreams/af600792-5757-48d8-b153-45513acf97d9/content (accessed on 6 January 2023).
  22. Petrichenko, L.; Sauhats, A.; Diahovchenko, I.; Segeda, I. Economic Viability of Energy Communities versus Distributed Prosumers. Sustainability 2022, 14, 4634. [Google Scholar] [CrossRef]
  23. JME Ellsworth. Electric Vehicle Charging Stations. Available online: https://www.jmesales.com/electric-vehicle-charging-stations/?sort=pricedesc (accessed on 3 January 2023).
  24. MCS Task Force; the Charging Connections Focus Group. CharIN Whitepaper Megawatt Charging System (MCS): Recommendations and Requirements for MCS Related Standards Bodies and Solution Suppliers. 2022. Available online: https://www.charin.global/media/pages/technology/knowledge-base/c708ba3361-1670238823/whitepaper_megawatt_charging_system_1.0.pdf (accessed on 7 December 2022).
  25. Maeve. Flight Time: 1 Hour 30 Minutes. Charging Time: 35 Minutes. Available online: https://maeve.aero/recharge (accessed on 3 January 2023).
  26. Lufthansa. Lufthansa Booking. Available online: https://www.lufthansa.com/de/de/homepage (accessed on 6 January 2023).
  27. Lufthansa. Nachhaltiger Fliegen. Available online: https://www.lufthansa.com/de/de/flug-kompensieren (accessed on 20 February 2023).
  28. Statistisches Bundesamt. Inflationsrate in Deutschland von 1950 bis 2022. 2022. Available online: https://de.statista.com/statistik/daten/studie/4917/umfrage/inflationsrate-in-deutschland-seit-1948/ (accessed on 9 March 2023).
  29. Thonemann, N.; Schulte, A.; Maga, D. How to Conduct Prospective Life Cycle Assessment for Emerging Technologies? A Systematic Review and Methodological Guidance. Sustainability 2020, 12, 1192. [Google Scholar] [CrossRef] [Green Version]
Figure 1. Basic topologies for DC-Fast-Charging of electric vehicles.
Aerospace 10 00283 g001
Figure 2. Schematic view of an HEA (EIS 2030/2040, ICE + Battery) - Reprinted/adapted with permission from Ref. [10]. 2023, Marciello, V.; Di Stasio, M.; Ruocco, M.; Trifari, V.; Nicolosi.
Aerospace 10 00283 g002
Figure 3. Schematic view of the aircraft (EIS 2040/2050; PEMFC + Battery) - Reprinted/adapted with permission from Ref. [10]. 2023, Marciello, V.; Di Stasio, M.; Ruocco, M.; Trifari, V.; Nicolosi.
Aerospace 10 00283 g003
Figure 4. Airport infrastructure for the ICE + Battery HEA for medium– and short–term horizons.
Aerospace 10 00283 g004
Figure 5. Airport infrastructure for the LH2 powered PEMFC + Battery HEA for medium– and long–term horizons.
Aerospace 10 00283 g005
Figure 6. Daily fuel and electricity amount per hybrid-electric flight, 2040.
Aerospace 10 00283 g006
Figure 7. Possible new flight plan with HEAs, 2040.
Aerospace 10 00283 g007
Figure 8. Charging and refuelling HEA energy requirements, 2040.
Aerospace 10 00283 g008
Table 1. Overview of fuel and battery energy consumptions per km based on calculations performed by UNINA and SmartUp.
2025–2035kg kerosene/kmkg SAF(4)*/kmkWh/kmkg LH2/km
Short-term 200 nmi(1)*
Short-term ICE(ref,2)*1.251.23
Short-term ICE(2)* + Battery0.870.962.23
Short-term 600 nmi (1)*
Short-term ICE(ref,2)*0.980.96
Short-term ICE(2)* + Battery0.860.940.76
2035–2045kg kerosene/kmkg SAF(4)*/kmkWh/kmkg LH2/km
Medium-term 200 nmi(1)*
Medium-term ICE(ref,2)*1.141.120.00
Medium-term ICE(2)* + Battery0.640.632.39
Medium-term PEMFC(3)* + Battery 2.580.16
Medium-term 600 nmi(1)*
Medium-term ICE(ref,2)*0.900.88
Medium-term ICE(2)* + Battery0.460.201.61
Medium-term PEMFC(3)* + Battery 1.750.21
2045–2055kg kerosene/kmkg SAF(4)*/kmkWh/kmkg LH2/km
Long-term 200 nmi(1)*
Long-term ICE(ref,2)*1.111.09
Long-term PEMFC(3)* + Battery 2.370.16
Long-term 600 nmi(1)*
Long-term ICE(ref,2)*0.880.86
Long-term PEMFC(3)* + Battery 1.600.19
(ref)*: Reference aircraft with conventional gas turbine engines as power plant technology. (1)*: Nautical mile. (2)*: Internal Combustion Engine. (3)*: Polymer Electrolyte Membrane Fuel Cell. (4)*: Sustainable Aviation Fuel.
Table 2. Average EIs for CO2, H2O and SO2 for conventional (Jet A-1) aviation fuel, assumed according to [16].
PollutantEI (g/kg)
CO23149.0
H2O1230.0
SO20.84
Table 3. Total emission cost comparison of two aircrafts according to [19].
RouteDistance [km]Jetstream JS31 [EUR]ES-19 [EUR]
Linköping-Visby178EUR 2306EUR 1805
Pajala- Luleå194EUR 2380EUR 1886
Umeå-Östersund296EUR 2976EUR 2378
Sälen-Arlanda326EUR 3253EUR 2636
Table 4. Cost estimation for HEA emissions.
EnergyUnitCost in EUR
Carbon tax ETS [20]kg CO20.25
Kerosene [21]kg1.20
SAF [21]kg2.00
Electric [22]kWh0.60
LH2 [21]kg6.00
Table 5. Daily fuel and electricity amount per hybrid-electric flight, 2040.
Day 2030PAXDistance [km]GMT [Time]Kerosene [kg]SAF [kg]Electric ICE [kWh]LH2
[kg]
Electric PEMFC [kWh]
London (2—HEA)7630805:1961220030492093288
London (2—HEA)7830808:3861220030492093288
Bergerac (3—HEA)14784412:04174357256707406128
Pula (4—HEA)164104916:302730896888111589598
Wien (3—HEA)13595316:49190562561978086697
Montpellier (4—HEA)17992517:042485816808210548735
Pisa (4—HEA)186102119:562675878870011359403
London (2—HEA)9730820:0861220030492093288
TOTAL 13,374438946,678552350,425
Table 6. Possible replacements through HEAs, 2040.
DestinationTime—OldTime—NewPAXkmKerosene [kg]SAF [kg]Electric ICE [kWh]LH2 [kg]Electric PEMFC [kWh]
London05:19LO 05:19503083061001.5251051643.94
London05:19LO 05:29263083061001.5251051643.94
London08:38LO 08:38503083061001.5251051643.94
London08:38LO 08:48283083061001.5251051643.94
Bergerac12:04BE 12:04508445811911.8902472042.76
Bergerac12:04BE 12:24508445811911.8902472042.76
Bergerac12:04BE 12:44478445811911.8902472042.76
Pula16:30PU 16:005010496832242.2202902399.46
Pula16:30PU 16:105010496832242.2202902399.46
Pula16:30PU 16:205010496832242.2202902399.46
Pula16:30PU 16:301410496832242.2202902399.46
Vienna16:49VIE 16:39509536352082.0662692232.42
Vienna16:49VIE 16:49509536352082.0662692232.42
Vienna16:49VIE 16:59359536352082.0662692232.42
Montpellier17:04MO 17:09509256212042.0212642183.7
Montpellier17:04MO 17:19509256212042.0212642183.7
Montpellier17:04MO 17:29509256212042.0212642183.7
Montpellier17:04MO 17:39299256212042.0212642183.7
Pisa19:56PI 19:365010216692202.1752842350.74
Pisa19:56PI 19:465010216692202.1752842350.74
Pisa19:56PI 19:565010216692202.1752842350.74
Pisa19:56PI 20:063610216692202.1752842350.74
London20:08LO 20:16503083061001.5251051643.94
London20:08LO 20:26473083061001.5251051643.94
TOTAL 13,374438946,678552350,425
Table 7. Charging and refuelling HEA energy requirements per month, 2040.
MonthKerosene [Tons]SAF [Tons]Electric ICE [MWh]LH2 [Tons]Electric PEMFC [MWh]
January2096976284823
February268889661081043
March35511712691441371
April261869751031053
May30510011111231200
June32410611711311265
July34511312211411319
August33210911651361258
September31410311281271218
October2086879881862
November1304352949571
December1625361064658
TOTAL3215105611,704129112,640
Table 8. Costs for typical mission flights, medium-term (2040) forecast.
London
308 km
ScenarioDelta/km [EUR]Cost/km and PAX [EUR]Delta/km and PAX [%]Cost/km (PAX; Env.; inflation) [EUR]Delta/Ticket HEA [%]
ERJ190(4)23.330.048 0.24
ERJ190(1.4)23.940.049 0.24
ERJ190(2.4)28.310.058 0.29
ERJ190(3.4)45.770.094 0.47
HEA-ICE(4)14.180.057−1.8%0.28−1.8%
HEA-PEMFC(4)12.440.050−46.7%0.25−46.7%
Table 9. Costs for design mission flights, short-term (2040) forecast.
Pula
1049 km
ScenarioDelta/km [EUR]Cost/km and PAX [EUR]Delta/km and PAX [%]Cost/km (PAX; Env.; inflation) [EUR]Delta/Ticket HEA [%]
B737(4)24.400.04 0.20
B737(1.4)25.050.04 0.20
B737(2.4)29.640.05 0.24
B737(3.4)40.110.077 0.38
HEA-ICE(4)10.460.042−11.8%0.21−11.8%
HEA-PEMFC 11.430.046−40.4%0.23−40.4%
Table 10. Ticket price forecast, 2040.
DestinationDistance [km]GMT [Time]Ticket (4) [EUR]Ticket (1.4) [EUR]Ticket (2.4) [EUR]Ticket (3.4) [EUR]Ticket HEA ICE [EUR]Ticket HEA PEMFC [EUR]
London30805:1973.3175.2488.97143.8387.3376.63
Bergerac84412:04164.78169.15200.11323.92176.49192.90
Pula104916:30204.81210.23248.71402.59219.35239.76
Wien95316:49186.06191.00225.95365.75199.28217.81
Montpellier92517:04180.60185.38219.31355.00193.42211.42
Pisa102119:56199.34204.62242.07391.85213.50233.36
Table 11. Emissions forecast of HEA flights in the medium-term (2040) scenario.
Fuel [ton]CO2 [ton]NOx [ton]HC [ton])CO [ton]H2O [ton]SO2 [ton]
Day—ICE + Battery
Kerosene13.37443.7690.1560.0060.06717.0960.012
HEFA-SPK4.38913.8900.0500.0020.0176.0620.001
TOTAL 57.6590.2060.0080.08323.1580.013
Month—ICE + Battery
Kerosene267.917876.8073.1260.1231.334342.4810.234
HEFA-SPK88.000278.4971.0090.0400.336121.5510.020
TOTAL 1155.3044.1350.1631.670464.0320.253
Year—ICE + Battery
Kerosene3215.00010,521.67937.5151.48116.0094109.7702.807
HEFA-SPK1056.0003341.96812.1040.4754.0341458.6090.235
TOTAL 13,863.64749.6191.95620.0445568.3793.041
Day—PEMFC + Battery
LH25.5230.0000.0000.0000.0009.8490.000
Month—PEMFC + Battery
LH2107.5830.0000.0000.0000.000191.8490.000
Year—PEMFC + Battery
LH21291.0000.0000.0000.0000.0002302.1920.000
Table 12. Emissions of a comparable short-term conventional aircraft (with new gas turbine engines installed) in combination with flight schedule.
Fuel [ton]CO2 [ton]NOx [ton]H2O [ton]
Day
Kerosene26.091114.1680.42344.594
Month
Kerosene519.2242272.0038.411887.449
Year
Kerosene6230.69627,264.041100.93510,649.384
Table 13. The yearly amount of energy for HEA 2025–2055.
Kerosene [Tons]SAF [Tons]Electric [MWh]LH2 [Tons]
2030—ICE + Battery56086107233-
2040—ICE + Battery3215105611704
2040—PEMFC + Battery 12,6401291
2050—PEMFC + Battery 11,6221234
Table 14. Costs for typical mission flights—forecast summary.
London
308 km
ScenarioDelta/km [EUR]Cost/km and PAX [EUR]Delta/km and PAX [%]Cost/km (PAX; Env.; Inflation) [EUR]Delta/Ticket HEA [%]Delta/km [EUR]
2030
ERJ190(4)19.500.05-0.20-61.29
ERJ190(1.4)20.020.05-0.20-62.91
ERJ190(2.4)23.670.06-0.24-74.38
ERJ190(3.4)38.260.09-0.39-120.25
ICE + Battery(4)11.720.06−3.00%0.23−3.00%72.18
2040
ERJ190(4)23.330.05-0.24-73.31
ERJ190(1.4)23.940.05-0.24-75.24
ERJ190(2.4)28.310.06-0.29-88.97
ERJ190(3.4)45.770.09-0.47-143.83
ICE + Battery(4)14.180.06−1.80%0.28−1.80%87.33
PEMFC + Battery(4)12.440.05−46.70%0.25−46.70%76.63
2050
ERJ190(4)27.150.05-0.28-85.33
ERJ190(1.4)27.870.05-0.28-87.58
ERJ190(2.4)32.950.06-0.34-103.56
ERJ190(3.4)53.270.09-0.54-167.42
PEMFC + Battery(4)13.750.05−49.40%0.28−49.40%84.71
Pula1049 km
2030
B737(4)20.400.04-0.16-171.22
B737(1.4)20.940.04-0.17-175.76
B737(2.4)24.780.05-0.20-253.33
B737(3.4)40.110.08-0.32-336.58
HEA(4)7.880.04−20.50%0.16−20.50%165.37
2040
B737(4)24.400.04-0.20-204.81
B737(1.4)25.050.04-0.20-210.23
B737(2.4)29.640.05-0.24-248.71
B737(3.4)47.970.08-0.38-402.59
ICE + Battery(4)10.460.04−11.80%0.21−11.80%219.35
PEMFC + Battery(4)11.430.05−40.40%0.23−40.40%239.76
2050
B737(4)28.410.04-0.23-238.39
B737(1.4)28.410.04-0.23-244.71
B737(2.4)28.410.05-0.28-289.49
B737(3.4)28.410.08-0.45-468.61
PEMFC + Battery(4)12.120.04−45.70%0.24−45.70%254.36
Table 15. The yearly missions HEA flights forecast estimation compared to the reference aircraft—Summary 2025–2050.
Fuel [Ton]CO2 [Ton]NOx [Ton]HC [Ton])CO [Ton]H2O [Ton]SO2 [Ton]
2012—Reference aircraft
Kerosene6230.69627,264.041100.935--10,649.384-
2030—HEA
Kerosene560818,353.21165.4382.58327.9267168.7684.896
SAF (HEFA-SPK)6101930.4936.9920.2752.33842.5680.136
TOTAL621820,283.70472.432.85830.2568011.3365.031
2040—HEA—ICE + Battery
Kerosene321510,521.67937.5151.48116.0094109.772.807
SAF (HEFA-SPK)10563341.96812.1040.4754.0341458.6090.235
TOTAL427113,863.64749.6191.95620.0445568.3793.041
2040—HEA—PEMFC + Battery
LH21291----2302.192-
2050—HEA—PEMFC + Battery
LH21234----2025.9-
Disclaimer/Publisher’s Note: The statements, opinions and data contained in all publications are solely those of the individual author(s) and contributor(s) and not of MDPI and/or the editor(s). MDPI and/or the editor(s) disclaim responsibility for any injury to people or property resulting from any ideas, methods, instructions or products referred to in the content.

