Article

Optimization Design and Performance Evaluation of U-Shaped Area Operation Procedures in Complex Apron

1
College of Civil Aviation, Nanjing University of Aeronautics and Astronautics, Nanjing 211106, China
2
Engineering Research Center of Airport Safety and Operations, CAAC, Beijing 101318, China
*
Author to whom correspondence should be addressed.
Aerospace 2023, 10(2), 161; https://doi.org/10.3390/aerospace10020161
Submission received: 17 November 2022 / Revised: 31 January 2023 / Accepted: 31 January 2023 / Published: 9 February 2023
(This article belongs to the Section Air Traffic and Transportation)

Abstract

:
In view of the common U-shaped apron structure of large- and medium-sized airports at home and abroad, this study considered the optimization design and performance evaluation of the U-shaped apron operation procedure. First, by analyzing the physical structure characteristics and traffic operation characteristics of the U-shaped area, exclusive, partition-shared, and global-shared operation procedures of the U-shaped area were designed, and differentiated apron-operation rules and traffic models were constructed for different types of operation procedures. Then, from the perspectives of safety, efficiency, and environmental protection, a multi-dimensional evaluation index system of U-shaped area operation performance is established, and a classification measurement and comprehensive evaluation method based on critique is proposed. Finally, a traffic simulation model was established based on airport network topology modeling. We used Monte Carlo methods for the simulation in Python 3.6, and the experimental results show that, in the scenario of high-density traffic operation, compared with exclusive and partition-shared procedures, the implementation effect of the global shared procedure is very significant, and the apron operation capacity increased by 14.8% and 5.0%, respectively. The probability of aircraft conflict decreased by 32.2% and 11.8%, respectively, and the time of single conflict relief decreased by 16.1 s and 10.6 s, respectively. The average resource utilization in each U-shaped area increased by 66% and 25%, respectively, while the average daily carbon emissions of a single aircraft were reduced by 16.7 kg and 11.0 kg and the average daily fuel consumption of a single aircraft were reduced by 3.6 kg and 2.4 kg, respectively. The proposed method is scientific and effective and can provide theoretical and methodological support for optimizing the configuration of the scene operation mode of complex airports and for improving flight operation efficiency.

1. Introduction

Runways have always been recognized as the bottleneck area of airport systems (Bennell, et al., 2013; Bennell, et al., 2017) [1,2]. Along with the continuous advancement of new runway renovation and expansion projects, as well as the iterative evolutionary development of theoretical approaches such as runway operation mode configuration and runway arrival and departure schedules, runway operation efficiency has been effectively improved (Ramanujam, et al., 2015; Samà, et al., 2017; Yin, et al., 2021) [3,4,5]. However, orderly and efficient runway take-off and landing aircraft flows are frequently subject to surface conflicts, congestion, and delays due to the constraints of apron-operational performance, aggravating the fuel consumption and gas emissions during the aircraft ground taxiing waiting process, which makes the safety and efficiency of the apron area a growing concern in the air transport industry and academia.
The apron is the core operating area of the civil airport system, and its operation involves “operators-aircraft-vehicles”, covering “airport-air traffic control-airline”, and multi-level business entities, serving “passengers-cargo”. In the apron areas of large airports, the conflict between the highly intensive arrival and departure traffic and the relatively limited apron capacity is becoming more pronounced, resulting in low levels of safety and efficiency in aircraft operations. From the perspective of airport ground service coordination, inefficient and disruptive aircraft operations further constrain the efficiency of the coordinated dispatch of operators and vehicles. In this context, how to adopt scientific means to optimize the design of apron operation procedures, scientifically evaluate the performance of apron operations, and enhance the safety, efficiency, and greenness of apron operations as far as possible has become a key challenge that needs to be addressed.

2. Literature Review

At present, many studies have been carried out at home and abroad in the field of airport surface operation optimization, mainly focusing on airport surface traffic operation modeling, airport surface performance index analysis, and airport surface resource optimization scheduling.
In terms of airport surface traffic operation modeling, most recent studies have extracted the traffic characteristics of the airport surface and adopted the theory of Cellular Automata (CA): elements such as taxiways, aprons, and runways are considered as cellular space, and a cellular transport model of the traffic flow on the surface is established for simulation and deduction in order to clarify the spatial and temporal evolution law of the traffic flow on the surface (Xing, et al., 2018; Xue, et al., 2020; Yang, et al., 2016) [6,7,8]. In some studies, a directed topological network model was used in establishing the operational environment of the airport surface, the neighborhood relationships of the structural elements of the airport surface were described using “nodes-segments”, and the static properties and dynamic response behavior of the airport surface traffic system were studied based on Petri net modeling (Lu, et al., 2021; Pan, et al., 2018) [9,10]. Mathematical models based on queuing theory for aircraft runway departure queuing and ground protection have been established to achieve the prediction and optimization of key time nodes for aircraft surface operations (Chen, et al., 2019; Feng, et al., 2016) [11,12]. Min considered the macro- and micro-effects of aircraft ground traffic flow arrival time separation distribution on airport operations and constructed a slowing probability model [13]. Fines treated a single aircraft as an agent and developed a simulation model of airport surface operations based on a multiple-agent system [14].
In terms of analysis of airport surface performance indices, most studies focus on the performance domains of safety, capacity, and efficiency. Marin used a weighted linear objective function to balance multiple types of conflict indices [15]. According to Zhang and Zhao, multi-scenario-oriented surface capacity assessment and prediction models were developed considering the influence of meteorology, traffic, and airspace on the surface capacity, respectively [16,17]. Simaiakis extracted taxiing durations and flight flows at different levels of airport surface congestion and studied the effect of congestion on the aircraft taxiing process [18]. Xie and Wang analyzed the interactions between airport surface operation indices and assigned weights to the indices using hierarchical analysis and a topologically integrated evaluation method [19,20]. In addition, a method of modeling and analysis of situational indices based on the macro-distribution network of the airport surface was constructed from the multidimensional perspective of surface traffic flow, take-off, landing queue length, and time slot resource demand, providing a theoretical basis for accurate perception of the field operating environment (Yin, et al., 2018; Du, et al., 2021) [21,22].
In terms of optimal scheduling of airport surface resources, the research focuses on parking stand allocation, taxiing planning, and runway scheduling, etc. In Yin and Simaiakis’s studies, the arrival aircraft parking stand usage optimization and the departing aircraft push-back control optimization methods were respectively studied for the parking stand resource usage problem [23,24]. Taxiway resource usage problems were investigated by Xu and Tang for taxiway schedules planning and taxiway path planning to ensure the safety and efficiency of aircraft operations [25,26]. In Yin and Balakrishan’s studies, a runway resource scheduling model was developed for multi-runway airports to optimize the scheduling of runway resources in terms of runway sequencing and takeoff and landing times to improve runway operational safety and efficiency [27,28]. According to Bertsimas, a two-stage multi-objective optimization model was constructed to integrate the joint scheduling of airfield area resources by considering the scheduling requirements of airfield area resources, and a comprehensive allocation of spatial and temporal resources of the whole airfield area was carried out [29].
The above-mentioned papers have carried out some preliminary studies in the field of airport surface operation optimization and model construction. As can be seen from the above, most current research works establish the model of airport surface operation based on specific operation procedures or rules, adopt scientific assessment of the surface operation capability, and optimize the scheduling of the surface spatial–temporal resources to improve the safety and efficiency of the arrival and departure aircraft, but they neglect to optimize the design of the “airport surface operation procedures” from the root level. From the perspective of key resources, the surface operation procedure involves three subsystems: runway, taxiway, and apron. As the runway operation mode and taxiway operation rules have been gradually researched on a large scale and widely applied, the apron operation procedures have not been studied systematically and thoroughly. Especially in the context of civil aviation industry-wide transfer of apron control, the problem of apron operation procedure optimization becomes more urgent. In the apron area of complex airports, the dense geographical distribution of parking stands, the limited space for aircraft operation, the frequent interaction of arrival and departure activities, as well as the existence of certain blind areas for control operation often lead to frequent problems in the apron such as aircraft cut-off, vehicle–aircraft cut-off, arrival and departure conflicts, taxiing avoidance, etc. Therefore, it is particularly important and urgent to use scientific methods to optimize the design of apron operation procedures and to scientifically evaluate the implementation performance of the designed operation procedures. In fact, scientific and reasonable apron operation procedures can essentially improve the safe, efficient, and smooth operation of arrival and departure aircraft in the apron area, while unreasonable apron operation procedures largely restrict the operational efficiency, fuel saving, and emission reduction level of the apron area and even the whole airport surface system.
Given this, this paper puts forward the optimization design and performance evaluation method of a U-shaped area operation procedure for arrival and departure aircraft operation activities in the complex aprons. First, based on the actual operation data of the airport and the configuration of the apron, we innovatively designed a diversified operation procedure for the apron U-shaped area and propose differentiated operation rules and traffic models under different operation procedures. Then, from the perspectives of safety, capacity, efficiency, and environmental protection, we construct a multi-dimensional performance evaluation index system of the apron U-shaped area and propose the specific measurement methods and comprehensive evaluation methods of various indices. Finally, to comprehensively verify the optimization of U-shaped area operation procedures, a simulation model of U-shaped area operation is integrated and developed. In addition, the advantages and shortcomings of various performance indices under different types of U-shaped area operation procedures are compared and analyzed in the final part.

3. Problem Description and Multiple Operation Procedures Design for U-Shaped Area

3.1. Problem Description

The apron U-shaped area is a three-sided closed airfield area enclosed by two adjacent finger corridors and the main body of the terminal building, with parking stands and taxiways in this area. If the entrance to the U-shaped area is considered as a runway node, the apron U-shaped area can be further considered as a miniature airport surface system. The apron U-shaped area is widely used in medium and large airports at home and abroad because of its high apron utilization rate and aircraft leaning rate. According to the number of accesses, the apron U-shaped area can be divided into single-access U-shaped area, double-access U-shaped area, and multi-access U-shaped area. The focus of this paper is on the narrow double-access U-shaped area, which is the most common in the civil aviation system.
Figure 1 shows the general distribution of aprons at Wuhan Tianhe International Airport. The main passenger apron at this airport contains 5 U-shaped areas (aprons 1–5 shown in the figure) and one semi-U-shaped area (apron 6 shown in the figure), and the number of parking stands involved accounts for 70% of the main passenger security stands and 54% of the corridor stands. According to the current operating rules of Wuhan Airport [30,31], only one aircraft is allowed to operate in any one U-shaped area at the same time, resulting in extremely inefficient operations.
To this end, according to regulation documents [32,33], three types of U-shaped area operating procedures are designed in this section, namely exclusive operation procedure, partition-shared operation procedure and global-shared operation procedure. Differentiated arrival and departure aircraft operation rules are also proposed for the different types of apron operating procedures.

3.2. Exclusive Operation Procedure

According to the current operating rules of Wuhan Airport, only one aircraft is allowed to operate in any one U-shaped area at the same time, and we define this operation procedure as the exclusive operation procedure. Under the exclusive operation procedure, only one aircraft is allowed to operate in the apron U-shaped area at a time, and the simultaneous movement of aircraft from adjacent stands is prohibited. This type of operation procedure is the current operation rule for the Wuhan Airport ramp. Taking the departure activity in Figure 2a as an example, if the departing aircraft A in the U-shaped area is pushing out, the arrival aircraft C must wait outside the U-shaped area, and the following departing aircraft B must wait in the stand until aircraft A leaves the U-shaped area. Using the arrival activity in Figure 2b as an example, departing aircraft B within the U-shaped area must queue up in order to await push-back instructions, and arrival aircraft C must wait outside the U-shaped area until aircraft A parks on stand.

3.3. Partition-shared Operation Procedure

Under the partition-shared operation procedure, the apron U-shaped area can be divided into three zones: “outer”, “middle”, and “inner”, and two access in the U-shaped area are being used as one access. For a specific partition, intersection taxiing of arrival and departure aircraft is not allowed (e.g., the paths of aircraft A and B in Figure 3), thus ensuring that aircraft operations meet the airport’s lateral safety separation regulations.
Under the partition-shared operation procedure, the specific aircraft operation rules need to be classified according to the physical structure of the U-shaped area and the aircraft interaction relationship. Figure 4a–c show the aircraft operation rules for different types of arrival and departure activities in different physical structure areas under the partition-shared operation procedure.
Figure 4a shows a scenario where there is a simultaneous pushing back of departure aircraft in the outer and inner sectors. Under the partition-shared operation procedure, only one aircraft A in the outer area and one aircraft B in the inner areas are allowed to be pushed back simultaneously at a time. Departure aircraft C in the middle area and other aircraft D that need to enter the U-shaped area must wait at the stand or outside the U-shaped area entrance until aircraft B from the inner area has left the U-shaped area.
Figure 4b shows a scenario where there are simultaneous-departure aircraft pushing back from the outer and middle areas, respectively. Under the partition-shared operation procedure, if there is a demand for aircraft to push back in the middle and the outer area at the same time, the priority is to push aircraft A in the middle area with extension into the inner area, and then push aircraft B in the outer area after aircraft A in the middle area reaches the designated position in the inner area, and then launch the two aircraft A and B with reference to the scenario of aircraft push back in the outer area and the inner area at the same time. The departure aircraft C in the inner area and other aircraft D that need to enter the U-shaped area must wait at the stand or outside the U-shaped area entrance until aircraft A has left the U-shaped area.
Figure 4c shows a scenario where there are simultaneous departure aircraft from the inner and middle areas, respectively. Under the partition-shared operating procedure, if there is a simultaneous aircraft push-back demand in the inner and middle areas, priority to push back will be given to aircraft A in the middle area and then pull forward the aircraft A to the outer area. After that, aircraft B will be pushed out to the inner area, and then both aircraft A and B in the U-shaped area are pushed out at the same time. The departure aircraft C in the outer area and other Aircraft D that need to enter the U-shaped area must wait at the stand or outside the U-shaped area entrance until aircraft B has left the U-shaped area.
Figure 5a shows a scenario where there are departure aircraft being pushed back from the inner or middle area and arrival aircraft entering the outer area at the same time. The partition-shared operating procedure provides that if there is only one aircraft being pushed out from the inner or middle area (e.g., aircraft A in Figure 5a), and there is also an arrival aircraft outside the U-shaped area whose target stand is in the outer area (e.g., aircraft B in Figure 5a), the departure aircraft A can be pushed out from its stand at the same time as the arrival aircraft B enters the U-shaped area. If there is an operational conflict, aircraft A should wait until the arrival aircraft B pulls into its stand, and then aircraft A can continue to complete the departure process. During this process, the other arrival and departure aircraft must wait outside the U-shaped area or in their stands.
Figure 5b shows a scenario where there are departure aircraft pushing out from the inner area and arrival aircraft entering the middle or outer area at the same time. Under the partition-shared operation procedure, if there is an aircraft being pushed out from the inner area (e.g., aircraft A) and there is also an arrival aircraft outside the U-shaped area with its target stand in the middle or outer area (e.g., aircraft B), the departure aircraft A can be pushed out of the aircraft position at the same time as the arrival aircraft B enters the U-shaped area. If there is an operational conflict, aircraft A should wait until the arrival aircraft B pulls into its stand, and then aircraft A can continue to complete the departure process. During this process, the other arrival and departure aircraft must wait outside the U-shaped area or in their stands.

3.4. Global-Shared Operation Procedure

Under the Global-Shared Operation Procedure, aircraft within the U-shaped area are free to move as required to meet the minimum safety separation of the airport surface. To ensure the lateral safety separation of aircraft, it is stipulated that intersection taxiing of arrival and departure aircraft is not allowed. Take the arrival and departure operation scenario shown in Figure 6 as an example, arrival aircraft B follows departure aircraft A into the U-shaped area. Since the operational distance between aircraft A and B is greater than the safety separation, aircraft B does not need to wait outside and can directly enter the U-shaped area. For departure aircraft C and D, when aircraft C is pushed out from its stand, if the distance between the preceding aircraft D is less than the safety separation, aircraft C needs to wait until the distance between aircraft D meets the minimum safety separation.

4. Apron U-Shaped Area Traffic Operation Model

4.1. Notation

For different apron U-shaped area operation procedures, this section establishes a U-shaped area traffic operation model to enable the simulation of the apron U-shaped area operation process under different operation rules. To facilitate the description, the parameters and variables shown in Table 1 are defined.
Network topology is a widely used method for airport surface operation modeling (Wang, et al., 2020; Ma, et al., 2019) [34,35]. As shown in 
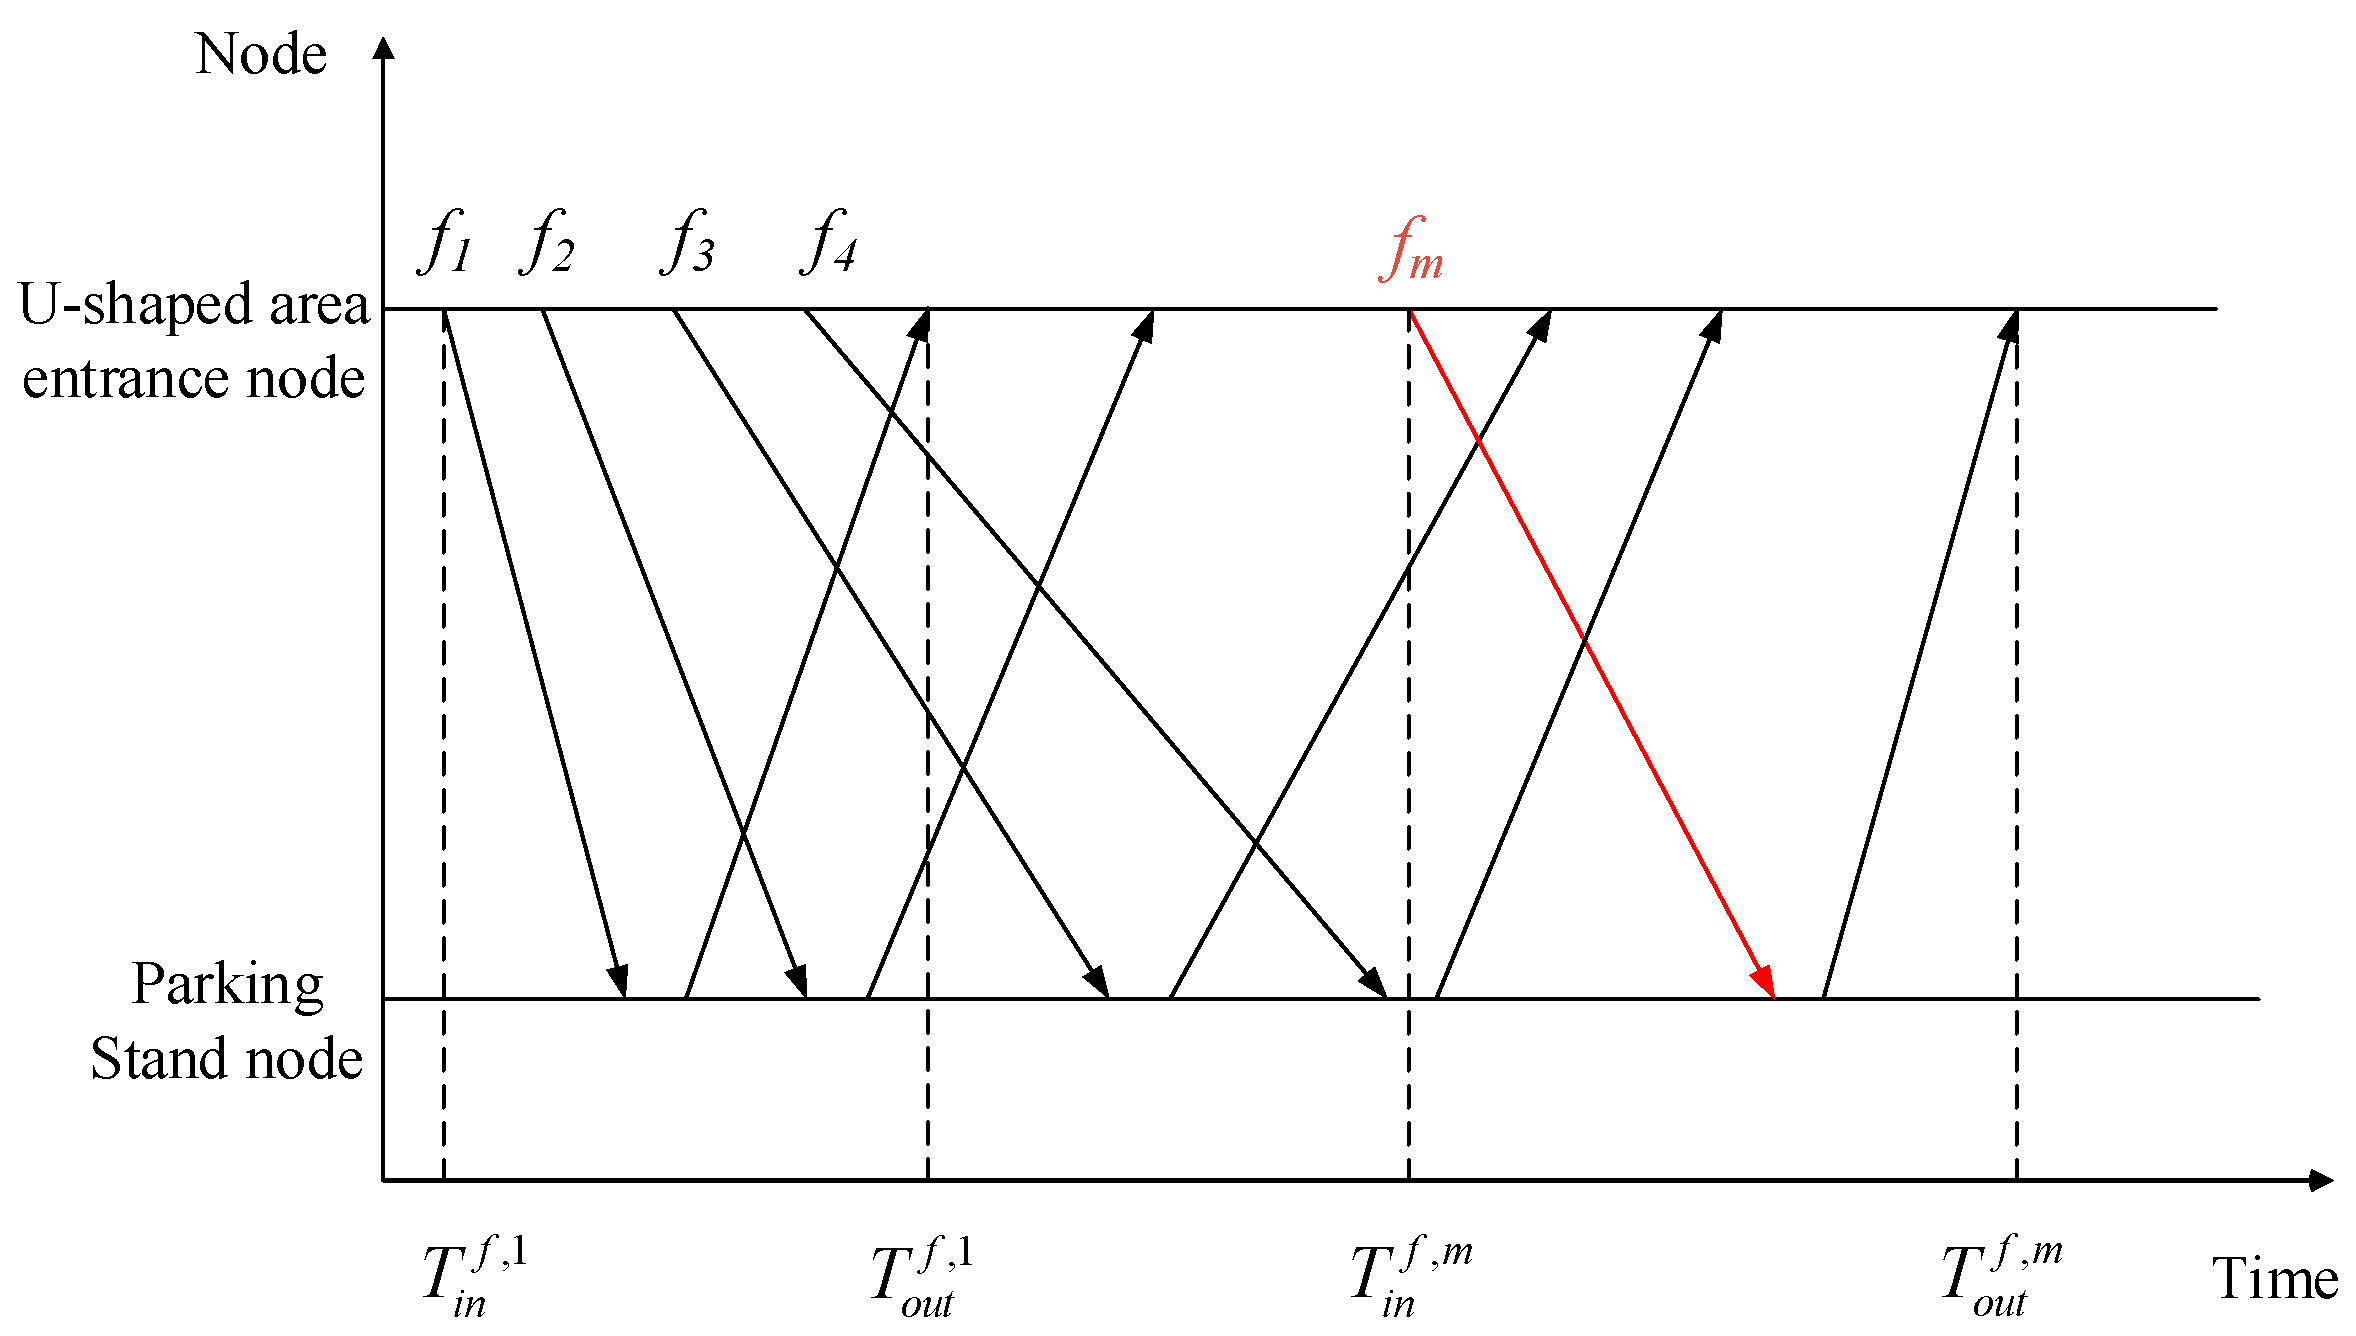
Figure 7, the airport’s runway–taxiway–apron system is abstracted as a set of directed graphs G = (V, E), where V is the set of points and E is the set of directed edges. The nodes in the surface network graph are divided into four parts: runway nodes, taxiway nodes, U-shaped area entrance/exit nodes, and parking stand nodes. The nodes are connected to each other by straight or curved segments.
It is worth noting that the model can be simplified by dividing the aircraft operation in the U-shaped area into two phases. For f F A ( f F D ), the aircraft operation can be divided into two phases: taxiing and stopping into the parking stand (pushing out of the parking stand). V f is defined as the speed of the taxiing phase, which can be considered to be related to the aircraft type. ϖ A f ( ϖ D f ) is the time required to park into a parking stand (push out of a parking stand), which can be considered to be related to the type of aircraft. Based on the operational characteristics of arrival and departure aircraft in the U-shaped area, the operational time of an aircraft in the U-shaped area consists of two parts: taxiing time and waiting time. The time of the two phases of the operation of aircraft f in the U-shaped area can be expressed as the difference between the nodal times, as shown below:
t p ( f ) t e n t r y ( f ) = L p f V f + w f p + ϖ A f       f F A
t e n t r y ( f ) t p ( f ) = L p f V f + w f p + ϖ D f       f F D
where Equation (1) represents the time for an arrival aircraft to travel from the U-shaped area entrance to the parking stand, and Equation (2) represents the time for a departure aircraft to travel from the parking stand to the U-shaped area exit. Considering that aircraft operate on the same route and at the same speed in the U-shaped area, the aircraft through taxi time is the same for different U-shaped area operating procedures, but the difference in operating rules makes a difference in the additional taxi time of aircraft due to waiting under different procedures. Therefore, the following traffic model is carried out for each of the three types of operation procedures.

4.2. Traffic Modeling under Exclusive Operation Procedure

In the following part, we introduce the U-shaped area arrival aircraft queueing set σ A and the departure aircraft queueing set σ D , respectively, because we need a quantitative representation of the aircraft waiting time. σ A f is the set of arrival aircraft that are lined up at the entrance to the U-shaped area when the aircraft f arrives in the U-shaped area (when ready to push back out of the block, f F D ). σ D f is the set of departure aircraft in the U-shaped area that are preparing to push back out of block when the aircraft f reaches the U-shaped area (when preparing to pull out of block, f F D ). σ A f , σ D f , and the aircraft f in operation in the U-shaped area are of great interest because we can use them to classify the aircraft waiting time into three categories. The details are as follows.
Case 1: The arrival aircraft can directly enter the U-shaped area (the departure aircraft can directly push out), i.e., w f p = 0 , f F A F D .
Based on the description in Section 3.2, when an arrival aircraft f reaches the U-shaped area entrance (when the departure aircraft f is ready to push back), there is no need to wait if there is no aircraft in operation in the U-shaped area. It is worth noting that there cannot be a queued aircraft before that aircraft, so σ A f = σ D f = 0 also needs to be satisfied in Case 1.
Case 2: The arrival aircraft f (departure aircraft f ) can enter the U-shaped area directly (can be pushed out directly), but needs to wait for the aircraft f operating in the U-shaped area to leave the U-shaped area (or park on arrival). We obtain
w f p = L p δ f p V f + ϖ A f       f F , f F A , p , p P
w f p = δ f p V f       f F , f F D , p , p P
where f is the aircraft in the U-shaped area that is operating, and the corresponding parking stand of f is p . The following explanations of f and p are the same.
Based on the description in Section 3.2, when the arrival aircraft f reaches the U-shaped area entrance (when the departure aircraft f is ready to push out), it needs to wait for the U-shaped area to be cleared before it can operate in the U-shaped area. It is worth noting that there cannot be a queued aircraft before that aircraft, so σ A f = σ D f = 0 also needs to be satisfied in Case 2.
Case 3: The arrival aircraft f (departure aircraft f ) can enter the U-shaped area directly (can be pushed out directly), but needs to wait for the aircraft f operating in the U-shaped area, σ A f and σ D f to leave the U-shaped area (or park on arrival). We obtain
w f p = L p f δ f p V f + σ A f L p f V f + σ A f ϖ A f + σ D f L p f V f + σ D f ϖ D f       f F , f F A , p , p P
where f is the aircraft in the U-shaped area that is operating, and the corresponding parking stand of f is p .
Based on the description in Section 3.2, when the arrival aircraft f reaches the U-shaped area entrance (when the departure aircraft f is ready to push out), it needs to wait for the U-shaped area to be cleared before it can operate in the U-shaped area. Also, we note that based on the first-come first-served (FCFS) principle (Ma J, et al., 2019) [35], the demand of the aircraft queued before that aircraft should be satisfied first. So, the condition used in Case 3 is σ A f 0 σ D f 0 .

4.3. Traffic Modeling under Partition-Shared Operation Procedure

We can also divide the aircraft waiting time into three categories by σ A f , σ D f , and the aircraft operating in the U-shaped area based on the description in Section 3.3 and Section 4.2. The details are as follows.
Case 1: Same as case 1 in the Exclusive Operation Procedure, the arrival or departure aircraft can directly enter the U-shaped area or push out, i.e., w f p = 0 , f F A F D .
Based on the description in Section 3.3, in this scenario, there is no need to wait if there is no aircraft in operation in the U-shaped area. We also note that the partition-shared operation procedure is different from the exclusive operation procedure. There is no need to wait for aircraft f when the partitional area of the parking stand of f is different from that of the aircraft f in operation, as shown in Equation (6).
w f p = 0 δ f p > X 23 , p P 1 P 2 , p P 3 , f , f F A δ f p > X 12 , p P 1 , p P 2 P 3 , f , f F A δ f p < X 12 , p P 3 , p P 1 P 2 P 3 , f , f F D
where X 12 is the distance from the middle area boundary to the U-shaped area entrance/exit, X 23 is the distance from the inner area boundary to the U-shaped area entrance/exit.
It is worth noting that there cannot be a queued aircraft before that aircraft, so σ A f = σ D f = 0 also needs to be satisfied in Case 1.
Case 2: Except for Case 1, the arrival aircraft f (departure aircraft f ) can enter the U-shaped area directly (can be pushed out directly), but needs to wait for the aircraft f operating in the U-shaped area to leave the U-shaped area (or park on arrival). We obtain
w f p = L p δ f p V f + ϖ A f       f F , f F A , p , p P
w f p = δ f p V f       f F , f F D , p , p P
We can conclude that departure aircraft located in the middle area can use long push as well as push-and-pull strategies to reduce the delay time based on the description in Section 3.3. From this, we define the time of the long push of the departure aircraft in the middle area as ϖ D L f ; when p P 2 , the delay time w f p in the long push case is shown in the following equation.
w f p = t e a r l y f × + ϖ D f × t e a r l y f ϖ D L f , p P 2 , p × P 1 , f , f × F D
where f × is the aircraft queued next to and after f on FCFS principle.
It is worth noting that there cannot be a queued aircraft before that aircraft, so σ A f = σ D f = 0 also needs to be satisfied in Case 2.
Case 3: The arrival aircraft f (departure aircraft f ) can enter the U-shaped area directly (can be pushed out directly), but needs to wait for the aircraft f operating in the U-shaped area, σ A f and σ D f to leave the U-shaped area (or park on arrival), and the operation separations for σ A f and σ D f are considered. We obtain
w f p = w f p + w f p *
where w f p consists of two components. w f p is the waiting time for an aircraft in operation and is calculated by Equations as shown in Case 2. w f p * is the waiting time between aircraft operations in σ A f and σ D f , which is the additional delay time due to FCFS strategy. The following explanations of w f p , w f p and w f p * are the same.
Based on the description in Section 3.3, when the arrival aircraft f reaches the U-shaped area entrance (when the departure aircraft f is ready to push out), it needs to wait for a safety separation to exist with all aircraft in the U-shaped area before it can operate. Also, we note that based on the FCFS principle, the demand of the aircraft in line before that aircraft should be satisfied first. So, the condition used in Case 3 is σ A f 0 σ D f 0 . Therefore, in Case 3, w f p * is added to the waiting time of aircraft f on basis of Equation (10). The value of w f p * is related to the aircraft f * that immediately precedes aircraft f in queue σ A f as well as σ D f on FCFS basis. w f p * can be calculated by Equation (11):
w f p * = t e a r l y f * + w f * p * t e a r l y f , f * σ A σ D , f F

4.4. Traffic Modeling under Global-Shared Operation Procedure

We can divide the aircraft waiting time into three categories by σ A f , σ D f , and the aircraft operating in the U-shaped area based on the description in Section 3.4 and Section 4.2. The details are as follows:
Case 1: Same as case 1 in the Exclusive Operation Procedure and Partition-Shared Operation Procedure, the arrival or departure aircraft can enter or push out from the U-shaped area directly, i.e., w f p = 0 , f F A F D .
Based on the description in Section 3.4, in this scenario, there is no need to wait if there is no aircraft in operation in the U-shaped area. We also note that the global-shared operation procedure is different from the exclusive operation procedure. There is no need to wait for aircraft f as long as the lowest separation of the aircraft is satisfied, the detail is shown in Equation (12).
w f p = 0 δ f p > d min , f , f F A L p δ f p > d m i n , f , f F D
where d min is the minimum safe separation between aircraft in a U-shaped zone and f is the aircraft in the U-shaped area that is operating whose corresponding parking stand is p .
Case 2: the arrival aircraft f (departure aircraft f ) can enter the U-shaped area directly (can be pushed out directly), but it needs to wait until there is a safe separation between f and the aircraft f 1 , f n in operation in the U-shaped area. When the arrival aircraft reaches the entrance of the U-shaped area (when the departure aircraft is ready to be pushed out), there may be more than one aircraft in operation in the U-shaped area. The waiting time of the arrival aircraft at the entrance (the waiting time of the departure aircraft at the parking stand) shall be determined according to the number of aircraft in operation and their status (arrival or departure). We obtain
w f p = max ( max ( δ f 1 p V f 1 , δ f 2 p 2 V f 2 , , δ f n p n V f n ) , 0 ) t e a r l y f , f F A , f 1 f n F D max ( max ( d min δ f 1 p V f 1 , d min δ f 2 p 2 V f 2 , , d min δ f n p n V f n ) , 0 ) t e a r l y f , f , f 1 f n F A max ( max ( L p 1 δ f 1 p V f 1 , L p 2 δ f 2 p 2 V f 2 , , L p n δ f n p n V f n ) , 0 ) t e a r l y f , f F D , f 1 f n F A max ( max ( L p δ f 1 p + d m i n V f 1 , L p δ f 2 p 2 + d m i n V f 2 , , L p δ f n p n + d m i n V f n ) , 0 ) t e a r l y f , f , f 1 f n F D
where t e a r l y f is the earliest time to enter the U-shaped area (the earliest off-block time) for f F A ( f F D ). It is worth noting that there cannot be a queued aircraft before that aircraft, so σ A f = σ D f = 0 also needs to be satisfied in Case 2.
Case 3: The arrival aircraft f (departure aircraft f ) can enter the U-shaped area directly (can be pushed out directly), but the it need to wait for safety separations between f and the aircraft operating in the U-shaped area ( f ) as well as the aircraft in queueing list ( σ A f and σ D f ) are satisfied, as shown in Equation (10).
Based on the description in Section 3.4, when the arrival aircraft f reaches the U-shaped area entrance (when the departure aircraft f is ready to push out), it needs to wait for a safety separation to exist with all aircraft in the U-shaped area before it can operate. Also, we note that based on the FCFS principle, the demand of the aircraft in line before that aircraft should be satisfied first. So, the condition used in Case 3 is σ A f 0 σ D f 0 . Therefore, in Case 3, w f p * is added to the waiting time of aircraft f on basis of Equation (13). The value of w f p * is related to the aircraft f * that immediately precedes aircraft f in queue σ A f as well as σ D f on FCFS basis. w f p * can also be calculated by Equation (11):

5. Multi-Dimensional Operational Performance Evaluation of Apron U-Shaped Area

To evaluate the implementation performance of the previously established operation procedures and rules as well as traffic models of the apron U-shaped area, in this section, we establish a multi-dimensional operating performance evaluation index system for the apron U-shaped area from the perspectives of safety, efficiency, and environmental protection, and propose a classification measurement and integrated evaluation method for the operating performance of the apron U-shaped area.

5.1. Safety Operating Performance Indices

We describe the proposed safety operation performance indices at both macro as well as micro levels. The probability of conflict between flights is used as a macro-level index of apron safety performance. The inefficiency of the surface operation due to the excessive pursuit of U-shaped area operation safety can also be reflected in the high probability of inter-aircraft conflict. The conflict variable N f m is introduced for a queue containing m aircraft. If a flight is delayed due to a conflict within the U-shaped area, N f m is 1; otherwise, it is 0. The conflict probability is calculated in Equation (14). Conflict resolution time as well as instantaneous traffic volume indices are used as micro-level indices. The delay time can reflect the severity of the conflict from the side, and the delay time can also be referred to as the conflict resolution time. w f is introduced as the waiting time of the aircraft. For a queue containing m aircraft, the total conflict resolution time is calculated in Equation (16). Relying on the spatial–temporal network of aircraft operations, the instantaneous traffic volume index we proposed can reflect the magnitude of potential unsafe events with aircraft. Based on the macroscopic distribution network (MDN) modeling method (Yin, et al., 2018) [21] of scene traffic proposed by Yin, as shown in Figure 8, we can consider that there are two aircraft with which there is a potential risk of collision during the operation of aircraft f m in the U-shaped area, because there are two aircraft in operation other than f m during the operation period of f m in the U-shaped area. Introducing the instantaneous traffic for a queue containing m aircraft, the total instantaneous traffic is calculated in Equation (17).
The conflict variable N f m is introduced. For a queue containing m aircraft, the following conflict judgment conditions are defined:
N f m = 1 w f > 0 0 w f = 0       f F A F D
where w f is the waiting time of aircraft f , then the probability of conflict is
P = m = 1 | m | N f m m       f F
and the conflict resolution time is
C t = m = 1 | m | f F ( N f m × w f )
A discrete time window T = { 1 , 2 , , | T | } (Guepet, et al., 2017) [36] is assumed, and in a queue containing m aircraft, the U-shaped area traffic volume at time i can be expressed as
Q m ( i ) = C a r d { f | T i n f , m i T o u t f , m }
where T i n f , m and T o u t f , m are the time when the m aircraft enters or leaves the U-shaped area.

5.2. Resource Use Efficiency Indices

We select two indices of maximum traffic volume and saturation to measure the resource utilization of the U-shaped area of the apron. Among them, the maximum traffic volume reflects the maximum number of arrival and departure aircraft in the U-shaped area at a certain time, which can reflect the instantaneous occupation of apron operating resources but cannot reflect the average utilization of resources in a certain period. In view of this, the “saturation” index is further defined, that is, the ratio between the average traffic flow and the supply capacity in a specific period in the U-shaped area, which is used to reflect the capacity resource utilization in the U-shaped area.
As shown in Figure 8, the instantaneous traffic volume in the U-shaped area of the apron is calculated, the arrows represent the process of arrival aircraft from the entrance node of the U-shaped area to the parking node or departure aircraft from the parking node to the entrance node of the U-shaped area.
The maximum traffic volume can be expressed as on the basis of Equation (17):
Q max = max { Q m ( i ) }
The average traffic flow in the U-shaped area is
Q = i Q m ( i ) | T |
The saturation of the apron U-shaped area can be expressed as
ρ = Q C = i Q m ( i ) C | T |
where C is the capacity of U-shaped area.

5.3. Fuel Saving and Emission Reduction Indices

Green aviation is the focus and development trend of the global aviation industry. In order to promote airport surface fuel saving and emission reduction, aircraft fuel consumption and carbon emissions under different operation procedures are included in the index system, and the fuel flow rate and taxiing time of aircraft under slow traffic are used for weighted calculation. The taxiing fuel consumption of a flight can be expressed as
F f = t f × n f × μ f
where μ f is engine fuel flow rate (kg/s); t f is the airport surface taxiing time (s); n f is the number of engines.
The CO2 emission during the airport surface taxiing phase under the slow state of aircraft is expressed as
E = F f × ω 1 × ω 2
where E is the CO2 emission of a single aircraft (kg); F f is the taxiing fuel consumption of the flight f (kg); ω 1 is the coefficient of aviation kerosene converted into standard coal and the value is 1.4714; ω 2 is the coefficient of standard coal converted into carbon emission and the value is 3.155 (Wang, et al., 2021) [37].

5.4. Integrated Evaluation Indices

Based on Section 3.1 to 3.3, the empowerment method of Critic (Zhang, et al., 2012) [38] is used to integrate the characteristics of various indices, and the weight coefficient is introduced to weight the safe operation performance index, resource utilization efficiency index, and fuel saving and emission reduction index, and the multi-dimensional operation performance evaluation model of the airport U-shaped area is obtained as
M = γ 1 P + γ 2 C t + γ 3 Q m + γ 4 ρ + γ 5 F f + γ 6 E
where γ 1 , γ 2 , γ 3 , γ 4 , γ 5 , γ 6 are the index weights of conflict probability, conflict resolution time, maximum traffic volume, saturation, fuel consumption, and carbon emissions, respectively.

6. Simulation and Verification of Operation Procedure in Apron U-Shaped Area

6.1. Time Constraints-Based Simulation Model for Apron Operations

In order to evaluate the apron U-shaped area operation procedures and performance, this section constructs a simulation model of apron operation considering time constraints and performs simulation extrapolations of the three apron U-shaped area operation procedures designed in Section 3. The apron simulation environment is coded in Python 3.6 and run on a PC with Intel i7-9700KF8C8T, 3.60 GHz and 16.0 GB RAM. The relevant parameters were set as follows:
(1)
The runway operation mode is segregated parallel operation.
(2)
Aircraft taxiing speed by area: average taxiing speed in the maneuvering area is 30 km/h, the average taxiing speed in the apron is 10 km/h, and the average taxiing speed in the U-shaped area is 8 km/h.
(3)
The longitudinal safety separation of aircraft is 50 m.
The Monte-Carlo method (Wang, et al., 2018; Roa, et al., 2020) [39,40] was used to generate simulated flight flows in the apron U-shaped area. In order to analyze the operational performance of the U-shaped area at different traffic intensities, the Poisson distribution parameter was increased from 20 to 50 aircraft/h in increments of 5, and the ratio of arrival and departure sorties was designed to be 1:1, with 1000 simulations under each procedure.
To make the apron operation simulation closer to the real situation, the following time constraints were established for the aircraft surface taxiing process.
Assume that F = f 1 , , f n is the set of aircraft in the study period, R i is the corresponding taxi path of the aircraft f i , the set of nodes of the path is R i = u i 1 , u i 2 , , u i k i where u i p V , ( u i p , u i , p + 1 ) E , and p = 1 , , k i 1 , and t i u is the time at which the aircraft f i passes through the nodes u on the taxi path R i .
We introduce the 0–1 variable x i j u , and x i j u = 1 indicates that the aircraft f j arrives at the node u immediately after the aircraft f i ; otherwise, x i j u = 0 . For f i , f j F , i j , the time constraint is as follows:
Case 1: If u is not the U-shaped area entrance node or the parking stand node, and aircraft f j reached node u immediately after the aircraft f i (i.e., x i j u = 1 ), then we have
t j u > x i j u t i u , u R i R j
Case 2: If u is the U-shaped area entrance node, and other conditions are the same as in case 1, then
t j u > x i j u t i u + w , u R i R j
where w is the waiting time of aircraft entering or leaving the U-shaped area due to different operation rules.
In order to define the uniqueness of the sequential relationship between the aircraft f j and the aircraft f i , the following constraint is established:
x i j u + x j i u = 1 , u R i R j
In addition, for conflict detection and deconfliction during taxiing, constraints are established to avoid four types of conflict situations, namely, cross-conflict, tail-chase conflict, head-to-head conflict, and taxiway waiting conflict, respectively (Yin, 2011) [41], which are not described in detail in this section.

6.2. Experimental Results and Comparative Analysis

6.2.1. Comparison of Different Indices of U-Shaped Area

Based on the time-constrained apron operation simulation model constructed, a computer simulation capacity evaluation method was used to evaluate the apron U-shaped area operation capacity corresponding to the three types of operation procedures. The capacity of the U-shaped area for the exclusive, partition-shared and global-shared operation procedures is 52, 58, and 61 aircraft per hour, respectively. It can be seen that the global-shared operation procedure can increase the apron capacity by 14.8% and 5.0% compared to the exclusive and partition-shared operation procedures, respectively.
We calculate the flight flow and indices of Wuhan Airport for a particular day based on the real operational data of the airport and record them in Figure 9, which shows the results of the relationship analysis between flight flow and different indices under different U-shaped area operation procedures. It can be seen that when the flight flow rate is less than 30 aircraft per hour, i.e., when the capacity and flow ratios of the exclusive, partition-shared and global-shared operation procedures are less than 57.7%, 51.7%, and 49.2%, respectively, the difference in the number of conflicts occurring under the three operation procedures is small, and the degree of mutual interference between aircraft on the apron is low. As the flight flow rate increased, the capacity and flow ratio of each operation procedure increased, and the difference in the conflict probability of the three operation procedures gradually became obvious. The conflict probability for all three types of operation procedures increased, with 34.6%, 32.4%, and 24.9% for exclusive, partition-shared, and global-shared operation procedures, respectively. The increase in conflict probability was more pronounced for the exclusive operation procedure and the partition-shared operation procedure than for the global-shared operation procedure.
As for the analysis results of the relationship between flight flow and conflict resolution time under different U-shaped area operation procedures, we note that when the flight flow rate is less than 25 vehicles/h, i.e., when the capacity ratios of the exclusive, partition-shared, and global-shared operation procedures are less than 48.1%, 43.1%, and 41.0%, respectively, the difference in the conflict resolution time of the three operating procedures is small. The increase in conflict resolution time for the three operation procedures is 1754.5 s, 6430 s, and 8260 s, respectively, and the increase in conflict resolution time for the global-shared operation procedure is more moderate compared with the other two operation procedures. The reason for this is that when the traffic volume exceeds a critical value, the interaction between aircraft deepens, and due to the strict limitations of the exclusive operation procedure, the total number of waits and the total time spent at the U-shaped area entrance are bound to increase as the traffic volume continues to increase, which inevitably leads to local congestion on the apron system. In contrast, the global-shared operation procedure is less restrictive and can be dynamically adjusted according to the flight flow, so the conflict probability and conflict resolution time are less affected by the flight flow and the operation efficiency is higher.
In terms of the resource use efficiency indices, when the flight flow is small, there is no difference in the average maximum traffic volume corresponding to the three operation procedures (e.g., when the flight flow is 20 vehicles/h). When the flight flow is 50 vehicles/h, the maximum traffic volume per unit time is one vehicle for the exclusive operation procedure, two vehicles for the partition-shared operation procedure, and four vehicles for the global-shared operation procedure. When the flight volume is less than 35 vehicles/h, there is no difference in the saturation of the U-shaped area corresponding to the three operation procedures. When the flight volume increases from 35 to 50 vehicles/h, the saturation corresponding to the exclusive, partition-shared and global-shared operation procedures increases by 11.4%, 20%, and 42.7%, respectively. This is due to the different degrees of restriction of the three operation procedures. The exclusive operation procedure only allows one aircraft to taxi in the U-shaped area, which is much lower than the actual capacity of the U-shaped area, leading to low saturation and its resource utilization is not high. In contrast, the global-shared operation procedure allows aircraft to reach the limit of operation as much as possible while maintaining the safety separation, so the apron saturation is high and the resource utilization is relatively high.
Figure 10 shows the total fuel consumption and carbon emissions of the aircraft in the three operating procedures at different flight flows. When the flight traffic is small, the difference in fuel consumption and carbon emission of the three operation procedures is small. As the traffic volume increases, the fuel consumption and carbon emission of the three operating procedures increase. The total fuel consumption and carbon emission of the three operation procedures increase when the flight flow reaches 30 to 50 vehicles/h. Compared with the global-shared operation procedure, the trend of increase is more significant for the exclusive and the partition-shared operation procedure, in which the total fuel consumption and carbon emission of the exclusive, partition-shared and global-shared operation procedure increase by 35.6%, 30.4%, and 23.9%, respectively. When the flight volume is 50 flights/h, the capacity and traffic flow ratios are 96.1%, 86.2%, and 82.0% for the exclusive, partition-shared, and operation procedures, respectively, and compared with the global-shared operation procedure, the average daily fuel consumption of a single aircraft increases by 3.6 kg and 2.4 kg for the exclusive and partition-shared operation procedures, respectively, and the average daily carbon emission of a single aircraft increases by 16.7 kg and 11.0 kg respectively, which translates into an increase of 1.2 tons and 0.8 tons of carbon emissions in a year.
The Critic method is used to objectively assign weights to conflict indices and resource utilization indices to further analyze the comprehensive evaluation indices of the U-shaped area. Figure 11 shows the comprehensive evaluation results of each of the three operation procedures for 1000 simulations at increasing flight flows, and Figure 12 shows the trend of the comprehensive evaluation indices with simulated flight flows under the three operation procedures. It can be seen that the performance of the global-shared operation procedure is completely superior to the other two procedures, and the advantage becomes more and more significant as the flight traffic increases.

6.2.2. Simulation-Based Comparison of U-Shaped Area

Once the simulation process is finished, the simulation-base operation solutions such as the waiting times of aircraft in U-shaped area and the number of conflicts on the surface network can be output, and the simulation-base solutions will be analyzed in this part to evaluate the performance of U-shaped area.
The waiting times of aircraft in U-shaped area for 1000 simulations under three operation procedures are displayed using statistical frequency distribution. Figure 13 shows the comparison of frequency distributions for traffic flow from 20 to 50 aircraft/h under three operation procedure scenarios, in which we note that the number of waiting times in 1000 simulations obey the normal distribution and the mean and standard deviation can provide a reference in the performance comparison. In the figure, no significant differences can be clearly observed for the standard deviation, while it is clear that the number of waits in the U-shaped area as the traffic flow increases under three operation procedures, and it is aggregated that there is a significant increase in exclusive operation procedure compared to partition-shared and global-shared operation procedures.
Figure 14 shows the number of conflicts on each node during the simulation period under the traffic flow of 45 aircraft/h. It is seen that the major conflicts arise near the entrance of the U-shaped area, where aircraft wait for entering the U-shaped area under the limitation of different operation rules. Another area with a high probability of conflicts is the accesses in the U-shaped area, with significant taxiing activities in the U-shaped area. Under three operation procedure scenarios, the conflicts have been significantly reduced when using the global-shared operation procedure compared with the exclusive and partition-shared operation procedure.

7. Conclusions

For this study, we designed three types of U-shaped area operation procedures for complex airport apron systems and constructed arrival and departure traffic operation rules and mathematical models for each operation procedure. To evaluate the performance of the operation on the apron, we proposed a U-shaped area operation performance evaluation index system and evaluation methods from three dimensions: safety, efficiency, and environmental protection, which should be taken into account in airport surface operation. A case study of the Wuhan Tianhe Airport was carried out to quantitatively assess the operation procedures proposed, including simulation evaluation and comprehensive verification analysis of apron U-shaped area operation under different operation procedures and flight flows.
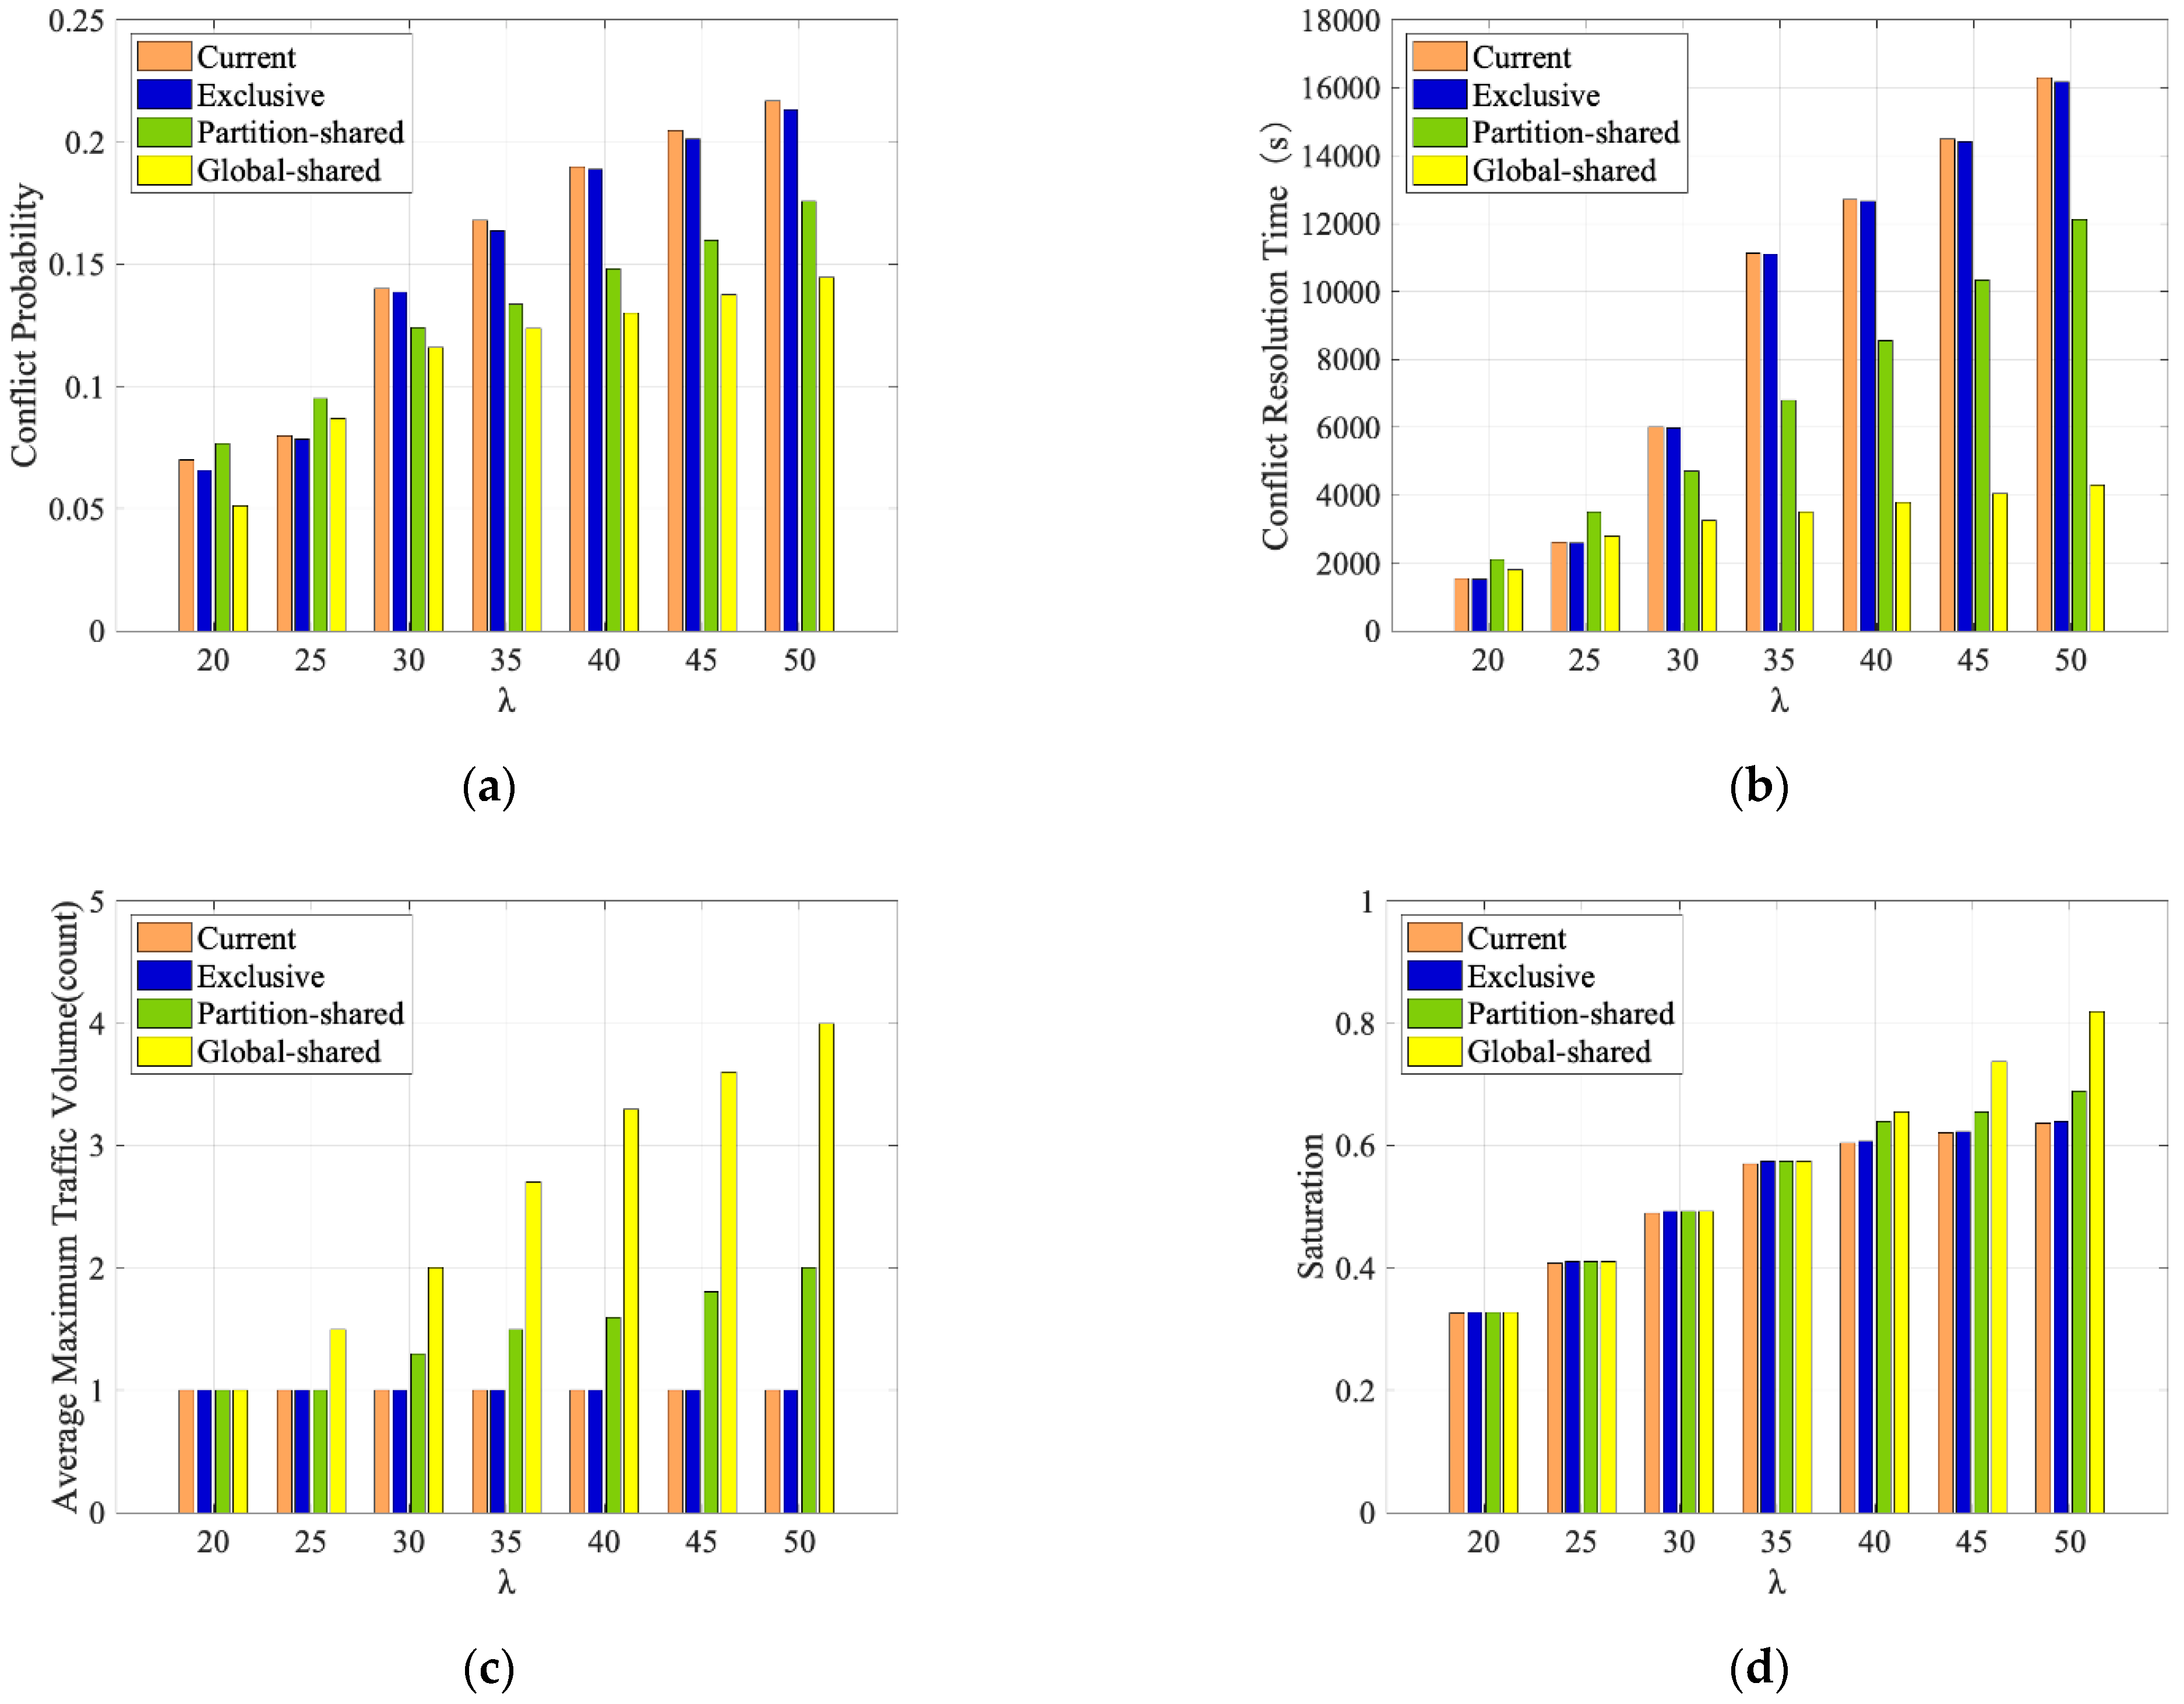
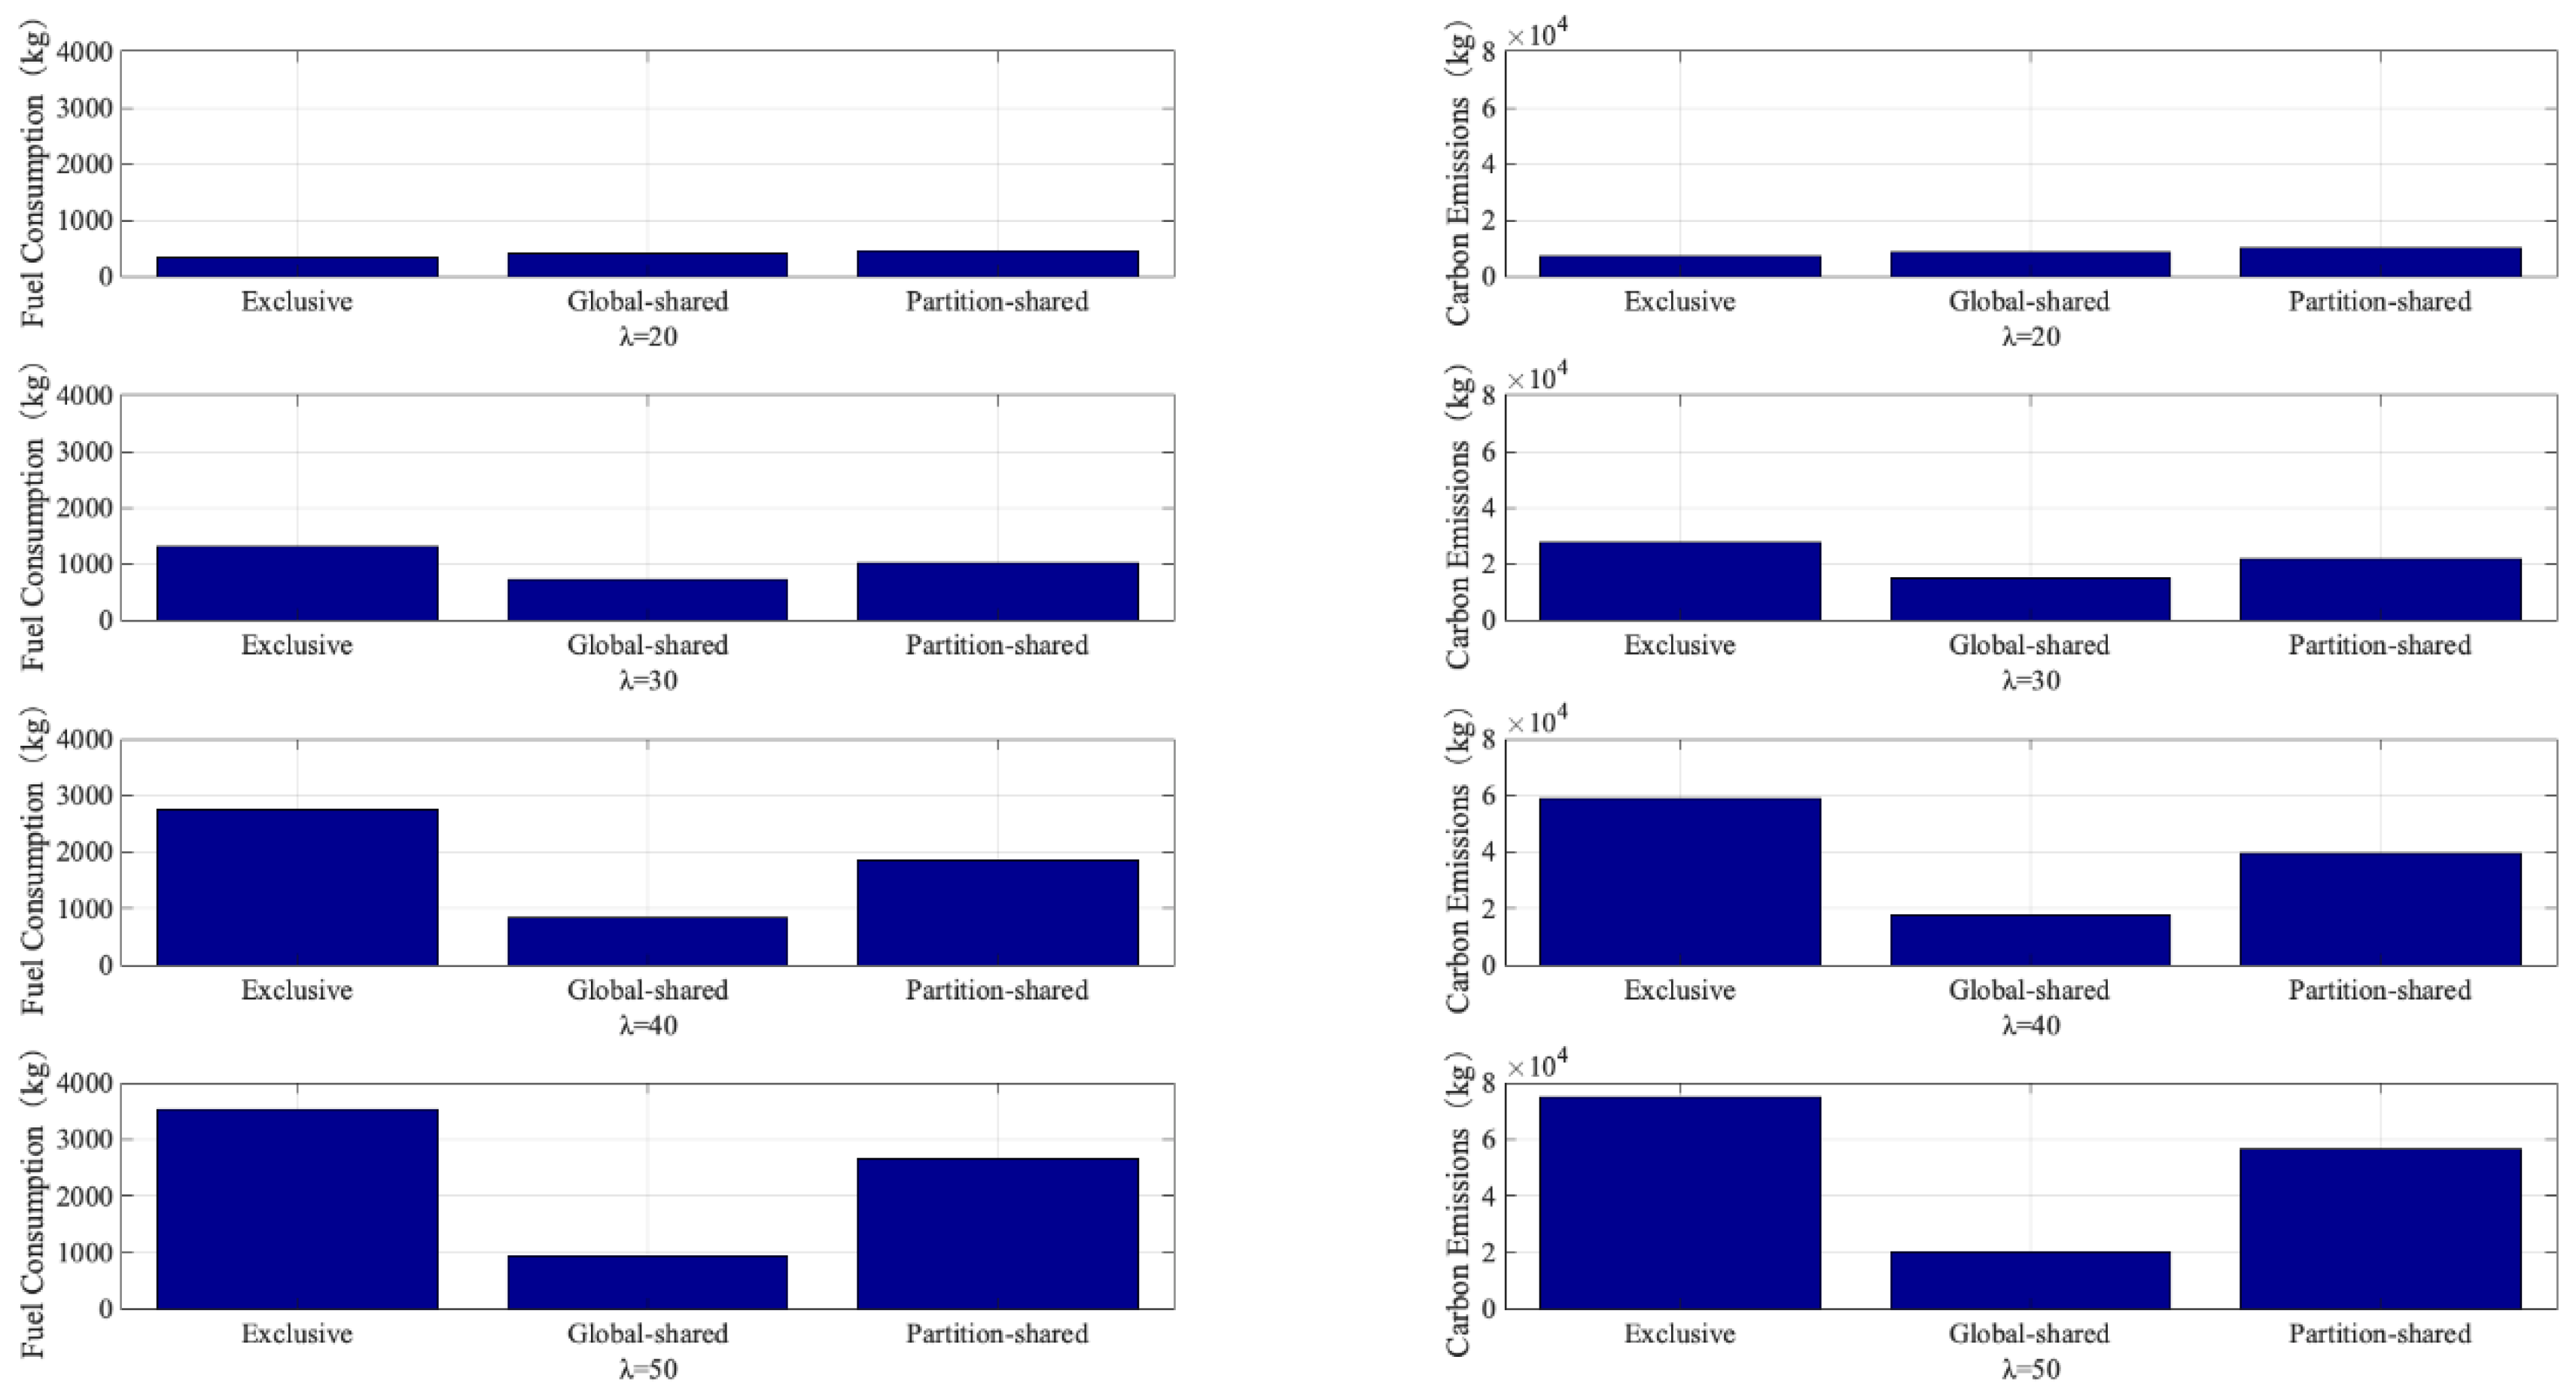
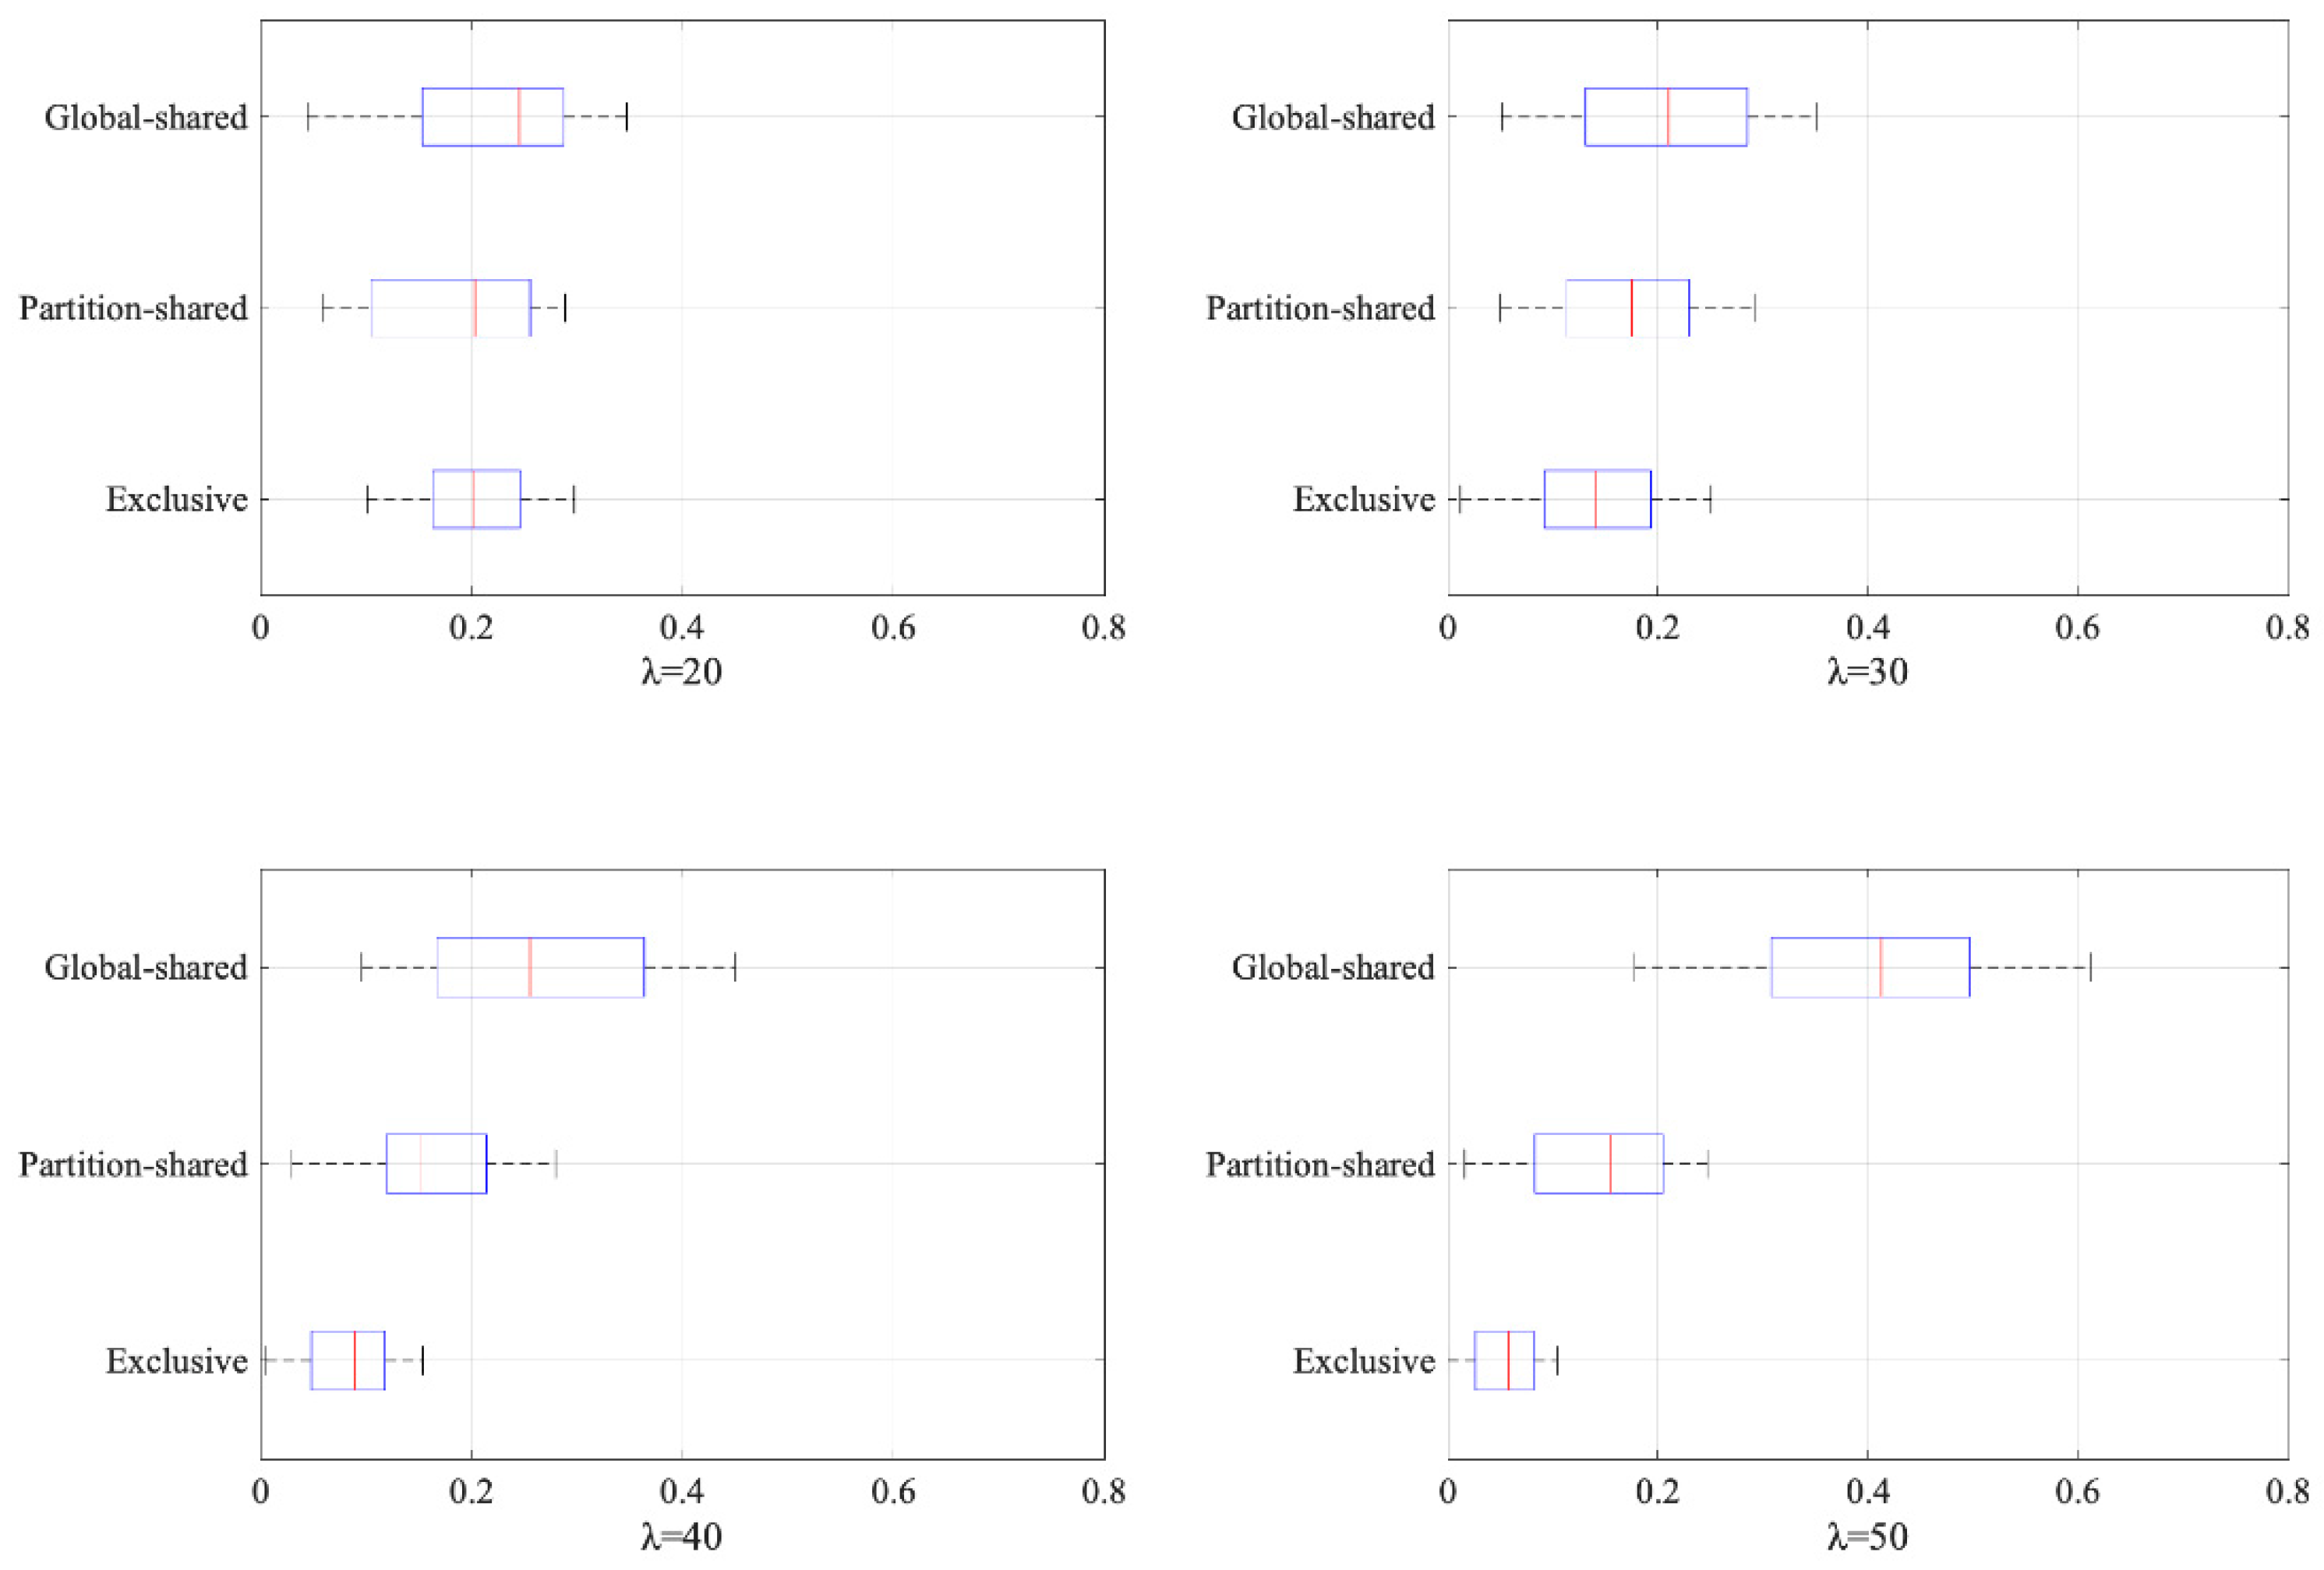
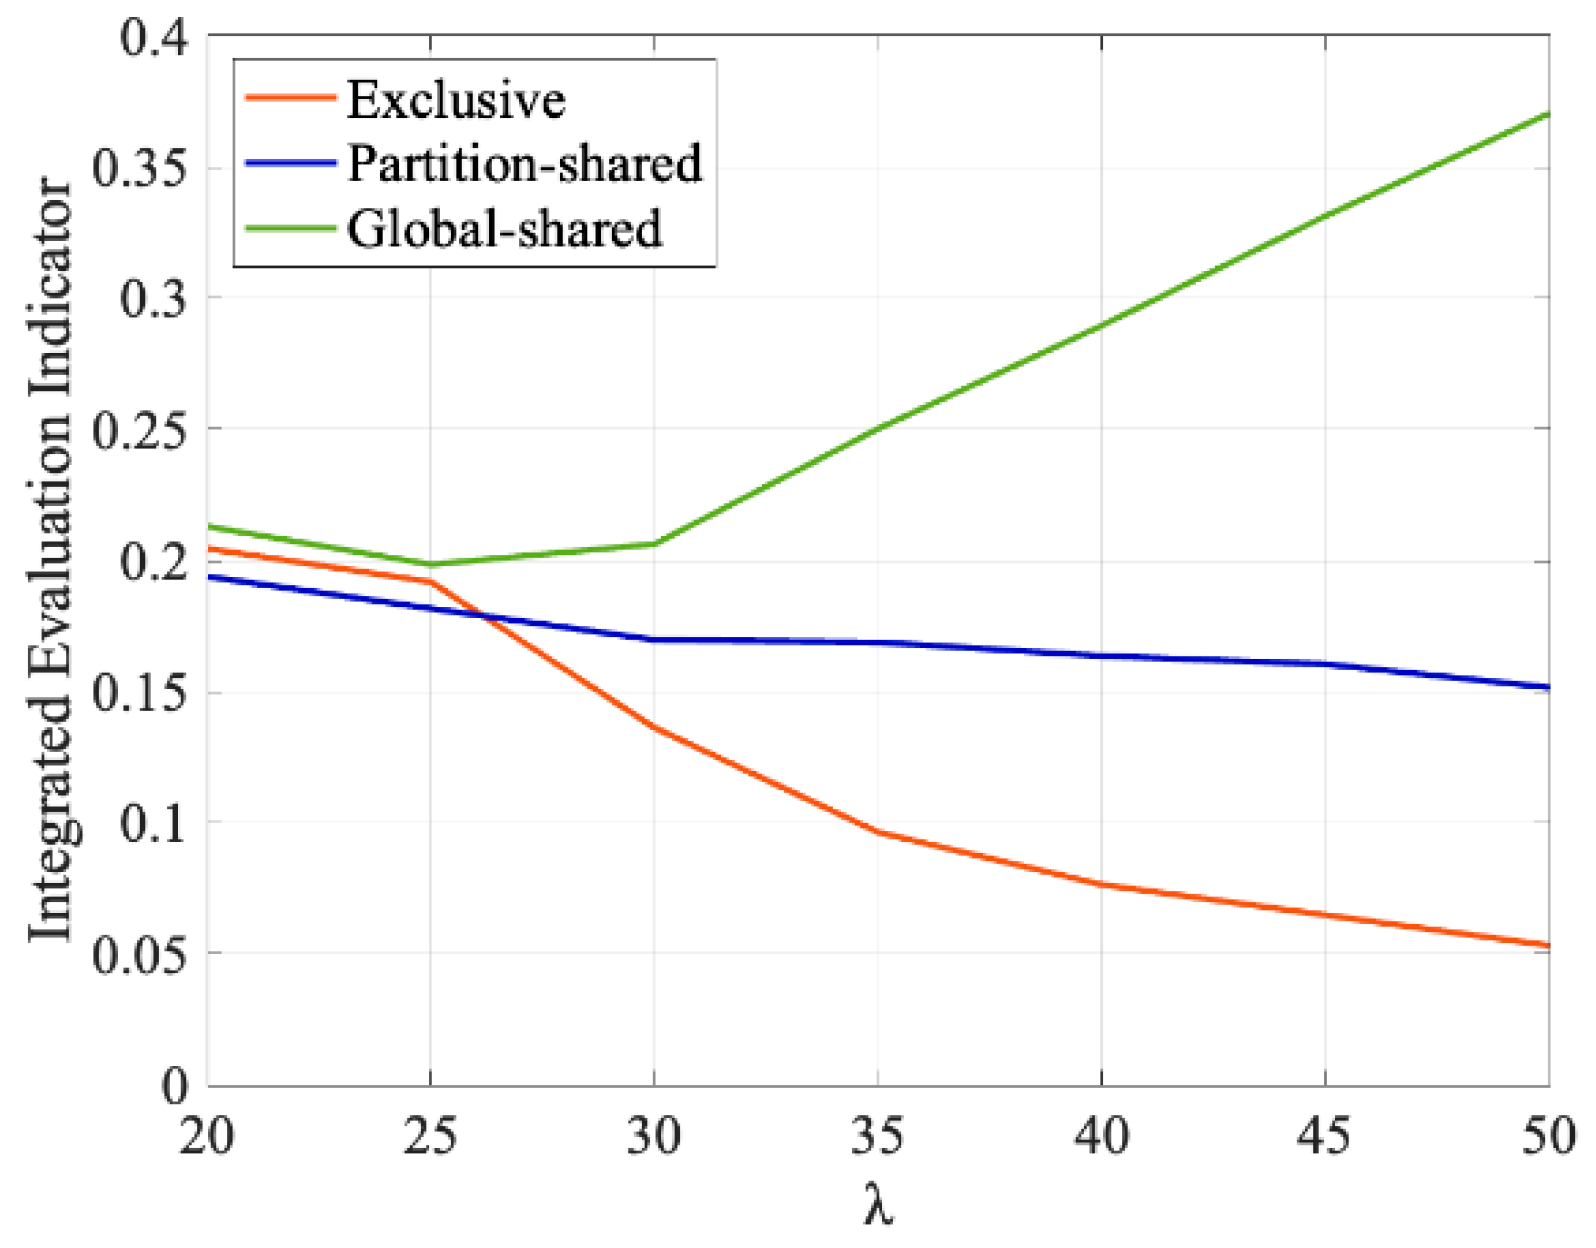
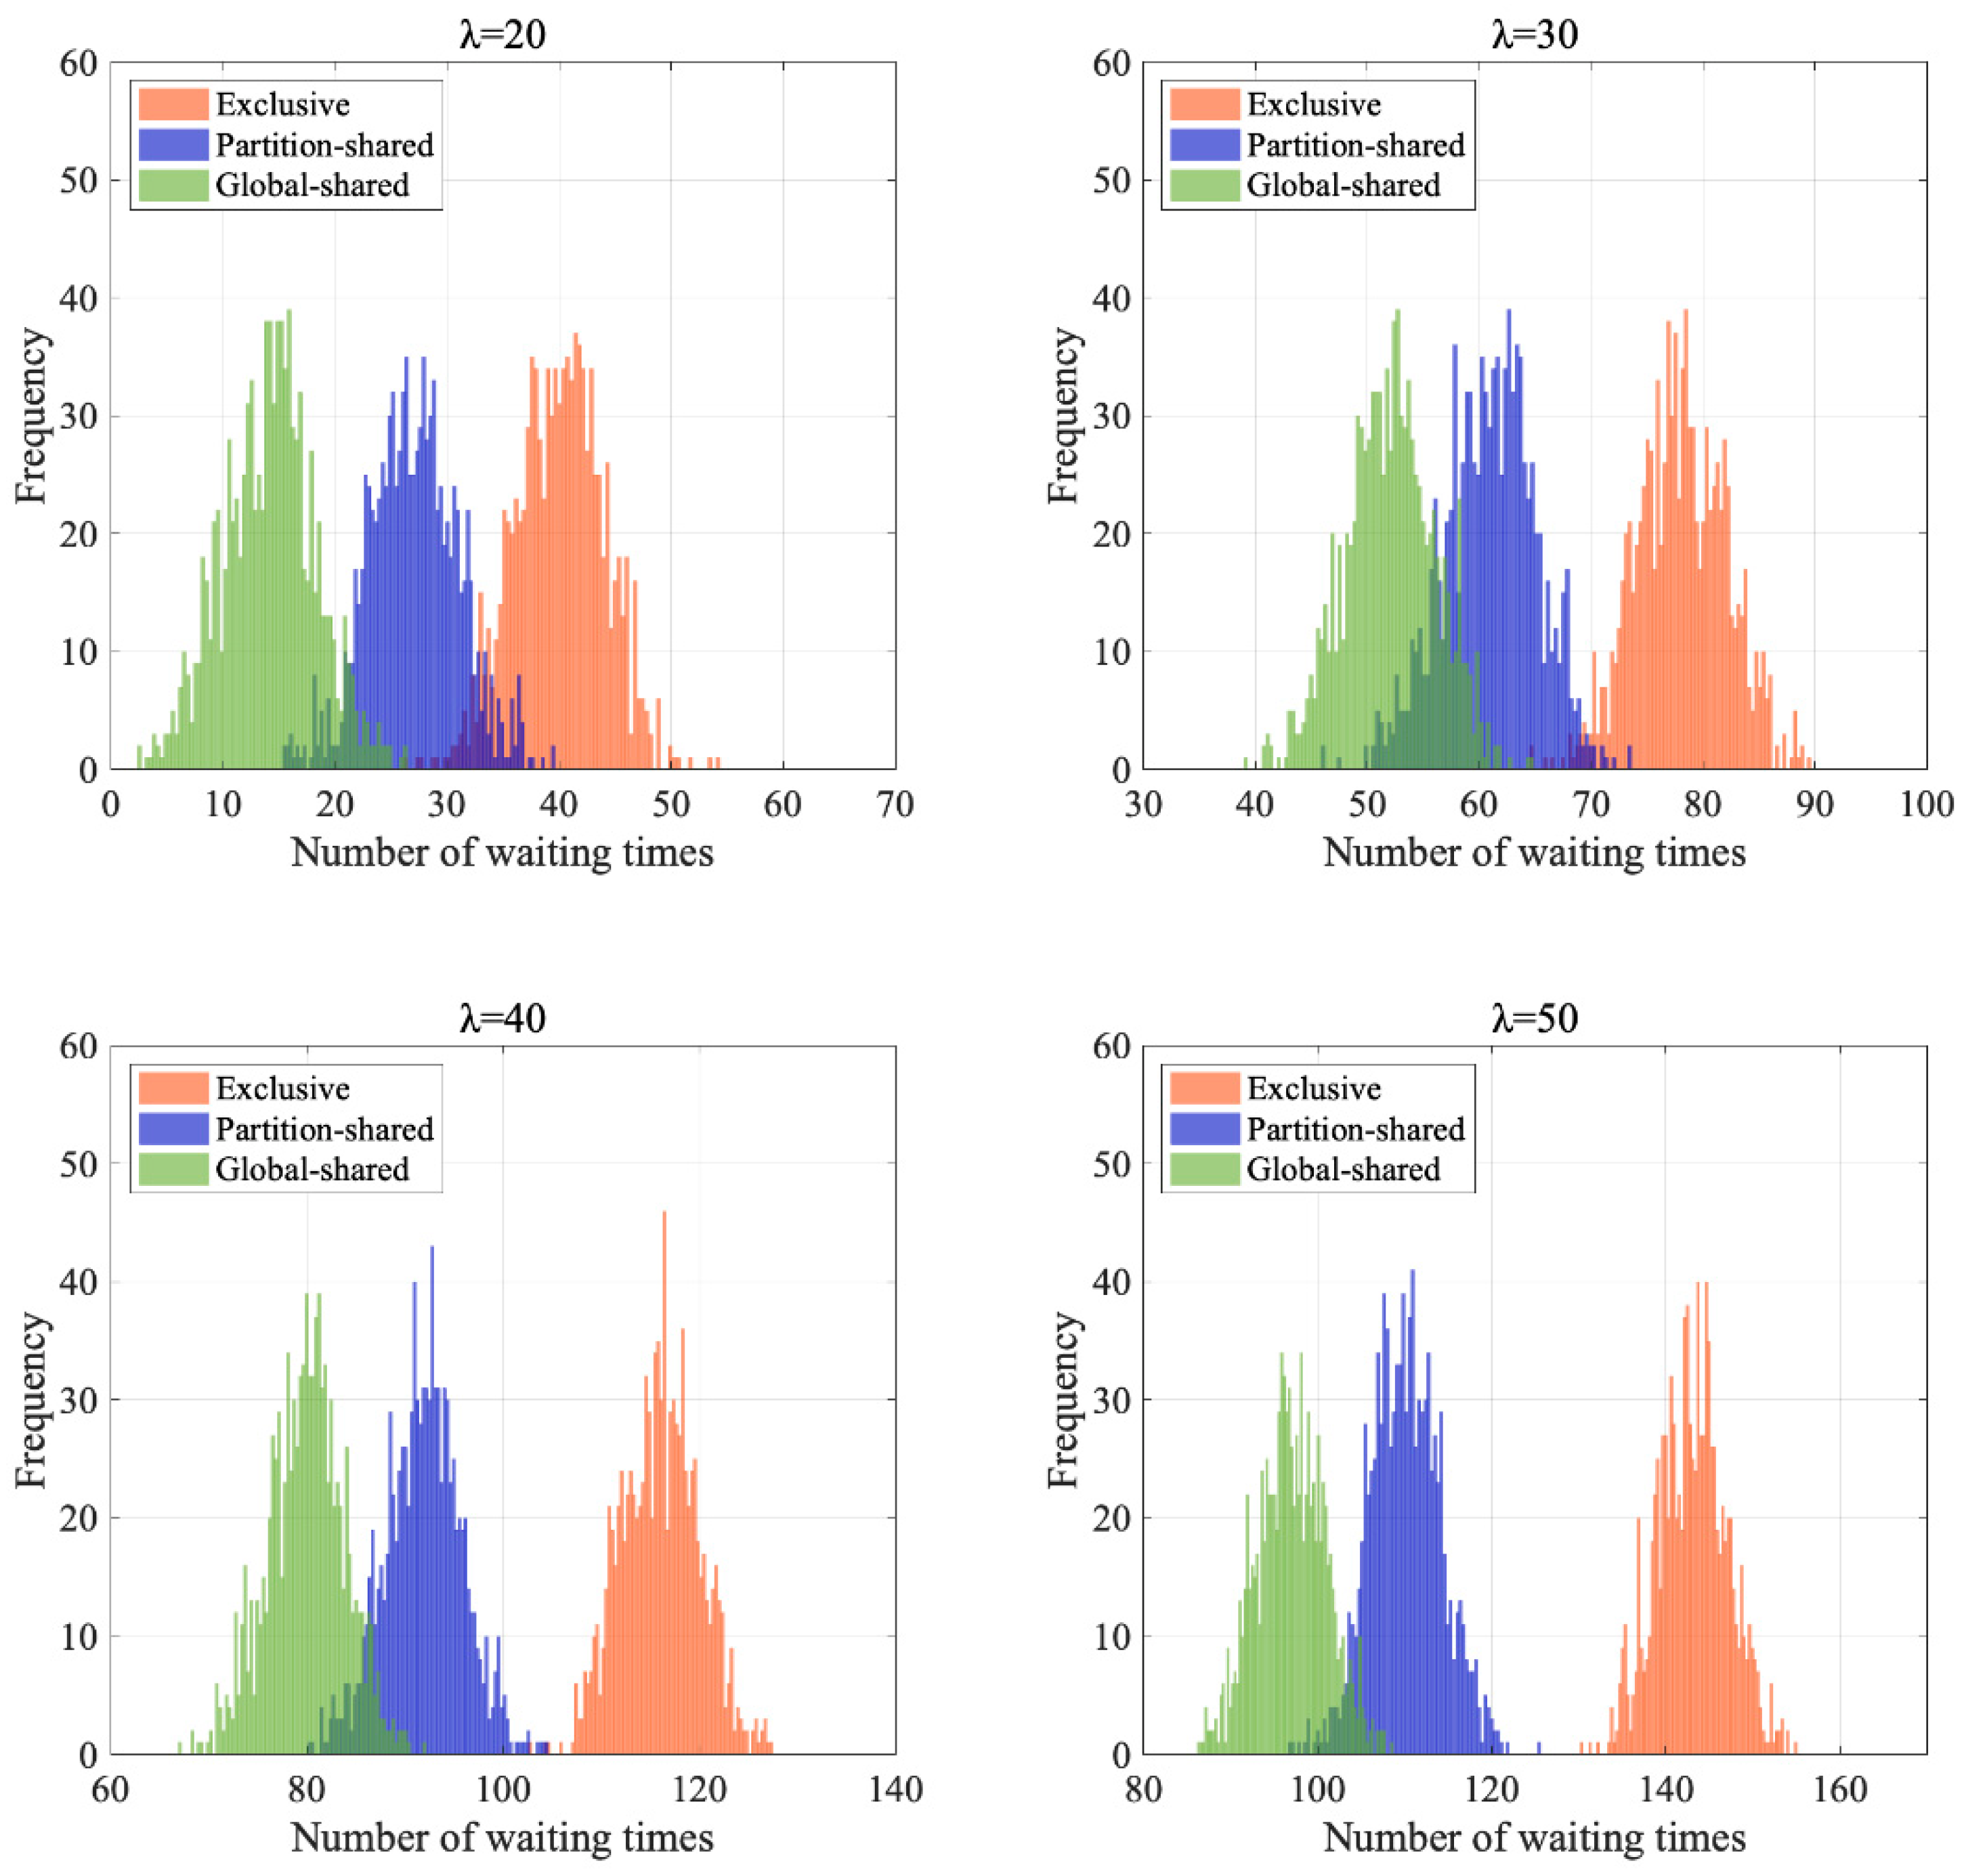
The main conclusions of this paper are as follows. First, the designed global-shared operation procedure can fully release the operation potential of the complex airport U-shaped area and increase the apron operation capacity by 14.8% and 5.0% compared to the exclusive and partition-shared operation procedures, respectively. When the hourly flight volume is lower than 30 aircraft/h, i.e., the capacity and traffic flow ratio corresponding to all three operation procedures is less than 60%, the difference in the operation effect of the three procedures is small; when the hourly flight volume increases from 30 to 50 aircraft/h, the advantages of the global-shared operation procedures are more prominent, which can effectively reduce the conflict probability, conflict resolution time, flight fuel consumption, and emission and improve the efficiency of apron resource utilization. Compared with the exclusive and partition-shared operation procedures, the global-shared operation procedure could reduce the probability of aircraft conflict by 32.2% and 11.8%, respectively and the average conflict resolution time per flight by 16.1 s and 10.6 s, respectively and could increase the resource utilization rate of each U-zone by 66% and 25%, respectively. The average daily fuel consumption of a single aircraft could be reduced by 3.6 kg and 2.4 kg, respectively, and the average daily carbon emission of a single aircraft could be reduced by 16.7 kg and 11.0 kg, respectively, translating into respective reductions of 1.2 tons and 0.8 tons of carbon emission in a whole year, which has a significant effect on effectively promoting fuel saving and emission reduction of the airport.
In the process of apron control, airports and ATC departments should not overly pursue restrictive and strict operational rules in the design of U-shaped area operation procedures and ignore the efficiency of apron resource utilization and aircraft operation, but should achieve a comprehensive trade-off between capacity, efficiency, and environmental protection and other performance indices as far as possible under the premise of ensuring operational safety.
Future studies should research the optimized design of apron operation procedures combined with apron control handover procedures for the three subsystems of runways, taxiways, and aprons on the surface and draw on the results of other fields to further improve the refinement of the operational assessment of the aprons and the surface as a whole and optimize the surface operation efficiency. In our future work, the proposed procedures will be further validated from the point of view of airport controllers’ workloads as well as flexibly adapted to the traffic flow by analyzing the traffic flow characteristics of different airports at different times of the day.

Author Contributions

Y.L.: Methodology, Validation, Writing-original draft. M.H.: Methodology, Review, Editing. J.Y.: Methodology, Review, Editing. J.S.: Data curation, Conceptualization, Writing-original draft. S.W.: Data curation, Conceptualization, Software. Z.Z.: Data curation, Investigation. All authors have read and agreed to the published version of the manuscript.

Funding

This work was funded by National Key R&D Program of China (No. 2021YFB1600500), National Natural Science Foundation of China (No. 52002178) and the Open Funds of Engineering Research Center of Airport Safety and Operations, CAAC (No. KFKT2023-02).

Institutional Review Board Statement

Not applicable.

Informed Consent Statement

Not applicable.

Data Availability Statement

Not applicable.

Conflicts of Interest

The authors declare no conflict of interest.

References

  1. Bennell, J.A.; Mesgarpour, M.; Potts, C.N. Airport runway scheduling. Ann. Oper. Res. 2013, 204, 249–270. [Google Scholar] [CrossRef]
  2. Bennell, J.A.; Mesgarpour, M.; Potts, C.N. Dynamic scheduling of aircraft landings. Eur. J. Oper. Res. 2017, 258, 315–327. [Google Scholar] [CrossRef]
  3. Ramanujam, V.; Balakrishnan, H. Data-driven modeling of the airport configuration selection process. IEEE Trans. Hum.-Mach. Syst. 2015, 45, 490–499. [Google Scholar] [CrossRef]
  4. Samà, M.; D’Ariano, A.; D’Ariano, P.; Pacciarelli, D. Scheduling models for optimal aircraft traffic control at busy airports: Tardiness, priorities, equity and violations consideration. Omega 2017, 67, 81–98. [Google Scholar] [CrossRef]
  5. Yin, J.; Ma, Y.; Hu, Y.; Han, K.; Yin, S.; Xie, H. Delay, throughput and emission tradeoffs in airport runway scheduling with uncertainty considerations. Netw. Spat. Econ. 2021, 21, 85–122. [Google Scholar] [CrossRef]
  6. Xing, Z.; Li, S.; Tang, Y.; Luo, Q. Airport surface traffic simulation based on Agent-Cellular automaton. J. Syst. Simul. 2018, 30, 857–865. [Google Scholar]
  7. Xue, Q.; Lu, J.; Jiang, Y. Modelling of Taxi Lane Traffic Flow Characteristic Based on Control Strategy. J. Wuhan Univ. Technol. (Transp. Sci. Eng.) 2020, 44, 1013–1019. [Google Scholar]
  8. Yang, L.; Hu, M.; Yin, S.; Zhang, H. Characteristics analysis of departure traffic flow congestion in mega-airport surface. Acta Aeronaut. Astronaut. Sin. 2016, 37, 1921–1930. [Google Scholar]
  9. Lu, L.; Gao, J. Research on Aircraft Taxiing Path Optimization Based on Digraph Model and Algorithm. In Proceedings of the IOP Conference Series: Materials Science and Engineering, Shanghai, China, 15–18 May 2021; p. 042045. [Google Scholar]
  10. Pan, W.; Yang, L.; Zhu, X.; Zhang, Q. Modeling of Busy Airport Apron Running Processes Based on Color Petri Net. Comput. Simul. 2018, 35, 52–56. [Google Scholar]
  11. Chen, B.; Zhang, Y.; Jiao, L. Delay Analysis of Deicing Aircraft Based on Queuing Theory. Comput. Appl. Softw. 2019, 36, 294–299. [Google Scholar]
  12. Feng, X.; Meng, J. Aircraft taxi-out time prediction based on queuing theory. J. Nanjing Univ. Aeronaut. Astronaut. 2016, 48, 772–780. [Google Scholar]
  13. Min, J. Research on the Stochastic Evolution of Aircraft Ground Traffic Flow in Airport. Master’s Thesis, The Harbin Institute of Technology, Harbin, China, 2018. [Google Scholar]
  14. Fines, K.; Sharpanskykh, A.; Vert, M. Agent-based distributed planning and coordination for resilient airport surface movement operations. Aerospace 2020, 7, 48. [Google Scholar] [CrossRef]
  15. Marín Gracia, A.; Codina Sancho, E. Network design: Taxi planning. Ann. Oper. Res. 2008, 157, 135–151. [Google Scholar] [CrossRef]
  16. Zhang, J. Research on Airport Capacity and Delay Assessment Affected by the Weather. Ph.D. Thesis, The Nanjing University of Aeronautics and Astronautics, Nanjing, China, 2012. [Google Scholar]
  17. Zhao, Z. Research on Airspace Capacity Assessment and Forecast. Ph.D. Thesis, The Nanjing University of Aeronautics and Astronautics, Nanjing, China, 2015. [Google Scholar]
  18. Simaiakis, I.; Balakrishnan, H. Impact of congestion on taxi times, fuel burn, and emissions at major airports. Transp. Res. Rec. 2010, 2184, 22–30. [Google Scholar] [CrossRef]
  19. Xie, Y. Research on Airport Operational Situation Prediction Based on Hidden Markov Process. Master’s Thesis, The Harbin Institute of Technology, Harbin, China, 2018. [Google Scholar]
  20. Wang, Q. Evaluation of Multi-Runway Operation Scheduling Scheme for Complex Airport. Master’s Thesis, The Nanjing University of Aeronautics and Astronautics, Nanjing, China, 2016. [Google Scholar]
  21. Yin, J.; Hu, M.; Ma, Y.; Han, K.; Chen, D. Airport taxi situation awareness with a macroscopic distribution network analysis. Netw. Spat. Econ. 2019, 19, 669–695. [Google Scholar] [CrossRef]
  22. Du, J.; Hu, M.; Zhang, W.; Yin, J. Weakly Supervised Evaluation of Airport Traffic Situation Based on Metric Learning. J. Beijing Univ. Aeronaut. Astronaut. 2021. [Google Scholar] [CrossRef]
  23. Yin, J.; Hu, M.; Zhao, Z. Evaluation model of multi-runway airport ground capacity. In Proceedings of the Aircraft Airworthiness and ATM Sympoium, Beijing, China, 11 September 2010; pp. 15–19. [Google Scholar]
  24. Simaiakis, I.; Khadilkar, H.; Balakrishnan, H.; Reynolds, T.G.; Hansman, R.J. Demonstration of reduced airport congestion through pushback rate control. Transp. Res. Part A Policy Pract. 2014, 66, 251–267. [Google Scholar] [CrossRef]
  25. Xu, C. Research on Joint Scheduling of Airport Surface Resources Based on Aircraft Taxiing Time Control. Master’s Thesis, The Nanjing University of Aeronautics and Astronautics, Nanjing, China, 2019. [Google Scholar]
  26. Tang, Y.; Hu, M.; Huang, R.; Wu, H.; Yin, J. Aircraft taxi routes planning based on free time windows and multi-agent for A-SMGCS. Acta Aeronaut. Et Astronaut. Sin. 2015, 36, 1627–1638. [Google Scholar]
  27. Yin, J.; Hu, M.; Zhang, H.; Ma, Y.; Wu, F. Optimized method for multi-runway spatio-temporal resource scheduling in the mode of independent departures. Acta Aeronaut. Astronaut. Sin. 2015, 36, 1574–1584. [Google Scholar]
  28. Balakrishnan, H.; Chandran, B.G. Algorithms for scheduling runway operations under constrained position shifting. Oper. Res. 2010, 58, 1650–1665. [Google Scholar] [CrossRef]
  29. Bertsimas, D.; Frankovich, M. Unified optimization of traffic flows through airports. Transp. Sci. 2016, 50, 77–93. [Google Scholar] [CrossRef]
  30. Members of ICAO. Annex 14—Aerodromes—Volume I—Aerodromes Design and Operations, 8th ed.; International Civil Aviation Organization (ICAO): Montréal, QC, Canada, 2022. [Google Scholar]
  31. Comprehensive Department of CAAC. The Research Report of the Invisible Apron Management Mode by Air-Traffic-Controller in Tower; Civil Aviation Administration of China (CAAC): Beijing, China, 2012. [Google Scholar]
  32. Members of ICAO. Doc 8643: Aircraft Type Designators; International Civil Aviation Organization (ICAO): Montréal, QC, Canada, 2023; Available online: https://www.icao.int/publications/doc8643 (accessed on 27 January 2023).
  33. Federal Aviation Administration Order JO 7110.65X; Air Traffic Control; Federal Aviation Administration (FAA): Washington, DC, USA, 2017. Available online: https://www.faa.gov/regulationspolicies/orders/notices/index.cfm/go/document.current/documentNumber/7110.65 (accessed on 27 January 2023).
  34. Wang, G.; Tan, T. Airport Taxiway Conflict Detection Method Based on Network Topology. In Proceedings of the 2020 IEEE 2nd International Conference on Civil Aviation Safety and Information Technology, Weihai, China, 14–16 October 2020; pp. 176–181. [Google Scholar]
  35. Ma, J.; Delahaye, D.; Sbihi, M.; Scala, P.; Mota, M.A.M. Integrated optimization of terminal maneuvering area and airport at the macroscopic level. Transp. Res. Part C Emerg. Technol. 2019, 98, 338–357. [Google Scholar] [CrossRef]
  36. Guépet, J.; Briant, O.; Gayon, J.P.; Acuna-Agost, R. Integration of aircraft ground movements and runway operations. Transp. Res. Part E Logist. Transp. Rev. 2017, 104, 131–149. [Google Scholar] [CrossRef]
  37. Wang, C.; Ren, Y. A Model of Gate Allocation for Parallel Multi-runway Hybrid Operation from the Perspective of Fuel-saving and Carbon Emission Reduction. J. Transp. Inf. Saf. 2021, 39, 144–152. [Google Scholar]
  38. Zhang, Y.; Wei, H. Multi-Attribute Decision Combination Weighting Method Based on CRITIC. Stat. Decis. 2012, 16, 75–77. [Google Scholar]
  39. Wang, F.; Zhao, L. Capacity evaluation method for parallel runway based on monte carlo simulation. In Proceedings of the 2018 Chinese Control and Decision Conference, Shenyang, China, 9–11 June 2018; pp. 5411–5415. [Google Scholar]
  40. Roa, J.; Trani, A.; Hu, J.; Mirmohammadsadeghi, N. Simulation of runway operations with application of dynamic wake separations to study runway limitations. Transp. Res. Rec. 2020, 2674, 199–211. [Google Scholar] [CrossRef]
  41. Yin, J. Research on Capacity Evaluation at Airport Airside with Parallel Runways. Master’s Thesis, The Nanjing University of Aeronautics and Astronautics, Nanjing, China, 2011. [Google Scholar]
Figure 1. General Apron Layout of Wuhan Tianhe Airport. The main passenger apron at this airport contains 5 U-shaped areas (aprons 1–5 shown in the figure) and one semi-U-shaped area (apron 6 shown in the figure).
Aerospace 10 00161 g001
Figure 2. Exclusive Operation Procedure. (a) Departure: the departing aircraft A in the U-shaped area is pushing out, and the arrival air-craft C must wait outside the U-shaped area and the following departing aircraft B must wait in the stand until aircraft A leaves the U-shaped area; (b) Arrival: departing aircraft B within the U-shaped area must queue up in order to await push-back instructions and arrival aircraft C must wait outside the U-shaped area until aircraft A parks on stand.
Aerospace 10 00161 g002
Figure 3. Intersection Taxiing Diagram of Arrival and Departure Aircraft. The intersection taxiing of departure aircraft A and arrival aircraft B is not allowed.
Aerospace 10 00161 g003
Figure 4. Partition-Shared Operation Procedure. Blue arrows indicate the aircraft operation path. (a) shows a scenario where there is a simultaneous pushing back of departure aircraft A and B in the outer and inner sectors (aircraft C and D are waiting to pushback or enter the U-shaped area); (b) shows a scenario where there are simultaneous departure aircraft B and A pushing back from the outer and middle areas respectively (aircraft C and D are waiting to pushback or enter the U-shaped area); (c) shows a scenario where there are simultaneous departure aircraft B and A from the inner and middle areas respectively (aircraft C and D are waiting to pushback or enter the U-shaped area).
Aerospace 10 00161 g004
Figure 5. Partition-Shared Operation Procedure. Blue arrows indicate the aircraft operation path. (a) shows a scenario where there are departure aircraft A being pushed back from the inner or middle area and arrival aircraft B entering the outer area at the same time. (b) shows a scenario where there are departure aircraft A pushing out from the inner area and arrival aircraft B entering the middle or outer area at the same time.
Aerospace 10 00161 g005
Figure 6. Global-Shared Operation Procedure. (a) shows a scenario that arrival aircraft B follows departure aircraft A into the U-shaped area; (b) shows a scenario that departure aircraft C follows departure aircraft D leaves the U-shaped area.
Aerospace 10 00161 g006
Figure 7. Network and Key Nodes Diagram of Airport Surface. Red triangles indicate the different types of airport surface nodes.
Aerospace 10 00161 g007
Figure 8. Macroscopic Distribution Network of U-shaped Area.
Aerospace 10 00161 g008
Figure 9. Relationship between Flight Quantities and Different Indices Using Different Operation Procedures. Procedures. (a) Relationship between Flight Quantities and Conflict Probabilities Using Different Operation Program; (b) Relationship between Flight Quantities and Conflict Resolution Times Using Different Operation Program; (c) Relationship between Flight Quantities and Average Maximum Traffic Volume Using Different Operation; (d) Relationship between Flight Quantities and Saturation Using Different Operation Program.
Aerospace 10 00161 g009
Figure 10. Aircraft Fuel Consumption and Carbon Emissions under Different Procedures and Flight Frequencies.
Aerospace 10 00161 g010
Figure 11. Comprehensive Evaluation Index under Different Procedures Based on Monte-Carlo Simulation.
Aerospace 10 00161 g011
Figure 12. Relationship between Flight Quantities and Comprehensive Evaluation Using Different Procedures.
Aerospace 10 00161 g012
Figure 13. The Frequency Distributions of the Simulation Experiments in terms of Number of Waiting Times.
Aerospace 10 00161 g013
Figure 14. Number of Conflicts on the Surface Network under Three Apron Operation Procedures. (a) Exclusive; (b) Partition-shared; (c) Global-shared.
Aerospace 10 00161 g014aAerospace 10 00161 g014b
Table 1. Sets, parameters, and variables of Apron U-shaped Area Traffic Operation Model.
Sets
F :Set of aircraft in study period
F A , F D :Set of arrival and departure aircraft in study period, respectively
P :Set of parking stands in U-shaped area
P 1 , P 2 , P 3 :Set of parking stands in outer, middle, and inner area of U-shaped area, respectively, P 1 P , P 2 P , P 3 P
σ A , σ D :Arrival and departure aircraft queueing set, respectively
Parameters
V f :Speed of the taxiing phase of f , which can be considered to be related to the aircraft type
L p f :Distance for f to travel from parking stand p to the entrance/exit of U-shaped area
ϖ A f , ϖ D f :Duration required to park into and push out of a parking position respectively for f , which are related to the type of aircraft
X 12 , X 23 :Distance from middle (12) and inner area boundary (23) to entrance/exit of U-shaped area in partition-shared operation procedure, respectively
d min :Minimum safe separation between aircraft in the U-shaped area
ϖ D L f :Duration of the long push of the departure aircraft f in the middle area
Variables
t n ( f ) , t p ( f ) , t e n t r y ( f ) :Time when aircraft f reaches node n , parking stand and entrance/exit of U-shaped area, f F
p n :Parking stands of partition area in partition-shared operation procedure, p n P n , n = 1 , 2 , 3
w f p :Waiting duration of f entering or exiting U-shaped area, and the corresponding stand of f is p , p P , f F A F D
δ f p :Distance from entrance/exit to the aircraft f in operation in the U-shaped area and the corresponding stand of f is p , p P , f F A F D
t e a r l y f :Earliest time to enter the U-shaped area or the earliest off-block time for arrival or departure aircraft, respectively, f F A F D
Disclaimer/Publisher’s Note: The statements, opinions and data contained in all publications are solely those of the individual author(s) and contributor(s) and not of MDPI and/or the editor(s). MDPI and/or the editor(s) disclaim responsibility for any injury to people or property resulting from any ideas, methods, instructions or products referred to in the content.

