
HCF and LCF Analysis of a Generic Full Admission Turbine Blade

Abstract
:1. Introduction
- A 3D thermal FE analysis.
- A 3D structural FE analysis.
- A post processing (cyclic strain based) LCF analysis.
2. Numerical Analysis Method
2.1. LRE Turbine-Blade FE Analysis Method Outline
- The usage of a commercial FE program package [8].
- The temperature dependent parameters of the turbine-blade material.
- The geometry of single and two half turbine blades, the related disk section and the related rotor section of the first rotor stage of the considered turbo pump.
- Additionally, all of the structural FE analyses are based on:
- ○
- bi-linear elasto-plasticity with the von Mises yield criterion and kinematic hardening,
- ○
- additive split of the total strain into thermal, elastic, plastic and creep strain,
- ○
- classical three-parameter model approach for taking into account secondary creep (multiplicative combination of Norton’s stress power law and the exponential activation energy law) in order to take into account the dependency of the creep strain rate on both the stress and temperature by means of a single equation, Equation (1), as, e.g., suggested in [9]:
2.1.1. HCF and Creep Related FE Analysis Method
- A stationary thermal 3D FE analysis, simulating the thermal field during the stationary hot run.
- A quasi-stationary structural 3D FE analysis (with thermal strains calculated from the thermal field of the abovementioned thermal FE analysis) with six load steps to :
- ○
- (for the time range to ): thermal strains from the abovementioned stationary thermal FE analysis. Although from the post-processing HCF analysis point of view, this loading could be integrated into load step 3, it is useful to separate it in order to show the negligible influence of the quasi-static thermal loading to the stresses, obtained by the FE model.
- ○
- (for the time range to ): additional spin loading (modelling centrifugal forces under high temperature). Although from the post-processing HCF analysis point of view, this loading could be integrated into load step 3, it is useful to separate it in order to show the dominant influence of the spin-loading to the stresses obtained by the FE model.
- ○
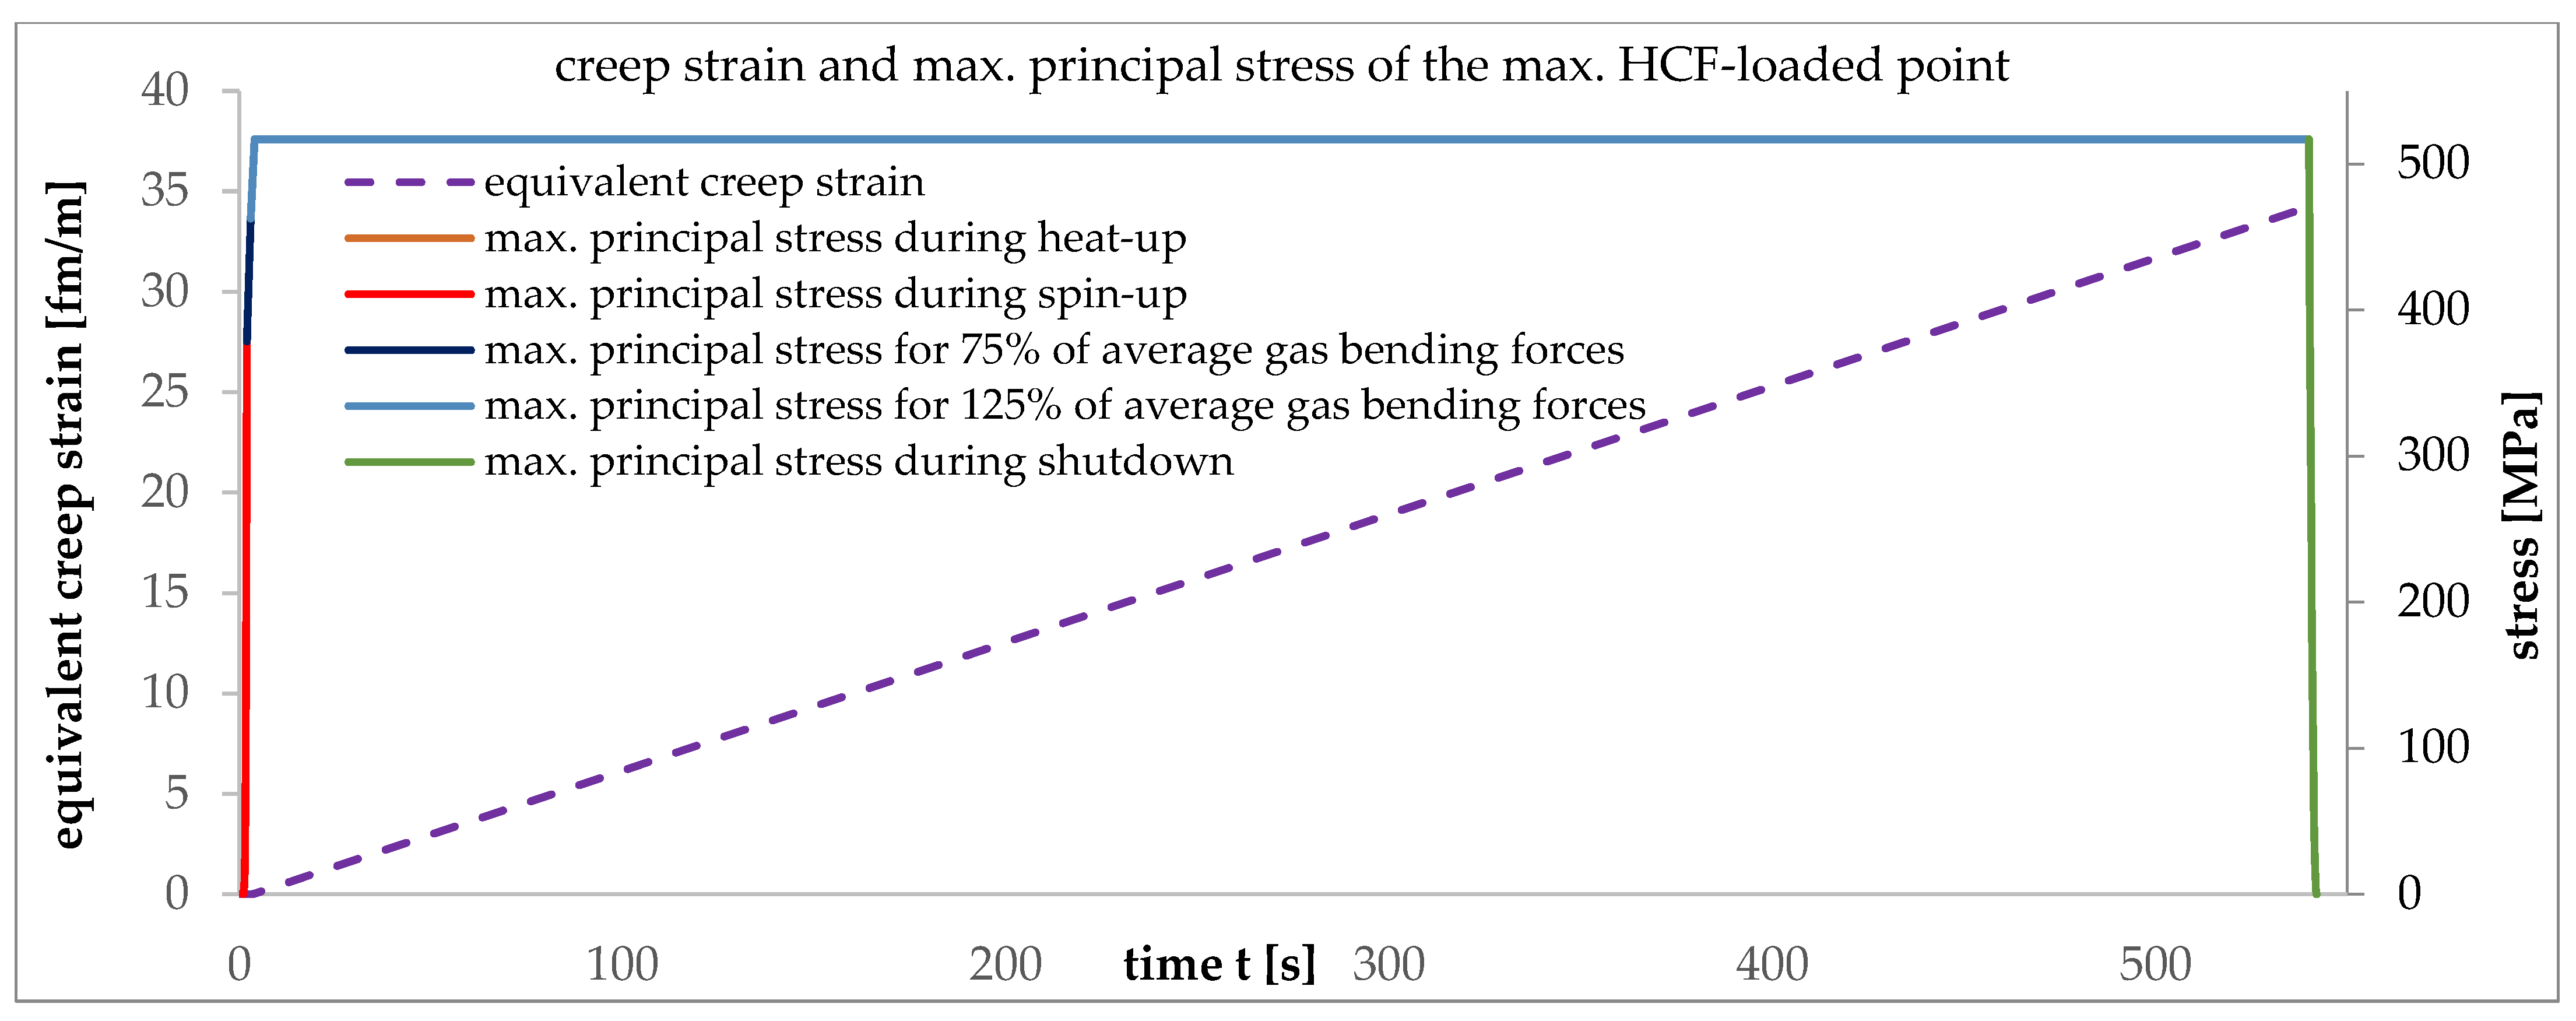
- (for the time range to ): an additional 0.75 ∙ the (circumferential and axial) average gas bending load (originating @ the stator row). This load step results in the minimum stress of the stationary hot run of the turbine and therefore is directly needed for the post-processing HCF analysis of the turbine blade.
- ○
- (for the time range to ): an additional 0.5 ∙ the (circumferential and axial) average gas bending load (originating @ the stator row). Therefore, load step combines full thermal, full centrifugal and 1.25 ∙ the (circumferential and axial) average gas bending load (originating @ the stator row). This load step results in the maximum stress of the stationary hot-run of the turbine and therefore is directly needed for the post-processing HCF analysis of the turbine blade.
- ○
- (for the time range to ): completely unchanged boundary conditions (for modelling both stress relaxation at the maximum HCF-loaded point and the build-up of radial creep deformation at the tip of the blade for the full duration of the stationary hot run of the turbine). According to [11], the hot-run duration of the reference engine is 540 s.
- ○
- (for the time range to ): reduction of thermal strains, spin load, circumferential and axial gas bending loads to zero (for obtaining the residual creep deformation after the end of a single hot run).
2.1.2. LCF-Related FE Analysis Method
- A fully transient thermal 3D FE analysis of the thermal loading of two complete engine operation cycles with twelve load steps to . The reason for this two-cycle thermal FE analysis is some shakedown of the cyclic strain, obtained by the follow-on elasto-plastic structural FE analysis from the first to the second loading cycle. The second half to of the load steps are identical to the first half to of the load steps. Therefore, only the first half to of the load steps is described in detail:
- ○
- (for the time range to ): Linearly ramping up to chill-down boundary conditions ( at the impeller position of the FE model while keeping ambient bulk temperature at the surface of the turbine blade).
- ○
- (for the time range to ): Keeping identical chill-down boundary conditions as at the end of the previous load step . The chill-down duration (of 105 minutes) is chosen according to [14].
- ○
- (for the time range to ): Linearly ramping up the blade surface bulk temperature to the hot-run condition while keeping at the impeller position of the FE model.
- ○
- (for the time range to ): Keeping identical hot-run boundary conditions as in the previous load step . The hot-run duration (of 540 s) is chosen according to [11].
- ○
- (for the time range ): Linearly ramping down the blade surface bulk temperature to ambient condition while keeping at the impeller position of the FE model.
- ○
- (for the time range to ) Keeping identical shut-down boundary conditions as in load step . This (relatively long) duration of was chosen to ensure stationary thermal conditions before the transition to the second full loading cycle.
- For the follow-on (one-way coupled) quasi-stationary structural 3D FE analysis:
- ○
- Thermal strains from the abovementioned thermal FE analysis.
- ○
- Centrifugal forces (during spin up, stationary hot run and spin down).
- ○
- Average gas bending load, originating at the stator row (during spin up, stationary hot run and spin down).
2.2. Post-Processing Fatigue-Life Analysis Methods of LRE Turbine Blades
2.2.1. Post-Processing HCF Analysis Method
- The mean stress of the stationary hot run of the turbo pump according to Equation (3):
- Similarly, the stress amplitude of the stationary hot run of the turbo pump is calculated according to Equation (4):
- Finally, the number of HCF cycles to failure is calculated by applying the modified Goodman equation (Equation (5)) as suggested in [15]:with , and as constants, fitted by applying the logarithmized version of Equation (5) to the results of 18 piezo actor driven (ultrasonic) uniaxial HCF tests in total with R > −1 at ambient temperature under high-pressure H2 atmosphere.
2.2.2. Post-Processing LCF Analysis Method
- As first step of the post-processing LCF analysis of the turbine blade, the minimum over-time and minimum over-all FE mesh node value of the minimum principal total mechanical strain of the turbine blade is extracted from the structural 3D FE analysis of the second full loading cycle (based on the transient thermal FE analysis).
- Subsequently, two of the values this triple minimum is related to are fixed:
- ○
- The (minimum principal strain) direction, which the value refers to;
- ○
- The node of the FE mesh, which the value refers to.
- For these two fixed values (of direction and spatial location), the maximum normal strain of the full second loading cycle is determined.
- Subsequently, the total mechanical strain range of the highest LCF-loaded point of the turbine blade is calculated according to Equation (6):
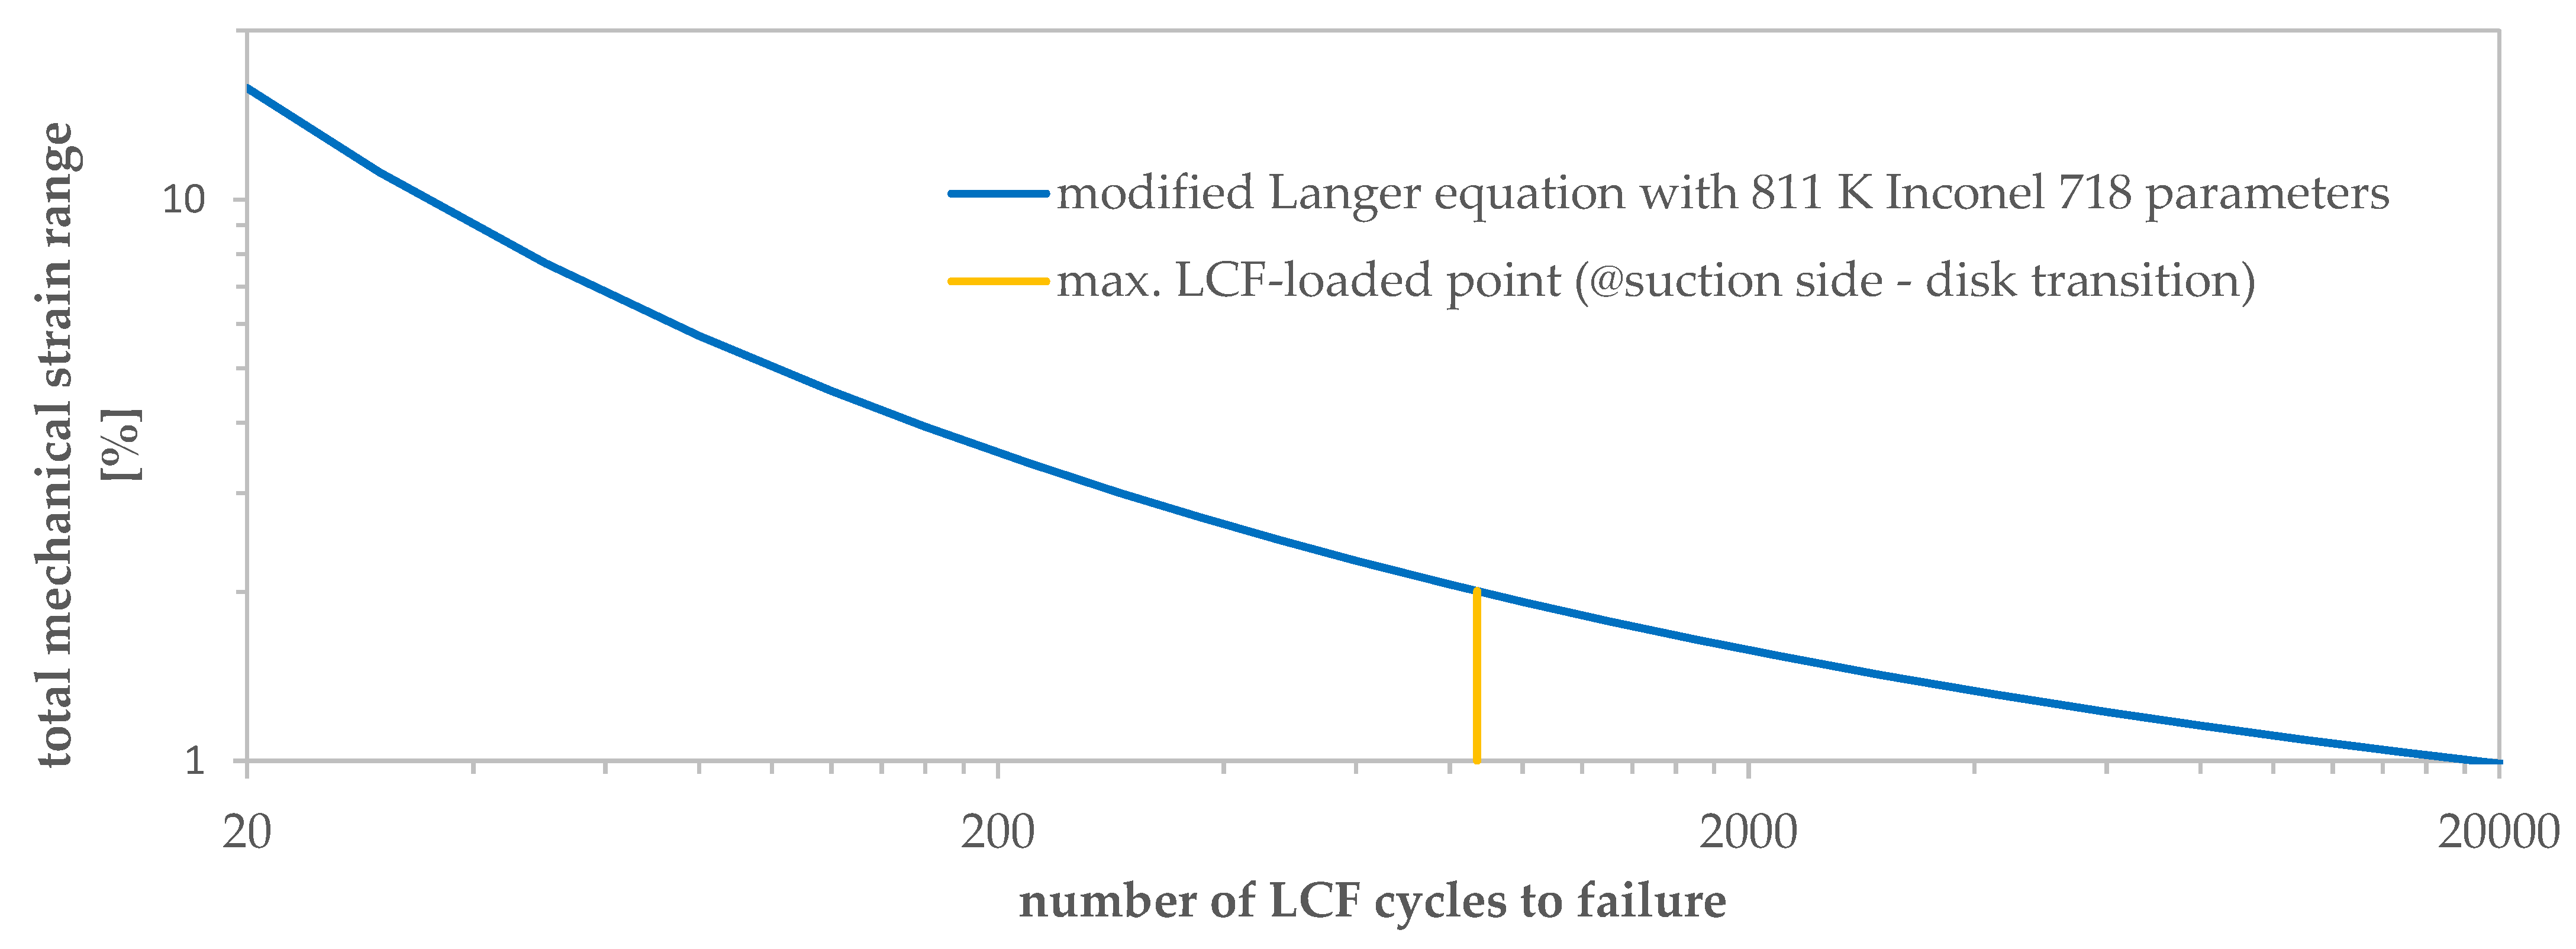
- Finally, the number of LCF cycles to failure of the turbine blade is calculated according to the modified Langer equation (Equation (7)) as suggested in [16]:with , and as constants, determined from a linear regression analysis of the results of (in total) 58 isothermal load controlled or strain controlled fatigue tests with Inconel 718 samples, tested at in air environment using induction heating with total strain ranges between 0.5% and 5%, leading to fatigue life values between 100 cycles to 10 Mcycles to failure [16].
3. Material, Material Parameters, Geometry and Loading Conditions
3.1. Material of the Reference Turbine Blade
- “Super Waspaloy” was foreseen as blade material in the initial phase of the development;
- However, for cost efficiency reasons, Inconel 718 was selected at a later stage of the development of the turbo pump of the 1 MN thrust class gas-generator reference LRE.
3.2. Material Parameters of the Reference Turbine Blade
3.2.1. Thermal FE Analysis Parameters of the Reference Turbine-blade Material
3.2.2. Structural FE Analysis Parameters of the Reference Turbine-blade Material
- The natural logarithm is applied to Equation (1), resulting in Equation (8):
- And and are used as dependency (input) parameters for obtaining the natural logarithm of the creep strain rate as a function value of Equation (8).
3.2.3. Fatigue-Life Analysis Parameters of the Reference Turbine-Blade Material
HCF Analysis Parameters of the Reference Turbine-Blade Material
LCF Analysis Parameters of the Reference Turbine-Blade Material
3.3. Assumed Turbine-Blade Geometry
- Highest temperature directly from the gas generator or (in case of other engine cycles) the pre-burner or the (expander LRE) cooling circuit (and therefore, usually most severely thermally reduced material properties);
- Highest share of the total turbine work [19].
3.4. Assumed Turbine-Blade Loading Conditions
3.5. Boundary Conditions of the Reference Turbine Blade
3.5.1. Boundary Conditions for the HCF- and Creep-Related FE Analyses
Boundary Conditions for the Stationary Thermal FE Analysis of the Reference Turbine Blade
- A: The impeller temperature (36 K);
- B: The total temperature of the turbine driving gas (from the gas generator) in the local coordinate system of the blade (800 K).
Boundary Conditions for the HCF- and Creep-Related Quasi-Stationary Structural FE Analysis of the Reference Turbine Blade
3.5.2. Boundary Conditions for the LCF-Related FE Analyses
Boundary Conditions for the Transient Thermal FE Analysis of the Reference Turbine Blade
Boundary Conditions for the LCF-Related Quasi-Stationary Structural FE Analysis of the Reference Turbine Blade
3.6. FE Meshing of the Reference Turbine Blade
4. Results
4.1. FE Analysis Results
4.1.1. Thermal FE Analysis Results
Results of the (HCF-Related) Stationary Thermal FE Analysis of the Reference Turbine Blade
- directly for the structural FE analysis of the (from the thermal point of view, stationary) hot run of the turbo pump (as shown in Section 4.1.2),
- indirectly also for the post-processing HCF analysis of the reference turbine blade (as shown in Section 4.2).
Results of the (LCF-Related) Transient Thermal FE Analysis of the Reference Turbine Blade
- directly for the quasi-stationary structural FE analysis of the complete operating cycle of the turbo pump (pre-cooling, start-up, stationary hot-run, and shut-down of the turbo pump as shown in Section 4.1.2); from the time-dependent thermal field shown in Figure 11 and Figure 12, the thermal strains of the structural analysis are calculated (by multiplying the difference between the thermal field and the reference temperature by the coefficient of thermal expansion),
- indirectly for the post-processing LCF analysis of the reference turbine blade (as shown in Section 4.2).
4.1.2. Results of the Quasi-Stationary Structural FE Analysis of the Reference Turbine Blade
Results of the HCF-Related Structural FE Analysis
Creep-Related Results of the Structural FE Analysis
Results of the LCF-Related Structural FE Analysis
4.2. Post-Processing Fatigue Life Analysis Results
4.2.1. Post-Processing HCF Analysis Results of the Reference Turbine Blade
4.2.2. Post-Processing LCF Analysis Results of the Reference Turbine Blade
5. Discussion and Outlook
- This experimental data is (with HCF life values between 1 Mcycle to failure and 10 Mcycles to failure) several orders of magnitude smaller than the predicted HCF life of the reference turbine blade. A large uncertainty of the predicted HCF life of the reference turbine blade based on these HCF test results with uniaxial probes has to be assumed under these circumstances.
- The experimental HCF data is related to ambient temperature—whereas the hot-run temperature of the reference turbine blade is assumed to be 800 K.
- These two drawbacks will be eliminated in the near future at DLR Lampoldshausen by the following two measures:
- Additional HCF tests with Inconel 718 samples (under loading conditions, expected to result in the fatigue-life magnitude of the reference turbine blade).
- Elevated temperature correction of one or several of the parameters of the Goodman Equation (5).
Author Contributions
Funding
Data Availability Statement
Acknowledgments
Conflicts of Interest
References
- Lee, H. Space Shuttle Main Engine High Pressure Fuel Turbopump Turbine Blade Cracking; NASA TM-100327; George, C., Ed.; Marshall Space Flight Center: Huntsville, AL, USA, 1988.
- Nagao, N.; Nanri, H.; Okita, K.; Ishizu, Y.; Yabuki, S.; Kohno, S. The Modified Fuel Turbopump of 2nd stage engine for H3 launch vehicle. In Proceedings of the 7th European Conference for Aeronautics and Space Sciences (EUCASS), Milan, Italy, 3–6 July 2017. [Google Scholar] [CrossRef]
- Holmedahl, K. Analysis and Testing of the Vulcain 2 Lox Turbine Blades for Prediction of High Cycle Fatigue Life. In Proceedings of the 36th AIAA/ASME/SAE/ASEE Joint Propulsion Conference and Exhibit, Huntsville, AL, USA, 16–19 July 2000; AIAA: Reston, VA, USA, 2012. [Google Scholar] [CrossRef]
- Kalluri, S.; McGaw, M.A. Effect of Tensile Mean Stress on Fatigue Behavior of Single Crystal and Directionally Solidified Superalloys, NASA Technical Memorandum 103644. In Proceedings of the Symposium on Cyclic Deformation, Fracture, and Nondestructive Evaluation of Advanced Materials, San Antonio, TX, USA, 12–13 November 1990. [Google Scholar]
- Saturday, E.G. Hot Section Components Life Usage Analyses for Industrial Gas Turbines. Ph.D. Thesis, Cranfield University, Cranfield, UK, 2015. [Google Scholar]
- Trollheden, S.; Bergenlid, B.; Aglund, A.; Pettersson, A.I. Development of the Turbines for the Vulcain 2 Turbopumps. In Proceedings of the 35th AIAA/ASME/SAE/ASEE Joint Propulsion Conference & Exhibit, Los Angeles, CA, USA, 20–23 June 1999; AIAA: Reston, VA, USA, 2012. [Google Scholar] [CrossRef]
- Ubulom, I. Influence of fluid-structure interaction modelling on the stress and fatigue life evaluation of a gas turbine blade. J. Power Energy 2021, 235, 1019–1038. [Google Scholar] [CrossRef]
- Ansys. Available online: https://www.ansys.com/ (accessed on 1 September 2022).
- Campello, D.; Tardif, N.; Baietto, M.-C.; Coret, M.; Desquines, J. Secondary creep behavior of Zr-4 claddings under LOCA conditions. In Proceedings of the Top Fuel 2016 Conference, Boise, ID, USA, 11–15 September 2016; Available online: https://hal.archives-ouvertes.fr/hal-01863188 (accessed on 24 December 2022).
- Special Metals. INCONEL® Alloy 718. Available online: https://www.specialmetals.com/documents/technical-bulletins/inconel/inconel-alloy-718.pdf (accessed on 23 December 2022).
- Caisso, P.; Barton, J.; Illig, M.; Margat, T. Development status of the Vulcain 2 engine. In Proceedings of the 36th AIAA/ASME/SAE/ASEE Joint Propulsion Conference and Exhibit, Las Vegas, NV, USA, 24–28 July 2000; AIAA: Reston, VA, USA. [Google Scholar] [CrossRef]
- Macaluso, S.B. Liquid Rocket Engine Turbines; NASA SP-8110; NASA Lewis Research Center (Design Criteria Office): Cleveland, OH, USA, 1974. [Google Scholar]
- Brown, A.M.; De Haye, M.; De Lessio, S. Application of Probabilistic Methods to Assess Risk due to Resonance in the Design of J-2X Rocket Engine Turbine Blades. In Proceedings of the 52nd AIAA/ASME/ASCE/AHS/ASC Structures, Structural Dynamics and Materials Conference, Denver, CO, USA, 4–7 April 2011; AIAA: Reston, VA, USA. [Google Scholar] [CrossRef]
- Kitsche, W. Operation of a Cryogenic Rocket Engine; Springer Series in Aerospace Technology; Springer: Berlin/Heidelberg, Germany, 2011; ISBN 978-3-642-10564-7. [Google Scholar] [CrossRef]
- Bruchhausen, M.; Fischer, B.; Ruiz, A.; González, S.; Hähner, P.; Soller, S. Impact of hydrogen on the high cycle fatigue behaviour of Inconel 718 in asymmetric push–pull mode at room temperature. Int. J. Fatigue 2015, 70, 137–145. [Google Scholar] [CrossRef]
- Korth, G.E. Effects of Various Parameters on the Fatigue Life of Alloy 718; Superalloys 718, 625 and Various Derivatives; The Minerals, Metals & Materials Society: Warrendale, PA, USA, 1991. [Google Scholar]
- VDM Metals. VDM® Alloy 718 (Nicrofer 5219 Nb), Material Data Sheet No. 4127, Revision 01. 2019. Available online: https://www.vdm-metals.com/fileadmin/user_upload/Downloads/Data_Sheets/Data_Sheet_VDM_Alloy_718.pdf (accessed on 23 December 2022).
- Inconel 718 Technical Data. Available online: https://www.hightempmetals.com/techdata/hitempInconel718data.php (accessed on 23 December 2022).
- Wahlén, U. The Aerodynamic Design of the Turbines for the Vulcain Rocket Engine. In Proceedings of the 31st AIAA/ASME/SAE/ASEE Joint Propulsion Conference and Exhibit, San Diego, CA, USA, 10–12 July 1995; AlAA: Reston, VA, USA, 2012. [Google Scholar] [CrossRef]
- Bosson, R.; Sabin, P.; Turin, G. Improvements of the Hydrogen Turbopump for the Vulcain 2 Engine. In Proceedings of the 35th AIAA/ASME/SAE/ASEE Joint Propulsion Conference and Exhibit, Los Angeles, CA, USA, 20–24 June 1999; AIAA: Reston, VA, USA, 2012. [Google Scholar] [CrossRef]
- Mårtensson, H.; Andersson, S.; Trollheden, S.; Brodin, S. Rocket Engines: Turbomachinery. In Advances on Propulsion Technology for High-Speed Aircraft; Educational Notes RTO-EN-AVT-150, Paper 5; RTO: Neuilly-sur-Seine, France; NATO Research and Technology Organization: Neuilly-sur-Seine, France, 2008; pp. 5-1–5-28. Available online: https://www.sto.nato.int/publications/STO%20Educational%20Notes/RTO-EN-AVT-150/EN-AVT-150-05.pdf (accessed on 24 December 2022).
- Ellerbrock, H. VULCAIN 2: Thrust Chamber. ASTRIUM Space Transportation; Propulsion & Equipment. Available online: https://www.yumpu.com/en/document/view/17516895/vulcain-2-thrust-chamber-eads (accessed on 24 December 2022).
- Riccius, J.R.; Zametaev, E.B.; Souverein, L.J. HCF, LCF and creep life analysis of a generic LRE turbine blade. In Proceedings of the AIAA SciTech Forum, San Diego, CA, USA, 3–7 January 2022; AIAA: Reston, VA, USA. [Google Scholar] [CrossRef]


| Creep Parameter | Value | Unit |
|---|---|---|
| 4.539 | ||
| 15.57 | - | |
| 8.677 | K |
| Structural Analysis Parameter | Value | Unit |
|---|---|---|
| Poisson’s ratio | 0.31 | - |
| Density | 8192 | kg/m3 |
| HCF Analysis Parameter | Value | Unit |
|---|---|---|
| 15,168 | MPa | |
| −0.2451 | - | |
| 1089 | Mpa |
| LCF Analysis Parameter | Value | Unit |
|---|---|---|
| −0.3553 | - | |
| −0.4582 | - | |
| 0.5357 | - |
| Geometric Parameters | Value | Unit | Reference |
|---|---|---|---|
| Mean blade diameter | 240 | mm | [6] |
| Number of blades of the 1st stator row | 23 | - | [6] |
| Number of blades of the 1st rotor row | 106 | - | [6] |
| Total height of the blade | 12.5 | mm | [21] |
| Leading edge radius of the blade (r1 as shown in Figure 7) | 0.209 | mm | [21] |
| Trailing edge radius of the blade (r2 as shown in Figure 7) | 0.157 | mm | [21] |
| Transition radius disk—blade (fillet radius) | 0.55 | mm | [21] |
| Blade thickness (full circle shown in Figure 7) | 3.8 | mm | [21] |
| Chord length of the blade | 9 | mm | [21] |
| Loading Conditions | Value | Unit | Reference |
|---|---|---|---|
| Total temperature at the inlet of the 1st turbine stage (related to the global/fixed coordinate system) | 873 | K | [6] |
| Rotational speed of the reference LRE H2 turbo pump | 35.68 | krpm | [6] |
| Rotational speed of the reference LRE H2 turbo pump (as calculated from the line above) | 3736 | rad/s | - |
| Output power of the reference LRE hydrogen turbine | 14.29 | MW | [6] |
| Relative power split between the 1st and the 2nd rotor stage of the 1 MN thrust class gas generator LRE hydrogen turbo pump. | 60:40 | % | [19] |
| Output power of the 1st stage of the 1 MN thrust class reference LRE hydrogen turbine (as calculated from the two table lines above) | 8574 | kW | - |
| Quotient: Total temperature, related to the relative (rotating) coordinate system of the turbine blade/total temperature, related to the global (fixed) coordinate system | 0.917 | - | [21] |
| Total temperature in the relative (rotating) coordinate system of the turbine blade of the 1st rotor stage (as calculated from the very 1st and the above-line of this table) | 800 | K | - |
| Static pressure at the inlet of the 1st rotor stage of the 1 MN thrust class reference H2 turbo pump | 4.18 | MPa | [21] |
| Static pressure at the outlet of the 1st rotor stage of the 1 MN thrust class reference H2 turbo pump | 3.57 | MPa | [21] |
| Mean static pressure of the 1st rotor stage of the 1 MN thrust class reference H2 turbo pump (as calculated from the two table lines above) | 3.88 | MPa | - |
| Total temperature at the H2 inlet of the 1 MN reference thrust chamber (assumed as total temperature at the H2 outlet of the 1 MN reference H2 turbo pump, and therefore applied as impeller temperature of the turbo pump) | 36 | K | [22] |
| Impeller Position Boundary [Face A of Figure 8] | Blade and Outer Disk Surface Boundary [Face B of Figure 8] | |
|---|---|---|
| bulk temperature [K] | 36 | 800 |
| film coefficient [kWm−2 K−1] | 1000 | 50 |
| Load Step Number | Time Range of the Load Step [s] | Spin Loading [rad/s] | Static Pressure (Normal to the Surface) [MPa] | Component Pressure, Acting in Axial Direction of the Turbine [MPa] | Component Pressure, Acting in Circumferential Direction of the Turbine [MPa] |
|---|---|---|---|---|---|
| 0–1 | 0 | 0 | 0 | 0 | |
| 1–2 | 3736 | 0 | 0 | 0 | |
| 2–3 | 3736 | 3.88 | 0.112 | 0.377 | |
| 3–4 | 3736 | 3.88 | 0.186 | 0.629 | |
| 4–540 | 3736 | 3.88 | 0.186 | 0.629 | |
| 540–542 | 0 | 0 | 0 | 0 |
| Impeller Position Boundary [Face A of Figure 8] | Blade and Outer Disk Surface Boundary [Face B of Figure 8] | ||||
|---|---|---|---|---|---|
| Load Step Number | Time Range of the Load Step [s] | Bulk Temperature [K] | Film Coefficient [kWm−2 K−1] | Bulk Temperature [K] | Film Coefficient [kWm−2 K−1] |
| 0–1 | 36 | 1000 | 295 | 0.2 | |
| 1–6300 | 36 | 1000 | 295 | 0.2 | |
| 6300–6301 | 36 | 1000 | 800 | 50 | |
| 6301–6841 | 36 | 1000 | 800 | 50 | |
| 6841–6842 | 36 | 1000 | 295 | 0.2 | |
| 6842–17,000 | 36 | 1000 | 295 | 0.2 | |
| Load Step Number | Time Range of the Load Step [s] | Spin Loading [rad/s] | Static Pressure (Normal to the Surface) [MPa] | Component Pressure, Acting in Axial Direction of the Turbine [MPa] | Component Pressure, Acting in Circumferential Direction of the Turbine [MPa] |
|---|---|---|---|---|---|
| 0–1 | 0 | 0 | 0 | 0 | |
| 1–6300 | 0 | 0 | 0 | 0 | |
| 6300–6301 | 3736 | 3.88 | 0.112 | 0.377 | |
| 6301–6841 | 3736 | 3.88 | 0.186 | 0.629 | |
| 6841–6842 | 0 | 0 | 0 | 0 | |
| 6842–17,000 | 0 | 0 | 0 | 0 |
| Result Description | 3D FE Analysis Value | Unit |
|---|---|---|
| Maximum principal stress of the FE analysis at the maximum loading point of the 3D model. | 463 | MPa |
| Maximum principal stress of the FE analysis at the maximum loading point of the 3D model. | 517 | MPa |
| Cyclic stress of the stationary hot-run at the maximum loading point. | 54 | MPa |
| Stress amplitude of the stationary hot-run at the maximum loading point. | 27 | MPa |
| Mean stress of the stationary hot-run at the maximum loading point. | 490 | MPa |
Disclaimer/Publisher’s Note: The statements, opinions and data contained in all publications are solely those of the individual author(s) and contributor(s) and not of MDPI and/or the editor(s). MDPI and/or the editor(s) disclaim responsibility for any injury to people or property resulting from any ideas, methods, instructions or products referred to in the content. |
© 2023 by the authors. Licensee MDPI, Basel, Switzerland. This article is an open access article distributed under the terms and conditions of the Creative Commons Attribution (CC BY) license (https://creativecommons.org/licenses/by/4.0/).
Share and Cite
Riccius, J.R.; Zametaev, E.B. HCF and LCF Analysis of a Generic Full Admission Turbine Blade. Aerospace 2023, 10, 154. https://doi.org/10.3390/aerospace10020154
Riccius JR, Zametaev EB. HCF and LCF Analysis of a Generic Full Admission Turbine Blade. Aerospace. 2023; 10(2):154. https://doi.org/10.3390/aerospace10020154
Chicago/Turabian StyleRiccius, Jörg R., and Evgeny B. Zametaev. 2023. "HCF and LCF Analysis of a Generic Full Admission Turbine Blade" Aerospace 10, no. 2: 154. https://doi.org/10.3390/aerospace10020154