Article

A Study on the Optimal Design Method for Star-Shaped Solid Propellants through a Combination of Genetic Algorithm and Machine Learning

Department of Aerospace Engineering, Inha University, 36 Gaetbeol-ro, Yeonsu-gu, Incheon 21999, Republic of Korea
*
Author to whom correspondence should be addressed.
Aerospace 2023, 10(12), 979; https://doi.org/10.3390/aerospace10120979
Submission received: 1 September 2023 / Revised: 16 November 2023 / Accepted: 21 November 2023 / Published: 22 November 2023

Abstract

:
This study was focused on the configuration design of a star grain by using machine learning in the optimal design process. The key to optimizing the grain design is aimed at obtaining a set of configuration variables that satisfy the requirements. The optimization problem consists of an objective area profile subject to certain constraints and an objective function that quantitatively calculates the design level. Designers must formulate suitable optimization problems to achieve an optimal design. However, because a method to alleviate the influence of the sliver section is not yet available, the optimization problem is typically solved based on experience, which is time- and effort-intensive. Consequently, a more practical and objective grain design method must be developed. In this study, an optimal design method using machine learning was developed to increase the convenience and success rate. A support vector machine was used to train a classification model that predicts a class. The classification model was used to alleviate the influence of the sliver zone and correct the search problem to ensure that an optimal solution existed in the region satisfying the requirements. The proposed method was validated through star grain optimal design using the genetic algorithm. The optimization was performed considering the area profiles, and the effectiveness of the proposed method was demonstrated by the enhanced accuracy.

1. Introduction

The propellant grain configuration considerably influences the thrust profile in a solid propulsion system. The objective of grain configuration design is to obtain the burning surface area profile (area profile) according to the length of the burned propellant in the direction normal to the burning surface (web burned). In a solid rocket motor, the burning surface area is directly related to the pressure and thrust, because the burning surface area determines the amount of combustion gas. The internal ballistics analysis calculates thrust using propellant properties, burning surface area, and nozzle shape. Depending on the mission, various area profiles, such as progressive, neutral, and regressive, can be applied. The grain design focuses on modifying the set of configuration variables to generate the desired area profile [1,2,3]. In addition to the area profile, several factors, such as manufacturability, must be considered in the design of the grain configuration. Cylindrical grains represent the simplest grain configuration. Although these grains are easy to design and manufacture, they cannot achieve a neutral profile. Finocyl has a complex configuration combining various cross-sectional shapes. This configuration can generate most area profiles and is used in high-performance propulsion systems because of its high loading density [1,2,3,4,5]. However, in the design of this configuration, computer-aided design (CAD) programs or high-accuracy numerical analysis code must be performed to obtain the burning surface area. In this context, optimal finocyl design is challenging because of the numerous design variables and the high manufacturing cost. The star configuration has been widely used in various propulsion systems because it can achieve multiple area profiles (regressive, neutral, and progressive), is easily manufactured, and exhibits high productivity [6,7,8,9,10]. However, the optimal design of star grain configurations is challenging [6,11]. Specifically, because the influence of the variations in the configuration variables on the area profile is complex, the designer cannot quickly determine the proper direction of correction. Therefore, the design process requires multiple iterations and is time- and knowledge-intensive [12]. High-performance optimization techniques for grain design have been developed for these problems.
Optimization techniques can be divided into deterministic and stochastic approaches [13,14]. The problem of grain design is a variety of local solutions. The optimization process is focused on searching for a set close to the optimal solution that satisfies the requirements among local solutions. However, deterministic and stochastic approaches are less likely to succeed in grain optimal design because of their inherent limitations, such as the lack of global search capability and low convergence performance. In the initial studies, a single optimization technique suitable for grain design was studied. Guozhu used a deterministic approach to design the wagon wheel configuration, and Kamran used a stochastic approach to design the cylindrical and star configurations [7,15]. However, these methods were noted to be ineffective in optimal grain design because of the shortcomings of each technique. Hybrid optimization techniques that combined two optimization techniques were studied to solve this problem. Raza used two stochastic approaches to increase the accuracy of the wagon wheel design [16], and Oh combined the deterministic and stochastic approaches to use the advantages of both approaches [10]. However, hybrid methods have insufficient universality and flexibility. For example, the suitable conditions for the design target must be identified. Recently, a general-purpose optimal design method was developed using a hyper-heuristic optimization technique combining various optimization techniques [17,18]. In this approach, the optimization process is repeated using all available optimization techniques, and the best result is used as the design. Although this approach has excellent search performance, it is challenging because it requires a significant amount of time and money. Industrial sites typically use easy-to-use optimization techniques such as genetic algorithms and grain configurations with high manufacturability considering the design, manufacturing time, and cost. Consequently, there is a significant demand to develop a new methodology to enhance the possibility of design success. Although optimization techniques for designing grain configurations have been studied, optimal design investigations for star grains with excellent utility still need improvement. Therefore, this study is focused on the optimal design of the star grain configuration.
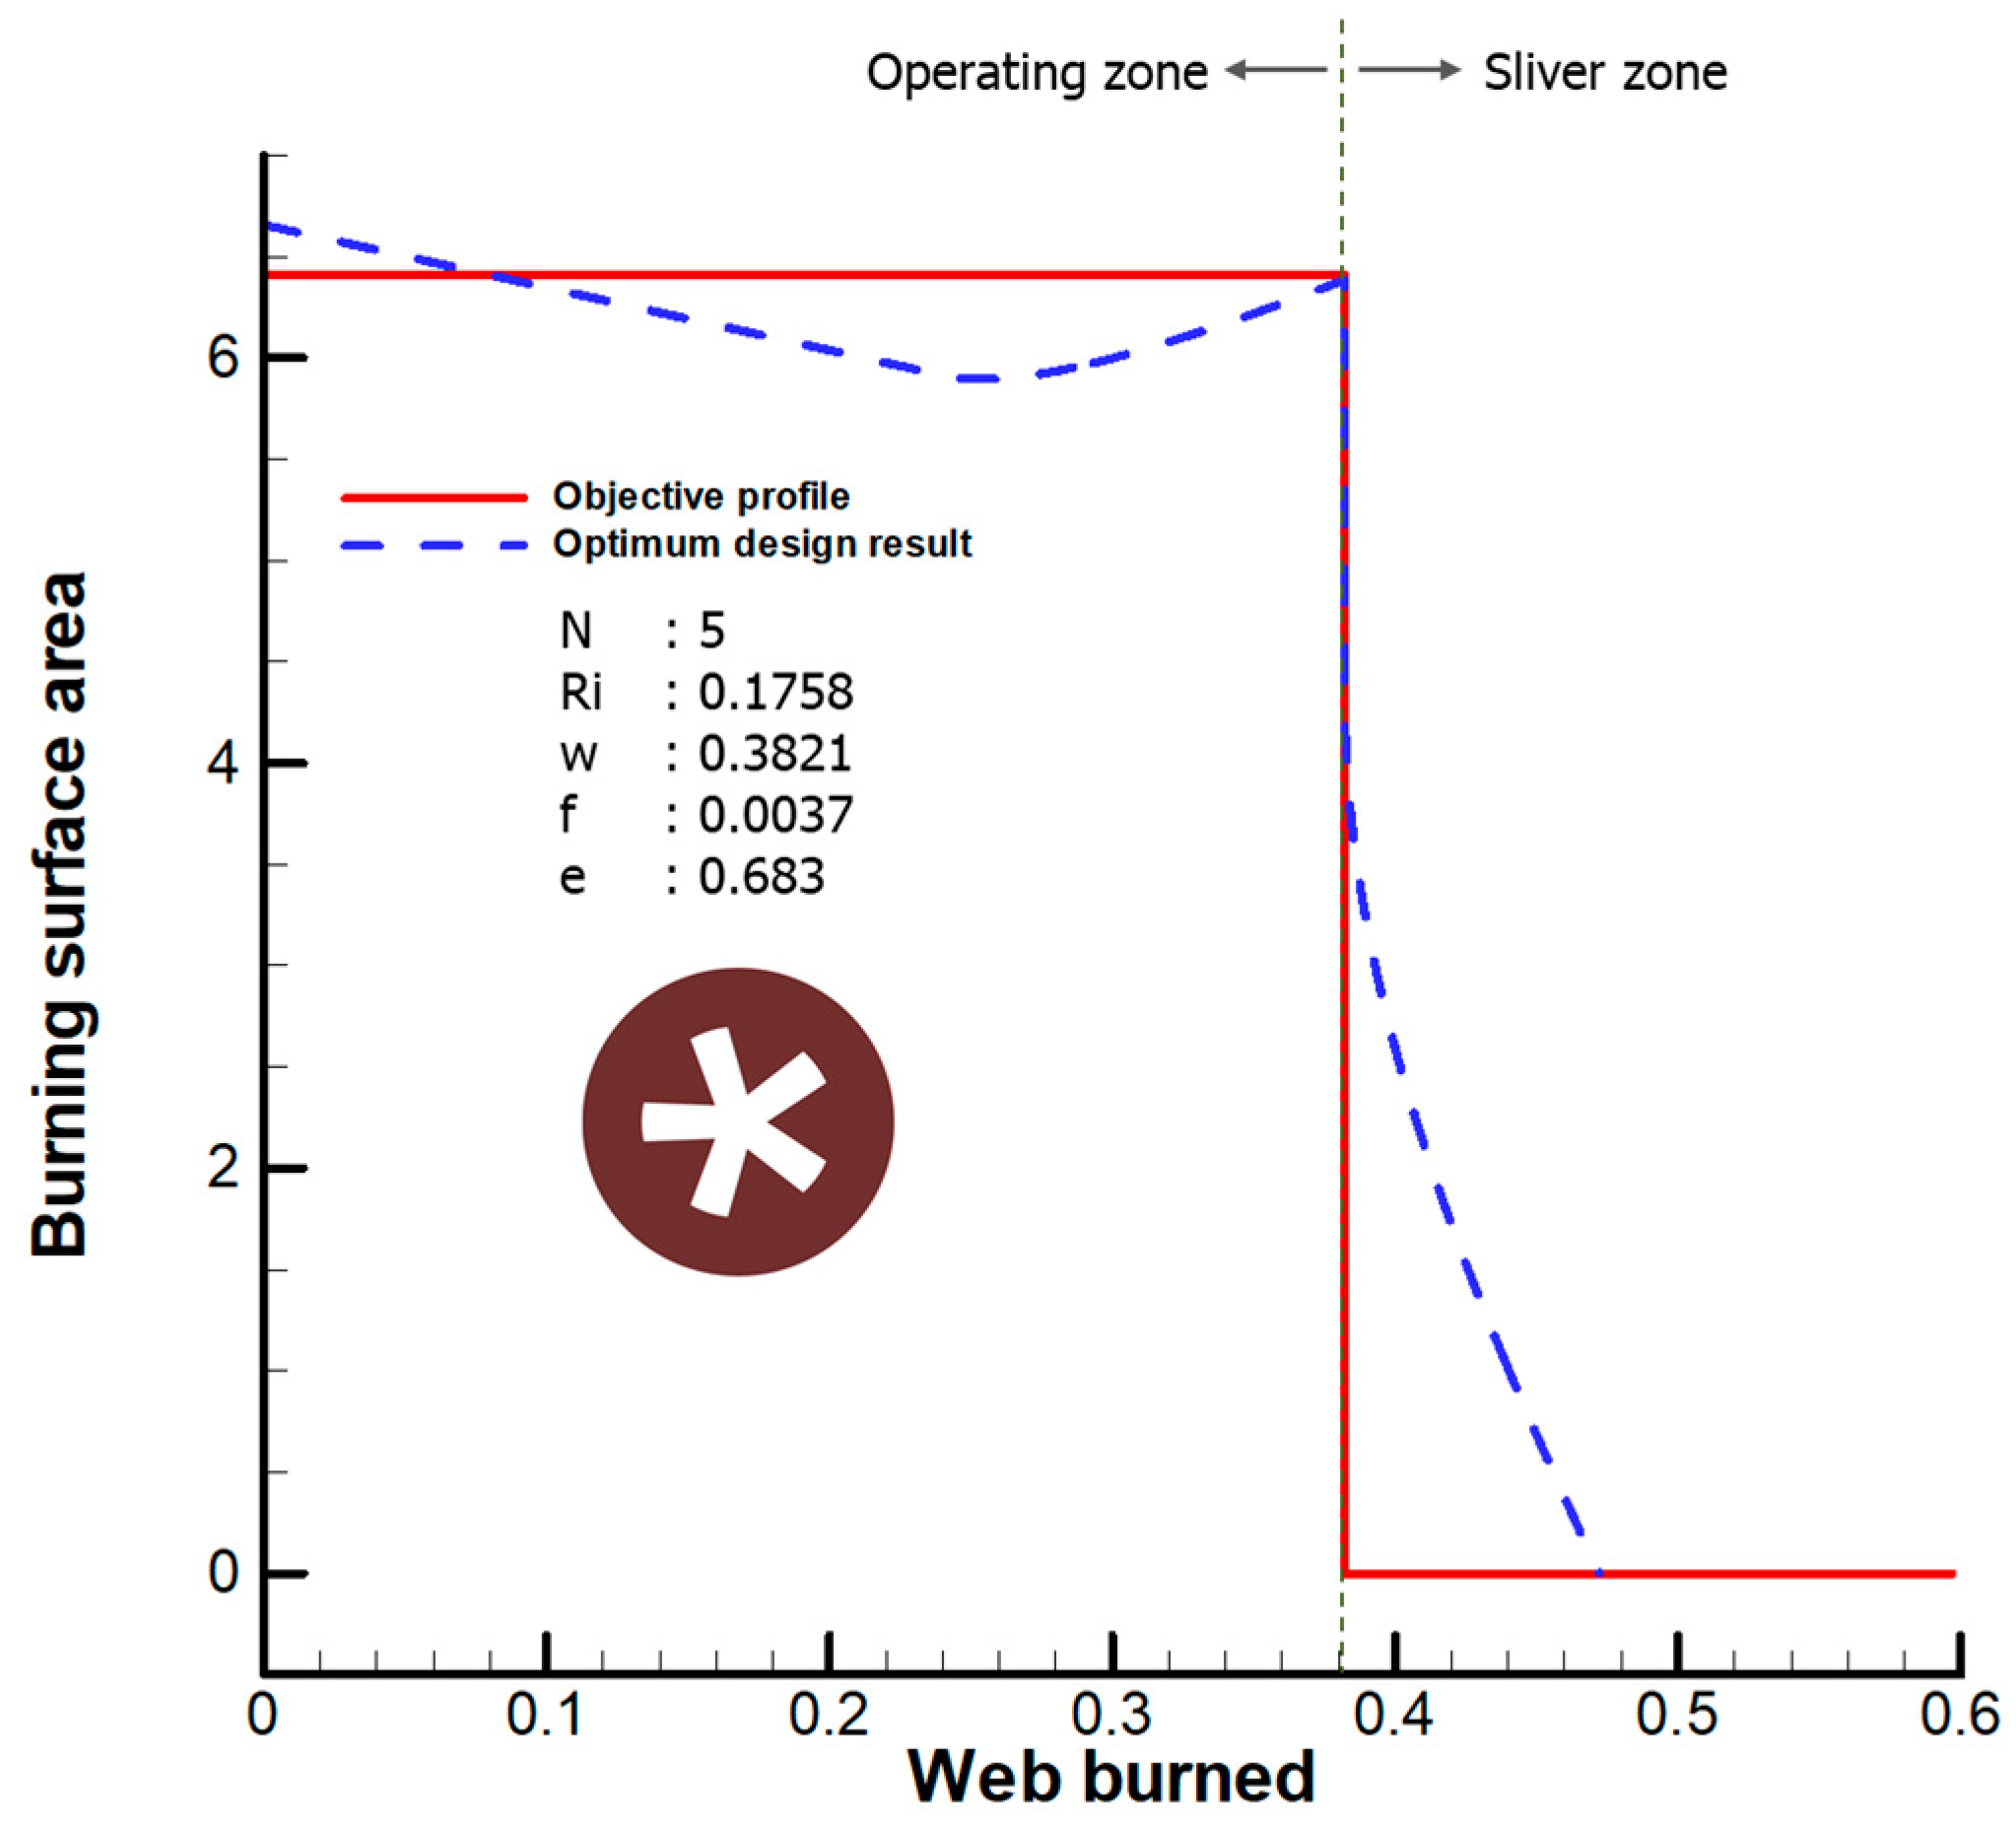
Figure 1 shows the conventional area profile of a star grain. The area profile of a star grain can be divided into two zones: operating and sliver zones. The propulsion system works in the operating zone, and the system requirements determine the area profile. In the sliver zone, the burning of the web terminates, and the area profile rapidly decreases as the propellant residue is burned [19]. The thrust required by the system cannot be generated because of the rapid decrease in the burning surface area in this zone. This sliver zone is the cause of the inappropriate optimization of the star grain configuration for the following reasons. First, the area profile of the sliver zone must be appropriately defined by the designer to achieve an optimal solution that satisfies the requirements. However, setting up an appropriate profile is difficult because a standard process has not been developed. Second, the inappropriate setting of the objective function may lead to failed optimization. Specifically, if the designer does not consider the sliver zone when setting the objective function, the designed grain’s objective profiles and area profiles may be considerably different in the sliver zone. This problem has previously been shown [6]. Açik obtained an objective profile using experimental data, considering the sliver zone, and successfully reverse-designed the neutral star grain using an optimization technique. However, a neutral profile could not be obtained when this technique was used without considering the sliver zone. Therefore, the optimization problem must be modified by considering the unknown area condition of the sliver zone. The optimization problem consists of configuration variables and an objective function. The objective function uses configuration variables to calculate the optimization level. The optimization level changes depending on settings such as objective profile, calculation intervals, and weighting factors. However, because the effect of configuration variables on the objective function is complex, it is difficult to determine the correlation. Therefore, many modified processes are required based on experience to obtain an appropriate objective function until the minimum value satisfies the requirements. But such modifications need much time and cost.
Machine learning techniques can conceivably be used to modify the optimization problem for grain design. Machine learning is widely applied in various fields due to its strong ability to analyze complicated correlations that humans cannot [20]. A machine learning framework can predict whether the designed configuration variables satisfy the requirements if the correlation between the configuration variables and requirements is provided. The previous study modified the grain configuration using machine learning and the Simplex method [21]. This study searches for the maximum margin to obtain a configuration that satisfies the requirements. However, this modified configuration could be more optimal because the margin is the smallest near the boundary that meets the requirements.
Therefore, this paper proposes a new optimal design method to optimize the star grain’s geometric configuration. The problem with the existing method was that the correlation between the shape variable and the objective function could not be known. The new method uses machine learning to learn the correlation and uses the learning results to modify the objective function appropriately. The database saves many randomly generated configuration variables and burn-back analysis results. Learning data are obtained by mining data close to the requirements of the database. Training data are provided to a support vector machine (SVM) to create a classification model that predicts a class. The classification model can accurately predict whether the configuration variables satisfy the requirements. If the classification model predicts that the requirements cannot be satisfied, a penalty is applied to the optimization result. An optimal solution that satisfies the requirements can be derived through this process. The performance of the proposed method is evaluated by applying it to neutral and complicated grain design using a genetic algorithm and analyzing the results.

2. Challenges Associated with the Optimal Design of Star Grain

2.1. Process of Grain Optimal Design

Figure 2 shows the optimization process of grain design. The design aim is to obtain an objective function that satisfies the requirements. First, the designer formulates an optimization problem to search for a grain configuration that meets the requirements and sets an objective function that quantitatively calculates the difference between the objective and area profiles. The design variable is a set of grain configuration variables, and the search objective is a set with the minimum objective function. The objective profile is typically derived from the required flight performance for a given propulsion system [9,14,22]. Table 1 lists the design requirements considered in this study on the area profile of the operating zone. This requirement is one of the failure cases of optimal design conducted under arbitrary conditions to confirm the performance of previous methods. The star grain design must satisfy the neutral area profile during operation. The neutral area profile is a constant area and challenging to design. The objective function is the standard deviation (Equation (1)), where A is the burning surface area of the grain in the design and A o is the objective area. In this study, all variables were non-dimensionalized based on an outer radius of 1 mm to reduce search variables and consider various sizes. The grain length was set to be equal to the outer radius.
  σ = c = 1 n A c A o c A o c 2 n
Figure 3 shows a conventional star-shaped cross-section and design variables for the configuration. The burning surface moves in the direction normal towards the motor case. A sliver is generated when the tip of the branch reaches the motor case. Table 2 lists the configuration variables that define star grains. The area profile of the set can be obtained via grain burn-back analysis. This study performs burn-back analysis using the analytical method [22,23]. This method geometrically analyzes the grain composition to obtain equations for straight lines, curves, and areas. The equations verified in previous studies for developing star grain are used [19]. For example, the initial burning surface area A can be calculated using Equation (2) and configuration variables.
A = 2 N R p sin π e N sin θ 2 f cot θ 2 + f π 2 θ 2 + π e 2 + R p + f π 2 π e 2 R p = R e R i f ,     θ 2 = tan 1 R p sin π e N tan π e N R p sin π e N R i tan π e N

2.2. Objective Profile and Function

The objective profile and function are essential in formulating the optimization problem. Figure 4 shows a sample objective profile [9,14,22]. In general, the requirements determine the objective profile of the operating zone. Therefore, the designer creates the objective profile of the sliver zone, relying on experience. In the case shown in Figure 4, the objective profile means that no sliver zones exist in the motor operation. The difference between the two profiles is the objective function. The optimal solution consists of the configuration variables for minimizing the objective function. The designer sets the objective function based on experience because no standard method is available to determine the number and interval of points for calculating the difference between two profiles. The number of calculation points must be adequately large to confirm the quantitative difference between the two profiles. This study set the number of calculation points as 200 and considered a constant calculation interval.

2.3. Optimal Solution Search

Genetic algorithms are widely used because these algorithms can optimize multiple variables and have excellent global search performance [11,24]. Table 3 shows the search range and settings of design variables. The range is set to satisfy the broadest range of geometric configurations. The external radius is set to a constant value according to the requirements. A set of five different design variables is searched using an optimization technique. The optimization end condition is that the objective function converges. It was set so that convergence occurred when the change in the objective function satisfied less than 1.0 × 10⁻⁵.

2.4. Modification of the Optimization Problem

Figure 5 shows the result of searching for the configuration variables closest to the objective profile with the genetic algorithm set for the range of variables suggested in Table 3. The optimization result obtained using the genetic algorithm results in a design failure because the standard deviation of the operating zone is 2.78, which is more than 0.5 and thus does not satisfy the requirements. This failure is attributable to two reasons. The first reason is the inadequate performance of the optimization technique, owing to which it cannot identify the optimal solution. Nevertheless, the genetic algorithm has successfully optimized the grain configuration design [1,7]. Even in this study, the searchability of the algorithm is sufficient because the optimal design using the settings listed in Table 3 is successful, as described in Section 4. The second reason pertains to the inappropriateness of the optimization problem. The optimal solution is the set of configuration variables with the minimum objective function. The optimal solution varies in the objective profile and calculation interval between the two profiles. Therefore, the designer must appropriately define the objective profile and calculation interval to obtain an optimal solution that satisfies the requirements. If the requirements are not satisfied, the optimization problem must be modified. The leading cause of the optimal design failure is the area profile of the sliver zone. In the objective profile shown in Figure 4, the area of the sliver zone is zero. However, in the case of a star grain, the area of the sliver zone must be nonzero because the residue burns in the sliver zone. Consequently, the genetic algorithm redesigns the set of configuration variables to decrease the difference in the sliver zone, even if the difference in the operating zone is slightly increased.
Because a method for adequately correcting the objective profile has yet to be developed, the objective profile is modified based on the designer’s experience. Figure 6 shows the objective profile modified in this study. The modified profile ranges from the beginning of the objective profile to the part at which the sliver area is reduced by half. This setting is introduced to exclude the difference in the sliver zone. The area cannot rapidly decrease to zero because the sliver is burned. Therefore, the final area of the modified objective profile is half that of the initial area, considering the result shown in Figure 6. The optimal solution (2) in Figure 6 is the optimal design result obtained using the modified objective profile. The modified problem aims to search an area profile closer to a neutral profile than the previous result. However, the web burned at the end of the operating zone is longer than the requirements. When the calculation interval is uniform, the difference between the two profiles is calculated 199 times in the operating zone and once in the sliver zone for the modified objective profile. In this manner, the design process performs more neutrally in the operation zone instead of decreasing the error of the sliver zone. Weighting factors and modified calculation interval are methods to solve this problem. Both methods can modify the optimization problem to increase the impact of the standard deviation in the sliver region on the objective function but require settings appropriate to the requirements. Optimal solution (3) pertains to searching for the optimal solution using the modified calculation interval. The goal for this interval is to ensure that the web burned in the sliver zone is the same as that in the objective profile. The difference between the two profiles is calculated 150 times in the operating zone and 50 times in the sliver zone. According to the results, the mean area and web burned to satisfy the requirements, and the profile closest to the objective profile is designed. However, the standard deviation for the operating zone is 0.84, which does not satisfy the requirements.
Although the modified problem can yield a design closer to the objective function, all the requirements are not satisfied. Given the lack of a standard or appropriate modification method, the problem is modified depending on the designer’s experience, making the optimal design process vulnerable to failure. Therefore, the optimal design of the star grain configuration is challenging because of the complex and iterative nature of the modification of the optimization problem. If the method is developed to eliminate the modified process, the design can be efficiently optimized with reduced time and effort. Therefore, this study is focused on developing a new optimal design method using machine learning to correct the optimization problem.

3. Grain Design Using Machine Learning

Machine learning aims to recognize complex patterns or make intelligent decisions. Machine learning techniques are used in various fields to analyze a considerable amount of data and obtain information suitable for a specific purpose [25]. The learning method must be selected considering the problem. The grain design problem involves a set of configuration variables, and the objective function is used as the learning data. In this case, supervised learning is suitable as the input information (such as the set of configuration variables) and output (class satisfying the requirements or not) are known. Supervised learning may be classified into classification or regression problems. Grain design is a classification problem that separates data that satisfy the requirements from other data. This study used a support vector machine (SVM) that analyzes complex correlations of various variables for learning classification problems [25,26]. SVM has been used in multiple studies, such as classifying normal and faulty operations and predicting fault locations [27,28,29,30,31].

3.1. SVM Application to Grain Design

In the SVM, the boundaries between classes are defined as hyperplanes. The classification model can predict the class of a new input variable using the hyperplane learned by the SVM. Figure 7 shows a sample linear SVM. The data are the input coordinates ( x 1 , x 2 , , x n ) and class ( y ), defined by the vector in Equation (3). A typical SVM is used when there are two classes, and only one hyperplane classifies the two classes, as shown in Figure 7. But, if there are three or more y, it is necessary to use multiclass SVM. Multiclass SVM learns multiple hyperplanes by learning a classification model with three or more classes.
  x 1 , x 2 , , x n , y
The margin is the dot product of the hyperplane and data. The SVM calculates a hyperplane vector w and constant b , for which all data satisfy Equation (4). The margin of the support vector is 1.
  y × w · x 1 , x 2 , , x n b 1
A class of new input coordinates is predicted using the margin. Positive and negative margins correspond to classes 1 and −1, respectively. For example, the new point p in Figure 7 is defined as class −1 by the hyperplane.
Variations in the configuration parameters lead to nonlinear problems that affect the area profiles. Nonlinear data can be classified by defining a hyperplane using a kernel function. This study used a nonlinear SVM that performed a Gaussian kernel function, a representative SVM kernel suitable for learning complex boundaries [25]. Because the grain configuration changes geometrically, the problem does not involve noise, and the classes are adequately distinct. Therefore, the SVM is a suitable tool for grain design [21]. SVM is embedded in various examples of free and commercial software [32]. MATLAB R2021b, which contains multiple machine learning and kernel functions and supports Bayesian optimization to establish the optimal hyperplane, is used in this study.

3.2. Database and Learning Data

For classification problems with a complex hyperplane, sufficient learning data and overfitting prevention techniques must be used to obtain an accurate classification model. In this study, databases of various sizes are obtained (Table 4) to check the amount of data required for learning, and a model for accurately predicting the class of new input data is obtained. A database is an extensive data collection containing configuration variables, objective functions, and standard deviation. The database-obtaining process is divided into four steps. First, set the range of configuration variables, as shown in Table 3. Second, generate grain configurations using a random function. This study uses the Mersenne Twister random number generator to generate uniformly distributed random numbers [32]. Five databases were created with different data counts named D1 to D5. The data count is the number of items of data saved in the database. D1 has 1000-grain configuration data, and the number of data was increased by 10 times at each stage from D1 to D5. Third, Search for geometrically feasible configurations. The configuration variables that are randomly generated may have unfeasible initial configurations, such as slivers being generated. These configurations need to be excluded from the burn-back analysis. Finally, perform the burn-back analysis and calculate the standard deviation. The class is defined using the standard deviation of the operating zone. The set with a standard deviation of 0.5 or lower in the operating zone is class 1. The set with a standard deviation of 1.0 or lower in the operating zone is class −1, as indicated in Table 5. The learning data are mined from the database to obtain an accurate classification model. Data suitable for learning are close to the boundary. For example, data with standard deviations of 0.49 and 0.51 are more appropriate than those with 0 and 1. As mentioned, this study obtained learning data corresponding to classes 1 and −1 through data mining. The learning data count is the number of items of data mined for use in SVM. Data with a standard deviation of 1 or more are not used for learning, because data far from the boundary may negatively influence the model training, such as increasing the learning time.
The classification model that classifies grain classes during design was trained using SVM. The grain during design is new and unknown data to the classification model. This study used the holdout cross-validation technique to increase the classification accuracy of the unknown data [33]. This technique can prevent overfitting in learning using a large amount of data. The learning dataset is divided into the training and test datasets using the holdout cross-validation technique, as shown in Figure 8. The test dataset is 15% of the learning dataset. The SVM creates the model using the training dataset and validates it using the test dataset. In this process, the SVM optimizes the kernel functions through Bayesian optimization to increase the classification accuracy.
Table 6 summarizes the learning results using SVM. In the case of D1, learning cannot be performed because of the small amount of data. The accuracy of the classification model increases when the amount of data increases because of the enormous amount of data around the boundary. This study used a classification model trained using the D5 database because this model has the highest accuracy.

4. Optimal Design Using Machine Learning

4.1. Grain Optimal Design Using Penalty

Figure 9 shows the process of grain optimal design using machine learning. The previous design process is divided into three main steps. First, the configuration variables are set. Next, the area profile of the set is obtained through burn-back analysis. Finally, an objective function is determined, which checks whether the selected variables satisfy the requirements. The new design method uses a classification model to predict whether a set of configuration variables meets the requirements. The classification model is obtained using SVM before performing the optimal design. The designed grain configuration satisfies the requirements when the classification model predicts class 1. A penalty is applied to the objective function if the requirements are unsatisfied. Generally, grain design is complicated because the optimization problem and design requirements are independent. The solution to the optimization problem is to find the minimum objective function. However, the optimal solution typically only satisfies some requirements. The penalty can modify the optimization problem to obtain the optimal solution that meets the requirements.
Figure 10 shows an example of the penalty applied to a one-variable minimum solution search problem. The typical minimum search problem consists of an optimization problem and constraints. In the grain design problem, the constraints cannot be defined with the variables and objective function. This search problem obtains the optimal solution in a three-step process. First, the optimal solution is found and whether this solution satisfies the constraints is checked. Second, various data are analyzed to obtain the boundary conditions that meet the constraints. Third, the optimal solution that satisfies the constraints is found. In this example, the design variable with the most minor objective function is 1.03, but this solution does not meet the constraints. Therefore, various design variables are input, and the boundary condition that satisfies the constraints is obtained by analyzing the “satisfy” and “fail” cases. Optimization is performed to obtain the optimal solution in the region that meets the constraints.
The classification model is used to obtain and apply the constraints in the grain design process. The constraint can be easily obtained because the example has only one design variable. The constraints of the star grain design pertain to the five-dimensional hyperplane; thus, a designer cannot easily obtain the constraints. However, the SVM can learn the constraint and obtain the classification model. The classification model predicts the set of configuration variables that satisfy and do not satisfy the constraints as classes 1 and −1, respectively.
The penalty modifies the optimization problem such that an optimal solution in the region satisfies the requirement. The example can obtain the correlation between the constraints and design variables. Therefore, if the search range is modified, the example can obtain an optimal solution that satisfies the constraints. However, the same method cannot be used for grain design because the correlation cannot be obtained. Therefore, the grain design applies the penalty shown in Figure 10 to satisfy the constraints.

4.2. Neutral Grain Optimal Design Using Single-Class SVM

This study performed a neutral grain design using the classification model and penalty. Case 1 corresponds to the design based on only the genetic algorithm, and case 2 is based on the genetic algorithm and SVM. The area profile in case 2 is closer to the objective profile than in case 1, as shown in Figure 11. Table 7 summarizes the quantitative results of grain design. Different sets of configuration variables are obtained in cases 1 and 2. Consequently, the case 1 design needs to satisfy the standard deviation of the requirements. The case 2 design meets all requirements.
The design failure in case 1 is attributable to the unsuitable optimization problem. The penalty is confirmed to be a valuable method to modify the optimization problem. Case 1 has a smaller objective function than that in case 2. Therefore, the genetic algorithm successfully searches for the optimal solution. However, case 1 is an unsuitable optimization problem in which the optimal solution fails to satisfy the requirements. If the set of case 1 is input to the classification model, the output is class −1, and, thus, the penalty is applied. The optimal solution of case 2 is shifted to the region that satisfies the requirements. The classification model accurately predicts the class, and the case 2 design meets all requirements.

4.3. RP Grain Optimal Design Using Multiclass SVM

The optimal design with a more complicated area profile than a neutral profile is performed to confirm the usefulness of the proposed grain design method [34]. This study used regressive–progressive (RP) grain to confirm whether various classification models are helpful for complex grain design. The RP grain has two phases in its operating section: regressive burn and progressive burn. The area profile is considered a clear RP profile when it satisfies the three conditions in Table 8. First, the initial and final areas are identical. Second, the minimum area is located at the center of the operation zone. The first and second conditions are set with a margin of 5% to decrease the convergence time of the optimization process. Third, the minimum area is 7–12% smaller than the initial area. This study analyzed the database to confirm the distribution of the minimum area and set −12 to −7% as the design goal. Figure 12 shows the area profile that satisfies the RP conditions.
Table 9 lists the requirements for the optimal RP grain design. By applying the RP condition, the initial area determines the final and minimum areas. The web burned with the minimum area defines the total web burned in the operating zone.
The neutral grain design is based on one classification model. In contrast, in the RP grain design, training a high-accuracy classification model is challenging because the amount of data satisfying all conditions is minimal. Therefore, the SVM is performed for each RP condition, as shown in Table 10, and classification models 1–3 are obtained.
The multiclass SVM can classify multiple classes, which is suitable for basic design. For example, the binary classification model that classifies classes 1 and −1 must be retrained using the SVM when the objective is changed. However, the classification model obtained using the multiclass SVM does not need to be retrained. This study obtained the classification models using the multiclass SVM. Table 11 presents the class and learning data definitions. The multiclass SVM creates a hyperplane for each class. The classification model calculates the margins of all classes and outputs the class with the highest margin. Therefore, multiclass can predict which class it belongs to among various classes. For example, the set of configuration variables with class 7 in model 4 can be predicted to have an initial region of 6.550–6.560 without any burn-back analysis process.
The objective classes are criteria for classifying whether the designed grain satisfies the requirements. If all models output the same results as the objective classes, it can be predicted that the designed grain satisfies the requirements. The objective classes are set as indicated in Table 12. Models 1–3 are binary classification models. Therefore, the objective class is 1. Table 13 shows the objective classes of models 4–5. The initial area of the requirements is 6410. So, the objective class of model 4 is 4. The web burned with the minimum area of the requirements of 0.16. So, the objective class of model 5 is 5. In the design process, the penalty is applied to the objective function if the designed grain classes differ from the objective classes.
The RP grain design using multiclass SVM and penalty satisfies the requirements. Case 3 is the design based on only the genetic algorithm, and case 4 is based on the genetic algorithm and SVM. Figure 13 shows the objective profile and design results. The green line shows the objective profile. Case 3 shows a profile similar to the objective profile, but the web burned with the minimum area of the operating zone does not satisfy the requirements. The enlarged view of the profile shown in Figure 13 shows that the minimum area of the shape in case 3 is inclined to the right. Table 13 summarizes the quantitative results of grain design. The sets of configuration variables in cases 3 and 4 are different.
Case 3 corresponds to design failure because of the unsuitable optimization problem. The penalty is confirmed to be a suitable tool to modify the optimization problem. The objective function in case 3 is smaller than that in case 4. Therefore, the genetic algorithm successfully searches for the optimal solution. Therefore, case 3 is an unsuitable search problem in which the optimal solution fails to satisfy the requirements. If the set of case 3 is input to the classification model, the output is shown in Table 13. The classification model correctly classifies that the case 3 design does not satisfy this condition. The multiclass SVM predicted performance variables without the burn-back analysis. In case 3, the initial area is 6.329 (class 3), and the web burned of the minimum area is 0.186 (class 6). Models 4 and 5 correctly predict both classes.

5. Conclusions

A star grain design method was developed using optimization techniques and machine learning. The star grain requirements define the objective area profile of the operating zone. The area profile of the sliver zone is variable and unpredictable. Optimization problems need objective functions that consider incomplete objective profiles. Optimal design fails because the minimum objective function does not satisfy the requirements. In this case, the designer needs to modify the objective function. However, an appropriate modification method cannot be developed because the correlation between configuration variables and requirements cannot be analyzed intuitively. Therefore, numerous existing design results cannot be utilized, and numerous iterative analyses have been performed to find configuration variables appropriate for the requirements, relying on experience. These existing methods were difficult to apply in designing the grain configuration, and there were many cases of failure in actual optimization. The proposed grain design method overcomes this difficulty by applying machine learning. The SVM trains a classification model that predicts whether the designed grain satisfies the requirements. The classification model modifies the minimum objective function to meet the requirements. The proposed method was applied to various design failure cases and successfully performed optimal design. This study confirmed that machine learning is a suitable tool for grain design. A factor that makes grain design difficult is uncertain design conditions. Machine learning obtains valuable information for design by utilizing learning design conditions that could not be analyzed with previous methods. However, this study considered only the star grain configuration and specific conditions. Additional research needs to be conducted considering various configuration designs and requirements.

Author Contributions

Conceptualization, S.-H.O.; investigation, S.-H.O.; validation, S.-H.O., H.J.L. and T.-S.R.; writing—original draft preparation, S.-H.O.; writing—review and editing, H.J.L. and T.-S.R.; supervision, H.J.L. All authors have read and agreed to the published version of the manuscript.

Funding

This work was supported by the National Research Foundation of Korea (NRF) grant funded by the Korea government (MSIT) (No. 2021R1A2C1095356).

Data Availability Statement

Data are contained within the article.

Conflicts of Interest

The authors declare no conflict of interest.

References

  1. Mesgari, S.; Bazazzadeh, M.; Mostofizadeh, A. Finocyl grain design using the genetic algorithm in combination with adaptive basis function construction. Int. J. Aerosp. Eng. 2019, 2019, 3060173. [Google Scholar] [CrossRef]
  2. Davies, J.; Grove, R.; Bell, T.; Rea, O.; Furkert, M.; Zhao, D.; Sellier, M. Preliminary design and test of high altitude two-stage rockets in New Zealand. Aerosp. Sci. Technol. 2022, 128, 107741. [Google Scholar] [CrossRef]
  3. Fedaravičius, A.; Račkauskas, S.; Survila, A.; Patašienė, L. Design of the testing system for solid propellant rocket motor thrust measurements using mathematical modelling techniques. J. Meas. Eng. 2015, 3, 123–131. [Google Scholar]
  4. Kamran, A.; Guozhu, L.; Rafique, A.F.; Zeeshan, Q. ±3-Sigma based design optimization of 3D Finocyl grain. Aerosp. Sci. Technol. 2013, 26, 29–37. [Google Scholar] [CrossRef]
  5. Tangermann, E.; Wegh, N.; Klein, M.; Weiland, S.; Link, T. Simulation of Ariane 5 Solid Rocket Booster Deformation by Internal Ballistics. J. Propuls. Power 2020, 37, 139–150. [Google Scholar] [CrossRef]
  6. Acik, S. Internal Ballistic Design Optimization of a Solid Rocket Motor. Master’s Thesis, Mechanical Engineering Department, Middle East Technical University, Ankara, Turkey, 2010. [Google Scholar]
  7. Kamran, A.; Guozhu, L.; Rafique, A.F.; Naz, S.; Zeeshan, Q. Star grain optimization using genetic algorithm. In Proceedings of the 51st AIAA/ASME/ASCE/AHS/ASC Structures, Structural Dynamics, and Materials Conference, AIAA, Orlando, FL, USA, 12–15 April 2010. AIAA 2010-3084. [Google Scholar]
  8. Rafique, A.F.; Zeeshan, Q.; Kamran, A.; Guozhu, L. A new paradigm for star grain design and Optimization. Aircr. Eng. Aerosp. Technol. 2015, 87, 476–482. [Google Scholar] [CrossRef]
  9. Ciucci, A.; Jenkins, R.M.; Foster, W.A. Analysis of Ignition and Flame Spreading in Solid Rocket Motor Star Slots. J. Propuls. Power 1996, 11, 1371–1373. [Google Scholar] [CrossRef]
  10. Greatrix, D.R. Internal Ballistic Model for Spinning Star-Grain Motors. J. Propuls. Power 1996, 12, 612–614. [Google Scholar] [CrossRef]
  11. Oh, S.H.; Kim, Y.C.; Cha, S.W.; Roh, T.S. Study of Hybrid Optimization Technique for Grain Optimum Design. Int. J. Aeronaut. Space Sci. 2017, 18, 780–787. [Google Scholar] [CrossRef]
  12. Miao, Q.; Shen, Z.; Zhang, H.; Sun, H. Multiobjective Optimization Method of Solid Rocket Motor Finocyl Grain Based on Surrogate Model. Aerospace 2022, 9, 679. [Google Scholar] [CrossRef]
  13. Segovia-Hernández, J.G.; Hernández, S.; Bonilla-Petriciolet, A. Reactive distillation: A review of optimal design using deterministic and stochastic techniques. Chem. Eng. Process. 2015, 97, 134–143. [Google Scholar] [CrossRef]
  14. Shim, P.Y.; Manoochehri, S. A hybrid deterministic/stochastic optimization approach for the shape configuration design of structures. Struct. Multidiscip. Optim. 2015, 17, 113–129. [Google Scholar] [CrossRef]
  15. Nisar, K.; Guozhu, L. A new approach for design and optimization of SRM wagon wheel grain. In Asian Joint Conference on Propulsion and Power; Korean Society of Propulsion Engineers: Gyeongju, Republic of Korea, 2008; pp. 247–254. [Google Scholar]
  16. Raza, M.A.; Liang, W. Design and Optimization of 3D Wagon Wheel Grain for Dual Thrust Solid Rocket Motors. Propellants Explos. Pyrotech. 2013, 38, 67–74. [Google Scholar] [CrossRef]
  17. Mahjub, A.; Mazlan, N.M.; Abdullah, M.Z.; Azam, Q. Design Optimization of Solid Rocket Propulsion: A Survey of Recent Advancements. J. Spacecr. Rocket. 2020, 57, 3–11. [Google Scholar] [CrossRef]
  18. Kamran, A.; Liang, G. An Integrated Approach for Optimization of Solid Rocket Motor. Aerosp. Sci. Technol. 2012, 17, 50–64. [Google Scholar] [CrossRef]
  19. Hartfield, R.; Jenkins, R.; Burkhalter, J.; Foster, W. A Review of Analytical Methods for Solid Rocket Motor Grain Analysis. In Proceedings of the 39th AIAA/ASME/SAE/ASEE Joint Propulsion Conference and Exhibit, Huntsville, AL, USA, 20–23 July 2003. AIAA 2003-4506. [Google Scholar]
  20. Raschka, S.; Mirjalili, V. Python Machine Learning: Machine Learning and Deep Learning with Python, Scikit-Learn, and TensorFlow, 2nd ed.; Packt Publishing: Birmingham, UK, 2017. [Google Scholar]
  21. Oh, S.H.; Roh, T.S.; Lee, H.J. New Design Method of Solid Propellant Grain Using Machine Learning. Processes 2021, 9, 910. [Google Scholar] [CrossRef]
  22. Oh, S.H.; Lee, H.J.; Roh, T.S. Development of a Hybrid Method in a 3-D Numerical Burn-Back Analysis for Solid Propellant Grains. Aerosp. Sci. Technol. 2020, 106, 106103. [Google Scholar] [CrossRef]
  23. Tola, C.; Nikbay, M. Internal Ballistic Modeling of a Solid Rocket Motor by Analytical Burnback Analysis. J. Spacecr. Rocket. 2018, 56, 498–516. [Google Scholar] [CrossRef]
  24. Kelner, V.; Capitanescu, F.; Léonard, O.; Wehenkel, L. A hybrid optimization technique coupling an evolutionary and a local search algorithm. J. Comput. Appl. Math. 2008, 215, 448–456. [Google Scholar] [CrossRef]
  25. Brereton, R.G.; Lloyd, G.R. Support Vector Machines for Classification and Regression. Analyst 2010, 135, 230–267. [Google Scholar] [CrossRef]
  26. Khaled, A.Y.; Kabutey, A.; Selvi, K.Ç.; Mizera, Č.; Hrabe, P.; Herák, D. Application of Computational Intelligence in Describing the Drying Kinetics of Persimmon Fruit (Diospyros kaki) During Vacuum and Hot Air Drying Process. Processes 2020, 8, 554. [Google Scholar] [CrossRef]
  27. Kim, Y.; Jang, J.; Kim, W.; Roh, T.S.; Choi, D.W. Multiple Defect Diagnostics of Gas Turbine Engine using SVM and RCGA-based ANN Algorithms. J. Mech. Sci. Technol. 2012, 26, 1623–1632. [Google Scholar] [CrossRef]
  28. Yuan, H.; Wu, N.; Chen, X.; Wang, Y. Fault Diagnosis of Rolling Bearing Based on Shift Invariant Sparse Feature and Optimized Support Vector Machine. Machines 2021, 9, 98. [Google Scholar] [CrossRef]
  29. Iglesias, A.T.; Anaya, M.Á.C.; Martinsanz, G.P.; Pastor-López, I. On Combining Convolutional Autoencoders and Support Vector Machines for Fault Detection in Industrial Textures. Sensors 2021, 21, 3339. [Google Scholar] [CrossRef]
  30. Li, Z.; Zhong, S.S.; Lin, L. Novel Gas Turbine Fault Diagnosis Method Based on Performance Deviation Model. J. Propuls. Power 2016, 33, 1–10. [Google Scholar] [CrossRef]
  31. White, L.M.; West, T.K.; Andrew, J.B. Reliability-Based Design of Thermal Protection Systems with Support Vector Machines. J. Spacecr. Rocket. 2019, 56, 1–11. [Google Scholar] [CrossRef]
  32. MATLAB Help Center. Available online: https://kr.mathworks.com/help (accessed on 12 September 2022).
  33. Silhavy, R.; Silhavy, P.; Prokopova, Z. Evaluating Subset Selection Methods for Use Case Points Estimation. Inf. Softw. Technol. 2018, 97, 448–456. [Google Scholar] [CrossRef]
  34. Albarado, K.; Hartfield, R.; Hurston, W.; Jenkins, R. Solid Rocket Motor Design Using Hybrid Optimization. Int. J. Aerosp. Eng. 2012, 2012, 987402. [Google Scholar] [CrossRef]
Figure 1. Sample star grain area profile.
Aerospace 10 00979 g001
Figure 2. Process of optimizing the grain design.
Aerospace 10 00979 g002
Figure 3. Star grain cross-section.
Aerospace 10 00979 g003
Figure 4. Objective profile.
Aerospace 10 00979 g004
Figure 5. Optimal design result and modified objective function.
Aerospace 10 00979 g005
Figure 6. Optimal design result.
Aerospace 10 00979 g006
Figure 7. Linear SVM [21].
Aerospace 10 00979 g007
Figure 8. Holdout cross-validation technique’s flow chart.
Aerospace 10 00979 g008
Figure 9. Grain optimal design process.
Aerospace 10 00979 g009
Figure 10. Optimization problem modification using penalty.
Aerospace 10 00979 g010
Figure 11. Results of neutral grain optimal design.
Aerospace 10 00979 g011
Figure 12. RP area profile.
Aerospace 10 00979 g012
Figure 13. RP grain optimal design results.
Aerospace 10 00979 g013
Table 1. Design requirements.
Variables (Operating Zone)Objective
Mean area6.410 (±5%)
Web burned0.382 (±5%)
Standard deviation σ < 0.5
Grain external radius1
Table 2. Star grain configuration variables.
SymbolConfiguration Variable
NNumber of star branches
ReExternal radius
RiInternal radius
wWeb thickness
fFillet radius
eAngle coefficient
Table 3. Genetic algorithm settings.
Configuration VariablesDesign Range
N4–6
Ro1 (Constant)
Ri0.100–0.500
w0.100–0.500
f0.001–0.100
e0.050–0.950
Generation50
Seed200
Optimization end condition∆ Objective function < 1.0 × 10⁻⁵
Table 4. Database and learning data.
DatabaseData CountLearning Data Count
D110007
D210,00075
D3100,000741
D41,000,0007394
D510,000,00073,810
Table 5. Sample data in the database.
Data NumberInputOutput (Class)
nN, Ro, Ri, w, f, e1 ( σ < 0.5 )
or −1 ( 0.5 < σ < 1.0 )
or 0 ( 1.0 < σ )
Table 6. Class prediction accuracy of the model to which cross-validation is applied.
DatabaseClassification Accuracy [%]
D1-
D281.8
D380.2
D494.9
D598.2
Table 7. Comparison of neutral grain optimal design results.
Set of Configuration VariablesCase 1Case 2 (Using SVM)
N56
Ri0.12890.1377
w0.38210.3820
f0.00110.0009
e0.6620.863
Requirements
Mean surface area 6.410 (±5%)6.2246.2329
Operating web burned 0.382 (±5%)0.3820.382
Standard deviation σ < 0.5 0.840.44
Optimization Result
Objective function4.629.26
Class−11
Table 8. RP grain requirements.
RP ConditionRequirements (Operating Zone)
1Final area is within ±5% of the initial area
2Web burned with the minimum area is located within ±5% of the center of the operating zone
3Minimum area is −12% to −7% of the initial area
Table 9. RP area profile requirements.
Variables (Operating Zone)Objective
Initial area6.410
Web burned with the minimum area0.16
Table 10. SVM results.
RP ConditionClass 1Class −1Classification Accuracy
RangeCountRangeCount
1 (model 1)±5%51,946±5% to ±8%19,65099.3%
2 (model 2)±5%45,139±5% to ±8%26,45796.5%
3 (model 3)−12 to −7%38,866−15% to −12%,
−7% to 5%
32,73098.9%
Table 11. Multiclass SVM.
ClassInitial Area
(Model 4)
Web Burned with the Minimum Area (Model 5)
RangeCountRangeCount
16.050–6.15064280.050–0.075787
26.150–6.25064470.075–0.01002950
36.250–6.35063010.100–0.1256439
46.350–6.45062760.125–0.1509414
56.450–6.55062000.150–0.1759906
66.550–6.56060410.175–0.2007268
76.650–6.75018070.200–0.225466
8--0.225–0.250405
Classification accuracy-99.1-99.7
Table 12. Objective classes.
Classification ModelObjective Class
1 (RP condition 1)1
2 (RP condition 2)1
3 (RP condition 3)1
4 (initial area)4
5 (web burned with the minimum area)5
Table 13. Comparison of RP grain optimal design results.
Set of Configuration VariablesCase 3Case 4 (Using SVM)
N57
Ri0.10010.2401
w0.32050.3198
f0.07920.0638
e0.6140.692
Requirements
1 (6.410 ± 5%)6.3296.360
2 (0.16 ± 5%)0.1860.167
3 (6.410 −12~−7%)5.8295.727
Optimization Result
Objective function0.771.26
Model 1 output (objective class: 1)11
Model 2 output (objective class: 1)−11
Model 3 output (objective class: 1)11
Model 4 output (objective class: 4)34
Model 5 output (objective class: 5)65
Disclaimer/Publisher’s Note: The statements, opinions and data contained in all publications are solely those of the individual author(s) and contributor(s) and not of MDPI and/or the editor(s). MDPI and/or the editor(s) disclaim responsibility for any injury to people or property resulting from any ideas, methods, instructions or products referred to in the content.

