Article

Incorporation of Pilot Factors into Risk Analysis of Civil Aviation Accidents from 2008 to 2020: A Data-Driven Bayesian Network Approach

1
School of Transportation and Logistics, Southwest Jiaotong University, Chengdu 610031, China
2
Department of Civil and Environmental Engineering, University of Waterloo, Waterloo, ON N2L 3G1, Canada
3
Key Laboratory of Flight Techniques and Flight Safety, Civil Aviation Flight University of China, Guanghan 618307, China
*
Author to whom correspondence should be addressed.
Aerospace 2023, 10(1), 9; https://doi.org/10.3390/aerospace10010009
Submission received: 22 November 2022 / Revised: 17 December 2022 / Accepted: 20 December 2022 / Published: 22 December 2022
(This article belongs to the Section Air Traffic and Transportation)

Abstract

:
Pilot factor is worth considering when analyzing the causes of civil aviation accidents. This study introduces a data-driven Bayesian network (BN) approach to investigating the joint causal effects of pilot and other factors on civil aviation safety. A total number of 163 individual pilot-related accidents in the National Transportation Safety Board (NTSB) aviation accident database from 2008 to 2020 are analyzed, focusing on eliciting the causal effects of various potential risk factors, including pilot factors, on civil aviation accidents. The modeling of the interdependency among the risk influencing factors (RIFs) and their causal contributory effect on the accident outcome is structured by a tree augmented network (TAN) and validated by sensitivity analysis. The novelty of this study is to incorporate pilot factors derived from the civil aviation accident database into risk analysis, combined with other external factors. The results indicate that weather conditions and flight phases are more correlated with casualty types of civil aviation accidents than pilot action and decision, and three other pilot factors only contribute to fatal injury in civil aviation accidents.

1. Introduction

The Annual Statistical Report on Aviation Safety in 2019 released by the International Civil Aviation Organization (ICAO) shows that with the rapid development of air transportation, civil aviation accidents show an increasing trend [1]. Aviation accidents cause an enormous loss of lives and massive monetary costs worldwide. In 2002–2011 alone, there were a total of 250 worldwide fatal accidents, which resulted in 7148 fatalities [2]. Aviation administrations conduct accident investigations to learn how the systems fail and why accidents happen, which may lead to the review and revision of related regulations, standards, and management. In order to improve the safety of air transportation, the National Institute of Aerospace and National Aeronautics and Space Administration (NASA) analyzed historical accident data to develop a high-level airline organizational hierarchy for tracing and identifying the deficiency propagation [3].
The occurrence of a civil aviation accident is a multi-stage dynamic system, and it may have more than one causal factor (such as aircraft manufacturing, aircraft maintenance, air traffic control, weather, and human factors). Although modern aircrafts are mostly equipped with advanced technologies, human factors present a major contribution to accidents [4,5]. Sant’Anna et al. found that over 50% of aviation accidents were caused by human errors at a node in the causal chain, especially human factors related to pilots [6]. Hence, this research focuses specifically on the contribution of pilot-related human factors to civil aviation risk.
Pilot factors generally include the physical conditions, experience, psychological conditions, decision-making, and task-handling performance of pilots [7]. To analyze pilot factors, the aviation accident database is used as one of the most valuable sources to obtain the primary data, including the Flight Safety Foundation database, Federal Aviation Administration (FAA) database, Aviation Safety Network database and National Transportation Safety Board (NTSB) aviation accident database. McKay and Groff examined trends in the prevalence of over-the-counter, prescription, and illicit drugs identified in toxicology tests of fatally injured pilots between 1990 and 2012 using matched data from FAA’s Civil Aerospace Medical Institute toxicology database and NTSB aviation accident database [8]. For analyzing civil aviation accidents, 163 commercial airliner accident reports extracted from the NTSB aviation accident database during 2008–2020 were reviewed in this paper. According to such reports, pilot factors are derived.
Quantitative risk analysis is a common approach to identifying risk factors and developing effective risk mitigation countermeasures, including fault tree analysis (FTA), event tree analysis (ETA), logistic regression (LR), and the Bayesian network (BN). Compared with FTA and ETA, BN has a significant advantage that allows for propagating such information in both forward propagation and backward inference when additional information on some random variables is available [9]. Additionally, Zhou et al. found that the LR model is more concentrated on statically qualitative analysis, and quantitative analysis is not sufficient [10]. For comparing the effects of LR and BN in small sample data, Leite et al. analyzed the data of 119 patients to realize the auxiliary diagnosis of obstructive sleep apnea [11]. The results showed that the specificity of BN was higher than that of LR. In addition, BN can represent the dependencies between the indicators and accident consequences, revealing that the accident consequences were the most sensitive to the position where the accidents occurred. Thus, in the domain of aviation, BN-based causal models have been extensively applied for pilot risk management and enhancing aviation safety. For example, Zhang and Mahadevan constructed a Bayesian network to analyze the historical passenger airline accidents reported in the NTSB aviation accident database and capture the causal relationships embedded in the sequences of these accidents [12].
According to previous studies, expert knowledge is still an important data source for aviation accident modeling [13]. Because BN requires a relatively low number of parameters and a small-size conditional probability table, it can utilize expert knowledge and/or data-driven methods to achieve quantitative aviation risk analysis. However, compared to the studies using expert knowledge in BN construction, a data-driven BN in aviation risk analysis that is less subjective has better robustness and certainty [14]. For the data-driven BN approach, there are several variants, such as naive Bayesian networks (NBN), and tree augmented naive Bayes networks (TAN-BN). Among them, TAN-BN constructs a quantitative BN representing RIFs’ interactive dependencies, which helps generate insights on critical pilot factors contributing to different casualty types of accidents. Li et al. pointed out that TAN-BN learning not only maintains the robustness and computational complexity of NBN learning but also provides better accuracy [15]. Li and Cheng used the I-880 field date to develop NBN and TAN-BN for traffic incident duration prediction [16]. By evaluating the results of NBN and TAN-BN under different sample sizes, they found that the prediction accuracy of TAN-BN was higher when the number of training samples was between 70 and 150. TAN-BN is proposed for identifying the interactions between the attribute variables by using a tree structure [17]. To date, few studies have used a data-driven TAN-BN to analyze pilot factors in civil aviation accidents.
This study aims at investigating how pilot factors interact with non-pilot factors, how they jointly affect air transportation risk, and how different risk factors generate an impact on different casualty types of pilot-related civil aviation accidents in an individual or combined manner. Therefore, this study used the aviation accident database from NTSB between 2008 and 2020 to conduct a data-driven TAN Bayesian Network to generate the structure of risk influencing factors (RIFs), which will provide new insights on the differentiation among critical pilot factors contributing to different “casualty types” of aviation accidents.

2. Methodology

2.1. NTSB Aviation Accident Database

NTSB (https://www.ntsb.gov/, accessed on 1 March 2022) is an independent agency tasked with the mission of increasing transportation system safety by investigating every accident in civil aviation, as well as in other modes of transportation (e.g., highway, railroad, marine), in the United States. In investigating each accident, NTSB determines the probable cause of the accident and issues safety recommendations with the aim of preventing future accidents. Typically, when an investigation is completed, a final description of the accident and its probable cause are made available to the public in the NTSB website. Over the past few decades, reports on civil aviation accidents and selected incidents within the United States have been stored in Microsoft Access format to cover accident information from 1962 to present.
Since this study is interested in the safety of civil commercial flights, all the accidents with aircraft falling under the category of Federal Aviation Regulations (FAR) Part 121 are selected. Air carriers authorized to operate under a Part 121 certificate (https://www.faa.gov/, accessed on 1 March 2022) are generally large, U.S.-based airlines, regional air carriers, and all cargo operators. Moreover, due to mainly considering pilot factors, this study excludes the accident data not related to or not involving pilots. For example, the flight attendant who tripped over a passenger’s leg without turbulence and the parking aircraft that was hit by the tractor driver. After the filtering of accident data is completed, it is carefully checked by civil aviation domain experts to make sure that all accidents selected are proper. Thus, this study selects a total number of 163 individual pilot-related accidents under Part 121 in the NTSB aviation accident database from January 2008 to March 2020 for pilot factors research.

2.2. RIFs Identification

The NTSB aviation accident database shows important individual factors regarding the propagation of the effects of initiating events in four tables: “injury”, “events_sequence”, “aircraft”, and “findings”. These factors were defined by experts of NSTB. The Table “injury” shows the casualties of each accident, including the injury level and the number of injured, and the injury level includes no injury (NONE), minor injury (MINR), serious injury (SERS), and fatal injury (FATL). The Table “events_sequence” shows the flight phase of each accident, which includes standing, pushback/towing, taxi, takeoff, climb, cruise, descent, approach, and landing. The Table “aircraft” shows the specific information of each flight involved in the accident, including certified max gross weight of aircraft, total number of seats on the aircraft, number of engines, airframe time, flight type, and carrying category of flight, etc. The Table “findings” is a summary of causes for each accident by NTSB, which can directly show the cause factors for each accident, mainly including aircraft issue, personnel issue, environmental issue, and organizational issue. According to the Table “injury”, four injury levels can represent four different “casualty types”, seen in Table 1. It is worth mentioning that in the NTSB aviation accident database, if the event did not cause anyone injury but might cause aircraft or equipment damage, NTSB still records the event as an accident in the database. Compared with the damage to aircraft or equipment, the severity of casualties is higher, so this study takes the degree of casualties as the evaluation index of civil aviation accident consequences.
Pilot factors in civil aviation accidents are usually combined with other non-pilot factors. From this perspective, it is beneficial to combine pilot factors with other non-pilot RIFs to investigate their combined effect on aviation safety. Referring to the previous factors analysis studies [18], 19 RIFs are extracted from Table “events_sequence”, “aircraft” and “findings”, seen in Table 2. Specifically, RIF No. 1 is obtained from Table “events_sequence”, and RIF No. 2, 3, 4, 11, 12, and 13 are obtained from Table “aircraft”. Because there are six subcategories of personnel issue in the Table “findings”, namely, physical, psychological, experience/knowledge, action/decision, task performance, and miscellaneous, RIF No. 5, 8, 9, 10, 15 and 19 are obtained from personnel issue in the Table “findings”. Additionally, RIF No. 6 and 16 are obtained from aircraft issue in the Table “findings”, RIF No. 7 and 17 are obtained from organizational issue in the Table “findings”, and RIF No. 14 and 18 are obtained from environmental issue in the Table “findings”. It is worth mentioning that as the risk caused by maintenance personnel is directly related to maintenance quality, RIF No. 16 includes human errors of maintenance personnel. Moreover, RIF No. 6 covers the risks of design, manufacturing, and production by aircraft manufacturers as it may affect operation of equipment.
Most of the definitions of the variables’ states can be extracted from the NTSB aviation accident database. For example, “flight phase”, “flight type”, and “carrying category” are classified into different states according to the classification of NTSB, which are widely accepted in the aviation industry. The other variables are graded according to the literature [19], including “Certified Max Gross Weight”, “Airframe Hours”, and “Number of Seats on Aircraft”.

2.3. TAN-BN Structure Learning

Using the RIFs, there are two approaches for the BN structure learning [20]. One relies on expert knowledge, which makes use of subjective causal relationships to build a BN structure. Another approach is a data-driven method to reveal the interactive dependencies between RIFs, which relies on the data correlation and learning algorithm in the BN model. The latter approach can greatly reduce the subjective bias and increase the soundness of the model, which is, therefore, adopted by this study [21]. Based on the RIFs identified in Section 2.2, the quantitative BN to represent the interactive dependencies can be constructed through the TAN learning.
Learning a TAN structure is an optimization problem. A 1 , A 2 …, A n are the attribute variables (the RIFs in Section 2.2 such as “flight phase”, “certified max gross weight”, “airframe hours”, etc.), and C is the class variable (target variable “casualty types”) in the risk analysis of civil aviation accidents. C represents the parent variables of C . B is defined as a TAN model if C = , and there is a function π that defines a tree over A 1 , A 2 …, A n such that A i = C , A π i if π i > 0 , and A i = C if π i = 0 . The optimization problem consists of finding a tree defining function π over A 1 , A 2 …, A n such that the log likelihood is maximized, and the TAN model under this function is used as the structure of the target BN model. One difference between a traditional BN model and the TAN model lies in class variables. Class variables in the BN model always have at least one parent node. However, since Bayesian inference will be used on the results, it is acceptable for links to go in either direction to fit the result reflecting the reality. In other words, the directions of links in the TAN model can be changed appropriately to fit the demand of this study on aviation safety.
Solving the above optimization problem follows the general procedure proposed by Chow and Liu, who used conditional mutual information (CMI) between attributes [22]. The function can be defined as Equation (1).
I P A i , A j C = a i i , a j i , c i P a i i , a j i , c i log P a i i , a j i c i P a i i c i P a j i c i
where I P represents the CMI, a i i is the i th state of the RIF A i , a j i is the i th state of the RIF A j , c i is the i th state of the class variable C i . The optimization problem, i.e., learning a TAN structure, is to find a tree defining function π over A 1 , A 2 …, A n such that the log likelihood is maximized.
The construct-TAN procedure for risk analysis of civil aviation accidents consists of five main steps:
(a)
Compute I P A i , A j C between each pair of RIFs in aviation safety, i j .
(b)
Build a complete undirected graph in which the vertices are RIFs A 1 , A 2 …, A n . Annotate the weight of an edge connecting A 1 to A n by I P A i , A j C .
(c)
Build a maximum weighted spanning tree that is a connected subgraph containing no cycles and a tree that has a maximum sum of I P A i , A j C .
(d)
Transform the resulting undirected tree to a directed one by choosing a root variable from RIFs and setting the direction of all edges to be outward from it.
(e)
Construct a TAN model by adding a vertex labeled by the class variable C and adding an arc from C to each A i .
The Netica software package (Version 5.0, Norsys, http://www.norsys.com, accessed on 1 March 2022) is applied to assist the calculation, and it has a “learning network” function, including the Bayesian network learning process and inferential analysis. Based on the TAN model, the parameter learning of conditional probability tables (CPTs) from the cases is conducted by Netica Software using the counting-learning algorithm. Once the CPTs are constructed and obtained, the posterior probabilities of each variable can be calculated. Peng et al. utilized Netica software to realize the structure learning of the Bayesian network [23]. Hence, this study utilizes Netica software to develop the TAN-BN model.

2.4. Sensitivity Analysis

2.4.1. Mutual Information (MI)

The MI represents the dependence between two variables in the probability theory [24]. Derived from the entropy theory, MI is described as an indicator showing the uncertainty of the dataset and interpreted as entropy reduction. The higher the entropy, the more uncertain one is about a random variable. MI explains the strength of the relationship between the RIF and “casualty type”. High MI indicates close connection; low MI indicates weak connection; zero MI indicates two variables are independent.
One objective of this study is to identify the relationship between the relevant RIFs and a particular “casualty type”. “Casualty type” is first determined as the fixed variable in MI. Accounting for the diversity of data samples, this study utilizes the method proposed by Mesner and Shalizi on the GitHub code repository to estimate MI [25]. In this way, calculating the value of MI can eliminate the RIFs that are relatively less relevant to the “casualty type”. Then, the remaining RIFs are extracted as significant variables with regards to a selected casualty type in the model.

2.4.2. True Risk Influence (TRI)

In addition to applying the MI measure to determine the degree of relevance of individual RIFs, another way of determining the effect of individual RIFs on casualty is by conducting a sensitivity analysis that can produce a measure of relative importance called truce risk influence (TRI) [26]. Taking a certain casualty type as an example, e.g., C 1 (no injury), first, this method increases the probability of the state producing the highest influence on the C 1 to 100% for obtaining the high risk inference (HRI) of C 1 . Next, it increases the probability of the state generating the lowest influence on the C 1 to 100% for obtaining the low risk inference (LRI) of C 1 . The TRI is the average value of HRI and LRI. The same analysis procedure can be applied to other casualty types, such as C 2 , C 3 , and C 4 , to obtain the corresponding TRI.
Therefore, the sensitivity analysis calculates the TRI value of each given factor in relation to different casualty types, representing each RIF’s influence on specific casualty types. In this way, the average TRI value of a given factor on all casualty types represents the overall effect of the factor on the casualty. The higher a TRI value is, the higher its corresponding RIF’s effect on “casualty type”.

2.5. Model Validation

For the model validation, the following two axioms are assumed to be satisfied [27,28]:
Axiom 1: A slight increase or decrease in the prior probability of each RIF should contribute to the corresponding increase or decrease in the posterior probability of the target node (such as casualty type).
Axiom 2: The total influence of the integration of the probability variations of parameters x should be no smaller than the one from the set of y y x RIFs.
For validating the model, it is examined by testing the combined effect of multiple RIFs on the casualty types. Considering different states of the parent nodes, this study calculates the changed value of each state [29]. First, in all states of a certain node, the value of the state generating the highest change value of a certain state in “casualty type” is increased by 10%, while the value of the state generating the lowest change value of that state in “casualty type” is decreased by 10%. Then, this method is applied to the next RIF, and the cumulative change value of the update is obtained. The update process continues until all RIFs are included. Furthermore, the same update process is applied to other states in “casualty type”, respectively, until all states of “casualty type” are included.
In addition, the k-fold cross-validation was utilized to avoid the overfitting of the model [30]. Therefore, we perform k-fold cross-validation to obtain the mean error rate of prediction over the k-folds, where the calibration data set is randomly divided into folds or partitions without replacement to create separate independent training and testing data sets. Once the data set is partitioned into k-folds, we reserve one-fold for testing or validation and use the remaining folds to train the TAN-BN. We conduct a 3-fold and a 5-fold cross-validation routine, and the prediction variable is “casualty types”.

2.6. Identification of Most Probable Explanation to an Accident

BN modeling can also explain the most probable scenario with reference to a particular casualty type. Providing a plausible explanation for the observed results is called the most probable explanation (MPE), which is a special case of the maximum a-posteriori probability [31]. In cases where the results of regular belief updating are questionable, the MPE can be used to identify the states of RIFs to provide a scenario for which the beliefs are upheld. It provides a completely specified scenario that is easier to understand. Thus, this study obtains insights by putting the BN in MPE mode, entering the evidence, and observing the most probable configuration for the investigated civil aviation accident casualty type.

3. Results

3.1. Description of Casualty Types

In Section 2.2, 19 RIFs are defined as the variables in Table 2 for the BN construction. In the quantitative analysis of BN modeling, the casualty type is defined as a dependent variable, classified into NONE, MINR, SERS, and FATL, as presented in Table 1. These casualty types are defined with respect to the classification of NTSB aviation accident database.

3.2. TAN-BN Modeling

For generating the BN model, 19 RIFs are tested for their relationships with the dependent variable (i.e., casualty type). With the use of the Netica software package, the structure of TAN-BN can be learned from the accident data, as shown in Figure 1. Each box represents a node, and the casualty type is the only target node in this structure. According to steps mentioned in Section 2.3, a maximum weighted spanning undirected tree is built based on values of CMI between 19 RIFs. Next, the resulting undirected tree is transformed to a directed one by choosing “flight phase” as a root variable and setting the direction of all edges to be outward from it. Then, the TAN model is constructed by adding a directed arc from target node to each RIF. After the BN structure is trained by the data, it is carefully checked by civil aviation domain experts to ensure all the links between the nodes are meaningful. In this study, no changes are made in the fine-tuning process since all the interrelationships suggested by the data make intuitive sense after they were reviewed by the domain experts. In the light of the results of TAN shown in Figure 1, it is clear that NONE and SERS are among the most frequent casualty types, accounting for 58.1% and 32.3% of the total, respectively.

3.3. Sensitivity Analysis

3.3.1. Effects of RIFs Using MI

Table 3 gives the MI between “casualty type” and RIFs, which can be used to determine the degree of influence of individual RIFs. When “casualty type” is the parent node, “weather condition” has the largest effect on the casualty type with the corresponding MI value of 0.3434, while “flight type” has the smallest effect with the corresponding MI value of 0.0032. Moreover, it can be seen that many MI values are less than 0.05, thus, 0.05 is selected in this study as the threshold for selecting the factors for further discussion [29]. As a result, five RIFs are considered, namely, “weather condition”, “flight phase”, “equipment condition”, “pilot action and decision”, and “maintenance quality”. However, it does not rule out the possibility of using a smaller value to consider more factors in the discussion when and where appropriate.

3.3.2. Effects of RIFs Using TRI

Table 4 provides the TRI value of “flight phase” against casualty type C 1 . Specifically, the first row denotes the base-case scenario, and the following rows represent the different scenarios when each state of the factor reaches 100%.
Based on the TRI values of individual RIFs on individual casualty type (e.g., Table 4), the maximum TRI values of all RIFs for all casualty types can be obtained (Table 5). To obtain the impact levels of those RIFs on casualty types, the TRIs values are compared and ranked. It can be seen that the average TRI value of “flight phase” is the largest and the average TRI value of “pilot action and decision” is the smallest. Additionally, by comparing the updated value of the target node in Table 4 and Table 5, it is concluded that the model is in line with Axiom 1.
Table 6 gives the order of importance of the five most important factors for individual casualty types. For example, “flight phase” is the most important RIF for all casualty types. “Pilot action and decision” contributes more to the casualty types C 2 and C 4 , than the casualty types C 1 and C 3 .

3.4. Model Validation

Table 7 indicates the casualty rate of a minor change in variables, and the changed value of each state is written as “~10%” in Table 7. The first column of the data shows the original values in TAN, and other columns state the changes in RIFs and the results. However, each state of the “casualty type” is calculated separately from each other, i.e., each row is computed through the change in states of RIFs in each casualty type. Additionally, from Table 7, it can be seen that the updated values of the target node are gradually increasing or decreasing along with the continuously changing RIFs. This result is consistent with Axiom 2, indirectly showing the validity of the model.
Table 8 shows the results of 3-fold cross-validation and 5-fold cross-validation. The mean error rate of 3-fold cross-validation is 18.52%, and that of 5-fold cross-validation is 18.00%. The mean error rate increases by only a few percentage points under 3-fold compared with 5-fold cross-validation, indicating a low level of overfitting in the TAN-BN model.

3.5. Most Probable Explanation (MPE) of a Given Causality—Scenario Analysis

Figure 2 shows the most probable explanation (MPE) results based on the calibrated TAN-BN model. To enable the MPE function, each variable will have a belief bar at the 100% level, and usually, some bars in RIFs are at lower levels, as seen in Figure 2. It reveals the most probable configuration by assuming the state with the bar at the 100% level for each variable. The shorter bars indicate the relatively low probabilities of the other states, given that the other variables are in the most probable configuration. In addition, they are scaled by the same factor used to bring the longest bar to 100%. From Figure 2, “SERS” is the most probable casualty type because of its high occurrence frequency, and other RIFs reveal the corresponding most probable states.
In addition, when “casualty type” is selected as state 4 (“FATL”), the MPE is displayed in Figure 3. By trying each of the possibilities, all the configurations that are at the highest probability level are revealed. Table 9 illustrates the MPE for all casualty types.

4. Discussion

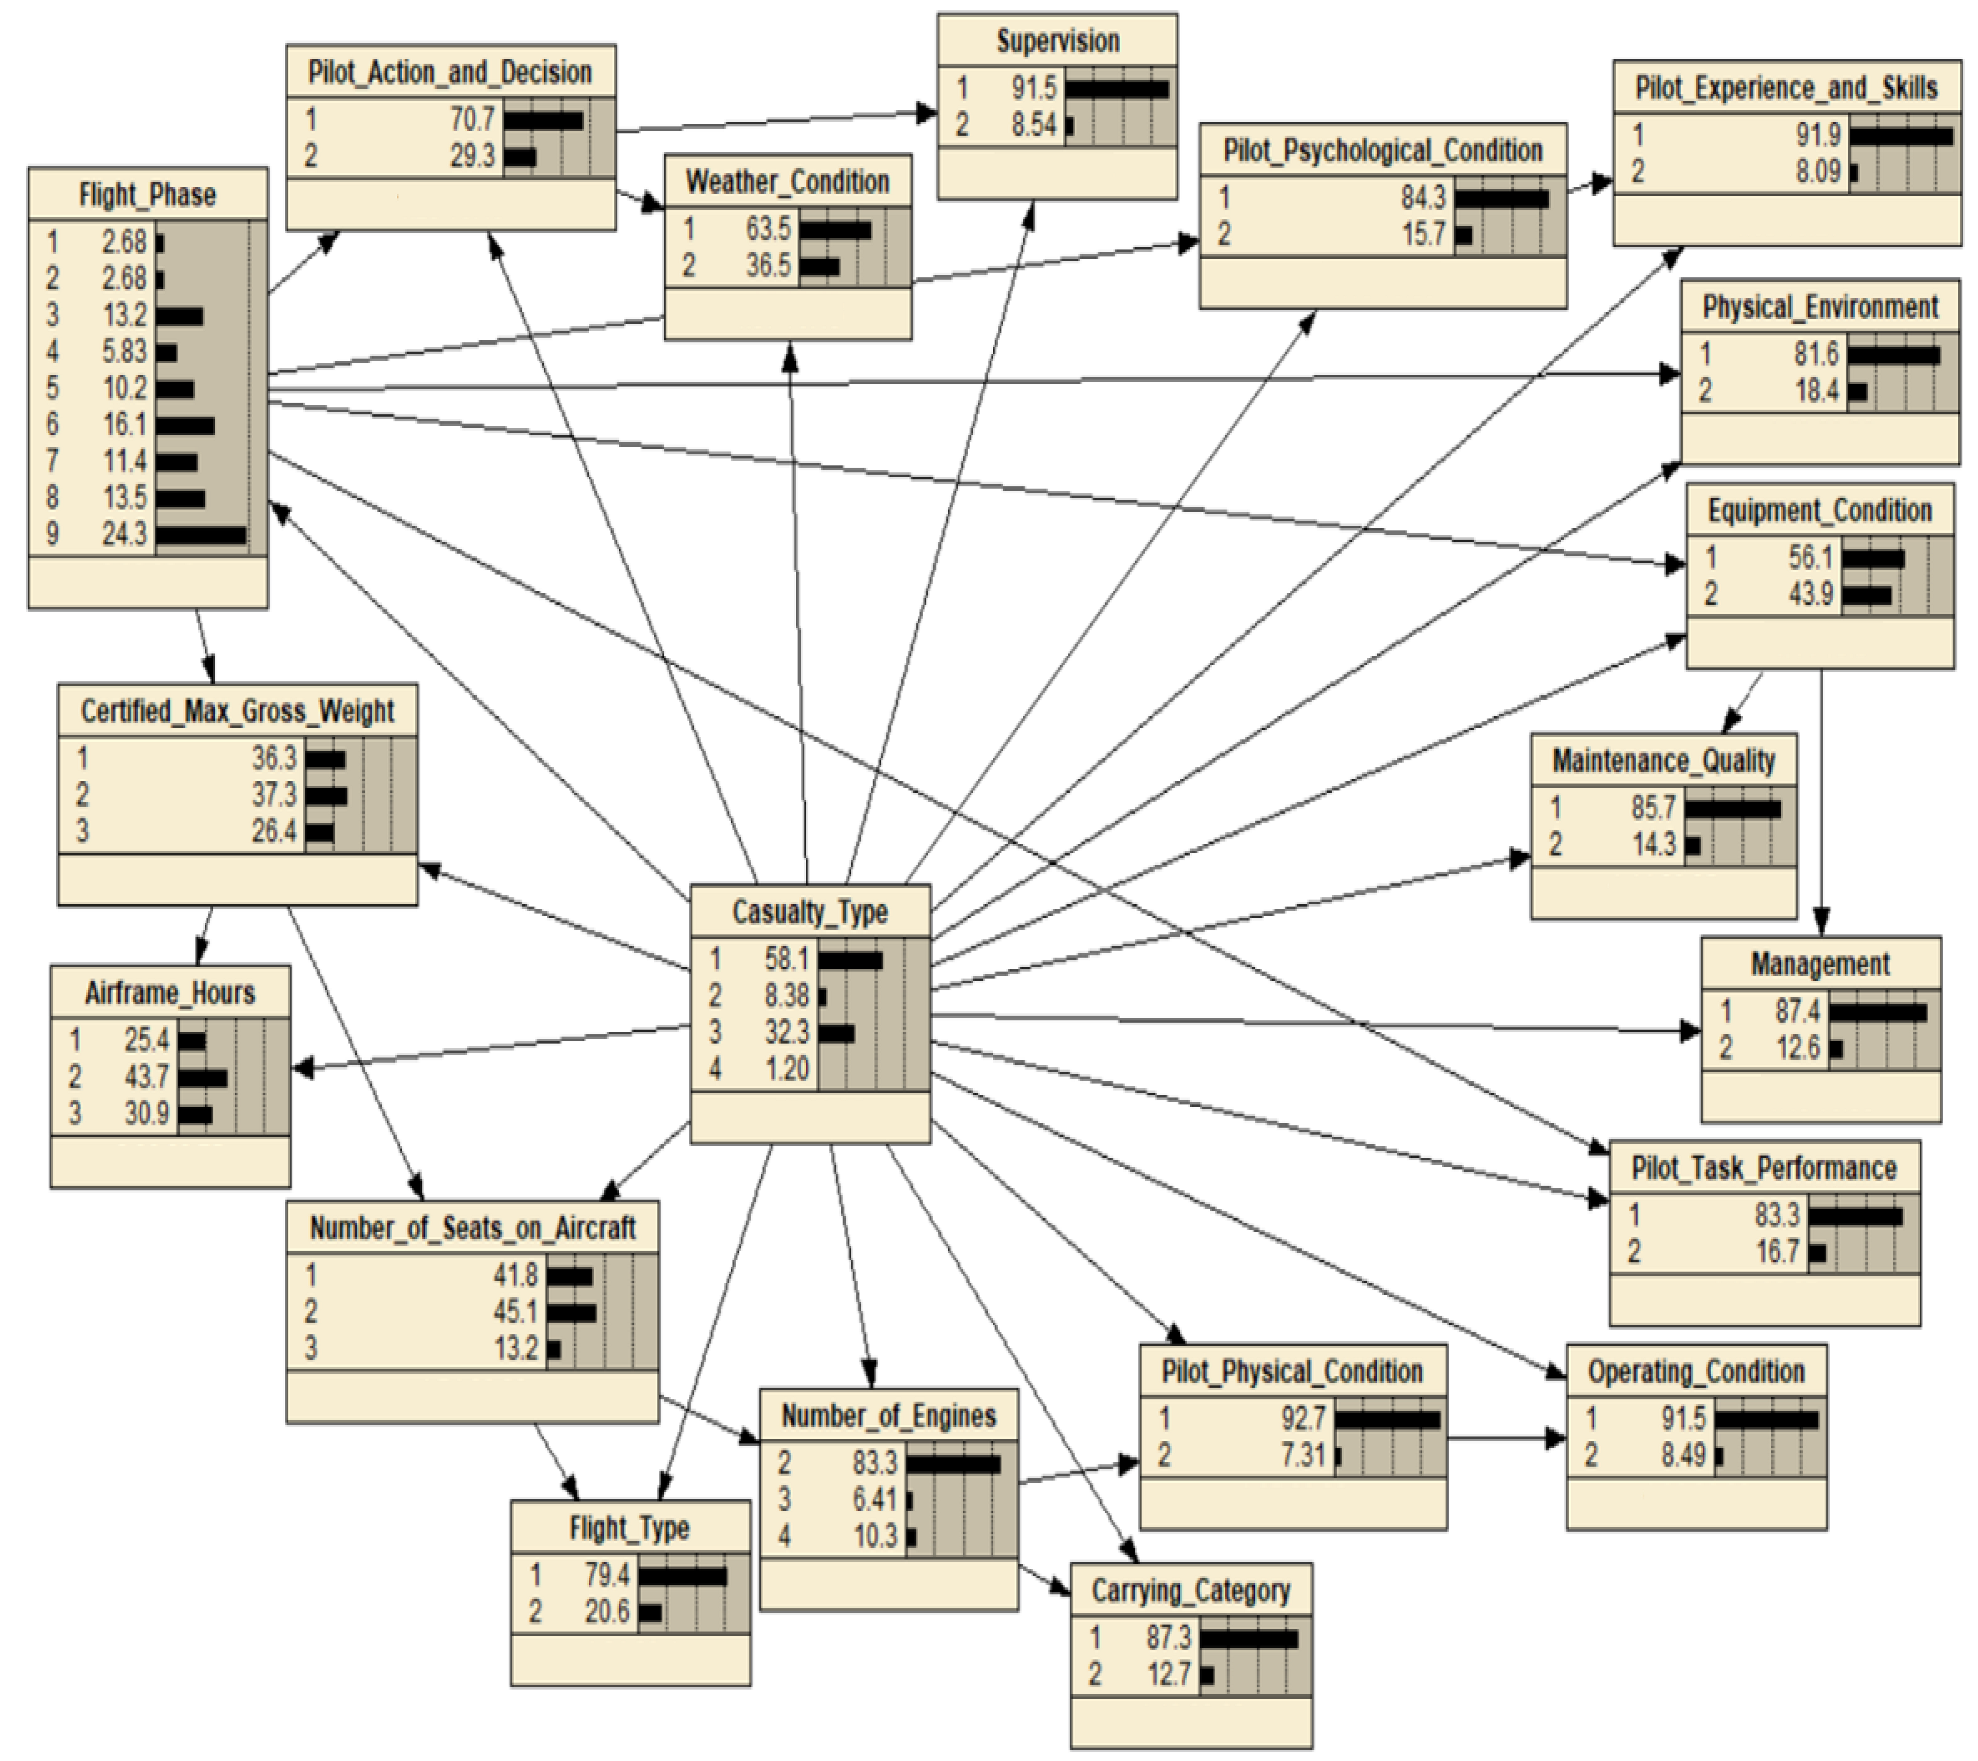
After training of the TAN-BN model with 163 individual pilot-related accidents under Part 121 in the NTSB aviation accident database from 2008 to 2020, it was found that most of the civil aviation accidents resulted in no injury, supporting the argument by Waycaster et al. that civil aviation is the safest way to travel [32]. On the other hand, if there are casualties in an accident, the most probable casualty type is serious injury, the second is minor injury, and the least is fatal injury.
Based on the MI values of the calibrated TAN-BN model, the top five factors (MI value > 0.05) in order of importance are: weather condition, flight phase, equipment condition, pilot action and decision, and maintenance quality. This ranking confirms that weather condition has the greatest impact on the casualty types in civil aviation accidents, which is consistent with the findings from the literature [33], which also used the NTSB data. This finding is also in line with those from Jenamani and Kumar, who used a different data source, namely, the Geneva-based Aircraft Crashes Record Office (ACRO) [34]. According to the statistics, it is not difficult to find that convective turbulence is the most frequent weather condition causing accidents in these 163 individual pilot-related accidents. However, convective turbulence in flight is not easy to forecast at present, and accidents are often caused by a sudden convective surge.
The second most important factor is the flight phase. On the different flight phases, the number of accidents was different. Li found that in the route and approach phase, the number of accidents was the most, and the number of casualties was higher than other flight phases, accounting for approximately 50% of the whole flight phases, indicating that the flight phase is highly correlated with aviation accidents, which is also confirmed by the results of this study [35].
Next, the third most important influencing factor is the equipment condition. This finding highlights the reliability of the equipment, and it is consistent with the results of several past accident analysis studies [36]. More importantly, this study finds that weather condition and flight phase play a more critical role in civil aviation accidents than equipment condition.
Pilot action and decision is ranked fourth in the importance of effect, but it ranks first among all pilot factors listed in Table 3 (pilot action and decision > pilot psychological condition > pilot task performance > pilot physical condition > pilot experience and skills), which is a new finding by this study and is partially supported by Kelly and Efthymiou’s research [37]. This finding can help airlines or flight training schools optimize their pilot training programs to reduce risks in these areas. Furthermore, McClernon et al. found that stress training during the acquisition of flight skills might serve to enhance pilot performance in stressful operations, which indicated that pilot psychological condition could improve pilot task performance [38]. However, some researchers suggested that pilot’s psychological pressure affects their decision-making, thus, it is more crucial [39].
Finally, the maintenance quality ranks fifth. To achieve a deeper understanding of maintenance quality, Insley and Turkoglu analyzed the aircraft maintenance-related accidents and serious incidents which occurred between 2003 and 2017 in the Aviation Safety Network’s accident database and SKYbrary’s accidents and incidents database [40]. They suggested that the greatest maintenance factors causing the accidents were “inadequate maintenance procedures” and “inspections not identifying defects”, which is partly corresponding to this study.
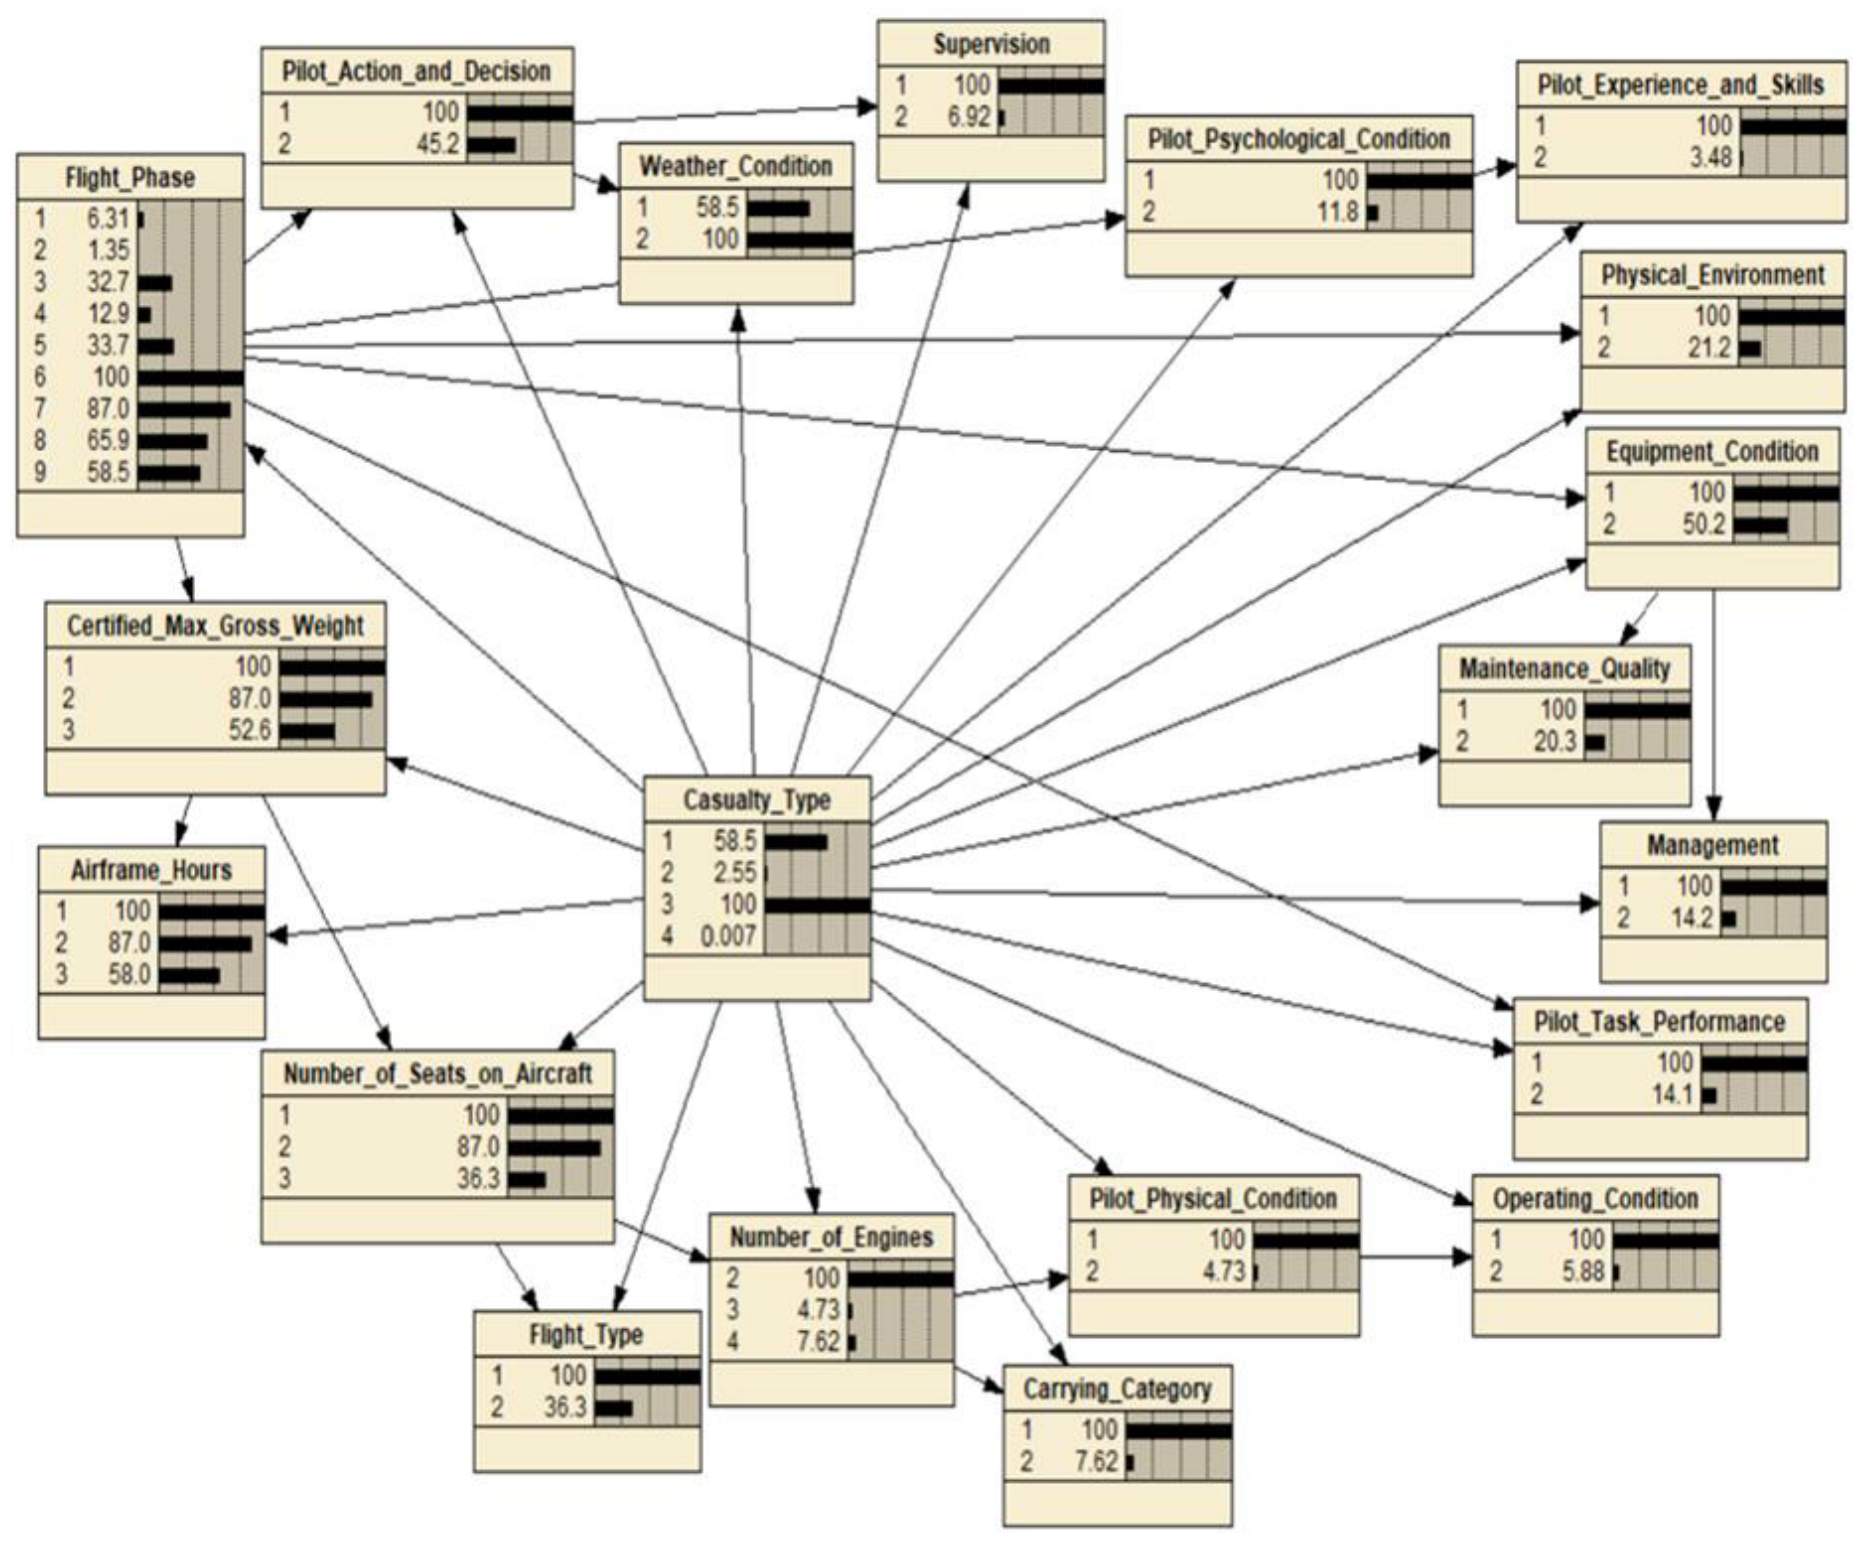
Similarly, from the results of Table 5, average values of TRI are compared and ranked as follows: flight phase > weather condition > equipment condition > maintenance quality > pilot action and decision. Compared with the results of Table 3, it is not difficult to see that the order of these five RIFs is different, but weather condition and flight phase are still the top two, which can indicate their higher correlation with the casualty type of civil aviation accidents than pilot action and decision. Thus, we suggest that airlines and aviation administrations should focus on monitoring flights in high-risk flight phases and bad weather, such as landing with windshear, approach with low-visibility, etc., and improve the ability of pilots to execute such flights.
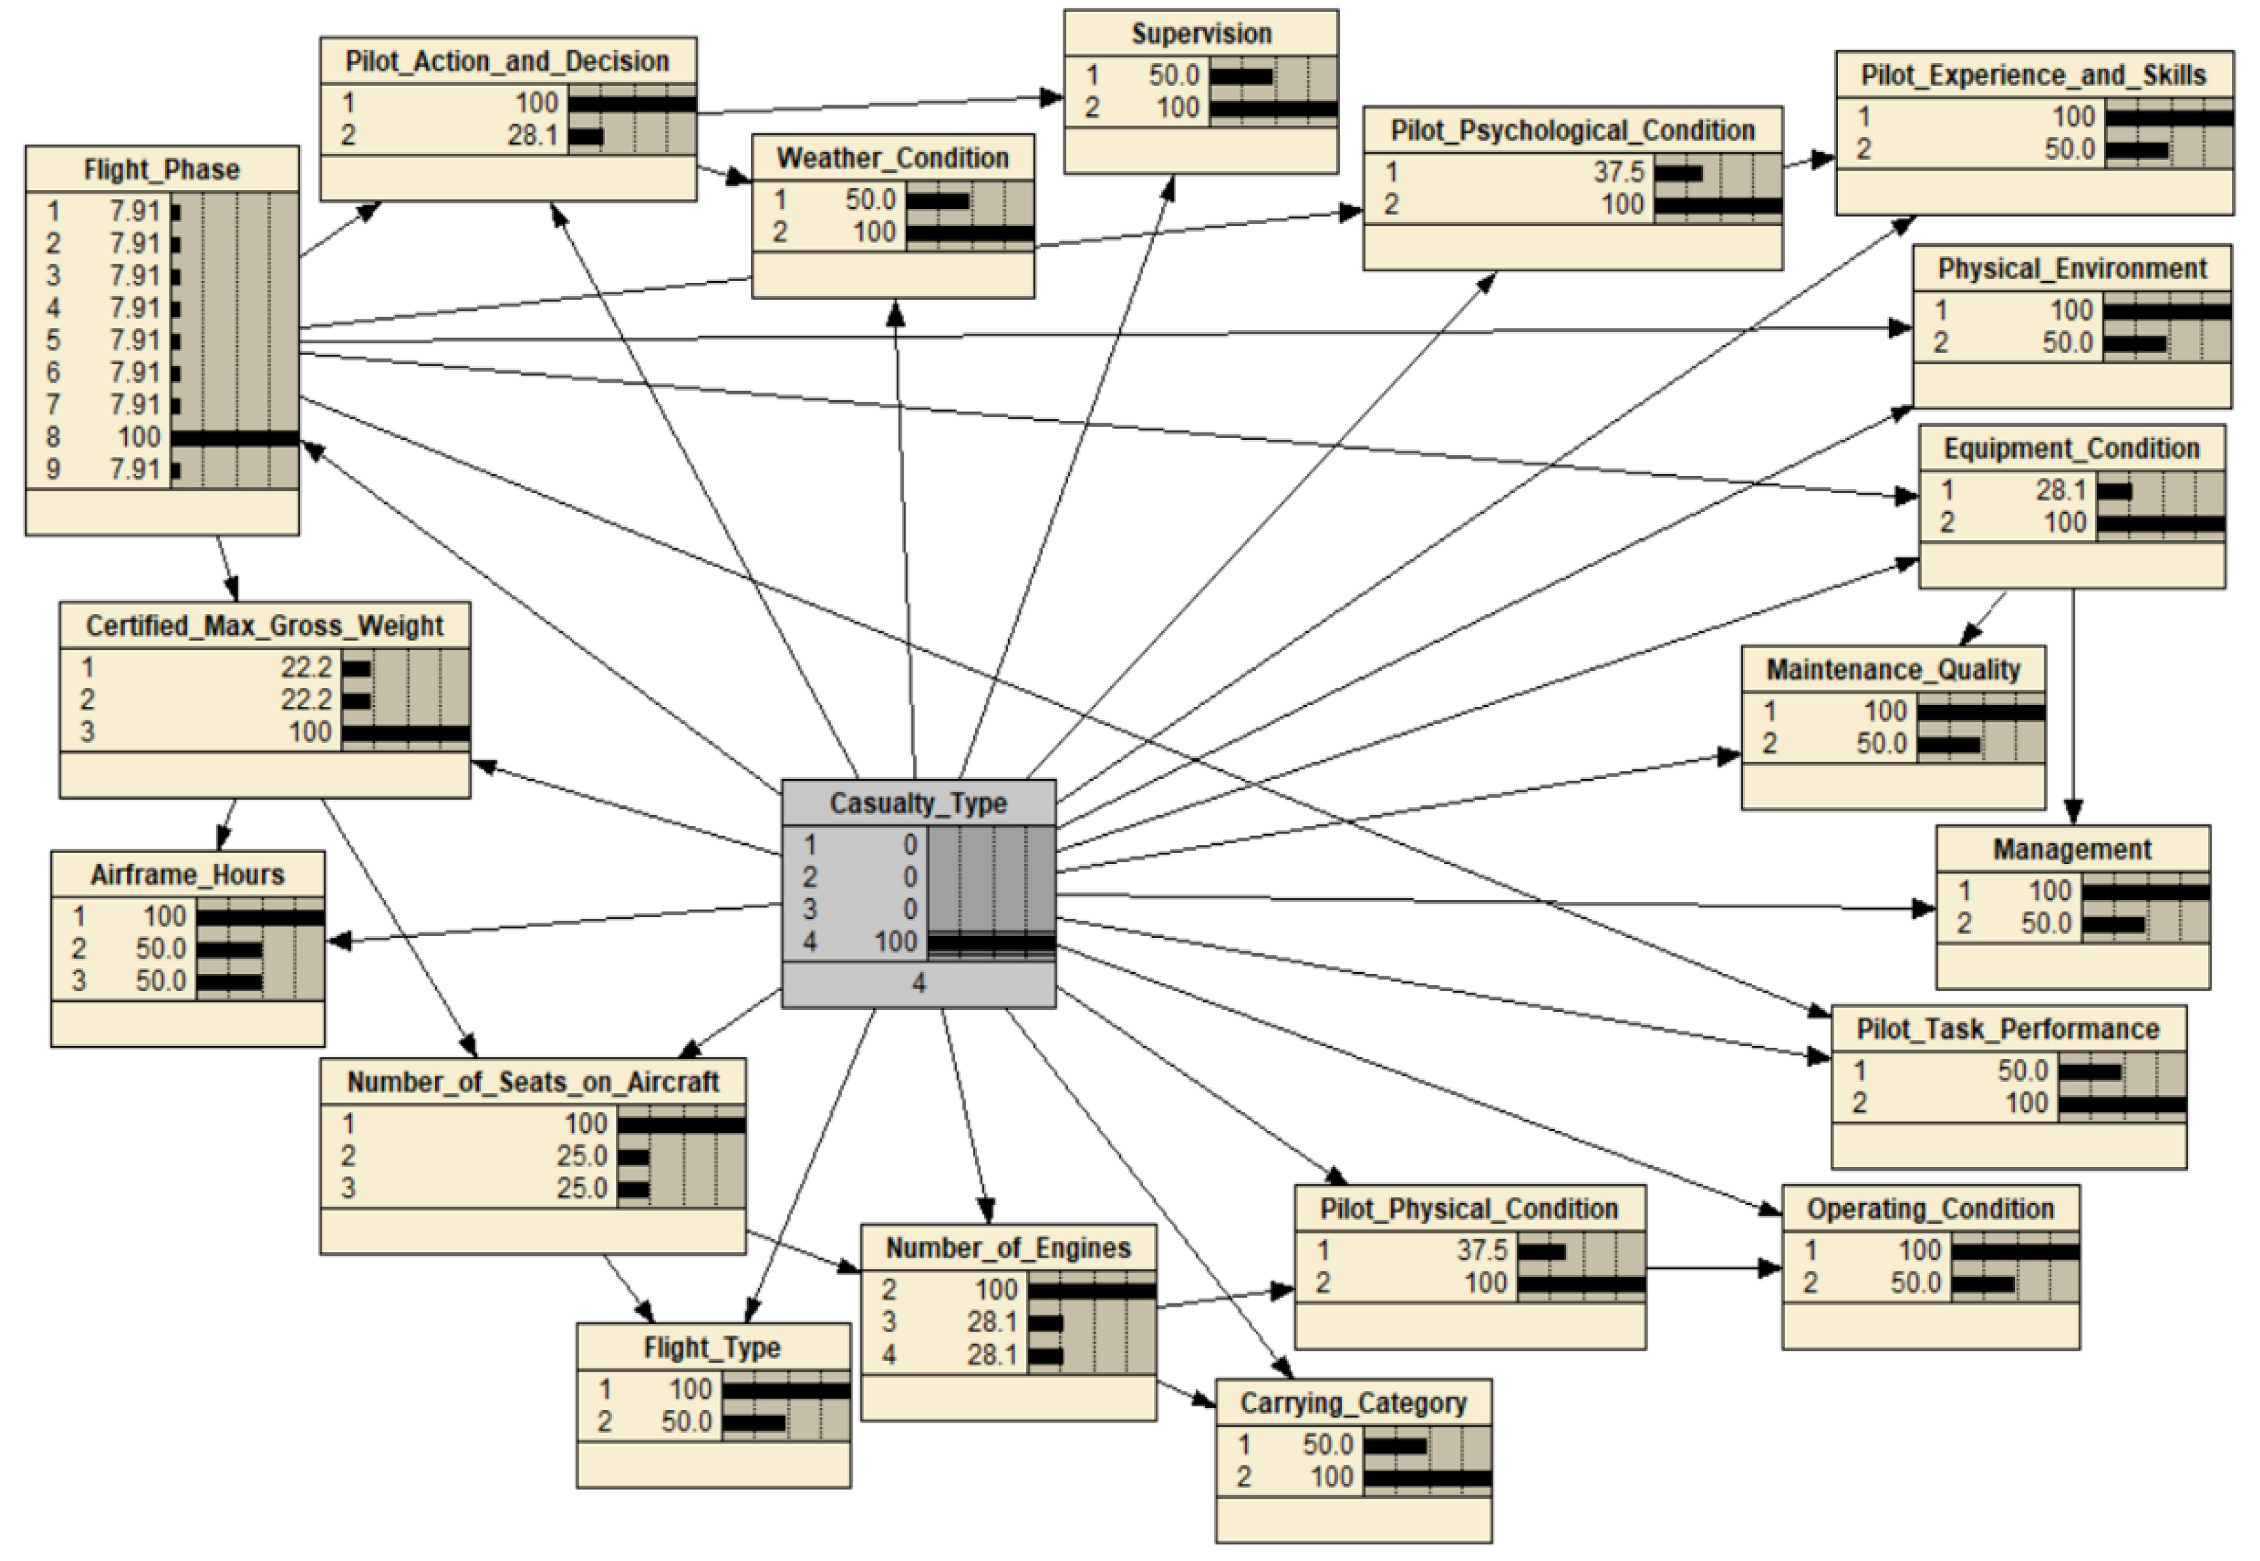
An empirical sensitivity analysis of the proposed TAN-BN model has shown that the model satisfies the two axioms, partially indicating its validity for application. The reasonableness of the model could also be illustrated through a retrospective analysis of a past accident, which is not included in the above training database. For example, from the event ID “20200714 × 42039” in the NTSB database, Envoy Airlines flight 3880, an Embraer 175 aircraft, encountered turbulence during the descent into Chicago O’Hare International Airport from Texas on 9 July 2020, and one person was seriously injured on the flight. Except for the target variable, some parameter settings for the proposed BN model can be obtained based on the descriptions, including:
(1)
Due to encountering turbulence during the descent of flight, the weather condition was poor, and the flight phase was descent.
(2)
Because of the flight No. 3880, the flight carried passengers.
(3)
Because the flight was from Texas to Chicago, the flight was a domestic flight.
(4)
Because of the Embraer 175 aircraft, the number of seats on aircraft for passengers was fewer than 100, and the number of engines was 2.
Along with the above information, there is no other information recorded in the accident. The other factors (nodes) maintain their generic original probabilities given no updated evidence is collected from the accident. Based on the above parameter settings, it reveals a very high probability of 94.4% for the serious injury in this accident, which further validates the proposed model, as shown in Figure 4.
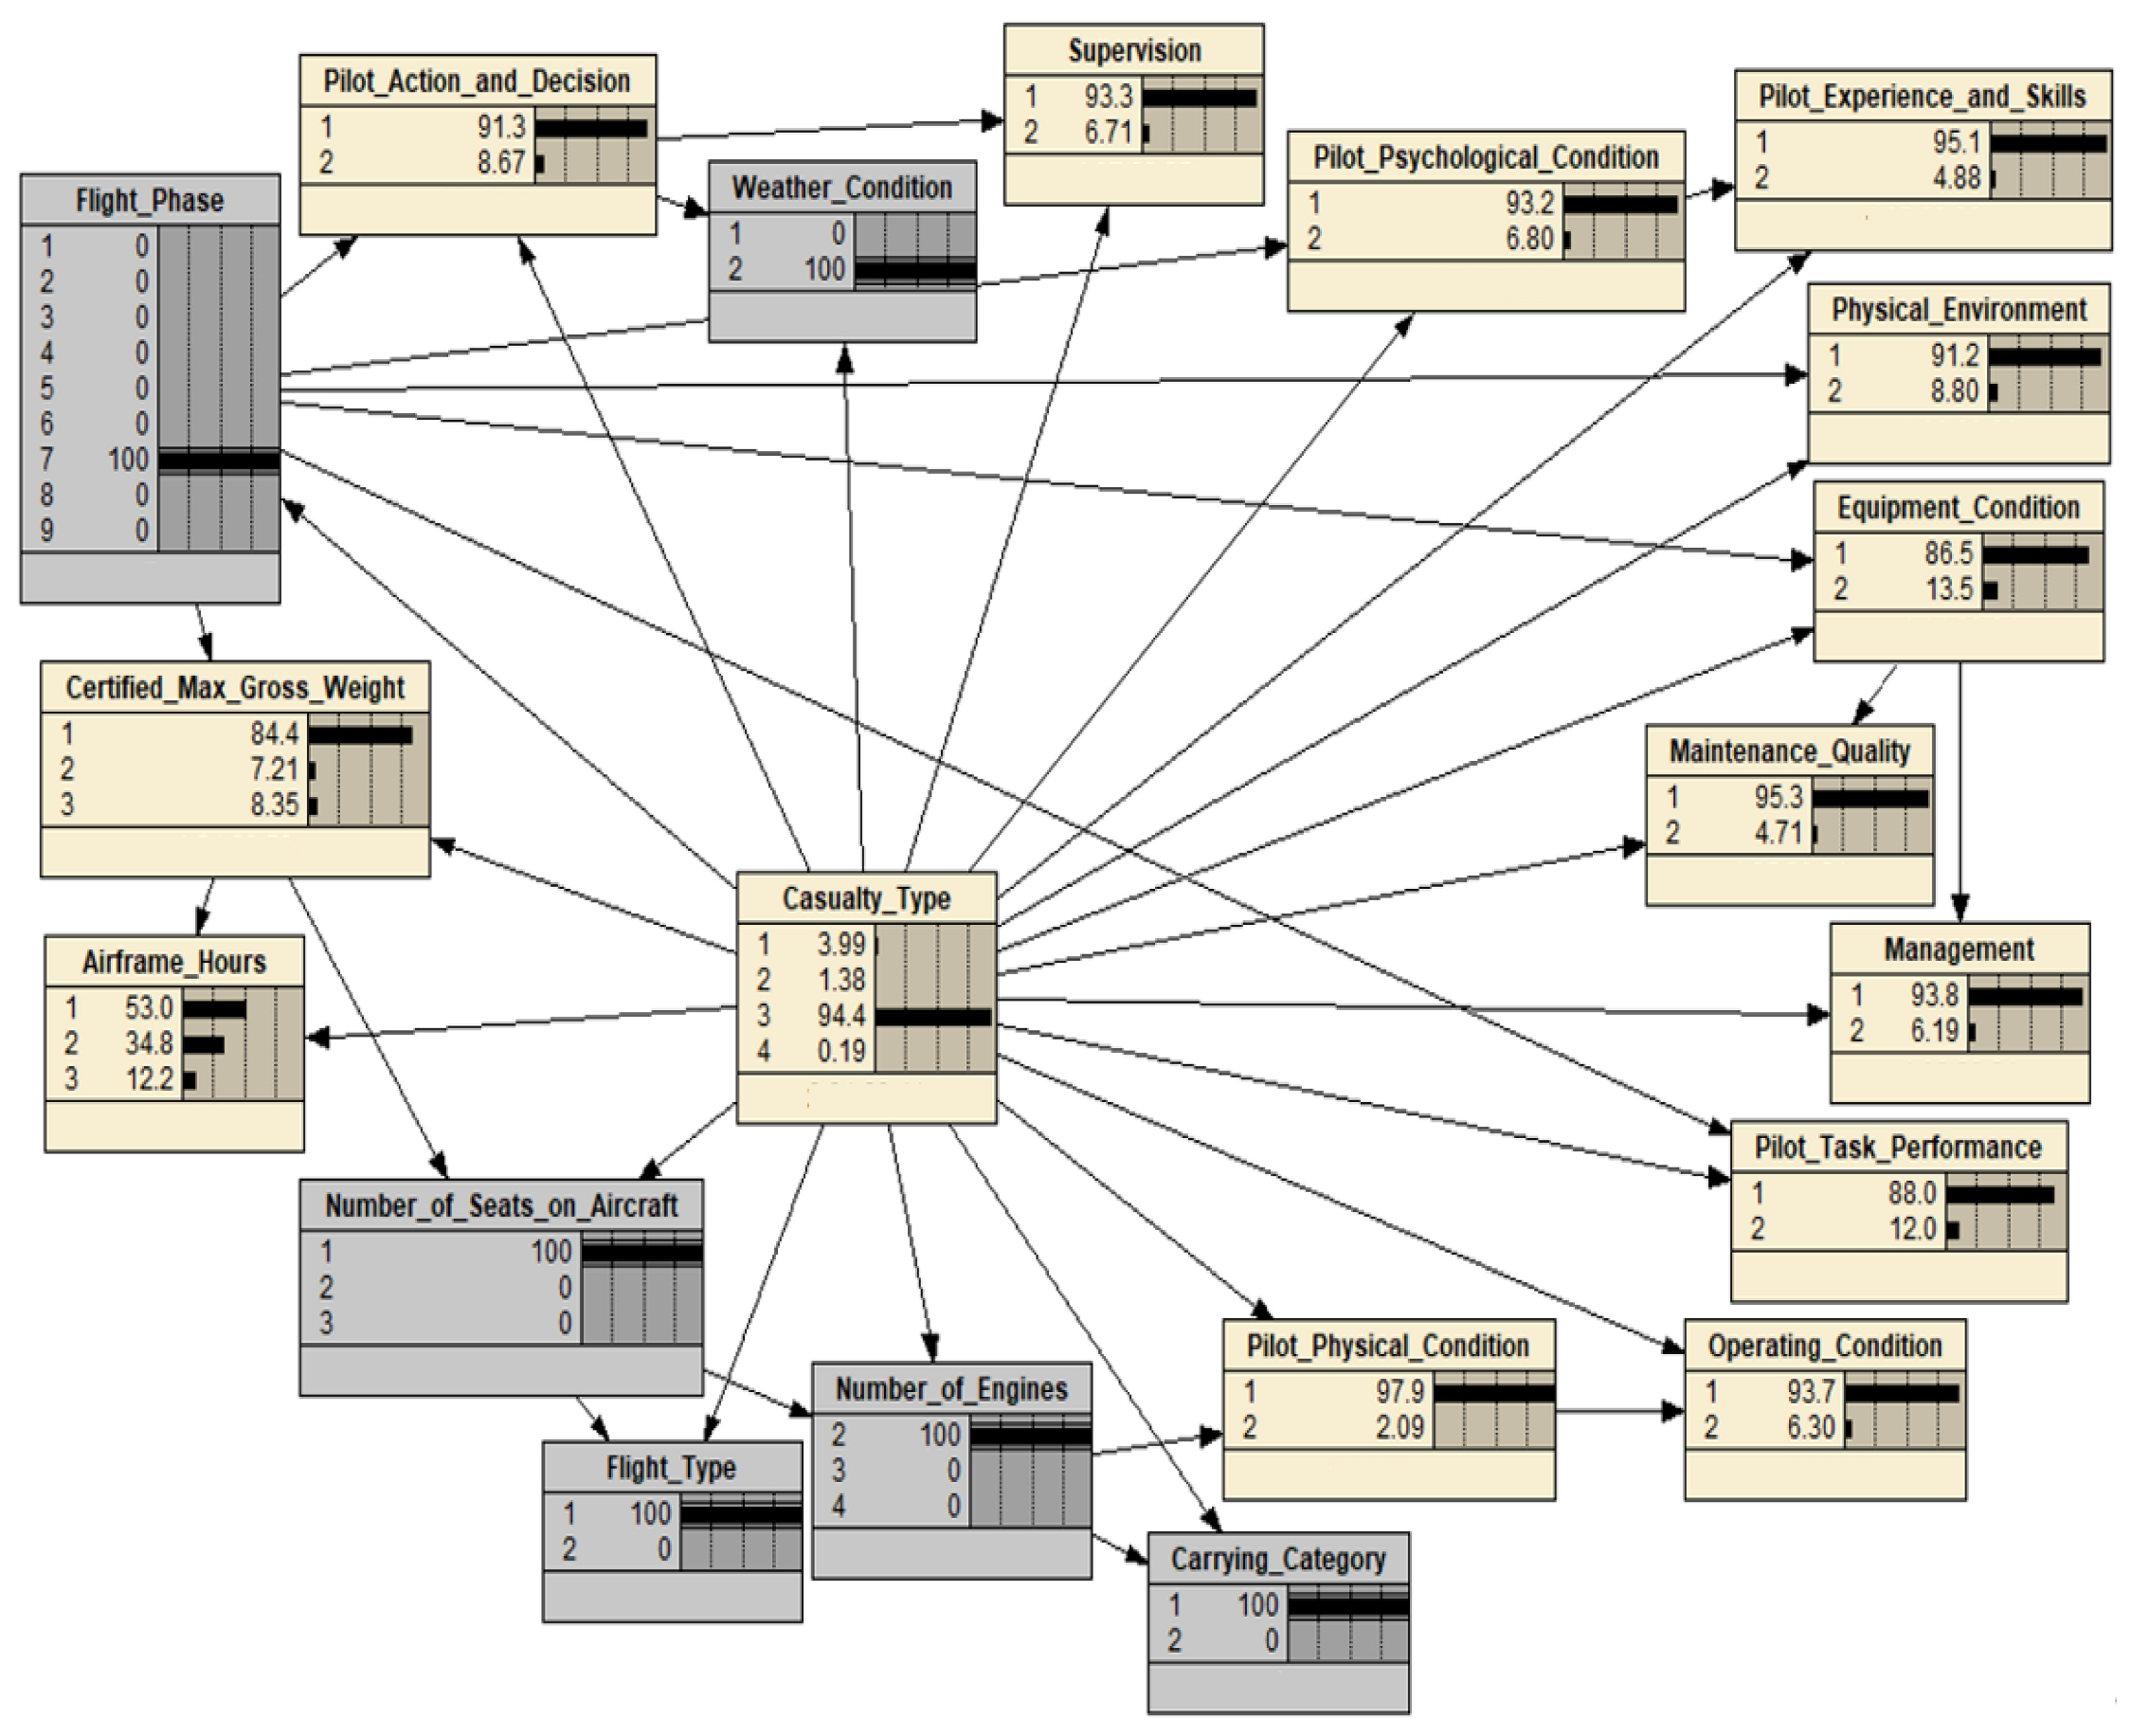
Table 9 illustrates the MPE for all casualty types. According to the results of Table 9, comparing with the situation of no injury in civil aviation accidents, the poor equipment condition and the bad weather condition have a strong relation to the minor injury and fatal injury, and the bad weather condition, such as convective turbulence and low visibility, also has a strong relation to serious injury. Hence, flight safety in bad weather is of great concern. Furthermore, weak supervision and carry category such as cargo are strongly related to fatal injury, which indicates that cargo airlines’ supervision on safety is insufficient and should be strengthened. Regarding the flight phase, this study finds that phases, including cruise, descent, approach, and landing, are strongly associated with these four casualty types, while phases such as standing, pushback/towing, taxi, takeoff, and climb are not, which is in accordance with Moriarty and Jarvis’s views [41], showing that cruise, descent, approach, and landing have higher accident risks. Moreover, there is a high probability for serious injury and fatal injury to happen during the airframe of hours less than 20,000 and a high probability for no injury and minor injury to happen during the airframe of hours between 20,000 and 50,000. This is a significant finding, indicating that the new aircraft is not necessarily more reliable than the older aircraft, which can help optimize the reliability management of airline fleets. In addition, minor injury becomes probable when the number of seats on the aircraft is between 100 and 200. Additionally, the certified max gross weight of aircraft less than 100,000 has a strong association with no injury and serious injury, the certified max gross weight of aircraft between 100,000 and 200,000 has a hard relation to minor injury, and the certified max gross weight of aircraft more than 200,000 is strongly related to fatal injury, which suggests that the accidents on aircraft with a certified max gross weight of more than 200,000 carry a high risk of fatality. In terms of pilot factors, poor pilot physical and psychological conditions and weak pilot task performance only contribute to fatal injury, while incorrect pilot action and decision is not correlated with these four casualty types. Thus, this finding verifies that it is very important to study the physiological, psychological, and behavioral performance of pilots to ensure flight safety. Likewise, Yue et al. suggested that the pilot factor is the most important causative factor among the human factors for civil aviation accidents, which is in accordance with the results of this study [42]. On the basis of Netica, we have successfully obtained the MPE for all casualty types. However, in addition, there are some other methods worth trying to obtain the MPE in the future, such as the deletion algorithm and the approximate deletion algorithm [43]. On the other hand, it is worth further study why pilot factors and casualty types show such a relationship. We plan to analyze the impact of pilot factors on flight safety through physiological signal monitoring.
While our study provides insight into the interdependency and causal effects of pilot factors on the outcome of civil aviation accidents using past accident data, important limitations are noted. In this study, we identify RIFs of the model according to the classified information in the NTSB database, which is not undisputed. To a certain extent, some RIFs cannot be isolated simply because they may have a strong causal relationship with other RIFs. For example, Fabre et al. believed that pilots’ risky decisions are related to the change in their psychological state caused by the external environment [44]. Therefore, further exploring the influence of the relationship between various RIFs on the results of the model is our future research content. Furthermore, we excluded the accident data not related to or not involving pilots for mainly considering pilot factors. Although the results of data filtering were checked by civil aviation domain experts, there is still some subjectivity. Future work may consider more RIFs and reduce the degree of accident data filtering. Furthermore, this study only focuses on civil commercial flights, which account for approximately 3% of the NTSB aviation accident database, resulting in a small total amount of accident data. In future, we will introduce the accident data of general aviation and conduct a comparative study.

5. Conclusions

To analyze the possible risks introduced by pilot factors to civil aviation safety, this study uses a data-driven TAN-BN approach to investigate how different risk factors contribute to different casualty types of civil aviation accidents with a focus on pilot factors. For identifying RIFs, this study utilizes a total number of 163 individual pilot-related accidents under Part 121 in the NTSB aviation accident database from January 2008 to March 2020. A TAN-BN model is calibrated to identify and analyze the effects of various RIFs incorporating pilot factors in civil aviation accidents. Finally, a sensitivity analysis is conducted, including model validation and scenario simulation.
Based on the statistical strength-of-influence measure—mutual information (MI) from the resulting TAN-BN model, the top five critical RIFs for casualty types (MI value > 0.05) are: “weather condition”, “flight phase”, “equipment condition”, “pilot action and decision”, and “maintenance quality”, successively. Based on another risk influence measure—TRI, these crucial RIFs are ranked again as follows: “flight phase”, “weather condition”, “equipment condition”, “maintenance quality”, and “pilot action and decision”. Furthermore, the scenario analysis provides a plausible causal explanation for the observed accidents, revealing the most probable scenario concerning a particular casualty type.
This study has provided insight into the interdependency and causal effects of various factors, including pilot factors, on the outcome of civil aviation accidents, contributing to the development of improved regulations, management, and safety countermeasures for the improved understanding of civil aviation industry.

Author Contributions

Conceptualization, C.Z., C.J. and L.F.; methodology, software, formal analysis, writing—original draft preparation, C.Z.; validation, C.L. and H.L.; writing—review and editing, supervision, C.J., L.F. and C.W.; funding acquisition, C.J. and W.C. All authors have read and agreed to the published version of the manuscript.

Funding

This research was funded by Open Fund of Key Laboratory of Flight Techniques and Flight Safety, CAAC under Grant No. FZ2021KF05, No. FZ2021KF09, and No. FZ2021KF14, and Youth Project of Humanities and Social Sciences Financed by Ministry of Education of China under Grant No. 21YJC190012, and Fund of National Park Research Center under Grand No. GJGY2022-YB009.

Institutional Review Board Statement

Not applicable.

Informed Consent Statement

Not applicable.

Data Availability Statement

The accident dataset used to support the findings of this study are publicly available, at the online locations specified in the paper.

Conflicts of Interest

The authors declare no conflict of interest. The funding sponsors had no role in the design of the study; in the collection, analyses, or interpretation of data; in the writing of the manuscript, and in the decision to publish the results.

References

  1. Ng, C.B.R.; Bil, C.; O’Bree, T. An expert system framework to support aircraft accident and incident investigations. Aeronaut. J. 2021, 125, 1131–1156. [Google Scholar] [CrossRef]
  2. Das, K.P.; Dey, A.K. Quantifying the risk of extreme aviation accidents. Phys. A Stat. Mech. Appl. 2016, 463, 345–355. [Google Scholar] [CrossRef]
  3. Ancel, E.; Shih, A.T. The analysis of the contribution of human factors to the in-flight loss of control accidents. In Proceedings of the 12th AIAA Aviation Technology, Integration and Operations (ATIO) Conference and 14th AIAA/ISSM, Indianapolis, IN, USA, 17–19 September 2012. [Google Scholar] [CrossRef] [Green Version]
  4. Kharoufah, H.; Murray, J.; Baxter, G.; Wild, G. A review of human factors causations in commercial air transport accidents and incidents: From to 2000–2016. Prog. Aerosp. Sci. 2018, 99, 1–13. [Google Scholar] [CrossRef]
  5. Stanton, N.A.; Li, W.-C.; Harris, D. Editorial: Ergonomics and human factors in aviation. Ergonomics 2019, 62, 131–137. [Google Scholar] [CrossRef]
  6. de Sant’Anna, D.A.L.M.; de Hilal, A.V.G. The impact of human factors on pilots’ safety behavior in offshore aviation companies: A Brazilian case. Saf. Sci. 2021, 140, 105272. [Google Scholar] [CrossRef]
  7. Chang, Y.-H.; Wong, K.-M. Human risk factors associated with runway incursions. J. Air Transp. Manag. 2012, 24, 25–30. [Google Scholar] [CrossRef]
  8. McKay, M.P.; Groff, L. 23 years of toxicology testing fatally injured pilots: Implications for aviation and other modes of transportation. Accid. Anal. Prev. 2016, 90, 108–117. [Google Scholar] [CrossRef]
  9. Baraldi, P.; Podofillini, L.; Mkrtchyan, L.; Zio, E.; Dang, V.N. Comparing the treatment of uncertainty in Bayesian networks and fuzzy expert systems used for a human reliability analysis application. Reliab. Eng. Syst. Saf. 2015, 138, 176–193. [Google Scholar] [CrossRef] [Green Version]
  10. Zhou, Z.P.; Yu, X.H.; Zhu, Z.Y.; Zhou, D.Q.; Qi, H.N. Development and application of a Bayesian network-based model for systematically reducing safety risks in the commercial air transportation system. Saf. Sci. 2023, 157, 105942. [Google Scholar] [CrossRef]
  11. Leite, L.; Costa-Santos, C.; Rodrigues, P.P. Can we avoid unnecessary polysomnographies in the diagnosis of obstructive sleep apnea? A Bayesian network decision support tool. In Proceedings of the IEEE 27th International Symposium on Computer-Based Medical Systems, New York, NY, USA, 27–29 May 2014. [Google Scholar] [CrossRef] [Green Version]
  12. Zhang, X.G.; Mahadevan, S. Bayesian network modeling of accident investigation reports for aviation safety assessment. Reliab. Eng. Syst. Saf. 2021, 209, 107371. [Google Scholar] [CrossRef]
  13. Wang, J.K.; Ning, H.S.; Chen, W.S.; Li, J.; Wan, J.; He, W. Airport bird-strike risk assessment model with grey clustering evaluation method. Chin. J. Electron. 2012, 21, 409–413. Available online: https://cje.ejournal.org.cn/en/article/id/1841 (accessed on 10 November 2022).
  14. Mack, D.L.C.; Biswas, G.; Koutsoukos, X.D.; Mylaraswamy, D. Learning Bayesian network structures to augment aircraft diagnostic reference models. IEEE Trans. Autom. Sci. Eng. 2017, 14, 358–369. [Google Scholar] [CrossRef]
  15. Li, D.W.; Hu, X.J.; Jin, C.J.; Zhou, J. Learning to detect traffic incidents from data based on tree augmented naive Bayesian classifiers. Discret. Dyn. Nat. Soc. 2017, 1, 8523495. [Google Scholar] [CrossRef] [Green Version]
  16. Li, D.W.; Cheng, L. Traffic incident duration prediction: A Bayesian network method. J. Wuhan Univ. Technol. Transp. Sci. Eng. 2011, 35, 884–887; 891. Available online: https://kns.cnki.net/kcms/detail/detail.aspx?FileName=JTKJ201105005&DbName=CJFQ2011 (accessed on 10 November 2022).
  17. Wang, S.A.; Yan, R.; Qu, X.B. Development of a non-parametric classifier: Effective identification, algorithm, and applications in port state control for maritime transportation. Transp. Res. Part B Methodol. 2019, 128, 129–157. [Google Scholar] [CrossRef]
  18. Chen, W.; Huang, S. Evaluating flight crew performance by a Bayesian network model. Entropy 2018, 20, 972. [Google Scholar] [CrossRef] [Green Version]
  19. Song, C.-Y.; Hur, H.-Y. Comparison of development and marketing strategies of Airbus and Boeing. J. Korean Soc. Aeronaut. Soc. 2006, 34, 98–116. Available online: https://www.dbpia.co.kr/Journal/articleDetail?nodeId=NODE01099123 (accessed on 10 November 2022).
  20. Yang, Z.L.; Yang, Z.S.; Smith, J.; Robert, B.A.P. Risk analysis of bicycle accidents: A Bayesian approach. Reliab. Eng. Syst. Saf. 2021, 209, 107460. [Google Scholar] [CrossRef]
  21. Fan, S.Q.; Yang, Z.L.; Blanco-Davis, E.; Zhang, J.F.; Yan, X.P. Analysis of maritime transport accidents using Bayesian networks. Proc. Inst. Mech. Eng. Part O J. Risk Reliab. 2020, 234, 439–454. [Google Scholar] [CrossRef]
  22. Bhattacharyya, A.; Gayen, S.; Price, E.; Vinodchandran, N.V. Near-optimal learning of Tree-structured distributions by Chow-Liu. In Proceedings of the 53rd Annual ACM SIGACT Symposium on Theory of Computing, Virtual, 21–25 June 2021. [Google Scholar] [CrossRef]
  23. Peng, Y.C.; Cheng, L.Y.; Jiang, Y.M.; Zhu, S.X. Examining Bayesian network modeling in identification of dangerous driving behavior. PLoS ONE 2021, 16, e0252484. [Google Scholar] [CrossRef]
  24. Yang, Z.S.; Yang, Z.L.; Yin, J.B. Realising advanced risk-based port state control inspection using data-driven Bayesian networks. Transp. Res. Part A Policy Pract. 2018, 110, 38–56. [Google Scholar] [CrossRef]
  25. Mesner, O.C.; Shalizi, C.R. Conditional mutual information estimation for mixed, discrete and continuous data. IEEE Trans. Inf. Theory 2021, 67, 464–484. [Google Scholar] [CrossRef]
  26. Alyami, H.; Yang, Z.; Riahi, R.; Bonsall, S.; Wang, J. Advanced uncertainty modelling for container port risk analysis. Accid. Anal. Prev. 2019, 123, 411–421. [Google Scholar] [CrossRef] [PubMed]
  27. Yang, Z.L.; Wang, J.; Bonsall, S.; Fang, Q.G. Use of fuzzy evidential reasoning in maritime security assessment. Risk Anal. 2009, 29, 95–120. [Google Scholar] [CrossRef] [PubMed]
  28. Zhang, D.; Yan, X.P.; Yang, Z.L.; Wall, A.; Wang, J. Incorporation of formal safety assessment and Bayesian network in navigational risk estimation of the Yangtze River. Reliab. Eng. Syst. Saf. 2013, 118, 93–105. [Google Scholar] [CrossRef]
  29. Fan, S.Q.; Blanco-Davis, E.; Yang, Z.L.; Zhang, J.F.; Yan, X.P. Incorporation of human factors into maritime accident analysis using a data-driven Bayesian network. Reliab. Eng. Syst. Saf. 2020, 203, 107070. [Google Scholar] [CrossRef]
  30. Alam, M.S.; Sultana, N.; Hossain, S.M.Z. Bayesian optimization algorithm based support vector regression analysis for estimation of shear capacity of FRP reinforced concrete members. Appl. Soft Comput. 2021, 105, 107281. [Google Scholar] [CrossRef]
  31. Mengshoel, O.J.; Wilkins, D.C.; Roth, D. Initialization and restart in stochastic local search: Computing a Most Probable Explanation in Bayesian networks. IEEE Trans. Knowl. Data Eng. 2011, 23, 235–247. [Google Scholar] [CrossRef]
  32. Waycaster, G.C.; Matsumura, T.; Bilotkach, V.; Haftka, R.T.; Kim, N.H. Review of regulatory emphasis on transportation safety in the United States, 2002–2009: Public versus private modes. Risk Anal. 2018, 38, 1085–1101. [Google Scholar] [CrossRef] [Green Version]
  33. Pramono, A.; Middleton, J.H.; Caponecchia, C. Civil aviation occurrences in Indonesia. J. Adv. Transp. 2020, 2020, 3240764. [Google Scholar] [CrossRef]
  34. Jenamani, R.K.; Kumar, A. Bad weather and aircraft accidents—Global vis-à-vis Indian scenario. Curr. Sci. 2013, 104, 316–325. Available online: https://www.jstor.org/stable/24089632 (accessed on 15 November 2022).
  35. Li, Y.F. Analysis and forecast of global civil aviation accidents for the period 1942–2016. Math. Probl. Eng. 2019, 2019, 5710984. [Google Scholar] [CrossRef]
  36. Baidzawi, I.J.; Nur, N.M.; Shukri, S.A.; Mohd Aris, K.D.; Asmadi, N.L.; Mohamed, M. A review of accidents and incidents on Boeing and Airbus commercial aircraft’s avionics-related system in two decades (1996–2015). IOP Conf. Ser. Mater. Sci. Eng. 2019, 697, 12–31. [Google Scholar] [CrossRef]
  37. Kelly, D.; Efthymiou, M. An analysis of human factors in fifty controlled flight into terrain aviation accidents from 2007 to 2017. J. Saf. Res. 2019, 69, 155–165. [Google Scholar] [CrossRef] [PubMed]
  38. McClernon, C.K.; McCauley, M.E.; O’Connor, P.E.; Warm, J.S. Stress training improves performance during a stressful flight. Hum. Factor 2011, 53, 207–218. [Google Scholar] [CrossRef]
  39. Paletz, S.B.F.; Bearman, C.; Orasanu, J.; Holbrook, J. Socializing the human factors analysis and classification system: Incorporating social psychological phenomena into a human factors error classification system. Hum. Factor 2009, 51, 435–445. [Google Scholar] [CrossRef] [PubMed] [Green Version]
  40. Insley, J.; Turkoglu, C. A Contemporary Analysis of Aircraft Maintenance-Related Accidents and Serious Incidents. Aerospace 2020, 7, 81. [Google Scholar] [CrossRef]
  41. Moriarty, D.; Jarvis, S. A systems perspective on the unstable approach in commercial aviation. Reliab. Eng. Syst. Saf. 2014, 131, 197–202. [Google Scholar] [CrossRef]
  42. Yue, R.T.; Li, J.W.; Han, M. Aviation accident causation analysis based on complex network theory. Trans. Nanjing Univ. Aeronaut. Astronaut. 2021, 38, 646–655. [Google Scholar] [CrossRef]
  43. Cano, A.; Gómez-Olmedo, M.; Moral, S.; Moral-García, S. MPE computation in Bayesian Networks using mini-bucket and probability trees approximation. Int. J. Uncertain. Fuzziness Knowl. Based Syst. 2020, 28, 785–805. [Google Scholar] [CrossRef]
  44. Fabre, E.F.; Matton, N.; Beltran, F.; Baragona, V.; Cuny, C.; Imbert, J.-P.; Voivret, S.; Henst, J.-B.V.D.; Causse, M. Hierarchy in the cockpit: How captains influence the decision-making of young and inexperienced first officers. Saf. Sci. 2022, 146, 105536. [Google Scholar] [CrossRef]
Figure 1. Structure and results of the proposed TAN-BN model.
Aerospace 10 00009 g001
Figure 2. Most Probable Explanation (MPE) for TAN-BN model.
Aerospace 10 00009 g002
Figure 3. Most Probable Explanation for “FATL”.
Aerospace 10 00009 g003
Figure 4. Model validation based on a retrospective analysis of a past civil aviation accident.
Aerospace 10 00009 g004
Table 1. Casualty types of civil aviation accidents.
No.Casualty TypeNotationDescription
1NONE C 1 No one was injured in the accident.
2MINR C 2 At least one person minorly injured.
3SERS C 3 At least one person is seriously injured.
4FATL C 4 At least one person is fatally injured.
Table 2. RIFs defined in civil aviation accidents.
No.RIFsNotationDescription of StatesCorresponding Values
1Flight Phase R 1 Standing, pushback/towing, taxi, takeoff, climb, cruise, descent, approach, landing.1, 2, 3, 4, 5, 6, 7, 8, 9
2Certified Max Gross Weight (lb) R 2 ≤100,000, 100,000 to 200,000, >200,000.1, 2, 3
3Airframe Hours (hours) R 3 ≤20,000, 20,000 to 50,000, >50,000.1, 2, 3
4Number of Engines (engines) R 4 2, 3, 4.2, 3, 4
5Pilot Physical Condition R 5 Good/poor physical condition of pilots during the flight. (Including physical characteristic, sensory ability/limitation, health/fitness, alertness/fatigue, and impairment/incapacitation)1 (good), 2 (bad)
6Equipment Condition R 6 Good/poor operation of equipment during the flight. (Including aircraft systems, handling/service, power plant, propeller/rotor, and structures)1 (good), 2(bad)
7Management R 7 Good/bad management system. (Including resources, scheduling, policy/procedure, and culture)1(good), 2(bad)
8Physical Environment R 8 Good/poor physical environment during the flight. (Including terrain, runway/land/takeoff/taxi surface, and object/animal/substance)1 (good), 2(bad)
9Pilot Experience and Skills R 9 Good/poor experience and skills of pilots during the flight. (Including knowledge, training and qualifications)1 (good), 2(bad)
10Pilot Psychological Condition R 10 Good/poor psychological condition of pilots during the flight. (Including cognitive limitation, attention/monitoring, perception/orientation/illusion, personality/attitude, and mental/emotional state)1 (good), 2(bad)
11Flight Type R 11 Domestic flight, international flight.1, 2
12Number of Seats on Aircraft (for passengers) R 12 ≤100, 100 to 200, >200.1, 2, 3
13Carrying Category R 13 Carrying passengers, carrying cargo.1, 2
14Operating Condition R 14 Good/poor operating condition during the flight. (Including approach aid coverage/avail, enroute navaid coverage/avail, communication system, airport facilities/design, radar services/coverage, air traffic/operating procedure, and meteorological services)1 (good), 2 (bad)
15Pilot Task Performance R 15 Good/poor task performance of pilots during the flight. (Including use of equipment/info, communication, record-keeping, inspection, planning/preparation, and workload management)1 (good), 2 (bad)
16Maintenance Quality R 16 Good/poor maintenance quality during the flight.1 (good), 2 (bad)
17Supervision R 17 Effective or ineffective supervision and supports. (Including safety programs, documentation/record keeping, enforcement, oversight, and design)1 (good), 2 (bad)
18Weather Condition R 18 Good/poor weather condition during the flight. (Including convective weather, turbulence, ceiling/visibility/precipitation, wind, temp/humidity/pressure, and light condition)1 (good), 2 (bad)
19Pilot Action and Decision R 19 Good/poor action and decision of pilots during the flight. (Including action and info processing/decision)1 (good), 2 (bad)
Table 3. Mutual information (MI) between “casualty type” and individual RIFs.
RIF/NodeMutual InfoRIF/NodeMutual Info
Weather Condition0.3434Pilot Psychological Condition0.0228
Flight Phase0.3181Certified Max Gross Weight0.0147
Equipment Condition0.1901Pilot Task Performance0.0126
Pilot Action and Decision0.0717Airframe Hours0.0124
Maintenance Quality0.0543Pilot Physical Condition0.0122
Carrying Category0.0432Supervision0.0112
Physical Environment0.0400Pilot Experience and Skills0.0105
Management0.0363Operating Condition0.0047
Number of Seats on Aircraft0.0354Flight Type0.0032
Number of Engines0.0294
Table 4. TRI of RIF—flight phase for casualty type C 1 .
Flight Phase
123456789 C 1 HRILRITRI
/////////58.130.243.636.9
100%0000000061.9
0100%000000061.9
00100%00000088.3
000100%0000075.9
0000100%000059.4
00000100%00027.5
000000100%0014.5
0000000100%053.1
00000000100%79.6
Table 5. The TRI of the five highest ranked risk factors for all casualty types.
RIF/Node C 1 C 2 C 3 C 4 Average Value
Weather Condition35.851.67533.540.57517.91
Flight Phase36.96.44536.7051.9920.51
Equipment Condition16.252.7619.20.239.61
Pilot Action and Decision8.652.33511.50.5055.75
Maintenance Quality10.41.1212.851.3156.42
Table 6. The most important factors.
Casualty TypeWeather
Condition
Flight PhaseEquipment ConditionPilot Action and DecisionMaintenance Quality
C 1 21354
C 2 41235
C 3 21354
C 4 31542
Table 7. Casualty rate of minor change in variables.
Weather Condition/~10%~10%~10%~10%~10%
Flight Phase//~10%~10%~10%~10%
Equipment Condition///~10%~10%~10%
Pilot Action and Decision////~10%~10%
Maintenance Quality/////~10%
C 1 58.165.272.374.375.176.2
C 2 8.388.7210.21111.411.5
C 3 32.33946.751.454.758.4
C 4 1.21.311.761.842.032.38
Table 8. The results of 3-fold cross-validation and 5-fold cross-validation.
k-Fold
Cross-Validation
Error Rate (%) by FoldMean Error Rate (%)
01234
3-fold cross-validation18.5212.9624.07//18.52
5-fold cross-validation21.216.0612.1221.2129.4118.00
Table 9. Most Probable Explanation for all casualty types.
Variable C 1 C 2 C 3 C 4
Flight Phase9968
Certified Max Gross Weight1213
Airframe Hours2211
Number of Engines2222
Pilot Physical Condition1112
Equipment Condition1212
Management1111
Physical Environment1111
Pilot Experience and Skills1111
Pilot Psychological Condition1112
Flight Type1111
Number of Seats on Aircraft1211
Carrying Category1112
Operating Condition1111
Pilot Task Performance1112
Maintenance Quality1111
Supervision1112
Weather Condition1222
Pilot Action and Decision1111
Disclaimer/Publisher’s Note: The statements, opinions and data contained in all publications are solely those of the individual author(s) and contributor(s) and not of MDPI and/or the editor(s). MDPI and/or the editor(s) disclaim responsibility for any injury to people or property resulting from any ideas, methods, instructions or products referred to in the content.

