1. Introduction
Research focusing on the space environment is being actively conducted in the civilian and military fields. When a manned spacecraft or ballistic missile returns to Earth from space, it inevitably passes through the atmosphere. The high potential energy of the aircraft reentering the atmosphere is converted into kinetic energy, and aerodynamic heating occurs on the surface of the aircraft. Aerodynamic heating causes dissociation and ionization of the air molecules on the surface of the vehicle to form an ionization layer that is defined as the reentry plasma sheath. This sheath is responsible for the blackout phenomenon, in which communication between the ground and the reentry vehicle is temporarily blocked [
1,
2,
3,
4]. The blackout phenomenon is related to the plasma frequency, which is one of the natural characteristics of plasma [
5,
6,
7,
8]. A communication signal with a frequency lower than that of the plasma does not pass through the reentry plasma sheath and is either reflected or absorbed [
6,
7,
8]. This phenomenon increases the possibility of problems resulting from communication failure when a manned spacecraft arriving from space prepares to land on the ground. Therefore, to overcome these problems, it is important to analyze the correlation between the characteristics (electron density) of the reentry plasma and the attenuation of the communication frequency in the reentry plasma medium.
There were results on electromagnetic wave attenuation by plasma from various experimental methods. In a 1 MW plasma wind tunnel, there were experimental results that measured electromagnetic wave attenuation according to different catalytic materials [
9], and in another experiment, cold gas was injected into a thin heat-insulating air film layer to reproduce reentry plasma, with computational fluid dynamics (CFD) results and results from comparative analysis with ref. [
10]. In addition, there were experimental results of measuring the electron density and electromagnetic wave attenuation according to the variation in argon flow in a Huels-type arc heater where the maximum power of 1.4 MW was applied [
11]. The above experiments did not directly measure the plasma density but substituted computer simulation results or measured the attenuation results in weakly ionized plasma. As a result, the results for reentry plasma showed some insufficient conclusions to discuss.
An experimental method designed to acquire measurement data in an actual reentry plasma environment has the disadvantage of an extremely high cost. Therefore, it is necessary to devise methods that can reproduce and measure the reentry plasma on a laboratory scale to measure the attenuation of the communication signal in the plasma medium [
12].
The purpose of this study was to confirm the feasibility of reproducing re-entry plasma at a relatively low cost on a laboratory scale. The plasma parameter considered most important in reproducing the re-entry plasma was the plasma density. Since it was difficult to reproduce the high plasma density of re-entry plasma with normal glow discharge methods (inductively coupled plasma, capacitively coupled plasma, etc.), arc plasma, which is an abnormal discharge method, was used. Since the current applied to discharge the arc plasma had a very high value (>40 A), high-temperature plasma can be obtained. In order to measure the plasma density of the reproduced reentry plasma (DC arc plasma), a measurement was attempted using a single Langmuir probe, but there was a problem with the probe tip melting. Therefore, an experiment was conducted to measure the plasma density through a microwave reflectometry, which is a non-invasive method. In addition, to analyze the black-out phenomenon, which is the biggest problem in re-entry plasma, an experiment was conducted to measure the attenuation of electromagnetic waves through microwave interferometry. The goal of this experiment is to compare the results of the two experiments and to verify the theoretical analysis that the attenuation of electromagnetic waves increased as the plasma frequency, which is proportional to the plasma density, increased. It is also a preceding study on how to mitigate electromagnetic wave attenuation in plasma. Further experiments on electromagnetic wave attenuation mitigation will be conducted in the near future.
In this study, DC arc plasma with high temperature, high speed, and high density plasma characteristics was discharged in a vacuum chamber using the hot refractory anode vacuum arc (HRAVA) method. The corresponding DC arc plasma is metal evaporation type arc plasma, which has slightly different characteristics from the gas ionization type reentry plasma resulting from aerodynamic heating. Nonetheless, the HRAVA method is considered to be the most appropriate to reproduce the important characteristics of the re-entry plasma, such as its high temperature, high speed, and high density, on a laboratory scale. The reflectometry method was used to measure the plasma density, which is the most important characteristic of DC arc plasma, and interferometry was used simultaneously to analyze the attenuation characteristics of electromagnetic waves in the plasma medium. The frequency range used in the experiments for both measurement methods was 10 to 35 GHz. The variation in the altitude of the reentry vehicle was expressed by varying the pressure in the vacuum chamber, and an experiment was conducted to compare and analyze the plasma density and attenuation of electromagnetic waves according to the variation in pressure.
In
Section 2, the similarity between the characteristics of the DC arc plasma discharged by the HRAVA method to those of the reentry plasma is explained to justify the selection of this method, and the configuration of the measurement equipment installed in the vacuum chamber is explained.
Section 2.2 presents a theoretical description of the characteristics of the plasma, and the reflectometry and interferometry used in this study are described in detail.
2. Materials and Methods
2.1. HRAVA Method
2.1.1. Similarly Reproduced Reentry Plasma
The HRAVA method entails discharging arc plasma by applying a strong DC current between a cathode maintained at an appropriate temperature and a high-temperature refractory anode. The reason for the suitability of the HRAVA method for reproducing reentry plasma is that the speed of the arc plasma is close to the number of charged particles in the plasma, which is large due to the re-evaporation of the cathode material around the anode. In addition, a high plasma temperature is attained by using an anode material with a high boiling point. Although the speed of the arc plasma varies depending on the material used as the cathode material, it is preferable to use a material whose physical properties do not change in extreme environments, such as high temperatures. The cathode material re-evaporates around the anode at the very high temperature, and therefore, the number of charged particles per unit volume in the plasma is much higher than that in general arc plasma. This means that the plasma is extremely dense, with a plasma density of 10
12 cm
−3 or more [
12,
13,
14,
15]. According to the results of the Radio Attenuation Measurement program, C series spacecraft configuration (RAM-C) at NASA Langley Research Center, the plasma density was the highest around hypersonic vehicles at an altitude of 61 km, and the density was quantified as 10
13 cm
−3 [
4,
6]. Therefore, the HRAVA method closely reproduces the plasma conditions, including the high plasma density, of reentry plasma. However, in this study, nitrogen at room temperature was used as the atmospheric gas in the vacuum chamber. The limitations of this approach are that the nitrogen/oxygen ratio was not adjusted to approximate that of the atmosphere; consequently, a gas with a different temperature from the atmosphere through which the actual reentry vehicle passes was used. Therefore, it is desirable to define similarly reproduced reentry plasma rather than perfectly reproduced reentry plasma.
The ion speed of the DC arc plasma discharged in the HRAVA method corresponds to hypersonic speed. As mentioned earlier, the speed of the DC arc plasma is affected by the cathode material. By defining the sound speed of ions in DC arc plasma as
Vis, the expression for
Vis becomes the following [
12,
13,
14,
15].
where
γe and
γi are the adiabatic indexes for electrons and ions, and
Te and
Ti are the temperatures of electrons and ions, respectively.
Mi is the ion mass, and
k is the Boltzmann constant.
DC arc plasma is a high-temperature plasma and therefore in local thermal equilibrium (LTE). Therefore, the temperature of electrons
and the temperature of ions
can be assumed to be equal. As a result, Equation (1) can be defined as expressing the behavior of ions. The information for obtaining the speed of DC arc plasma using this equation is provided in more detail in a previous paper [
16]. As a result, the ion speed in the plasma discharged by the HRAVA method could be considered to have a hypersonic speed of Mach 5 or higher.
2.1.2. HRAVA Chamber Set-Up
The HRAVA equipment consists of a cathode part, an anode part, and a vacuum chamber. After installing the cathode and anode parts in the vacuum chamber, which serves to maintain the experimental environment under vacuum, low-voltage, strong-current DC power was applied across the cathode and anode.
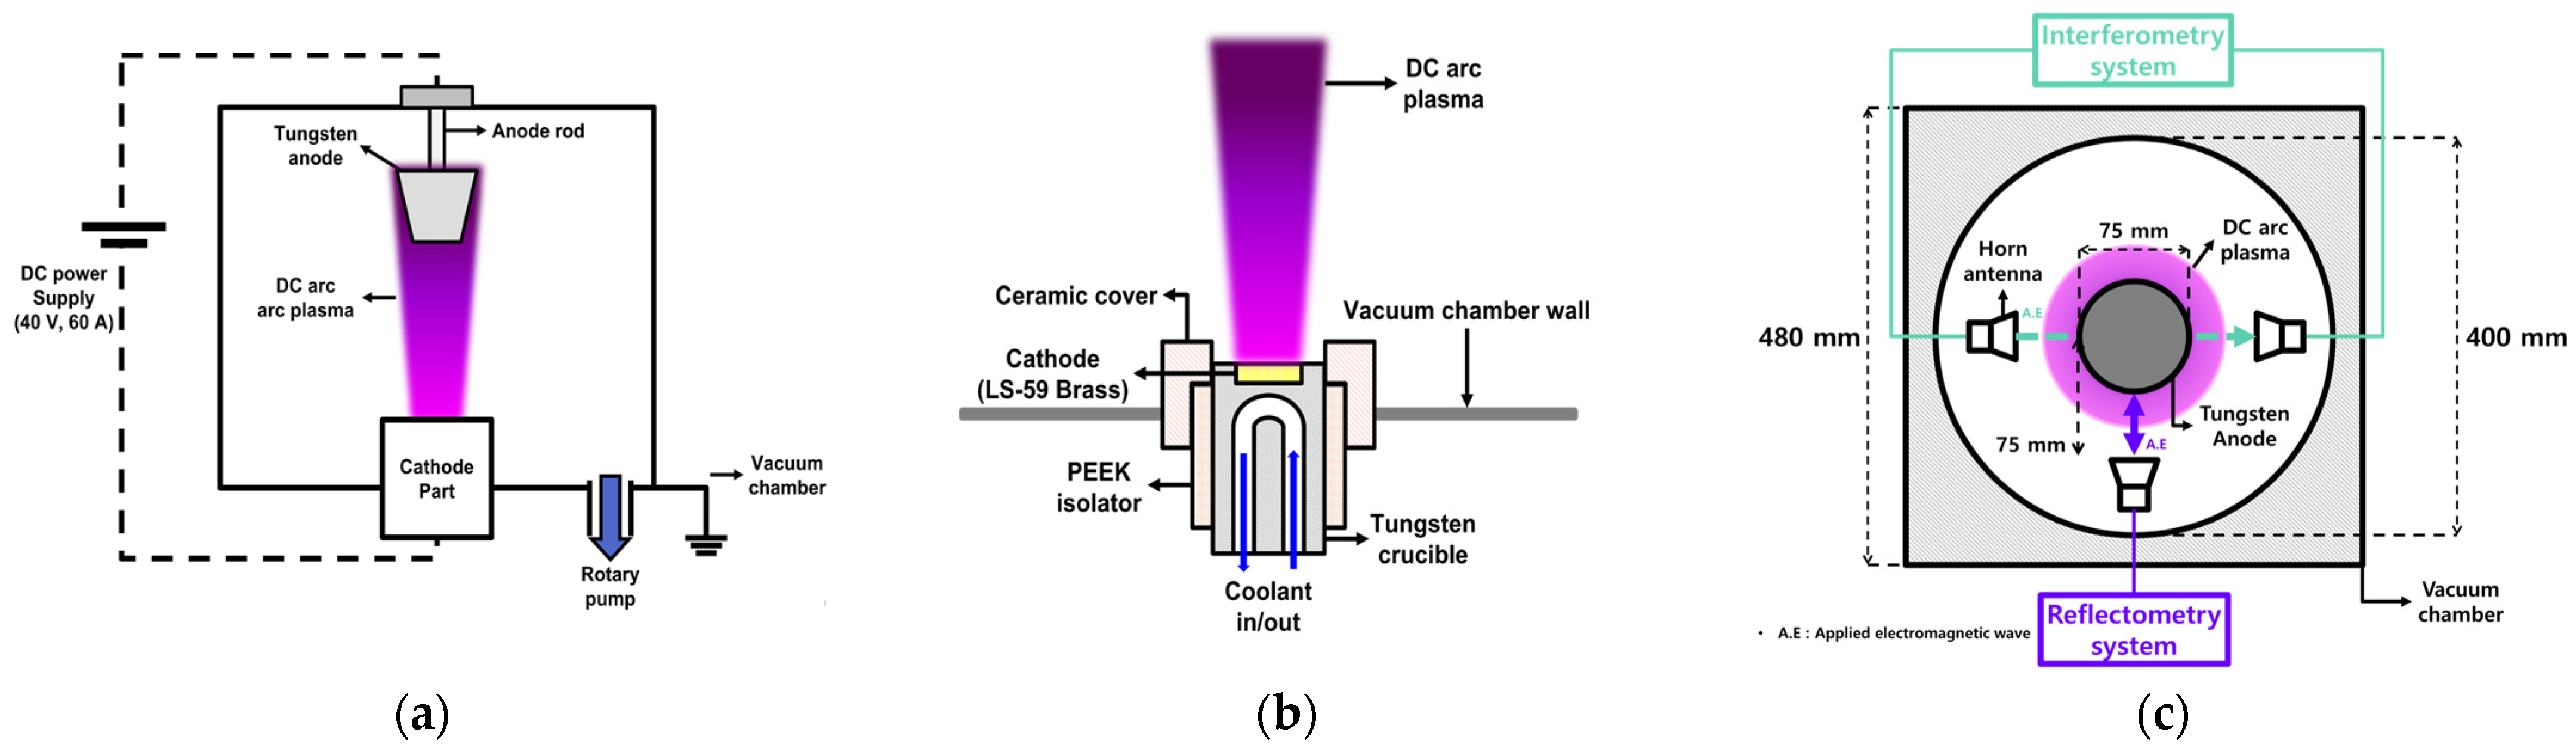
Figure 1a shows the anode and cathode components installed in the vacuum chamber, and
Figure 1b shows the different parts of the cathode in more detail. A detailed diagram of the parts of the anode is not provided. The anode was manufactured from tungsten, a high-temperature refractory metal. The closed circuit for supplying DC power was confined to the anode and cathode to ensure that the anode and cathode were electrically insulated from the vacuum chamber. These explanations can be understood more easily by referring to
Figure 1a. In the case of the cathode, a more detailed configuration is presented in
Figure 1b. A ceramic cover was used to prevent damage to the PEEK isolator by charged particles with high energy, such as thermal electrons from the DC arc plasma. The PEEK isolator was inserted for electrical isolation between the tungsten crucible and the vacuum chamber. The tungsten crucible holds the cathode (LS-59 Brass) in a fixed position and delivers DC power to the cathode via its connection to the DC power supply. In addition, a cooling line is included for internal cooling to prevent the cathode from becoming excessively hot as the cooling material flows inside. Ultra-pure water was used as the cooling material, considering electrical insulation.
Figure 1c shows a top-view illustration of the HRAVA-type vacuum chamber depicted in
Figure 1a. This is to explain the positions of the three horn antennas installed inside the vacuum chamber. A tungsten anode with a diameter of 75 mm was placed in the center of the vacuum chamber. Two horn antennas were located facing each other around this center, and three antennas were fixed 75 mm from the center of the tungsten anode. An interferometry system for measuring electromagnetic wave attenuation in the plasma medium was connected to the two horn antennas. The other horn antenna was connected to a reflectometry system to measure the plasma frequency. The tungsten anode was positioned 100 mm from the bottom of the vacuum chamber. A rotary pump was used for the vacuum environment in the vacuum chamber, and the base pressure was maintained as low as possible at 2.6 Pa before nitrogen gas was injected. After nitrogen gas injection, the pressure in the vacuum chamber was changed from 25.3 Pa to 87.9 Pa and finally to 293.3 Pa. These changes represent the pressure variation according to the variation in the altitude of the reentry vehicle. The pressure corresponding to altitudes of 60, 50, and 40 km was 25.3, 87.9, and 293.3 Pa, respectively [
17].
2.2. Reflectometry and Interferometry
2.2.1. Plasma Frequency and Electromagnetic Wave Attenuation Correlations
Equal amounts of electrons and ions exist in the plasma, which is defined as a quasi-neutral state. These charged particles interact and oscillate in the plasma, which gives rise to the plasma frequency. For the reason the plasma frequency is related to the number of oscillating charged particles, it can be related to the plasma density
ne. The plasma frequency can be defined as an angular frequency and denoted as ω
p, which can be expressed as follows [
18,
19]:
The reentry plasma and DC arc plasma can be defined as existing in the ordinary mode because they do not have a form in which a magnetic field is applied from outside the plasma [
20]. Therefore, the angular frequency
of the electromagnetic wave applied to the plasma in the corresponding mode and the angular frequency
of the plasma are related to the refractive index
n of the plasma according to the dispersion relation.
Based on the definition of the refractive index
n of the plasma, the correlation between an electromagnetic wave in a plasma medium and the plasma frequency can be represented. When
n is less than 0, the electromagnetic waves do not pass through the plasma and are attenuated in the plasma. When
n is 0, the electromagnetic waves are all reflected from the plasma. When
n is greater than 0, electromagnetic waves may pass through the plasma [
21,
22,
23,
24]. As a result, an electromagnetic wave with a frequency lower than that of the plasma is attenuated in the plasma medium, and when the frequency of the plasma and the electromagnetic wave are equal, the electromagnetic wave is completely reflected from the plasma. Therefore, the point at which most of the electromagnetic wave appears to be reflected by the plasma is the plasma frequency point, which enables the plasma density to be calculated using Equation (1). This is the method used by microwave reflectometry.
The attenuation characteristics of electromagnetic waves propagating through a plasma medium are related to the angular frequency of the applied electromagnetic waves, the plasma angular frequency expressed as the plasma density, and the plasma collision frequency
υe. Assuming an electromagnetic wave travelling through a homogeneous and non-fluctuating plasma medium is a plane wave, the applied electromagnetic wave can be expressed as
ejωt. Therefore, the relative permittivity of the plasma is
εp(ω) and can be expressed as follows [
18,
19]:
The wave number
k of the electromagnetic wave can be expressed as the relative permittivity of the plasma and as the sum of the real part
β and imaginary part
α. The real part,
β, is the phase constant, and the imaginary part,
α, is the attenuation constant. The theoretical attenuation in the plasma can be calculated by summarizing the equations related to the imaginary part
α, as expressed in Equation (6).
In which,
where
μ0 is the permeability of vacuum.
Microwave interferometry was used to measure the plasma frequency by measuring the attenuation of electromagnetic waves in the plasma medium.
2.2.2. Reflectometry and Interferometry Circuit
Both reflectometry and interferometry use the general heterodyne method [
25], whereby the high frequency (GHz) used for measuring the plasma frequency and electromagnetic wave attenuation is changed into an intermediate frequency using a mixer.
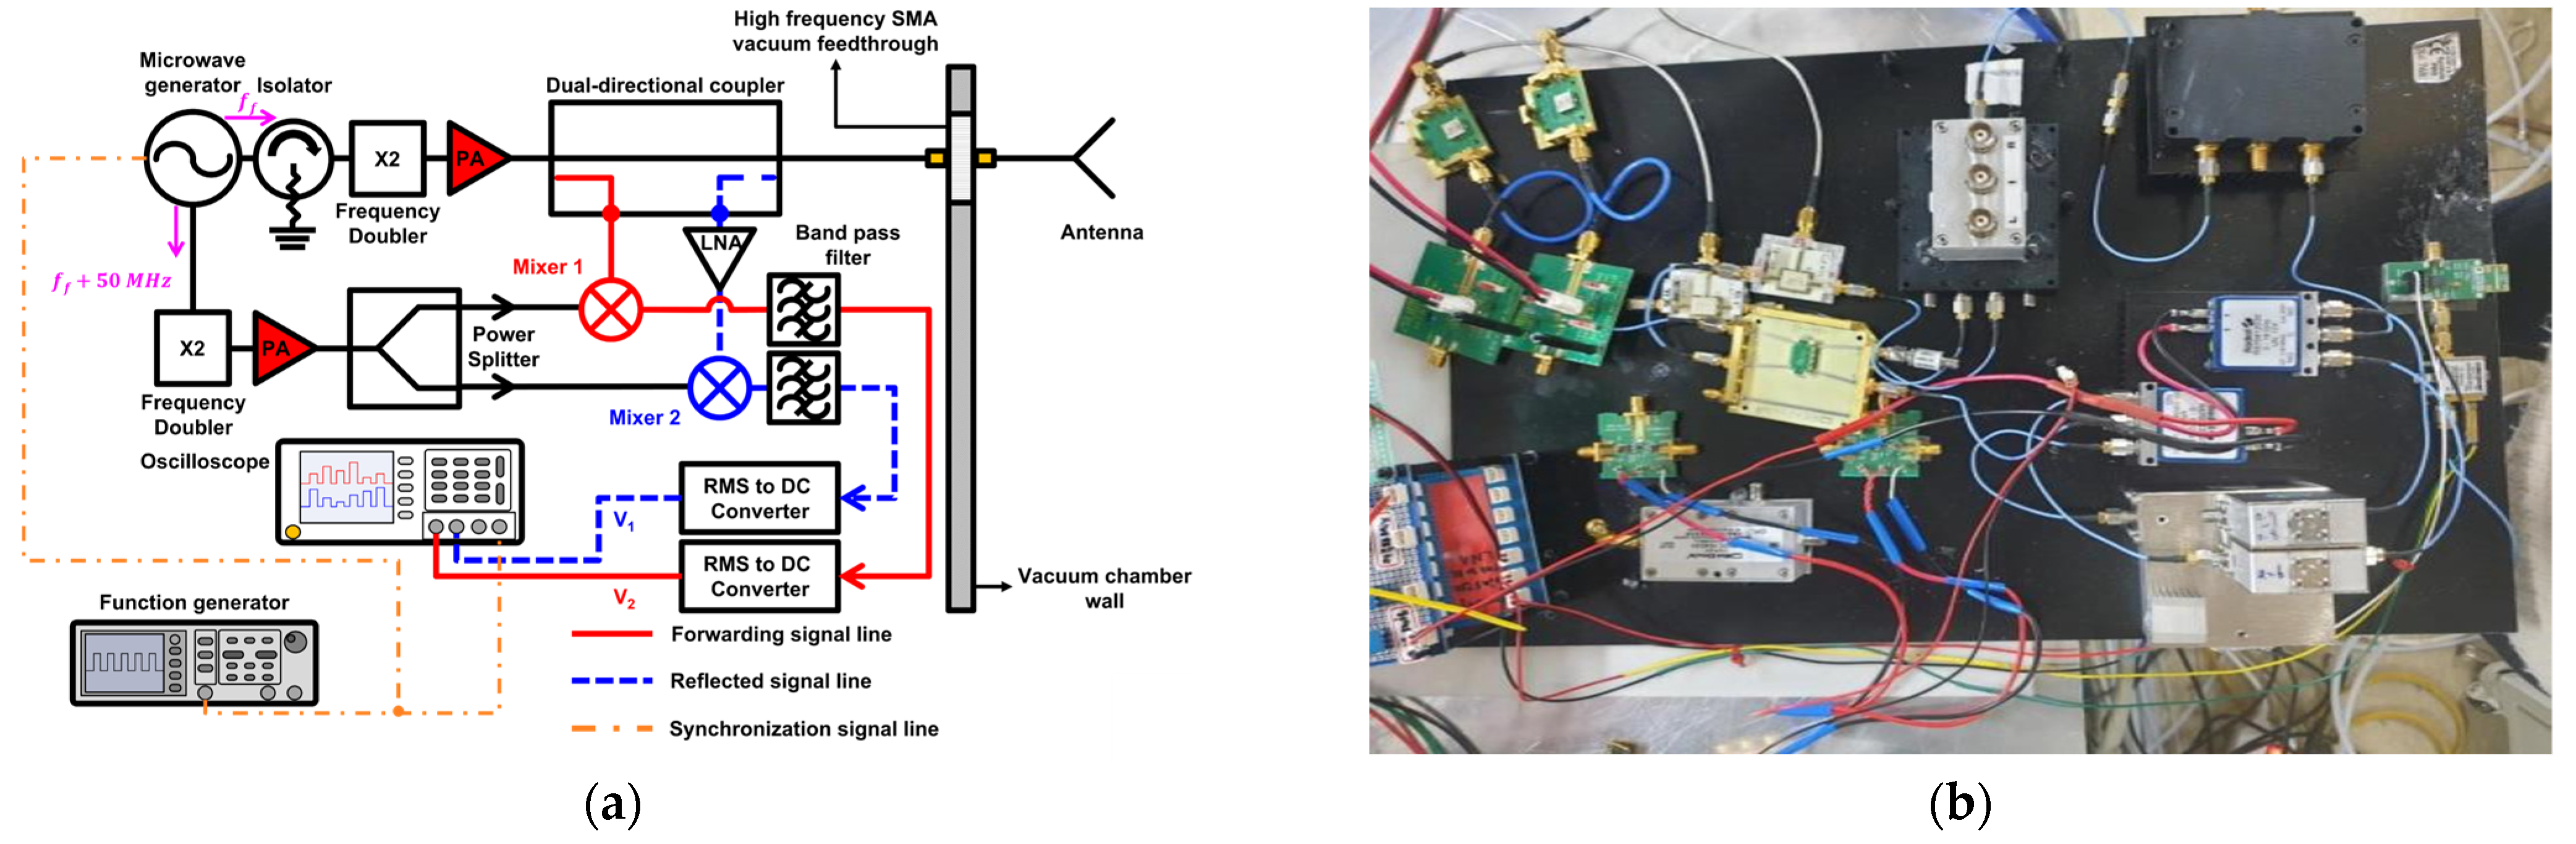
Figure 2a and
Figure 3a show schematic diagrams of the reflectometry and interferometry circuits, and
Figure 2b and
Figure 3b show photographic images of the corresponding circuits. Both methods used the same components; only the arrangement was different. In reflectometry, the role of Mixer 2 is to create an intermediate frequency for the signal reflected by the plasma, and in interferometry, the role of Mixer 2 is to create an intermediate frequency for the signal that has passed through the plasma. Therefore, in interferometry, Mixer 2 was replaced with Mixer 3.
The microwave output from the 2ch frequency sweepable microwave generator was divided into two paths. The first is applied to the plasma and serves to measure the correlation between the electromagnetic wave and the plasma frequency (Path 1), and the other is input to the mixers and serves as a local oscillator (Path 2). It can specify the settings for the frequency sweep in the microwave generator itself. In this study, a frequency step unit of 125 MHz and a step conversion time of 2 ms were set, and the frequency setting range was set from 5 to 17.5 GHz. The microwaves proceeding along Path 1 passed through an isolator to suppress reflected signals in the circuit. The frequency is subsequently doubled using a frequency doubler. This is to increase the frequency range to higher than the range that can be output by the microwave generator. For the reason the microwaves passing through the isolator and frequency doubler experience power loss, they proceed through an amplification step involving a power amplifier (PA) before being applied to the plasma. The frequency-multiplied and power-amplified microwave signal was input to the dual-directional coupler, and some power is input to Mixer 1 through the coupling effect. In Mixer 1, it is combined with LO to create an intermediate frequency for the electromagnetic wave frequency incident on the plasma (V1). Microwaves proceeding along Path 2 are first passed through the frequency doubler. Furthermore, the power is amplified by the PA to meet the minimum input power required by the mixer. The amplified microwave is distributed to Mixer 1 and Mixer 2 through the power splitter and input to each LO port.
In reflectometry, the microwaves propagating along Path 1 were incident on the plasma via a horn antenna. A single horn antenna was used to radiate and collect microwave signals. Electromagnetic waves incident on the plasma were reflected by the plasma frequency and collected again by the horn antenna. Part of the power of the reflected signal collected by the horn antenna was input to Mixer 2 by the coupling effect in the dual-directional coupler. At this time, because the reflected signal power is weak, it needs to be amplified by a low-noise amplifier (LNA). In Mixer 2, the reflected signal and the LO are combined to create the intermediate frequency for the signal reflected by the plasma (V2).
In interferometry, the experiment was conducted with a pair of antennae. One antenna radiated microwave signals (the transmission antenna), and the other antenna receives microwave signals passing through the plasma medium (the receiving antenna). The microwave signal passing through the plasma was input to Mixer 3 and combined with the LO signal to create an intermediate frequency for the signal passing through the plasma (V3).
2.2.3. Analysis of Reflectometry and Interferometry Measurements
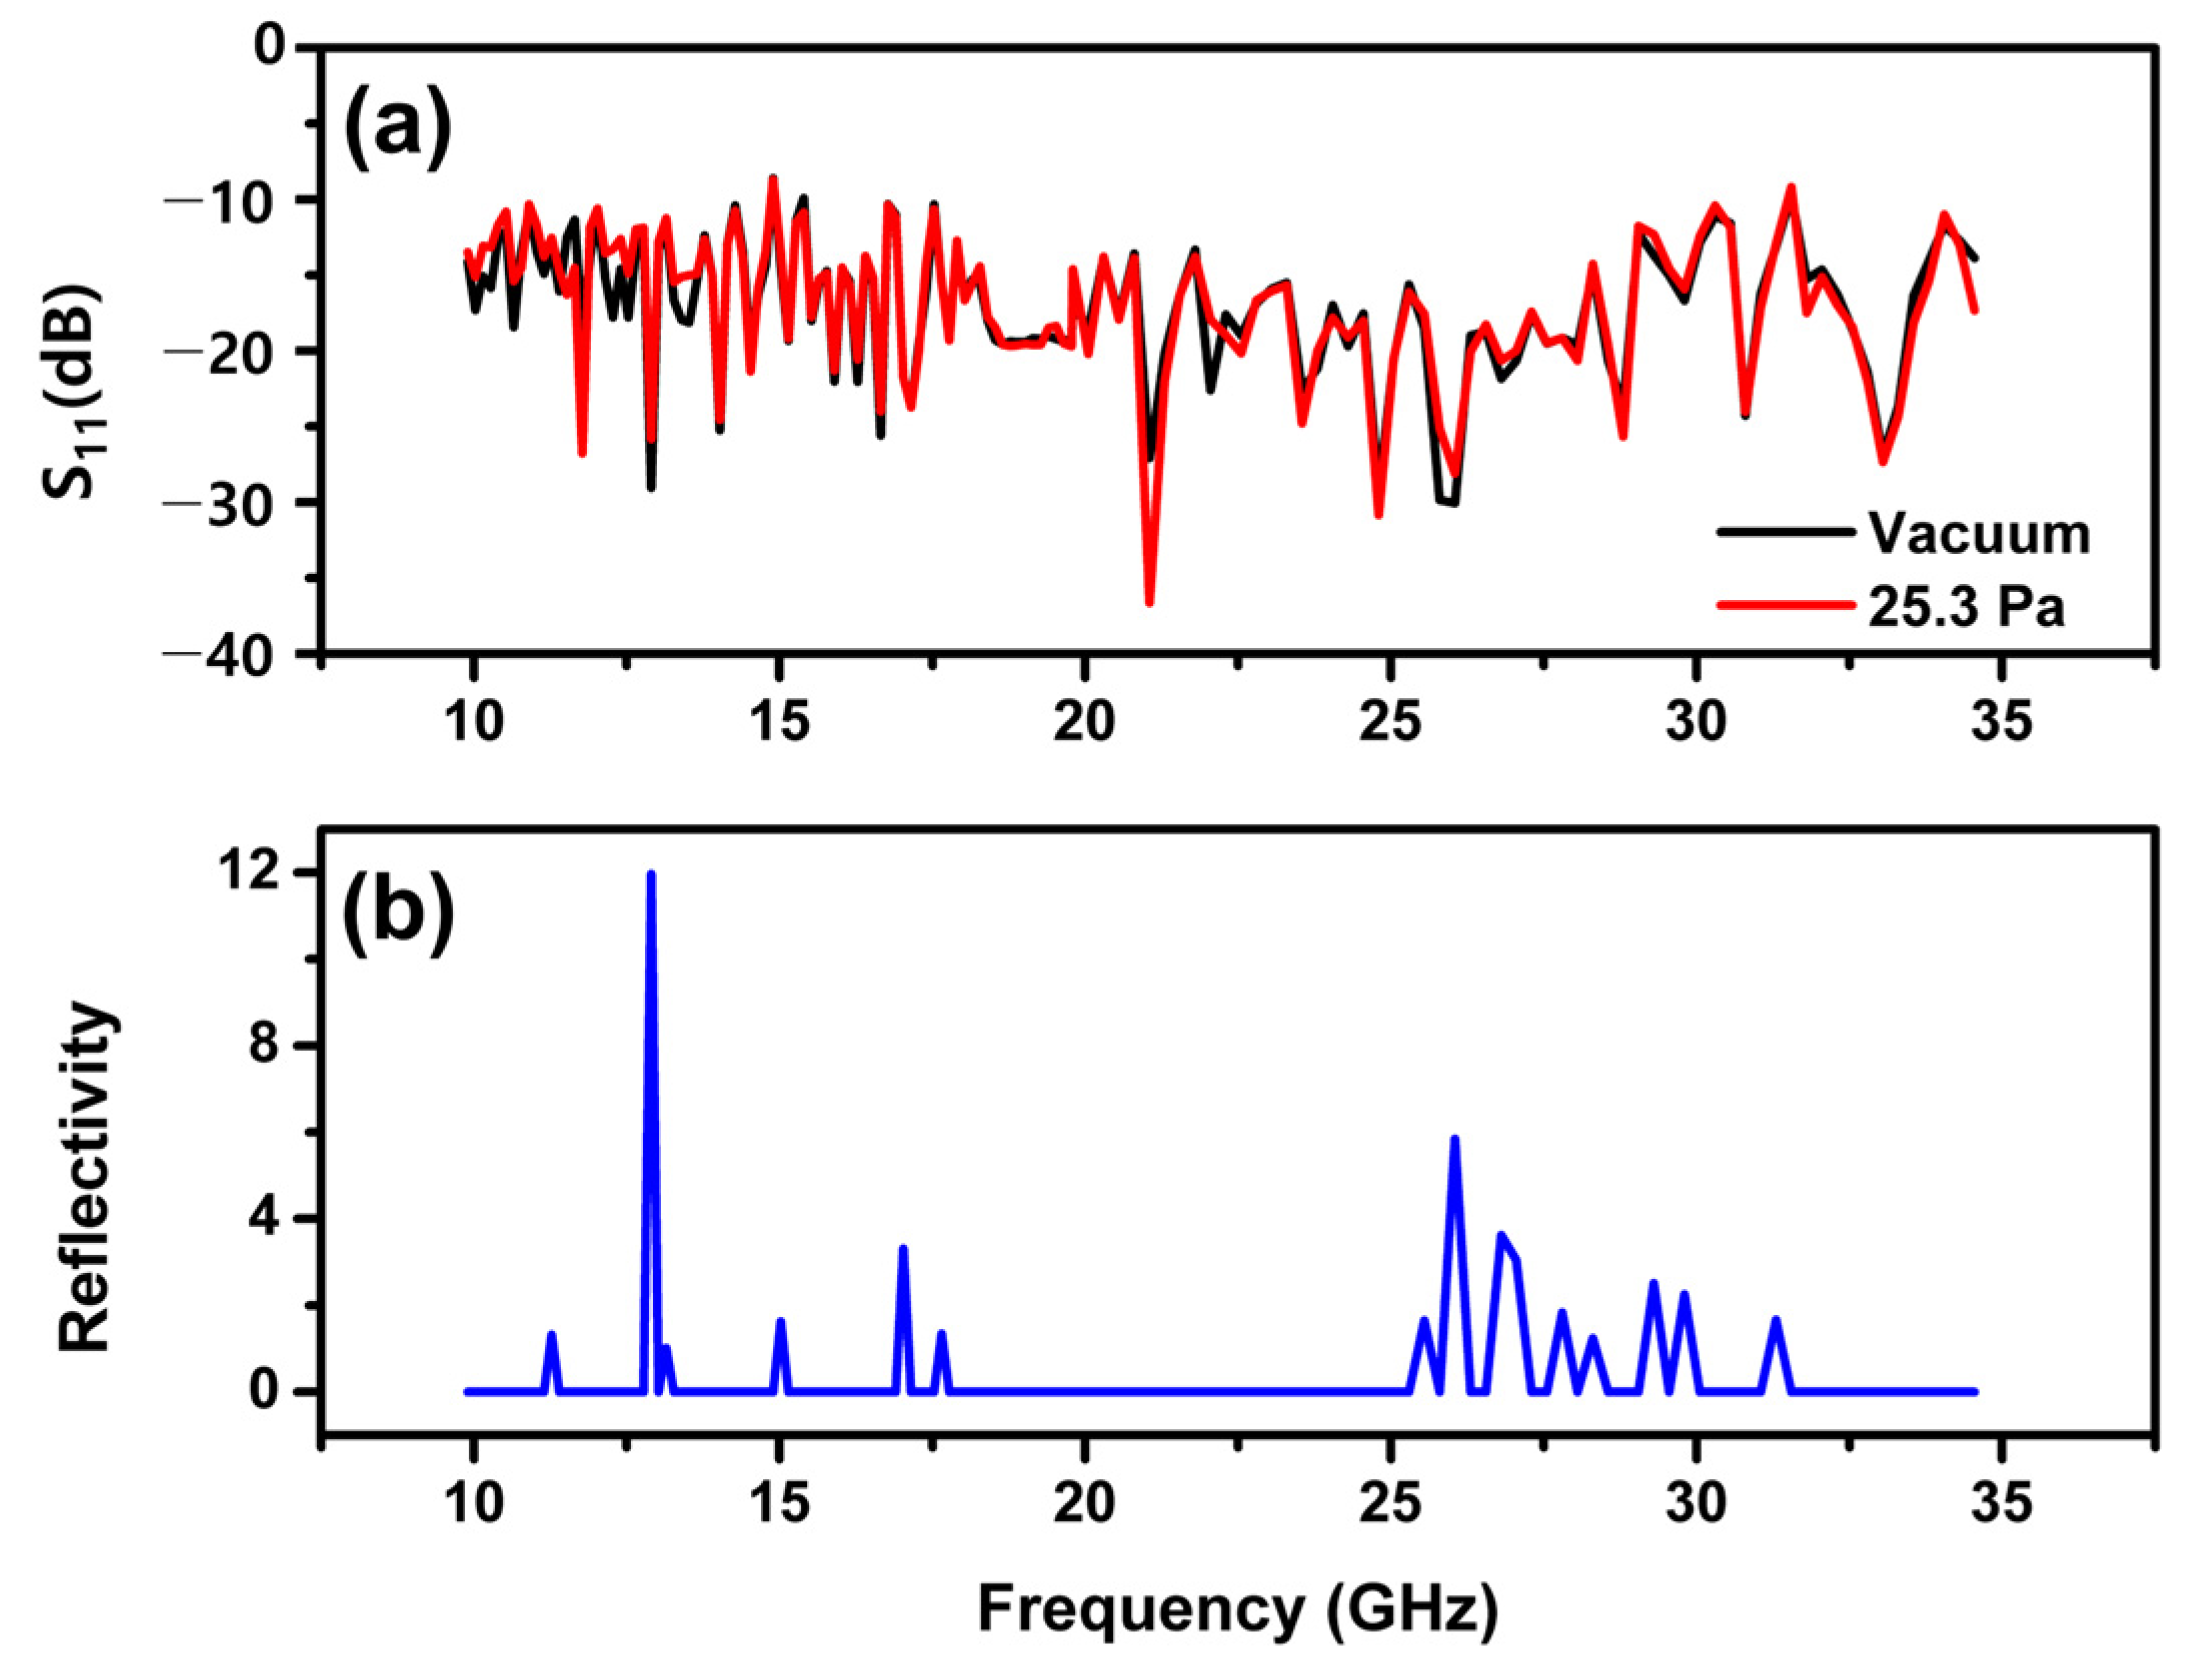
Figure 4 shows the reflectometry results.
Figure 4a shows the
S11 parameter as a function of the frequency before and after plasma discharge at 25.3 Pa. This parameter is an index that quantitatively indicates the degree to which electromagnetic waves are reflected by a medium. The definition of
S11 is shown in the equation below.
In
Figure 2, the voltages after the intermediate-frequency component of the electromagnetic wave applied to the plasma and the intermediate-frequency component of the electromagnetic waves reflected by the plasma and passed through the RMS-to-DC converter are defined as V
1 and V
2, respectively. Therefore, because V
+ is equal to V
1 and V
− is equal to V
2, the circuit output can be expressed as a voltage ratio, as in Equation (7). For the reason the frequency point at which the reflection of electromagnetic waves by the plasma was the greatest coincided with the plasma frequency, the plasma frequency can be measured by reflectometry. However, as shown in
Figure 4a, it was difficult to find the corresponding point. Therefore, in this study, a more convenient method for analyzing the plasma frequency was devised. The reflectivity is defined as the value obtained by subtracting the
S11 parameter (measured in the absence of plasma) from the resulting
S11 parameter after plasma discharge.
Figure 4b shows only the positive values among the calculated reflectivity. This is because the value of the
S11 parameter increases when the electromagnetic waves are reflected by the plasma. The result in
Figure 4b confirms that several peaks appear. The frequency at the highest reflectivity provides an approximation of the plasma frequency. This is explained in more detail in
Section 3 and
Section 4.
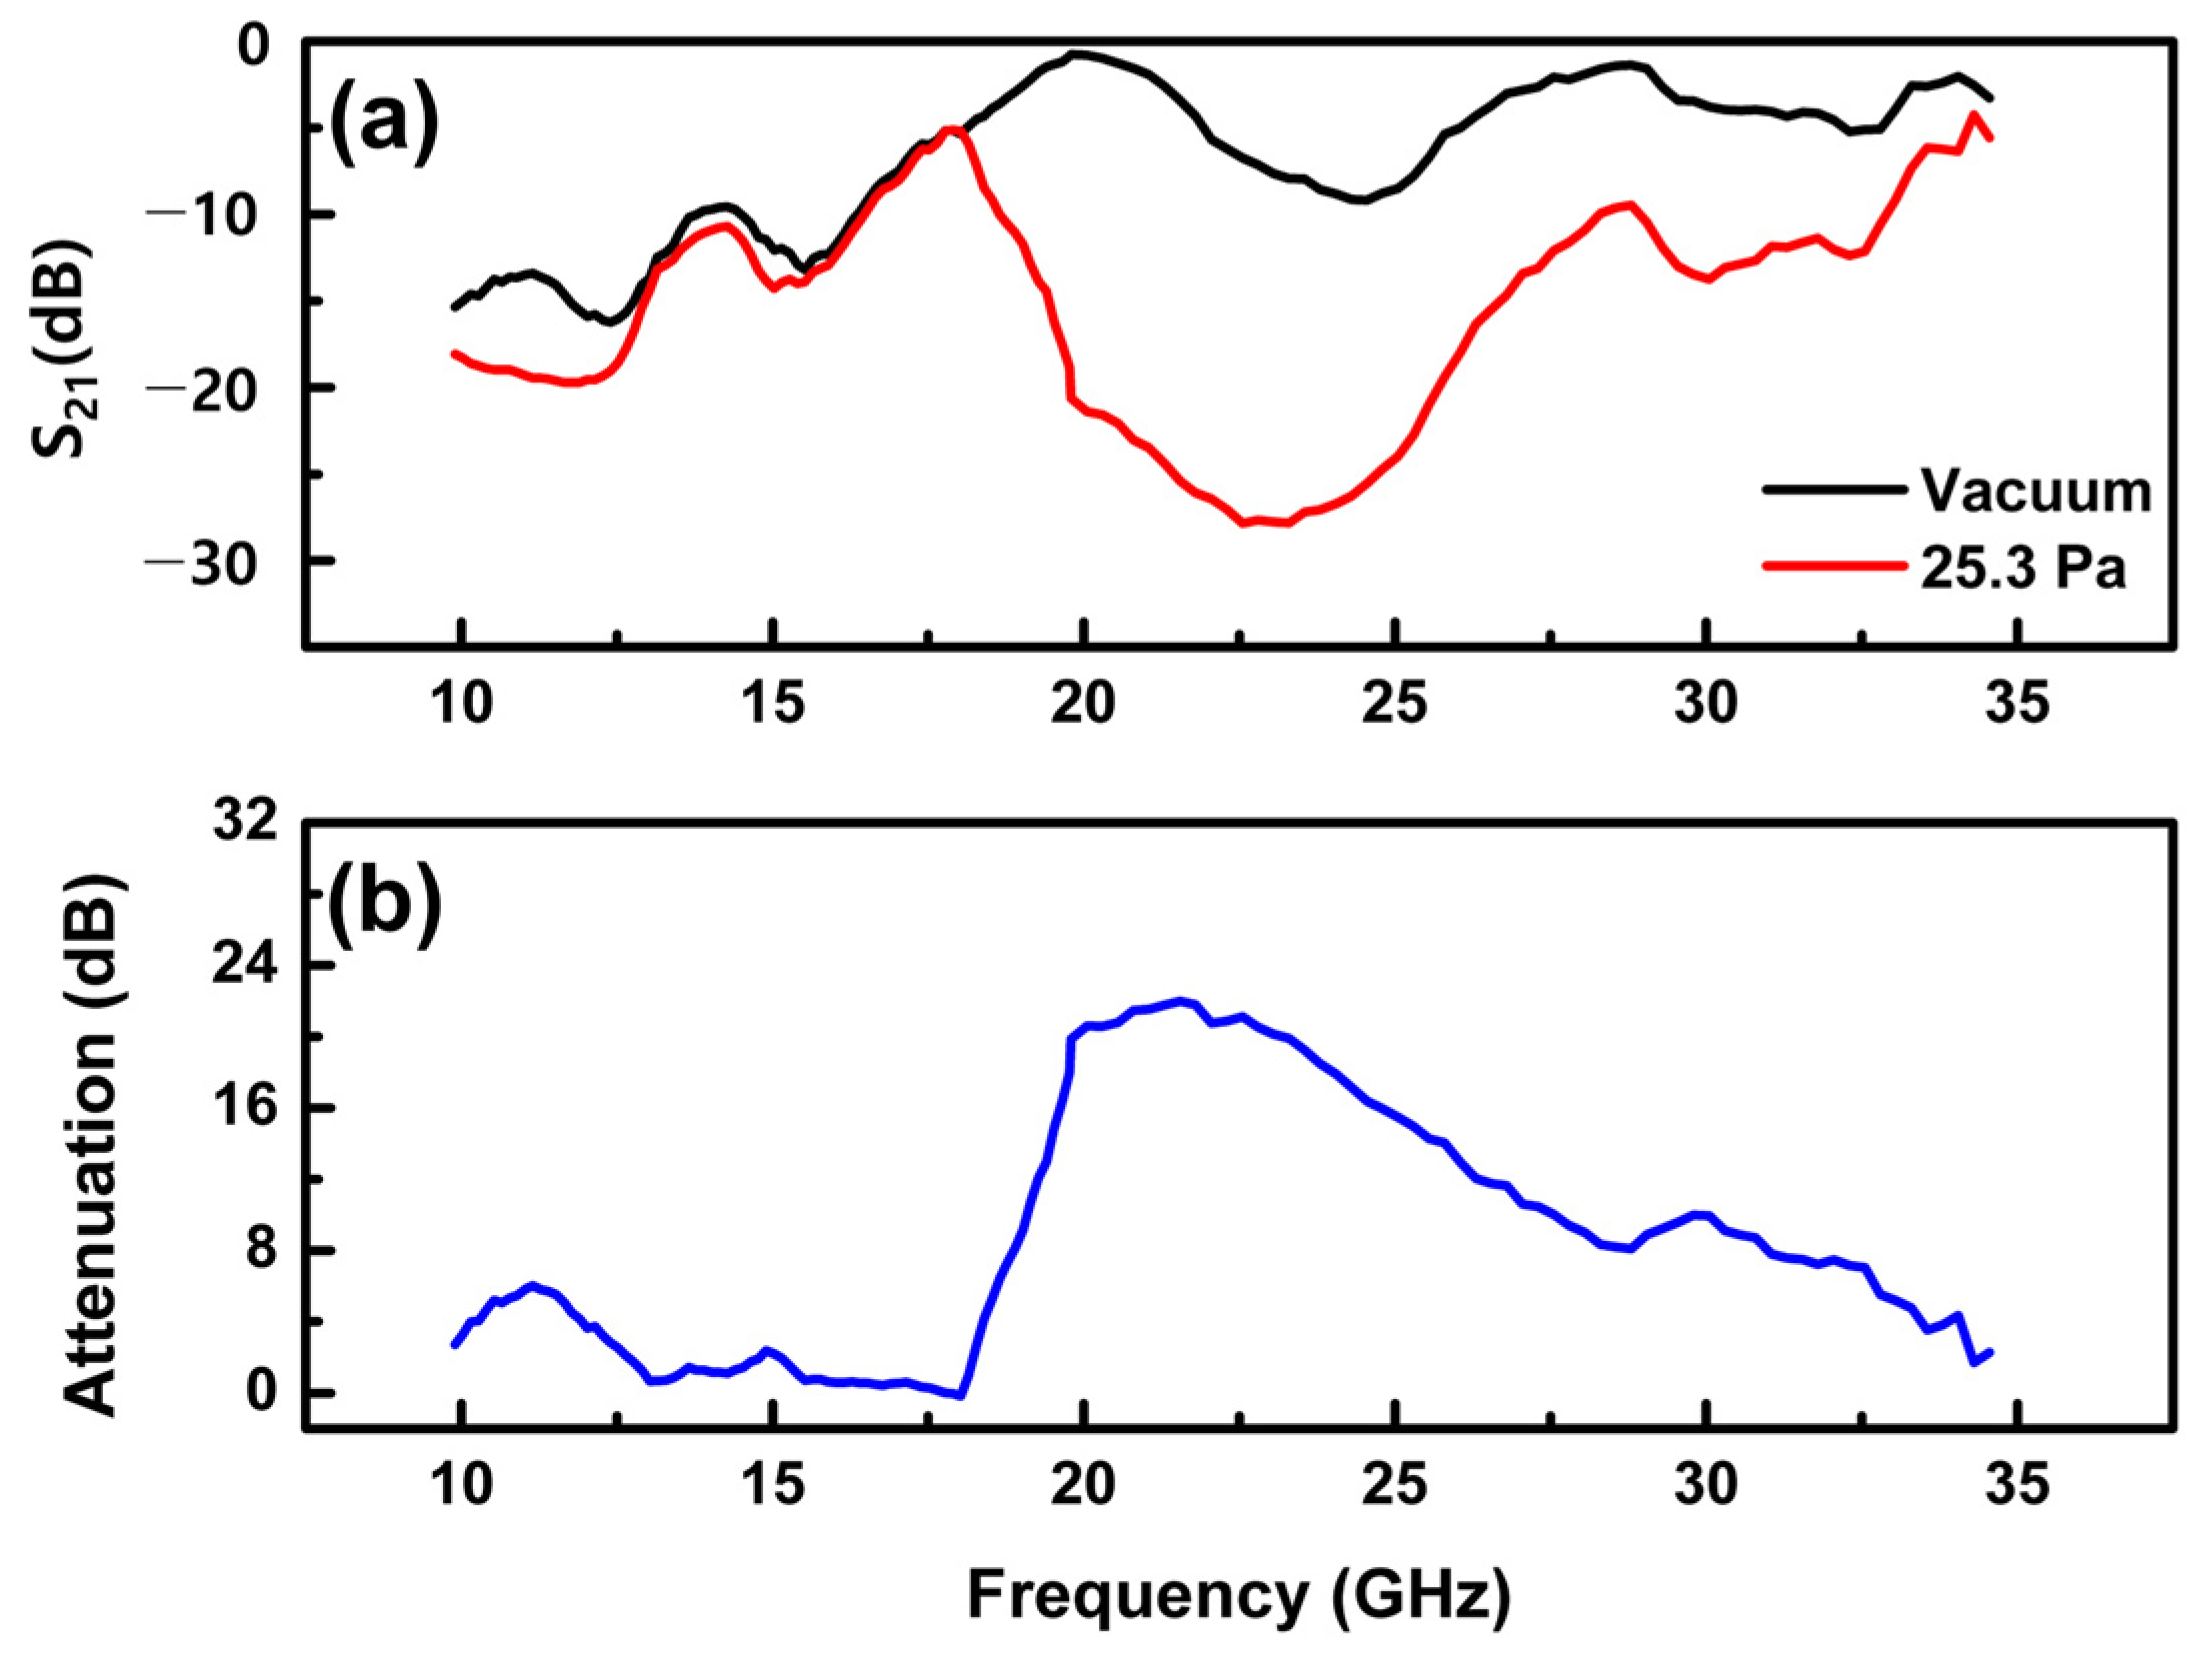
Figure 5 shows the interferometry results. In
Figure 5a, the value of the
S21 parameter is plotted before and after plasma discharge at 25.3 Pa pressure. The
S21 parameter, defined in Equation (7), is an index that quantitatively indicates the extent to which electromagnetic waves pass through a medium.
where
V′ is the voltage of the electromagnetic wave passing through the plasma medium.
The voltage after the intermediate frequency component of the electromagnetic wave that passes through the plasma medium and the RMS-to-DC converter is defined as
V3 (
Figure 3). Therefore, because
V′ is equal to
V3, the output can be expressed as a voltage ratio, as in Equation (8). As shown in
Figure 5a, it is difficult to confirm the attenuation of the electromagnetic wave in the plasma medium by analyzing the
S21 parameter. Therefore, the attenuation was defined as the value obtained by subtracting the value of
S21 (measured in the presence of plasma) from the value of
S21 before plasma discharge. The calculated attenuation is plotted in
Figure 5b. This is because the power of the electromagnetic waves passing through the plasma decreases, whereby the value of
S21 also decreases. The results in
Figure 5b confirm that the plasma attenuates the electromagnetic wave at all frequencies. A more accurate analysis of these phenomena is provided in
Section 3 and
Section 4.
3. Results
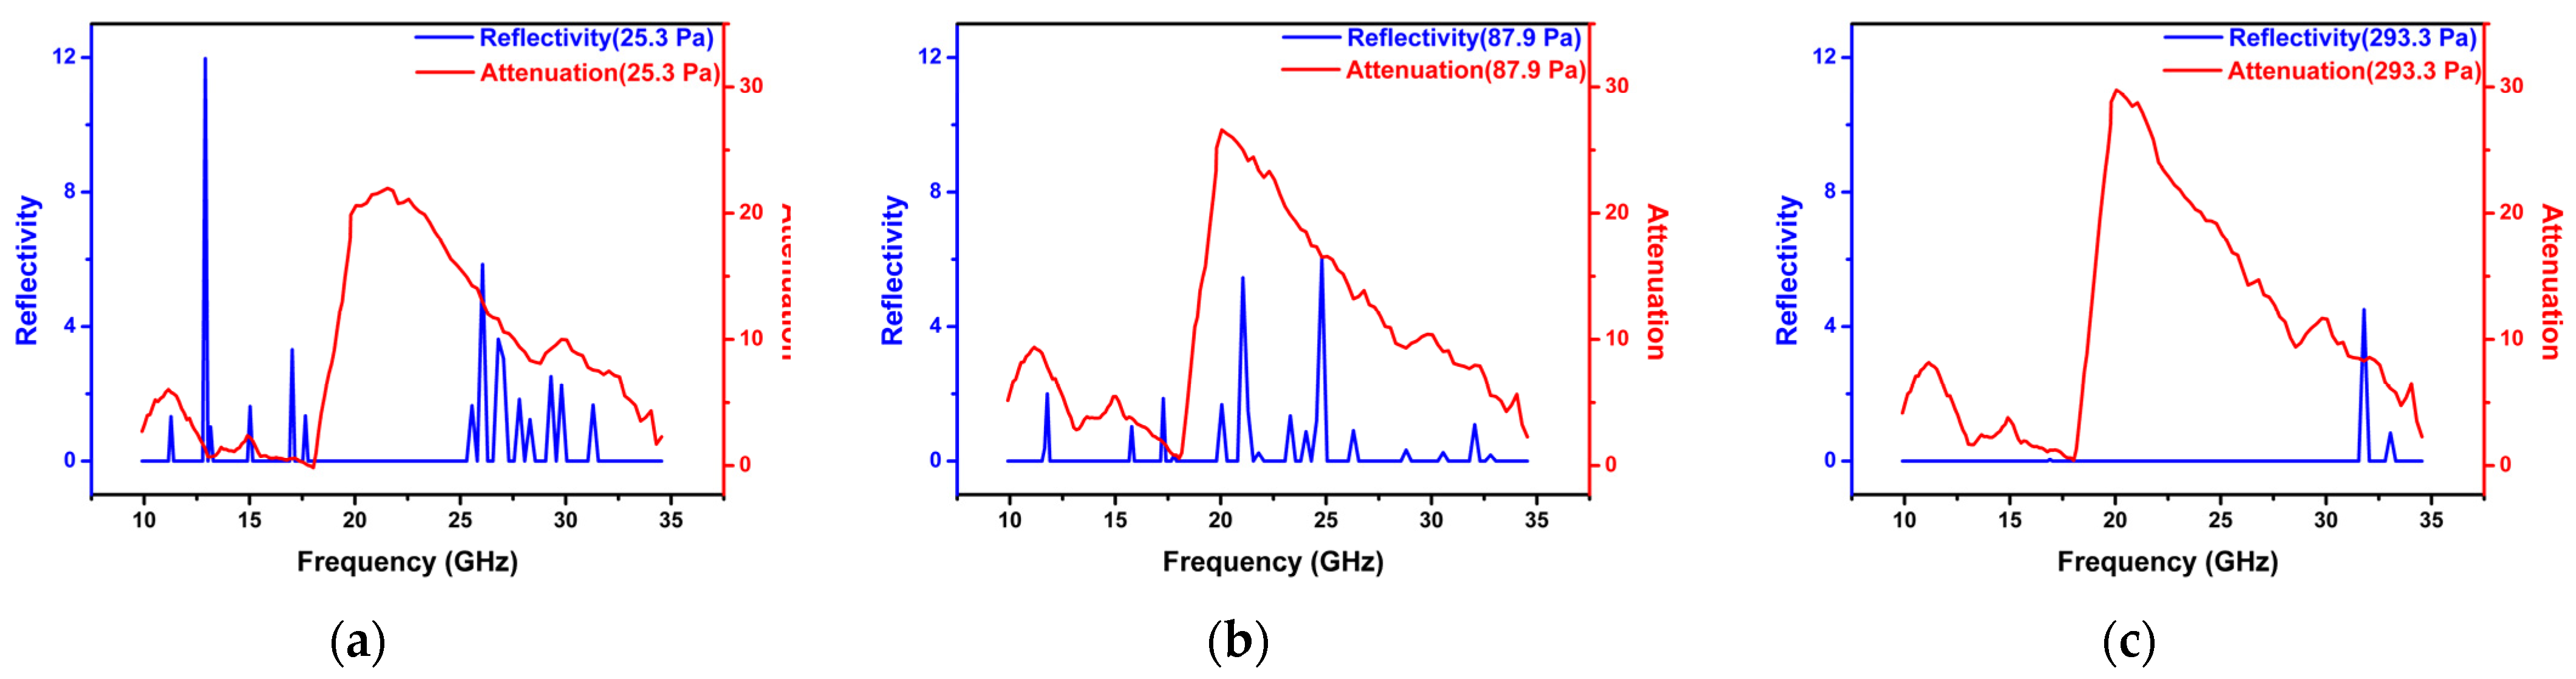
Figure 6 compares the reflectivity measured by reflectometry and the attenuation measured by interferometry as a function of the pressure.
The reflectivity measured by the reflectometer depends on the pressure. Specifically, as the pressure in the vacuum chamber increased, the maximum reflectivity increased. This means that the plasma frequency increased and the plasma density increased. This is because the number of neutral particles that can be ionized increases as the pressure in the vacuum chamber increases [
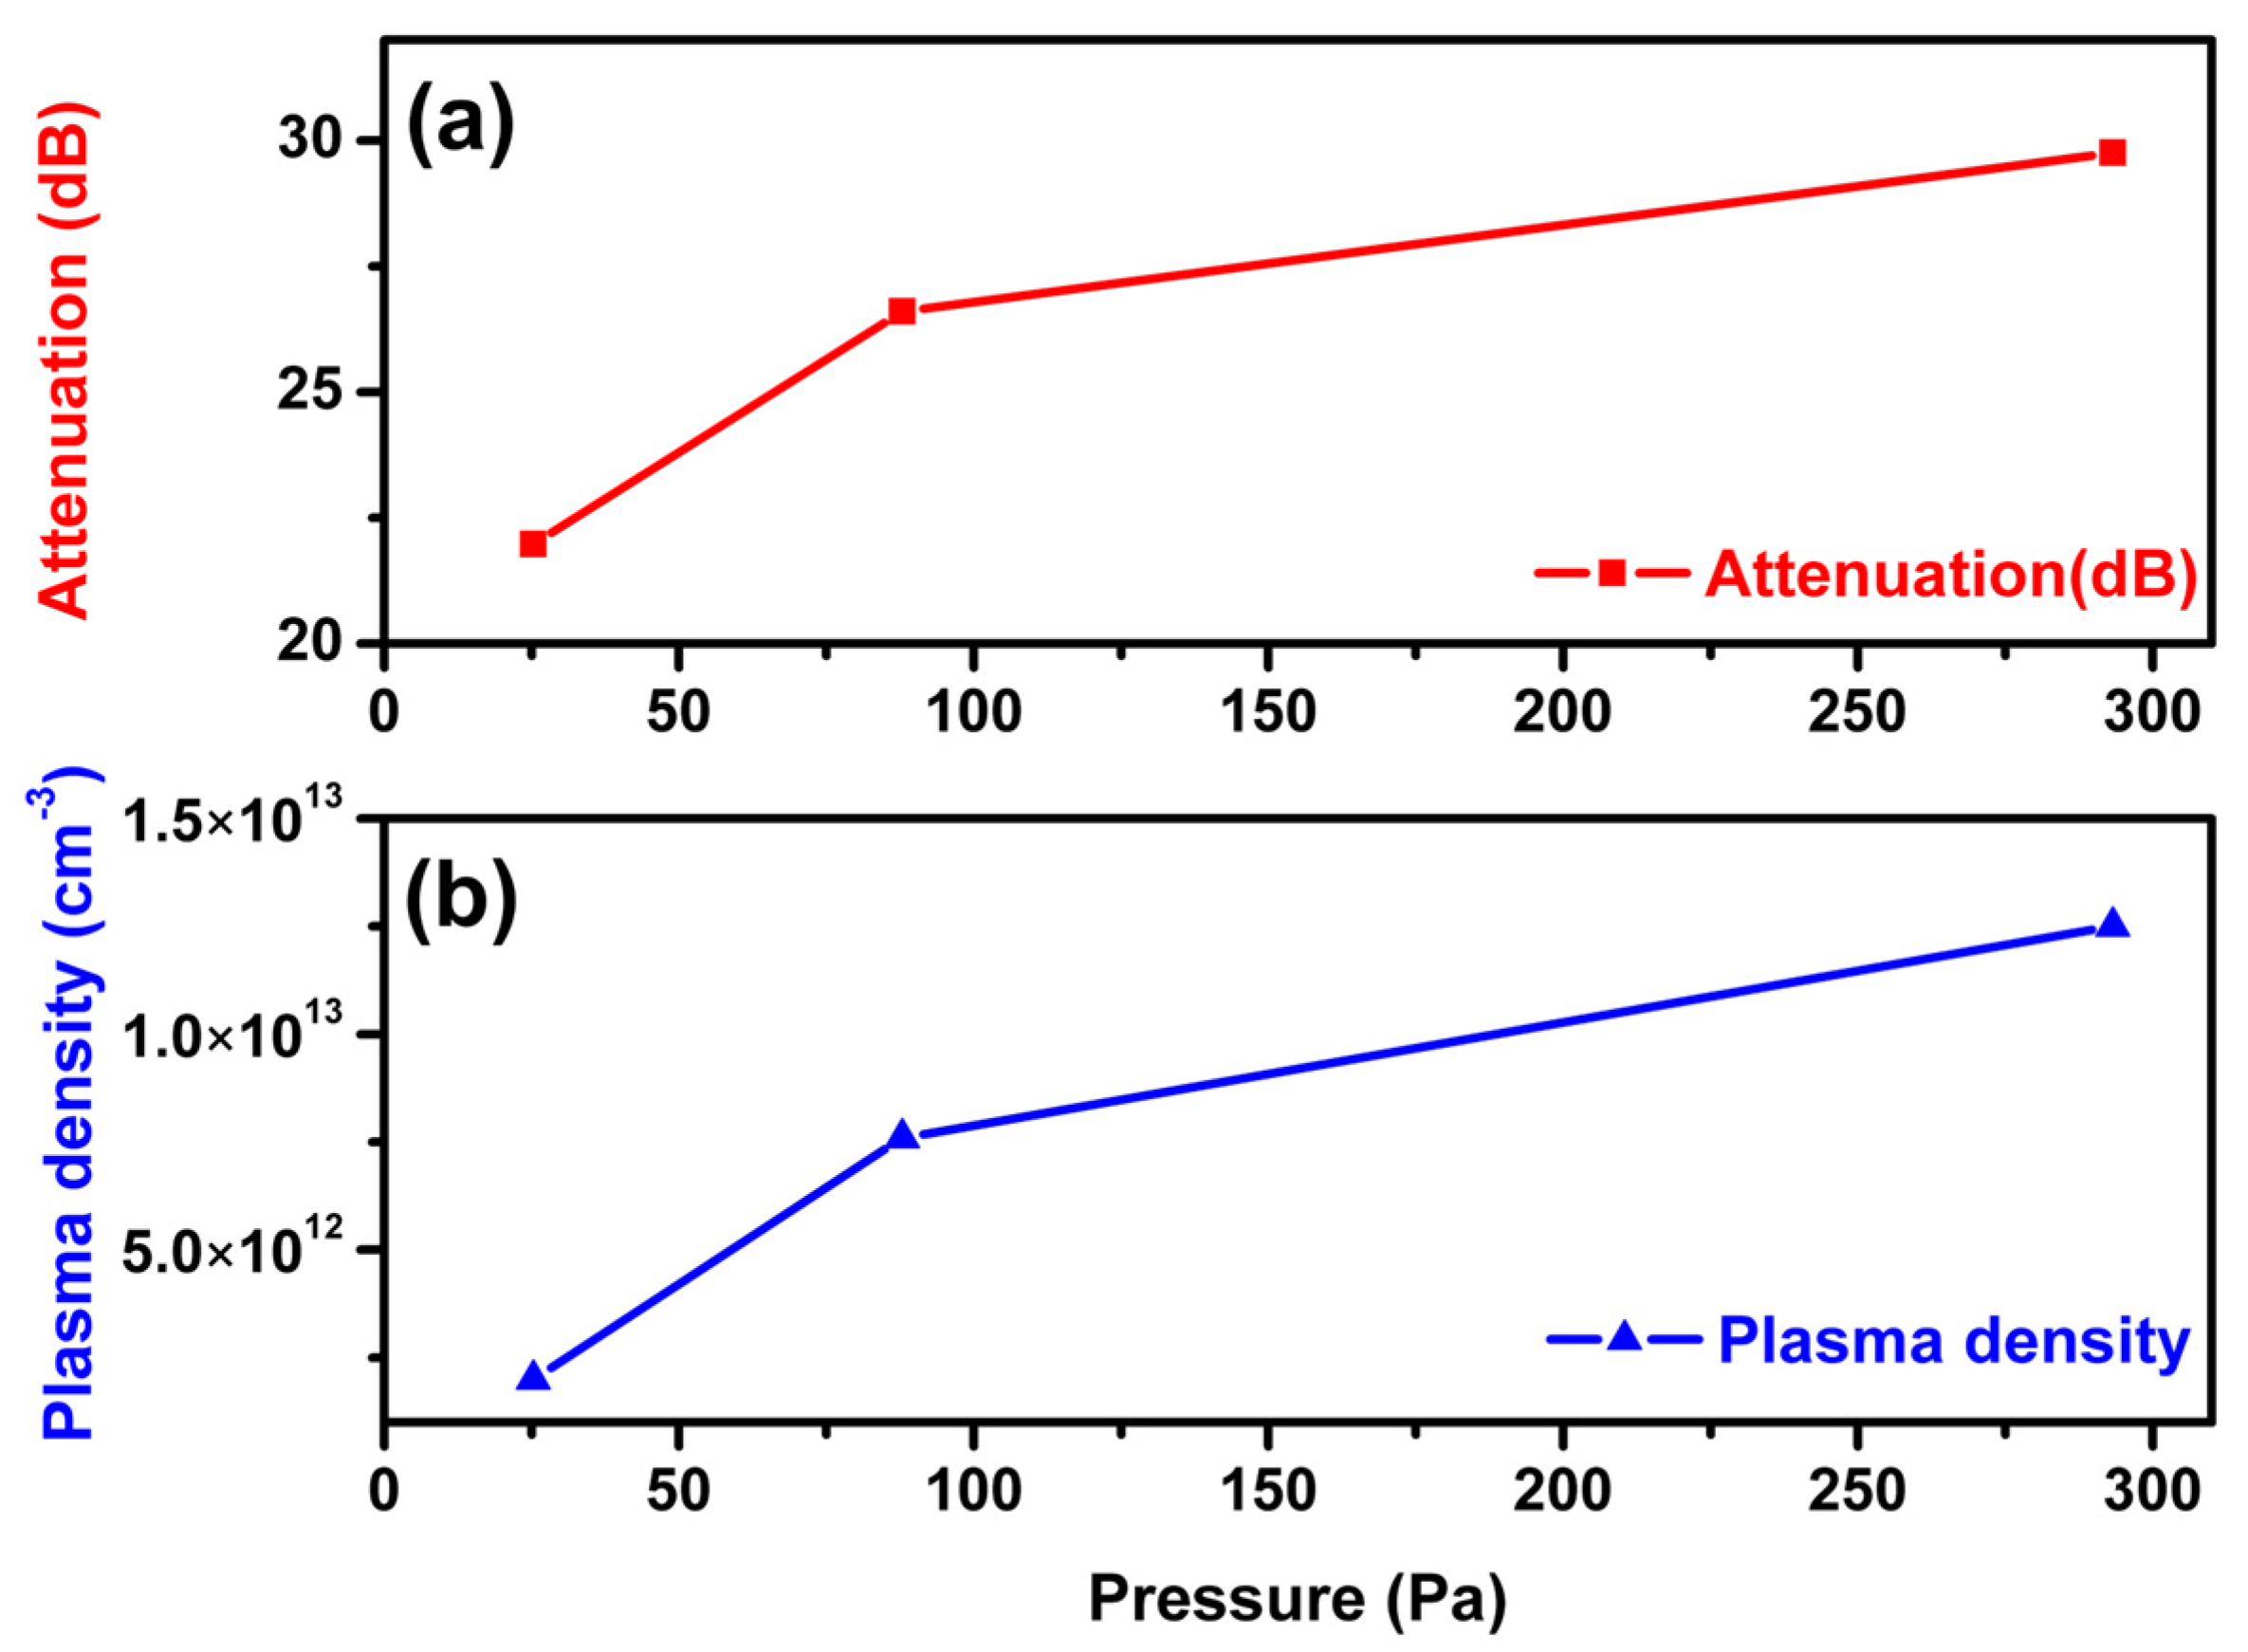
26]. The plasma frequencies were measured as 12.9, 24.8, and 31.8 GHz at 25.3, 87.9, and 293.3 Pa pressure, respectively. The plasma density was calculated using Equation (2). The calculated plasma densities at 25.3, 87.9, and 293.3 Pa are 2.05 × 10
12, 7.59 × 10
12, and 1.25 × 10
13 cm
−3, respectively; these values are plotted in
Figure 7b. These results are similar to the density of the reentry plasma measured by NASA [
4,
5,
6].
The attenuation measured by interferometry also depends on the applied pressure. In particular, the maximum attenuation value increases as the pressure in the vacuum chamber increases. In comparison with the results obtained with reflectometry, these results can be interpreted to mean that the attenuation of the electromagnetic waves increases as the plasma frequency increases. The fact that the electromagnetic waves are attenuated means that detection using radar on the ground is prevented, and it also means that blackouts occur, during which the communication frequency with the ground is also blocked. The maximum attenuation values were 21.9, 26.9, and 29.7 dB at 25.3, 87.9, and 293.3 Pa pressure, respectively. The results are graphically presented in
Figure 7b. This dependency can be confirmed using Equation (6) because the attenuation constant
α has a proportional relationship with the plasma frequency.
The correlation between the plasma density and the attenuation of electromagnetic waves in the plasma medium is shown graphically in
Figure 7. For the reason the same pressure levels were applied to determine the attenuation and plasma density, the pressure variation was assumed to be one, and the slope of each graph was calculated. In the pressure range of 25.3–293.3 Pa, the slope of the attenuation graph was 4.6 and that of the plasma density graph was 5.5. In the pressure range 87.9–293.3 Pa, the slope of the attenuation graph was 3.2 and that of the plasma density graph was 4.9. These calculations confirmed that the variation in the plasma density according to the variation in pressure in the vacuum chamber and the maximum attenuation of the electromagnetic waves in the plasma medium showed almost equal tendencies.
Apart from the above results, the change in minimum attenuation according to the pressure variation was confirmed. At pressures of 25.3, 87.9, and 293.3 Pa, the minimum attenuation was measured to be 0.28 dB, 0.86 dB, and 1.0 dB, respectively. It was confirmed that the minimum attenuation value also increased as the pressure increased.
4. Discussion
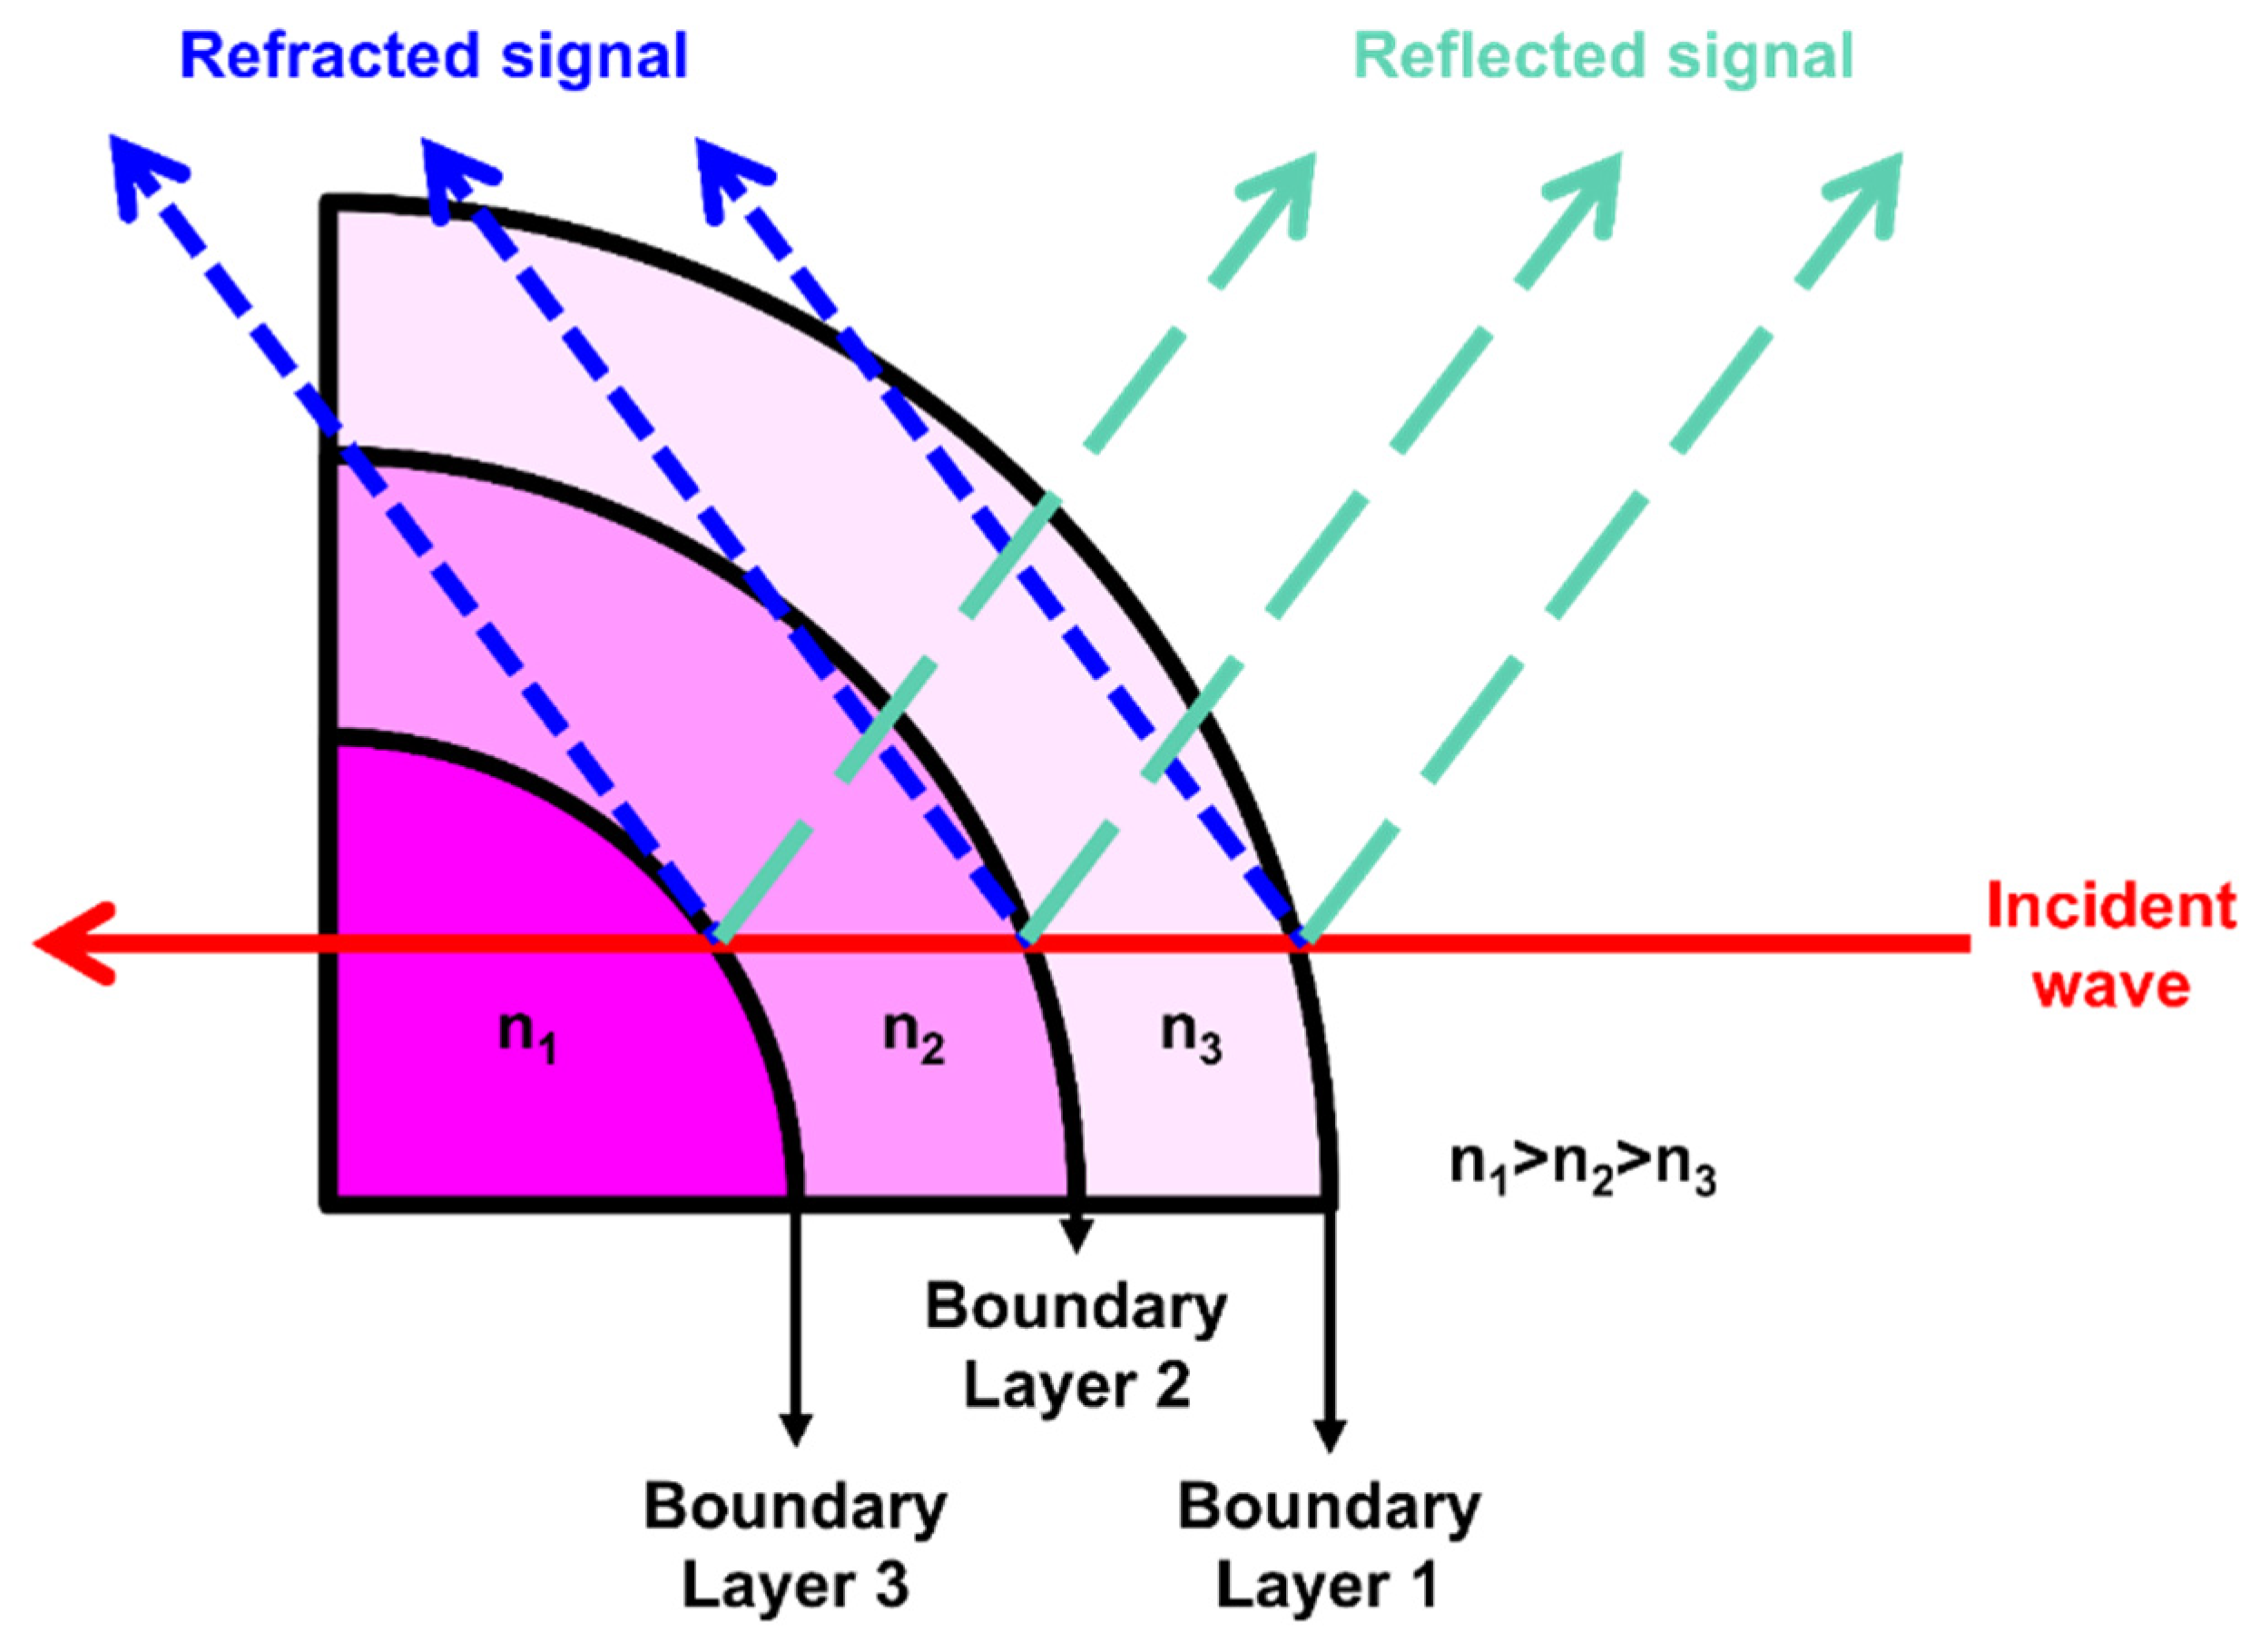
The results obtained through both reflectometry and interferometry were assumed to be due to the formation of dense plasma interfaces as a result of the plasma density distribution, as illustrated in
Figure 8. The plasma density, which is the highest at the center of the tungsten anode, decreases as the distance from the anode increases (n
1 > n
2 > n
3) [
27,
28,
29]. According to Equation (3), the plasma frequency and the refractive index of the plasma are proportional to each other when the angular frequency of the incident wave applied to the plasma is constant at
ω. Therefore, the plasma density distribution gives rise to a difference in the refractive index, and as a result, boundary layers appear continuously. At these boundary layers, the incident waves applied to the plasma undergo reflection and refraction according to Snell’s law and Fresnel’s law [
30,
31,
32]. These signals are indicated using the labels “Refracted signal” and “Reflected signal” in
Figure 8.
4.1. Reflectivity
In terms of the reflectivity determined by reflectometry, as the frequency of the incident wave applied to the plasma increases, it becomes possible to penetrate regions with higher plasma density. This means that wave reflection occurs in more boundary layers, and the reflected power collected by the horn antenna increases. As a result, the reflected power appears to be highest at the point where the plasma density is highest, which is also the point at which the maximum value of the reflectivity is the highest. A more detailed description of this phenomenon appeared previously [
16].
4.2. Attenuation
The reflectometry experiments confirmed that the plasma density increases as the pressure in the vacuum chamber increases. Using Equation (6), the attenuation of electromagnetic waves travelling through the plasma medium was confirmed to increase plasma density. As the electromagnetic wave attenuation α is proportionally related to the plasma angular frequency ωp, the attenuation increases as the plasma density increases. As the attenuation is correlated with the frequency, the attenuation value for the entire frequency range was derived by integrating the graph for each pressure level. The graph integral values at 190, 660, and 2200 mTorr were 219.46, 265.96, and 276.98 dB, respectively. These results indicate that, as the plasma density increases (i.e., the pressure increases), the attenuation of electromagnetic waves increases.
We can also analyze the attenuation graph of the electromagnetic waves at each pressure. The standard deviations σ for the attenuation graphs at 25.3, 87.9, and 293.9 Pa were found to be 6.61, 7.23, and 8.12, respectively. The corresponding standard deviations are those for attenuation from 18 GHz to 25 GHz, which is the frequency range in which the attenuation was the greatest. The standard deviation of the attenuation graph was different for each pressure because the density of the plasma formed in the anode changed as the pressure changed, and this was presumed to be a result of the decrease in the thickness of the plasma sheath. According to the Child-Langmuir law, the thickness of the plasma sheath decreases as the plasma density increases [
32]. However, as the speed of the arc plasma exceeded supersonic speed, the speed at which the ions in the plasma sheath expanded was faster than the Bohm velocity. Therefore, the expression related to the thickness of the plasma sheath to which the supersonic environment was applied can be formulated as follows [
32,
33]:
where
s(
t) is the dependence of the thickness of the plasma sheath on time,
V(
t) is the voltage applied to the anode for plasma discharge, and
mi is the ionic mass.
The DC voltage that was used in this experiment (40 V) was used as the voltage applied to the anode in Equation (9). Therefore, we substituted a constant that does not depend on time. With respect to the plasma density, the values obtained from the reflectometry experiments were substituted for each pressure. Substitution of the constants in Equation (9) enables an expression for the dependence of the plasma sheath thickness
s(
t) on time to be derived. The plasma sheath was assumed to reach a thickness of 10 cm, which is the distance from the plasma center to the antenna at a pressure of 25.3 Pa. Similarly, the thickness of the plasma sheath at 87.9 Pa and 293.3 Pa was calculated to be 8.8 cm and 6.9 cm, respectively. A decrease in the thickness of the plasma sheath means that the plasma density gradient around the anode becomes steeper as the pressure increases [
32,
33]. Therefore, as the pressure increased, the plasma density formed a steep slope, which means that the region with the highest plasma density became relatively small as the pressure increased. In conclusion, as the pressure in the vacuum chamber increased, the plasma density region that attenuated the electromagnetic wave the most decreased in comparison, and thus the standard deviation of the attenuation graph increased.
Another important aspect worthy of discussion is the refraction owing to the plasma density gradient around the anode. The proposed formation of the plasma density gradient in the arc plasma as a result of refraction is schematically illustrated in
Figure 8. The plasma density gradient exhibits a symmetrical parabolic shape with respect to the center of the anode [
27,
28]. Therefore, a boundary layer is formed owing to the difference in plasma density, and the refraction of electromagnetic waves at the interface occurs according to Fresnel’s law. This is similar to the known tendency of the density of the reentry plasma to decrease as the distance from the surface of the reentry vehicle increases [
4,
5,
6]. Assume that the central plasma density was
n1, the plasma density that decreased as the distance increased was
n1 and
n2, and the electromagnetic wave travelling through the plasma was assumed to be an incident wave. Under the above assumption, the incident wave travelled through a total of three boundary layers while travelling through the plasma, and thus the electromagnetic wave undergoes refraction. The electromagnetic waves refracted at the interface are defined as refracted signals. The refraction of electromagnetic waves at the boundary layer is associated with different refractive indices, as defined by Snell’s and Fresnel’s laws. Equation (3) confirms that the refractive index of the plasma is related to the plasma density. The formation of the plasma density gradient in the arc plasma could therefore be considered to have been caused by electromagnetic wave refraction. As a result, it can be inferred that information on the plasma frequency did not appear when the plasma characteristics were measured using interferometry, owing to the refraction of electromagnetic waves at the boundary layer.
5. Conclusions
Reentry plasma with high-temperature, high-speed, and high-density characteristics was reproduced on a laboratory scale using the HRAVA method. To reproduce the variation in these characteristics with altitude, the pressure in the vacuum chamber was set to 25.3 Pa (altitude 60 km), 87.9 Pa (altitude 50 km), and 293.3 Pa (altitude 40 km). Among the similarly reproduced reentry plasma characteristics, reflectometry was used to measure the plasma density, and interferometry was used to measure the attenuation characteristics of electromagnetic waves in the plasma medium. Both measurement methods used heterodyne, and the frequency range used was 10 to 35 GHz.
The experimental results can be summarized in two main points. First, it was confirmed that plasma discharged in an extreme environment can be measured by reflectometry. The reflectivity analysis method was introduced to analyze the reflected signal, which enabled the plasma frequency to be determined. The plasma density was confirmed to increase as the pressure in the vacuum chamber increased, which is one of the characteristics of plasma. Second, as the plasma density increased, the electromagnetic wave passing through the plasma medium was confirmed to be attenuated. The theoretical fact that the attenuation constant α of the electromagnetic wave is related to the plasma frequency was verified through the experimental results. Both results could be confirmed by Snell’s and Fresnel’s laws in the boundary layer and the plasma density distribution.
We analyzed the advantages and disadvantages that can be confirmed through the results of this experiment. The advantages were summarized in three main points. First, plasma with high-temperature, high-speed, and high-density characteristics could be discharged at a relatively low price. Through this, it was confirmed that it can be used simply for pre-experiment purposes before experiments in large-scale facilities that require a lot of cost and time, such as plasma wind tunnels. Second, by using a non-invasive measurement method (reflectometry, interferometry), the effect of perturbation in the plasma was minimized and the reliability of the measurement result was secured. Third, the correlation between the plasma density and the electromagnetic wave could be confirmed in real time by using reflectometry and interferometry simultaneously. The disadvantages were also summarized into three major categories. First, plasma parameters other than plasma density could not be measured. Although the experiment was conducted by creating an environment similar to the previous experiment, there are some minor differences, which may be due to changes in plasma parameters. Second, the temperature of the gas injected into the vacuum chamber was different from the atmospheric temperature. The gas temperature of the injected gas in this experiment was room temperature, and the temperature of the actual atmosphere is close to 0 ℃. Third, the actual atmosphere has a nitrogen/oxygen ratio, but only nitrogen gas was used in this experiment. These shortcomings should be supplemented in future experiments.
Although it was possible to measure the density of the reproduced reentry plasma and the attenuation of the electromagnetic waves, an important result in the actual reentry environment would be a method that could mitigate the attenuation of electromagnetic waves. Possible approaches to mitigate electromagnetic wave attenuation would be to form a magnetic field near the measurement antenna or inject an electrophilic material into the plasma. In the near future, we plan to conduct research on mitigating the attenuation of electromagnetic waves passing through the plasma medium using the aforementioned approaches.
Author Contributions
Conceptualization, G.-W.S., Y.-S.P. and G.-C.K.; methodology, W.-J.K., H.-T.K. and J.-H.K. (Jae-Hyeon Kim); validation, S.-H.L. and J.-H.K. (Ji-Hwan Kim); formal analysis, W.-J.K. and I.-Y.B.; investigation, I.-Y.B., J.-H.K. (Ji-Hwan Kim), Y.-S.P.; data curation, I.-Y.B. and S.-H.L.; writing—original draft preparation, G.-W.S.; writing—review and editing, G.-W.S.; supervision, G.-C.K. All authors have read and agreed to the published version of the manuscript.
Funding
This research was supported by National R&D Program through the National Research Foundation of Korea (NRF) funded by Ministry of Science and ICT (2019M3F6A1112429) and This research was supported by the MOTIE (Ministry of Trade, Industry & Energy) (1415179121) and KSRC (Korea Semiconductor Research Consortium) (20010723) support program for the development of the future semiconductor device. The present Research has been conducted by the Research Grant of Kwangwoon University in 2022.
Data Availability Statement
Data available on reasonable request.
Conflicts of Interest
The authors declare no conflict of interest.
References
- Rybak, J.; James, P. Causes, Effects and Diagnostic Measurements of the Reentry Plasma Sheath; DTIC Report No. AD0718428; Department of Electrical Engineering in Colorado State University: Fort Collins, CO, USA, 1970; Available online: https://apps.dtic.mil/sti/citations/AD0718428 (accessed on 10 December 2022).
- Marini, J.W. On the Decrease of the Radar Cross Section of the Apollo Command Module Due to Reentry Plasma Effects; NASA Report No.19670020821; NASA Goddard Space Flight Center Greenbelt: Greenbelt, MD, USA, 1967. Available online: https://ntrs.nasa.gov/api/citations/19670020821/downloads/19670020821.pdf, (accessed on 10 December 2022).
- Hartunian, R.A.; Stewart, G.E.; Fergason, S.D.; Curtiss, T.J.; Seibold, R.W. Causes and Mitigation of Radio Frequency (RF) Blackout during Reentry of Reusable Launch Vehicles; Aerospace Report No. ATR-2007 (5309)-1; Aerospace Corporation: El Segundo, CA, USA, 2007. Available online: https://rosap.ntl.bts.gov/view/dot/12493 (accessed on 10 December 2022).
- Grantham, W.L. Flight Results of a 25000-Foot-Per-Second Reentry Experiment Using Microwave Reflectometers to Measure Plasma Electron Density and Standoff Distance; NASA Technical Note No. 19710004000; NASA Langley Research Center Hampton: Hampton, VA, USA, 1970. Available online: https://core.ac.uk/download/pdf/80653954.pdf (accessed on 10 December 2022).
- Huber, P.W. Hypersonic Shock-Heated Flow Parameters for Velocities to 46,000 Feet Per Second and Altitudes to 323,000 Feet; NASA Technical Report No. 19640014678; NASA Langley Research Center Hampton: Hampton, VA, USA, 1963. Available online: https://ntrs.nasa.gov/api/citations/19640014678/downloads/19640014678.pdf (accessed on 10 December 2022).
- Huber, P.W. Relation between Reentry Plasma Knowledge and Flight Data; NASA Report No.19680003882; NASA Langley Research Center Hampton: Hampton, VA, USA, 1967. Available online: https://ntrs.nasa.gov/api/citations/19680003882/downloads/19680003882.pdf (accessed on 10 December 2022).
- Yang, X.; Yuan, K.; Wang, Y.; Liu, Y.; Xiong, J. Propagation Characteristics of Modulated EHF Signal in the Wake Region of Plasma Sheath. Aerospace 2022, 9, 194. [Google Scholar] [CrossRef]
- Morabito, D.D. The Spacecraft Communications Blackout Problem Encountered during Passage or Entry of Planetary Atmospheres; IPN Progress Report; California Institute of Technology: Pasadena, CA, USA, 2002; pp. 42–150. Available online: https://ipnpr.jpl.nasa.gov/progress_report/42-150/150C.pdf (accessed on 10 December 2022).
- Takasawa, H.; Takahashi, Y.; Oshima, N.; Kihara, H. Experimental demonstration and mechanism of mitigating reentry blackout via surface catalysis effects. J. Phys. Appl. Phys. 2021, 54, 225201. [Google Scholar] [CrossRef]
- Miyashita, T.; Takasawa, H.; Takahashi, Y.; Oshima, N.; Steffens, L.; Esser, B.; Guelhan, A. Numerical Study on Mitigation of Reentry Blackout by Effects of Air-film. In Proceedings of the AIAA 2022-2150. AIAA SCITECH 2022 Forum, San Diego, CA, USA, 4–6 October 2016. [Google Scholar]
- Steffens, L.; Koch, U.; Esser, B.; Gülhan, A. Characterization of weakly ionized argon flows for radio blackout mitigation experiments. EUCASS Proc. Ser. 2017, 9, 335–348. [Google Scholar]
- Plyutto, A.A.; Ryzhkov, V.N.; Kapin, A.T. High speed plasma streams in vacuum arcs. Sov. Phys. JETP 1965, 20, 328–337. [Google Scholar]
- Shashurin, A.; Zhuang, T.; Teel, G.; Keidar, M.; Kundrapu, M.; Loverich, J.; Beillis, I.I.; Raitses, Y. Laboratory modeling of the plasma layer at hypersonic flight. J. Spacecr. Rocket. 2014, 51, 838. [Google Scholar] [CrossRef]
- Yushkov, G.Y.; Anders, A.; Oks, E.M.; Brown, I.G. Ion velocities in vacuum arc plasmas. J. Appl. Phys. 2000, 88, 5618. [Google Scholar] [CrossRef]
- Anders, A.; Yushkov, G.Y. Ion flux from vacuum arc cathode spots in the absence and presence of a magnetic field. J. Appl. Phys. 2002, 91, 4824. [Google Scholar] [CrossRef] [Green Version]
- Shin, G.W. Measurement of re-entry plasma density using microwave reflectometer in laboratory. Rev. Sci. Instrum. 2022, 93, 103521. [Google Scholar] [CrossRef] [PubMed]
- Minzner, R.A.; Pond, H.L.; Champion, K.S.W. The ARDC Model Atmosphere; DTIC Report No. AD0229482, ; Geophysics Research Directorate, Air Force Cambridge Research Center, Air Research and Development Command, US Air Force: Bedford, MA, USA, 1959. [Google Scholar]
- Hutchinson, I.H. Principles of Plasma Diagnostics, 2nd ed.; Cambridge University Press: Cambridge, UK, 2002. [Google Scholar]
- Dumont, R. Waves in Plasmas; Springer Science & Business Media: Berlin/Heidelberg, Germany, 1992.
- Gregoire, D.J.; Santoru, J.; Schumacher, R.W. Electromagnetic-Wave Propagation in Unmagnetized Plasmas; Hughes Research Labs: Malibu, CA, USA, 1992. [Google Scholar]
- Gerardo, J.B.; Verdeyen, J.T. Plasma refractive index by a laser phase measurement. Appl. Phys. Lett. 1963, 3, 121. [Google Scholar] [CrossRef]
- Sun, B.; Xie, K.; Liu, Y.; Zhang, Y.; Guo, S.; Ma, P. Experimental Investigation of the Dynamic Effects of Time-Varying Plasma on Low-Frequency Electromagnetic Wave Propagation. 2020. Available online: https://www.techrxiv.org/articles/preprint/Experimental_Investigation_of_the_Dynamic_Effects_of_Time-Varying_Plasma_on_Low-Frequency_Electromagnetic_Wave_Propagation/13371197 (accessed on 10 December 2022).
- Shi, L.; Zhao, L.; Yao, B.; Li, X. Telemetry channel capacity assessment for reentry vehicles in plasma sheath environment. Plasma Sci. Technol. 2015, 17, 1006. [Google Scholar] [CrossRef] [Green Version]
- In, S.R. Consideration on the Electromagnetic Wave Absorption Properties of the Plasma for the Stealth Technology. Appl. Sci. Converg. Technol. 2008, 17, 501–510. [Google Scholar] [CrossRef]
- Nazikian, R.; Kramer, G.J.; Valeo, E. A tutorial on the basic principles of microwave reflectometry applied to fluctuation measurements in fusion plasmas. Phys. Plasmas 2001, 8, 1840. [Google Scholar] [CrossRef]
- Kaganovich, D.; Hafizi, B.; Palastro, J.P.; Ting, A.; Helle, M.H.; Chen, Y.-H.; Jones, T.G.; Gordon, D.F. Nonlinear frequency shift in Raman backscattering and its implications for plasma diagnostics. Phys. Plasmas 2016, 23, 123104. [Google Scholar] [CrossRef] [Green Version]
- Beilis, I.I.; Keidar, M.; Boxman, R.L.; Goldsmith, S. Interelectrode plasma parameters and plasma deposition in a hot refractory anode vacuum arc. Phys. Plasmas 2000, 7, 3068. [Google Scholar] [CrossRef]
- Beilis, I.I.; Goldsmith, S.; Boxman, R.L. Interelectrode plasma evolution in a hot refractory anode vacuum arc: Theory and comparison with experiment. Phys. Plasmas 2002, 9, 3159. [Google Scholar] [CrossRef]
- Beilis, I.I.; Boxman, R.L.; Goldsmith, S. Radially expanding plasma parameters in a hot refractory anode vacuum arc. J. Appl. Phys. 2000, 88, 6224–6231. [Google Scholar] [CrossRef]
- Lvovsky, A.I. Fresnel equations. In Encyclopedia of Optical Engineering, 2nd ed.; Hoffman, C., Driggers, R., Eds.; CRC Press: Boca Raton, FL, USA, 2013; p. 4088. [Google Scholar]
- Anicin, B.A. Electron density profiles in cylindrical plasmas from microwave refraction data. Radio Sci. J. Res. 1965, 69, 721. [Google Scholar] [CrossRef]
- Filho, G.P.; Neto, A.B.G.; Maciel, H.S.; Pessoa, R.S. Studies of the cathode sheath of a low-pressure hollow cathode discharge. J. Phys. Conf. Ser. 2012, 370, 012041. [Google Scholar]
- Sarrailh, P.; Garrigues, L.; Hagelaar, G.J.M.; Sandolache, G.; Rowe, S.; Jusselin, B.; Boeuf, J.P. Expanding sheath in a bounded plasma in the context of the post-arc phase of a vacuum arc. J. Appl. Phys. 2007, 41, 015203. [Google Scholar] [CrossRef]
| Disclaimer/Publisher’s Note: The statements, opinions and data contained in all publications are solely those of the individual author(s) and contributor(s) and not of MDPI and/or the editor(s). MDPI and/or the editor(s) disclaim responsibility for any injury to people or property resulting from any ideas, methods, instructions or products referred to in the content. |
© 2023 by the authors. Licensee MDPI, Basel, Switzerland. This article is an open access article distributed under the terms and conditions of the Creative Commons Attribution (CC BY) license (https://creativecommons.org/licenses/by/4.0/).

 ,
, 


