1. Introduction
Vibration performance has always been the main aspect of evaluating the quality of machinery and equipment. Especially with the improvement of social productivity, the performance of various machinery and equipment has shown a trend of high speed, light weight and heavy load. Therefore, engineers need to continuously solve the problems of vibration control [
1,
2,
3,
4]. When the actual vibration mechanism is too complex, the transfer path analysis method (TPA) can be used to easily separate the source excitations from the structure/acoustic transmission characteristics, allowing engineers to eliminate the main path of vibration transmission, and then anticipate by making changes to either the source itself or the receiving structures that are connected to it [
5]. Because of its convenient characteristics, TPA technology has been widely used in recent years. Based on the specific analysis of the transfer path in the vibration system, dynamic optimization technology can be guaranteed in the early stage of system design [
6,
7,
8].
The traditional transfer path analysis method (TPA) is mainly based on the method of testing. It divides the mechanical system into three parts: the source, the transfer path, and the receiving end. The transfer function matrix between the source and the receiving end is obtained by isolating the vibration source, and then the source–path contribution information of the receiving end can be analyzed [
9,
10,
11]. However, the isolation of the vibration source requires disassembly of the system, which requires a large workload, and the corresponding analysis accuracy is high [
5,
12].
In recent years, on the basis of traditional transfer path analysis methods, many scholars have done a lot of research to solve practical problems [
1,
5,
13,
14,
15,
16,
17,
18,
19,
20,
21,
22,
23,
24,
25,
26,
27]. In order to solve the problem of dismantling the system, a method of operation transfer path analysis is proposed [
5,
13,
14,
15,
16,
17,
18]. De Sitter, G et al. used finite element simulation data to carry out operational transfer path analysis (OTPA) [
5]. Zhang ZY et al. analyzed the operation transfer path of a heavy commercial truck cab installation system [
13]. Deklerk and Ossipov applied OTPA based on singular value decomposition (SVD) to analyze tire noises [
14]. Reising et al. applied OTPA based on SVD to effectively assess acoustic characteristics of the driven axle in automobiles [
15]. Roozen et al. used a method for determining the number of effective transfer paths based on the singular value decomposition of the response matrix [
16], and singular value decomposition (SVD) and principal component analysis (PCA) have been successfully used by Toome in his study of a source contribution prediction at low frequency [
17] and by Strom in the OTPA of a high-speed train bogie [
18]. Many scholars also analyze the transfer path from the perspective of energy flow [
19,
20,
21,
22,
23,
24]. Han X, et al. proposed an energy-based transfer path analysis method [
19]. Kim and co-workers [
20,
21,
22,
23] studied vibration isolation and structure-borne noise transmission via multiple/multidimensional transfer paths. Ba-Leum K and Yoshida J et al. developed an improved transfer path analysis (MTPA) method to more accurately estimate the force of the main vibration source in a complex system with multiple vibration sources, basic excitations and multiple disturbances [
24,
25,
26]. Lee identified the dominant vibration transfer path by experimentally measuring the multidimensional vibrational power flow through each isolator and obtained a 5 dB reduction in the sound pressure level in a vehicle by modifying the body structure accordingly [
27].
However, most of the existing transfer path analysis methods use displacement, velocity, acceleration or sound pressure as the response for analysis, and rarely take reaction force as the research object. Maarten et al. introduced a method of reaction force transfer path analysis based on the traditional transfer path analysis method [
5]. Wei Zhao et al. proposed the concept of the path transmission ratio, and derived the convenient formulae of reaction force based on the path transfer force analysis and the path disconnected method [
1].
In the transfer path analysis methods of the reaction force introduced in the above documents, the reaction force is calculated by analyzing the response of the transfer path and the receiving end. In actual engineering applications, there are many cases where the force transmitted to the receiving end is used to measure the vibration performance of the system, and the receiving end is often much larger and more complex than the system. At this time, because the various system parameters of the receiving end are difficult to accurately obtain, the accuracy of the results obtained is difficult to guarantee by using the existing reaction force transfer path analysis method. At the same time, due to the complex structure of the receiving end, the amount of calculation in the analysis process is too large.
This article introduces in detail an improved reaction force transfer path analysis method, analyzes the existing reaction force transfer path analysis method, introduces the modal superposition method and the penalty function method, which will affect the support between the transfer path and the receiving end. The problem of solving the reaction force is transformed into a problem of solving the displacement between the two. Taking a satellite refrigeration module as an example, the reaction force between the transfer path and the receiving end is calculated, and the path contribution of the corresponding reaction force is analyzed. By setting up an experimental platform, the reaction force during the actual operation of the refrigeration module was measured and compared with the simulation data to verify the correctness of the proposed analysis method.
2. Theory of Force-Based Transfer Path Analysis
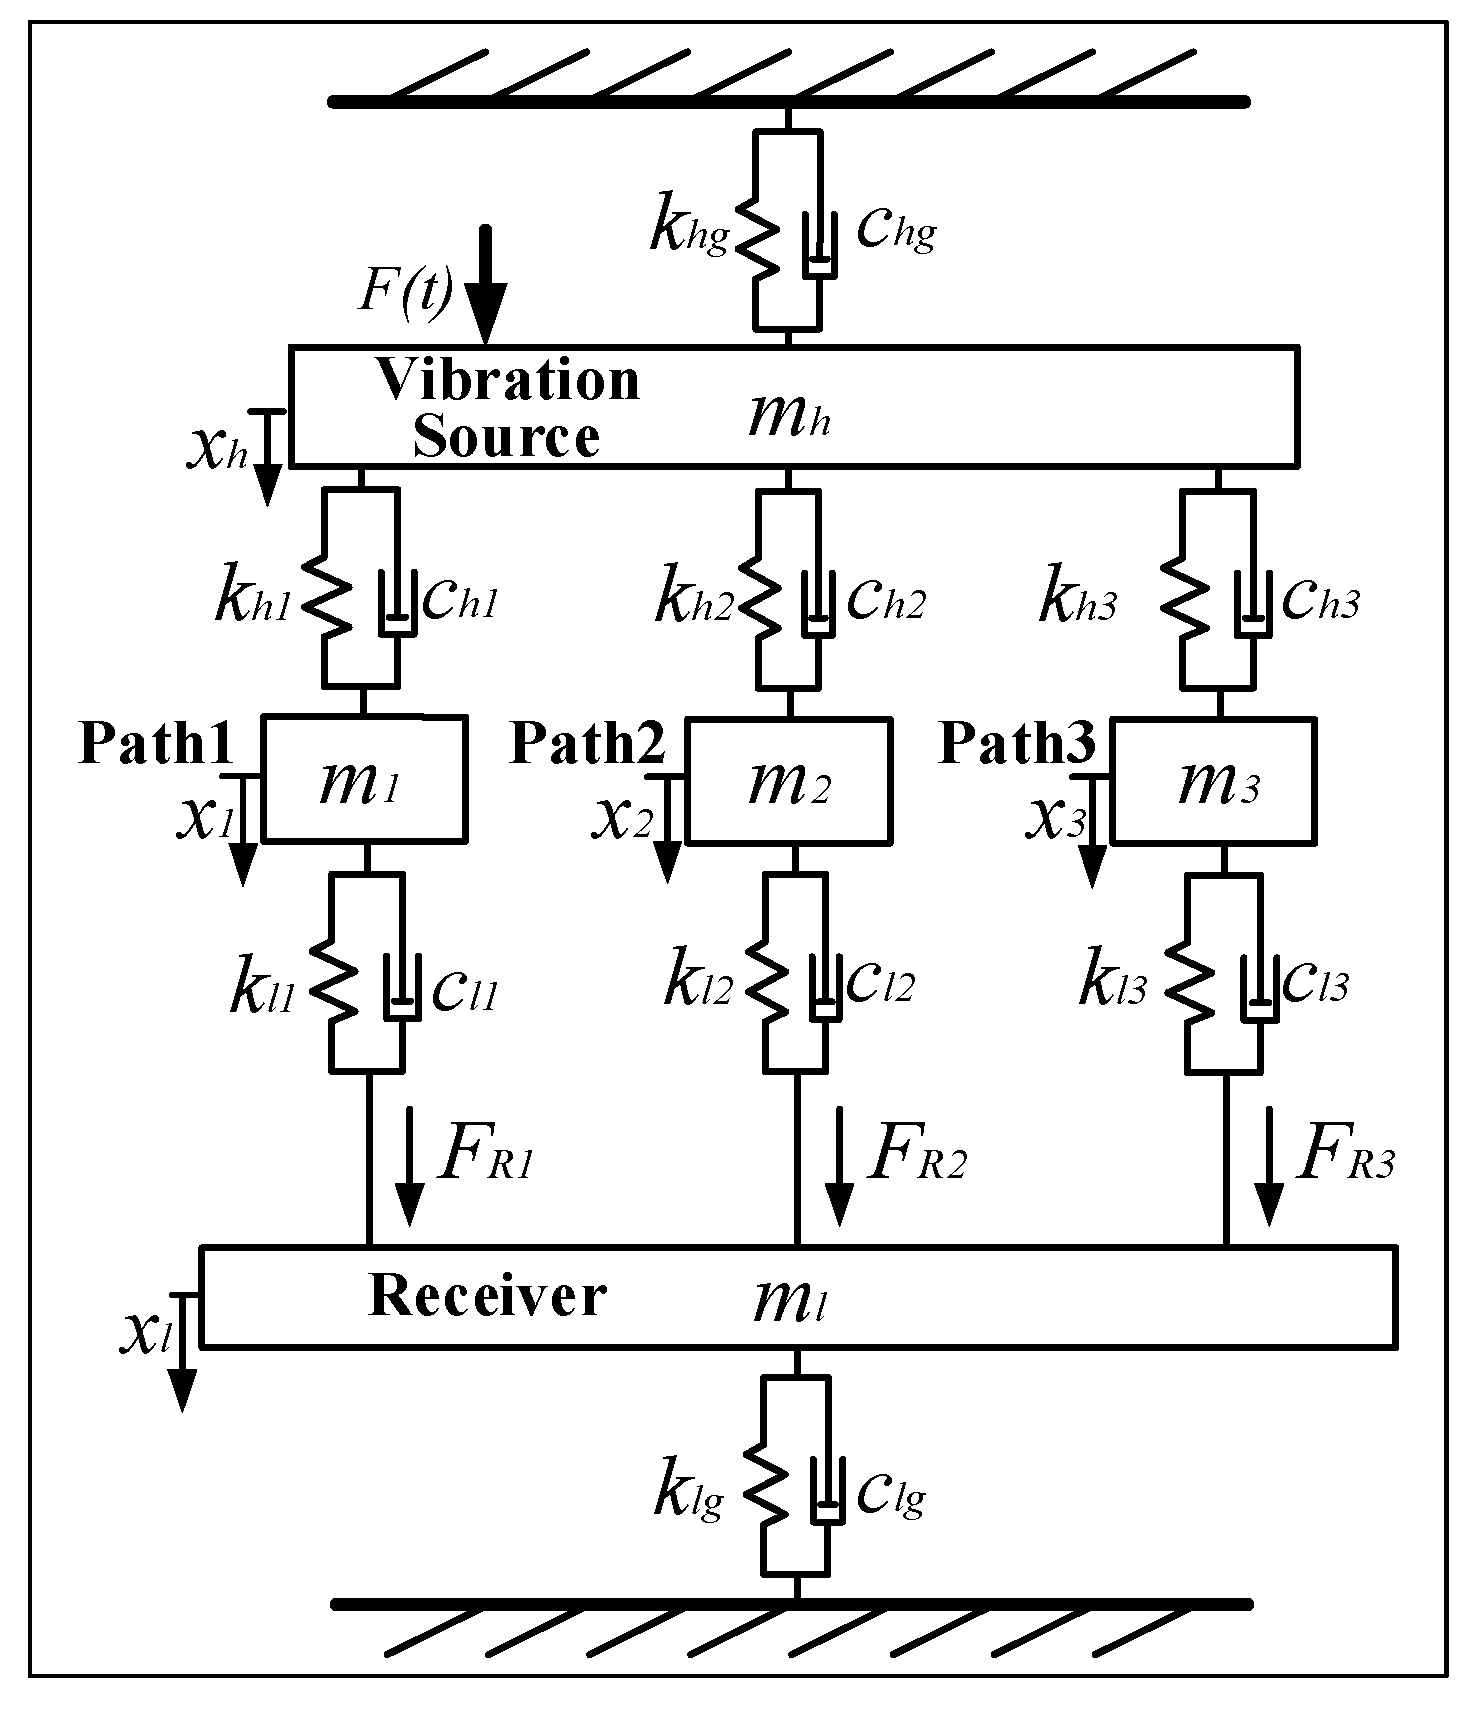
In engineering practice, many mechanical vibration systems have established their own transfer path models. For example, for the vehicle power transmission subsystem, the excitation of the running engine is transmitted to the vehicle body through a three-point suspension, thereby causing the vehicle body to vibrate. Normally, the transfer path model of a classic single-degree-of-freedom vibration system is shown in
Figure 1.
In this system, the effects of stiffness, damping and mass are considered separately. Among them, , , , and are the equivalent masses of the vibration source, path1, path2, path3, and receiving end, respectively. is the equivalent stiffness of the vibration source, and is the equivalent stiffness of the receiver. , , and are the equivalent stiffness between each path and the excitation source; , and are the equivalent stiffness between each path and the receiver. and are the equivalent damping of the vibration source and the receiver respectively. , and are the equivalent damping of each path and vibration source respectively; , and are the equivalent damping of each path and receiver respectively. is the motivation of the system, which can be expressed as . , , , and are the displacements of the excitation end, each path, and the receiver respectively. , and are the reaction forces between each path and the receiver respectively. Among these parameters, , , , , and are all parameters to be solved.
The dynamic differential equation of the vibration system is
where
is the quality matrix of the system;
is the stiffness matrix;
is the damping matrix.
,
and
are the acceleration, velocity and displacement column vectors respectively.
is the column vector of motivation.
In the system of
Figure 1, mass, stiffness and damping are all known parameters, and the excitation force can be directly measured. The displacement, velocity and acceleration values of each position of the system can be obtained by solving the matrix.
The formula for calculating the reaction force between each path and the receiving end is
Then the reaction force transfer function of the system can be expressed as
This analysis method has the following two defects:
(1) This method simplifies the relevant parameters of the system, and equates the mass, stiffness and damping parameters of each part to concentrated mass, concentrated stiffness and concentrated damping. Although this can improve the efficiency of calculation, it is difficult for these parameters to reflect the real boundary conditions of the system in the process of obtaining concentrated mass, concentrated stiffness and concentrated damping. Especially for complex systems, it is easy to get wrong results using this method.
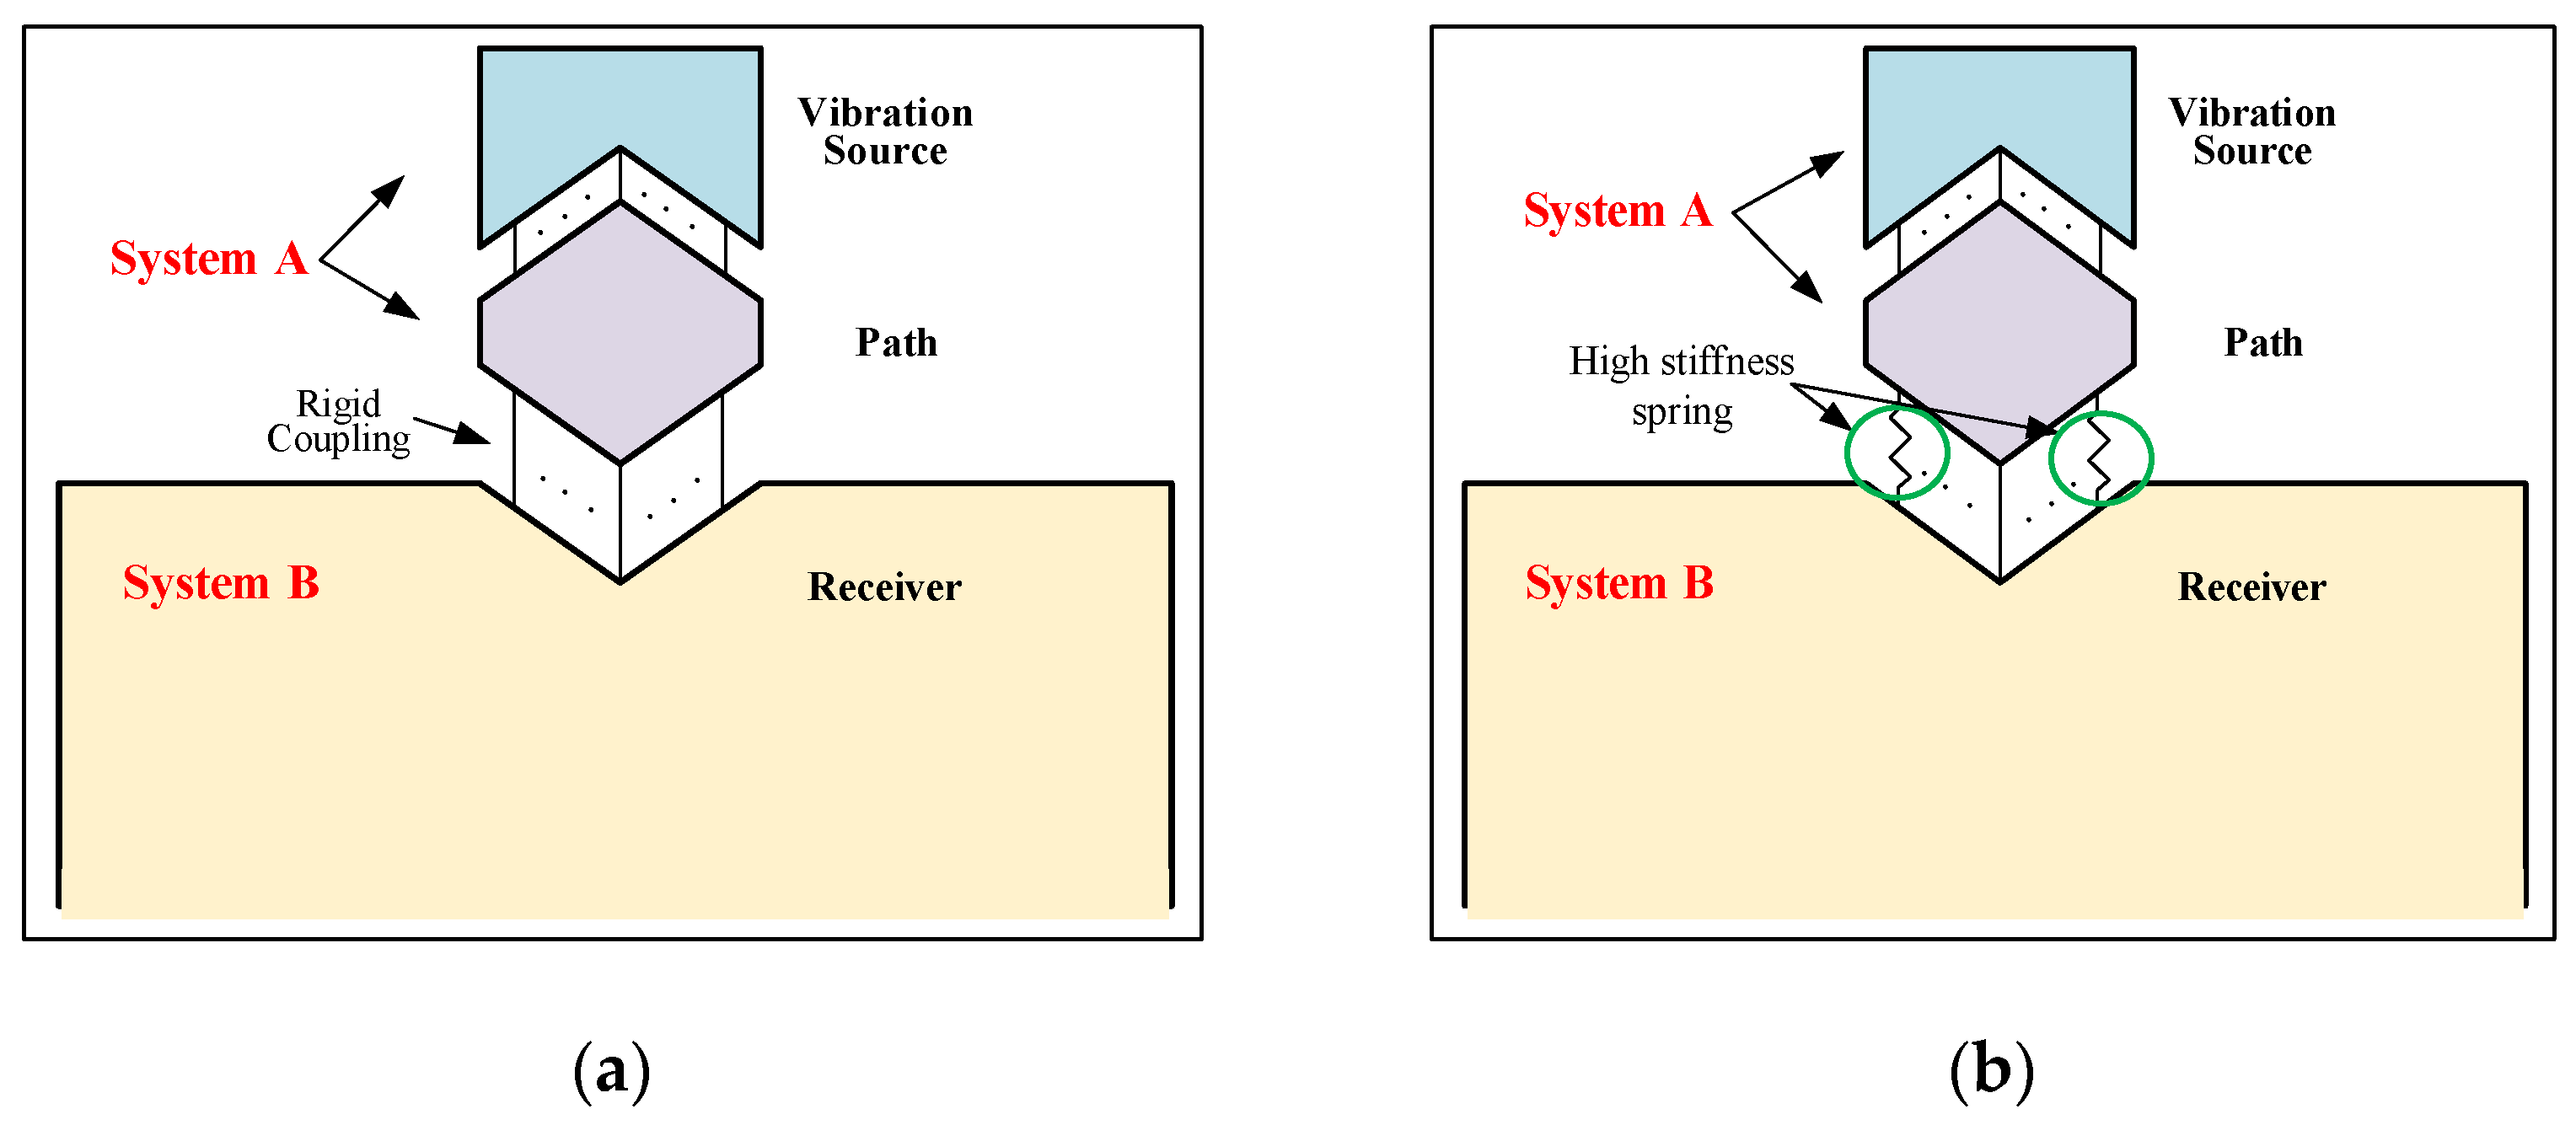
(2) In actual engineering applications, there is a widespread situation in which a system A containing an excitation source is installed on another system B (system B is much larger than system A in terms of scale and complexity), as shown in
Figure 2a. System A includes the excitation source and transfer path, and system B is the receiver. At this time, engineers often use the force of system A on system B as an index to measure the vibration performance of system A. When analyzing the transfer path of the reaction force between the two systems based on the above theory, engineers will spend a lot of energy and time in the process of obtaining the system parameters of system B, and it is difficult to ensure the accuracy of the system parameters of system B.
In engineering practice, in order to improve the efficiency of vibration analysis and ensure the accuracy of the vibration solution, the finite element analysis method is widely used in the early stage of mechanical design.
There are usually two methods to solve the dynamic response of structures by finite element: the modal superposition method and the stepwise integration method. The modal superposition method is widely used due to its high efficiency and high precision.
Combining with the solution of the vibration differential equation, it can be known that the displacement column vector can be expressed as the linear addition of each mode shape.
where
is the
-th mode of the undamped system differential equation
,
is the mode participation factor of the
-th mode, and
is Modal order time.
Equation (4) is substituted into Equation (1) to get Equation (5)
Both sides of Equation (5) are multiplied by
to get Equation (6)
where
is the transpose matrix of the
-th order mode of the differential equation
of the undamped system.
According to the orthogonality of the mode, Equation (7) is obtained.
where
,
and
are the modal mass, modal damping and modal stiffness of the
-th mode of the system, respectively, and
;
and
are proportionality constants.
Equation (6) can be simplified as
The excitation load and response in Equation (8) are expressed in the complex form as Equation (9):
Equation (9) is substituted into Equation (8) to get Equation (10)
Equation (9) and Equation (11) are substituted into Equation (4) to get Equation (12)
Thus, Equation (13) is obtained:
where
is the damping ratio,
, and
is called the critical damping coefficient.
If the system only has an acting force
at point
, Equation (14) is obtained.
Equation (14) is substituted into Equation (13) to get Equation (15)
where
is the mode shape of the
-th degree of freedom of the
-th mode vector.
The response amplitude at point
of the system can be expressed as
where
is the mode shape of the
-th degree of freedom of the
-th mode vector.
If the system is not affected by gravity and there is a branch reaction Force
at point
of the system, then Equation (17) is obtained.
If point
of the system is the constraint point, the penalty function method is adopted, that is, a spring with the stiffness of
is connected at point
(
), as shown in
Figure 2b. Then Equation (18) is obtained.
Because of
, Equation (19) is obtained.
Equation (16) and Equation (19) are combined to obtain Equation (20)
and Equation (21) is obtained.
Equation (21) defines the transfer function of the branch reaction force between the branch reaction force and the incentive force at the output point, which is expressed as
3. Simulation Analysis of Related Examples
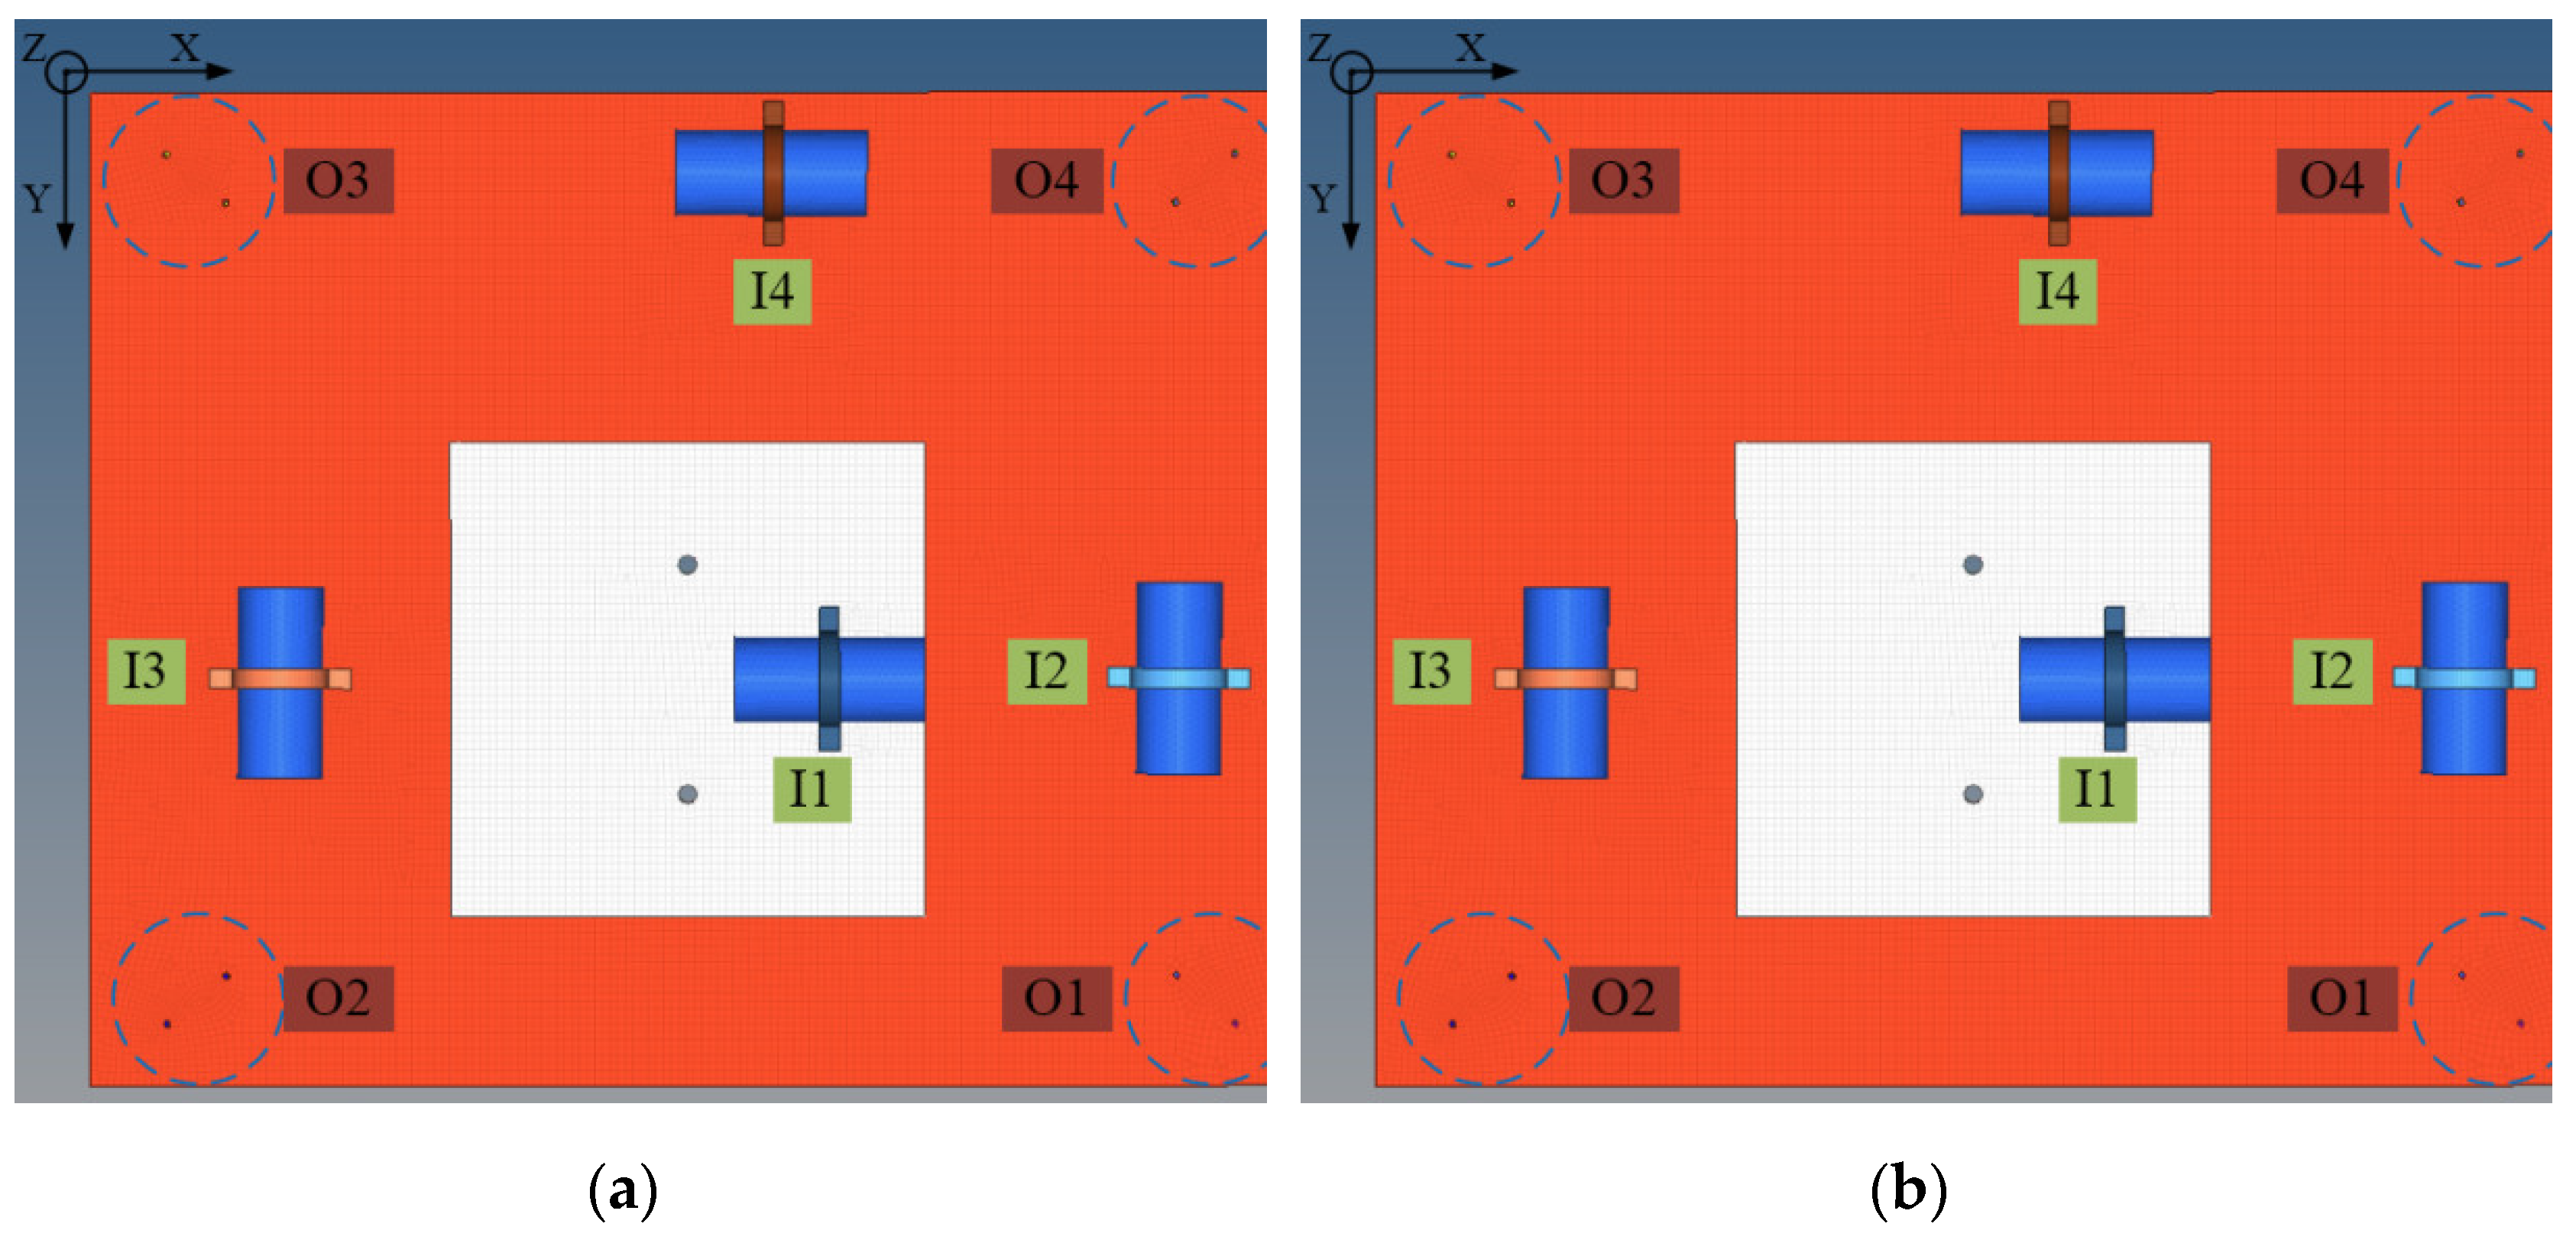
For the vibration reduction device designed by the research group for an optical satellite refrigeration module, the design standard is that the reaction force in each direction of the output point is reduced by 90% compared with the excitation force in the corresponding direction. The vibration reduction device has been preliminarily designed.
The refrigeration module uses four refrigerators as excitation sources, which are labeled as I1, I2, I3, and I4. The centers of the four vibration isolation ring bases are the output points, which are marked as O1, O2, O3, and O4. The overall finite element model is shown in
Figure 3.
The analysis method used in this paper is the force transfer path analysis method based on the modal superposition method. After the finite element modeling of the system is completed, the model is subjected to modal analysis. Generally speaking, the first few modes of the system have a large participation factor. Taking into account the speed of the finite element solution, this paper solves the first 10 modes of the system.
3.1. Measurement of Excitation Force
In engineering applications, the excitation force acquisition methods generally include the direct measurement method, inverse matrix method, dynamic stiffness method, etc. In this analysis, the excitation source is directly installed on the refrigeration module. Taking into account the convenience of measurement, the direct measurement method is adopted. At the same time, because the excitation source is not connected to the rest of the structure, the use of the direct measurement method will not affect the boundary conditions of the excitation source, which can also ensure that the obtained excitation force data has a higher accuracy.
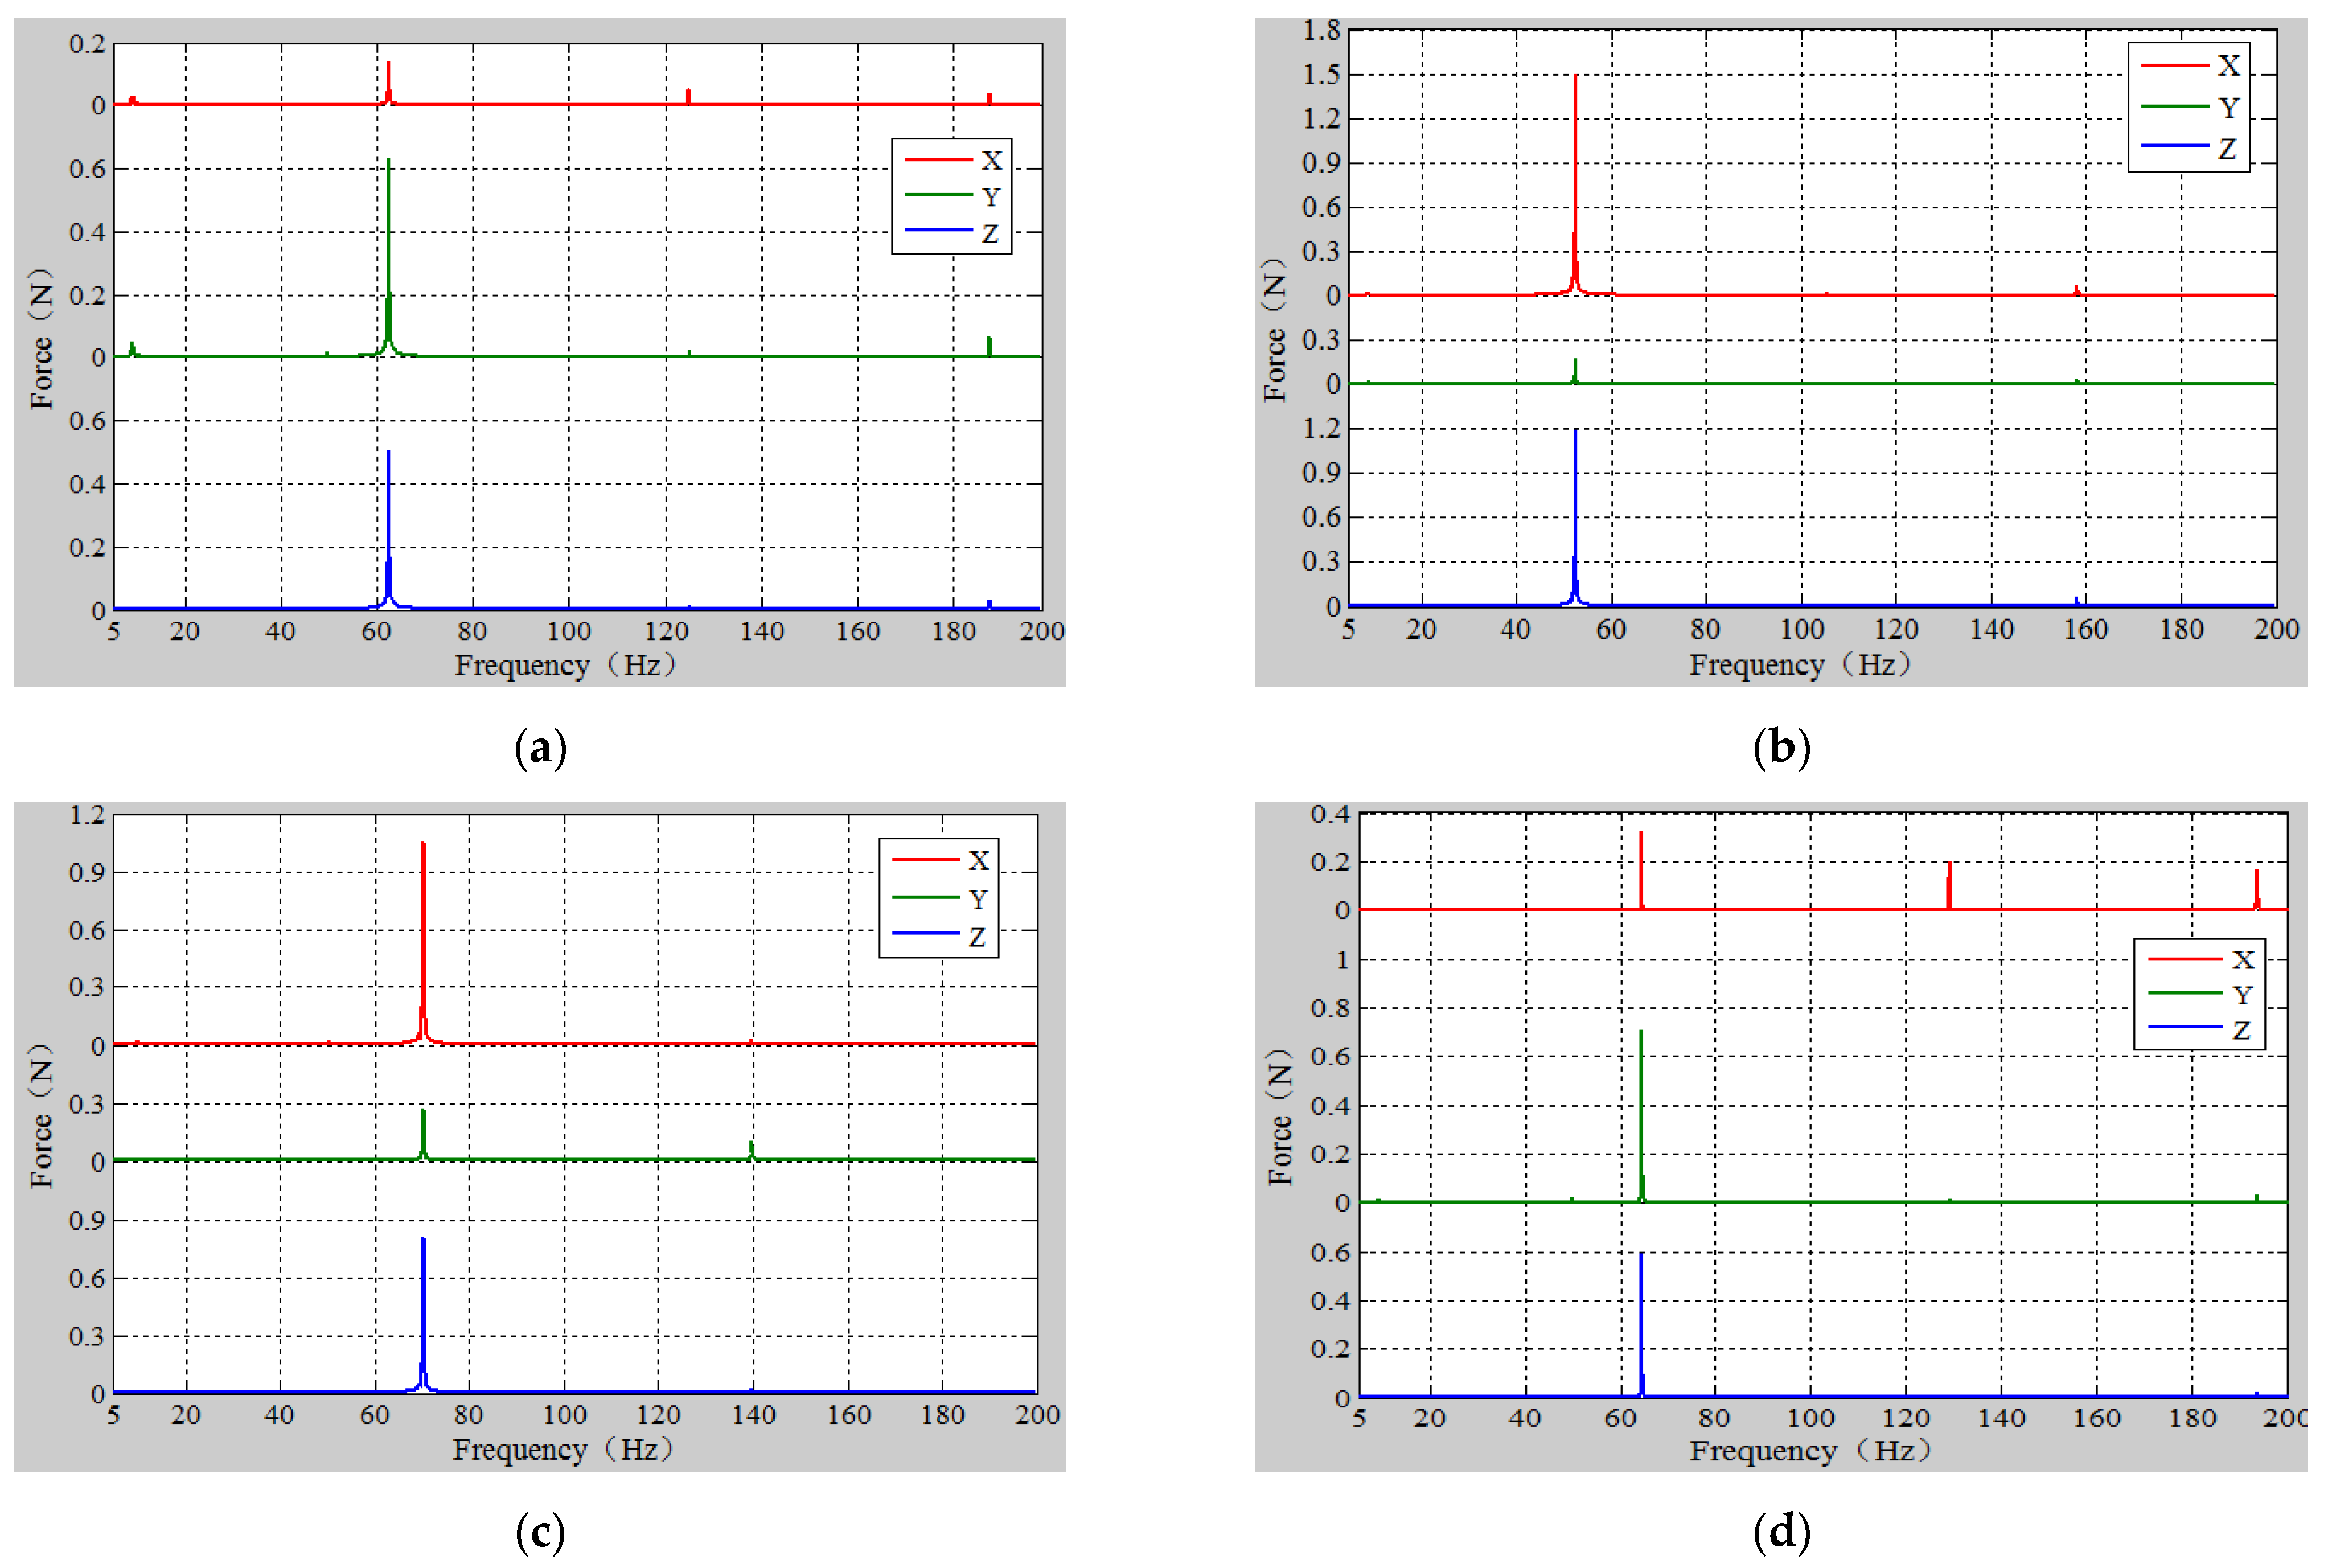
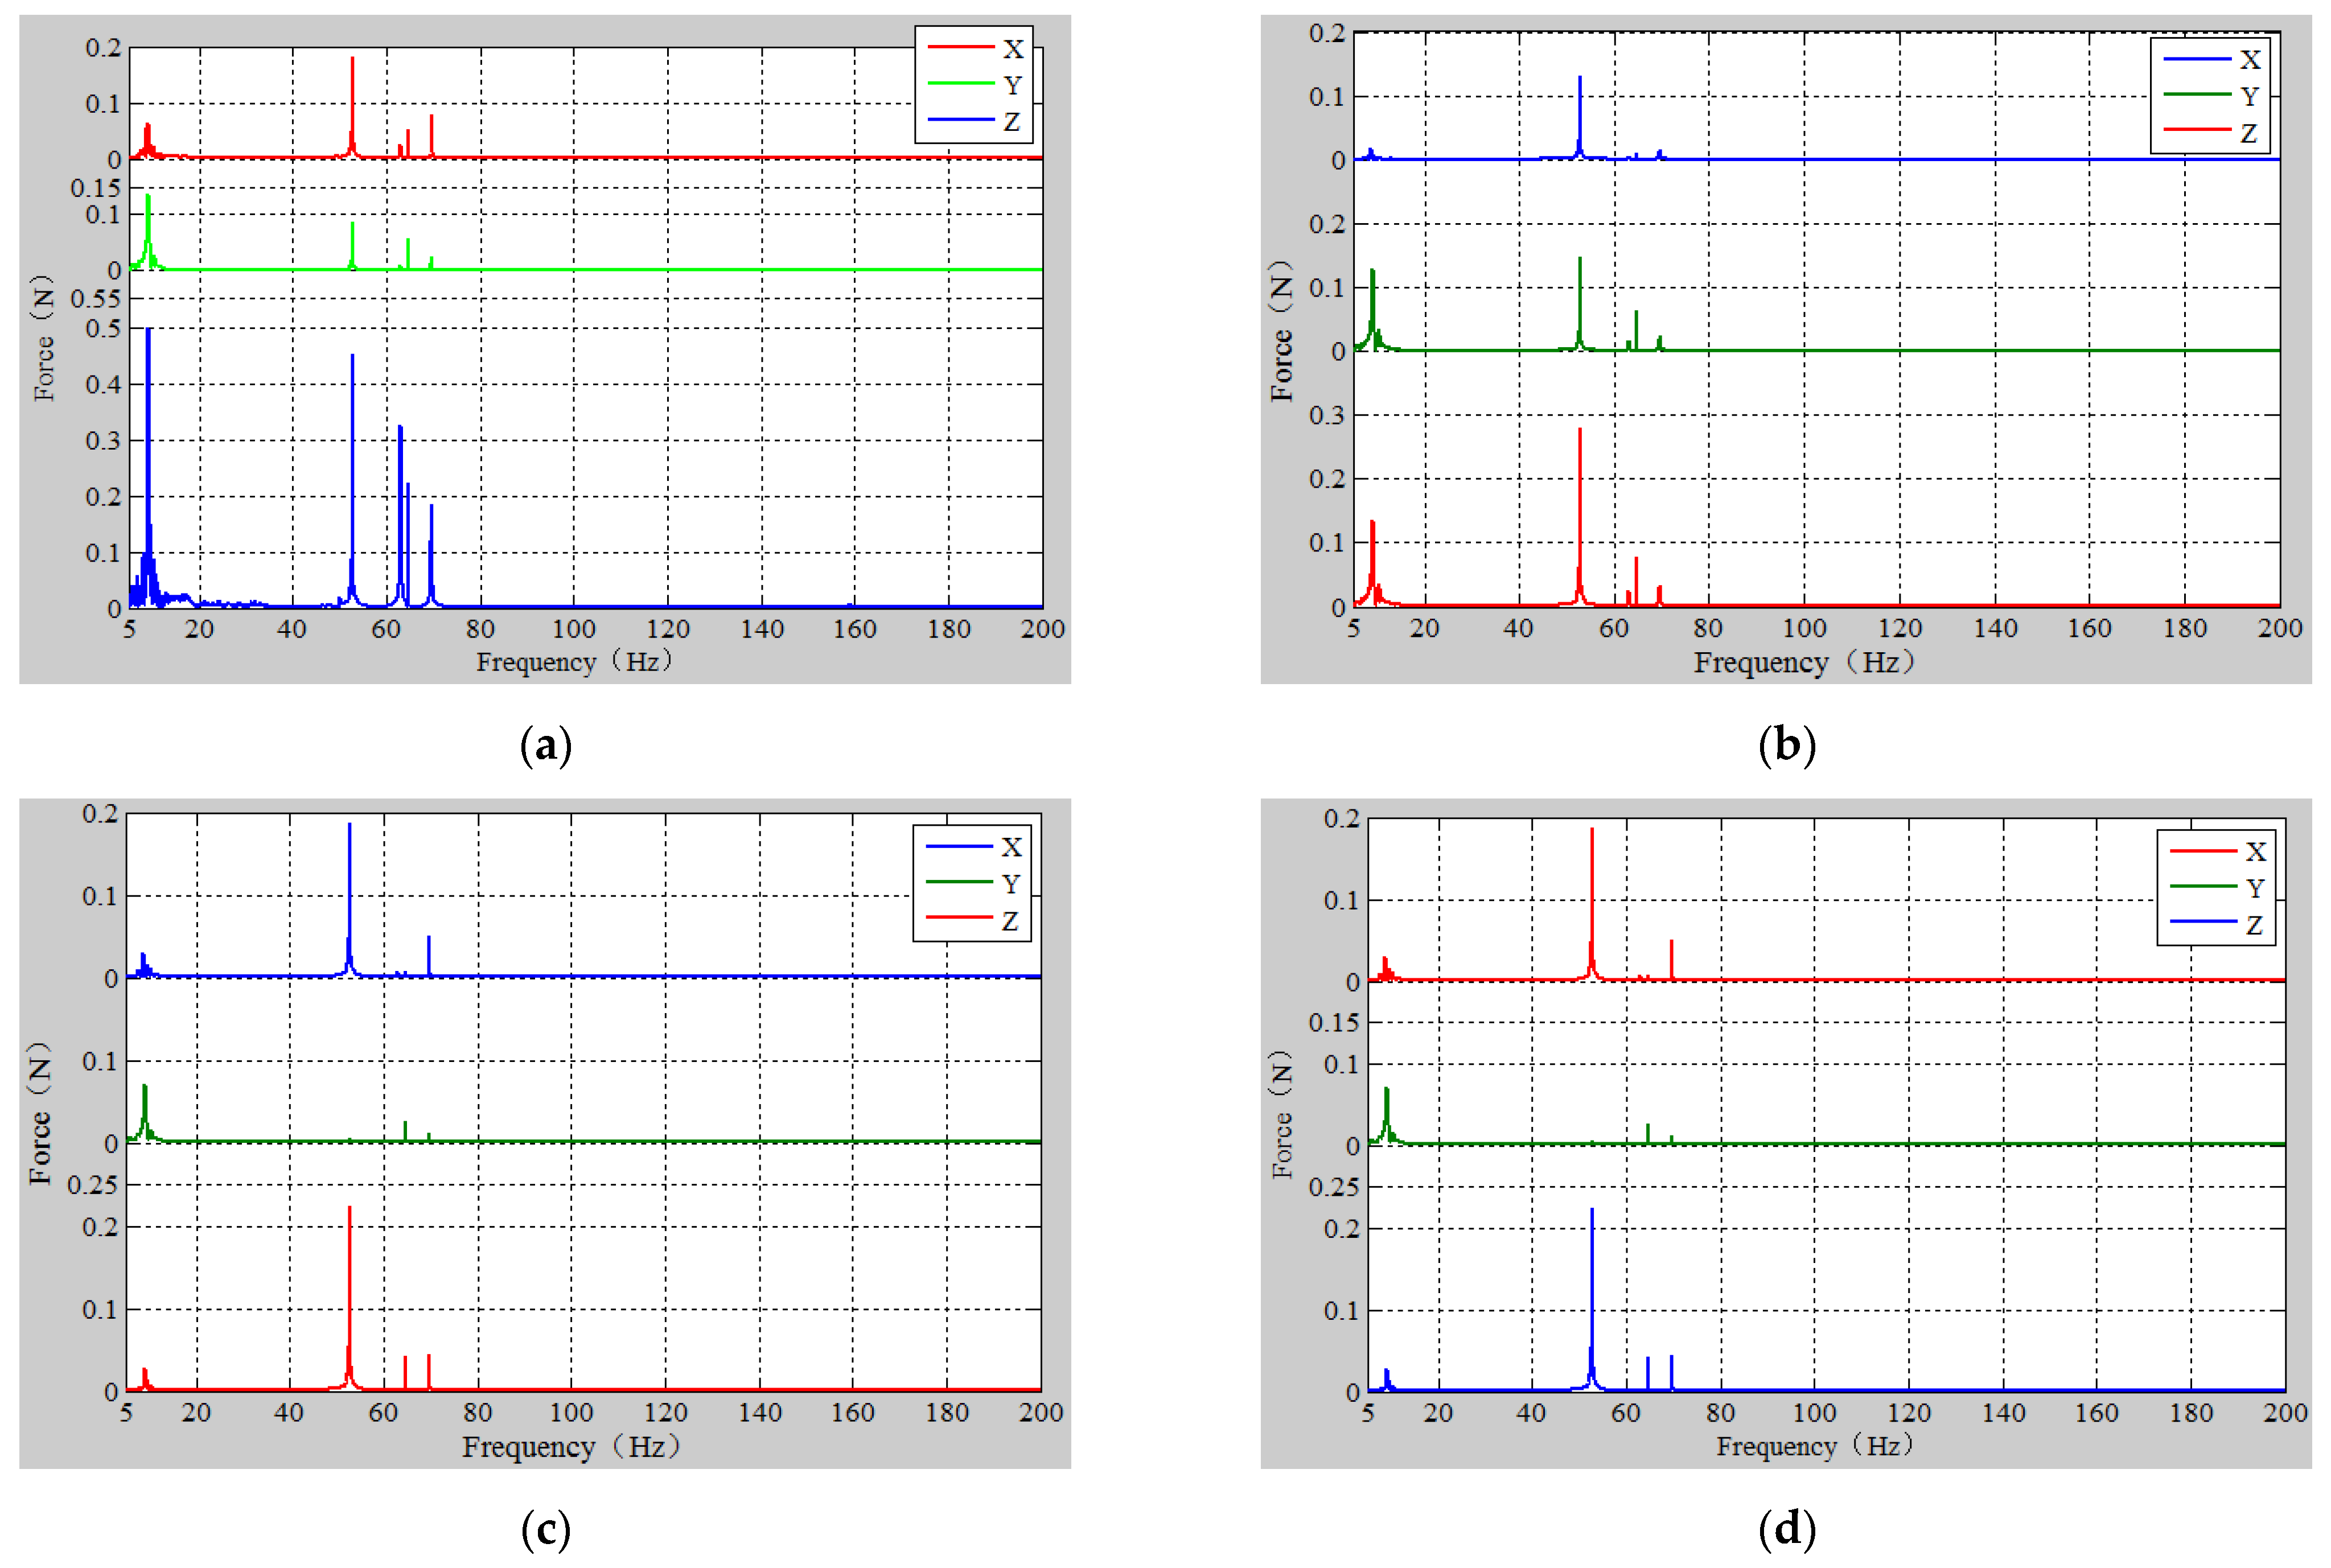
In the process of measuring the excitation force, consider the four motors in this example as the excitation source; the excitation in the three directions of X, Y, and Z for each motor needs to be considered, and 12 excitation force data in total are measured. The frequency domain data obtained is shown in
Figure 4.
3.2. Path Contribution Analysis
The analysis case in this article is a 12-input and 12-output model with a total of 144 transfer paths.
According to Equation (22), when the excitation force is only
, that is
, Equation (23) is obtained.
If the excitation force is
, according to the linear superposition theorem, Equation (24) is obtained.
Then the reaction force of the system is expressed as:
where
is the transfer function matrix of the reaction force.
The extracted modal data is calculated to obtain the transfer function matrix of the system, and the extracted excitation force data is combined to calculate the reaction force data of the system. The data is shown in
Figure 5.
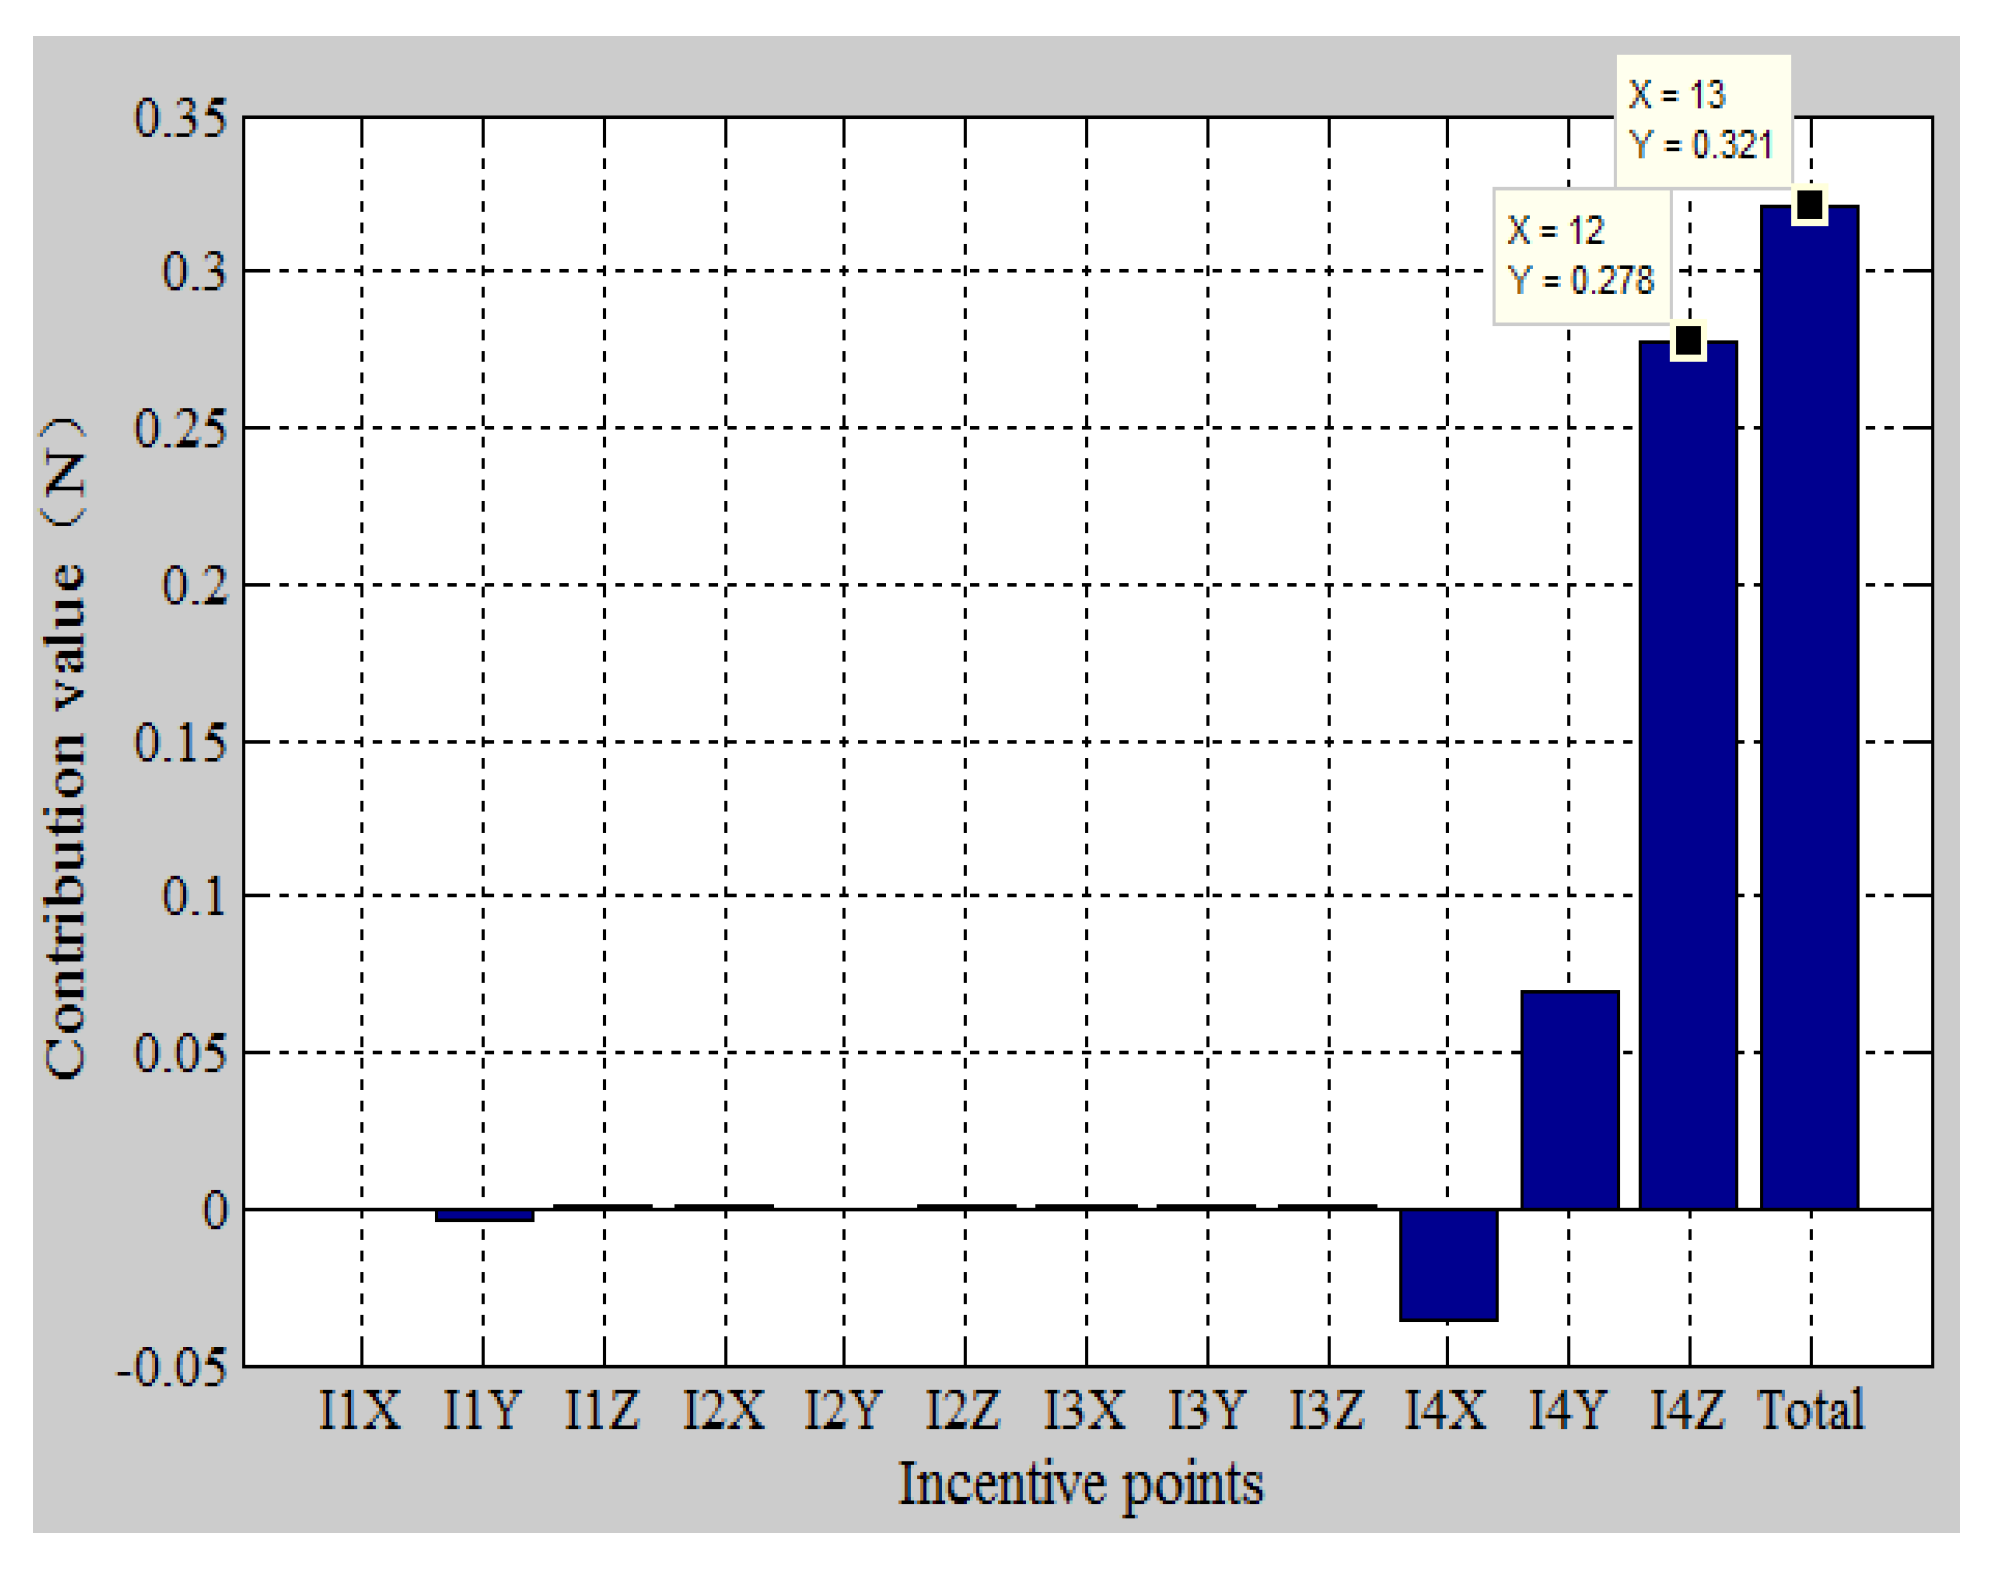
Table 1 shows the maximum value of the reaction force and the damping efficiency data of each output point. It can be seen from the table that there are two places where the damping efficiency of the vibration isolation ring is lower than 90%, namely the Z-direction at the O1 point and the Z-direction at the O3 point. The path contributions of these two places are analyzed, and the results are shown in the
Figure 6 and
Figure 7.
As shown in
Figure 6, the contribution of the Z-direction reaction force of O1 is analyzed, and it can be seen that the excitation points 1X, 1Y, 2X, and 2Y contribute more to the reaction force, but the contributions of the excitation points 2X and 2Y are both negative values, which can counteract the reaction force, so the paths I1:+X_O1:+Z and I1:+Y_O1:+Z are determined as the main reaction force transfer path.
As shown in
Figure 7, the contribution of the Z-direction reaction force of the output point 3 is analyzed, and it can be seen that the contribution of the excitation point 4Z is the largest, and the contribution of the remaining paths is small. The decision path I4:+Z_O3:+Z is the main reaction force transfer path.
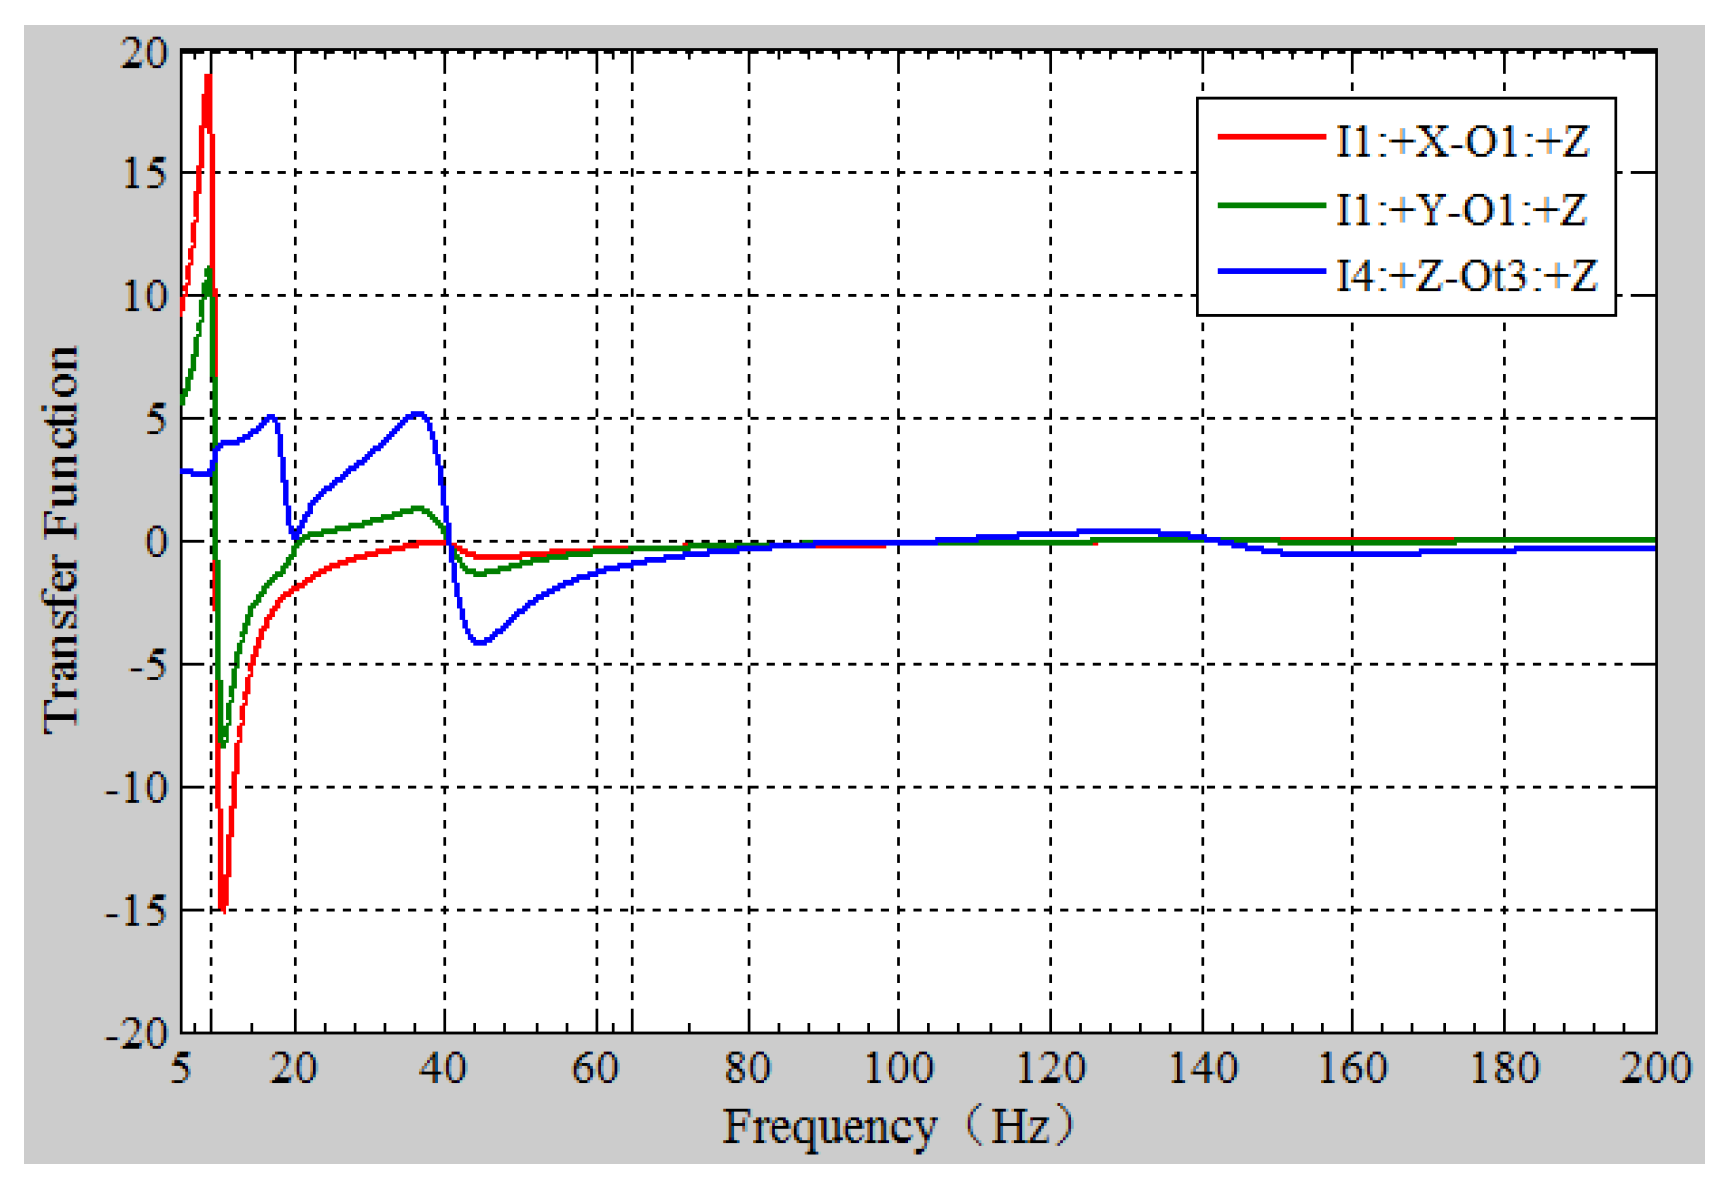
For the above three transfer paths, the transfer function of the full frequency range is shown in the following
Figure 8.
(1) For the two paths I1:+X_O1:+Z and I1:+Y_O1+Z where the contribution of output point O1 is larger, the excitation force amplitude is small. The reason for the larger reaction force at this point is that the path transfer characteristics of the two paths are not good. The subsequent optimization process is mainly aimed at optimizing the path transfer characteristics of the two transfer paths.
(2) For the transfer path I4:+Z_-O3:+Z, the transfer function at 64.7 Hz is small, the excitation force level is high, and the reason for the large reaction force in the 3Z direction of the output point is the large excitation force. The vibration reduction optimization is carried out around the excitation source.
4. Test Analysis of Reaction Force
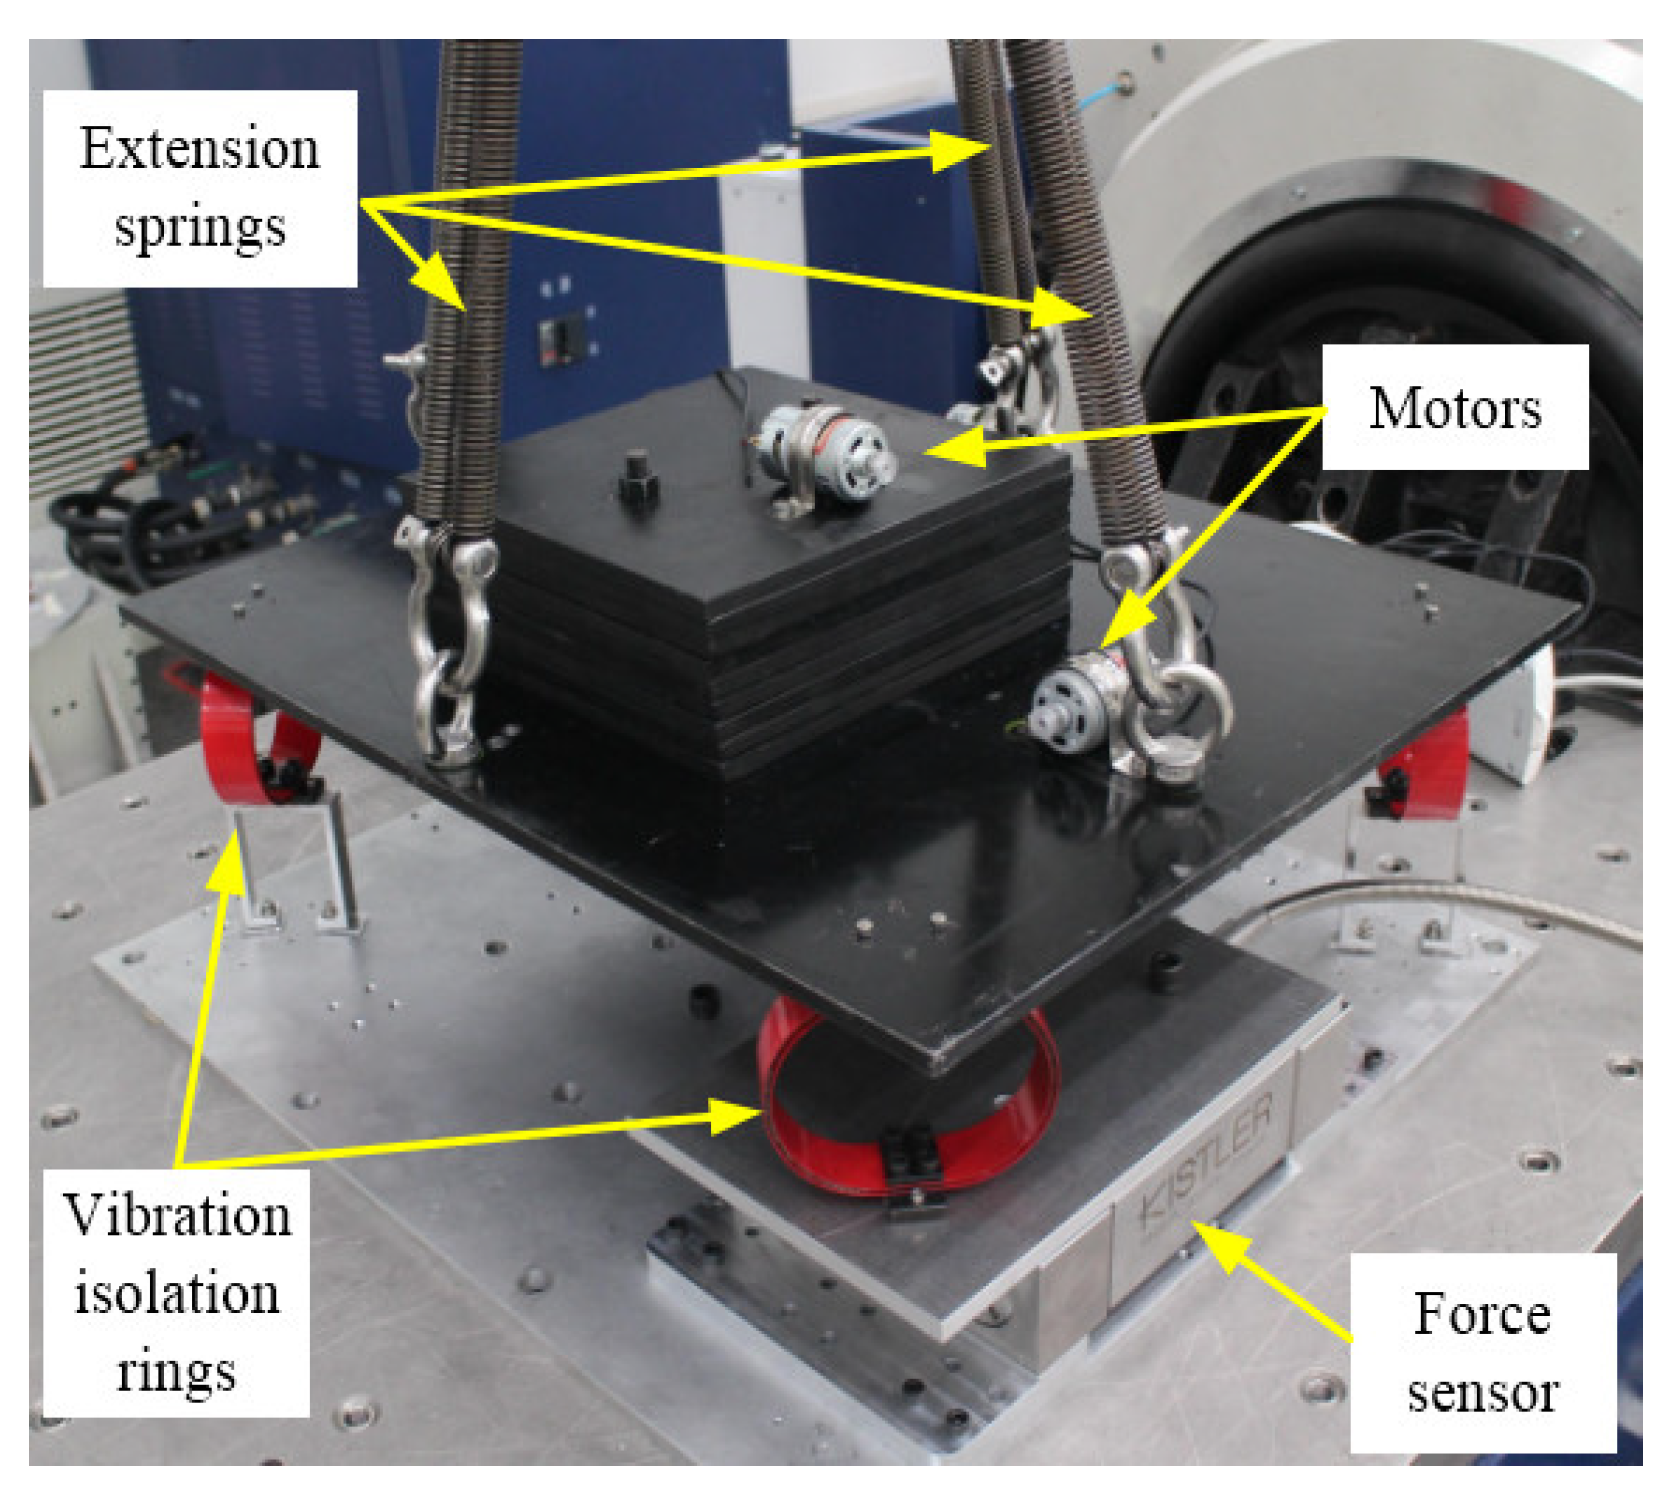
The refrigeration module is applied to the satellite, and the analyzed working condition is the operating state of the satellite in orbit. In the process of building the experimental platform, a four-point suspension was used to simulate the non-gravity environment in space, and the suspension was suspended by a tension spring, which has a long spring length, which can ensure that the suspension hardly affects the accuracy of the experimental data.
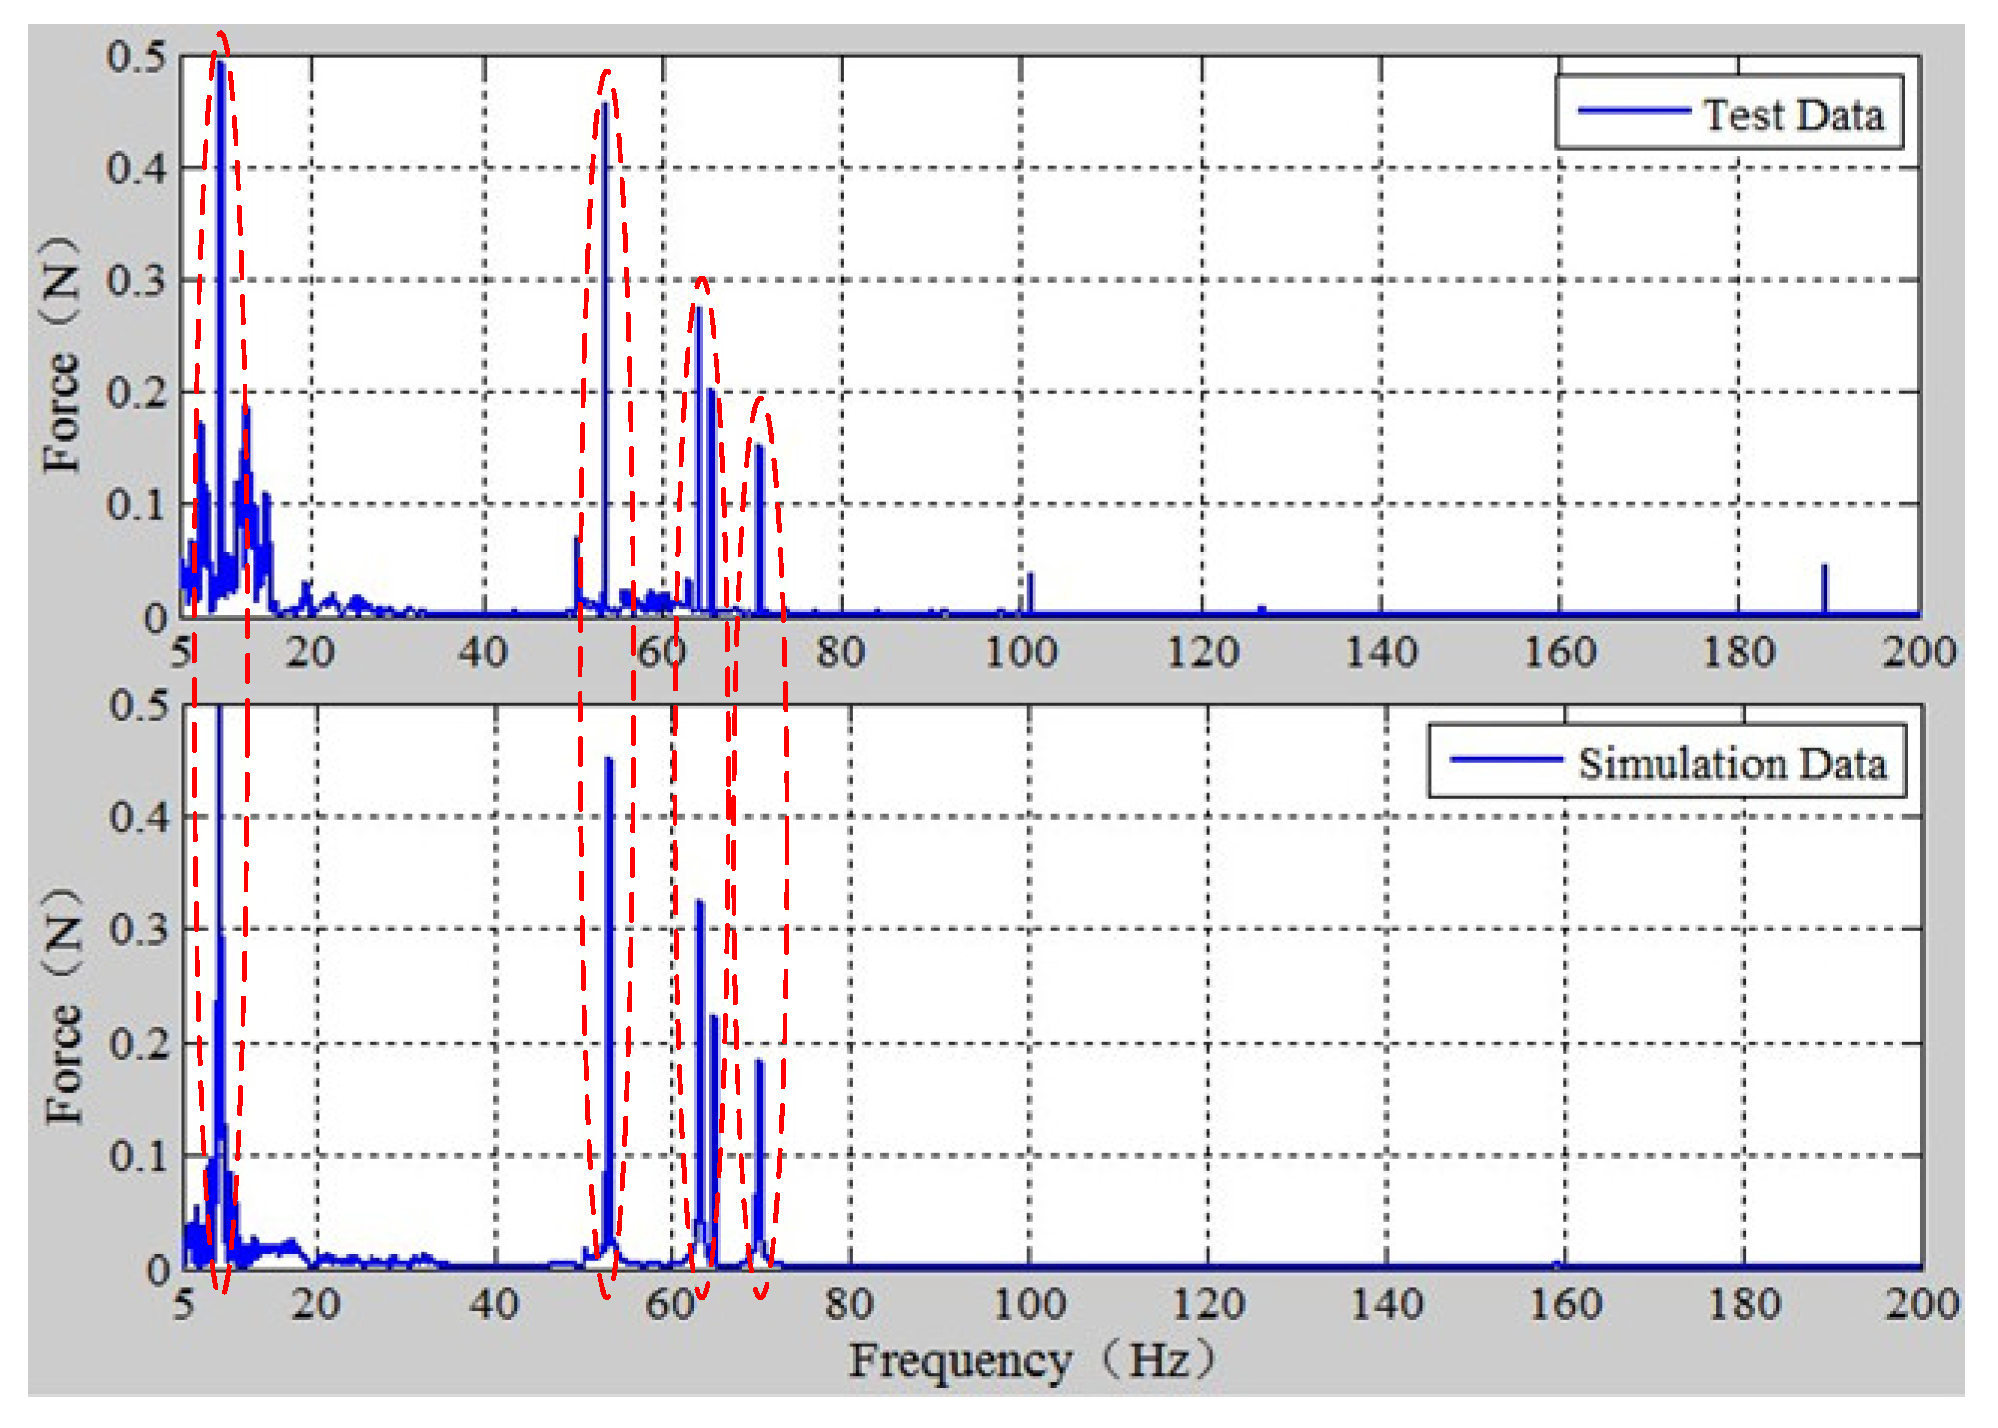
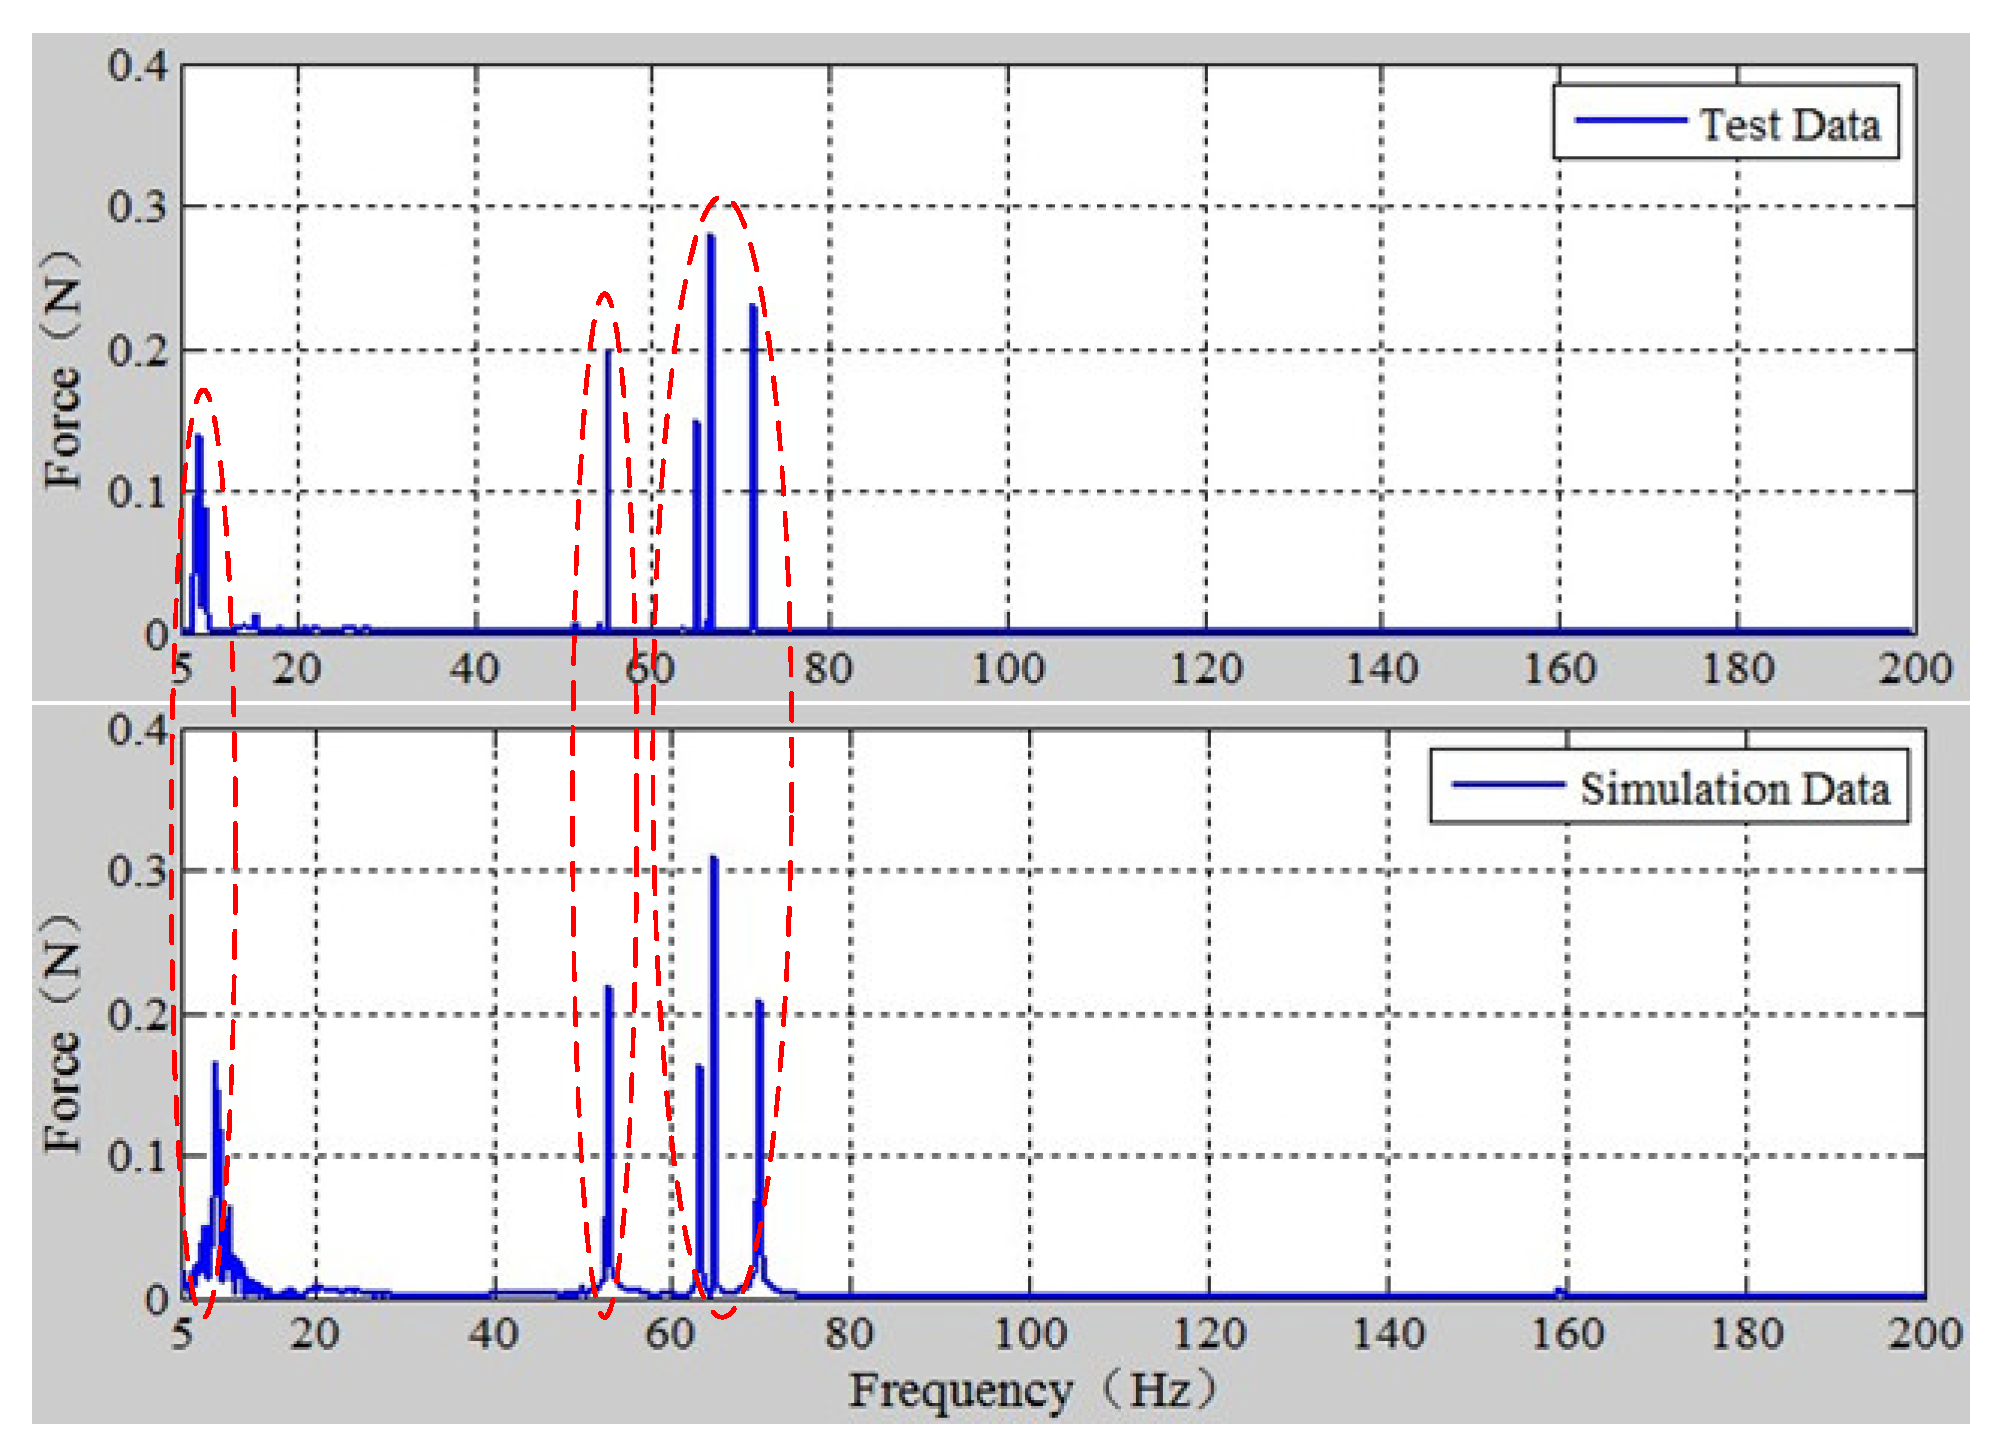
Figure 9 is an analysis test diagram of the reaction force transfer path of the refrigeration module.
In the simulation analysis, the vibration damping efficiency of the vibration isolation ring does not meet the design requirements, and the two reaction forces are in the Z direction at O1 point and the Z direction at O3 point. In the experiment, these two reaction forces are mainly measured and compared with the data obtained from the simulation analysis to verify the correctness of the simulation analysis.
It can be seen from the above two comparison figures that at the corresponding frequency, the fit of the experimental data and the simulated data can reach more than 90%, and the trend of the two data is basically fitted.
Compared with the simulated data, the experimental data has more peaks. This is because the data collected during the experiment contains noise, which is obvious in the low frequency range. At the same time, the experimental data is smaller. The reason is that the suspension mode is used to simulate the non-gravity environment in space under the test conditions. The suspension device bears a certain vibration input, which is also in line with expectations.
5. Results
Based on the traditional transfer path analysis, this paper adopts the modal superposition method and the penalty function method to establish an improved reaction force transfer path analysis method. This method is suitable for the vibration reduction analysis of the mechanical system in the design stage because there is no need to consider the structural parameters of the next system, and this method has a greater advantage in solving speed.
In this paper, by analyzing the transfer path of the force for the vibration damping design of a satellite refrigeration module by the research group, the output point positions with unsatisfactory vibration damping efficiency are identified, and the path contribution of these positions is analyzed. Through analysis, we can identify the main factors that affect the effect of vibration reduction, and clarify the direction for subsequent further optimization.
By building an experimental platform, the refrigeration module was tested and analyzed for the reaction force transfer path. Comparing the experimental data with the simulation data, it can be seen that the two types of data fit well, which proves the correctness of the established method for analyzing the reaction force transfer path.
Because this method is based on simulation, its solution accuracy depends on the accuracy of the finite element model. At the same time, idealizing the receiving end of the system during the analysis process will also bring certain errors to the analysis results. This is the next direction that needs improvement.


