Article

Study on Separation Characteristics of Nozzles with Large Expansion Ratio of Solid Rocket Motors

1
State Key Laboratory for Strength and Vibration of Mechanical Structures, School of Aerospace Engineering, Xi’an Jiaotong University, Xi’an 710049, China
2
The Fourth Academy of China Aerospace Science and Technology Corporation, Xi’an 710025, China
*
Author to whom correspondence should be addressed.
Aerospace 2023, 10(1), 4; https://doi.org/10.3390/aerospace10010004
Submission received: 7 November 2022 / Revised: 8 December 2022 / Accepted: 15 December 2022 / Published: 21 December 2022
(This article belongs to the Special Issue Combustion Evaluation and Control of Solid Rocket Motors)

Abstract

:
In order to study the flow characteristics of a nozzle with large expansion ratio and its influence on the force on the nozzle, ground cold flow test research and a fluid–structure coupling simulation analysis were carried out (maximum expansion ratio ε = 30.25). The variation and pulsation characteristics of the pressure near the measuring point area and the inlet pressure were obtained through experiments. Through the analysis of the peak-to-peak value and average value, it was found that the average pressure after separation increases by 90%, but the peak-to-peak value increases by about five times, indicating that the pressure fluctuation after separation is much larger than before separation. The separation flow field under cold flow conditions was simulated using the CFD commercial calculation software Fluent to verify the correctness of the numerical calculations. The fluid–structure coupling analysis was carried out on a large expansion ratio (maximum expansion ratio ε = 48) full-scale nozzle, and the structural deformation characteristics of the nozzle under the separation conditions were studied. The research results show that flow separation occurs in the nozzle with a large expansion ratio under ground conditions. Before the separation point, the pressure pulsation on the nozzle wall is small, and the turbulent pulsation effect is weak. After the separation point, the pressure pulsation increases, and the turbulent pulsation effect is enhanced. When the total pressure decreases, the separation area of the nozzle increases, and the separation flow field presents a strong asymmetry. Reducing the total inlet pressure by half resulted in approximately 50 times the lateral load. Under the combined influence of the ground conditions and low total pressure, the large lateral load caused by the asymmetry of the separation flow field will cause the deformation of the nozzle structure to increase by 5.5 times. This research provides an important reference for the design and experiment of nozzles with a large expansion ratio.

1. Introduction

At present, the geometric size of nozzles is a major factor that determines whether solid rocket motors can obtain excellent thrust at a high altitude. The expansion ratio refers to the ratio of the maximum cross-sectional area to the minimum cross-sectional area of the nozzle, represented by ε. In the Laval nozzle, the nozzle is divided into contraction and expansion sections. The airflow flows in from the subsonic state. Through the contraction section, it will accelerate to supersonic speed and continue to expand and accelerate after entering the expansion section. This means that the expansion ratio plays an important role in the acceleration of the airflow. When the solid rocket runs at a high altitude, it needs the motor to provide strong thrust, which can be achieved by expanding the nozzle expansion ratio. At present, a nozzle with an expansion ratio (ε) greater than 20 is generally called a large expansion ratio nozzle.
When a nozzle with a large expansion ratio works at a high altitude, it can work well in a full flow state. However, a large expansion ratio nozzle will be affected by environmental pressure during a ground test, the low-altitude flight of the rocket, and the startup and shutdown of the motor, which will cause flow separation and serious lateral load, which will not only reduce the performance of the nozzle but also damage the nozzle and motor structure. Therefore, in order to ensure the stability of the thruster during operation, there is important theoretical significance and practical reference value in the study of the separation characteristics of high expansion ratio nozzles [1,2,3,4].
Stark [1] carried out an experimental study on the characteristics of ambient flow in order to study the effect of ambient density on flow separation in conventional nozzles. Li [2] and others analyzed the vibration response gap of the upper nozzle with a higher expansion ratio when working under ground and high-altitude conditions and found that the vibration response under ground conditions is much higher than that under high-altitude conditions, which is due to the flow separation in the nozzle. Jia [3] studied the effect of an FITH system response on the starting flow separation and lateral load of conical nozzles during flight using a numerical method. It was found that asymmetric classification may lead to a large continuous lateral disturbing force. Pei [4] et al. conducted a cold flow experiment on an engine nozzle with a high expansion ratio at sea level. The experiment revealed the influence of inlet pressure on the pressure of upstream and downstream test points at the separation location.
The flow in the nozzle of a rocket motor has a thick boundary layer on the wall of the nozzle due to the viscous effect of the gas. When the shock wave generated outside the nozzle extends to the boundary of the nozzle tail, the shock wave interacts with the boundary layer on the nozzle wall to separate the boundary layer. The separated boundary layer is like a “sharp wedge” extending into the nozzle, so that an oblique shock wave will be generated at the apex of the “sharp wedge” before the supersonic airflow reaches the outlet. After the airflow passes through the oblique shock wave, the flow turns, which causes the flow boundary to be inconsistent with the direction of the nozzle wall and that creates a separation zone. The flow velocity in the separation zone is very low, and the airflow movement is connected to the external atmospheric flow, so the separation zone pressure is equal to the ambient pressure. Martelli [5] found that, in the case of excessive expansion of the nozzle, there is an obvious peak (~1 kHz) at the intermediate frequency of the wall pressure spectrum that continues to exist downstream of the separation impact. According to the analysis, this intermediate frequency peak is related to the generation of side load. Conejo et al. [6] observed that the optimal arrangement of the gas injection nozzle should depend on the gas flow rate and be related to the wall shear stress. Lee’s k for the low Reynolds numbers of Yang and Shih’s ε model, Mener’s SST k-ω model and Wilcox’s k-ω model [7]. Chaudhuri [8] conducted a large eddy simulation (LES) on the shock induced transient flow of a plane nozzle and found that the improper initialization of the flow field may lead to incorrect predictions regarding the flow characteristics. Studies have shown that two different separation phenomena occur in nozzles with a large expansion ratio: free shock separation and confined shock separation, as shown in Figure 1 [9]. Usually, the airflow separated from the wall takes the form of a free jet, and this flow state is called free shock separation, as shown in Figure 1a. In addition, under a certain pressure ratio, the pressure downstream of the separation point is irregular and higher than the ambient pressure, and the airflow after separation will re-attach. This separation mode is called confinement shock separation, as shown in Figure 1b.
The flow characteristics of a nozzle with a large expansion ratio in a solid rocket motor are studied in this paper, and we analyze two separation situations:
(1)
The cold flow simulation test of a reduced-ratio nozzle was carried out to obtain the position of the separation point under different pressures and the pressure pulsation characteristics of the wall before and after the separation point. The numerical simulation of the separation flow field under cold flow conditions was carried out to obtain the parameter distribution of the flow field in the nozzle, and the calculation results were compared with the experimental results to verify the correctness of the numerical calculation.
(2)
A fluid–structure coupling analysis was carried out on a full-scale nozzle with a large expansion ratio, and the difference in the flow field distribution under different working conditions (ground and high-altitude environments) was obtained. The structure of the nozzle deformation properties under the separation conditions was studied.

2. Study of Separated and Cold Flow Using Experiments

Verma [10] studied the change in airflow in the pipe of a parabolic nozzle under different conditions by means of a cold flow test. Wang [11] discussed the impact of regenerative cooling on the nozzle. In the present test using a solid rocket motor, due to the complex gas composition of the solid propellant and the short working time, the pressure adjustment and control are difficult to achieve; the ablation and thermal protection problems caused by the high temperatures and high-pressure two-phase flow make the test difficult, and the accuracy of the test and analysis are difficult to guarantee. The cold flow test is basically the same as the hot test in the air separation mechanism, and compared with the hot test, it has the advantages of simple working gas composition and low temperatures, and it is easy to control the test pressure and flow, in addition to ensuring a high test accuracy. In this paper, the cold flow test was used to study the separation flow in the nozzle [12,13,14].
The nozzle geometry used in the cold flow experiment is a thick-wall fixed nozzle; the nozzle shell material is metal, and the total nozzle length is 396 mm. The throat diameter is Φ 40 mm, the maximum expansion ratio is 30.25, the inner surface of the nozzle is conical, the convergence half angle is 40°, and the expansion half angle is 15°. The nozzle with a large expansion ratio is designed to work at full flow at a high altitude, and the Mach number in the nozzle is within its allowable range during the experiment.
The basic idea of the test is to use a compressed air supply system to generate high-pressure air, enter the gas-collecting device through the pipeline, adjust to the pressure required for the test, enter the nozzle, and then discharge from the nozzle outlet. During the test, the wall pressure sensor is used to measure the pressure at different positions on the nozzle wall. The main devices used in the test include a compressed air supply system, nozzle installation bench, test solid-wall nozzle, test bench measurement and control system, pressure sensor and PXI data acquisition system, as shown in Figure 2; the schematic diagram of the test point location is shown in Figure 3. The pressure sensor is a high-precision pressure sensor, and the gas inlet pressure source is controlled by a high-precision solenoid valve and pressure-reducing valve, resulting in very small error.
During the test, a “frosting” phenomenon appeared on the upstream part of the outer wall of the nozzle, as shown in Figure 4. The reason for the analysis is that the high-pressure air expands and accelerates in the nozzle, and the gas temperature decreases; the temperature of the wall surface is reduced, causing the moisture in the outside air to condense and fog on the outer wall of the nozzle. However, there is no moisture condensation downstream of the nozzle, which is due to the gas flow separation in the nozzle. In the separation of the airflow, due to the effect of the separation shock wave, the airflow velocity decreases and the temperature rises after the separation point. At the same time, due to the low return velocity in the separation zone, the convective heat transfer effect between the airflow and the inner wall of the nozzle is weakened, and the temperature of the outer wall of the nozzle is close to the atmospheric environment. According to the test data, the variation law of the nozzle wall pressure with the axis can be obtained. Figure 5 shows the wall pressure distribution with the total inlet pressure of Pc = 4.34 MPa. The results in Figure 5 show that, along the axis of the nozzle from the measuring point P1 to the measuring point P5, the wall pressure gradually decreases, and the average pressure decreases from 487.67 to 36.65 kPa. At the measuring point P6, the average pressure rises rapidly to 68.90 kPa, indicating that the separation point is between P5 and P6. After P6, the average pressure at the measuring point further increased, but the pressure increase rate increase decreased and finally increased to close to the surrounding atmospheric pressure.
The statistics of the pressure changes at points P5 and P6 over time show that the peak-to-peak value of the data before the separation point (P5) is only 2.44 kPa, and the standard deviation of the data is 0.307. The peak-to-peak value of the data after the separation point (P6) is 12.26 kPa, and the standard deviation of the data is 1.533, which is much larger than the corresponding value before the separation point, which indicates that the pressure pulsation is significantly enhanced after the separation point. The specific values are shown in Table 1.
The above method was used to analyze the pressure data before and after the separation point under other total inlet pressure conditions, and the pressure results before and after the separation point were obtained as shown in Table 2 and Table 3. The same rule can be found; the pressure fluctuation after the separation point is much larger than before the separation point.

3. The Numerical Simulation of Separation Fluid Field

According to the pressure ratio and area ratio of the nozzle, stable symmetry, unstable symmetry and stable asymmetric separation occurred [15]. It was found that the impingement and split flow behavior in the nozzle are complex, but the gas separation is closely related to the expansion state of the gas [16]. We need to understand the behavior of the gas in the nozzle in detail. Due to the objective limitations of the test conditions, only the pressure data at a specific position on the nozzle wall can be measured in the test, and the law of the continuous distribution wall pressure cannot be obtained. Therefore, it is necessary to carry out a numerical simulation of the nozzle according to the test conditions to study the laws of the separation flow in the nozzle [17,18,19,20].

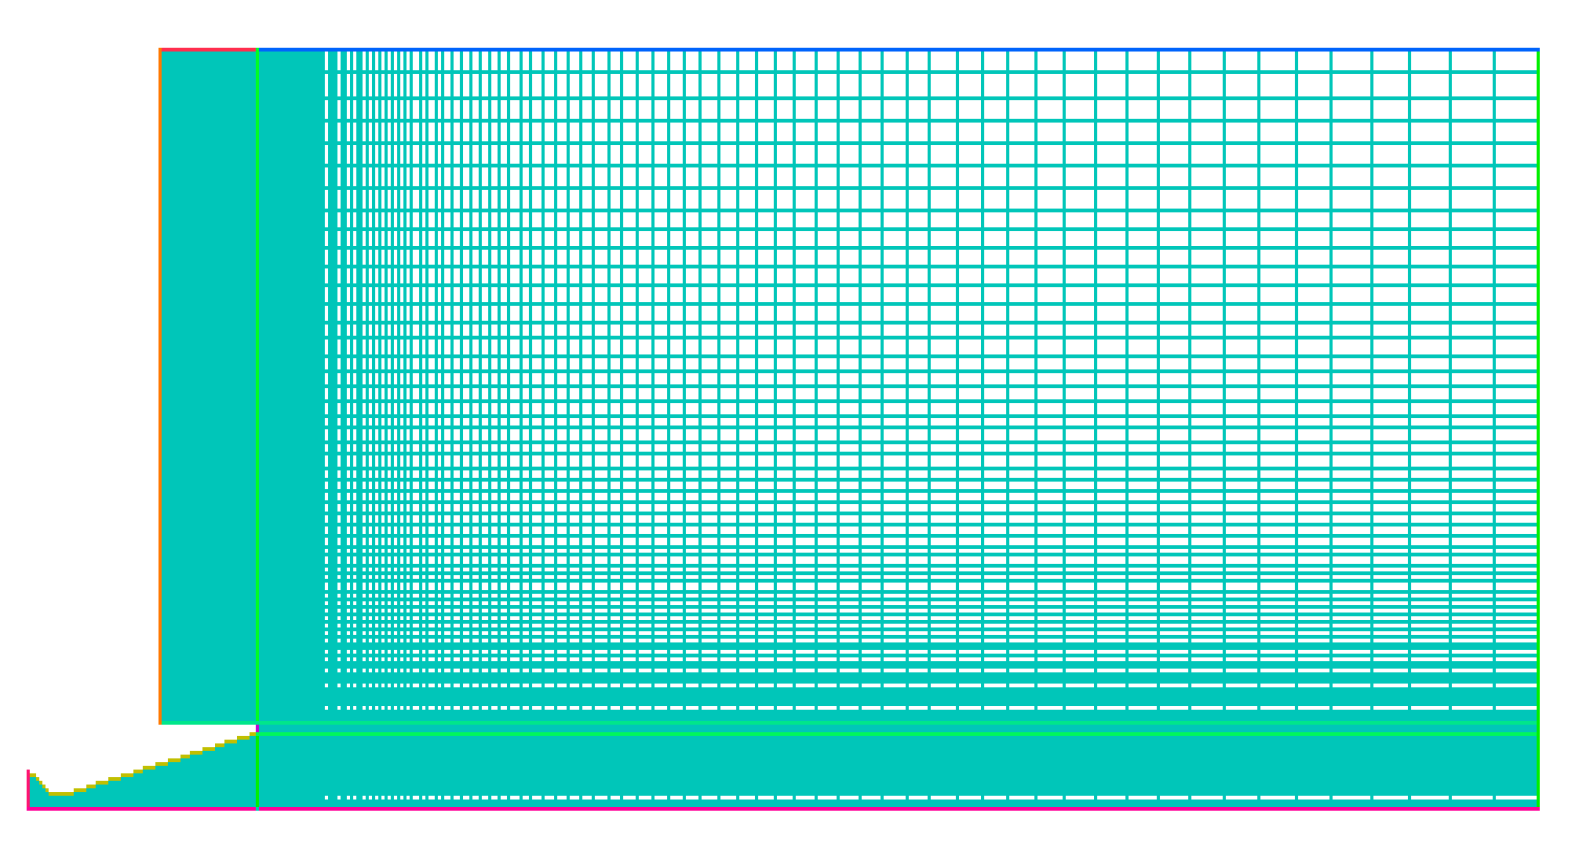
3.1. The Calculation Model and the Condition of Boundary

The calculation adopts a two-dimensional axisymmetric model, taking the inside of the nozzle and the external field as the calculation area. The axial distance of the external field is 10 times the outlet diameter, and the radial distance is 5 times the outlet diameter. The calculation area is shown in Figure 6, and the calculation grid is shown in Figure 7.
Structural meshing of the computational area was adopted. The actual meshing parameters are as follows: the axial grid of the flow field in the nozzle is evenly distributed, and the grid size is 2 mm. In order to capture the separation phenomenon, the grid at the wall is locally refined, and the grid transition near the wall is uniform. The outfield area has little influence on the calculation; the grid of the external field grows proportionally after the nozzle outlet, and the grid is sparser as it is farther away from the nozzle outlet. The grid transition between different partitions is uniform, the axial and radial grid lines are orthogonal, and the entire computational domain grid has high quality.
Next, we will explain the meaning of each named boundary in Figure 6:
(1)
ab is the nozzle inlet. The pressure inlet boundary is taken, the flow direction is perpendicular to the inlet, and the total temperature, total pressure and turbulence parameters are given under the test conditions;
(2)
bc is the axis of the calculation domain, and the axisymmetric boundary conditions are taken;
(3)
ah and hg are the wall surfaces, and the adiabatic non-slip wall surface conditions are used;
(4)
fg, ef and ed are the calculation far field, and the pressure far field boundary conditions are used, and the total temperature and total pressure are given under the condition of sea-level conditions;
(5)
dc is the flow field outlet, taken as the pressure outlet boundary, which also gives the total temperature and total pressure of the environment under sea-level conditions.

3.2. Numerical Methods

The finite volume method of time advancement, the N-S equation and the AUSM method with high discontinuous resolution were adopted to solve the problem. The shear stress transport SST k-ω two-equation model and the Wilcox k-ω mode at the near wall were adopted, and the k-ε mode at the edge of the boundary layer and the free shear layer, and transition between them through a mixed function. The SST k-ω two equation model can be more widely applied to the boundary layer problems under various pressure gradients, which limits the turbulent stress by limiting the turbulent viscosity. Relative to the k-ε model, it can better predict and capture the separation of the flow on the wall, making the calculated value more consistent with the actual situation. In this paper, the energy of gas flow is given by the initial pressure boundary, and the cold flow separation phenomenon that has occurred in the experiment is emphatically studied. Choosing to use the SST k- ω two equation model, the viscosity of the gas was given by the three-coefficient Sutherland law, and the formula is:
μ = μ 0 ( T T 0 ) 3 2 T 0 + S T + S
where:
T0—reference temperature;
S—equivalent temperature;
μ0—reference viscosity coefficient at T0.
At the beginning of the calculation, a suitable residual value is given to judge the convergence of the flow field calculation. The residual value is 10−6 to ensure sufficient accuracy and avoid truncation errors.
First, when Pc = 4.34 MPa, the flow field distribution of the nozzle under high-altitude (Pa = 10 kPa) and ground conditions (Pa = 94 kPa) was calculated, and its Mach number cloud map is shown in Figure 8.

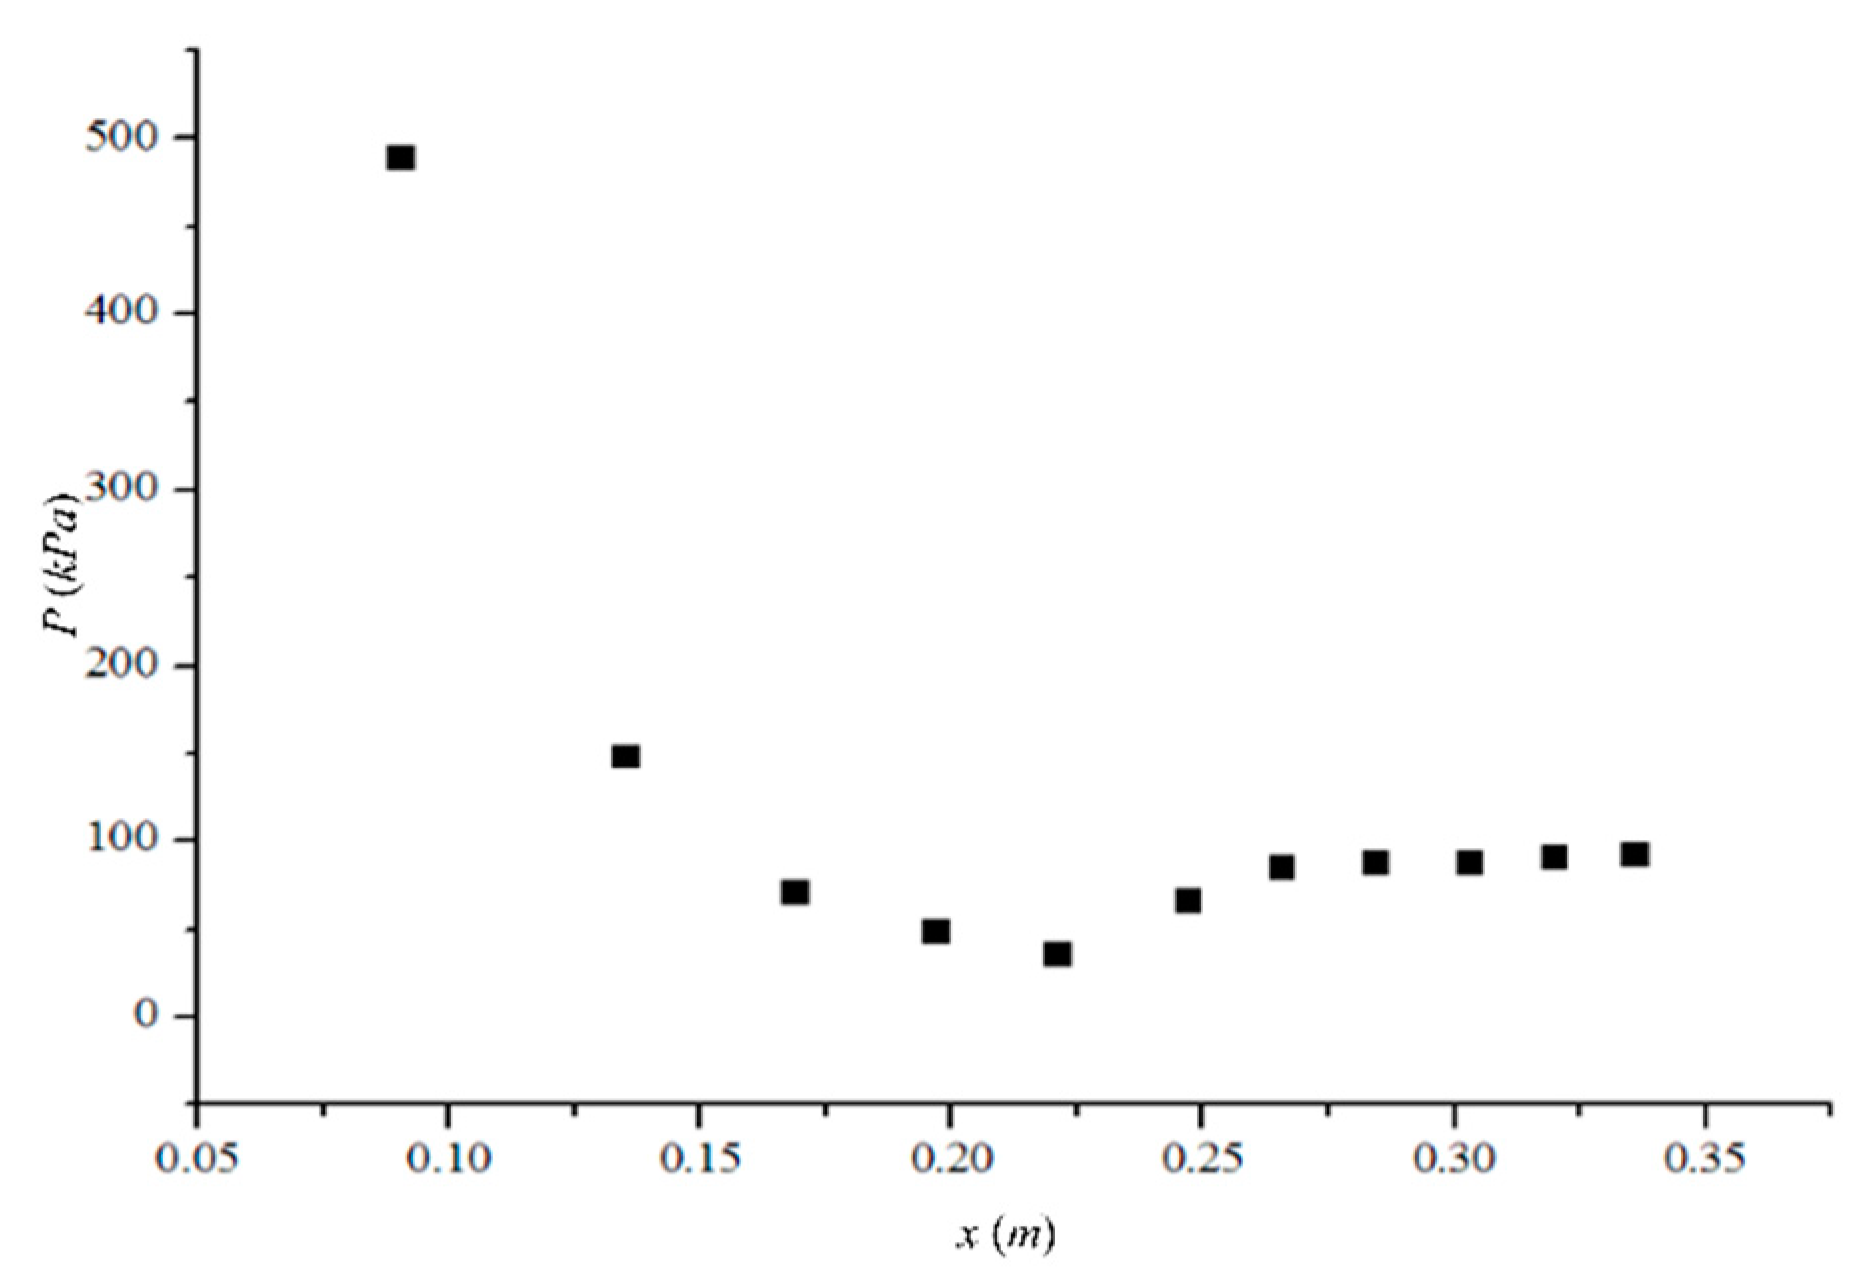
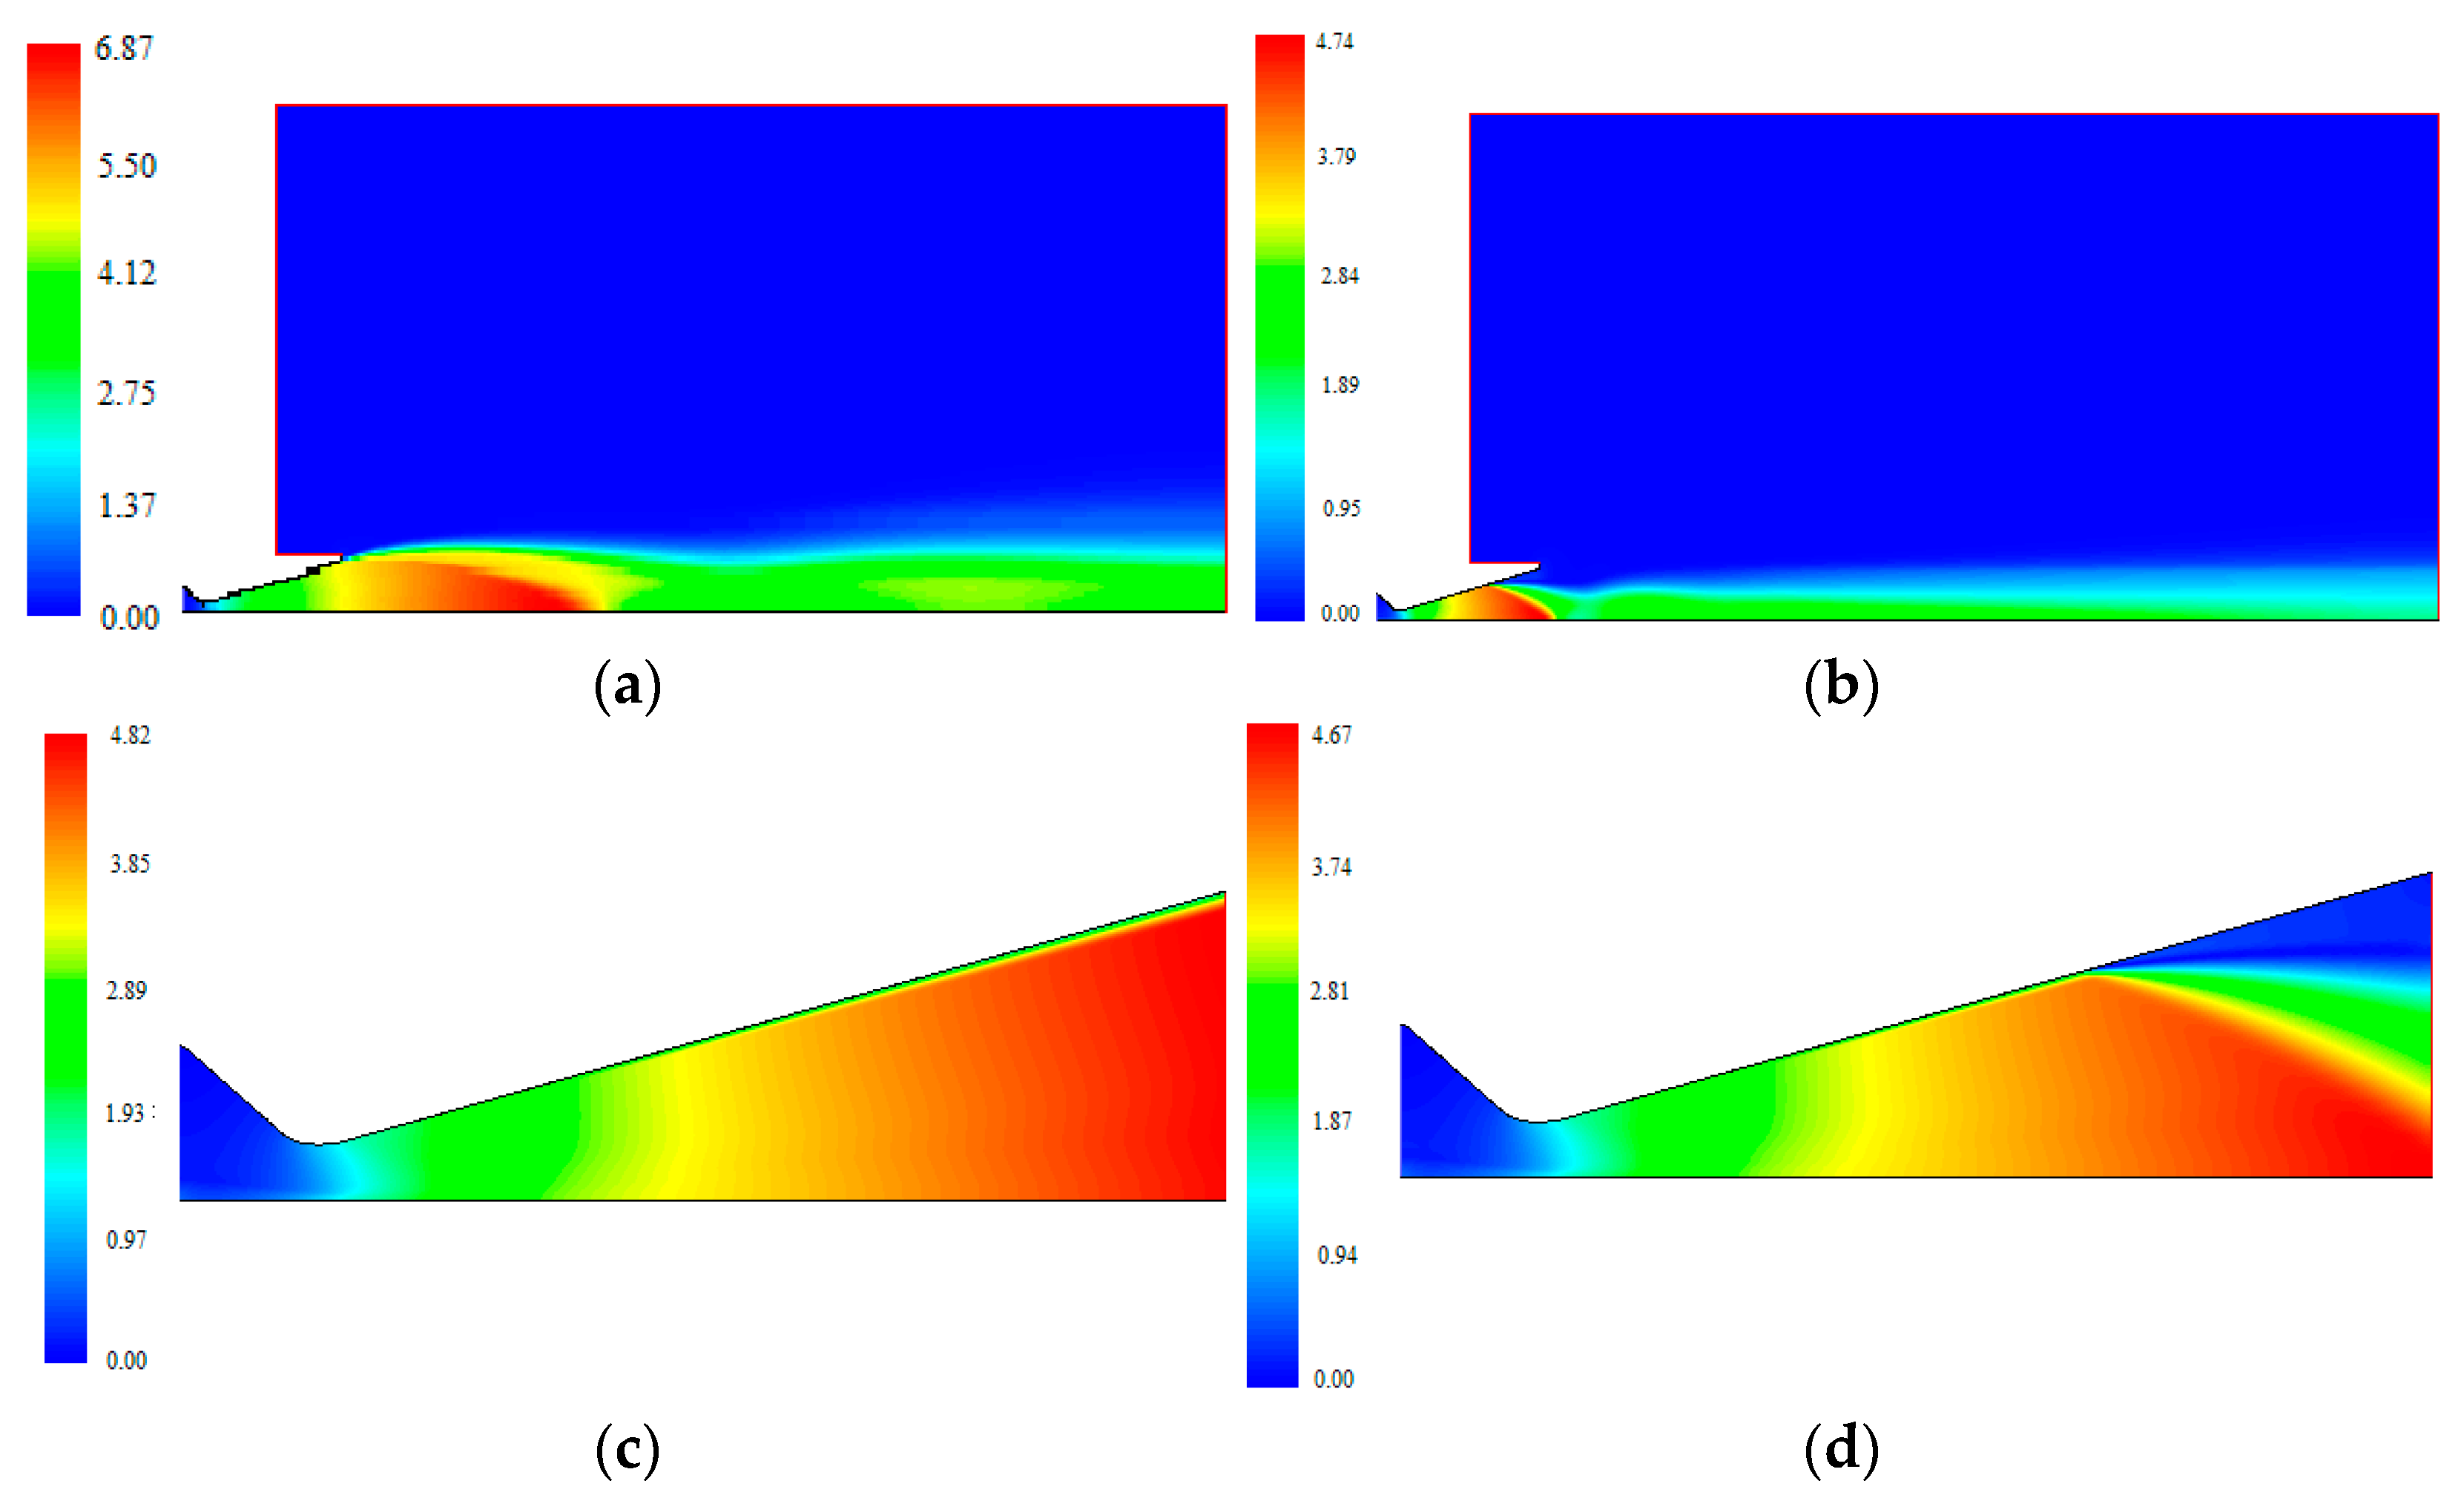
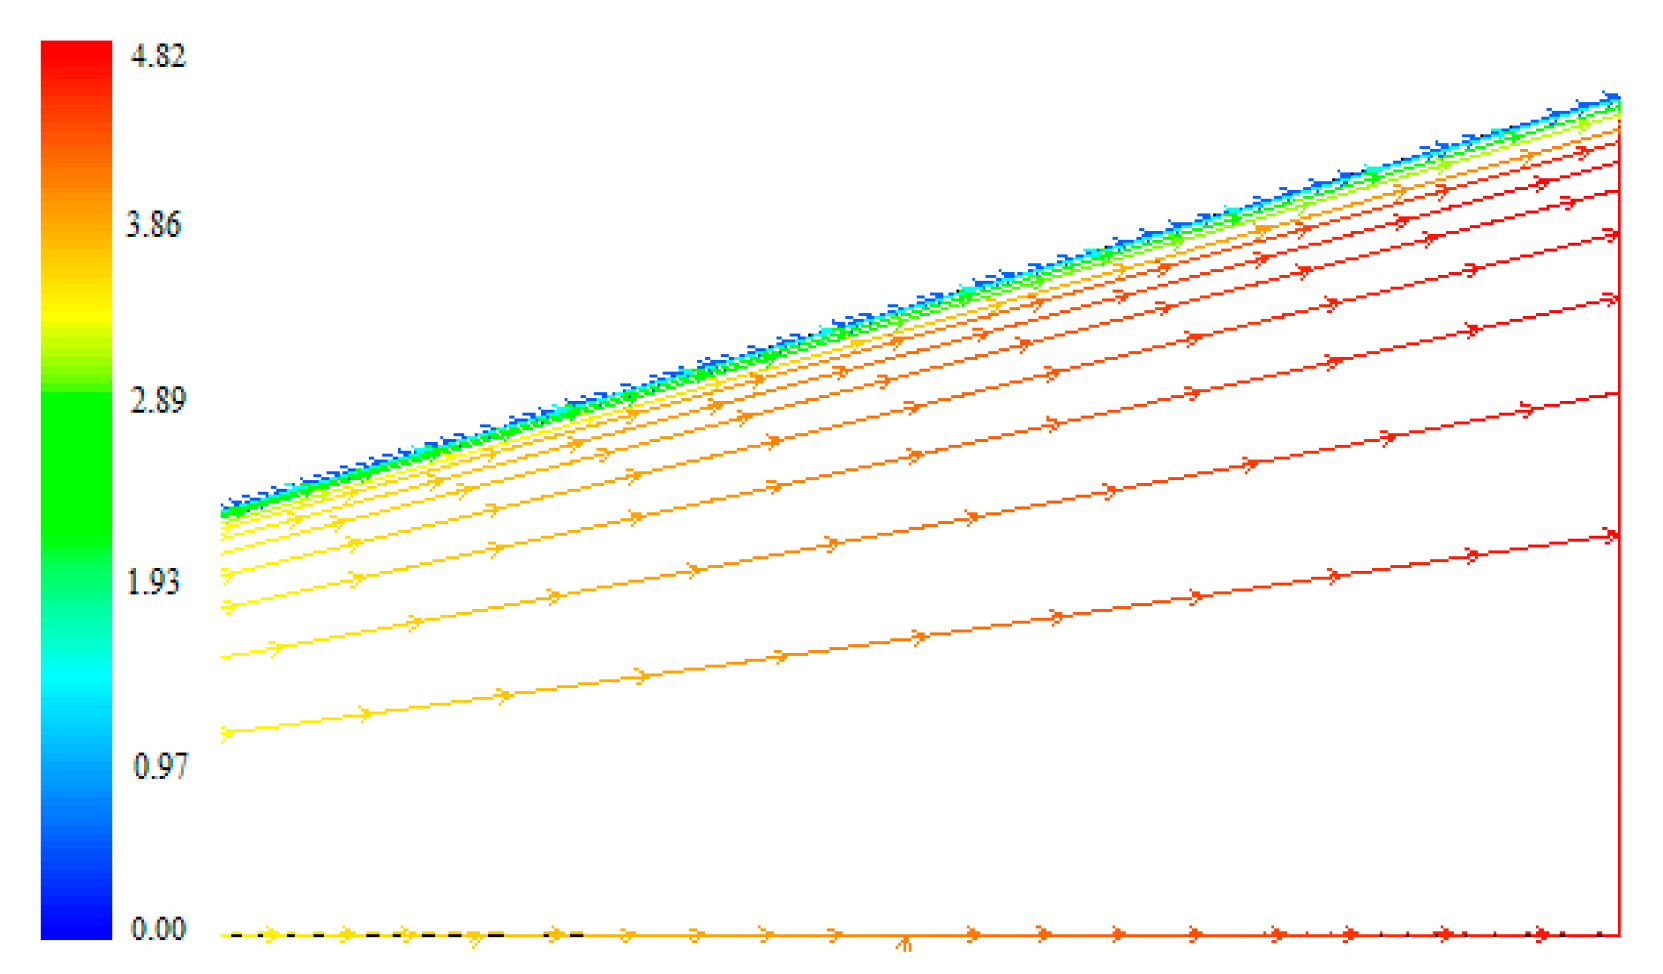
3.3. Analysis of Calculation Results

It can be found in Figure 8 that under the same total inlet pressure, the ambient pressure is different, and the flow field shape in the nozzle is also different. Under high- altitude conditions, the flow field in the nozzle is in a state of full flow, and the gas expands further outside the nozzle outlet. Under ground conditions, significant flow separation occurs in the nozzle, and oblique shock waves are generated near the separation point. After the shock wave is separated, a recirculation zone is formed. The flow velocity in the recirculation zone is very low, and the flow direction near the wall is opposite to the main flow direction, as shown in Figure 9. When the total inlet pressure is the same, the air flows close to the wall under high-altitude conditions, and there is no recirculation zone. The Mach number streamline diagram is shown in Figure 10.
According to the calculation results, the temperature distribution and pressure distribution of the inner wall of the nozzle can be obtained. The temperature distribution and pressure distribution of the inner wall of the nozzle under high-altitude and ground conditions with Pc = 4.34 MPa are shown in Figure 11 and Figure 12, respectively.
Figure 11 shows that the increase in the axial distance; the temperature of the inner wall of the nozzle shows a decreasing trend under the high-altitude conditions and reaches the lowest at the outlet of the nozzle. Under ground conditions, the temperature of the inner wall of the nozzle first decreases; at ε = 11.7, it reaches the lowest point, then suddenly rises to around 300 K and remains basically unchanged after that. Similar to the changing trend in temperature, the pressure on the wall of the nozzle decreases with the increase in the axial distance under high-altitude conditions, and the pressure on the wall also shows a trend of first decreasing, then suddenly increasing and reaching a stable value close to the atmospheric pressure under ground conditions (Figure 12).
The reason for the above change trend is that, under high-altitude conditions, due to the low ambient pressure, the airflow in the nozzle is in an under-expanded state, and the airflow continues to expand and accelerate in the nozzle, resulting in a continuous decrease in temperature and pressure. Under ground conditions, due to the large ambient pressure, shock waves appear in the nozzle, and the flow in the boundary layer is subsonic, so the high pressure generated after the wave propagates upstream through the subsonic layer in the boundary layer, causing the pressure in the upstream boundary layer to increase, the velocity to decrease and boundary layer thickening, forcing the boundary line of the boundary layer to turn outward, resulting in an oblique shock wave. The reverse pressure gradient caused by the shock wave is very large, resulting in the separation of the boundary layer. The airflow will decelerate and pressurize after passing through the oblique shock wave, and the flow velocity in the separation zone behind the wave is very low, so the temperature and pressure remain basically unchanged. The location corresponding to the lowest point of temperature and pressure is the location of the separation point.
According to this temperature change trend on the inner wall, the temperature in the area before the separation point is lower, which leads to a decrease in the saturated vapor pressure near the outer wall upstream of the nozzle (ε < 11.7), and the moisture in the air condenses on the outer wall. The phenomenon of the “frosting” upstream of the outer wall is consistent with the trend of the temperature change on the inner wall.
Comparing the calculated wall pressure with the experimental results, they are in good agreement as a whole, but the experimentally measured value at the same axial position before the separation point is higher than the numerical simulation value, as shown in Figure 13. This is because compressed air was used as the working medium, and the moisture contained in working gas will condense due to the decrease in temperature during the flow process. Due to the speed lag of the condensed phase components, the actual flow velocity in the nozzle is lower than the calculated value of the ideal gas in the simulation. Therefore, the static pressure at the measuring point is higher than the calculated value. After the separation point, as the flow velocity in the reflux zone is low, and the temperature is close to the atmospheric environment, there is no moisture condensation, so the static pressure at the measurement point is very close to the calculated value. The calculated results at other inlet total pressures are also in good agreement with the experimental measurements, as shown in Figure 14; the maximum error of the entire calculation is 7.9%.
Comparing the position of the separation point under different total inlet pressures, it was found that with the increase in the total inlet pressure, the separation point moves towards the nozzle outlet. According to the calculation results, the minimum value of the wall pressure and the separation pressure can be obtained. Figure 15 shows the calculated values of the separation pressure under different total inlet pressures.
It was found that the separation pressure varies with the total inlet pressures, and the separation pressure tends to decrease with the increase in the total inlet pressure. The main reason for this phenomenon is that the separation occurs when the kinetic energy of the air in the boundary layer is insufficient to overcome the reverse pressure gradient after the separation shock. As the total inlet pressure increases, the position of the separation point is closer to the nozzle’s downstream. The gas velocity before the separation point is also greater, and the external atmospheric pressure needs to overcome the larger airflow kinetic energy in the boundary layer to generate airflow separation. However, under ground conditions, the external atmospheric pressure is unchanged, so the closer the nozzle’s downstream is, the wall pressure at the separation point is also smaller.

4. Calculation of Nozzle Fluid Structure Interaction

4.1. Calculation Model and Condition Setting

Taking the full-scale motor nozzle as the analysis object, the physical model structure is shown in Figure 16. The total length of the nozzle is 1154 mm, the throat diameter is Φ 163 mm, and the maximum expansion ratio is 48. In the calculation, the flow field in the nozzle and a cylindrical external field are taken as the calculation area, and the size of the external field is Φ 2500 mm × 3000 mm. Similarly, the full-size engine nozzle is designed for full flow operation at a high altitude. The given pressure is within its set allowable value.
The specific meshing parameters are as follows: the axial grids are evenly distributed, the grid size is 4 mm, the thickness of the first layer of the boundary layer grid size is 0.02 mm, and the grid size growth ratio is 1.3, and when the grid in the outer field area is farther from the nozzle outlet, the sparser the division. As shown in Figure 17, the mapping of the grids in all calculation areas is good. The grids are arranged according to the flow direction, and the boundary is densified. The body fitting effect is good, meeting the flow field characteristics and the uniform transition of the grids at the connections of different regions. The circumferential grids are uniformly distributed, the number of nodes is 48, and the flow field mesh is shown in Figure 17.
The nozzle structure adopts an unstructured mesh, and the grid size is set to 10 mm, which is automatically generated by meshing. The mesh is shown in Figure 18.
The actual structure of the nozzle is composed of a variety of composite materials. The materials are anisotropic. The performance of the nozzle in all directions is related to the nozzle design and winding process. The interaction between different materials is very complex, so it is difficult to calculate in practice. In order to reflect the main problems, the structure of the nozzle was simplified in the calculation, and the nozzle was considered to be composed of a single isotropic composite material. The main parameters of the material are ρ = 1550 kg/m3, Poisson ratio γ = 0.2, and elastic modulus E = 1.5 × 10⁴ MPa.
In the flow field calculation, the gas in the nozzle was treated as follows: the density was treated as an ideal gas; the constant pressure specific heat capacity and molecular weight were fixed values, respectively; the constant pressure specific heat Cp was equal to 4155 J/kg·K; the average molecular weight M was equal to 28.75 g/mol; and the viscosity coefficient followed Sutherland’s three-coefficient formula. The gas material parameters were set in Fluent, and the chemical reactions and two-phase flow were not considered in the calculation process.
For this large expansion ratio Laval nozzle, when the engine is working at a high altitude and in an accelerated state, the pressure in the nozzle decreases, the temperature decreases, and the gas expands and accelerates. In the accelerated state, the process of heat exchange between the wall and the external gas is instantaneous, so the wall can be regarded as an external adiabatic wall. As the research focus is to compare the influence of the airflow state in the nozzle and the nozzle structure under different pressure conditions, we believe that the environmental temperature and altitude have little influence on the experimental results, so the effects of their changes were not considered the influence caused by their changes.

4.2. Analysis of Flow Field Results

First, the flow field distribution in the nozzle under ground (Pa = 94 kPa) and high- altitude conditions (Pa = 10 kPa) were calculated when the total inlet pressure was Pc = 6 MPa. Taking the z = 0 symmetry plane of the nozzle as the parameter distribution surface, the Mach number distribution cloud map in the nozzle was obtained according to the calculation results, as shown in Figure 19.
Figure 19 shows that flow separation occurs in the nozzle under ground conditions, and the airflow is in a state of overexpansion. After separation, the airflow does not re-attach, showing free shock separation (FSS). From the shape of the separation flow field, the separation appears as a Mach disk shock mode, which is characterized by the shock wave at the nozzle axis showing a flat disk shape. After the oblique shock wave separated from the wall, it intersects with the normal shock wave of the Mach disk and reflects outward and then reflects on the downstream free boundary of the jet to form a series of alternating expansion–compression wave structures. Figure 19 shows, under high-altitude conditions, the flow in the nozzle is in a state of full flow; the airflow continues to expand after the nozzle exit, and the airflow in the nozzle is in a state of under-expansion.
In the post-processing of the CFD-post, the z = 0 section is intersected with the nozzle wall, resulting in two intersection lines called 0° and 180° intersections. According to the calculation results, the wall pressure distribution on the two intersection lines can be drawn, as shown in Figure 20.
The results in Figure 20 show that under the conditions of ground separation, the wall pressure distribution curves of the intersecting lines at different angles do not completely overlap. Before reaching the minimum pressure, the curves of the intersecting lines at different angles overlap well; after the minimum pressure, the curves begin to deviate, so it can be concluded that under the condition of flow separation, the flow is very uniform, and the flow symmetry is good before the separation point; but after flow separation, the uniformity of the flow field is destroyed and deviates from its symmetry.
Under the condition of high-altitude conditions, the wall pressure distribution curves of intersecting lines at different angles overlap well, which shows that flow separation is the reason for the asymmetry of the flow field. Moreover, from the wall pressure curve under high-altitude conditions, it can be found that the wall pressure at the nozzle outlet is 10 kPa higher than the ambient pressure, which is also the reason why the airflow continues to expand after its ejection from the nozzle outlet.
The lateral load in the nozzle can be obtained by integrating the wall pressure with the wall, as shown in Table 4.
It was found that no matter whether the inlet pressure is 3 or 6 MPa, the lateral load of the nozzle under ground conditions is greater than at a high altitude, especially under low pressure conditions (Pc = 3 MPa); the lateral load difference is 47.9 times. Under the separation conditions, when the inlet pressure is high (Pc = 6 MPa), the lateral load is also small (1 × 10² N order of magnitude) due to the uniform flow field distribution. When the inlet pressure is low (3 MPa), the degree of asymmetry increases the asymmetric pressure distribution of the separation section, and its nozzle’s downstream leads to a large lateral load (1 × 10³ N order of magnitude).

4.3. Structure Analysis Result

The results of the flow field were input into the structural calculation of the nozzle as boundary conditions, and the structural analysis of the nozzle was carried out. The total deformation and von Mises stress results of the nozzle structure were obtained, as shown in the following figures (Figure 21, Figure 22, Figure 23 and Figure 24).
According to the cloud map of structural deformation, no matter whether the total inlet pressure is high (6 MPa) or low (3 MPa) and whether it is under ground or high-altitude conditions, the overall deformation trend of the nozzle increases with the increase in the axial distance, and the maximum deformation occurs at the nozzle outlet. The isosurface of the nozzle deformation does not show a uniform circular shape. When the total inlet pressure is 6 MPa, the difference between the maximum deformation under high-altitude and ground conditions is small at 0.30 and 0.34 mm, respectively. When the total inlet pressure is reduced to 3 MPa, the maximum deformation under high-altitude conditions is reduced to 0.14 mm, and the maximum structural deformation under ground conditions is 1.86 mm. This shows that with the decrease in the total inlet pressure, the asymmetry of the flow field after the separation point increases, and the maximum structural deformation of the nozzle will increase accordingly.
The von Mises stress distribution results show that, under high-altitude conditions, the stress isosurface of the nozzle presents a regular annular distribution and a downward trend along the axis, which indicates that the distribution of the flow field is relating uniformly, and the pressure on the inner wall of the nozzle is monotonous in its decline along the axis. Under ground conditions, the overall stress distribution first decreases and then increases along the axis. The stress distribution is uniform when the inlet pressure is 6 MPa, and the stress distribution is obviously asymmetric when the inlet pressure is 3 MPa.
According to the above flow field calculation and structural calculation results, it can be concluded that, under ground conditions, due to the high ambient pressure, the flow in the nozzle will be separated. The lateral loads will then cause a significant deformation of the nozzle structure.

5. Conclusions

(1)
A cold flow test under ground conditions was carried out. The flow separation phenomenon was observed in the test, and the pressure distribution on the nozzle wall was measured. The pressure data before and after the separation point were analyzed, and the difference in pressure pulsation characteristics before and after the separation point were obtained. Before the separation point, the pressure pulsation was small, and after the separation point, the pressure pulsation increased sharply, and the turbulent pulsation effect was significantly enhanced. A numerical simulation of the nozzle flow field under the test conditions was carried out, and the calculated results were compared with the experimental values. The results were in good agreement, which verified the accuracy of the numerical calculation.
(2)
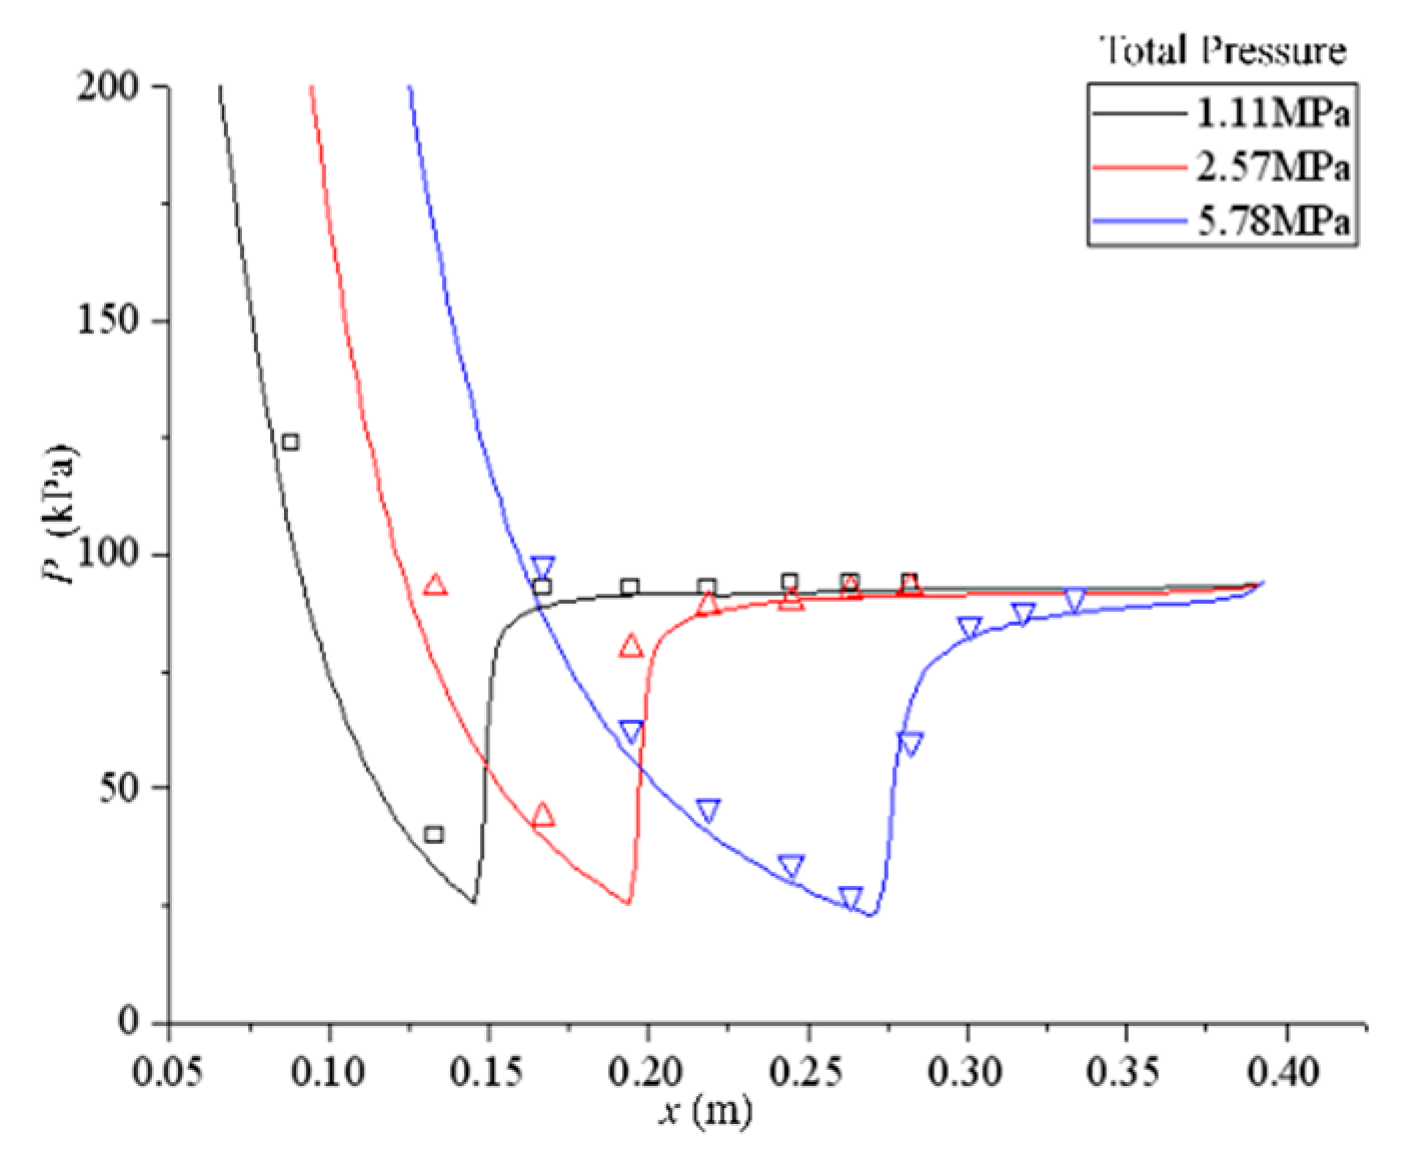
A three-dimensional model was established for the above nozzle, and a numerical simulation under steady conditions was carried out using Fluent software, and the three-dimensional flow field distribution of the nozzle was obtained. From the Mach number distribution diagram of the nozzle section and the wall pressure distribution, it can be found that the separation flow field presents a certain asymmetry, and the wall pressure at the same axial position after the separation point is different. The lateral load was obtained by integrating the pipe wall surface. Under different total inlet pressures, the lateral load was different; their magnitudes decreased with the increase in total inlet pressure, and the directions were randomly distributed.
(3)
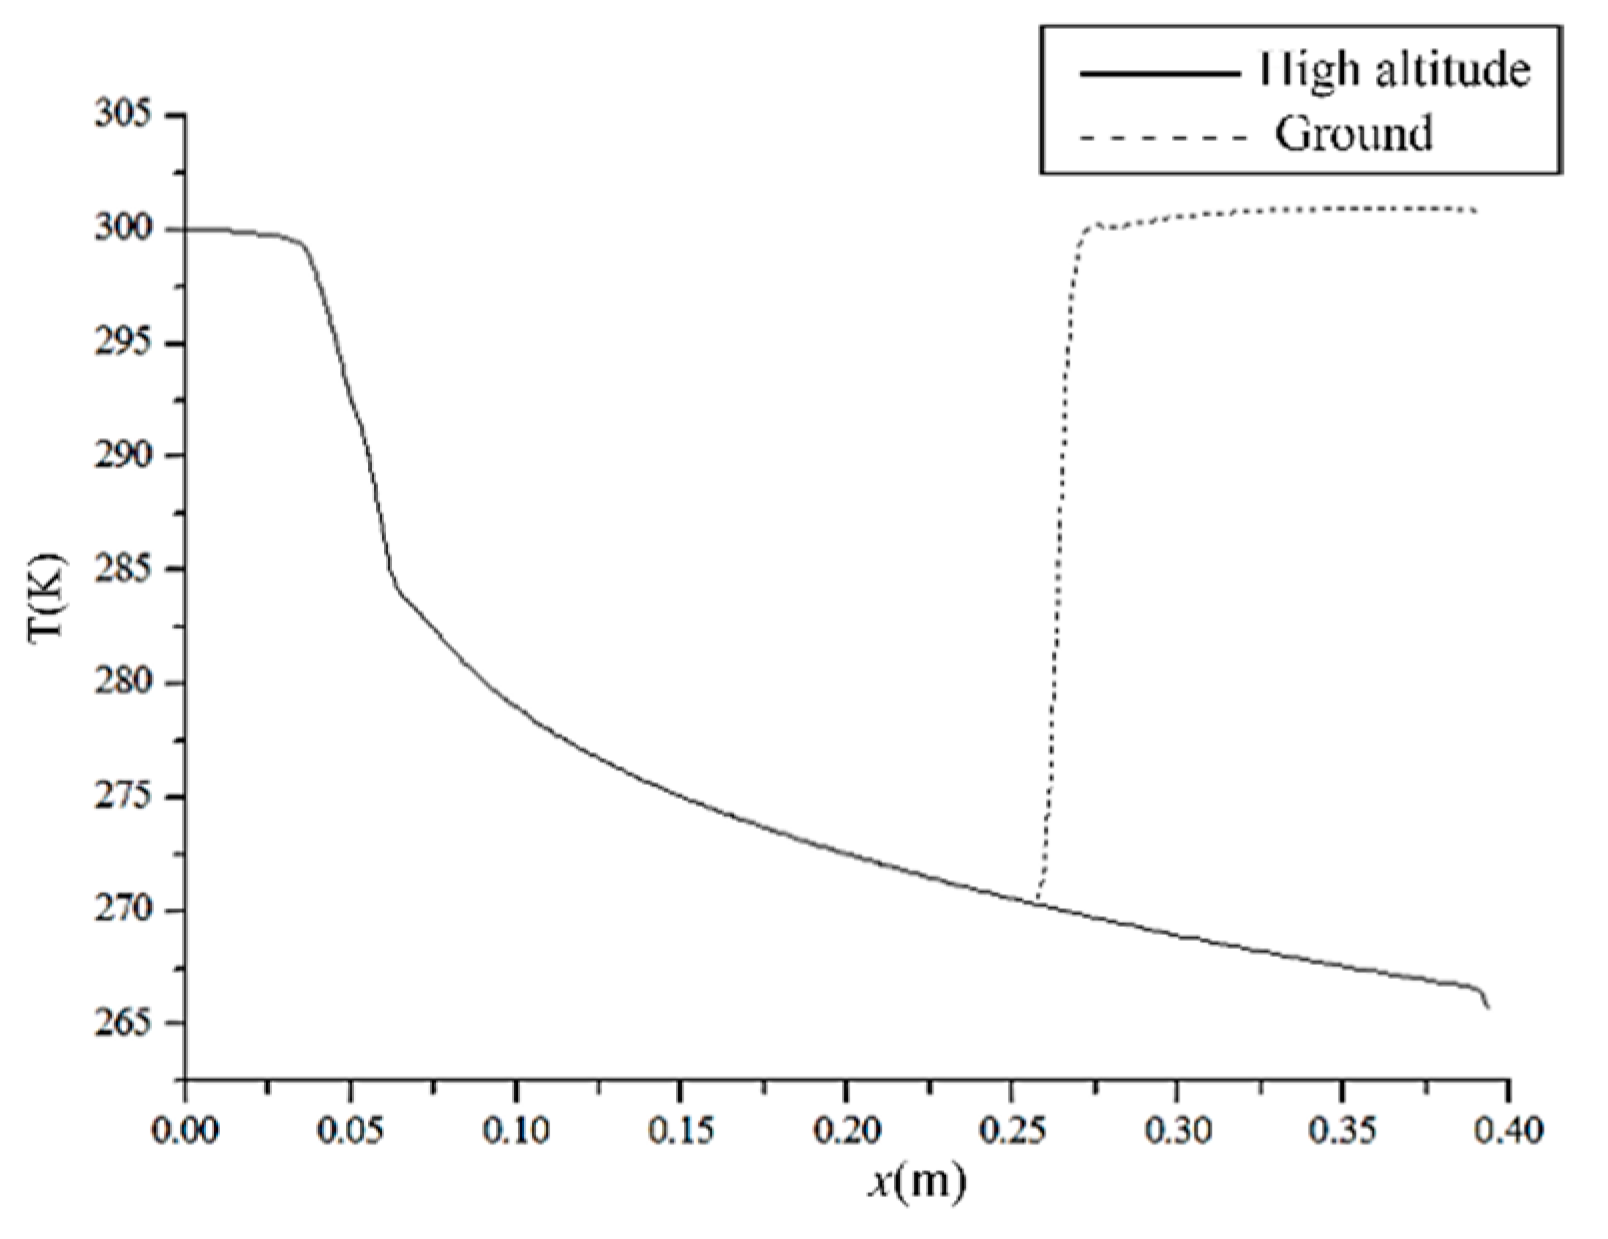
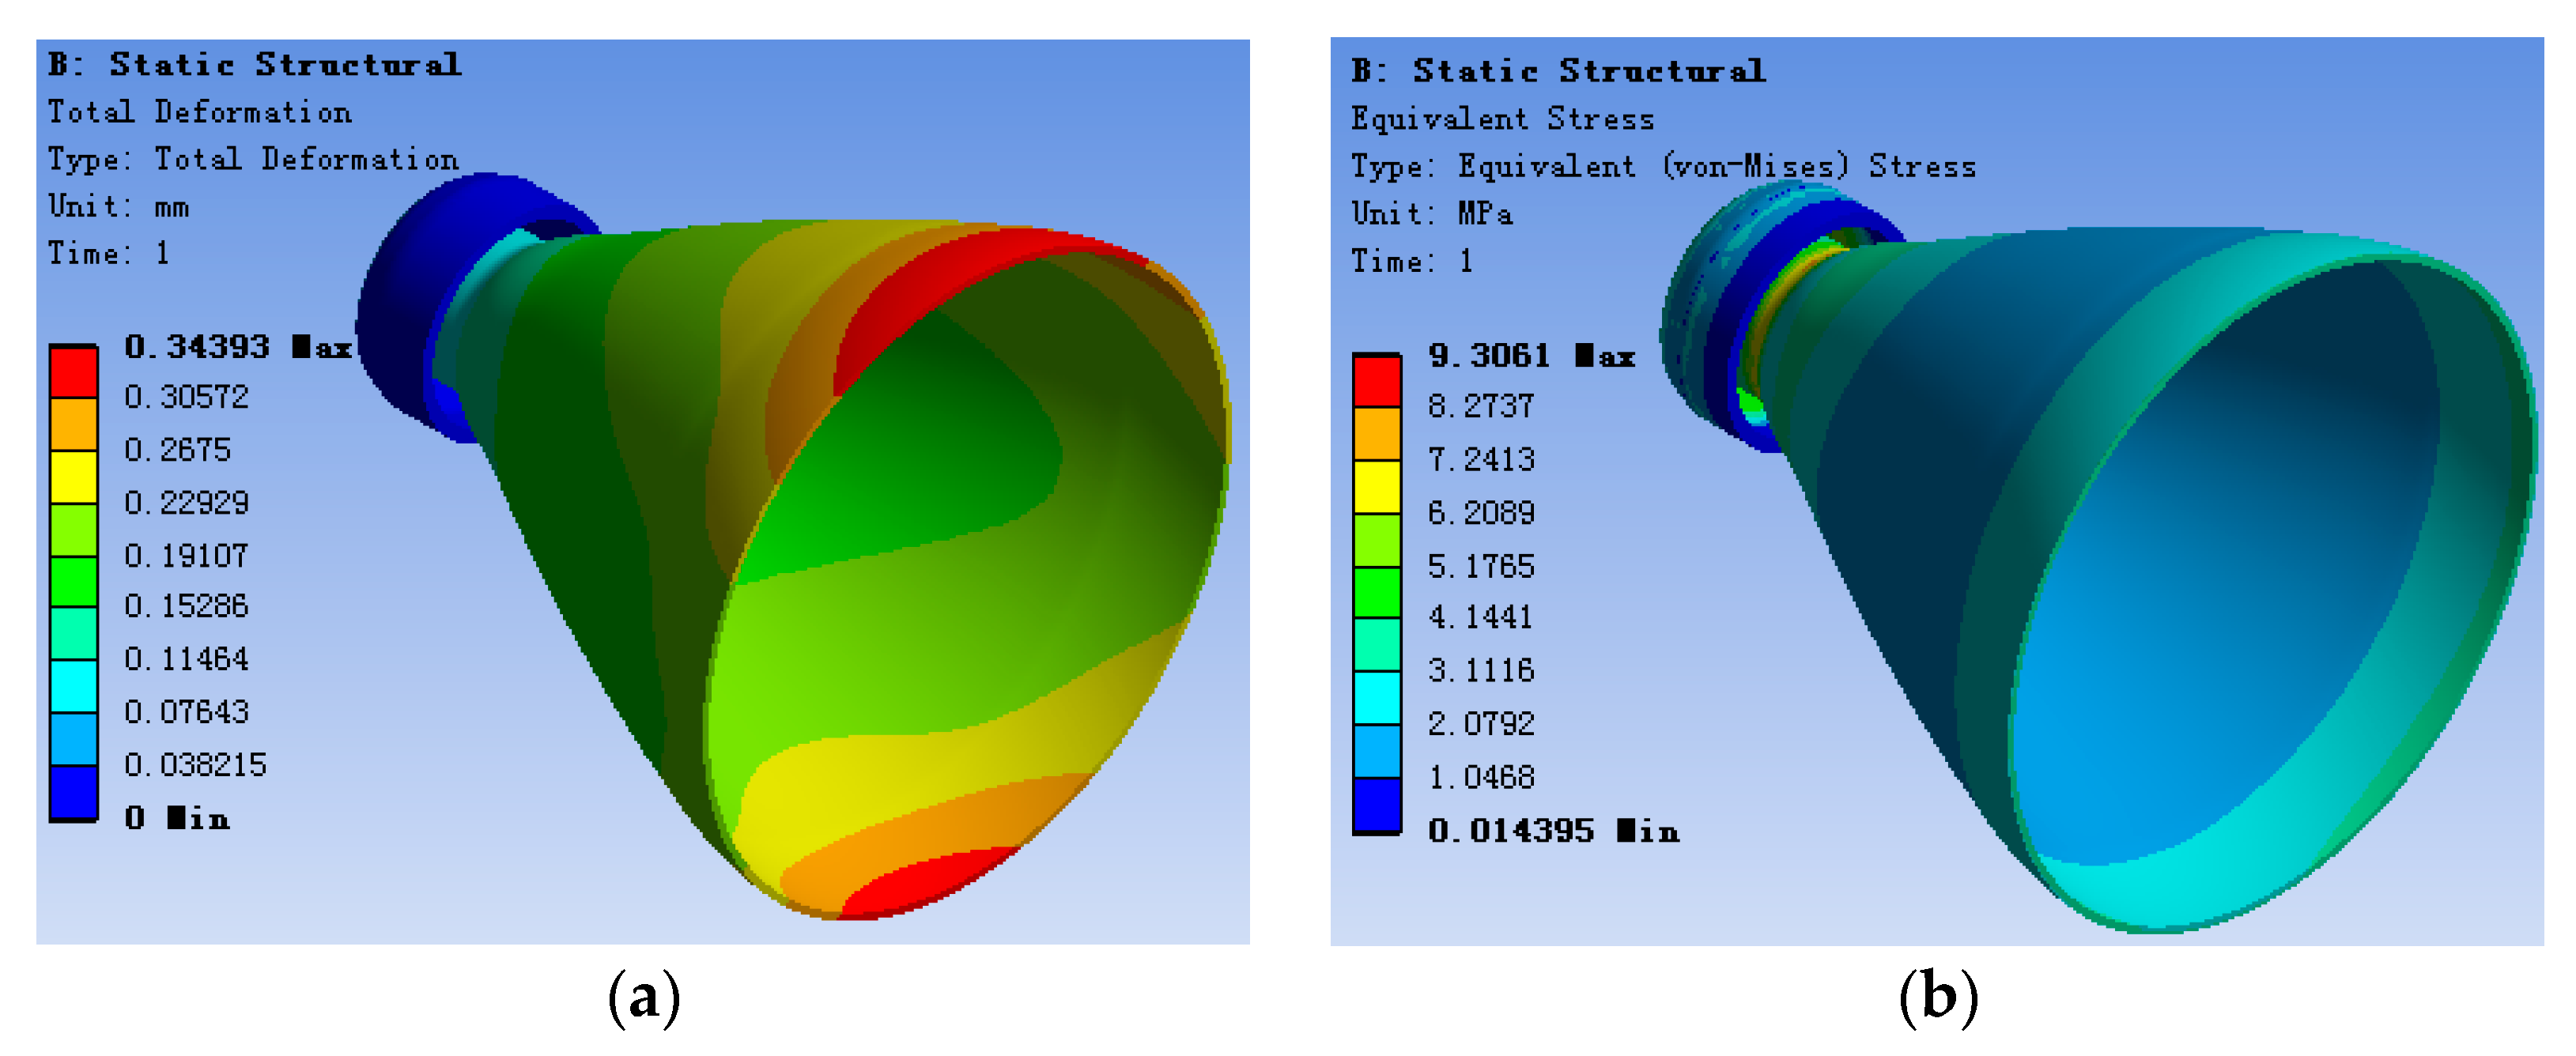
The one-way coupling method was used to analyze the fluid–structure coupling of the full-scale nozzle, and the flow field distribution and structural deformation of the nozzle under different total pressures, and ground and high-altitude conditions were calculated, respectively. The calculation results show that under the conditions of high altitude, when the flow in the nozzle is in a state of full flow, the flow symmetry is good; the stress at the nozzle wall shows a downward trend along the axis, and the structural deformation of the nozzle is small. When the flow separation occurs in the nozzle, the nozzle will be asymmetric. The stress on the nozzle wall first decreases and then increases along the axis, and the structural deformation of the nozzle is larger than under high-altitude conditions. As the total pressure decreases, the lateral load of the nozzle will increase under ground conditions, and the structural deformation of the nozzle will increase sharply.

Author Contributions

Conceptualization, W.T.; Data curation, Z.W.; Formal analysis, C.W.; Funding acquisition, W.T.; Methodology, Z.W.; Resources, W.T.; Supervision, W.T.; Validation, C.W.; Visualization, Z.W.; Writing—original draft, Z.W. and C.W.; Writing—review & editing, Z.W. and C.W. All authors have read and agreed to the published version of the manuscript.

Funding

This work was supported by the Application Innovation Plan Project of China Aerospace Science and Technology Group (No.6230112002), the Basic Research Project (No. 514010304-302-2), and the National Natural Science Foundation of China (No. 11772245).

Conflicts of Interest

The authors declare no conflict of interest.

References

  1. Stark, R.; Génin, C. Flow separation in rocket nozzles under high altitude condition. J. Shock Waves 2017, 27, 63–68. [Google Scholar] [CrossRef] [Green Version]
  2. Li, G.; Liu, Q.; Han, X.; Guo, Y. Influence study of flow separation on the nozzle vibration response. J. Propuls. Power Res. 2016, 5, 108–117. [Google Scholar] [CrossRef] [Green Version]
  3. Jia, R.; Jiang, Z.; Zhang, W. Numerical analysis of flow separation and side loads of a conical nozzle during staging. J. Proc. Inst. Mech. Eng. Part G J. Aerosp. Eng. 2016, 230, 845–855. [Google Scholar] [CrossRef]
  4. Pei, L.; Geng, L.; Li, Z. Experimental study on cold separation flow in large expansion ratio nozzle. J. Exp. Fluid Mech. 2017, 31, 62–66. [Google Scholar]
  5. Martelli, E.; Saccoccio, L.; Ciottoli, P.P.; Tinney, C.E.; Baars, W.J.; Bernardini, M. Flow dynamics and wall-pressure signatures in a high-Reynolds-number overexpanded nozzle with free shock separation. J. Fluid Mech. 2020, 895, A29. [Google Scholar] [CrossRef]
  6. Conejo, A.N.; Mishra, R.; Mazumdar, D. Effects of Nozzle Radial Position, Separation Angle, and Gas Flow Partitioning on the Mixing, Eye Area, and Wall Shear Stress in Ladles Fitted with Dual Plugs. J. Metall. Mater. Trans. B 2019, 50, 1490–1502. [Google Scholar] [CrossRef]
  7. Lee, J.; Shin, J.; Sung, H.-G. Assessment of Turbulence Models with Compressibility Correction for Large Flow Separation in a Supersonic Convergent-Divergent Rectangular Nozzle. J. Aerosp. Syst. Eng. 2018, 12, 40–47. [Google Scholar]
  8. Chaudhuri, A.; Hadjadj, A. Numerical investigations of transient nozzle flow separation. J. Aerosp. Sci. Technol. 2016, 53, 10–21. [Google Scholar] [CrossRef]
  9. Lee, C.; Choi, K.; Kim, C.; Han, S. Computational investigation of flow separation in a thrust-optimized parabolic nozzle during high-altitude testing. J. Comput. Fluids 2020, 197, 104363. [Google Scholar] [CrossRef]
  10. Verma, S.B.; Haidn, O. Cold gas testing of thrust-optimized parabolic nozzle in a high-altitude test facility. J. Propuls. Power 2011, 27, 1238–1246. [Google Scholar] [CrossRef]
  11. Wang, T.-S. Transient three-dimensional startup side load analysis of a regeneratively cooled nozzle. J. Shock Waves 2009, 19, 251–264. [Google Scholar] [CrossRef] [Green Version]
  12. Ko, S.-H.; Kim, C. Separation motion of strap-on boosters with base flow and turbulence effects. J. Spacecr. Rocket. 2008, 45, 485–494. [Google Scholar] [CrossRef]
  13. Verma, S.B.; Haidn, O. Study of restricted shock separation phenomena in a thrust optimized parabolic nozzle. J. Propuls. Power 2009, 25, 1046–1057. [Google Scholar] [CrossRef]
  14. Yaravintelimath, A.; Raghunandan, B.N.; Moríñigo, J.A. Numerical prediction of nozzle flow separation: Issue of turbulence modeling. J. Aerosp. Sci. Technol. 2016, 50, 31–43. [Google Scholar] [CrossRef]
  15. Shimshi, E.; Ben-Dor, G.; Levy, A.; Krothapalli, A. Asymmetric and Unsteady Flow Separation in High Mach Number Planar Nozzles. J. Int. J. Aeronaut. Sci. Aerosp. Res. (IJASAR) 2015, 2, 65–80. [Google Scholar]
  16. He, M.; Qin, L.; Liu, Y. Numerical investigation of flow separation behavior in an over-expanded annular conical aerospike nozzle. J. Chin. J. Aeronaut. 2015, 28, 983–1002. [Google Scholar] [CrossRef] [Green Version]
  17. Verma, S.B.; Manisankar, C. Origin of flow asymmetry in planar nozzles with separation. J. Shock. Waves 2014, 24, 191–209. [Google Scholar] [CrossRef]
  18. Bej, N.; Sinhamahapatra, K.P. CFD Study on the Effects of Nozzle Number on Turbulent Flow and Energy Separation in a Ranque-Hilsch Vortex Tube. J. Appl. Mech. Mater. 2014, 465, 505–509. [Google Scholar] [CrossRef]
  19. Verma, S.B. Study of Flow Separation in Truncated Ideal Contour Nozzle. J. Propuls. Power 2002, 18, 1112–1121. [Google Scholar] [CrossRef]
  20. Beresh, S.J.; Henfling, J.F.; Erven, R.J. Flow Separation Inside a Supersonic Nozzle Exhausting into a Subsonic Compressible Crossflow. J. Propuls. Power 2003, 19, 655–662. [Google Scholar] [CrossRef]
Figure 1. Two aerodynamic separation modes in nozzle. (a) Free shock separation. (b) Confined shock separation.
Aerospace 10 00004 g001
Figure 2. Schematic diagram of the test analysis system.
Aerospace 10 00004 g002
Figure 3. The distribution of the pressure test point.
Aerospace 10 00004 g003
Figure 4. Space face of the nozzle during the test of the nozzle.
Aerospace 10 00004 g004
Figure 5. Test-measured wall pressure, Pc = 4.34 MPa.
Aerospace 10 00004 g005
Figure 6. Schematic diagram of computing area.
Aerospace 10 00004 g006
Figure 7. Schematic diagram of the entire grid area.
Aerospace 10 00004 g007
Figure 8. Mach number of cloud map of flow field, Pc = 4.34 MPa. (a) High altitude full field. (b) Ground full field. (c) High altitude infield. (d) Ground infield.
Aerospace 10 00004 g008
Figure 9. The Mach number streamlines’ map under ground conditions, Pc = 4.34 MPa.
Aerospace 10 00004 g009
Figure 10. The Mach number streamlines’ map under high-altitude conditions, Pc = 4.34 MPa.
Aerospace 10 00004 g010
Figure 11. Temperature distribution, Pc = 4.34 MPa.
Aerospace 10 00004 g011
Figure 12. Pressure distribution, Pc = 4.34 MPa.
Aerospace 10 00004 g012
Figure 13. Comparison of numerical calculation and experimental wall pressures, Pc = 4.34 MPa.
Aerospace 10 00004 g013
Figure 14. Numerical calculation and experiment of other inlet total pressures.
Aerospace 10 00004 g014
Figure 15. The pressure at the separation point varies with the total inlet pressures.
Aerospace 10 00004 g015
Figure 16. Nozzle model.
Aerospace 10 00004 g016
Figure 17. Flow field grid. (a) Full field grid. (b) Nozzle outlet grid.
Aerospace 10 00004 g017
Figure 18. Nozzle structural grid.
Aerospace 10 00004 g018
Figure 19. Pc = 6 MPa. The cloud map of ground and high altitude. (a) Ground. (b) High altitude.
Aerospace 10 00004 g019
Figure 20. Pc = 6 MPa. The wall pressure distribution. (a) Ground. (b) High altitude.
Aerospace 10 00004 g020
Figure 21. Cloud map of ground nozzle properties. (Ground, 6 MPa.) (a) Structure deformation. (b) Stress distribution.
Aerospace 10 00004 g021
Figure 22. Cloud map of ground nozzle properties. (High altitude, 6 MPa.) (a) Structure Deformation. (b) Stress Distribution.
Aerospace 10 00004 g022
Figure 23. Cloud map of ground nozzle properties. (Ground, 3 MPa.) (a) Structure Deformation. (b) Stress Distribution.
Aerospace 10 00004 g023
Figure 24. Cloud map of ground nozzle properties. (High altitude, 3 MPa.) (a) Structure Deformation. (b) Stress Deformation.
Aerospace 10 00004 g024
Table 1. Pc = 4.34 MPa. Data statistical analysis results.
Test PointMinimum Pressure (kPa)Maximum Pressure (kPa)Peak-to-Peak Value (kPa)Standard Deviation (kPa)
P535.2737.712.440.307
P663.6675.9212.261.533
Table 2. Pc = 2.57 MPa. Data statistical analysis results.
Test PointMinimum Pressure (kPa)Maximum Pressure (kPa)Peak-to-Peak Value (kPa)Standard Deviation (kPa)
P341.7245.033.310.435
P463.7286.5522.833.308
Table 3. Pc = 5.78 MPa. Data statistical analysis results.
Test PointMinimum Pressure (kPa)Maximum Pressure (kPa)Peak-to-Peak Value (kPa)Standard Deviation (kPa)
P727.4529.802.350.381
P846.8170.2323.424.671
Table 4. Lateral loads under different working conditions.
Inlet Total PressureConditionThe Force of Y Axis (N)The Force of Z Axis (N)The Lateral Load (N)
3 MPaHigh altitude−17.39−28.5233.40
Ground−1530.90−467.171600.61
6 MPaHigh altitude7.24−1.7825.09
Ground100.74−52.46113.58
Disclaimer/Publisher’s Note: The statements, opinions and data contained in all publications are solely those of the individual author(s) and contributor(s) and not of MDPI and/or the editor(s). MDPI and/or the editor(s) disclaim responsibility for any injury to people or property resulting from any ideas, methods, instructions or products referred to in the content.

