
The Power of Data: How Traffic Demand and Data Analytics Are Driving Network Evolution toward 6G Systems


Abstract
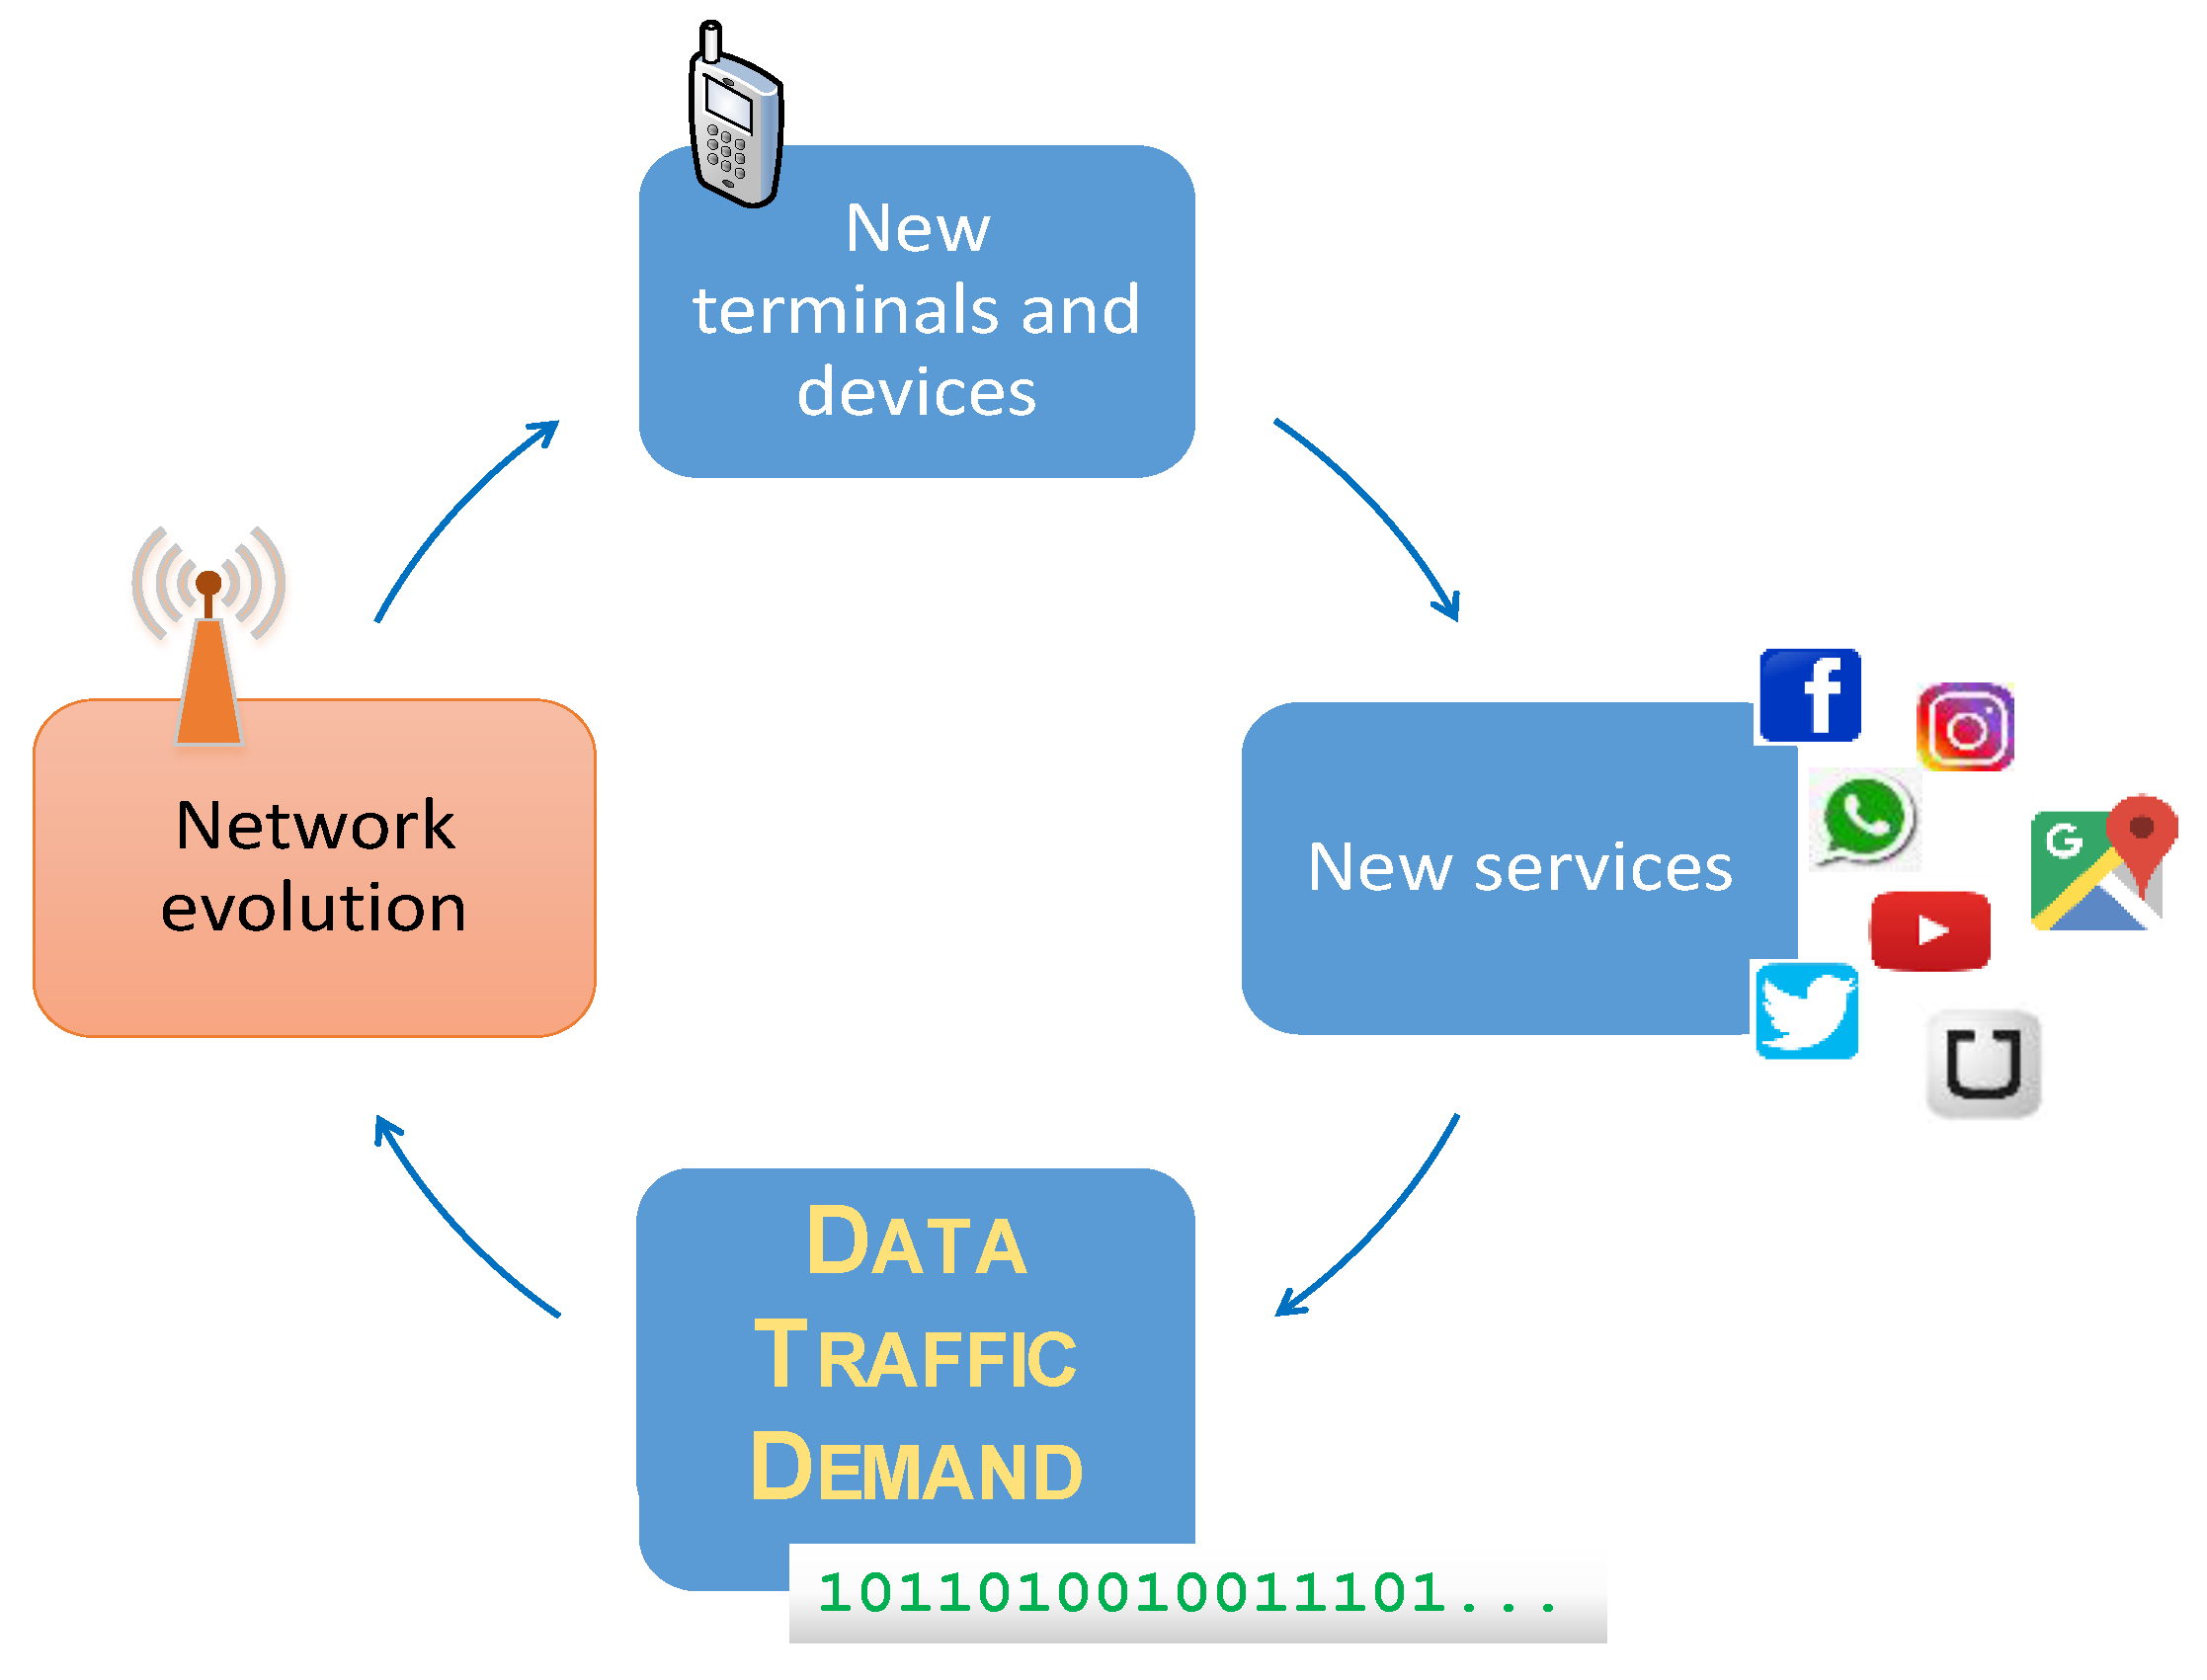
:1. Introduction
2. Data Traffic and Impact on Networks
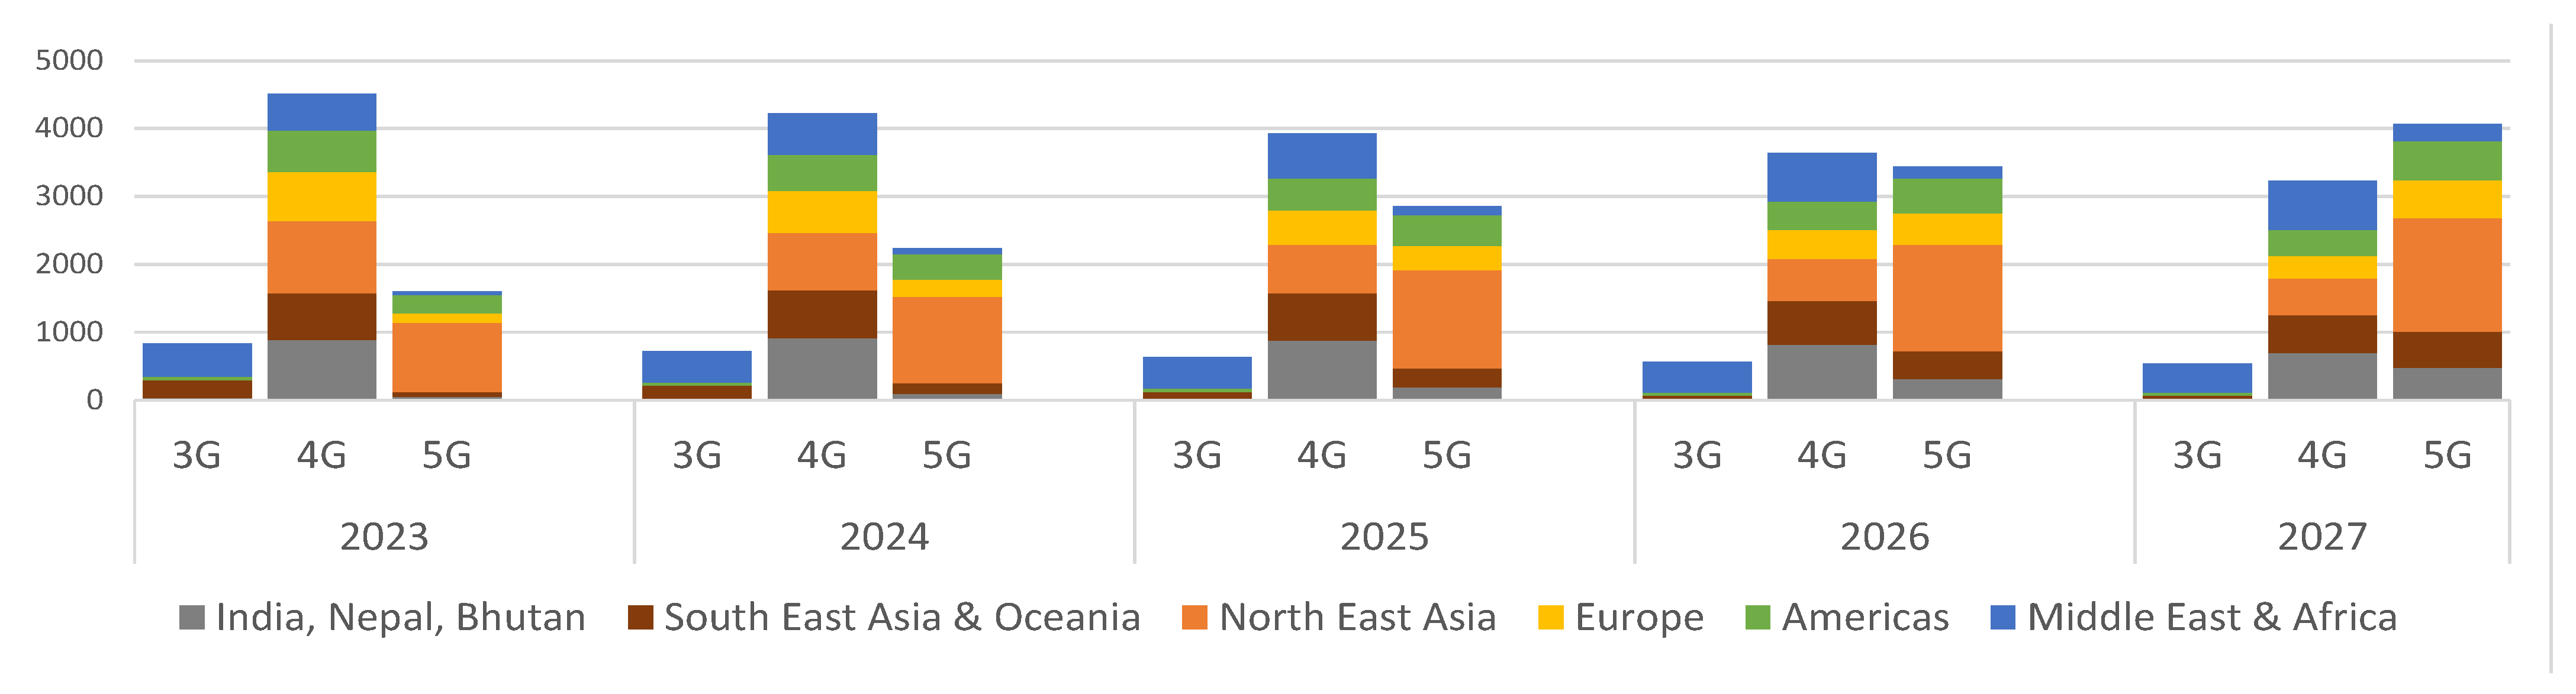
2.1. Data-Driven Insights from Global Forecasts
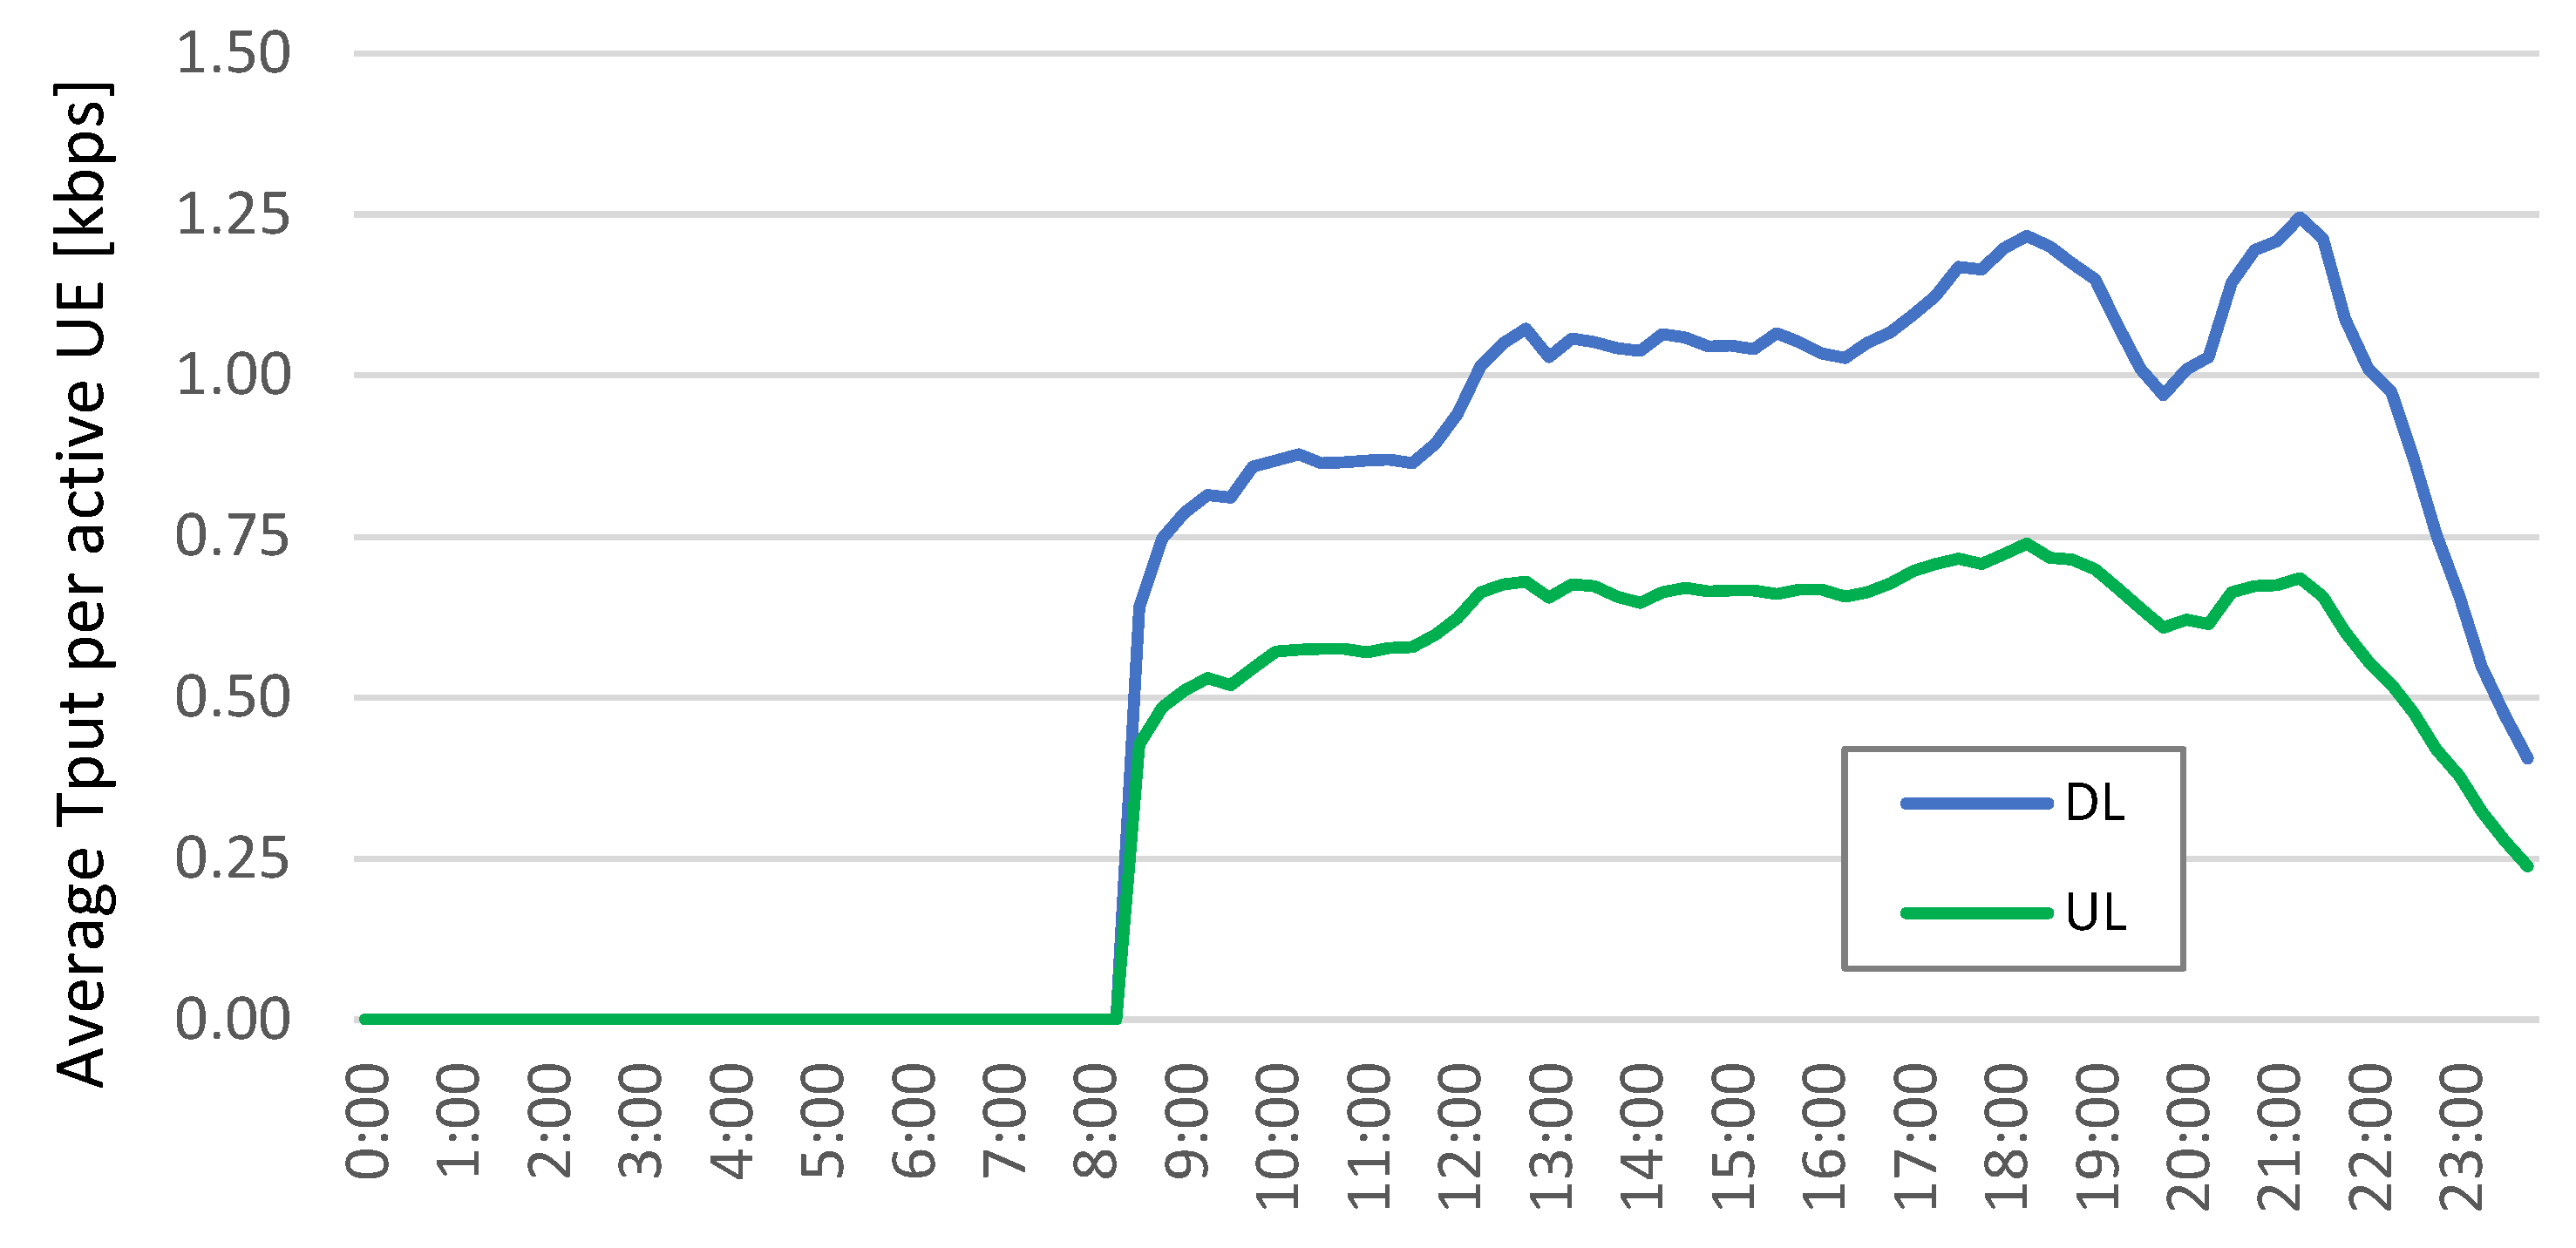
2.2. Considerations from Mobile Data Usage
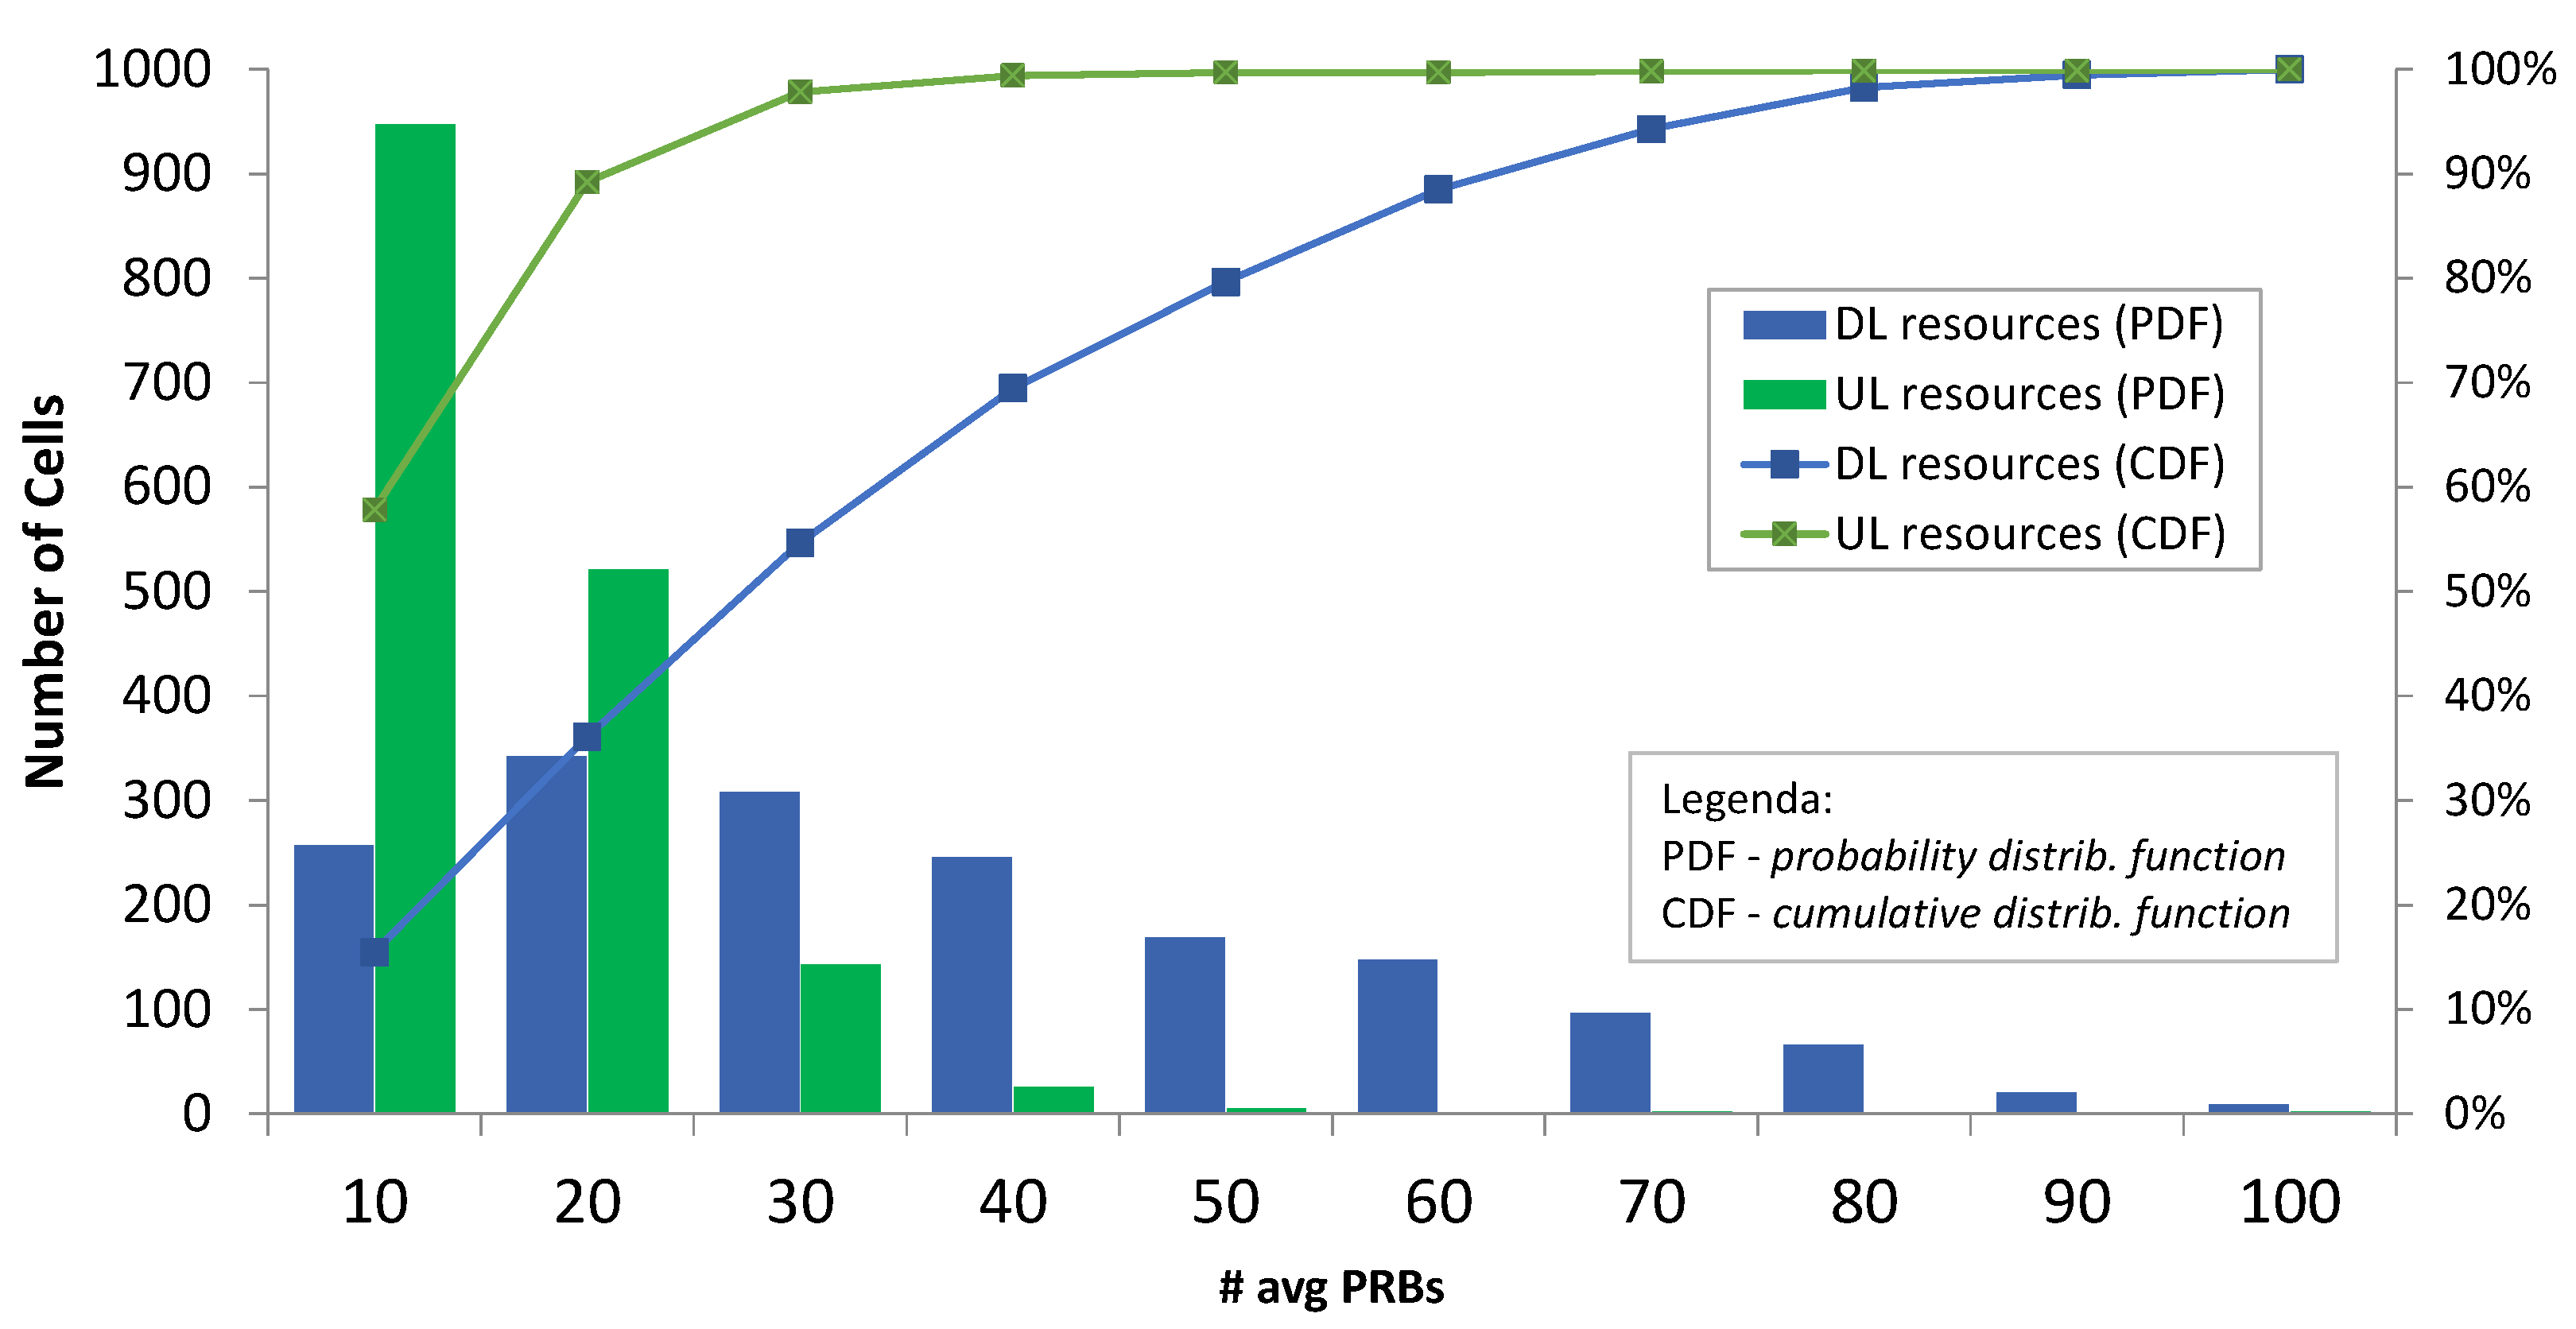
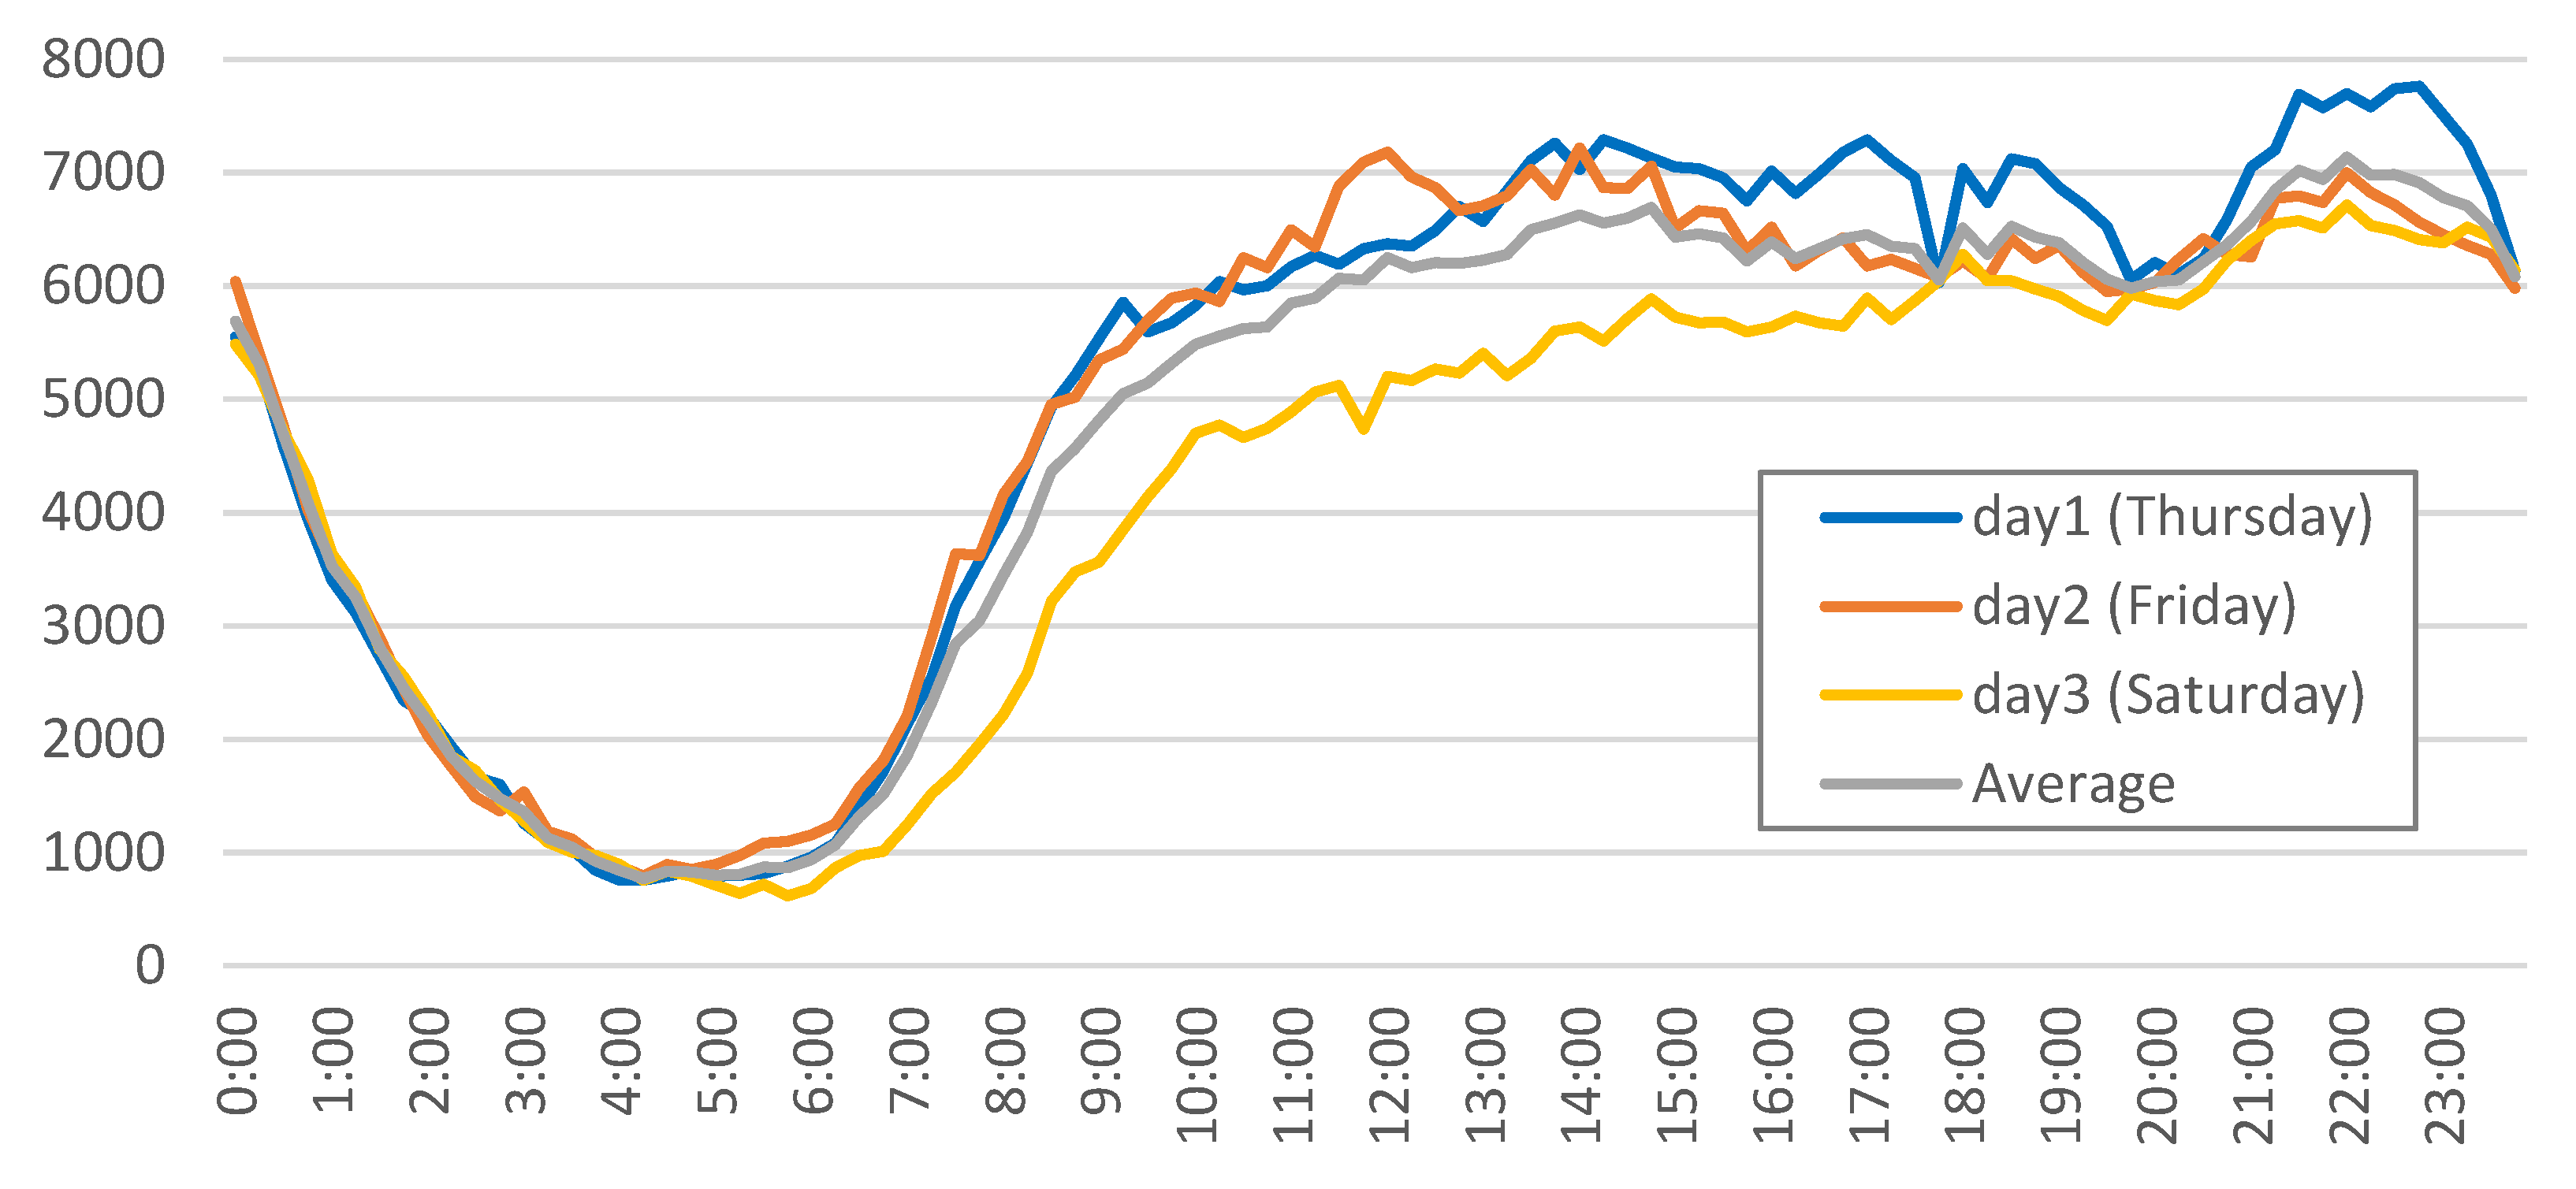
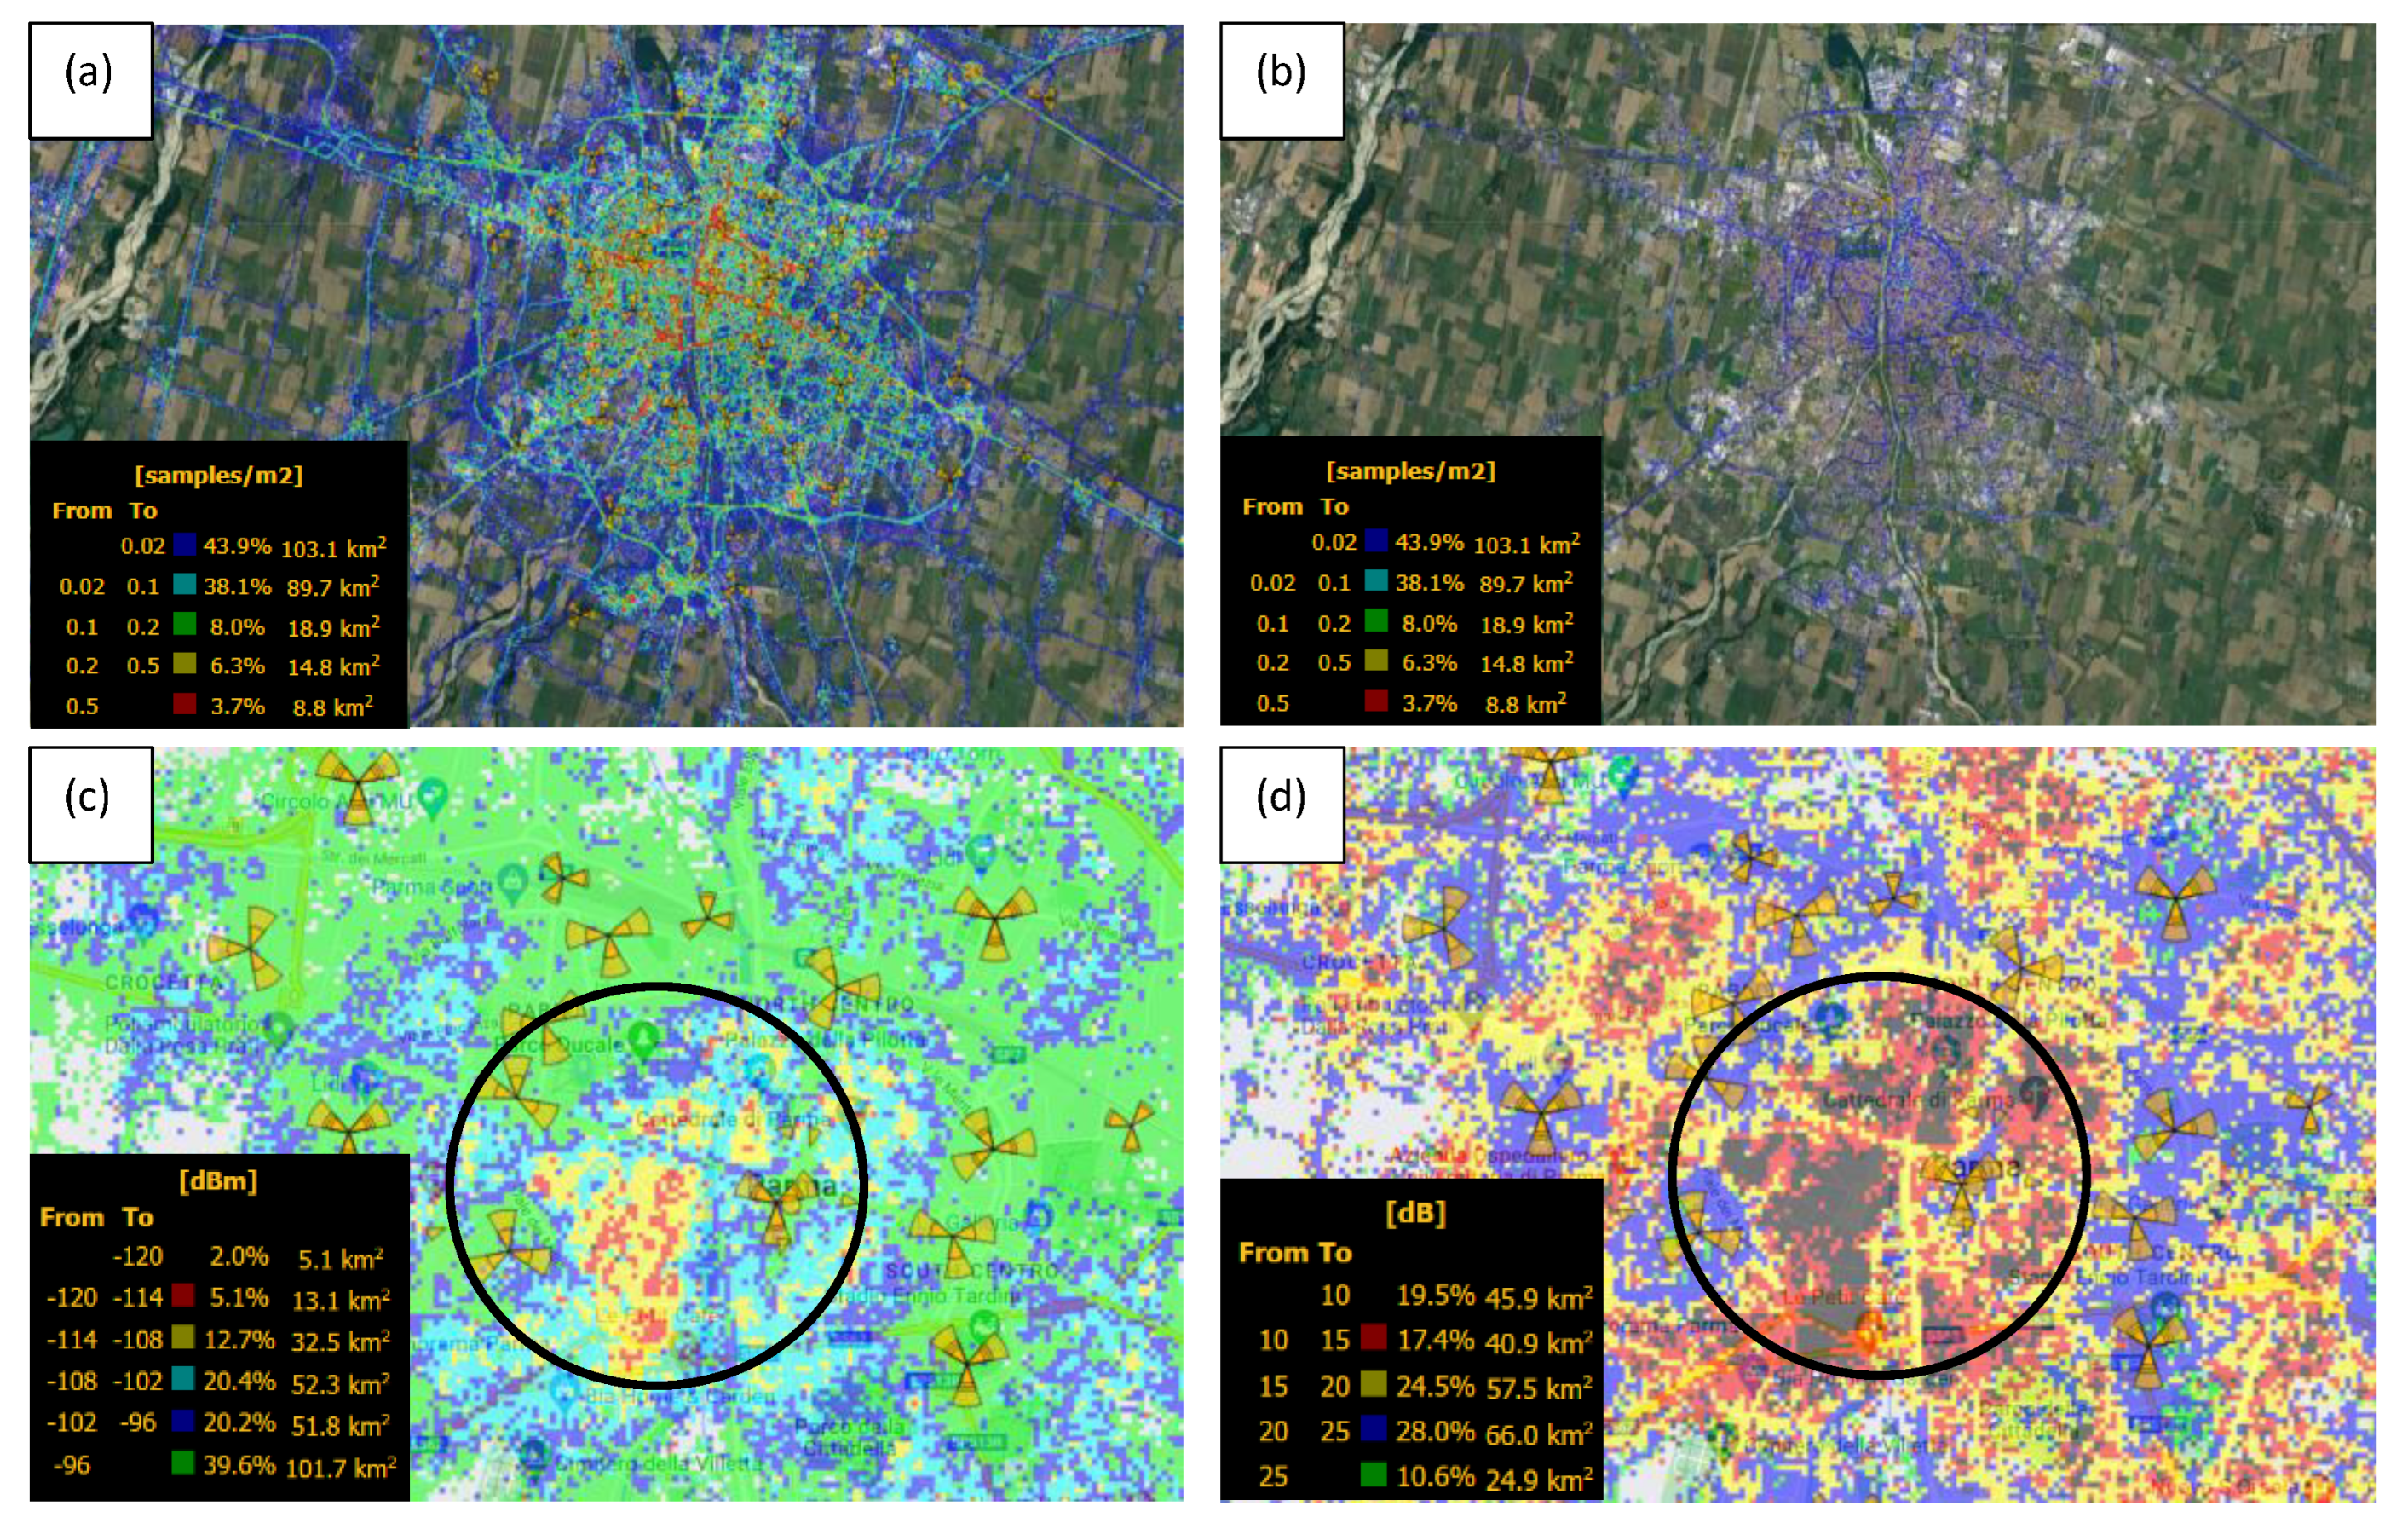
2.3. Data Analysis from Operator Networks
3. Status and Technology Evolution of Mobile Communication Systems
3.1. Standardization Trends toward 6G: Devices Evolution
- Low-end devices: in 2024, the first reduced capability (RedCap) devices should be available, introducing relaxed requirements on the receiver in the device, allowing lower costs compared to standard NR. RedCap devices can facilitate the expansion of the NR device ecosystem to cater to the use cases that are not currently best served by NR specifications. This includes wearables, industrial wireless sensors, and video surveillance. The introduction of RedCap devices can further stimulate the market in all sectors of Internet-of-Things, influencing data usage/patterns.
- Multi-access integration: it is evident that 5G access networks cannot cope alone with global traffic demand growth in some indoor (with better Wi-Fi coverage) or outdoor scenarios (where satellites can complement mobile networks). It is then expected to see a convergence among different accesses (supported by traffic combination at higher levels e.g., via MTS APIs [20]), where multi-access devices will experience better and ubiquitous performance. This usage of multiple accesses can be also beneficial at the network level in terms of energy efficiency.
- Location and positioning technologies: many advanced use cases (e.g., from 5GAA [21], on coordinated manoeuvres for connected and automated vehicles) will require more stringent precision in order to provide location-based services. Furthermore, the evolution of MDT-enabled devices is moving is this direction, where an improved set of measures from UEs (by keeping user privacy) can offer more opportunities to improve perceived the user experience.
- High-end devices (e.g., for AR/VR, multiverse): 3GPP [22] is working on 5G-Adv standard for metaverse applications by selecting UCs and capabilities based on the specification for “Tactile and Multi-modality Services” (see also the LF Edge Akraino Technical Summit Fall 2022). Examples of these UCs: (1) Localized Mobile Metaverse Service UCs, (2) Mobile Metaverse for 5G-enabled Traffic Flow Simulation and Situational Awareness, (3) Collaborative and Concurrent Engineering in Product Design using Metaverse Services. Now, while it is still not clear what the metaverse will be, it is however expected that high-end devices will critically push even higher requirements in future systems.
- Edge computing: thanks to better latency for the proximity to the end user, edge computing is commonly considered as a key technology for the evolution of communication systems. Gartner predicts that by 2025, three-quarters of enterprise-generated data will be created and processed at the edge, outside centralized datacentres or clouds. New services at the edge will also provide new revenue opportunities for operators and service providers. This paradigm shift will change radically the way data is processed and consumed, with increased presence of applications at the edge; this process will further transform data traffic patterns, by influencing in turn the evolution of networks and devices. In particular, from a device perspective, the availability of edge servers will create huge opportunities to design edge native applications which can better exploit network capabilities in a low-latency environment, thus enabling new and innovative services at the terminal side. It is also worth noting that one key use case in ETSI MEC [23] is also about application computation offloading, where the MEC host executes compute-intensive functionalities with high performance instead of mobile devices. This use case can help especially for computation-hungry applications such as graphical rendering (high-speed browser, AR/VR, 3D games, etc.), intermediate data-processing (sensor data cleansing, video analysing, etc.), and value-added services (translation, log analytics, etc.).
- In-RAN computing: it is expected that 6G will be the first generation to shift from a communication-centric to a communication computing-data centric system [24], with tight coupling between communication and computing. According to estimations, the growth of data would far outpace the growth of network capacity. Current systems would not be able to transport all the data to datacentres for processing: in fact, even if there is sufficient communication capacity, the cost of transporting data is high. For example, according to [24], with an estimated 10 nJ/bit energy consumption for transporting data over 500 km, 22 trillion kWh of energy will be needed to transport 1 mln zettabytes of data. So, computing close to data sources is a way to cater to the exponential growth of data and reduce the energy costs of its transport.
3.2. Standardization Trends toward 6G: Network Infrastructure Evolution
- RAN intelligence: 3GPP is studying in TR 37.817 how these RAN intelligence features in Release 17 can be enabled by AI/ML, including a functional framework (where the model of the training function may reside in OAM or RAN nodes, and the model for the inference functions resides in RAN nodes) and a set of input/output parameters for AI/ML-enabled RAN optimization functions (Network Energy Saving, Load Balancing, Mobility Optimization).
- O-RAN: in the context of Radio Access Network, it is worth mentioning also the relevant work performed by O-RAN Alliance in proposing a new architecture called Open-RAN (O-RAN) that consists in splitting the RAN into various parts based on functionality. This functional split of the RAN not only permits us to have cost efficient and more flexible networks, but also creates a chance for the small vendors and operators to start their own services and to increase their market revenue, compared to the current situation, where RAN vendors are typically offering a complete (and often still monolithic) solution to mobile operators. In the O-RAN architecture [25], the various RAN components are disaggregated, where Distributed Unit (DU) and multi-RAT Control Unit (CU) are separated and running on a NFVI platform. This distribution of RAN functionalities (that in the traditional RAN architecture were aggregated into a single node) will increase the network reliability by avoiding any single point of failure. Finally, the O-RAN architecture defined by O-RAN Alliance permits us to enhance the traditional RAN functions with AI via the introduction of the RAN Intelligent Controller (RIC) platform, implementing RAN monitoring and control techniques in the form of rApps and xApps, respectively for “Non-RT (Real-Time) RIC” and “Near-RT RIC”. Suitable uses for the RIC are mainly focused on AI-enabled RAN optimization, but can also include advanced functionalities, such as the integration of RIC with MEC enabling cross-layer application design (e.g., network and QoS aware adaptive MEC applications), or again xApps for Flexible ML-based Spectrum Sensing, e.g., to enable cognitive radio concepts [26].
- Distributed/Federated Learning over 5G System (5GS): while Rel-17 5GS plans to support AI/ML training and inference within the 5GC via NWDAF for network automation purposes, for their Release 18 it is notable how 3GPP is also working to provide intelligent transmission support for application AI/ML-based services, e.g., AI/ML model distribution, transfer, training for various applications, video/speech recognition, robot control, automotive, etc. A relevant example of AI/ML operations is the Distributed/Federated Learning over 5G system (see also 3GPP TR 22.874). Federated Learning (FL) is an increasingly widely used approach for training computer vision and image recognition models. In Federated Learning mode, the cloud server (called also an “aggregator”) trains a global model by aggregating local models partially trained by each of the end devices (“collaborators”) based on an iterative model averaging method.
3.3. Research Trends: Data-Driven Innovations
3.4. The Power of Data: Overview of Key Enablers for Data-Driven Insights
4. Exploiting Data toward 6G: The Fed-XAI Case Study
4.1. Federated Learning of eXplainable Artificial Intelligence Models: The Hexa-X Experience
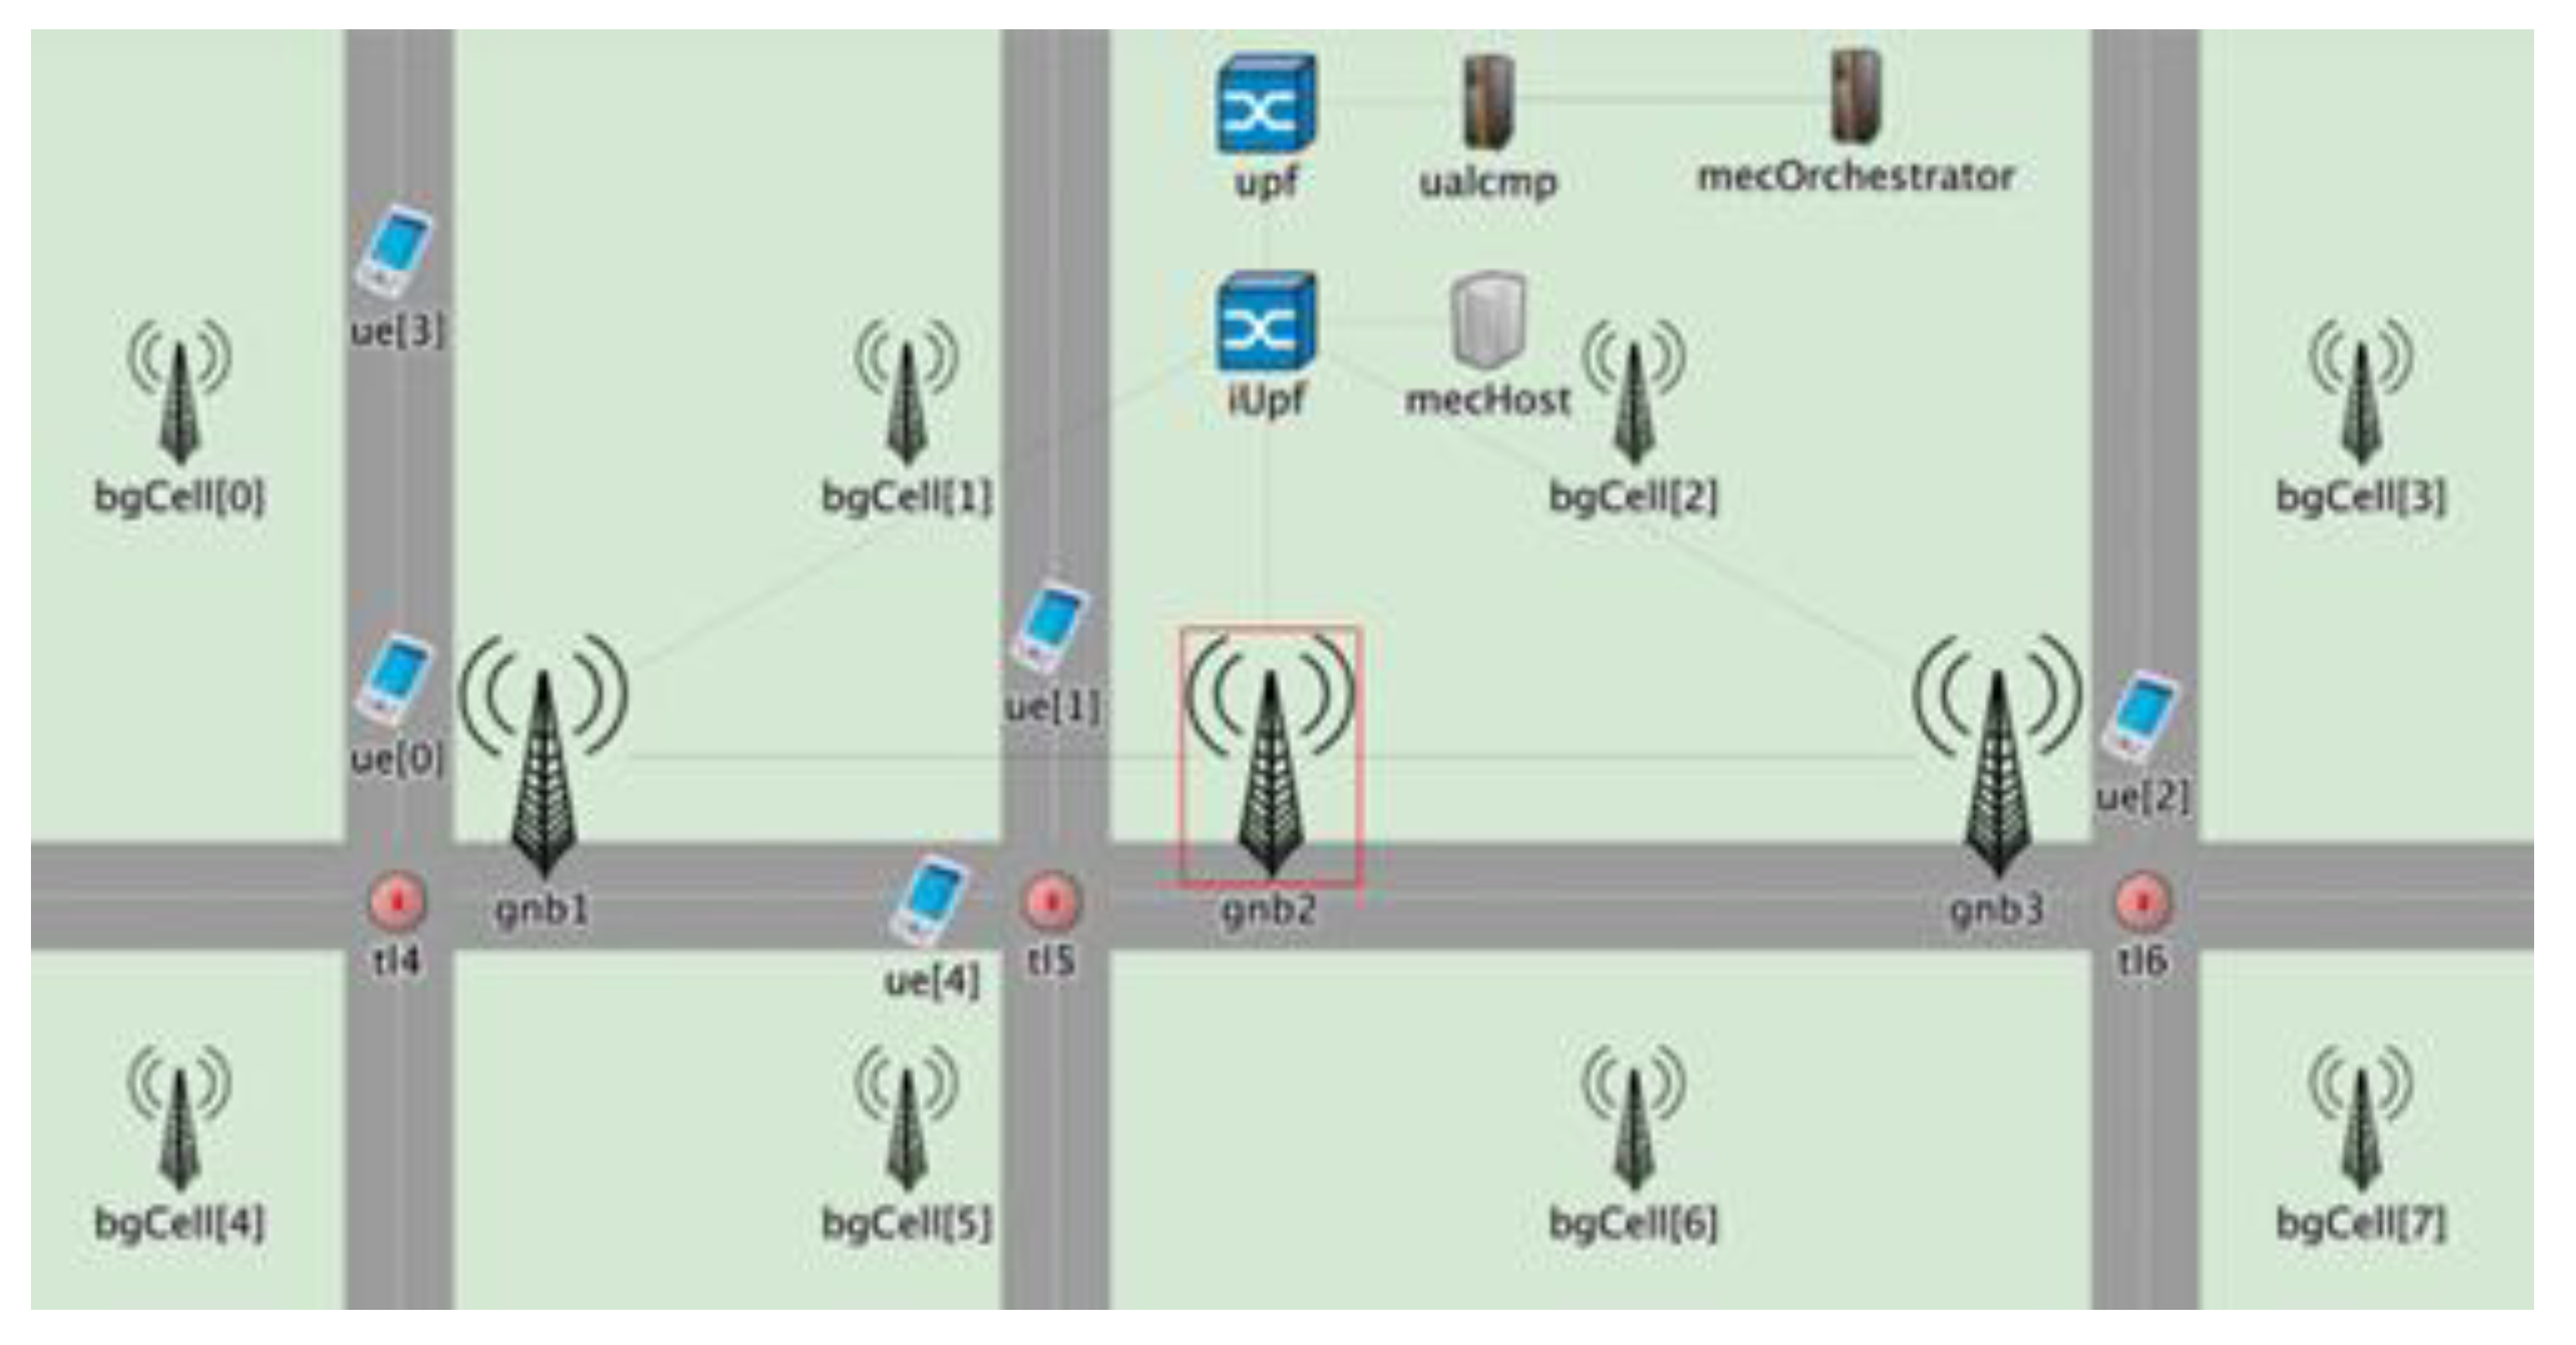
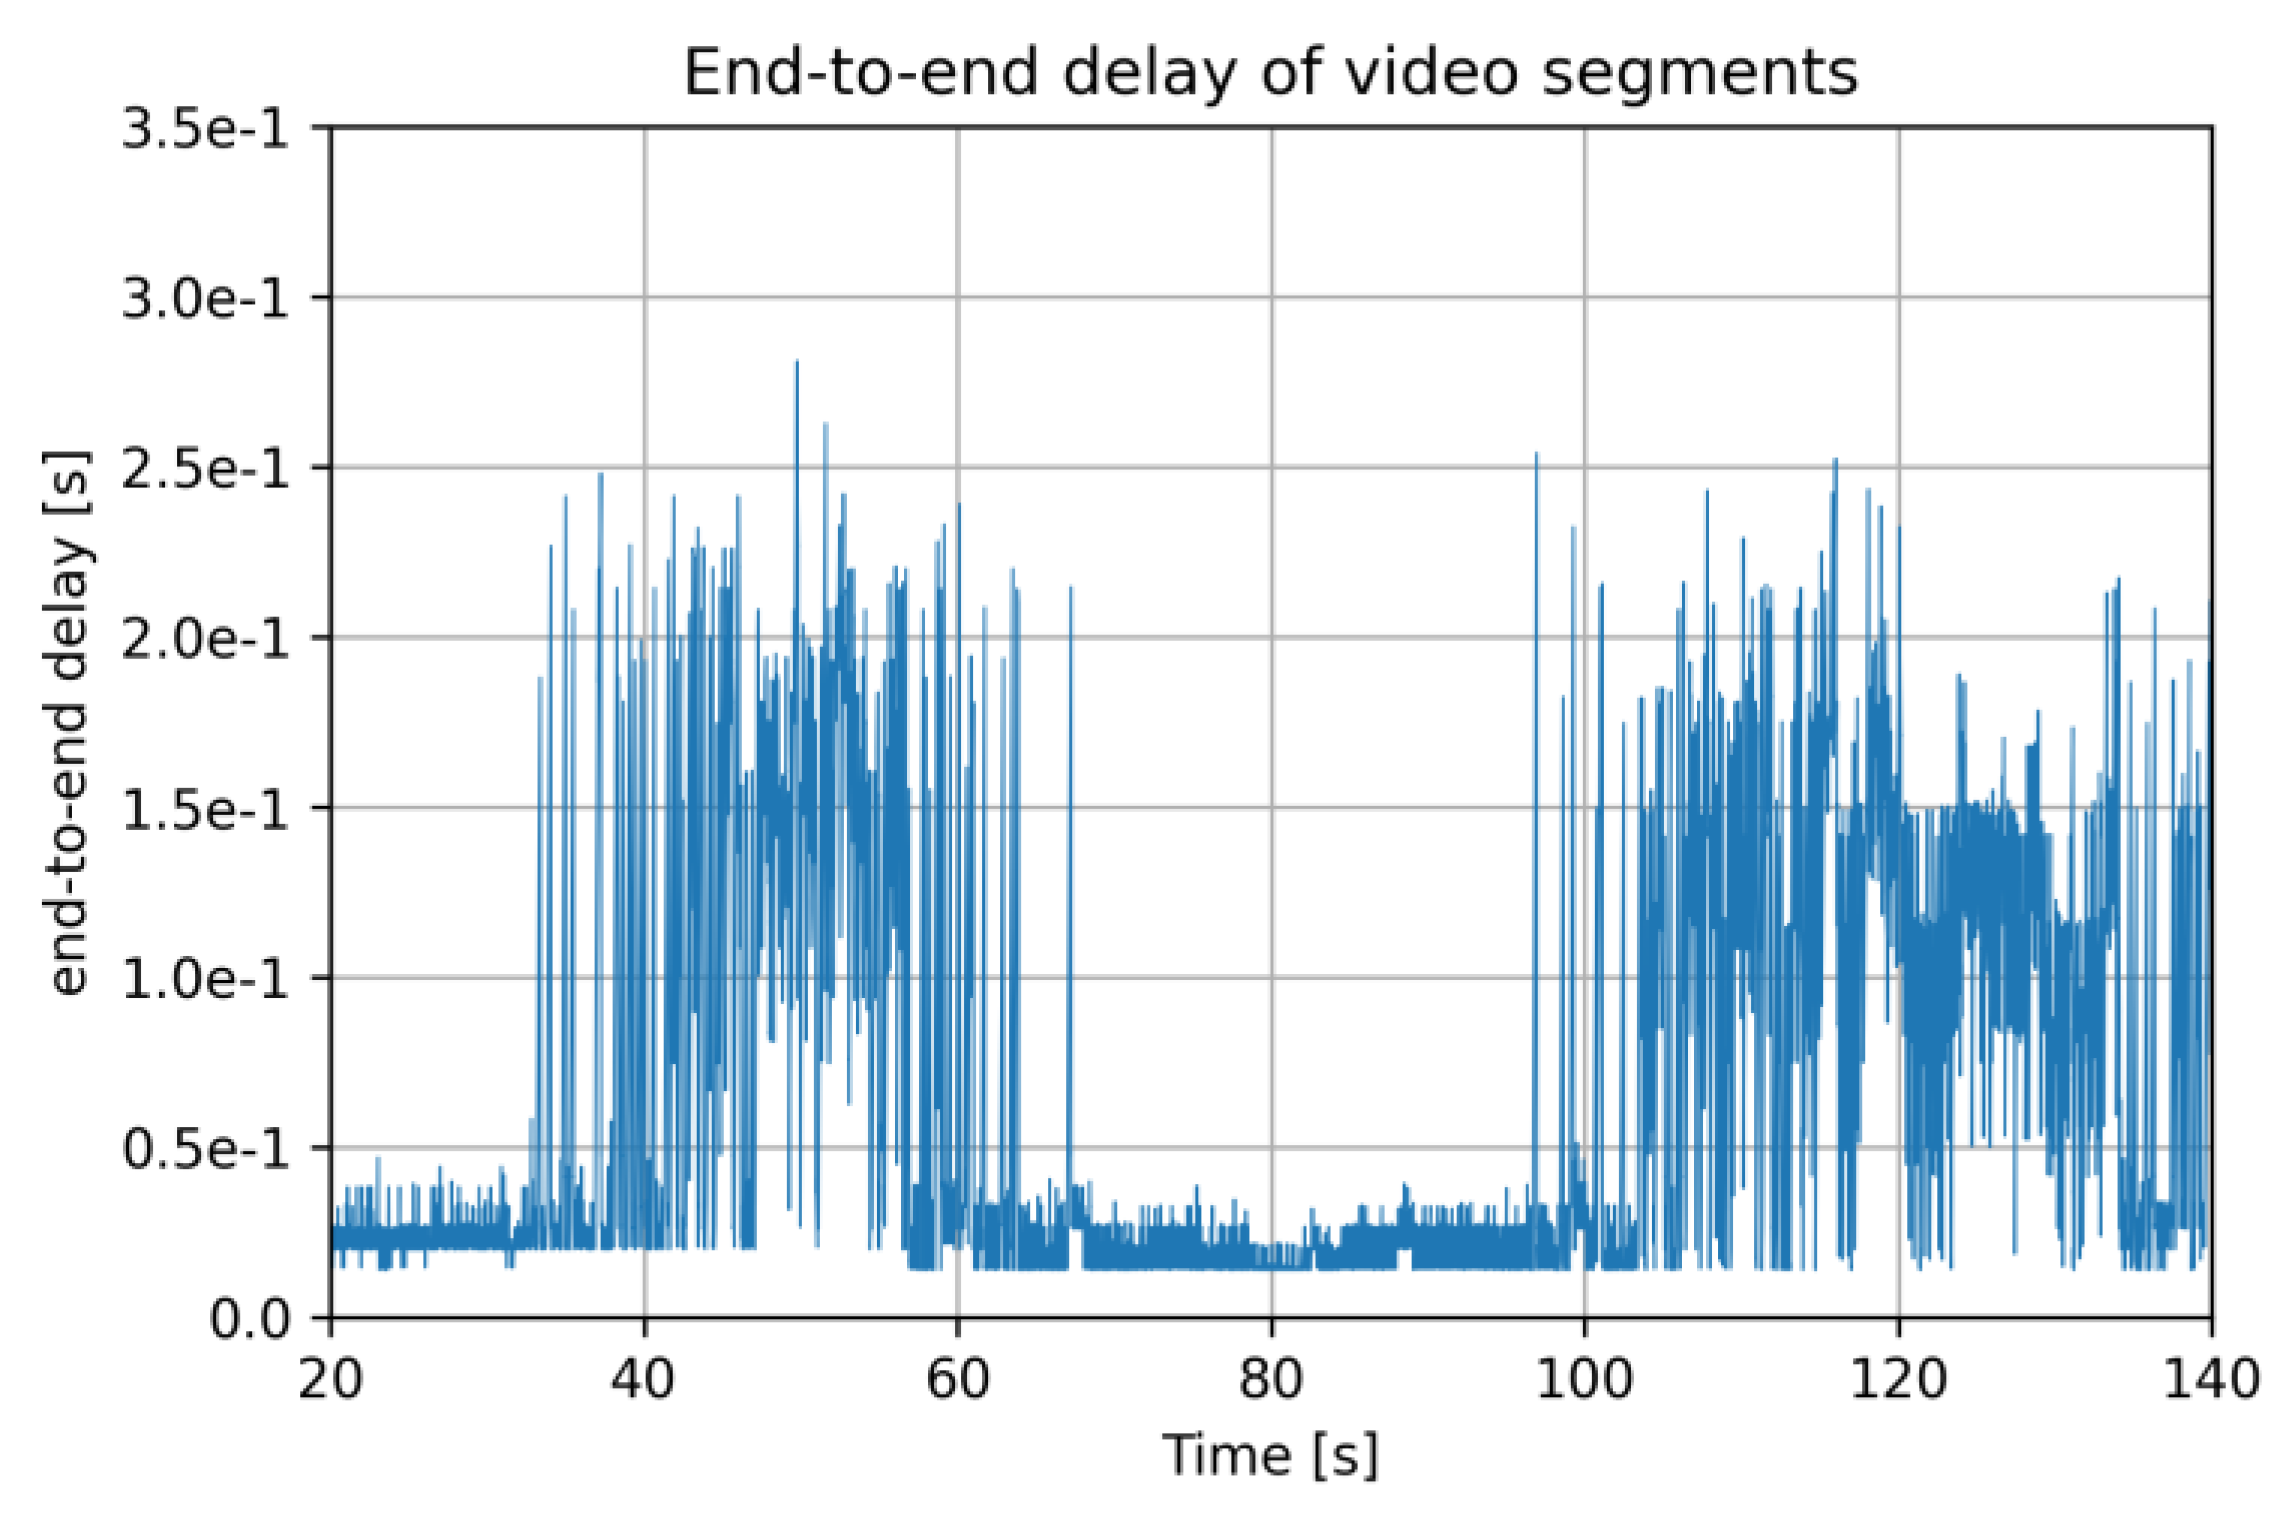
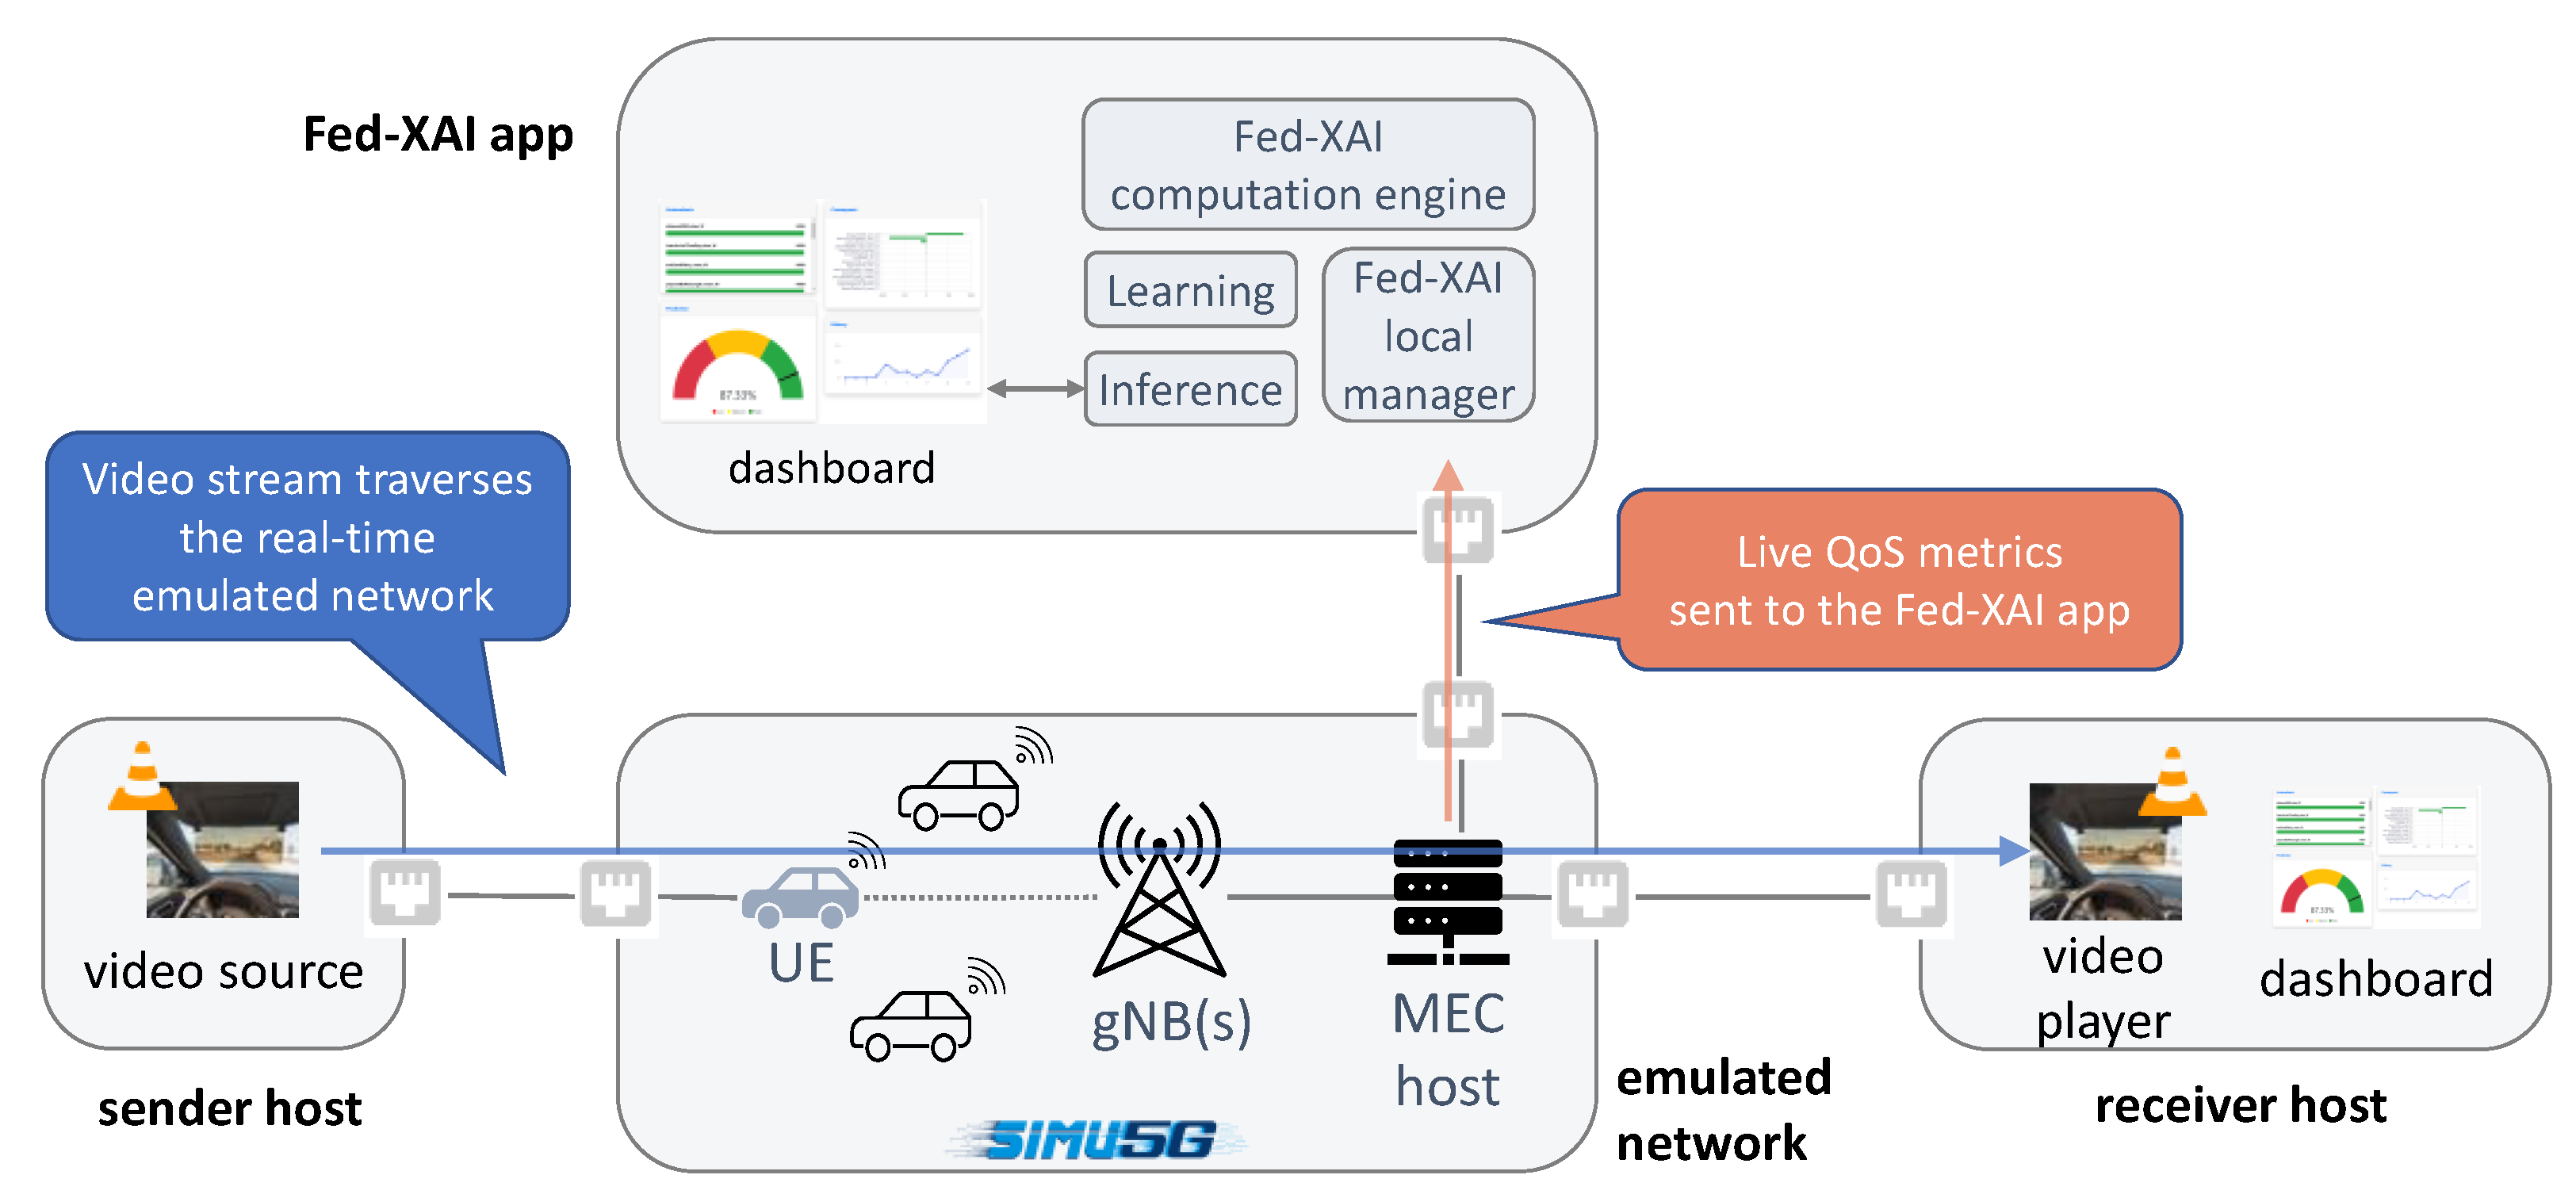
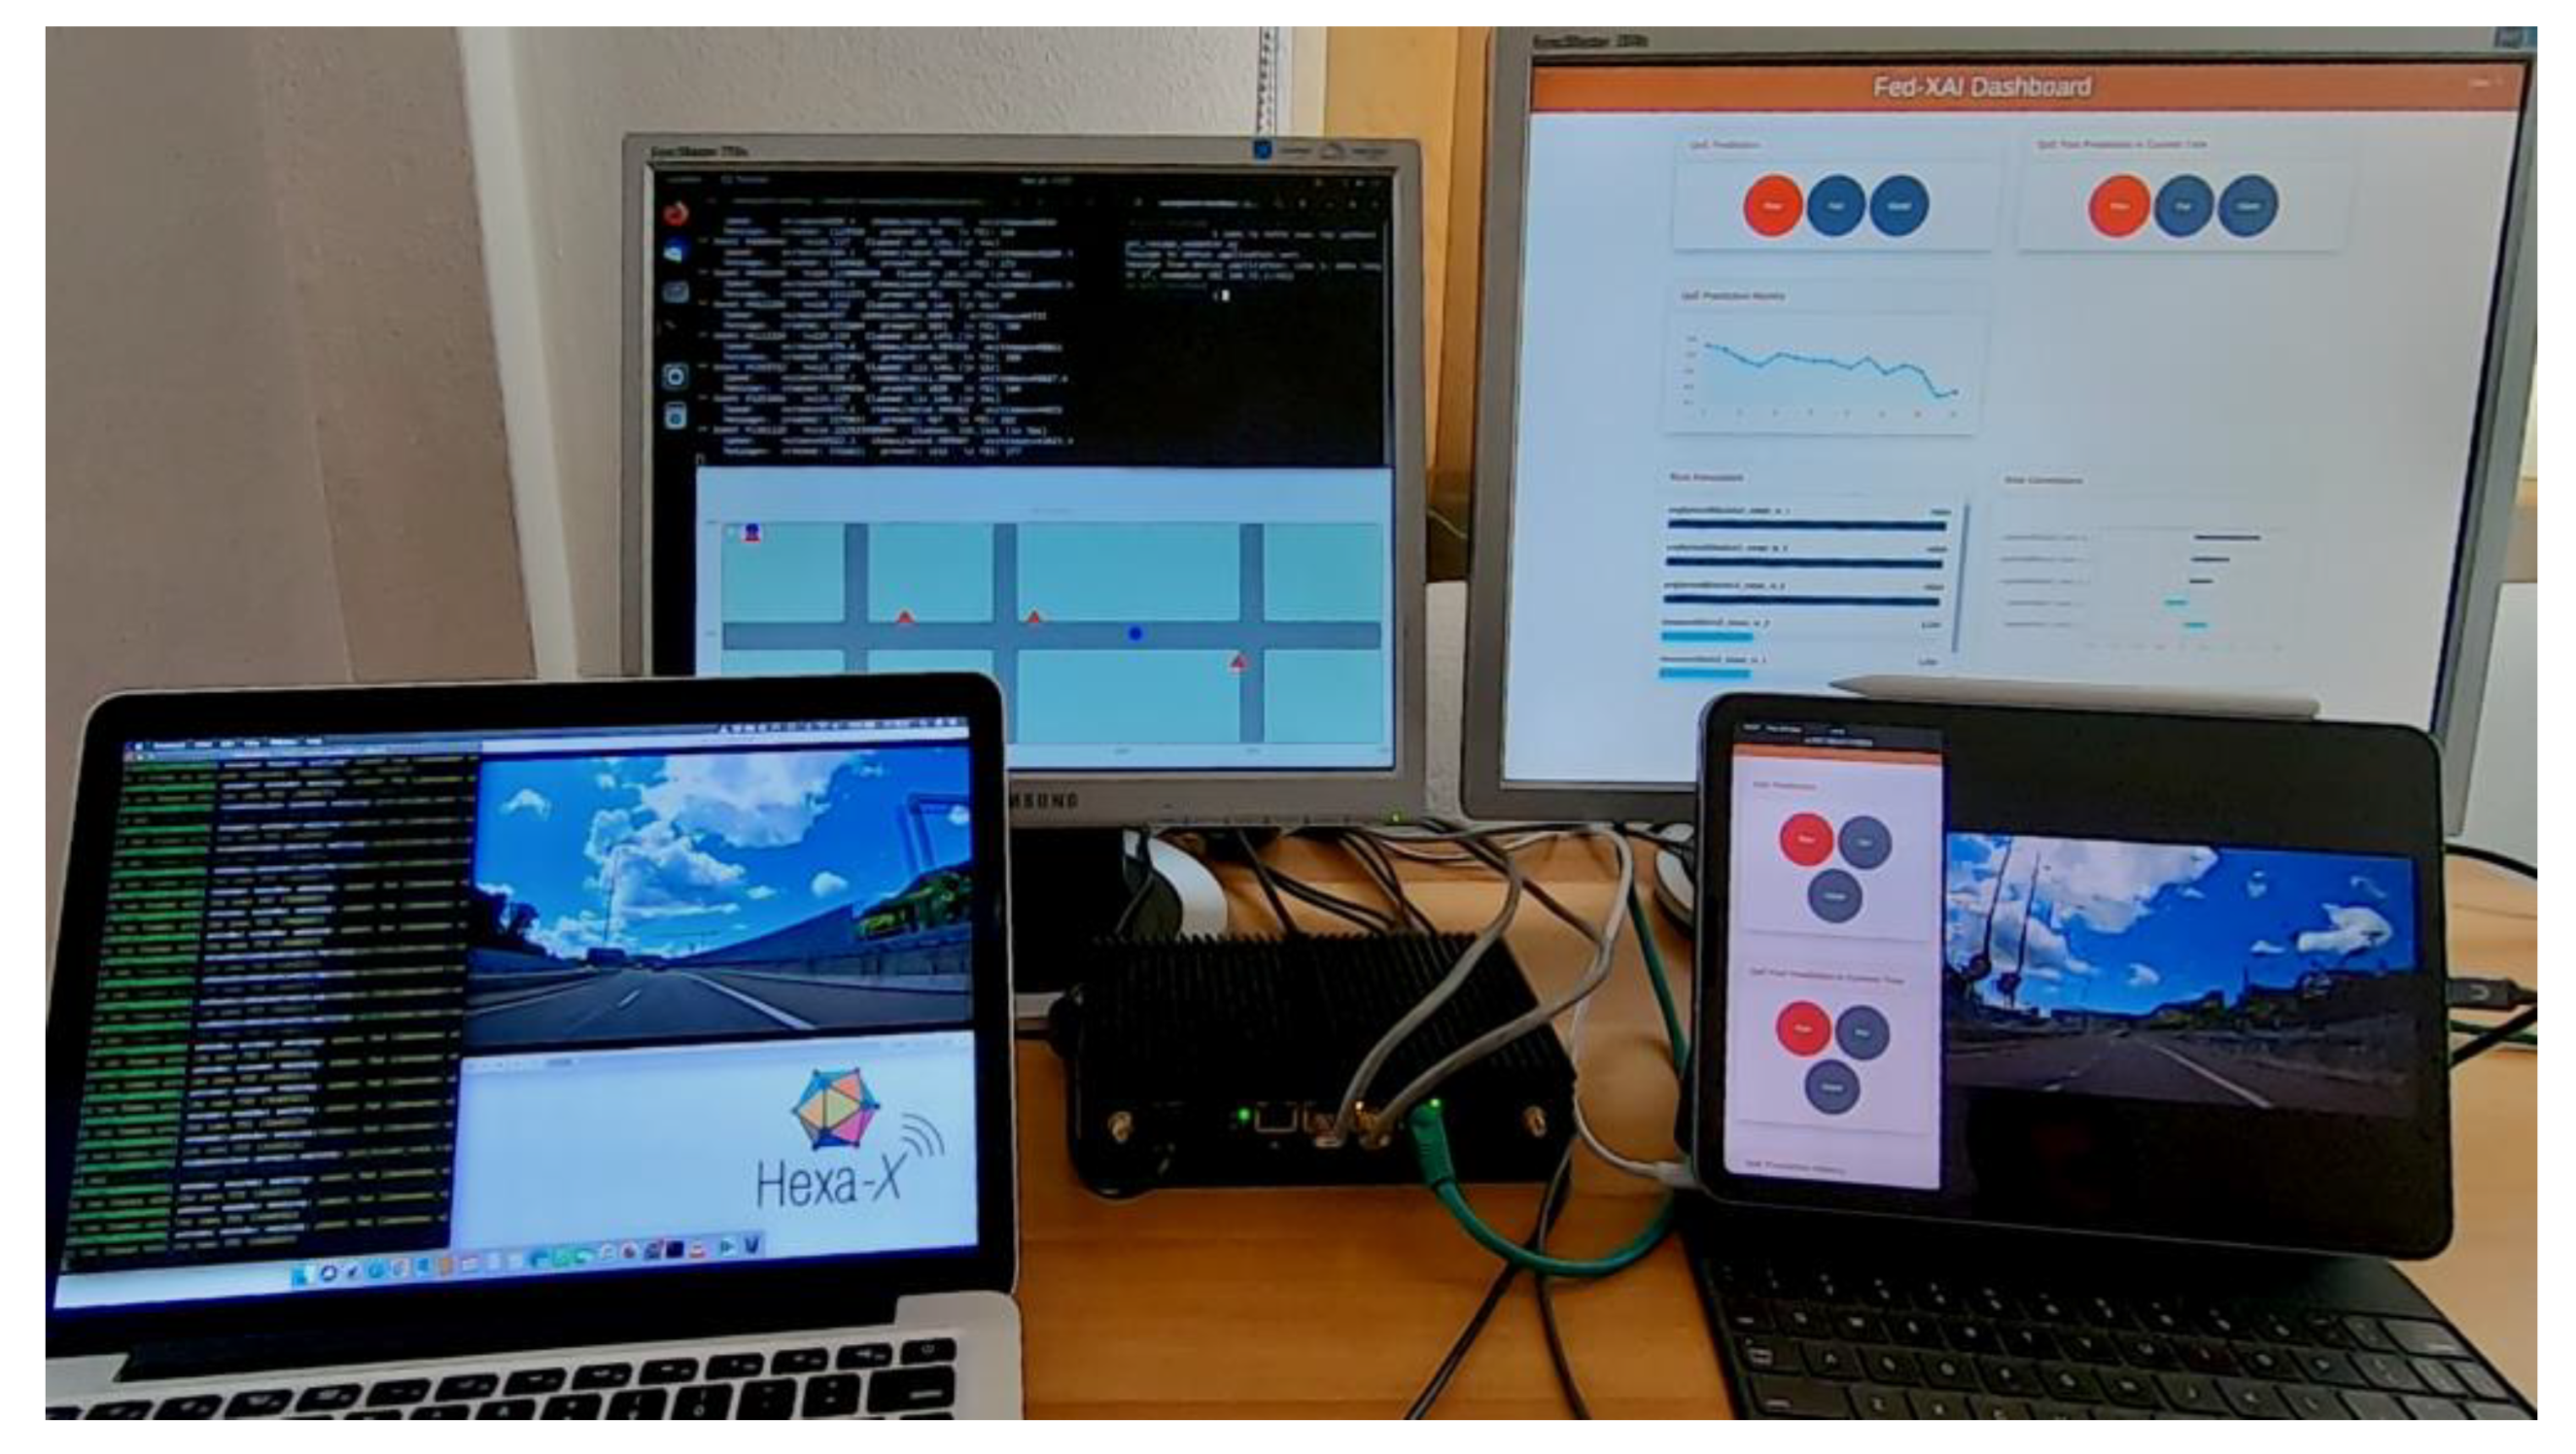
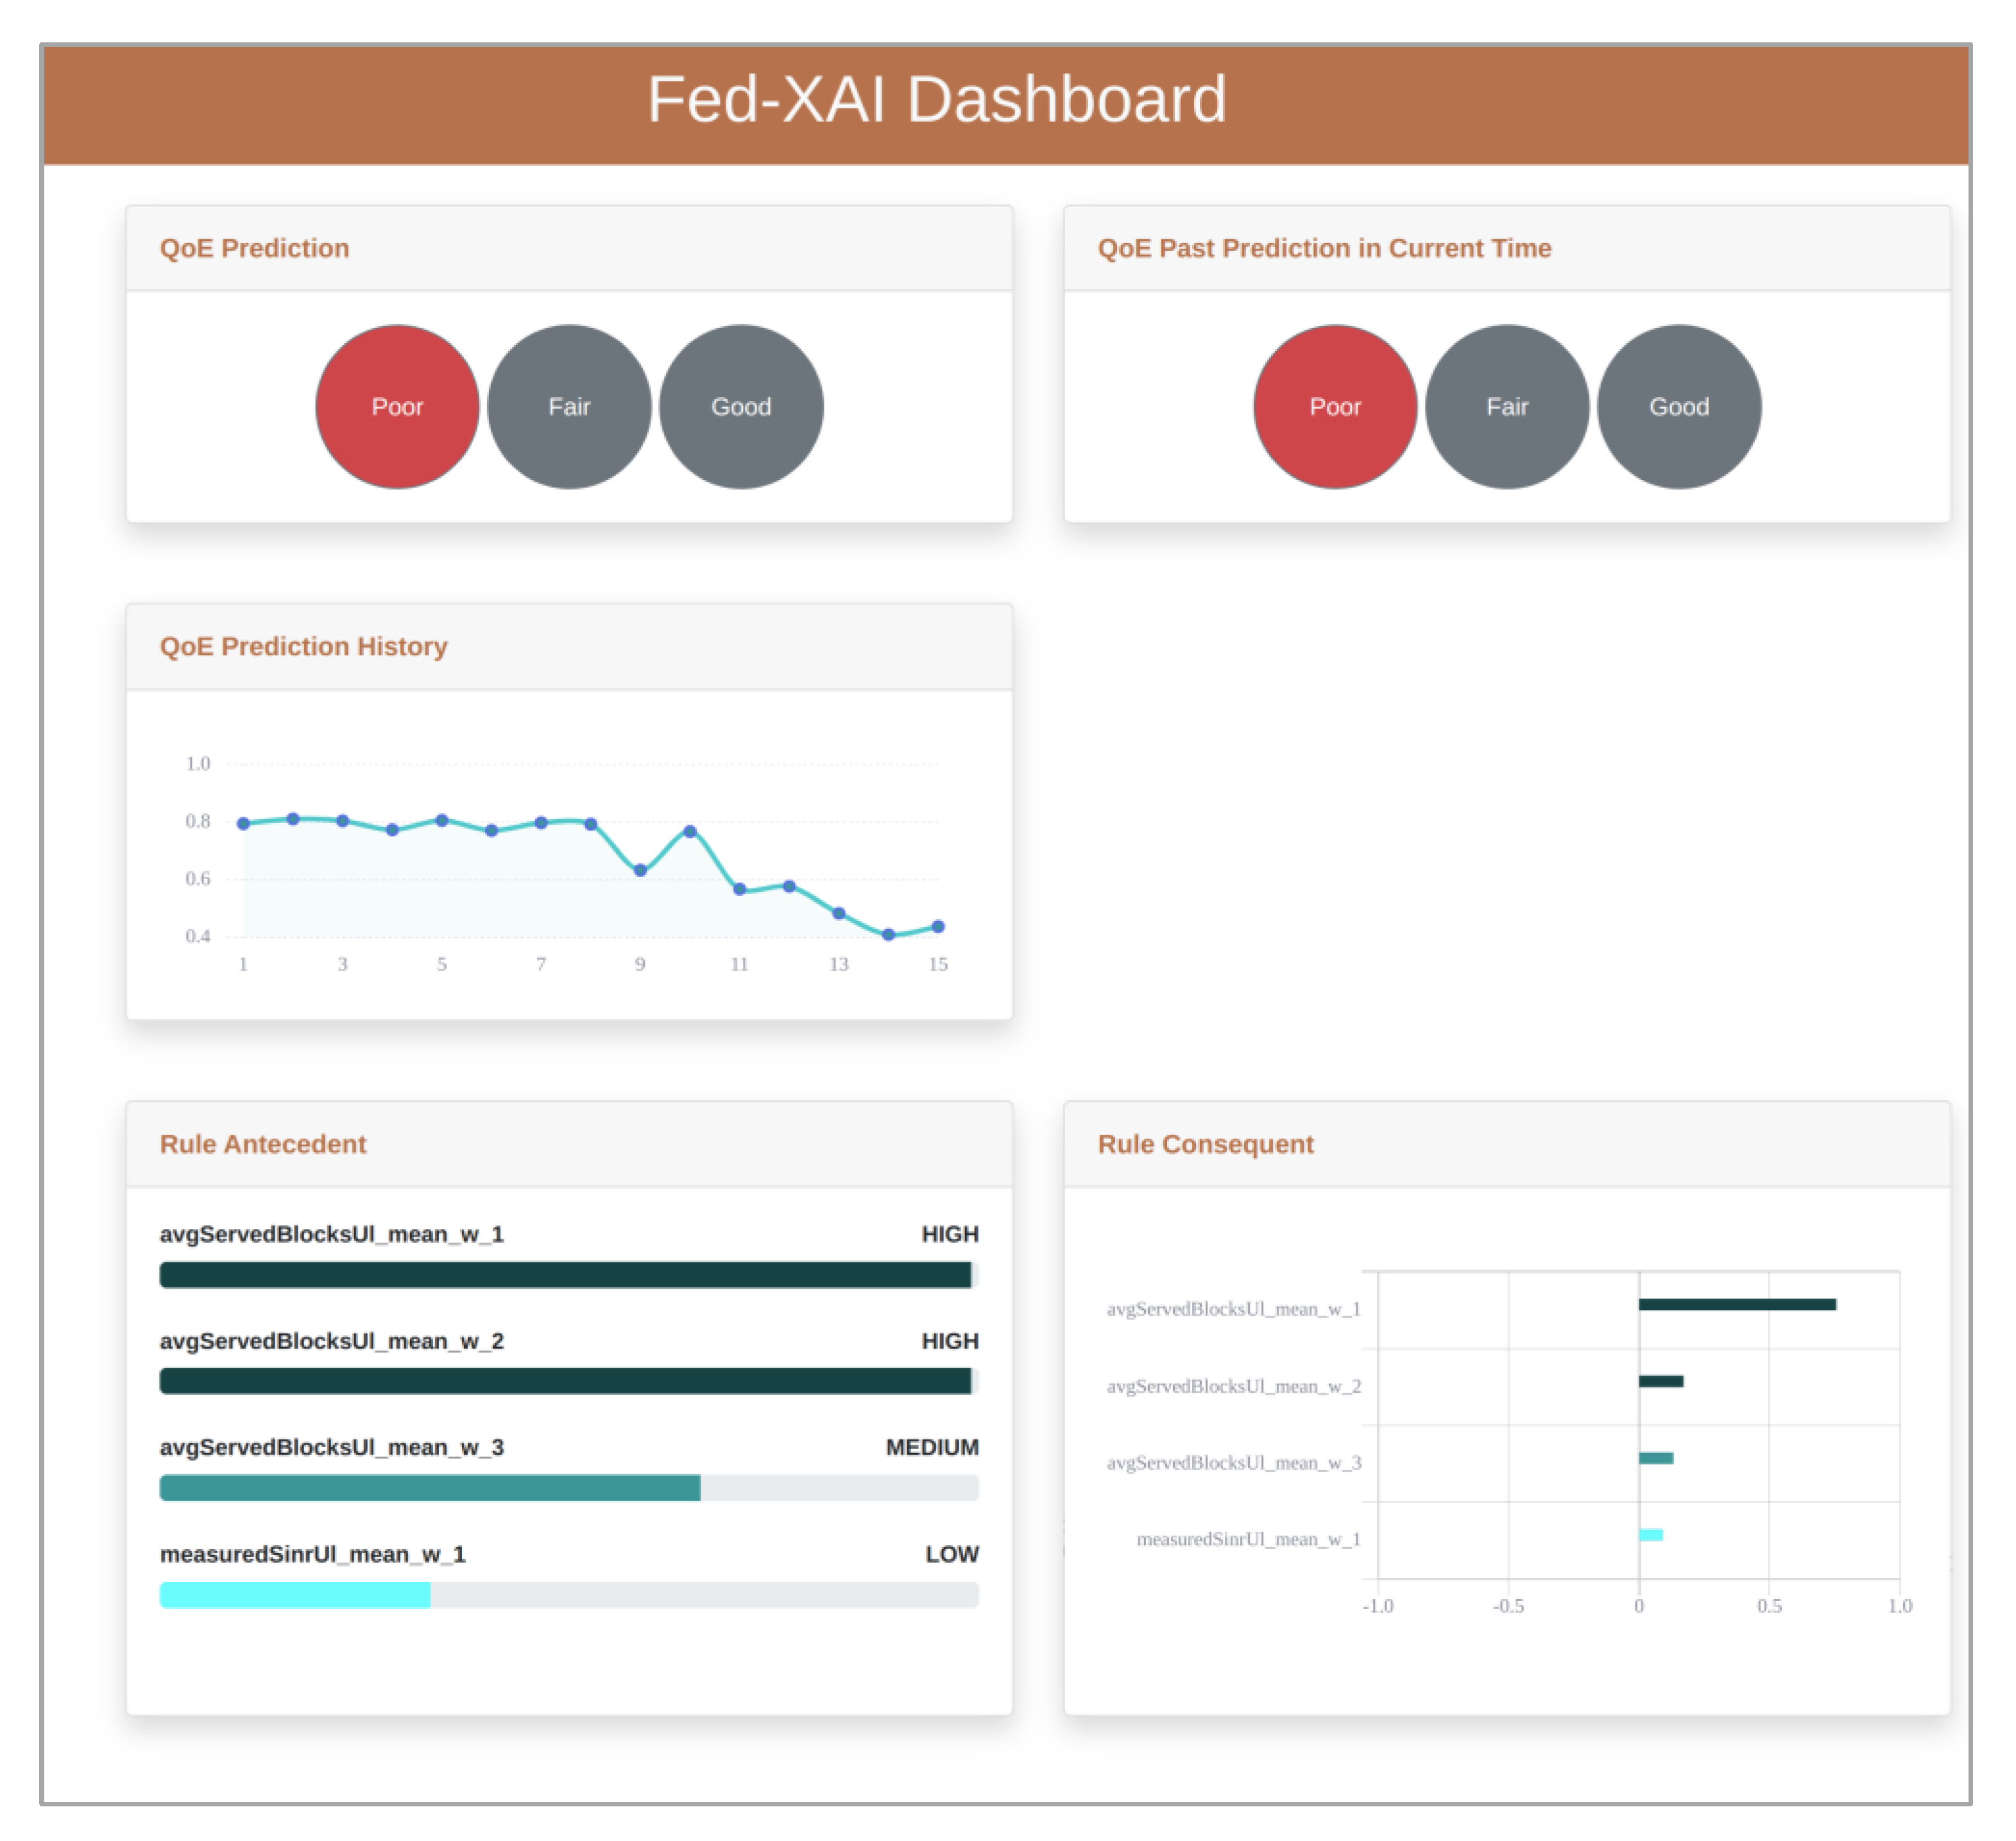
4.2. Combining Live Network Data with Network Simulations to Support Fed-XAI Operations
5. Conclusions
Author Contributions
Funding
Data Availability Statement
Acknowledgments
Conflicts of Interest
References
- Cisco Annual Internet Report (2018–2023). Available online: www.cisco.com/c/en/us/solutions/executive-perspectives/annual-internet-report/index.html (accessed on 19 June 2023).
- Ericsson Mobility Report. 2022. Available online: www.ericsson.com/4a4be7/assets/local/reports-papers/mobility-report/documents/2022/ericsson-mobility-report-q2-2022.pdf (accessed on 19 June 2023).
- Sabella, D.; Reznik, A.; Frazao, R. Multi-Access Edge Computing in Action; CRC Press: Boca Raton, FL, USA, 2019. [Google Scholar] [CrossRef]
- Ericsson Report. Planning In-Building Coverage for 5G: From Rules of Thumb to Statistics and AI. 2021. Available online: https://www.ericsson.com/49ced5/assets/local/reports-papers/mobility-report/documents/2021/planning-in-building-coverage.pdf (accessed on 19 June 2023).
- 5GAA Position Paper: Secure Space-Based Connectivity Programme and Focus on the European Communication Satellite Constellation. Available online: 5gaa.org/content/uploads/2022/10/5GAA_NTN_Position_Paper.pdf (accessed on 19 June 2023).
- GSMA Intelligence. The Mobile Economy 2022. Available online: https://www.gsma.com/mobileeconomy/wp-content/uploads/2022/02/280222-The-Mobile-Economy-2022.pdf (accessed on 19 June 2023).
- OpenSignal. The Smartphone Experience Shift from 4G to 5G. March 2022. Available online: www.opensignal.com (accessed on 19 June 2023).
- OpenSignal. 5G Impact on the Global Mobile Network Experience. 2022. Available online: www.opensignal.com (accessed on 19 June 2023).
- Mizzi, C.; Fabbri, A.; Rambaldi, S.; Bertini, F.; Curti, N.; Sinigardi, S.; Luzi, R.; Venturi, G.; Davide, M.; Muratore, G.; et al. Unraveling pedestrian mobility on a road network using ICTs data during great tourist events. EPJ Data Sci. 2018, 7, 44. [Google Scholar] [CrossRef] [Green Version]
- Scaloni, A.; Cirella, P.; Sgheiz, M.; Diamanti, R.; Micheli, D. Multipath and Doppler Characterization of an Electromagnetic Environment by Massive MDT Measurements from 3G and 4G Mobile Terminals. IEEE Access 2019, 7, 13024–13034. [Google Scholar] [CrossRef]
- 3GPP TS 37.320 V17.3.0 (2023-03): Radio Measurement Collection for Minimization of Drive Tests (MDT); Overall Description; Stage 2. Available online: https://www.3gpp.org/ftp/Specs/archive/37_series/37.320 (accessed on 19 June 2023).
- Micheli, D.; Diamanti, R. Statistical analysis of interference in a real LTE access network by massive collection of MDT radio measurement data from smartphones. In Proceedings of the 2019 PhotonIcs & Electromagnetics Research Symposium-Spring (PIERS-Spring), Rome, Italy, 17–20 June 2019. [Google Scholar]
- Vannelli, A.; Micheli, D.; Muratore, G. Statistical analysis of smartphone MDT signaling power measurements for Radio Maritime LTE propagation study. In Proceedings of the 2020 International Symposium on Electromagnetic Compatibility-EMC EUROPE, Rome, Italy, 23–25 September 2020. [Google Scholar] [CrossRef]
- Micheli, D.; Muratore, G.; Vannelli, A.; Scaloni, A.; Sgheiz, M.; Cirella, P. Rain effect on 4G LTE in-car electromagnetic propagation analyzed through MDT radio data measurement reported by mobile phones. IEEE Trans. Antennas Propag. 2021, 69, 8641–8651. [Google Scholar] [CrossRef]
- Scaloni, A. Minimization of Drive Test (MDT): An Innovative Methodology for Measuring Customer Performance on Mobile Network. In Proceedings of the ITU Workshop on “Benchmarking of Emerging Technologies and Applications. Internet Related Performance Measurements”, Geneva, Switzerland, 11 March 2019. [Google Scholar]
- Micheli, D.; Muratore, G. Smartphones reference signal received power MDT radio measurement statistical analysis reveals people feelings during music events. In Proceedings of the 2019 PhotonIcs & Electromagnetics Research Symposium-Spring (PIERS-Spring), Rome, Italy, 17–20 June 2019. [Google Scholar]
- Renda, A.; Ducange, P.; Marcelloni, F.; Sabella, D.; Filippou, M.C.; Nardini, G.; Stea, G.; Virdis, A.; Micheli, D.; Rapone, D.; et al. Federated Learning of Explainable AI Models in 6G Systems: Towards Secure and Automated Vehicle Networking. Information 2022, 13, 395. [Google Scholar] [CrossRef]
- Skocaj, M.; Amorosa, L.M.; Ghinamo, G.; Muratore, G.; Micheli, D.; Zabini, F.; Verdone, R. Cellular network capacity and coverage enhancement with MDT data and Deep Reinforcement Learning. Comput. Commun. 2022, 195, 403–415. [Google Scholar] [CrossRef]
- Muratore, G.; Giannini, T.; Micheli, D. Solar radio emission as a disturbance of radiomobile networks. Sci. Rep. 2022, 12, 9324. [Google Scholar] [CrossRef] [PubMed]
- ETSI GS MEC 015 V2.2.1 (2022-12). Multi-Access Edge Computing (MEC); Traffic Management APIs. Available online: https://www.etsi.org/deliver/etsi_gs/MEC/001_099/015/02.02.01_60/gs_MEC015v020201p.pdf (accessed on 19 June 2023).
- 5GAA. System Architecture and Solution Development; High-Accuracy Positioning for C-V2X. Available online: https://5gaa.org/wp-content/uploads/2021/02/5GAA_A-200118_TR_V2XHAP.pdf (accessed on 19 June 2023).
- 3GPP TR 22.856 V1.0.0 (2023-03). Feasibility Study on Localized Mobile Metaverse Services (Release 19). Available online: https://www.3gpp.org/ftp/Specs/archive/22_series/22.856/ (accessed on 19 June 2023).
- ETSI GS MEC 002 V3.1.1 (2023-04). Multi-Access Edge Computing (MEC); Use Cases and Requirements. Available online: https://www.etsi.org/deliver/etsi_gs/MEC/001_099/002/03.01.01_60/gs_MEC002v030101p.pdf (accessed on 19 June 2023).
- Li, Q.; Ding, Z.; Tong, X.; Wu, G.; Stojanovski, S.; Luetzenkirchen, T.; Kolekar, A.; Bangolae, S.; Palat, S. 6G Cloud-Native System: Vision, Challenges, Architecture Framework and Enabling Technologies. IEEE Access 2022, 10, 96602–96625. [Google Scholar] [CrossRef]
- Singh, S.K.; Singh, R.; Kumbhani, B. The Evolution of Radio Access Network Towards Open-RAN: Challenges and Opportunities. In Proceedings of the 2020 IEEE Wireless Communications and Networking Conference Workshops (WCNCW), Seoul, Republic of Korea, 6–9 April 2020; pp. 1–6. [Google Scholar] [CrossRef]
- Rego, I.; Medeiros, L.; Alves, P.; Goldbarg, M.; Lopes, V.; Flor, D.; Barros, W.; Sousa, V.; Aranha, E.; Martins, A.; et al. Prototyping near-real time RIC O-RAN xApps for Flexible ML-based Spectrum Sensing. In Proceedings of the 2022 IEEE Conference on Network Function Virtualization and Software Defined Networks (NFV-SDN), Phoenix, AZ, USA, 14–16 November 2022; pp. 137–142. [Google Scholar] [CrossRef]
- Ma, B.; Guo, W.; Zhang, J. A Survey of Online Data-Driven Proactive 5G Network Optimisation Using Machine Learning. IEEE Access 2020, 8, 35606–35637. [Google Scholar] [CrossRef]
- Francesco, P.D.; Malandrino, F.; DaSilva, L.A. Assembling and Using a Cellular Dataset for Mobile Network Analysis and Planning. IEEE Trans. Big Data 2018, 4, 614–620. [Google Scholar] [CrossRef]
- Vallero, G.; Renga, D.; Meo, M.; Marsan, M.A. Greener RAN Operation through Machine Learning. IEEE Trans. Netw. Serv. Manag. 2019, 16, 896–908. [Google Scholar] [CrossRef]
- Bega, D.; Gramaglia, M.; Fiore, M.; Banchs, A.; Costa-Pérez, X. DeepCog: Optimizing Resource Provisioning in Network Slicing With AI-Based Capacity Forecasting. IEEE J. Sel. Areas Commun. 2020, 38, 361–376. [Google Scholar] [CrossRef] [Green Version]
- Gómez-Andrades, A.; Barco, R.; Muñoz, P.; Serrano, I. Data Analytics for Diagnosing the RF Condition in Self-Organizing Networks. IEEE Trans. Mob. Comput. 2017, 16, 1587–1600. [Google Scholar] [CrossRef]
- DAWN4IoE Project. Available online: https://www.dawnforioe.com/ (accessed on 19 June 2023).
- CANCAN Project. Available online: https://cancan.roc.cnam.fr/ (accessed on 19 June 2023).
- Lohmüller, S.; Schmelz, L.C.; Hahn, S. Adaptive SON management using KPI measurements. In Proceedings of the NOMS 2016–2016 IEEE/IFIP Network Operations and Management Symposium, Istanbul, Turkey, 25–29 April 2016; pp. 625–631. [Google Scholar] [CrossRef]
- Hahn, S.; Schweins, M.; Kürner, T. Impact of SON function combinations on the KPI behaviour in realistic mobile network scenarios. In Proceedings of the 2018 IEEE Wireless Communications and Networking Conference Workshops (WCNCW), Barcelona, Spain, 15–18 April 2018; pp. 1–6. [Google Scholar] [CrossRef]
- Uusitalo, M.A.; Ericson, M.; Richerzhagen, B.; Soykan, E.U.; Rugeland, P.; Fettweis, G.; Sabella, D.; Wikström, G.; Boldi, M.; Hamon, M.H.; et al. Hexa-X The European 6G Flagship Project. In Proceedings of the 2021 Joint European Conference on Networks and Communications & 6G Summit (EuCNC/6G Summit), Porto, Portugal, 8–11 June 2021. [Google Scholar]
- Nardini, G.; Sabella, D.; Stea, G.; Thakkar, P.; Virdis, A. Simu5G—An OMNeT++ Library for End-to-End Performance Evaluation of 5G Networks. IEEE Access 2020, 8, 181176–181191. [Google Scholar] [CrossRef]
- Bárcena, J.L.C.; Ducange, P.; Ercolani, A.; Marcelloni, F.; Renda, A. An Approach to Federated Learning of Explainable Fuzzy Regression Models. In Proceedings of the 2022 IEEE International Conference on Fuzzy Systems (FUZZ-IEEE), Padua, Italy, 18–23 July 2022; IEEE: Piscataway, NJ, USA, 2022. [Google Scholar]
- Nardini, G.; Stea, G.; Virdis, A. Scalable Real-time Emulation of 5G Networks with Simu5G. IEEE Access 2021, 9, 148504–148520. [Google Scholar] [CrossRef]


| Type of Data | Possible Usages (and Relevant Work) | References (Standards) | Comments |
|---|---|---|---|
| MDT samples | RAN optimization (ref. [12]); Analysis of solar radiations and their impact on RAN interference (ref. [19]); Inferences of pedestrian mobility flows (ref. [9]); | 3GPP TS 37.320 “Radio measurement collection for Minimization of Drive Tests (MDT); Overall description” | Details of data samples available:
|
| Radio Access Network counters | Network dimensioning and planning (ref. [18]) Adaptive SON management (ref. [34,35]) | Technology specific | Examples of metrics:
|
| Country-level/ region-level data statistics | Network dimensioning and planning | GSMA Intelligence (ref. [6]) Open Signal (ref. [7,8]); | Examples of metrics:
|
Disclaimer/Publisher’s Note: The statements, opinions and data contained in all publications are solely those of the individual author(s) and contributor(s) and not of MDPI and/or the editor(s). MDPI and/or the editor(s) disclaim responsibility for any injury to people or property resulting from any ideas, methods, instructions or products referred to in the content. |
© 2023 by the authors. Licensee MDPI, Basel, Switzerland. This article is an open access article distributed under the terms and conditions of the Creative Commons Attribution (CC BY) license (https://creativecommons.org/licenses/by/4.0/).
Share and Cite
Sabella, D.; Micheli, D.; Nardini, G. The Power of Data: How Traffic Demand and Data Analytics Are Driving Network Evolution toward 6G Systems. J. Sens. Actuator Netw. 2023, 12, 49. https://doi.org/10.3390/jsan12040049
Sabella D, Micheli D, Nardini G. The Power of Data: How Traffic Demand and Data Analytics Are Driving Network Evolution toward 6G Systems. Journal of Sensor and Actuator Networks. 2023; 12(4):49. https://doi.org/10.3390/jsan12040049
Chicago/Turabian StyleSabella, Dario, Davide Micheli, and Giovanni Nardini. 2023. "The Power of Data: How Traffic Demand and Data Analytics Are Driving Network Evolution toward 6G Systems" Journal of Sensor and Actuator Networks 12, no. 4: 49. https://doi.org/10.3390/jsan12040049