1. Introduction
One key component in the attainment of smart cities is the application of the Internet of Things (IoT) concept in the localization of a person or equipment in an indoor location. Inside a building, global positioning systems cannot be utilized because of the lower accuracy due to line-of-sight issues present in the form of obstacles such as walls, people, furniture, and fixtures [
1]. There must be a set of deployed edge-service architectures [
2] in a building that can intuitively and intelligently provide services and solutions to its stakeholders, such as customers, tenants, and parkers. One good example of smart city applications is the implementation of a low-cost [
3] and of a IoT-based [
4] electronic parking system. These smart parking systems eliminate the tedious process of finding vacant spaces, mitigate the unnecessary fuel consumption, and reduce the search time [
5].
Indoor positioning systems (IPSs), also known as indoor location tracking, comprise a technique that can be used to identify the presence or absence of people or objects inside a building, such as the number of available parking spaces, the location of expensive equipment, and the movement of people. This system is IoT-based and uses a network of wireless devices to locate items anywhere inside large indoor spaces such as shopping malls, hospitals, and multi-story buildings [
6]. IPSs enable the localization of objects in various indoor environments aided by the advancements of wireless technology, e.g., handheld devices analyzing detected signals. In hospitals, IPSs are being used to navigate, track, and localize individuals and expensive medical equipment throughout the facility [
7]. Moreover, IPSs are also being used in sports and entertainment. Indoor positioning technology has been successfully used in locating the real-time position of athletes when they are in sports and fitness centers [
8].
Another example where IPSs can be deployed is in determining the number of vacant parking slots in commercial establishments and also in providing parking assistance to avoid damage when parking vehicles [
9]. Traditionally, vacant slots are determined upon entrance, where drivers see the number of open slots posted on an electronic board, which is manually changed by the personnel assigned to give the entry key cards. As a service provided by a smart city, intelligent parking systems offer a better quality of life for frequent parkers, shoppers, and workers in a commercial building by providing in advance if there is an available parking space and a means to reserve that slot [
10]. Other smart parking systems have focused on resource allocation [
11], reservation [
12], and pricing [
13].
Various works have utilized wireless technologies and other algorithms in developing their smart parking systems. Most works have focused on the usage of Bluetooth devices and access points. In [
14], Bluetooth beacon transmitters were installed in vehicles, while the receivers were deployed on the roadside parking space. A work not different from this on can also be found in [
15]. The parked vehicles with these BLE beacons installed were sensed to determine where the actual vehicle was located. The authors in [
16] employed multiple kinds of wireless technologies, e.g., Bluetooth Low Energy (BLE) devices and smartphones, to localize an available parking space and alert users about it. Their proposed system, called D-PARK, required a smartphone to collect BLE signals to determine where the free space was situated given an outdoor on-street parking. Their architecture deployed multiple BLE beacons distributed over different designated zones. IoT, smart mobile devices, and edge computing were clustered to achieve high user status detection and positioning accuracy in [
17]. They also integrated machine learning techniques to achieve their results, e.g., K-nearest neighbors applied to the BLE RSSI [
18]. One major drawback of using BLE devices in vacant parking slot detection was its installation. As the number of vehicles or slots increased, more BLE devices were needed.
In [
19], a single access point (AP) was used per parking floor to measure the signal strengths at different assigned parking slots at various terminal points. The work required the vehicle driver to input his/her terminal number so that the system could automatically assign a vacant parking slot at that terminal point based on the RSSI readings from the floor’s access point. Four APs were deployed in [
20] for RSSI data collection. These RSSI raw data were converted to the corresponding RSSI heat maps for better localization performance, while implementing a convolutional neural network and long short-term memory network (CNN-LSTM). Other works investigated the use of WiFi RSSI fingerprints for parking navigation [
21] and indoor vehicular tracking [
22]. Ultrasonic sensors were used in [
21] for detecting slot vacancy/occupancy, while inertial sensors were installed in [
22] to guide vehicular movements. A complex parking environment with the presence of strong interference was considered in [
23]. They defined a complex environment as a place where WiFi signals are very much varying. To solve this dilemma, a fuzzy classifier and multi-level perceptron model was proposed.
In this work, the parking occupancy/vacancy detection system (POVD) employed the principles of WiFi RSSI fingerprinting in realizing a smart parking system. We utilized multiple WiFi RSSI sources installed at different locations to extract a unique fingerprint given a parking scenario. Unlike previous research papers, the locations of these WiFi sources do not designate a zone of operation. Two distinct and dynamic indoor environments were considered in the collection of RSSI values sampled at varying times of the day. We note that the challenge of creating a fingerprint database that is both efficient and accurate remains [
24]. The inherent instability of WiFi RSSI and its susceptibility to environmental changes [
25] further aggravates this issue. To mitigate these challenges, our data were collected at varying times of the day and from two distinct locations, thus assessing the impact of environmental factors on fingerprint accuracy and improving the overall robustness of the parking occupancy/vacancy detection system. Since the accuracy performance of indoor positioning systems is still an active topic [
26], we implemented three quick and basic methods of RSSI data processing, namely: (i) weighted averaging, (ii) averaging [
27], and (iii) instantaneous [
28]. Their respective effective prediction rates will be determined by comparing their corresponding mean-squared error (MSE) values. The major contributions of this research work are as follows:
The parking occupancy/vacancy detection system (POVD) was tested in two distinct locations. The utilization of two unique testing sites enabled the examination of the variations in RSSI measurements and fingerprints in relation to the characteristics of the environment. Furthermore, this methodology enabled a comparative analysis of the prediction rates between different locations.
Our exhaustive experiments utilized 10 boxes to represent 10 available parking vehicles. Various parking occupancy/vacancy scenarios were also experimented with. The RSSI readings from a possible of 10 deployed WiFi routers were captured by a developed application installed on a mobile phone for each of the occupancy/vacancy scenarios. Our results also showed the optimal number of routers to be positioned in achieving a certain prediction rate.
By using simple and basic RSSI aggregation techniques, we achieved high prediction rates while incorporating three data processing methods, which aimed to improve the RSSI-fingerprint matching precision. The first method employed is known as instantaneous comparison, in which the current RSSI data are compared to the individual training datasets that were previously gathered. The second approach, known as fingerprint averaging, entails averaging the RSSI data for each location while assigning equal weights to each dataset. Lastly, the third approach, referred to as weighted fingerprint averaging, involves allocating the greatest significance to the most-recently acquired dataset.
This paper is organized into five section:
Section 2 discusses the existing studies and research concerning the subject matter.
Section 3 presents the experimental setup, which describes the data collection, processing, and occupancy/vacancy prediction.
Section 4 describes the results obtained from the experiments and all of the notable observations. Lastly,
Section 5 discusses the conclusion and future research directions.
2. Materials and Methods
In this section, we describe the experimental process employed in the study. Specifically, we describe the two separate indoor settings utilized as testing sites and the methodology for the placement of the APs within each location. Furthermore, this section encompasses a discussion of the technique utilized for collecting WiFi fingerprints and the procedures involved in the data processing, eventually resulting in the formulation of the predictions.
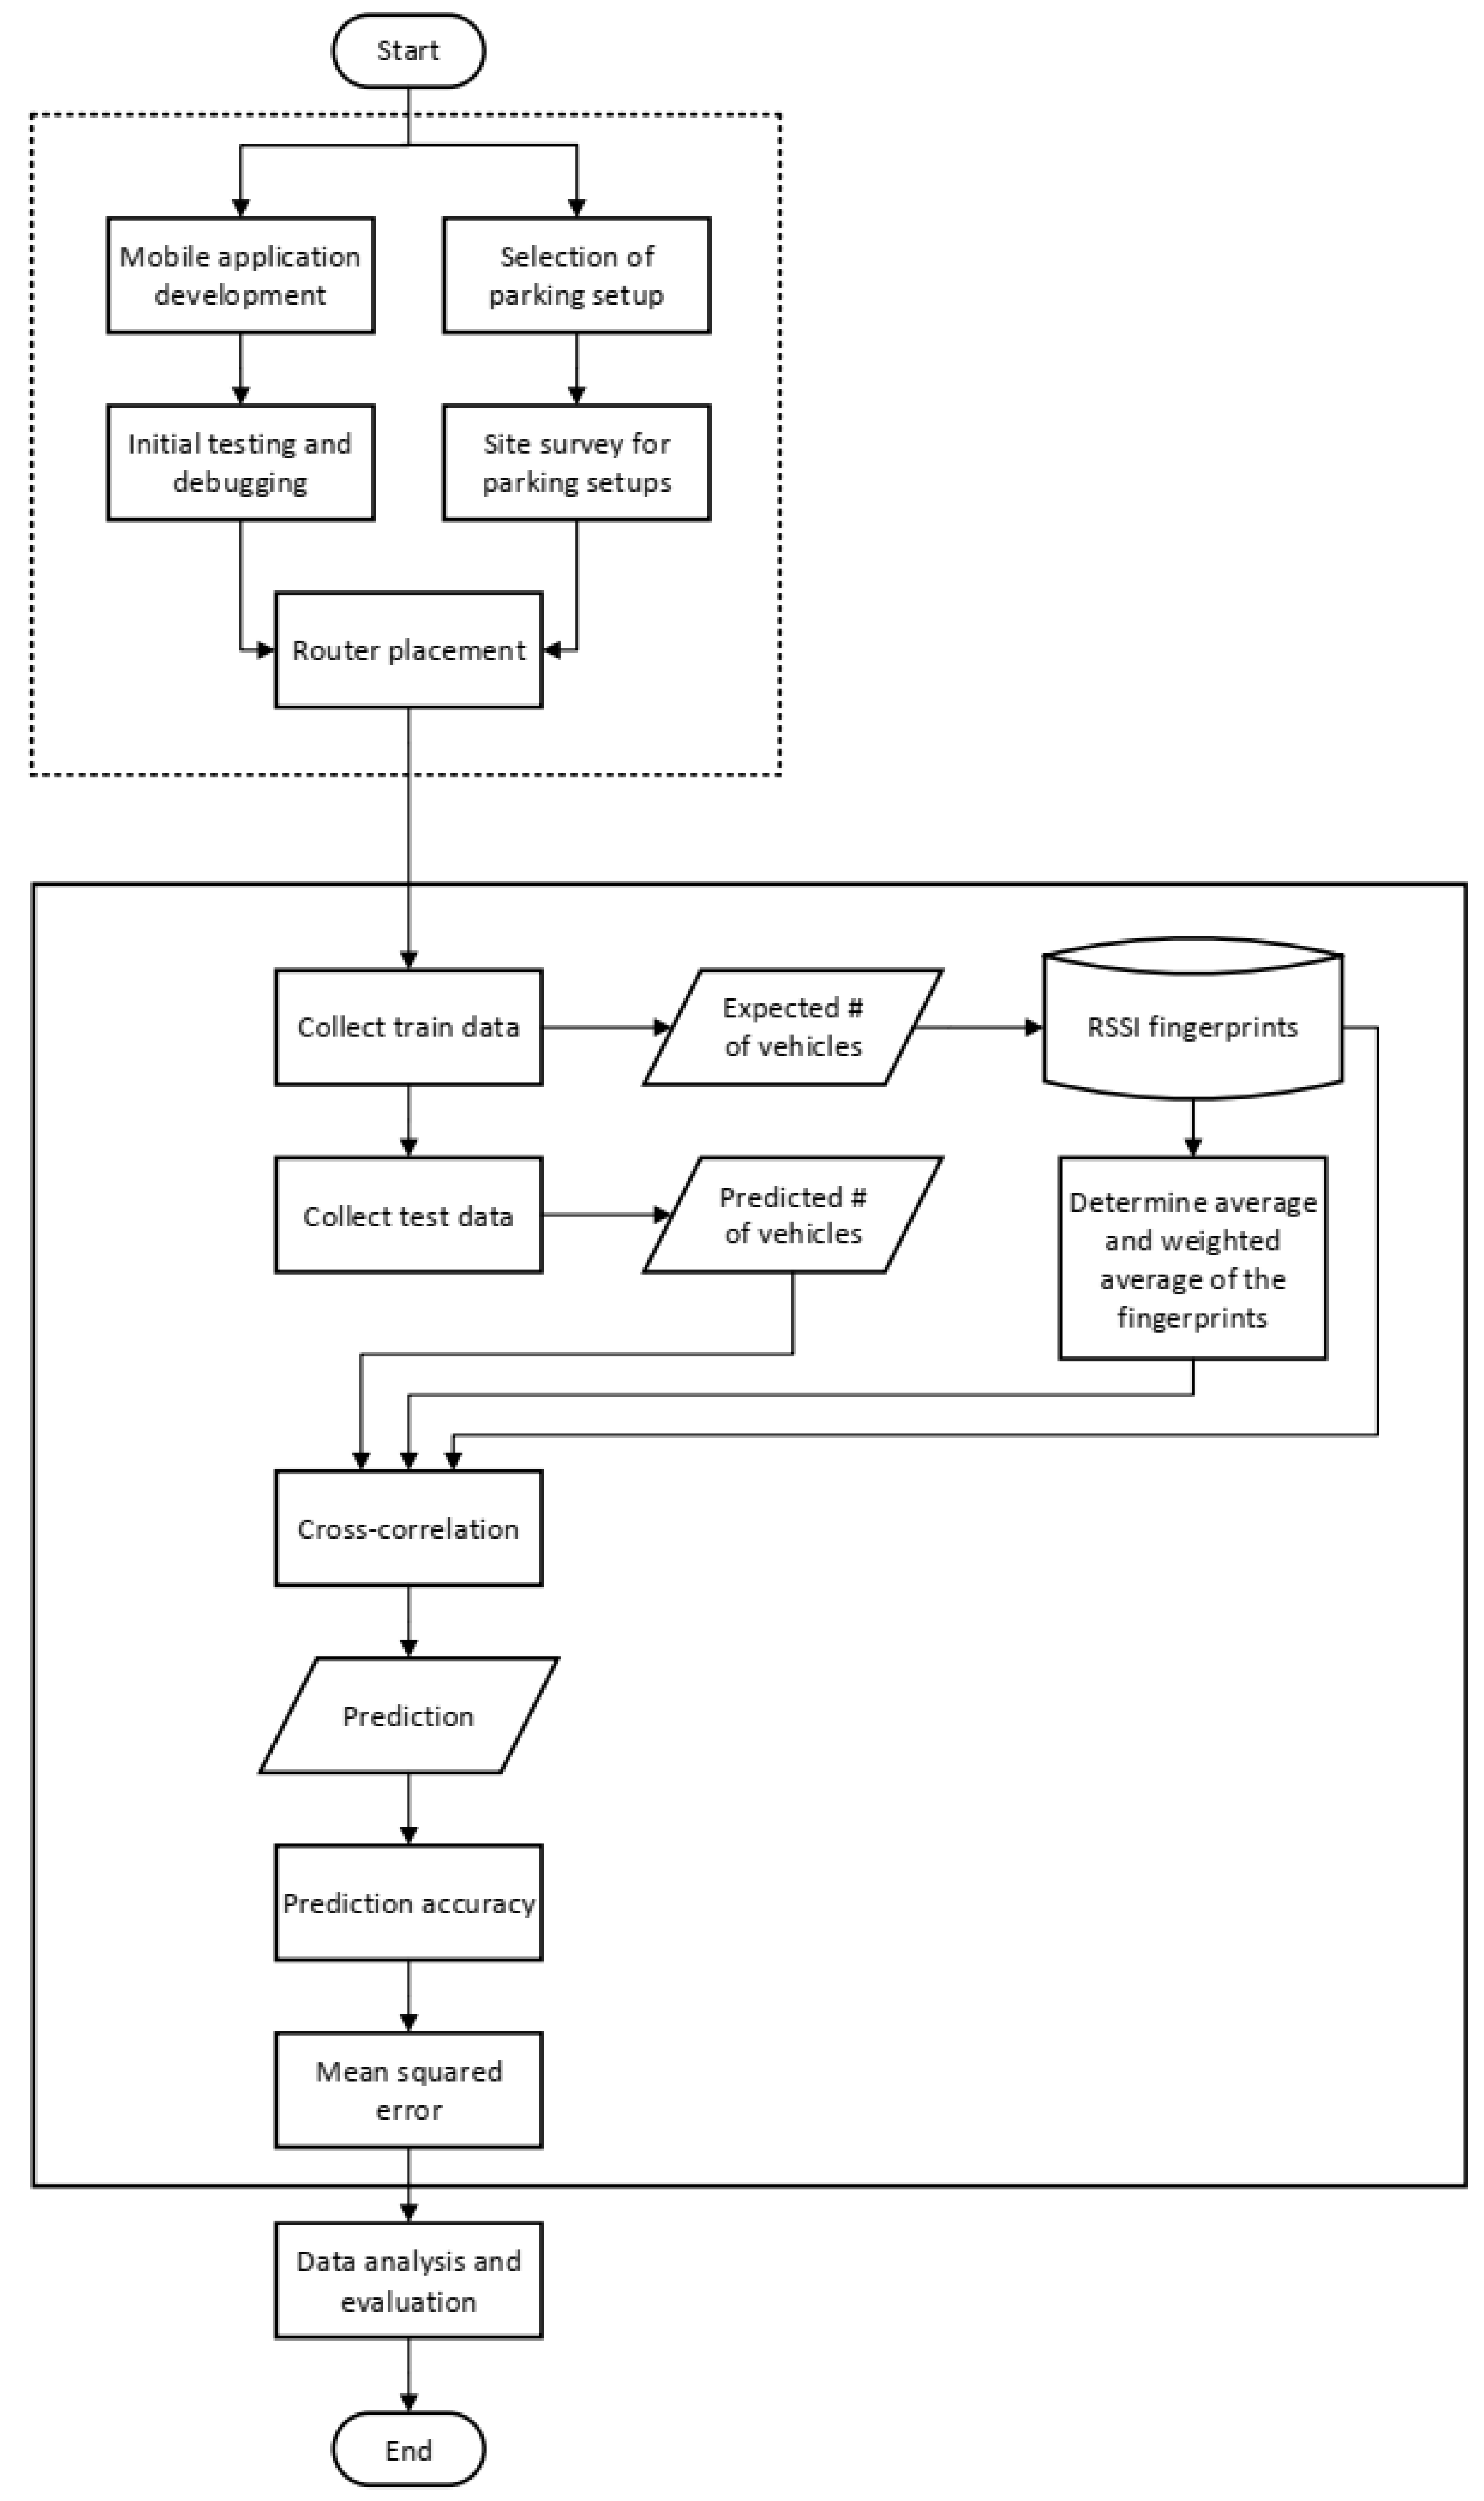
Figure 1 illustrates the flowchart of our methodology in correctly predicting the number of available occupied/vacant slots in an existing parking slot. The research study was divided into two major tasks: (1) experimental setup installation and (2) WiFi RSSI acquisition and prediction. In the first part, two possible locations where we can investigate our proposed method were identified. These locations were chosen in such a way that there was less disruption once the setup was put in place, especially the routers, furniture, and fixtures, which served as the obstacles. This setup is somewhat representative of the daily occurrences in a commercial parking lot. After the installation of the routers in the selected locations, the bulk of the research study was in the data gathering, processing, and prediction. We discuss these important tasks in the subsections below.
2.1. Experimental Setup
The floor plans of the two distinct testing locations used for this study are illustrated in
Figure 2 and
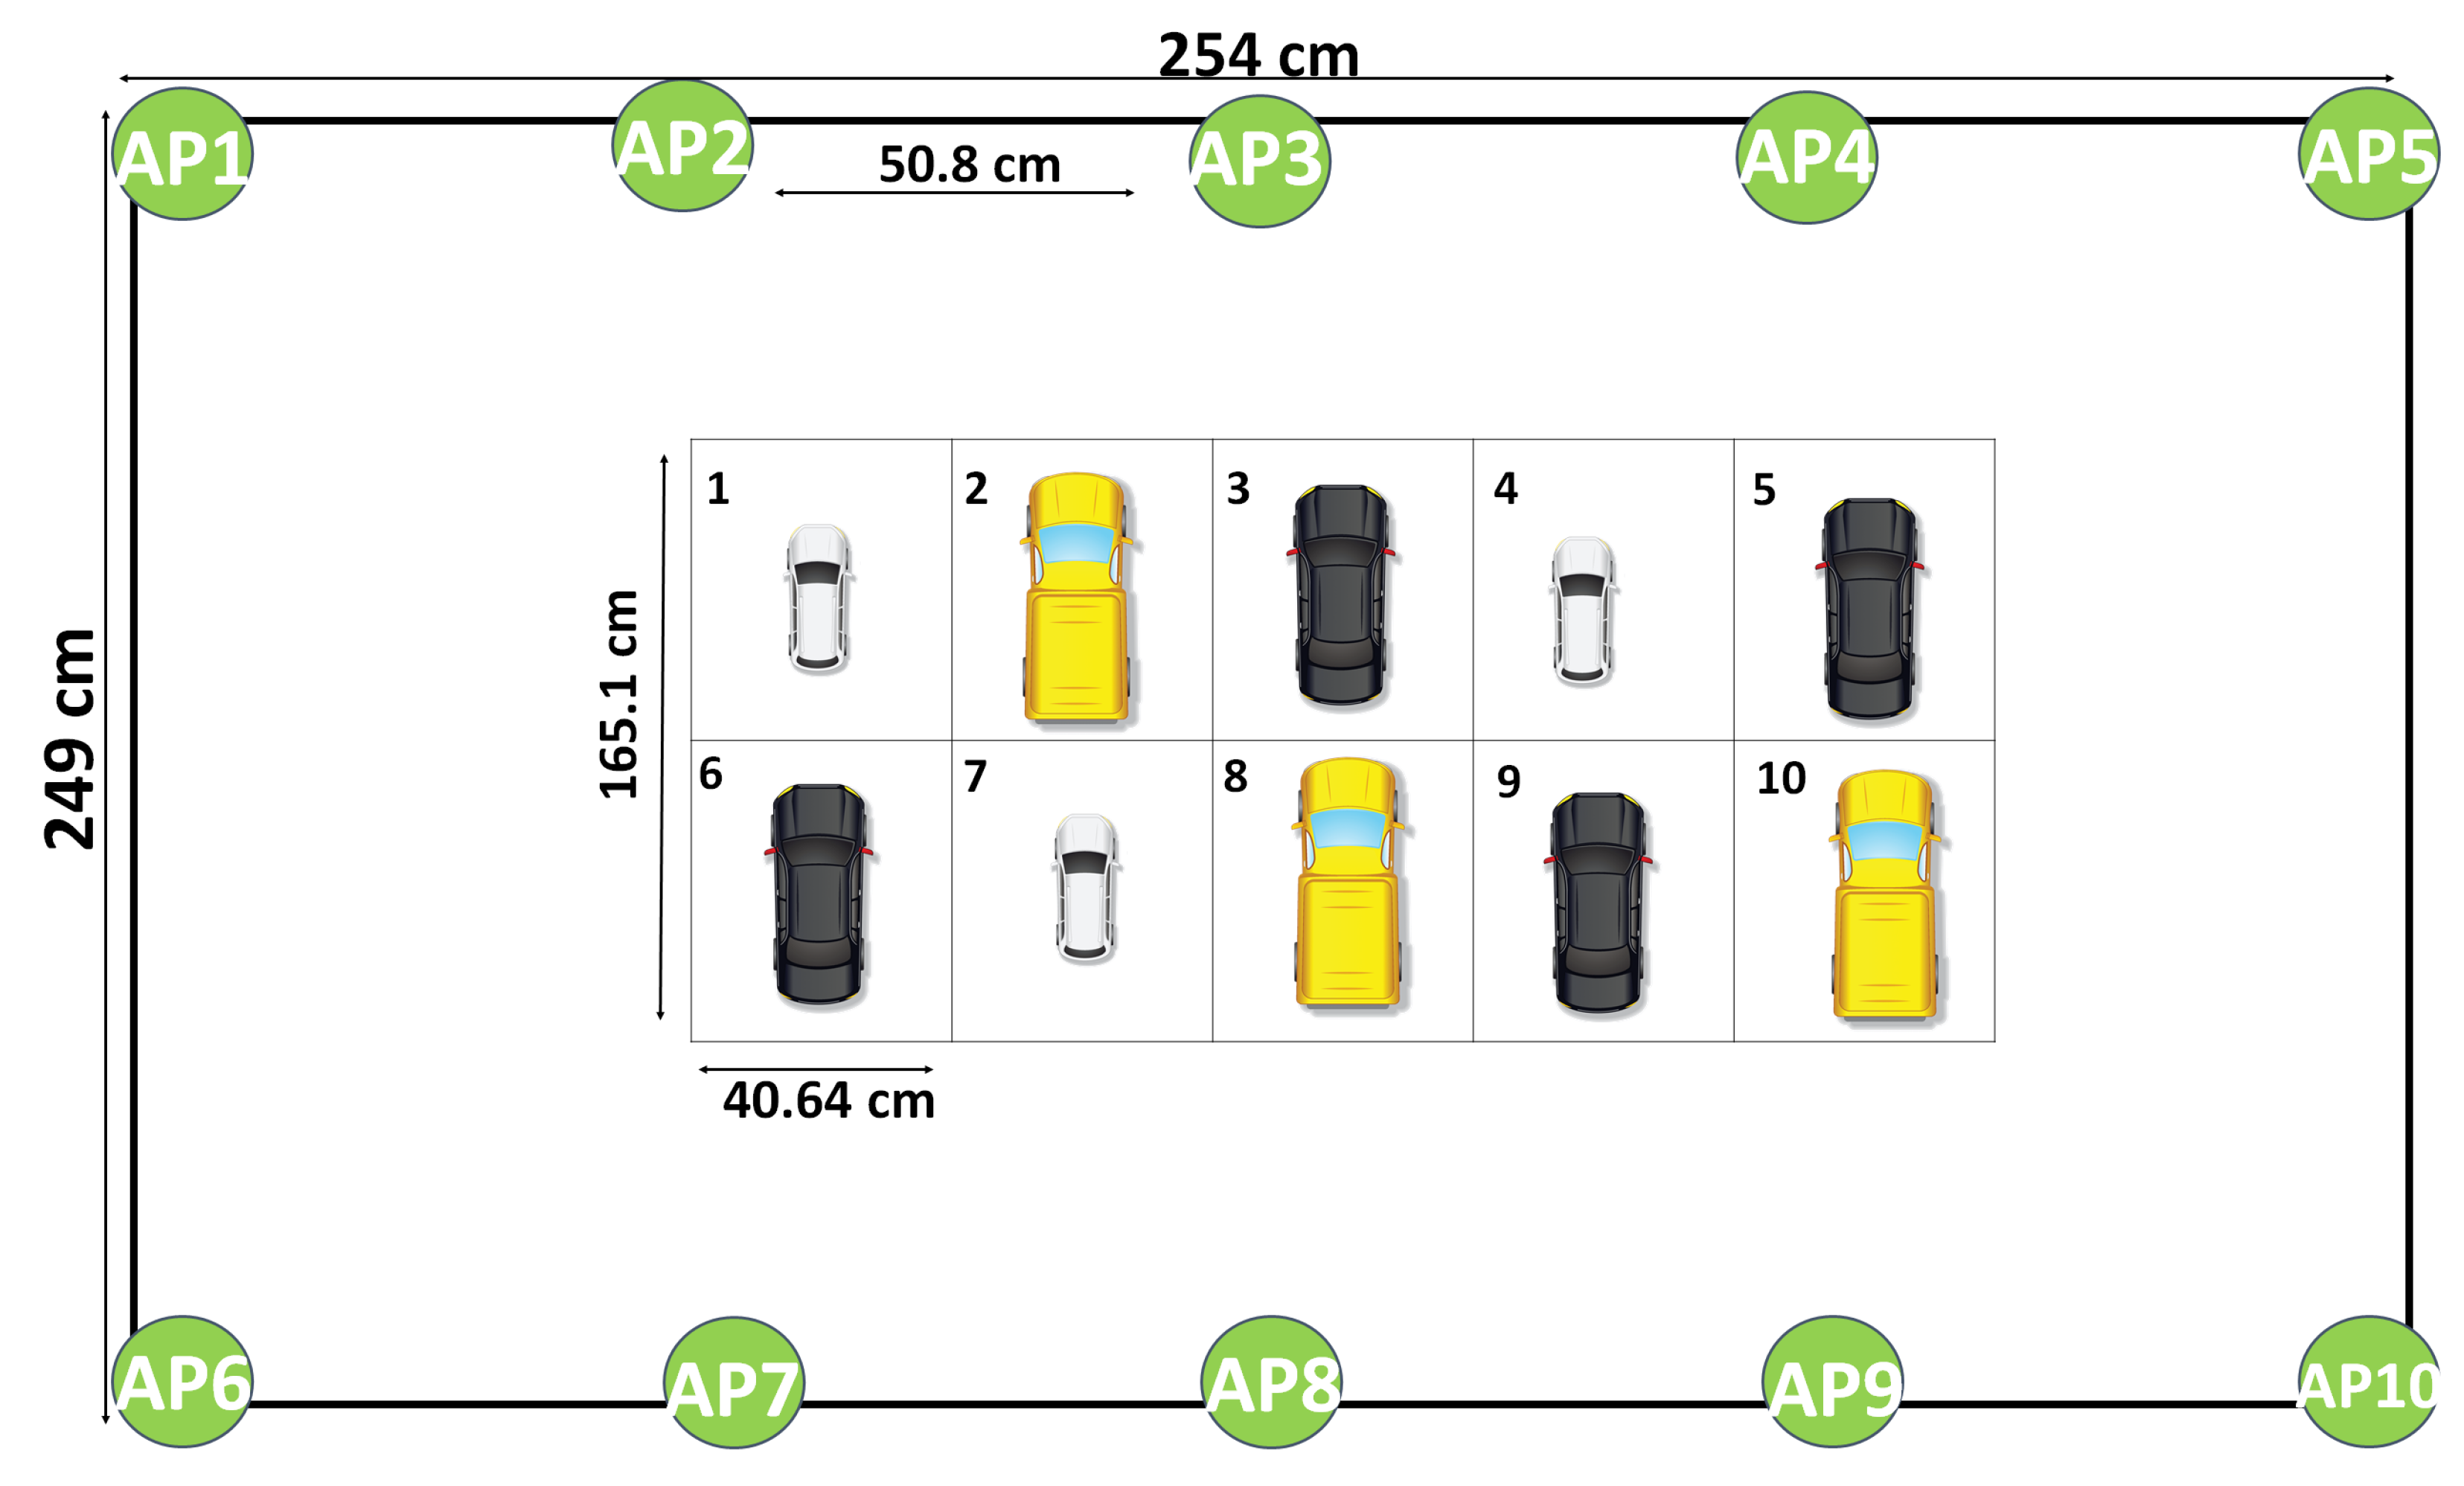
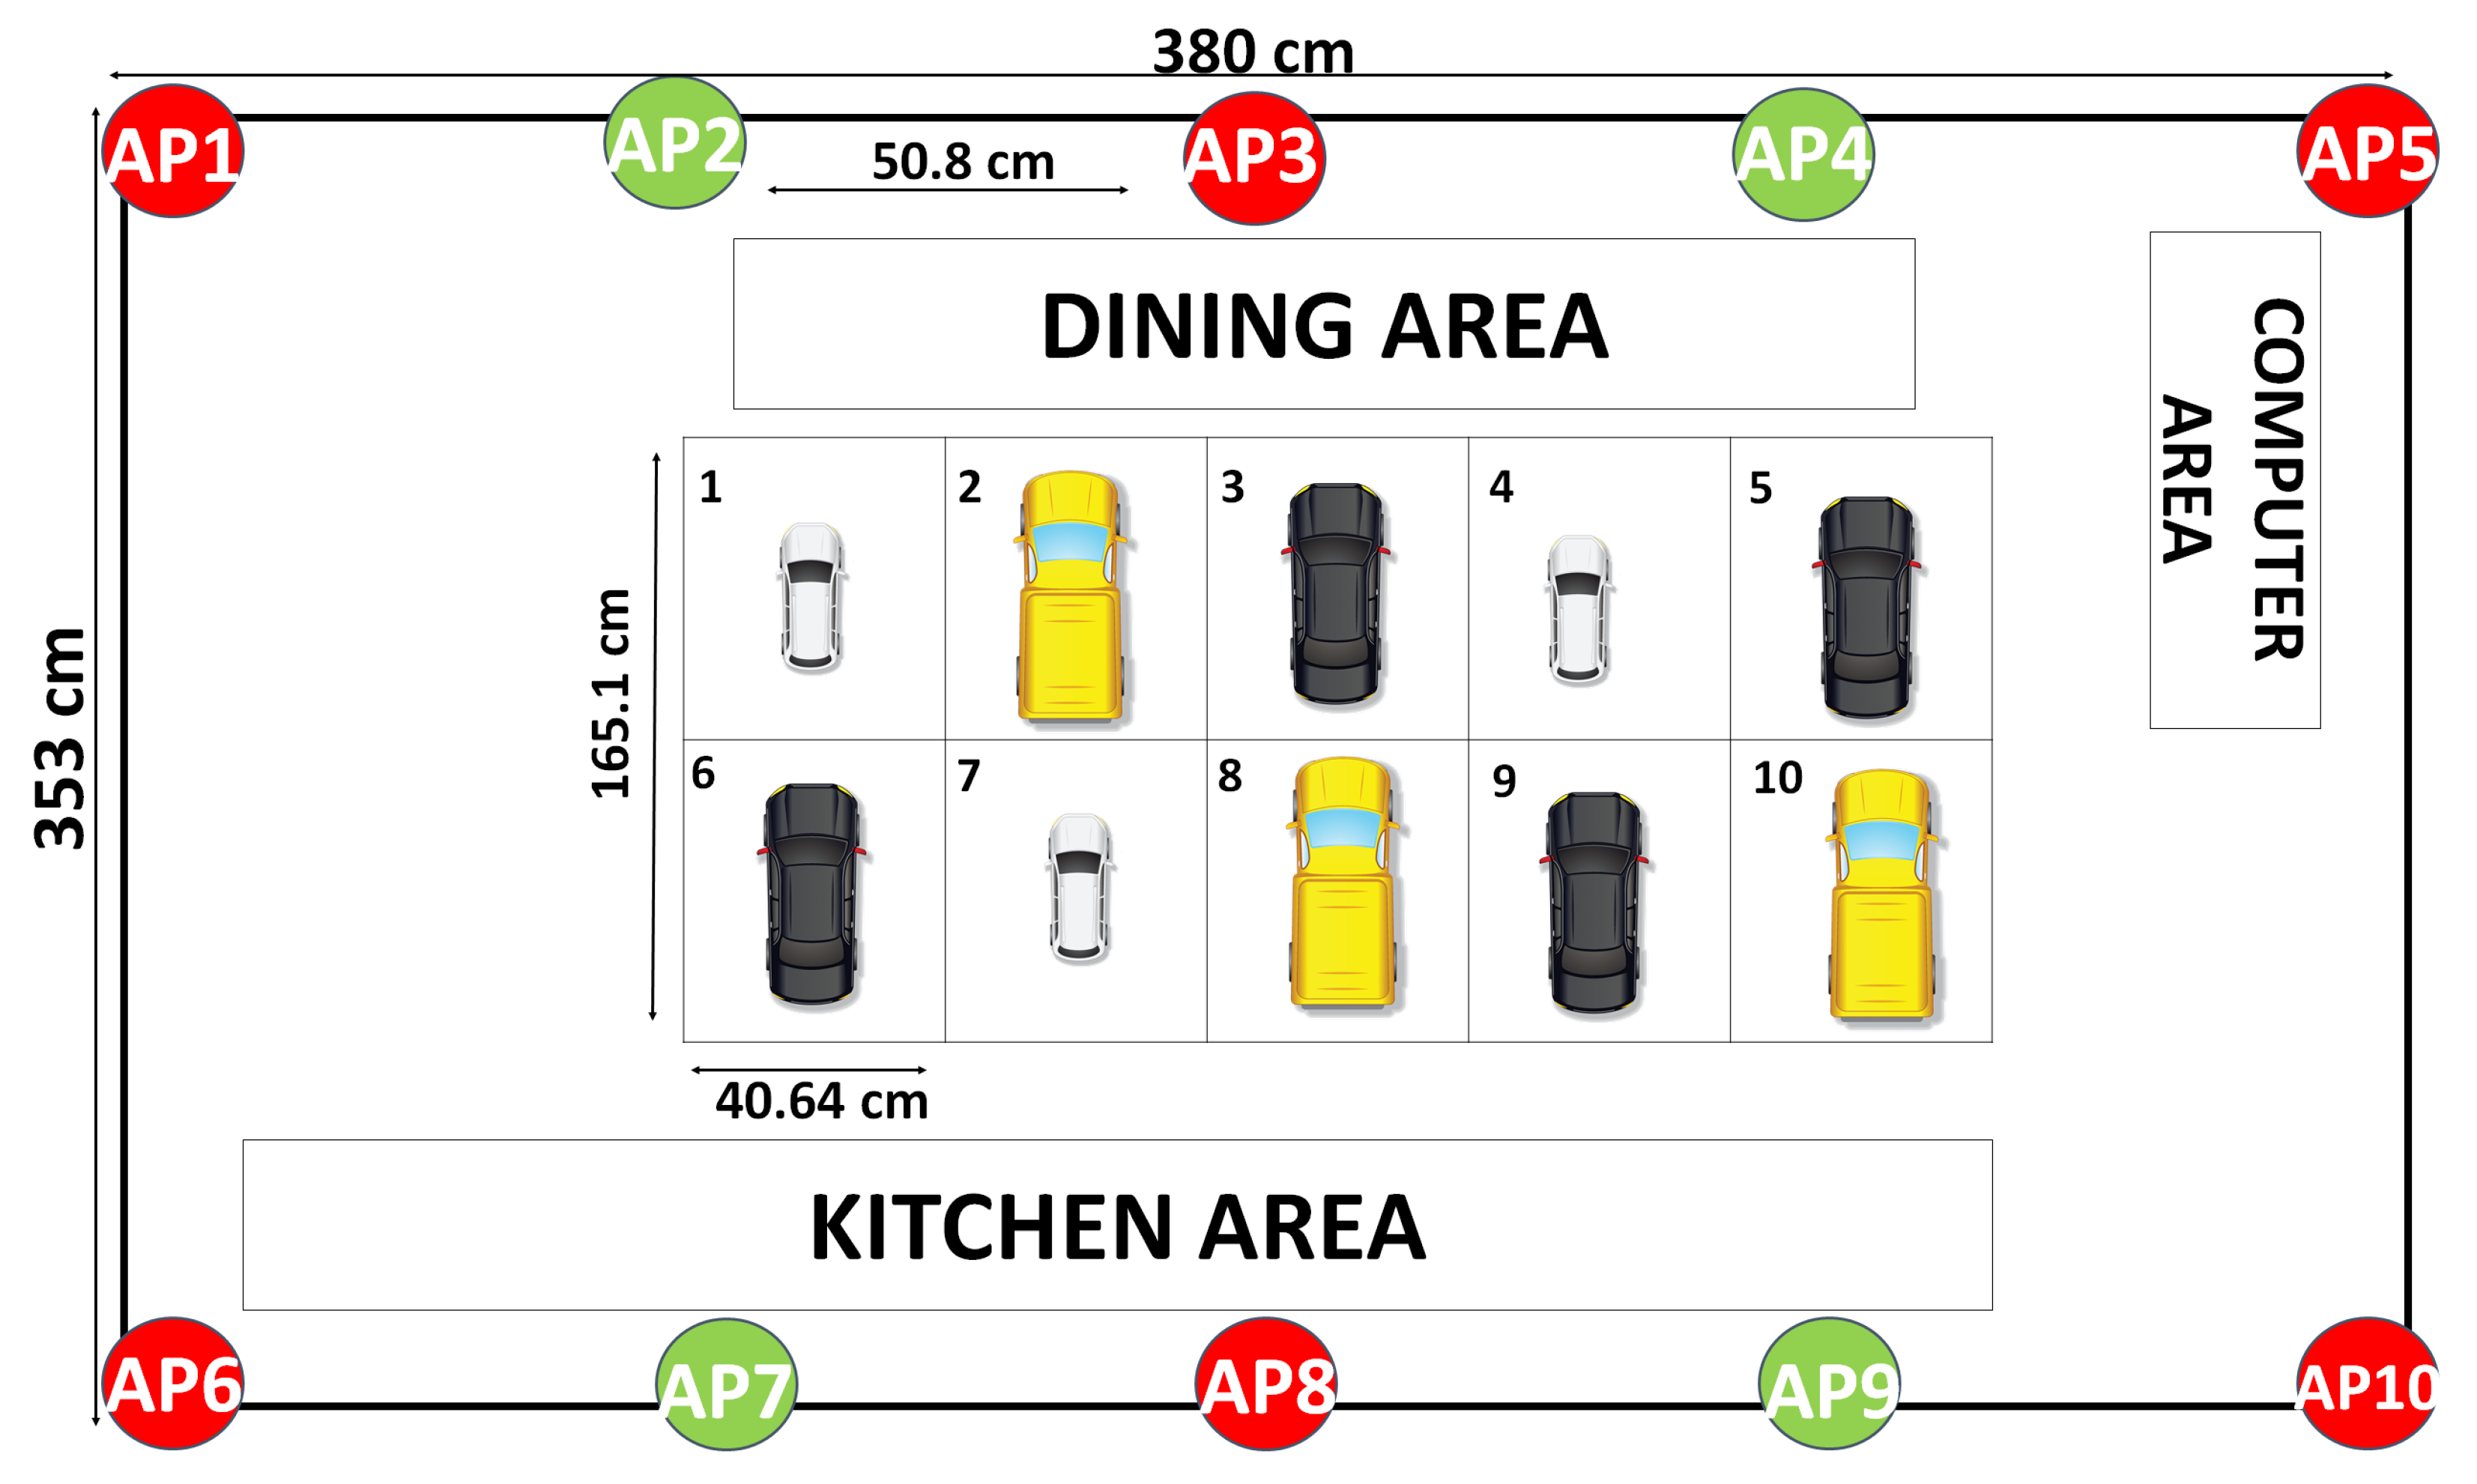
Figure 3. These two locations are situated in two separate houses. The first testing site was a condominium unit, characterized by the presence of dining, computer, and kitchen areas. The second location, which was formerly utilized as a music room, now serves as an unoccupied storage space.
In addition, from the maps of the floors alone, it is apparent that there exists a difference between the area and characteristics of the two locations. This was specifically designated to assess the influence of environmental factors on the overall stability and accuracy of the system. Concurrently, in the first testing site, shown in
Figure 2, 2-, 3-, and 4-router deployments were evaluated, while the deployment of 5–10 APs was tested in the second testing site, shown in
Figure 3. This was performed in order to determine the optimal number of routers that would result in the best prediction rates. Since one testing location is smaller than the other site, the separation, which is 50.8 cm, was calculated by simply dividing the room length by 5. We also placed the routers at the edge of the room to achieve maximum coverage and minimum overlaps between functional WiFi routers. With regard to the placement of the APs, it was imperative to ensure that they were positioned in a symmetrical and organized manner to simplify the installation. Consequently, a specific metric was adopted for their placement, as demonstrated in the accompanying illustrations.
2.2. WiFi RSSI Fingerprint Collection
An Android application was developed to facilitate the efficient sampling and collection of fingerprints corresponding to each deployed router and parking scenario. The obtained fingerprints served as the offline representation of a parking scenario and, subsequently, were utilized to correlate with the online WiFi RSSI data for the purpose of prediction. All WiFi RSSI readings, whether training or testing datasets, were passed to a central computer that could store these datasets and predict the current parking scenario by correlating training and testing parking scenario datasets.
In this research, 10 parking slots were selected to facilitate the experiment, resulting in a total of 11 possible parking scenarios. In each parking scenario, i.e., depending on the number of cars parked, five different combinations were evaluated each for the training and testing phases, wherein no scenario setup was the same for the testing and training phases. For example, take the parking lot setup in
Figure 2 and the parking lot scenario where two cars are parked. The training dataset will be collected when cars are parked in slots (1, 2), (3, 4), (5, 6), (7, 8), and (9, 10). On the other hand, the test dataset will be collected when cars are parked in slots (2, 3), (4, 5), (6, 7), (8, 9), and (1, 10). Such a consideration helped us to eliminate testing bias.
The exceptions to this test and training dataset collection were the 0 and 10 scenarios, where only one combination was possible.
A 5-minute sampling period was designated for each combination’s measurement of the RSSI. Additionally, a scan was conducted every 30 s, yielding a total of 10 readings. The sampling time for each measurement was carefully determined through analysis to effectively capture the variations of values that may occur throughout the day. To ensure accuracy, this procedure was conducted three times at selected intervals within a 24 h period to accommodate the effects of the dynamic environment.
Each collected dataset, denoted as , where D corresponds to the dataset number and E denotes the number of cars parked, was stored in the fingerprint database.
2.3. Data Processing and Prediction
The collected RSSI readings from all access points characterizing the parking scenario were time-bound data gathered from the indoor environment. thereby, they can be represented by their averages. However, in order to test and determine the optimal method that would yield the highest prediction rates, three methods of data processing were conducted.
The initial technique employed is known as instantaneous comparison, which entailed an individual correlation of the online data to the collected
. The subsequent method involved the procurement of the average fingerprint for E cars parked. In simpler terms, this approach is characterized by the calculation of the average fingerprint for each parking scenario; thus, this method is called fingerprint averaging, denoted as
, as shown in (
1).
Meanwhile,
or weighted averaging was the third method of data processing utilized. This entailed the allotment of the most-significant weight to the most-recent dataset obtained, which is depicted through (
2).
In both equations, D corresponds to the number of gathered datasets in each training phase.
In the process of detecting parking lot availability/occupancy, our system made use of the cross-correlation between online data,
, and saved offline fingerprints,
. This is shown in (
3). The results of this correlation,
, were compressed into heat maps, where each column represents a similarity measure between the online and offline WiFi RSSI data for each parking scenario. The maximum value for each column was utilized to make the predictions. In order to make the visualization of the results clearer, we applied color mapping to the matrix, where the highest value is shown as dark red and the lowest value is shown as dark blue. This indicates that, when a cell’s color approaches dark red, a higher degree of similarity between the offline and online datasets was observed.
where
and
are either the instantaneous, average, or weighted average online and offline RSSI measurements, respectively, depending on which method is evaluated.
denotes the inner product between the real-valued
x and
y vectors.
is given in (
4), where
is the RSSI reading at WiFi router
x at the time when the number of occupancy/vacancy is predicted.
2.4. Experimental Procedure
Over the course of our experiments, we employed a Samsung Galaxy AO3s and a Samsung Galaxy Tab A to obtain the RSSI values for Testing Site 1 and Testing Site 2, respectively. To identify the WiFi router from which the WiFi RSSI measurements were collected, their respective basic service set identifiers (BSSIDs) were recorded. In order to provide ample parking options for a variety of car quantities, we implemented a 10-slot indoor parking facility. However, we only considered five scenarios for each number of cars parked in our training or fingerprinting process. It is important to note that both 0 and 10 cars parked only have a single possible scenario each.
During the course of our experimentations, training fingerprints were collected from two experimental settings and saved in a database. In collecting RSSI measurements, the sampling period was set to 5 min, where each scan took 30 s to be completed, thus resulting to a total of 10 readings. Moreover, to account for and observe the effects of a dynamic environment, the offline training procedures were conducted on three different time intervals within a 24 h period. These intervals were specifically 1 a.m. to 5 a.m. (Dataset 1), 10 a.m. to 2 p.m. (Dataset 2), and 7 p.m. to 11 p.m. (Dataset 3). The two experimental setups were situated in close proximity to each other in Manila, which meant that they experienced the same weather conditions during the experimentation process. Throughout the experiment, no extreme weather events, such as storms and heavy rain, were experienced. However, it is important to mention that the temperature from the three timestamps varied. The first dataset was the lowest, with an average of 25 °C. The highest temperature peak occurred during Dataset 2 at 10:00 a.m. to 2:00 p.m., with an average of 30 °C, before dropping again during Dataset 3 to an average of 26 °C.
Once the offline or training datasets were complete, the online RSSI data,
, were now obtained and then cross-correlated to our offline data. During this online stage, a new set of five scenarios for each number of parked cars for the online data was tested. This approach was adopted to comprehensively evaluate the system’s capabilities and precision. Furthermore, three data aggregation methods, namely instantaneous comparison, fingerprint averaging, and weighted fingerprint averaging, are presented to remedy and increase the prediction accuracy. Instantaneous comparison involves individually correlating each of the online data with the
datasets. To minimize the dynamic environment effects, fingerprint averaging was considered, as shown in (
1). This method combines the offline datasets into one dataset representing their mean. Finally, another method, weighted fingerprint averaging, assigned the greatest weight to the most-recent dataset, as shown in (
2).
In each of these methods, the prediction of the number of vacancies relies on finding the maximum correlation between the online and offline RSSI readings, i.e., computing for (
3). For each result, the feature scaling or min–max normalization was employed to discriminate the true positives from the false positives. Predicting the correct number of car vacancies was achieved by locating the correlation value that was approximately equal to one. The calculated values obtained from correlating the online and offline data from each router deployment and data processing method were consolidated into heat maps and prediction matrices.
3. Results
We present in this section the results obtained from our experiments involving two test sites and various car parking situations.
3.1. Effects of Varying Location and Time of Collection
Fingerprinting encounters a significant challenge in adapting to real-world settings due to the dynamic nature of WiFi RSSI measurements [
29]. This may be attributed to various factors including physical obstacles in different environments, which can make it difficult to identify access points accurately. Additionally, RSSI measurements are subject to changes over time and may fluctuate due to factors such as higher levels of network interference and congestion during specific times of the day [
30]. To investigate this and evaluate its effects on the system’s overall prediction accuracy, the experiments were conducted in two distinct indoor environmental settings and at three different timestamps during a 24 h period.
Shown in
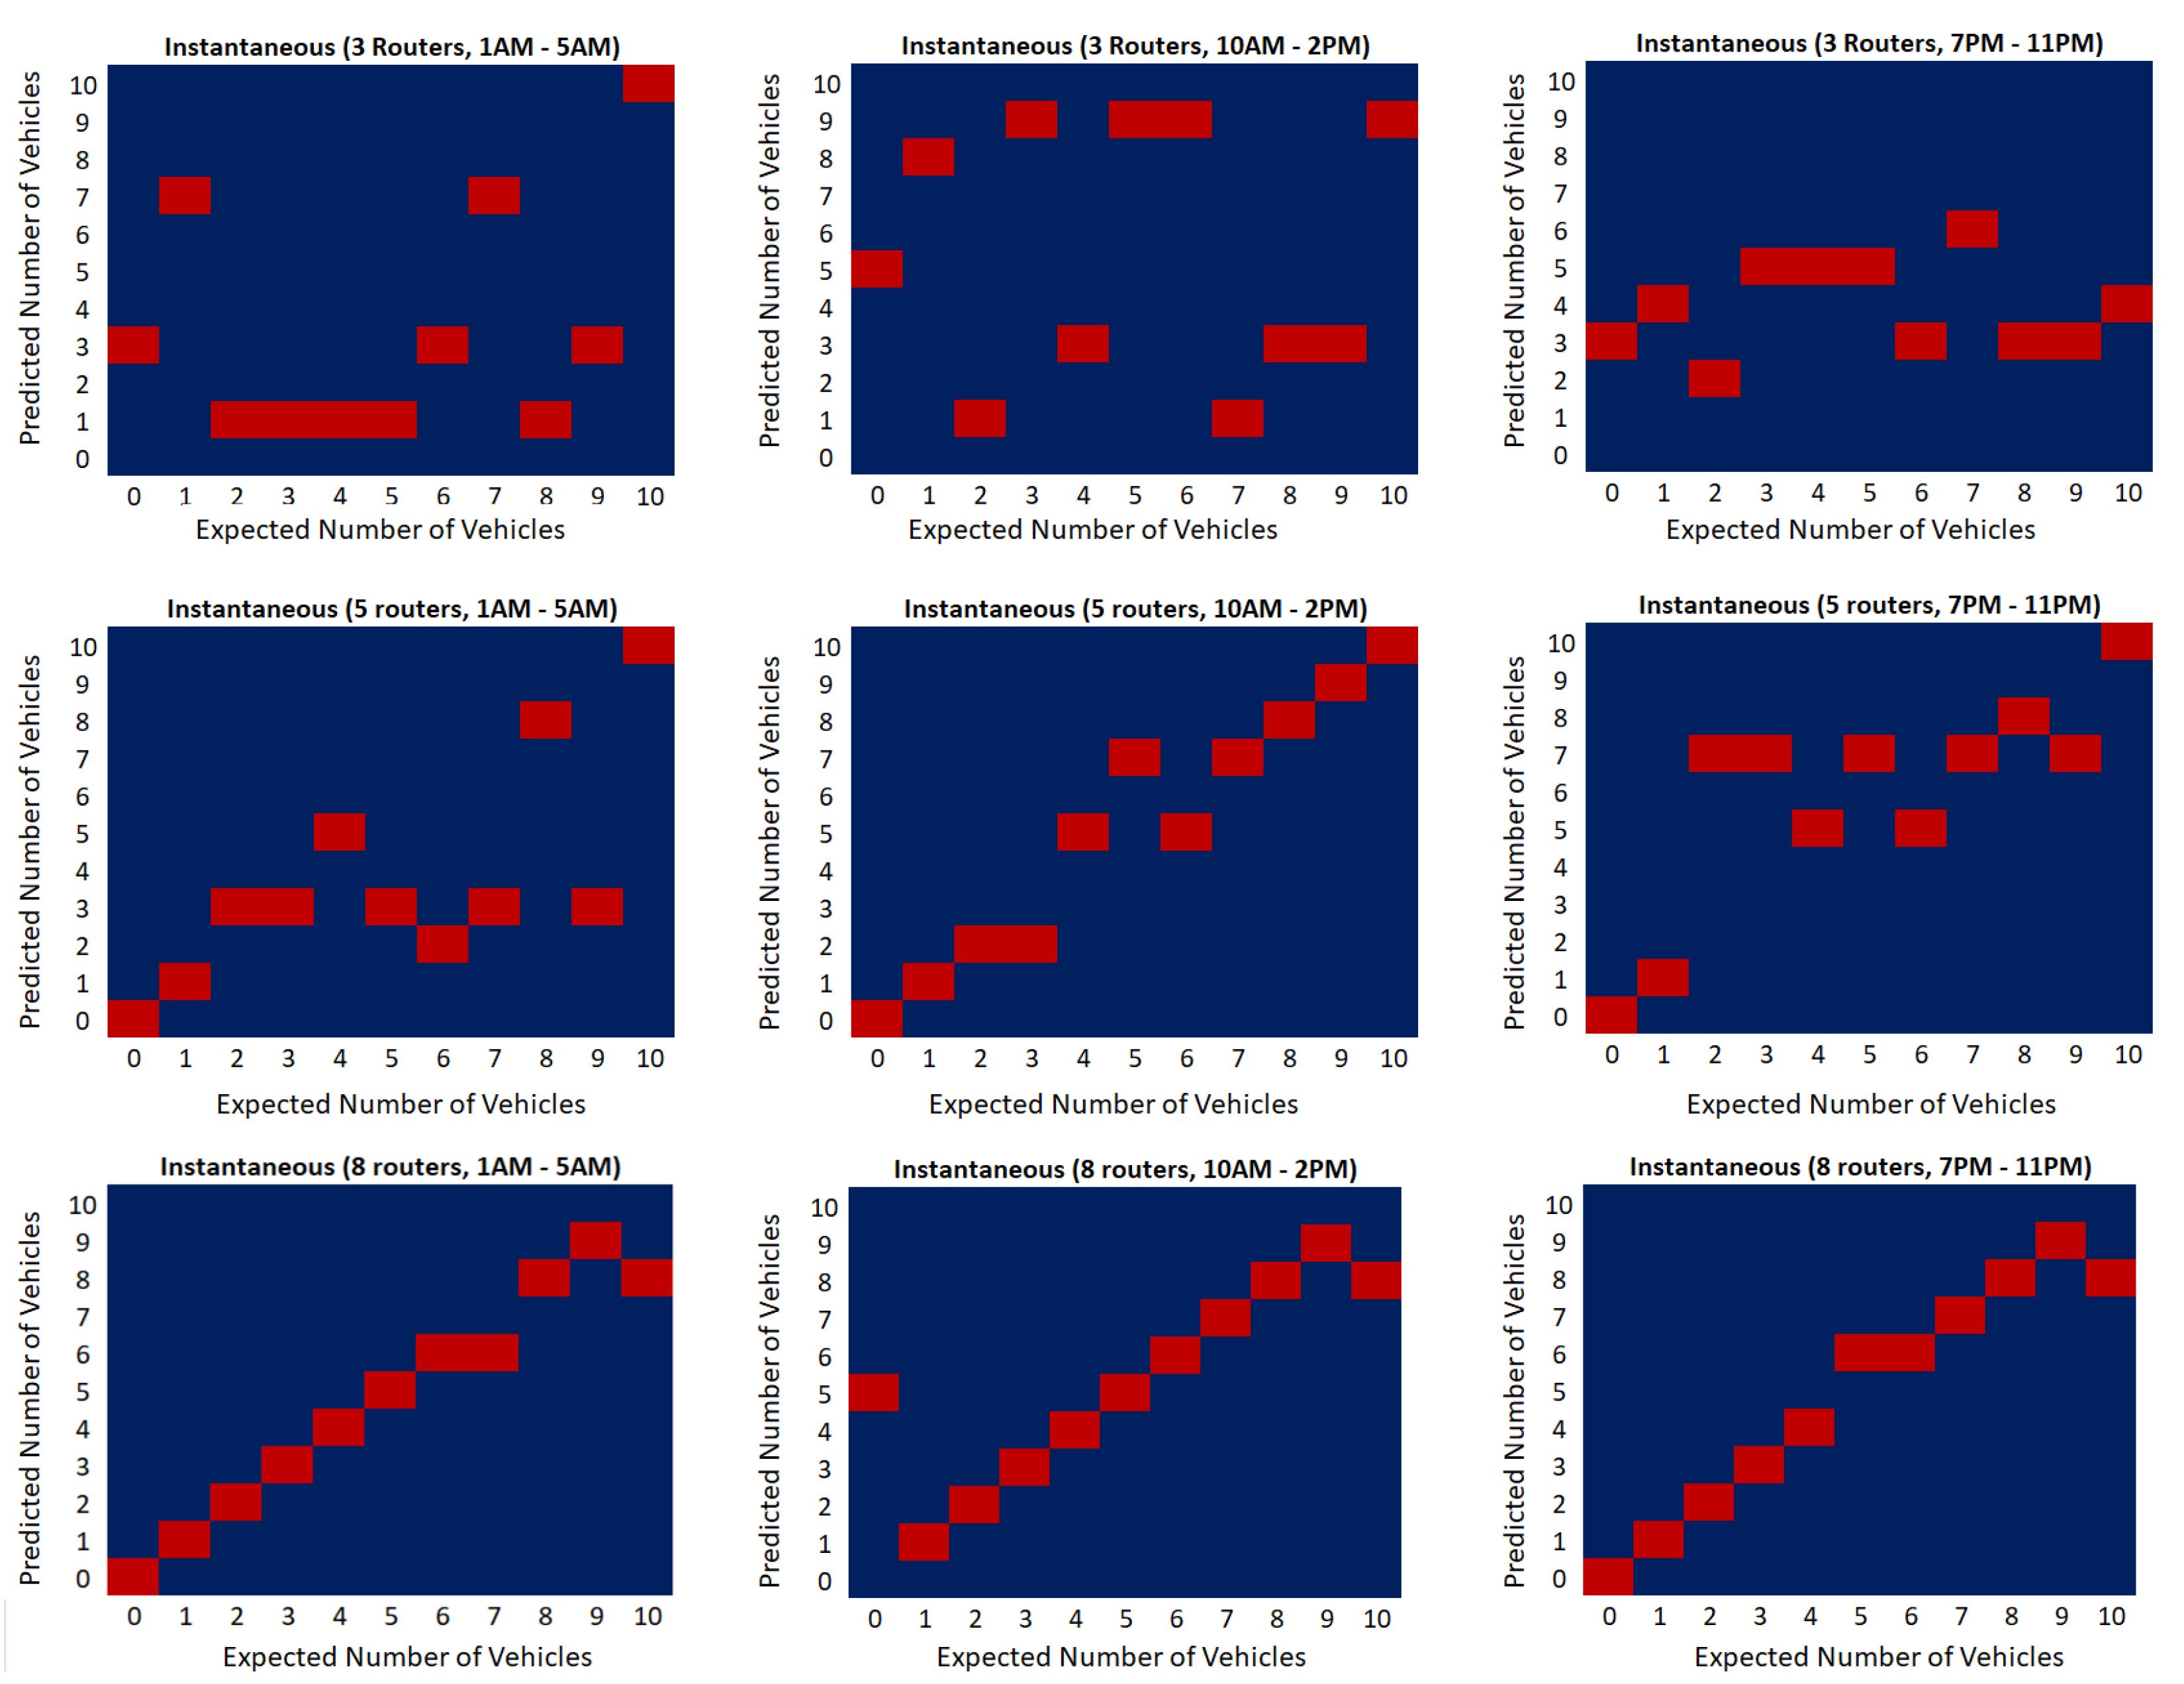
Figure 4 are the compiled results gathered from the instantaneous comparison originating from the three different timestamps of data collection while using a number of WiFi routers. In
Figure 4, the rows represent the number of deployed routers, i.e., 3-, 5-, and 8- router deployments. The columns show the various timestamps when the RSSI measurements were collected.
In the experiment involving a three-router setup done at Testing Site 1, the data collected during the 1–5 a.m. interval were only able to accurately predict the presence of 7 and 10 parked cars. However, during the 10 a.m.–2 p.m. interval, no parking scenario was identified correctly. Lastly, during the 7–11 p.m. interval, the system accurately predicted the presence of 2 and 5 parked cars in the facility.
On the other hand, the five-router setup conducted at Testing Site 2 showed a noticeable improvement in terms of prediction accuracy. The system was able to accurately predict multiple parking scenarios, with results showing 0, 1, 3, 8, and 10 cars parked during the first time interval, 0, 1, 2, 7, 8, 9, and 10 cars parked during the second time interval, and 0, 1, 7, 8, and 10 cars parked during the third time interval. The results showed that an increased number of deployed WiFi routers and a location having less interference contributed to the increase in prediction accuracy.
Lastly, the eight-router experiment performed at Testing Site 2 further improved the accuracy of the system with the results showing that, from the first timestamp, the only erroneous prediction was when 7 and 10 cars were parked in the facility, while for the second time period, only 0 and 10 cars parked were wrongly predicted. Lastly, the third time interval revealed that the only errors of system were when 6 and 10 cars were parked in the area. More importantly, a more consistent prediction was observed as more routers were deployed.
Evidently, the experimental results showed that, at various times of a day, the predictions from each router deployment varied. There was no router setup that produced the same predictions at different times of the day. This finding highlights the impact of a dynamic environment on the RSSI collection, thus varying the system’s predictions as well. However, it was also observed that, as the number of WiFi routers deployed in the area increased, the prediction accuracy of the system also increased, therefore reducing the effects of the dynamic environment on the system’s performance. This finding underscores the importance of the careful consideration of the environmental factors that can impact the accuracy of WiFi-fingerprinting-based systems.
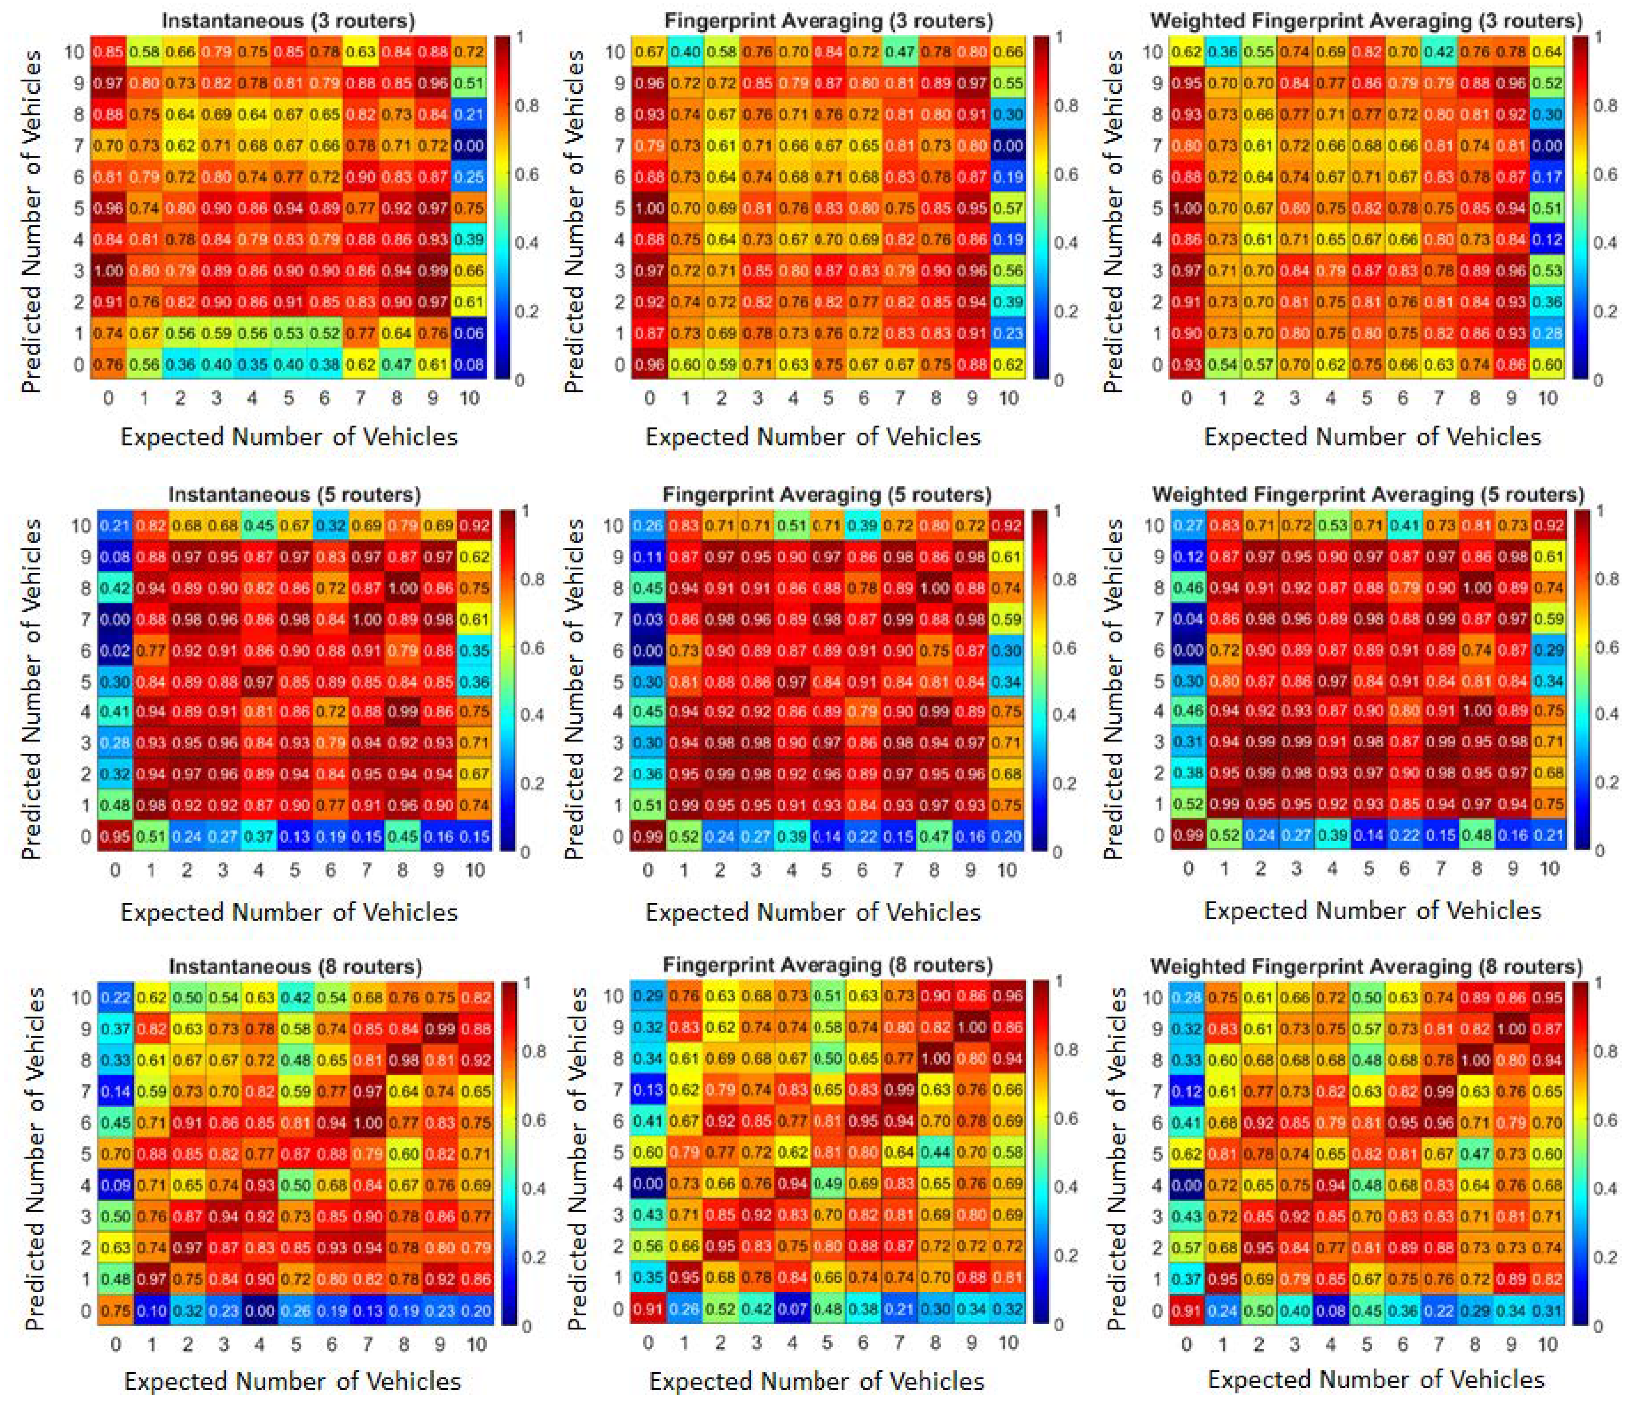
3.2. Parking Lot Vacancy Detection
Figure 5 displays the heat maps gathered from the 3- (first row), 5- (second row), and 8-router (third row) setups using the methods of instantaneous comparison,
, and
, respectively. From visual inspection of the three-router setup alone, it is evident how the system was not able to make accurate predictions for each parking scenario. In cases where correct predictions were made, the corresponding heat maps did not show a dark red color, which indicates that the correlation between the offline and online data was relatively weak.
Meanwhile, the results obtained from the 5-router setup demonstrated significant improvements compared to the 3-router setup. The heat maps generated by the five-router setup exhibited better predictions, shown by the forming diagonal line of dark red cells. However, it was also apparent that, even though the prediction rates improved, several cells have comparable colors, indicating that, although the correct prediction was produced, the offline and online data for these scenarios were relatively close to each other.
From the eight-router deployment results, we observed a considerable improvement relative to the two previous setups discussed. Based on the heat maps, we found a strong correlation between the accurate predictions of this setup and the observed offline data. From a visual inspection alone, it was evident that the correct predictions stood out from the remaining data. From these heat maps, we acquired the highest correlation values for each parking scenario and marked them as the system’s predictions. Thus, for our prediction matrices seen in
Figure 6, for the 3- (first row), 5- (second row), and 8-router (third row) deployment schemes and instantaneous comparison,
, and
, respectively, the red grid highlights the predicted parking scenario, while the blue ones denote the other scenarios that were disregarded.
The results showed that, with the deployment of three routers alongside , the system accurately predicted the presence of 1, 2, 3, 9, and 10 parked cars, resulting in an accuracy rate of 84.55%. Meanwhile, further decreased this accuracy rate by only correctly identifying 2, 3, 9, and 10 cars parked. Lastly, instantaneous comparison produced the lowest accuracy among the three methods in this router setup by only correctly identifying five cars parked.
In our deployment of five routers, we observed a significant improvement in prediction accuracy using . The only erroneous predictions made by this method were for 4 and 5 parked cars. On the other hand, incorrectly predicted 4, 5, and 6 parked cars, while for instantaneous comparison, we noticed a significant decrease in accuracy for this setup with the only correct predictions being for 0, 1, 7, 8, and 10 parked cars.
The figure also illustrates that the utilization of weighted averaging achieved a perfect prediction rate upon deploying eight routers. This was the first instance in which a perfect prediction rate was attained across all router setups; however, it can also be noticed that, using , the system failed to correctly identify when there were 5 cars parked in the system, while for instantaneous comparison, it misidentified 7 and 10 cars parked.
It is important to acknowledge that the testing environments varied, as the 2–4 router configuration was implemented in Testing Site 1, while the 5–10 router setup was utilized in Testing Site 2. Furthermore, it is worth noting that the parking scenario involving five parked cars had the highest number of potential variations. From the prediction matrices produced, it can be noticed how the system’s prediction improved. This shows that, as we increase the number of routers deployed in the area, the predictions of the system become more accurate.
4. Discussion
In this section, we discuss the obtained results in terms of the prediction accuracy and the determination of the optimal number of deployed WiFi access points. At the end of the discussion, we provide the limitations of the project and how they can be addressed in other dynamic environments.
4.1. Performance Metric Evaluation
In order to evaluate and quantify the system’s performance, two metrics were utilized, mean-squared error (MSE) and percent accuracy.
To calculate the MSE value, we utilized (
5) below.
where
denotes the number of total parking scenarios,
are the observed values, and
equates to the system’s predicted values.
Illustrated in
Figure 7 is the mean-squared error (MSE) value for every method as the number of deployed routers increased to 10. We only used a maximum of 10 routers because, in practical applications, a WiFi router installed per each parking slot should be enough to determine parking vacancy. In our experiments, we wished to determine how many WiFi routers should be used to observe changes in a car parking scenario with 10 parking slots.
It is noticeable from the graph that there was a significant drop when the router deployment was five as the MSE reached a value of lower than 1 for both and . This signifies that the observed and predicted values for five routers were now closer to the regression, making it more accurate. Furthermore, it can also be said that our system required only a minimum of five routers to acquire an MSE value of lower than 1, specifically 0.45. Moreover, the results also showed that, with only eight access points (APs) employed, the system could successfully distinguish the number of parked cars in the experimental environment through weighted fingerprint averaging, leading to an MSE value of 0. Conversely, the fingerprint averaging method necessitated the use of nine routers to achieve an equivalent MSE value. On the other hand, the instantaneous comparison approach consistently obtained the highest MSE value in all of our conducted experiments, even with the maximum of 10 routers utilized. This result implied that there is a significant likelihood of identifying a copy or closely resembling the training data while cross-correlating the online data, resulting in an erroneous prediction.
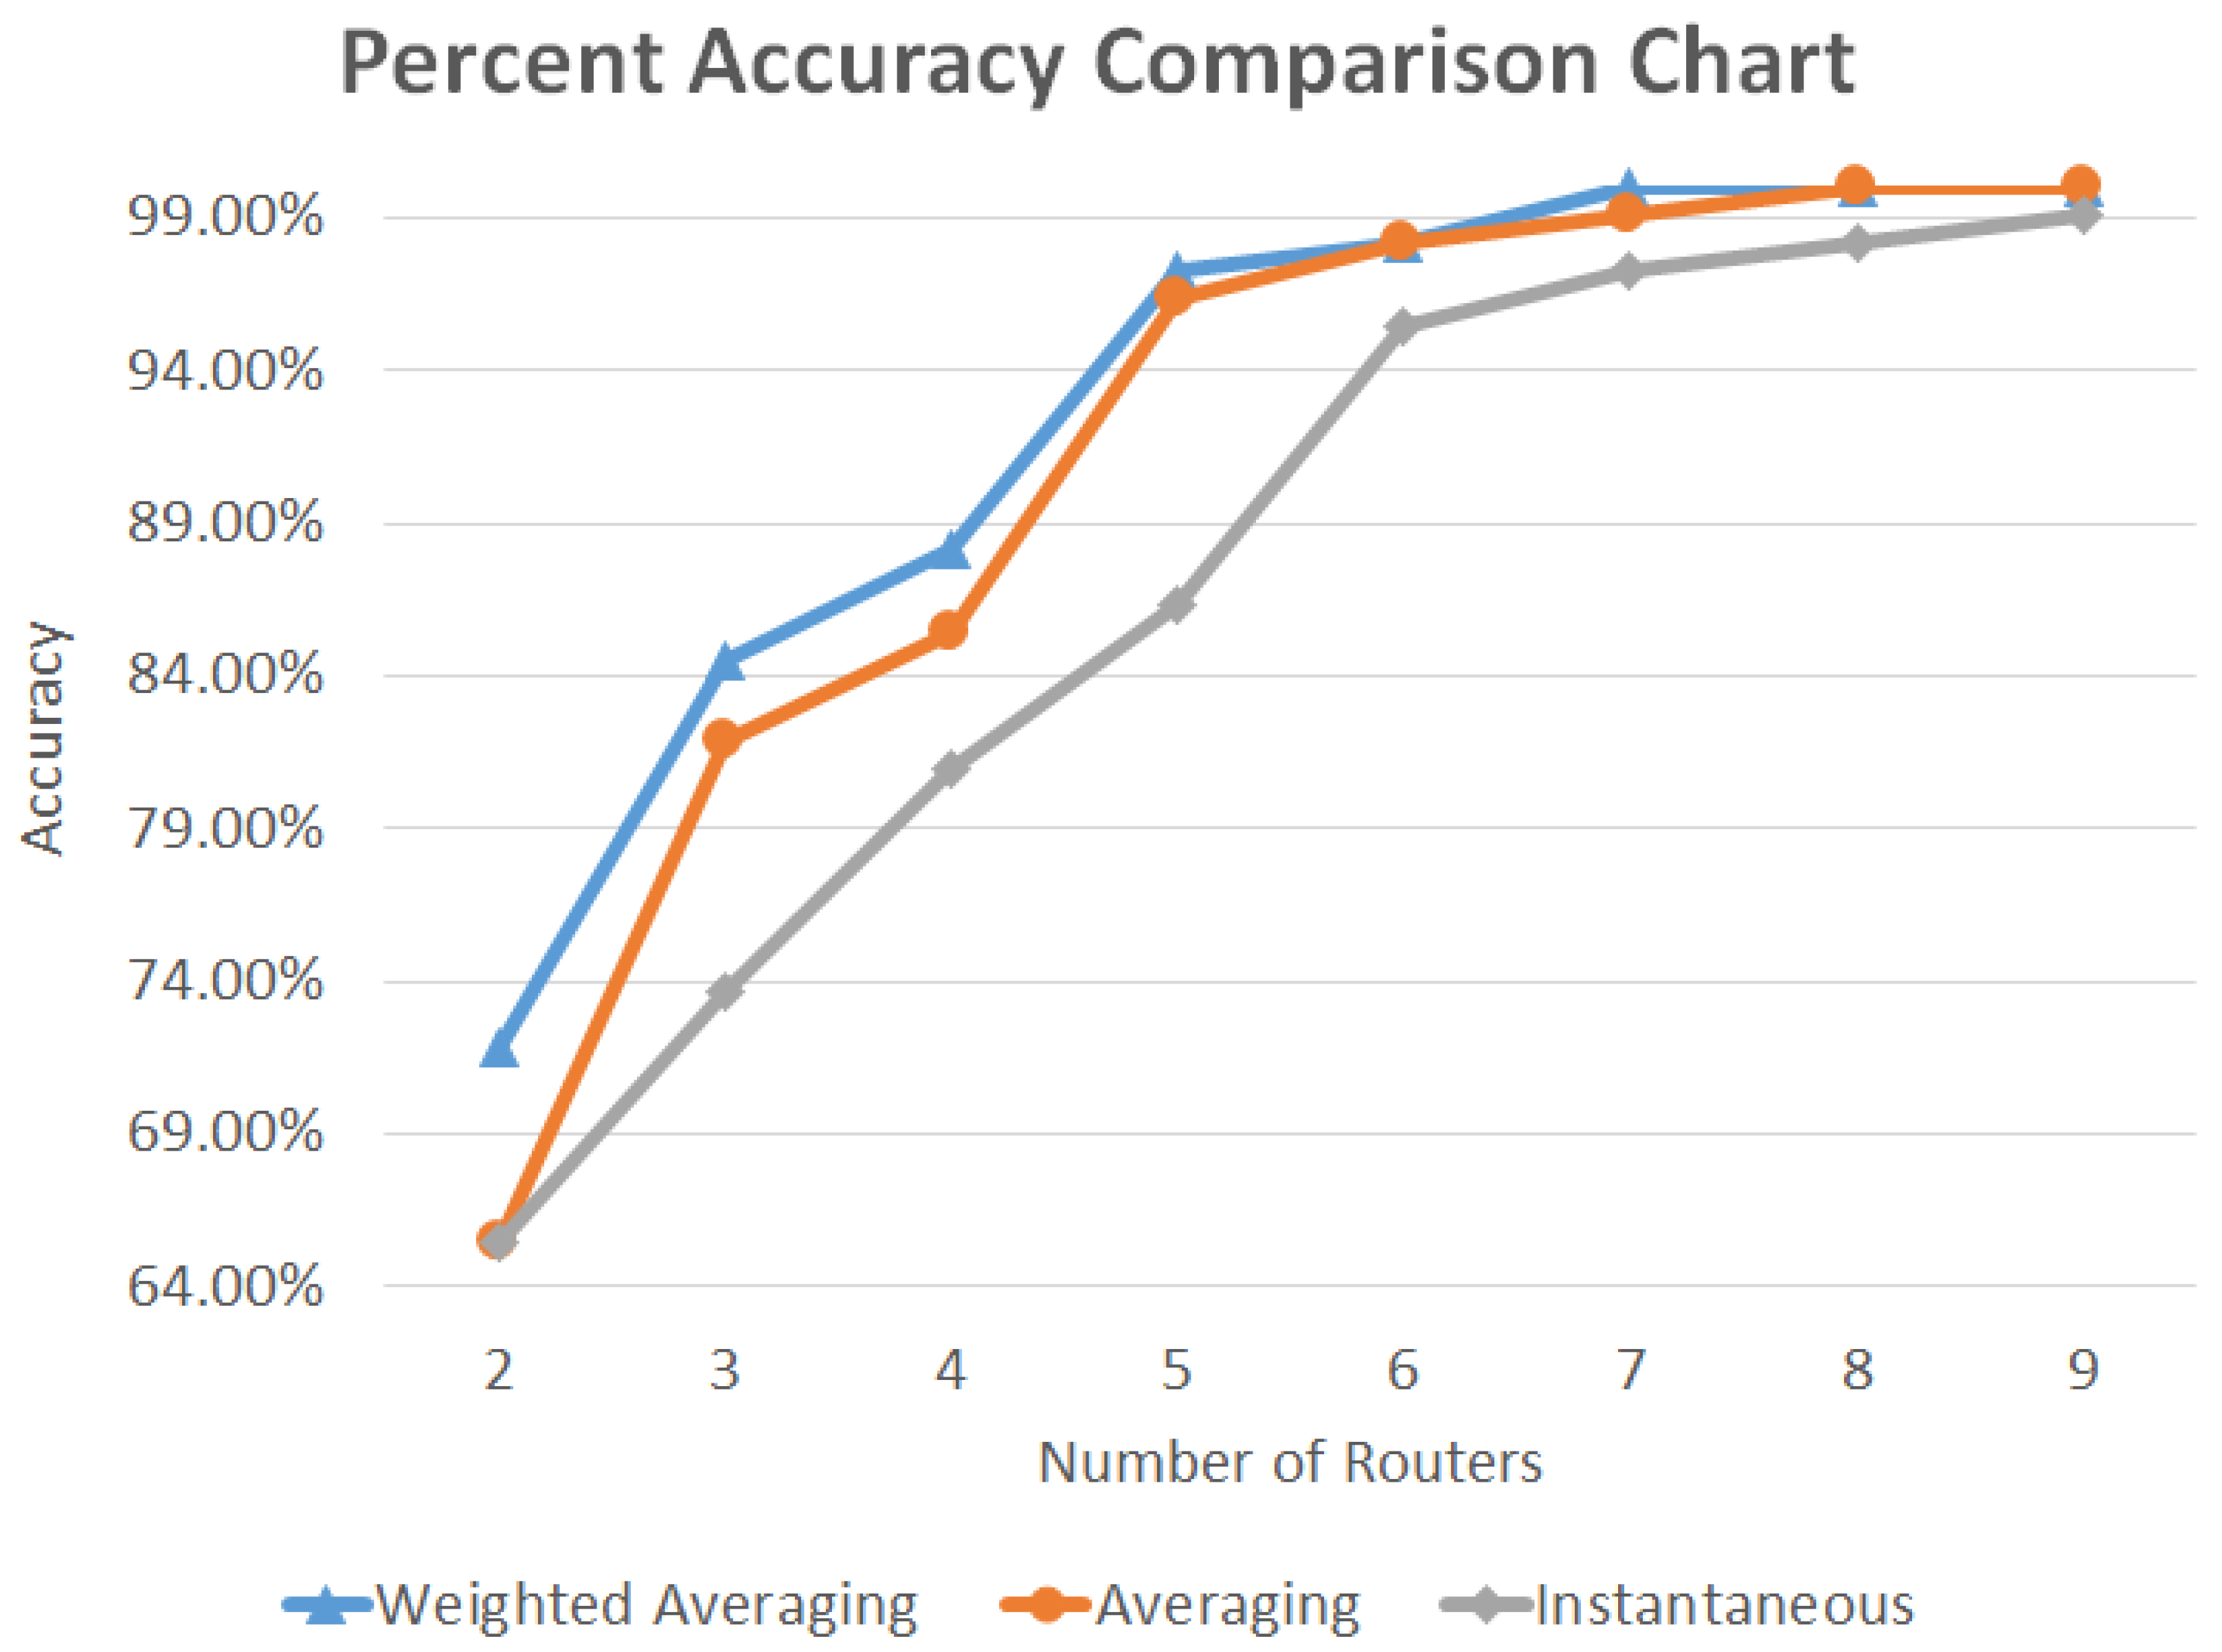
The data presented in
Figure 8 represent a chart of the percent accuracy achieved by the POVD per router deployment scenario. As it shows a generally increasing trend, this implied that, as the number of routers deployed increased, the system’s percent accuracy increased as well. For our three-router setup, the best accuracy attained by the system was 84.55% from
. Meanwhile, using the same method, the five-router setup resulted in significant improvement of 12.72%, yielding a success rate of 97.27%. Furthermore, it can also be observed in this graph that we were able to attain 100% accuracy when we deployed 8 routers while using
, suggesting that, given the parameters of our experiments, the system necessitated 8 routers in order to acquire perfect prediction rates.
It was also consistent in our results that the method was seen to be the most-effective and -efficient because, across all setups, it acquired the lowest MSE and highest percent accuracy values. This was followed by and, lastly, instantaneous comparison.
In summary, we presented an experiential method of obtaining the optimal number of deployed WiFi routers in a given scene. We recognize that the WiFi router deployment in commercial establishments is first designed according to the coverage of its tenants and customers; thus, using WiFi RSSI signals for other purposes is secondary. Our method showed that indoor positioning and localization can be achieved by using the aggregation techniques of RSSI signals.
4.2. Limitations and Future Directives of the Research Study
In our extensive experiential investigations, we showed how to employ WiFi RSSI readings as fingerprints of parking scenarios and to enable parking managers to determine the occupancy rate. However, there are limitations, as listed below, to the setup that we have just investigated. Given these constraints, we provide future studies on how to improve our work:
Ten WiFi routers were deployed because there were only 10 available parking slots. It was assumed that each router, on its own, can be used to identify if a parking slot is available or not. We used this number, i.e., 10, as the limit on the number of allowable WiFi routers to be deployed in a commercial setup. However, it is noticeable that this will be expensive as the number of available parking slots and floors increases. As seen from
Figure 7 and
Figure 8, by using our WiFi RSSI aggregation techniques, we were able to reduce the number of needed WiFi routers to half of the available parking slots to predict the number of unoccupied car slots. Our work supports the claim of RSSI reliability as a difficult parameter to be used in localization while using elementary processing techniques [
31]. In future research, we want to verify our methods and results in areas that simulate the actual commercial locations. In particular, we showed that we only needed approximately half of number of available parking slots when deploying the WiFi routers. We will further explore more sophisticated RSSI data integration including artificial intelligence methods and algorithms to predict parking vacant/occupied slots.
Our work did not establish a scientific process on where and how to optimally deploy the WiFi routers to be used for scenario prediction, especially when the area size changes. Our work relied on a given commercial establishment’s WiFi router deployment and, more often than not, installed such that there is less overlap among their coverage. Our work is differentiated from this WiFi router deployment setup by exploiting coverage overlaps, which can be used to provide a unique fingerprint given the dynamic environment. The changing size of an indoor location for localization and scenario prediction is the topic of our next study. Our future target is to provide a systematic and scalable method of deploying WiFi routers to establish unique car parking fingerprints. We studied the effects in the controlled variation of signal strengths and the placement of obstacles that a create non-line-of-sight and dynamic environment.
We utilized two distinct experimental locations of approximately the same floor area to determine the effects of a dynamic environment during RSSI collection. Thus, different places will exhibit unique and varying behavior, but the collection and prediction processes can be the same for the places under study. Given this finding, our work established an experiential method of how to collect RSSI readings and heuristically determine where to place a WiFi router that can be used to establish a unique fingerprint. Our method simply follows a linear installation of WiFi routers. We plan to collect as many WiFi RSSI readings from various and actual indoor locations, which can be similar or dissimilar. From these collections, an expected research output is the formation of WiFi RSSI reading databases that are accessible to the public.

 ,
, 


