1. Introduction
A product of the digital revolution is the Internet of Things (IoT), a modern technology that connects various devices, for example, smart TVs, printers, cameras, smartphones, and smartwatches, via cyberspace. The IoT introduces new services and apps to numerous users and improves their quality of life. The majority of IoT things and items do not need an extensive capacity. In addition, the total of storage and handing out capacity available in the IoT is limited. As a result, a huge number of sensitive data are stored in clouds. This reduces the costs and effort, while increasing the availability and accessibility of provided services. However, the fact that these IoT apps and services can be accessed “anytime and anywhere,” is a key challenge for the security and privacy of the data stored on these apps and services, in addition to other IoT-related challenges, such as performance and cost, the management of the heterogeneous environment (hardware conflict/data conflict), resource constraints (computational, power, and storage capacity), accessibility, and scalability. There is no standard structure or protocol (transferring, processing, storing, etc.) when one is dealing with a large amount of data (big data). The expansion of the IoT has led to an increase in various challenges [
1]. A number of these concerns frequently manifest as network anomalies, such as a diversion from normal network activity. Nowadays, there are an increasing number of IoT devices, but there are some limitations of the cloud [
2]:
Huge network utilization: because network bandwidth is an unusual resource that will not be able to keep up with the increasing amount of data generated by IoT devices, network usage will rise dramatically.
High energy consumption: as the number of servers in cloud data centers grows, so does power consumption in the data centers, raising the cost of energy consumption.
Large latency: as the number of IoT devices and applications grows, the traditional cloud will be unable to deliver the low latency needed by delay-sensitive or real-time applications, negatively impacting performance levels.
Reliance: Everything today is dependent on a connection to the Internet. We need an Internet connection to access cloud services. Internet outages can lead to dangerous situation where time-sensitive applications are concerned.
Non-essential data storage: Several apps are limited by the computer and storage capacity, severely limiting their ability to store, transmit, and process data. The storage of unnecessary data in the cloud can result in high maintenance costs and inoperative data analytics.
Mobility and restricted control: customers of cloud computing have minimal control over their applications, data, and services, which is a major issue.
Privacy and security concerns: There have been numerous security breaches involving sensitive data in the cloud. Fog computing, on the other hand, improves the security approach by offering a higher level of security and establishing numerous walls. Implementing machine learning in fog computing can improve the network routing performance, as well as provide better insights and solutions.
In cloud computing, fog computing is a defensive strategy against the ever-expanding security threats, principally DDoS attacks [
3]. Fog acts by means of a clarifying layer for the generated traffic and is located between the user and the cloud. In [
4], the authors worked to improve the overall network performance and reduce the traffic transferred to the cloud by offering services toward the network’s edge. Fog computing improves the network’s capability.
1.1. Research Motivation
Several strategies have been developed to reduce the anomalies in IoT networks, such as DDoS. To improve the accuracy of the anomaly detection rate and lower the false positive rate (FPR), some schemes use statistical or machine learning methodologies in anomaly-based IDS to mitigate an attack. Despite the proposed anomaly mitigation techniques, the mitigation of DDoS attacks on IoT networks remains a concern. Because of the similarity between DDoS and a normal network, leading to problems such as a high FPR, low accuracy, and a low detection rate, the majority of anomaly mitigation methods have failed. Furthermore, the limited resources in IoT devices have made the implementation of anomaly mitigation techniques more difficult. Numerous solutions have been presented to mitigate anomalies in IoT networks on the victim side. However, the mitigation of attacks such as DDoS still poses difficulties due to the similarity of the DDoS traffic flow to the normal traffic flow, and the mitigation system in most of the studies addresses the victim side. A perfect DDoS detection system will detect DDoS attack traffic in real time and mitigate the attack as near the source as possible in order to prevent additional network destruction. This leads to two main objectives: high accuracy and early detection. Accuracy refers to a system’s ability to detect DDoS attacks with a high true positive rate and a low FPR, while early detection refers to detecting a DDoS attack as close to the origin of the attack as possible, for example, at the local switch/router nearest to the attack origin. The primary issue with existing DDoS attack detection approaches is their inability to accurately and quickly detect both high- and low-intensity DDoS attacks in large-scale networks because of shortcomings in their performance, expandability, and information exchange abilities. Therefore, it is critical to develop new techniques for the accurate and timely detection of both high- and low-intensity DDoS attacks. In this research, our proposed system is placed at the fog level to monitor the outgoing traffic and detect the attack at an early stage. One important characteristic of our system is the ability to treat the IoT traffic in a different way since we are concerned about the attacks generated by IoT devices.
1.2. Contributions
We have developed an efficient anomaly mitigation system for the IoT network by designing and implementing a DDoS attack detection system relying on a statistical method that combines three algorithms: exponentially weighted moving average (EWMA), the cumulative sum algorithm (CUSUM), and K-nearest neighbors (KNN). The contributions of this study can be considered as critical in the field of IoT devices, where the deployment of anomaly mitigation strategies is challenging because of limited resources. Within the general framework of the suggested approach, several key contributions of this study stand out.
This novel idea of combining the three algorithms in one anomaly-based IDS module to mitigate the DDoS attack in the fog layer in the IoT ensures accurate attack detection.
Anomaly mitigation in the IoT achieves good performance in terms of a high detection rate and accurate classification of the network flow as normal or abnormal.
The system distinguishes between IoT devices and non-IoT devices effectively.
1.3. Organization
The remainder of this paper is organized as follows.
Section 2 presents the related works on IDS and statistical techniques in the IoT environment.
Section 3 presents the methodology used in this paper. It describes the dataset, the methods of feature selection, dataset pre-processing, and the mathematical model. In
Section 4, the approach is evaluated in terms of the experimental details, evaluation metrics, and experimental results and compared with other approaches.
Section 5 provides the conclusion of the research paper and indicates the direction of future work.
2. Related Works
Numerous studies on the intrusion detection system (IDS) of DDoS attacks are presented in [
5]. The authors implement different machine learning (ML) algorithms to analyze their performance in detecting DDoS attacks [
5]. The researchers in [
6] categorize the traffic in the IoT networks. They provide a comprehensive review of current and previous studies on IoT traffic characterization in relation to the IoT apps and their designs [
6]. Several strategies are developed to reduce the anomalies in IoT networks, such as DDoS. To increase the accuracy of the anomaly mitigation system and lower the FPR, some schemes use statistical or machine learning methodologies in the anomaly-based intrusion detection systems (IDS) to mitigate an attack. Despite the proposed irregularity reduction techniques, in IoT traffic, the mitigation of DDoS attacks remains a concern. Because of the similarity between DDoS and normal network flows, leading to problems such as a high FPR, low accuracy, and a low detection rate (DR), the majority of anomaly mitigation methods fail. Furthermore, the limited resources in IoT devices obstruct the implementation of anomaly mitigation techniques. In the literature, we have classified the network anomaly mitigation schemes in the IoT into three parts, as shown in
Figure 1. In this research, we have built our model based on anomaly-based detection techniques using both statistical techniques and machine learning.
In [
7], CUSUM-Entropy is used to examine packet header fields to improve accuracy. By examining these fields, it is possible to distinguish between normal and non-normal traffic, achieving a high DR and a low FPR.
In [
8], the authors use the IDS CUSUM solution. In this study, there is an example in which both DDoS and reflective DDoS successfully detect using the CUSUM algorithm. This is why we have used this algorithm in the solution presented in our thesis.
In [
9], CUSUM Flood is used to detect TCP SYN flooding attacks, which are amongst the most widely known DDoS attacks. A non-parametric implementation, the CUSUM algorithm, is used to accomplish a high DR with a low FPR. This is one of the reasons we have used CUSUM in our research.
In [
10], the authors employ an entropy and hybrid approach to prevent attackers from training models and convincing them that the attack traffic is normal. Various fields from network traffic are observed to achieve the best possible result. However, in [
11], the authors explain why statistical process control is implemented in the IDS, in which principal component analysis is used to solve the issues caused by a large amount of quality characteristics.
In [
12], as per the authors, when it comes to the reliability and security of IoT networks, anomaly detection is the most important component. Due to their lack of security, IoT networks are extremely vulnerable to attacks.
ProfilIoT, the method proposed in [
13], focuses on an individual port by implementing an ML-based technique to classify IoT devices in the network. The objective is to determine whether the traffic stream is associated with any specifically identified IoT device. The proposed method can distinguish IoT devices from non-IoT devices. Similarly, by using a network behavior-based technique, it can identify the model of a device in a network, such as an IP camera or a smart TV. A set of categorizations based on ML algorithms is executed in a multistage procedure using traffic movements generated by a specific device that could be identified by its IP address.
Similarly, in [
14], the authors propose a method for recognizing unidentified IoT devices and distinguishing between IoT and non-IoT devices. In this method, the generated traffic is used to model the behavior of a device. The method employs a deep long short-term memory (LSTM) auto encoder network to display the TCP structures of each device and group the structures based on the Bayesian Hyper Parameter Tuning model. The proposed method appears to have high precision in matching devices to their characterized equivalents.
In the same way, the authors in [
15] create an ML framework for categorizing IoT devices. A characterization procedure is developed based on a variety of traffic structures, including signaling patterns, action cycles, transmission protocols, and cipher suite algorithms. Furthermore, a framework employs a classification based on ML in a multistage situation that accurately identifies IoT gadgets. The proposed technique discusses the trade-offs between the speed, costs, and performance.
Similarly, to recognize new and unknown devices in the network, the research in [
16] executes a mechanized categorization technique that uses the structures of the traffic generated by IoT devices. This technique defines the specifications of various devices by using the rich data transported through IoT network traffic streams. An actual IoT dataset is used to evaluate the effectiveness of the implemented technique. According to the evaluation findings, the implemented technique shows a satisfactory level of performance in identifying devices.
The DeL-IoT in [
17] uses a deep ensembling learning algorithm to detect anomalous IoT activities (DEL). This system is designed to address data heterogeneity and data imbalance issues in the IoT environment, while also predicting anomalous activities. This is accomplished by incorporating software-defined networking into the IoT to handle various network features. The presented system predicts whether the device status is normal or abnormal.
In [
18], the authors examine the various DoS attacks on a network. The prediction depends on the attention to defense concepts against various DoS attacks. The designed model integrates the victim-based DoS defense strategy with the transmission of packets via attack mitigation. The funnel procedures are assessed on the destination node so as to minimize overcrowding at the access link in the node. The suggested model incorporates node collaboration with expenses and latency in the load. The DoS traffic is approximated using the funneling model for incorporating statistical filtering against DDoS attacks.
In [
19], the authors focus on IoT NIDS implemented by using ML because learning algorithms have a high rate of success in terms of confidentiality and security. The research study thoroughly examines NIDSs implementing various characteristics of learning methods for the IoT.
In [
20], the authors use a multilayer perceptron (MLP) model to present a lightweight IDS depending on a vector space representation. They compare the proposed IDS to the Australian Defense Force Academy Linux Dataset (ADFA-LD) and the Australian Defense Force Academy Windows Dataset (ADFA-WD), which are newly developed systems that identify datasets containing vulnerabilities and address attacks on diverse products. The simulation demonstrates this by employing a single hidden layer and a limited number of nodes.
In [
21], the applications of ML algorithms in IoT security are examined by evaluating numerous studies that have used various techniques to solve a number of issues affecting the security of the IoT environment. This study emphasizes the scope of the IoT and the opportunities for its use. The authors then concentrate on the specific cases in which ML might bolster IoT security, such as the use of malware and intrusion detection and the recognition of unidentified IoT devices.
A statistical solution is used in [
22]. In this study, CUSUM and EWMA are tested using the same dataset, and EWMA outperforms CUSUM, as expected, because EWMA gives additional weight to more recent data. The most significant aspect for us is the fact that both algorithms produce favorable results and successfully detect and mitigate attacks, which is one of the reasons we chose them for our paper.
In this work, we have used a combination of three algorithms (CUSUM, EWMA, and KNN). We have achieved a high accuracy, or 99.00%, with a low false positive rate (FPR).
All the previous works mentioned above were classified into three types: machine learning, knowledge-based systems, and statistics. The approach presented in this research is one type of integration for all of them. This approach has overcome the limitations of the previous studies by its ability to implement a mitigation system that can detect the attack with high accuracy and a low FPR, in addition, to its ability to distinguish between IoT and non-IoT devices.
3. Methodology
3.1. Dataset Description
The Bot-IoT dataset was established at the University of New South Wales (UNSW) in Australia [
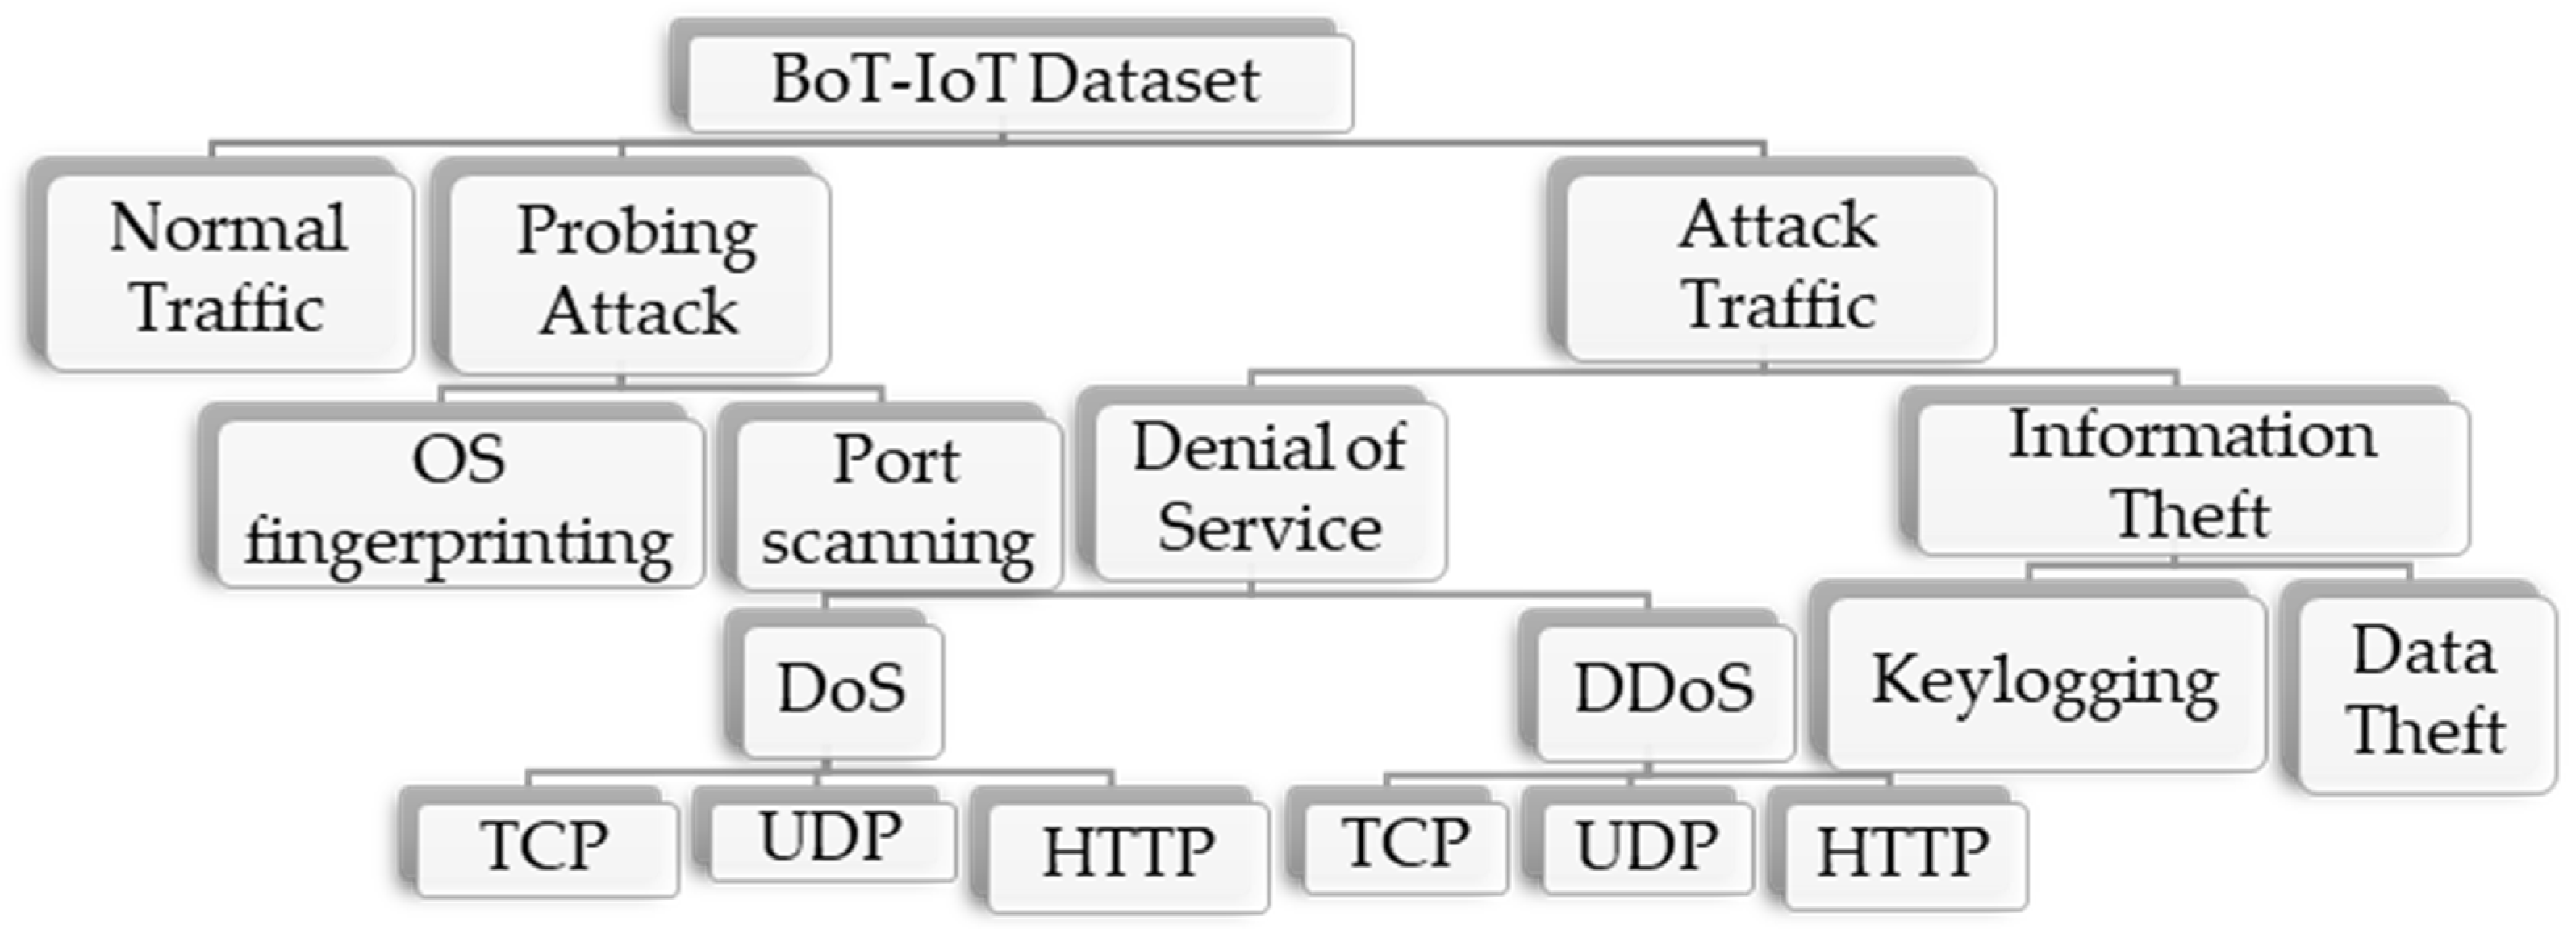
23]. This dataset includes both legitimate and simulated IoT traffic, as well as various types of attacks. The Bot-IoT dataset is classified into three main sub-categories, as shown in
Figure 2. The dataset accurately depicts the traffic flow features of the situation in which the framework would be deployed. This dataset will be used for the experiments. For our experiment, we use the Bot-IoT dataset because:
Compared with other datasets, it is the most recent and advanced dataset with simulated IoT services.
It contains a variety of common IoT attack samples with significant data features.
It contains modern networking features.
3.2. Methods of Feature Selection
Feature selection is a machine learning (ML) technique for reducing the number of input characteristics to increase the design model performance, while reducing memory and CPU processing costs. This method can also be used to simplify the design models so that they are simpler to understand and evaluate the level of the chosen characteristic. Therefore, we use two techniques for selecting features such as entropy, correlation coefficient, synthetic minority over-sampling technique (SMOTE), and SHAPley Additive exPlanations (SHAP), described as follows:
To analyze the correlation between features, we compute a correlation matrix. In
Figure 3, a heatmap is plotted to view the determined connection values between various elements. This map displays the degree to which both elements are directly connected. The correlation coefficient can have values ranging from −1 to 1. A value of nothing or near zero shows that no relationship exists between two elements. A value of 1 or near –1 demonstrates that the two elements are profoundly correlated.
The plot in
Figure 4 shows that the most important feature is N_IN_Conn_P_SrcIP (the number of incoming associations per source IP), and there is a big difference between this feature and the other important ones based on the F1 score. The feature mean has the lowest importance; therefore, we eliminate it before building our models. This graph helps us to choose parameters that will be used to train the models.
3.3. Dataset Pre-Processing
Before evaluating the performance of any categorization algorithm, dataset pre-processing is essential, particularly for ML-based mitigation schemes, to improve categorization accuracy and avoid misleading results.
Figure 5 depicts the pre-processing steps we used on the datasets, including data cleaning, data transformation, feature selection, and class distribution balancing. We used 5% of the dataset. It includes the top ten features for training and testing datasets. This dataset has 19 columns, with target columns of classification and sub-category as the objective sections, and over 2.9 million rows [
23].
3.4. Categorization Using ML Models
In this research we have trained nine ML models: logistic regression (LR), support victor machine (SVM), XGBoost, random forest (RF), naive bayes (NB), decision tree (DT), K-nearest neighbors (KNN), exponentially weighted moving average (EWMA), and the cumulative sum algorithm (CUSUM). The result shows that KNN provided the best average score for all the parameters. In our proposed solution, we have combined three algorithms: KNN, EWMA, and CUSUM.
3.5. Mathematical Model
A mathematical model can be used to estimate the system’s quantitative behavior. The quantitative conclusions from statistical pattern can be simply contrasted with experimental data to determine the model’s strengths and limitations [
27]. As a result, in this part, a statistical pattern for detecting DDoS attacks is proposed. The most important qualities for determining attacks are accuracy and the false positive rate [
28]. In our proposed solution, we have achieved a high accuracy and a low FPR by combining three algorithms (KNN, EWMA, and CUSUM), rather than implementing each algorithm individually. In the next section, the paper explains each of these algorithms in detail.
3.5.1. Cumulative Sum (CUSUM) Algorithm
This algorithm has the ability to detect changes. CUSUM is modernized on a regular basis, which is useful for this implementation solution since network traffic typically contains a large number of packages that are continually modifying throughout their period cycle. It is a quality control algorithm that is enhanced for monitoring any variation from a predefined value and for detecting tiny mean changes. CUSUM calculates the total number of variances among both the actual and expected principles, which is the CUSUM value. CUSUM is extremely adaptable and is currently implemented in several applications. It can even be bestowed with an independent learning ability, allowing it to mitigate and detect variations in network traffic [
29]. This algorithm is the average of the variation in a signal
μ, which is a real-time rate updated on a regular basis. Furthermore, if
is the
i-th CUSUM,
is the
n-th monitoring, and
μ is the real-time average of the procedure, the CUSUM
can be determined as shown in Equation (1):
3.5.2. Exponentially Weighted Moving Average (EWMA)
EWMA uses exponentially decreasing weighting elements. The previous data are much less valuable than the current data, but they are still considered [
30]. This feature is important since an attack can occur, and then be immediately stopped, making the current data additionally crucial. A continuous smoothing component b, a value between 0 and 1, is used to describe the degree of weighing reduction. The value of b can alternatively be stated as a percentage. EWMA is calculated using Equation (2):
where
μn is the average of the procedure assessed in reality in the
n-th monitoring and the
β is the EWMA component.
3.5.3. K-Nearest Neighbors (KNN)
The KNN approach is a simple method used for both regression and classification. It is a non-parametric method, which is advantageous since in real-world settings, whenever it comes to attacking data, there will often be no regulations. Dependent upon K number of training examples, this method classifies or predicts [
31], for example, by relating other entered data to the data of a similar class as the nearest number of K examples for a given value of K. There are numerous techniques for calculating distance to the nearest instances. However, the greatest common factor is called the Euclidean distance, which is determined as shown in Equation (3):
where
is the
i-th monitoring and
is the
i-th observation.
Table 1 compares the three algorithms (KNN, EWMA, and CUSUM).
Algorithm 1 shows that our proposed solution has the advantage of having its own backup system, where, if one of the three algorithms fails to identify malicious traffic, the two other algorithms will succeed. For the same two values, the results of three algorithms, EWMA, CUSUM, and KNN, remain associated. The potential outcomes are 0 (an attack is taking place) and 1 (no attack is taking place). Initially, the results of EWMA and CUSUM are compared and if they are equal, the result of CUSUM is considered to be the final result, but if they differ, an additional differentiation among CUSUM and KNN is performed, yielding a final output. If the result of KNN matches that of CUSUM, we take the CUSUM principle as the output. Otherwise, we take EWMA or KNN as the output because EWMA and KNN hold equal principles (that is, the conflicting of the CUSUM principle), which is what we need in this paper. Then, we can decide whether or not to raise an alarm.
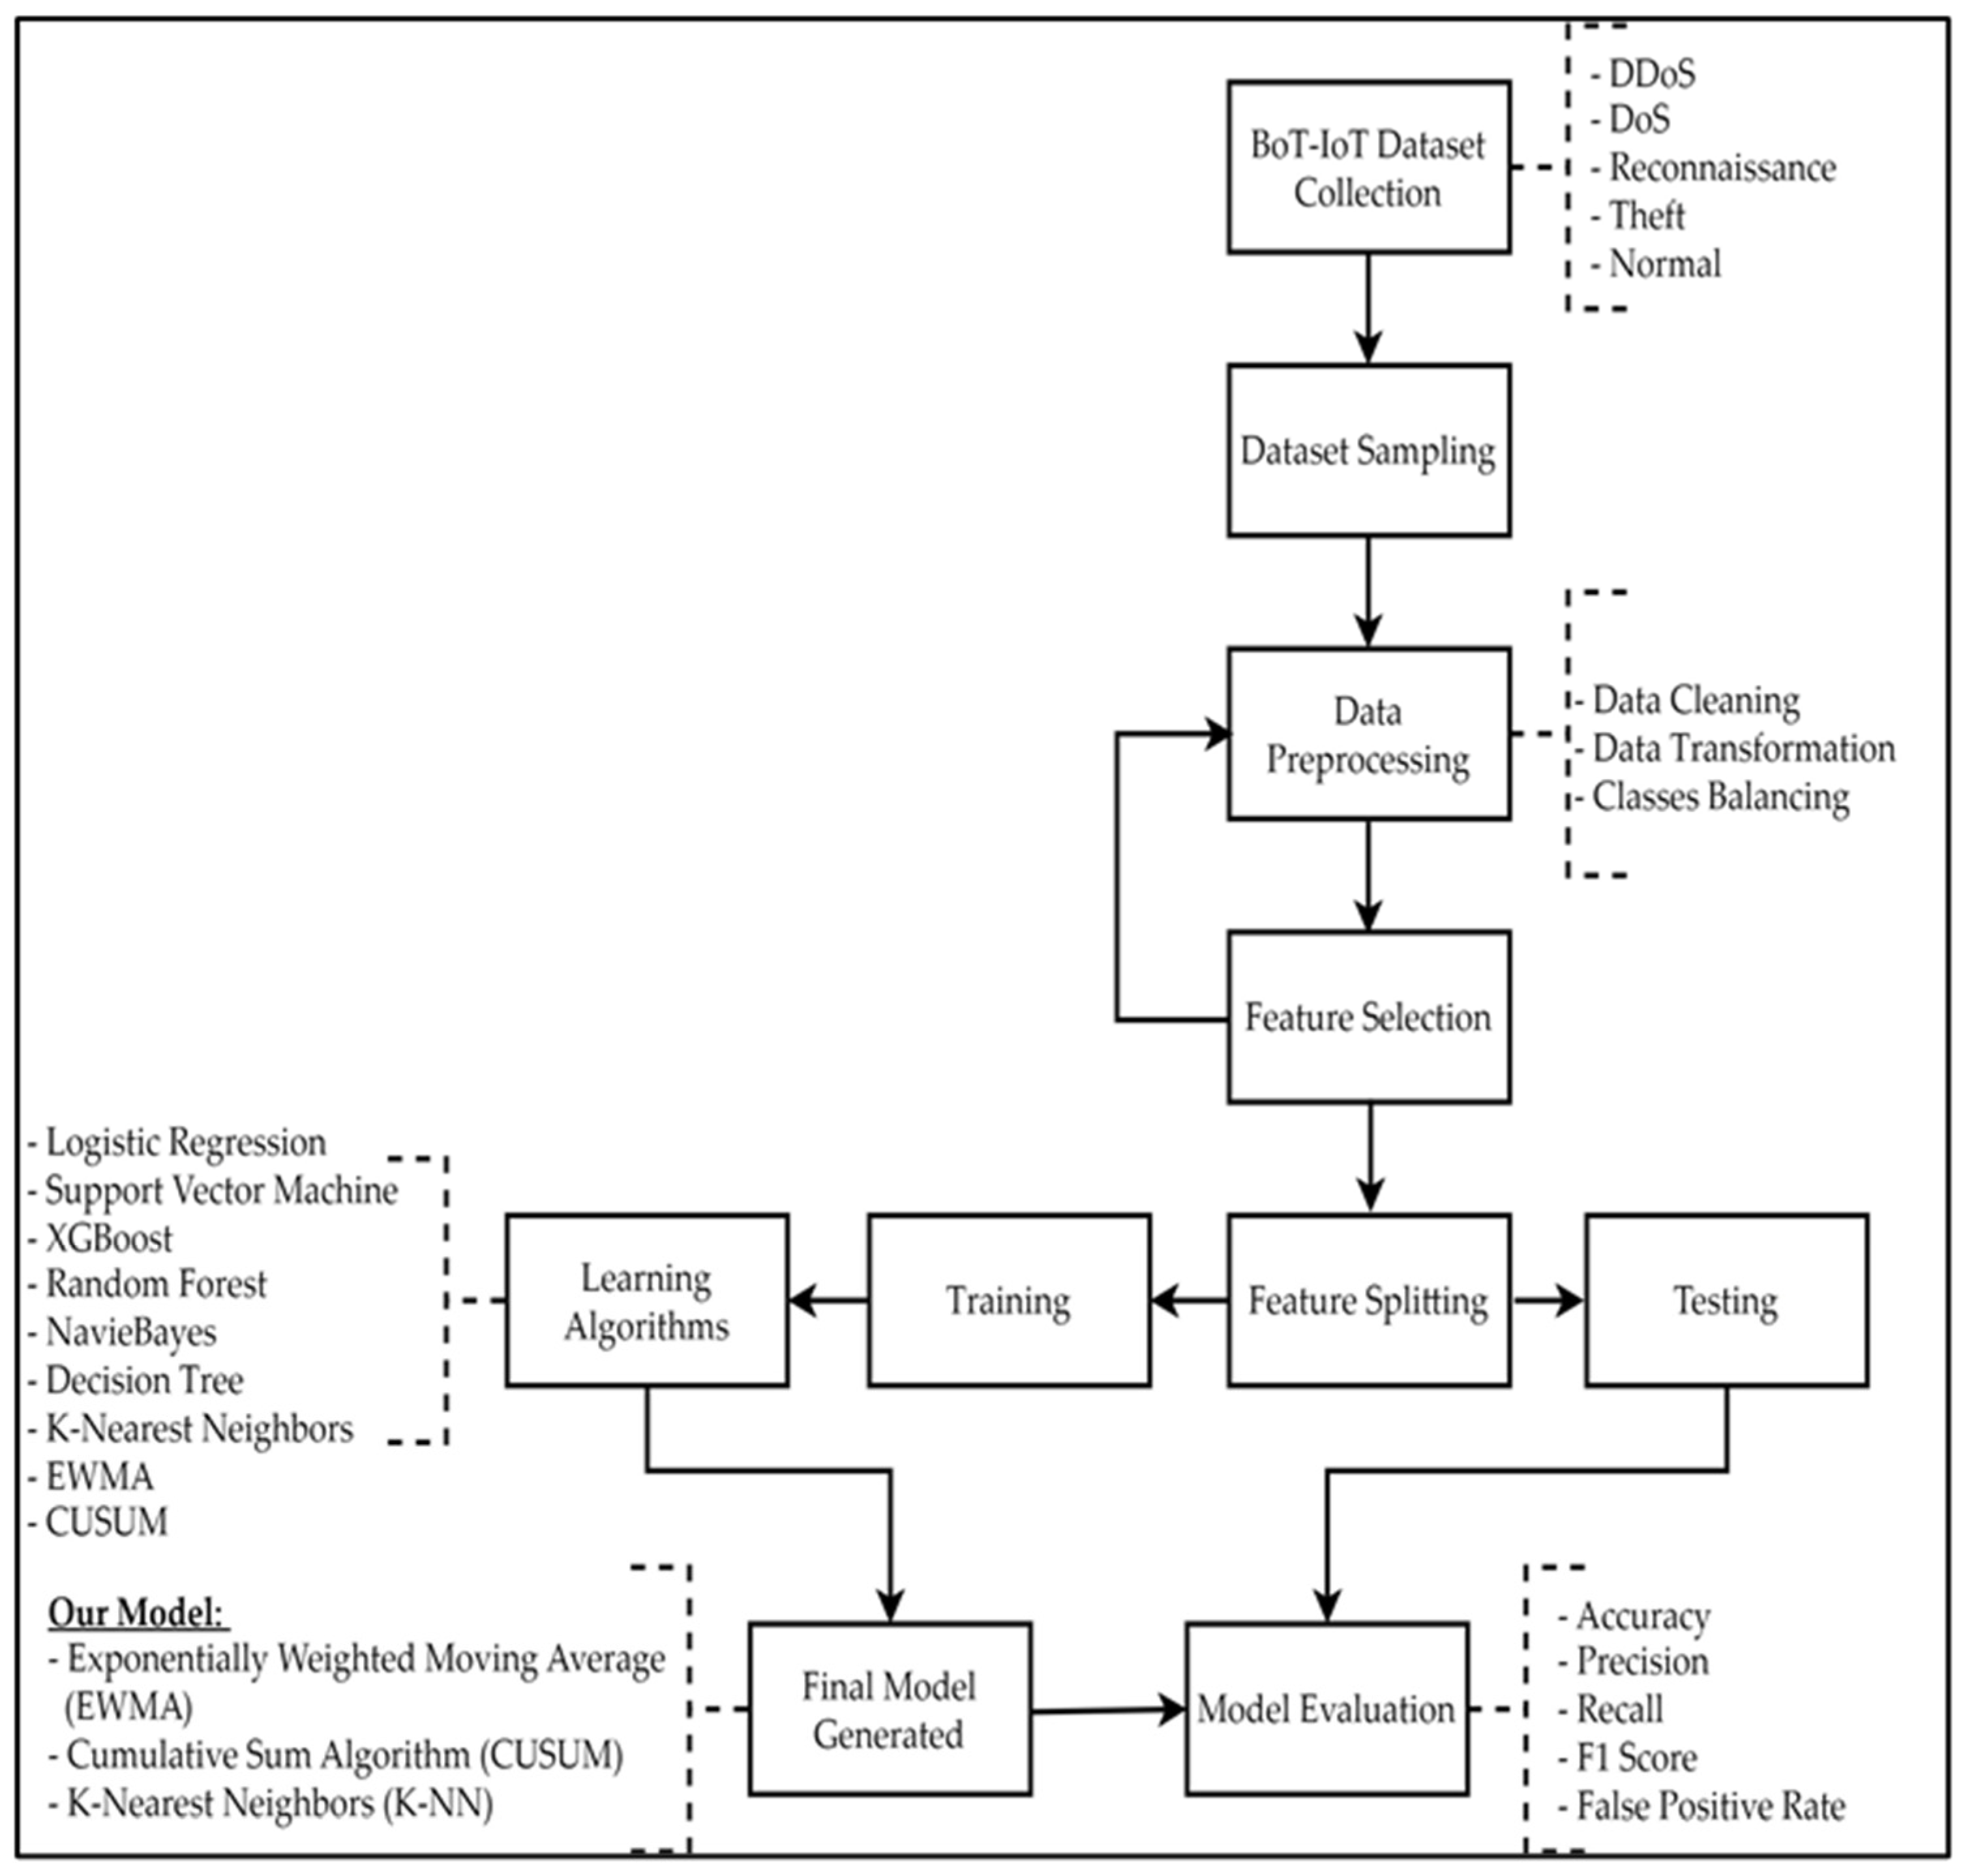
Figure 6 presents the complete attack and anomaly detection procedure. After the dataset is loaded and the type of attack identified, the dataset passes through different data pre-processing steps. Then, the dataset splits into training and testing data. The different ML algorithms are applied to measure and evaluate the model against multiple measurements. A final model is generated using the novel multialgorithm implemented in this research, and the measurements are compared.
| Algorithm 1: Proposed Algorithm Advantages of Backup |
1: Input: CUSUM, EWMA, KNN
2: Output: Output
3: Run Log–CUSUM (Output-CUSUM)
4: Run Log–EWMA (Output-EWMA)
5: Run Log–KNN (Output-KNN)
6: If Output–CUSUM = Output–EWMA then
7: Output = Output-CUSUM;
8: else
9: If Output–CUSUM = Output–KNN then
10: Output = Output-CUSUM;
11: else
12: Output = Output-EWMA; |
3.6. The Proposed Framework
Figure 7 presents the framework solution proposed in this paper. By characterizing and profiling network traffic traces, we sort the incoming traffic to isolate the IoT device from the non-IoT device. This designed system is able to distinguish between the traffic generated by IoT gadgets and the traffic generated by non-IoT gadgets. The IoT traffic is forwarded to detection engine 1, and the non-IoT traffic is forwarded to detection engine 2. Then, we categorize the traffic into normal, suspicious, and confirmed attack traffic. Our proposed framework monitors the process over time and signals an alarm if it detects abnormal behavior. The normal traffic is forwarded to the Internet, the suspicious traffic is investigated by a second checkpoint to determine whether or not it is an attack, and the confirmed attack traffic is dropped, and the source of this traffic is blacklisted. This research focuses on TCP SYN flood.
The model in
Figure 8 identifies the traffic and distinguishes between IoT devices and non-IoT devices. We upload the dataset [
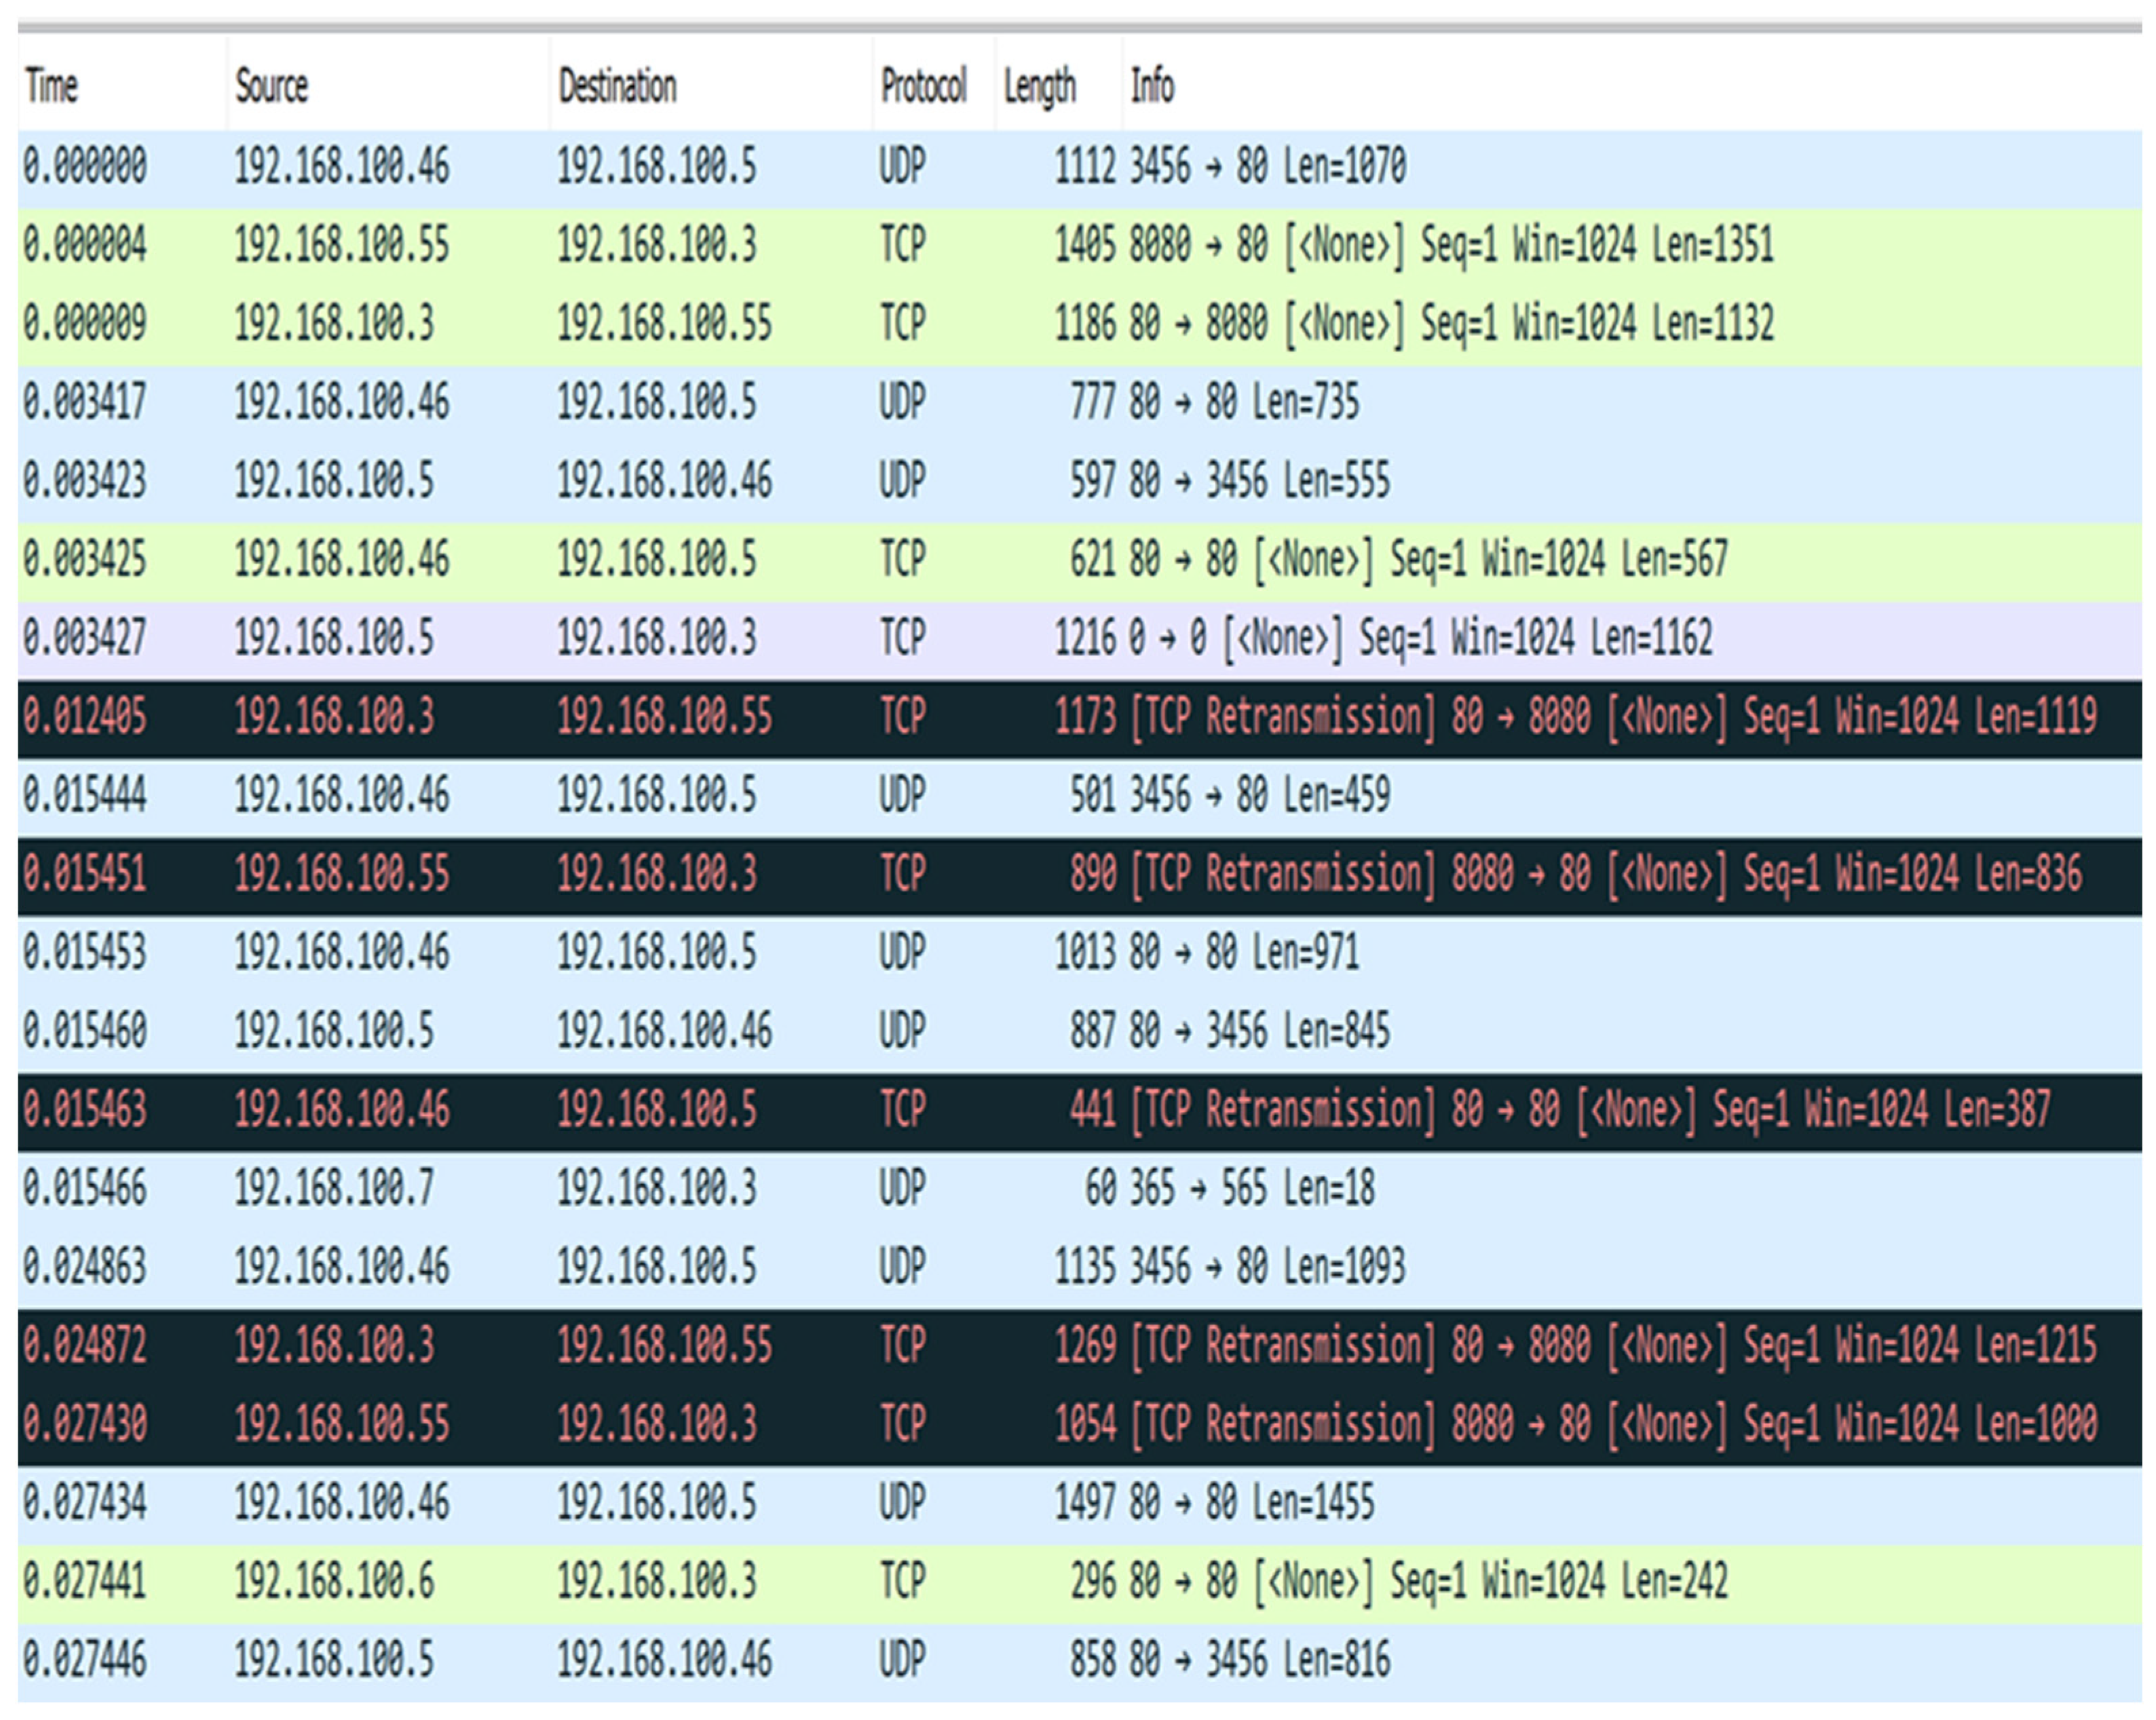
23] in CSV file format. The network traffic data are 8 GB in size, sufficient for reasonable results. The network has 20 connected devices, including both IoT and non-IoT devices. We use the Wireshark tool to show the network traffic traces and capture the network traffic packets, as shown in
Figure 9. The flow features are organized as tuples that include time, packet size, protocol, source MAC, destination MAC, destination port source IP, source port, destination IP, and information approved through packets, which are all factors to be considered.
After the entire device traffic has been divided, local and web traffic packets must be differentiated. On the basis of the packet protocol, Python is used to separate the Domain Name Server (DNS) packets from individual gadgets in the web traffic. Then, the DNS packets between dissimilar domains and comparable (repeated) domain packets are checked and counted. When the IoT DNS packets have been examined in detail, we discovered that a large number of packets have the same destination domain and a similar packet size and query. We also discovered that a few devices transmit comparable packets in a normal period on a similar domain, indicating that IoT gadgets transmit restricted DNS packets to a limited domain.
In the research, each device is individually iteratively inspected, and the dataset shows that IoT devices transmit DNS requests to an extreme of 10 diverse domains. Therefore, we establish a DNS count threshold of 10. In contrast, the script calculates the number of frequent packets of device traffic through checking packet destination port, IP, and protocol size. When these characteristics have similar principles, it indicates that this gadget sends out frequent or comparable packets. When the gadget comprises at least 25% of the frequent packets, it is likely that this is an IoT gadget. This principle is obtained through an iterative method of inspecting the traffic of various devices. We conclude that a minimum of 25% of the IoT device packets must be repeated. We discover DNS query designs that are obviously distinct from non-IoT devices. The traffic patterns of some devices are consistent, indicating that as soon as a user uses a gadget, it produces the equivalent action sequence, which provides an expectable outcome. The research findings help the network administrators to better distinguish between IoT and non-IoT devices, allowing them to create higher quality network policies in terms of security, routing, and resource distribution.
This part introduces the proposed framework, discusses a use case for the fog computing framework in the context of anomaly mitigation, and provides a brief overview of the components of the framework. A framework based on the fog computing paradigm is presented to detect and mitigate anomalies, for instance, botnet attacks in the IoT network, as seen in
Figure 10. The fog computing paradigm is used in IoT networks to compensate for a shortage of resources [
32]. It relieves resource-constrained IoT devices of the load of mathematical overhead and additional relevant functioning needs in the mitigation of an anomaly. The framework uses an anomaly-based IDS module that uses blacklisted IP addresses stored in a database and an algorithm classifier that we have implemented in our solution. This allows the detecting module to take advantage of their strengths. The anomaly-based approach detects and mitigates attacks with reasonable accuracy. This framework guarantees a secure IoT network.
In the proposed framework, in
Figure 10,
x represents the network traffic flow,
d represents the known attacks (from the blacklisted IP addresses),
N represents the normal traffic stream, and
A represents the irregular traffic stream. First, the network flow
x passes through the anomaly-based IDS module. The IP address of the traffic flow
x is checked in contrast to
d in the module’s database. If
x ∈
d is true,
x is blocked/dropped and an alarm is raised for the manager admin. If not, the stream is redirected to the second check point. The anomaly-based detection module classifies the network traffic flow
x as
N or
A. The module blocks/drops
x if it is categorized as
A. After that, an alarm is raised and forwarded to the manager admin. Lastly, the IP address of
A is changed in the database of the anomaly-based detection module. The
x, on the other hand, is allowed to pass.
The proposed fog framework in
Figure 11 can be used to create a fog node on a dedicated system to efficiently implement security solutions such as the anomaly mitigation system IDS to protect the IoT node or system, ensuring that malicious users cannot use the IoT nodes as a botnet part to carry out DDoS attacks.
The traffic classification step is performed using Algorithm 2, which works well in distinguishing between traffic types.
| Algorithm 2: Proposed Anomaly Mitigation Algorithm |
1: Input: Traffic flow
2: Output: Attack detected
3: Step1: Set
4: T ← Traffic flow
5: Tip ← Traffic Source IP
6: T f ← Traffic Features
7: BL ← Blacklist
8: Step2: Blacklist look-up
9: Get Tip
10: if Tip ∈ BL then
11: Block/drop Traffic flow
12: Send alert
13: else
14: Go to Step3
15: Step3: Classification
16: Start classification model (CUSUM)
17: Input: T f
18: Output: Normal or Suspicious or Attack
19: if T = Attack then
20: Block/drop Traffic flow
21: Send alert
22: Update database
23: else if T = Normal then
24: Allow Traffic flow
25: else T = Suspicious then
26: Allow Traffic to pass to Second Check Point
27: if T = Suspicious then
28: Block/drop Traffic flow
29: Update database
30: else
31: Allow Traffic flow
32: end |
In summary, the methodology used in this study consists of the following steps: First, the dataset used in this study is described. Then, the features selected for implementation are identified. After that, the dataset pre-processing steps are followed. Then, different ML model algorithms are implemented. After that, a mathematical model is presented to describe the three algorithms used in the proposed solution. Then, the framework used for the proposed solution is provided. After that, a model to distinguish between IoT and non-IoT devices is presented. Finally, a framework based on the fog computing paradigm is presented to detect and mitigate anomalies.
4. Evaluation Approach
4.1. Experimental Details
This part describes the research experimental environment design, the evaluation metrics, and the performance examination for the proposed method. For this evaluation experiment, we use the Jupyter Notebook with the Python-based Scikit-learn ML libraries on a Windows 10 operating system with 16 GB of RAM and an Intel® Core ™ i7-8650U CPU at 2.11 GHz. Our model requires Matplotlib, Scipy, Pandas, Detecta, and Scikit-learn. We will assess the proposed categorization algorithms from two aspects:
Pre-processing stages.
Traffic categorization.
The proposed framework is executed using the Python programming language. The obtained dataset is used as the source of data for the proposed framework. To evaluate the anomaly-based module, the obtained dataset is reproduced as two duplicates and will involve many data pre-processing procedures, including data transformation (encoding) and feature selection (correlation coefficient and entropy techniques, the synthetic minority over-sampling technique (SMOTE), and SHAPley Additive exPlanations (SHAP)) [
14]. In each iteration of testing sets, a random seed [
28] will be used for the Stratified K Fold purpose to create distinguishable datasets for training and testing, while preserving the equivalent proportion of the aim labels in the training and testing sets to ensure accurate results for all the classes when we are evaluating our model. K-fold cross validation will be employed with k = 10. The 10-fold cross-validation randomly splits the dataset into 10 parts. In every examination, one part of the split dataset will be used as a test set, while the remaining nine parts will be used as a training set.
4.2. The Requirement of the Experiment
Python: It is an open-source, high-level, general-purpose programming language. It has been the preferred programming language for the majority of data scientists due to its code readability philosophy, efficient code, easy communication features, and ease of learning. Python has vibrant scientific libraries, as well as a variety of fantastic environments, such as Spyder and Jupyter Notebook. Python Matplotlib is a powerful 2D graphic library that aids machine learning scientists in graph plotting. Because of these advantages, we chose Python languages for our machine learning experiment.
Scikit-Learn: It is a public and open-source ML library for Python. It is a quick and easy tool for data mining and analysis. Scikit-learn contains implementations of various supervised and unsupervised learning algorithms. This package includes features for model selection, dimensionality reduction, and data pre-processing, in addition to classification, regression, and clustering algorithms.
SciPy: SciPy stands for Scientific Python and is a technical calculation library that uses NumPy underneath. It is an open source library, so we can use it freely. Optimization, linear algebra, integration, interpolation, and special functions are all modules in SciPy.
Matplotlib: It is a plotting library for Python, as well as its numeral math extension, NumPy. It offers an object-oriented API for incorporating plots into apps that use general-purpose GUI toolkits.
Pandas: It is an analysis software library written for Python and data manipulation. It offers operation and data structures for manipulating numeral tables and time series.
Detecta: It is Python module to detect proceedings in data. In our implementation, detecta_cusum is used to detect unexpected changes in data using CUSUM.
4.3. The Evaluation Metrics
There are five performance metrics widely used in the literature: accuracy, recall, precision, F1 score, and the FPR [
33,
34]. This research will use these metrics to evaluate the proposed anomaly mitigation scheme. This section presents the methods used to examine the research model.
Recall: It is also known as the true positive rate (TPR) or DR. It is the percentage of malicious vectors that have been correctly classified out of the overall number of malicious vectors. Equation (5) is used to calculate recall.
Precision: It is also known as the false negative rate (FNR). It describes the proportion of incorrectly classified attacks in comparison to the overall number of attack examples. Precision can be calculated using Equation (6).
F1
Score: It is the calculated weighted average of both the DR and the FNR. The F1 score can be calculated using Equation (7).
False Positive Rate (FPR): It is the proportion of detections incorrectly classified as attacks to the overall number of detections. Equation (8) is used to calculate the
FPR.
Here, we describe the equation of the evaluation metrics: TP is the number of attack samples that are categorized properly, TN is the number of normal samples that are categorized properly, FP is the number of attack samples that are categorized inaccurately, and FN is the number of normal examples that are categorized inaccurately. TPR or recall is the number of attack samples that are correctly categorized among the overall attack examples, TNR is the number of normal samples that are correctly categorized among the overall normal examples, FPR is the number of attack examples that are inaccurately categorized among the overall normal examples, and FNR is the number of normal examples that are inaccurately categorized among the overall attack examples. Accuracy is the overall number of categorized samples divided by the overall number of samples saved in the dataset. Precision is the proportion of correctly categorized samples among the overall number of correct samples.
4.4. The Experimental Results
The goals of the proposed solution were to detect an attack in an early stage and inform the user and decrease the false positive rate (FPR). To achieve these goals, we combined three algorithms: exponentially weighted moving average (EWMA), K-nearest neighbors (KNN), and the cumulative sum algorithm (CUSUM).
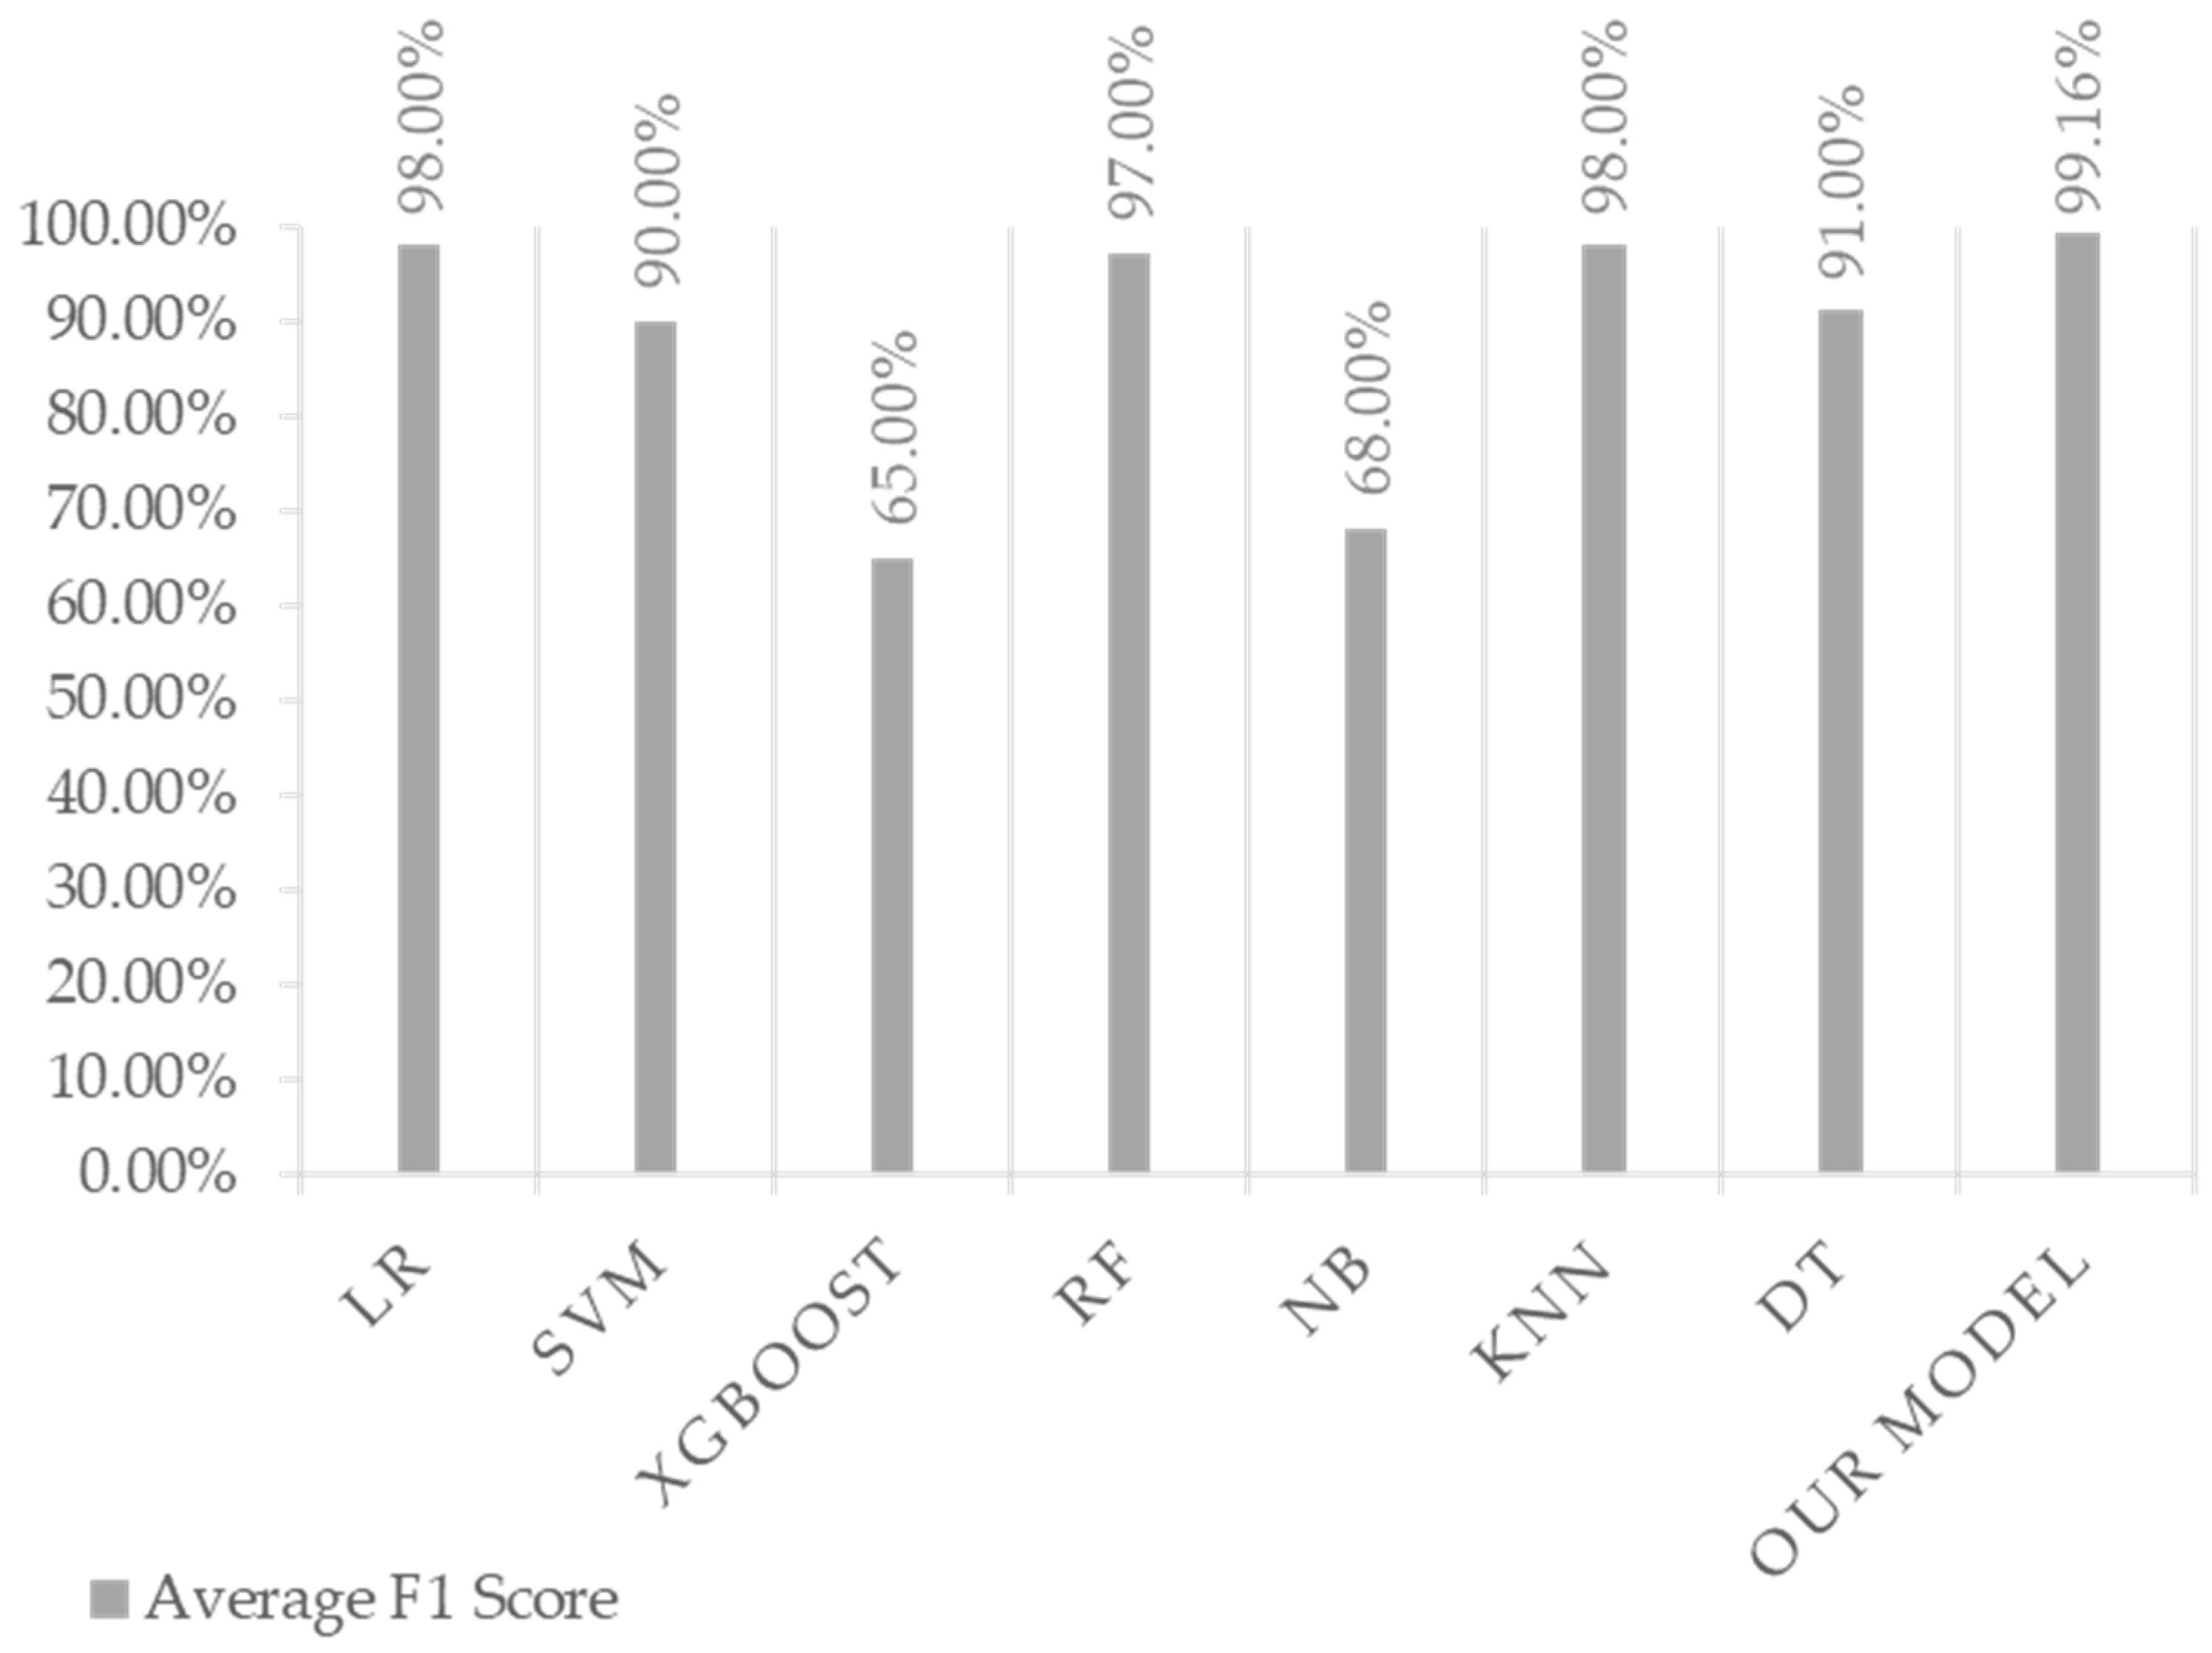
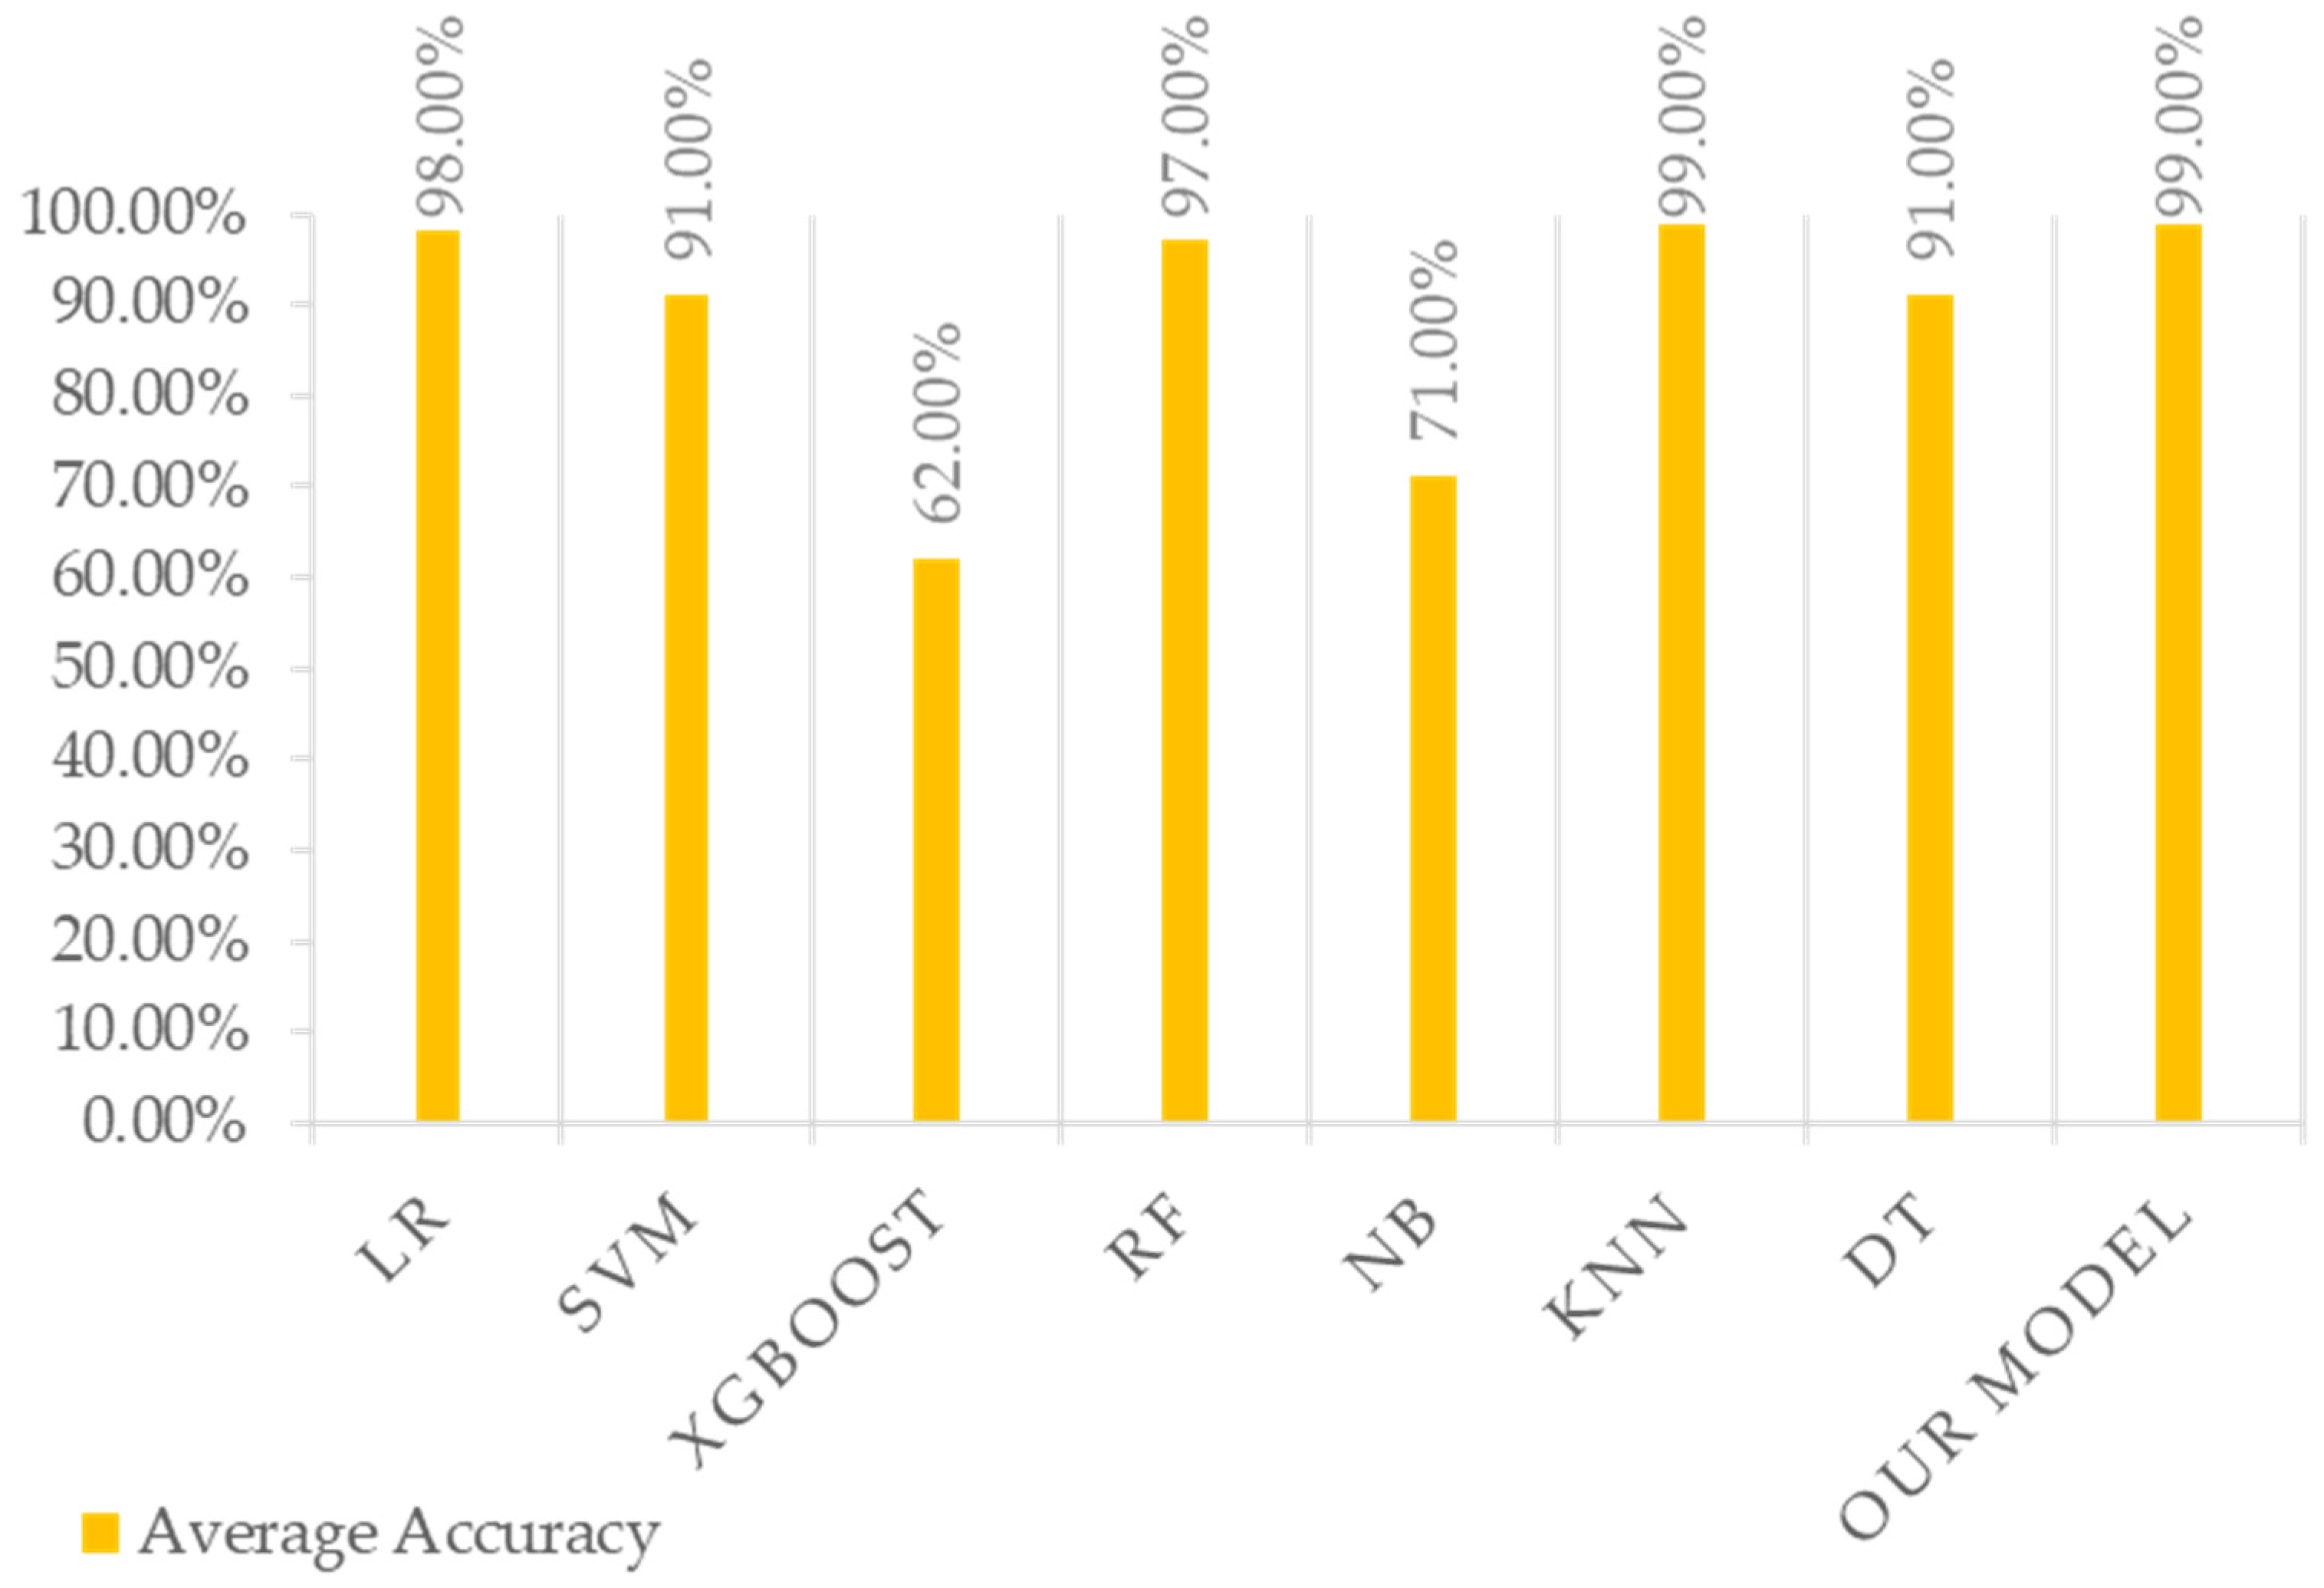
Figure 12 presents our calculation of the accuracy, recall, precision, and F1 score of our model compared with those of other algorithms.
In
Appendix A, we present our calculation of the precision, recall, F1 score and accuracy of our model compared with those of other algorithms.
Figure A1 presents a comparison of the precision of our model with different algorithms.
Figure A2 presents a comparison of the recall of our model with different algorithms.
Figure A3 presents a comparison of the F1 score of our model with different algorithms.
Figure A4 presents a comparison of the accuracy of our model with different algorithms.
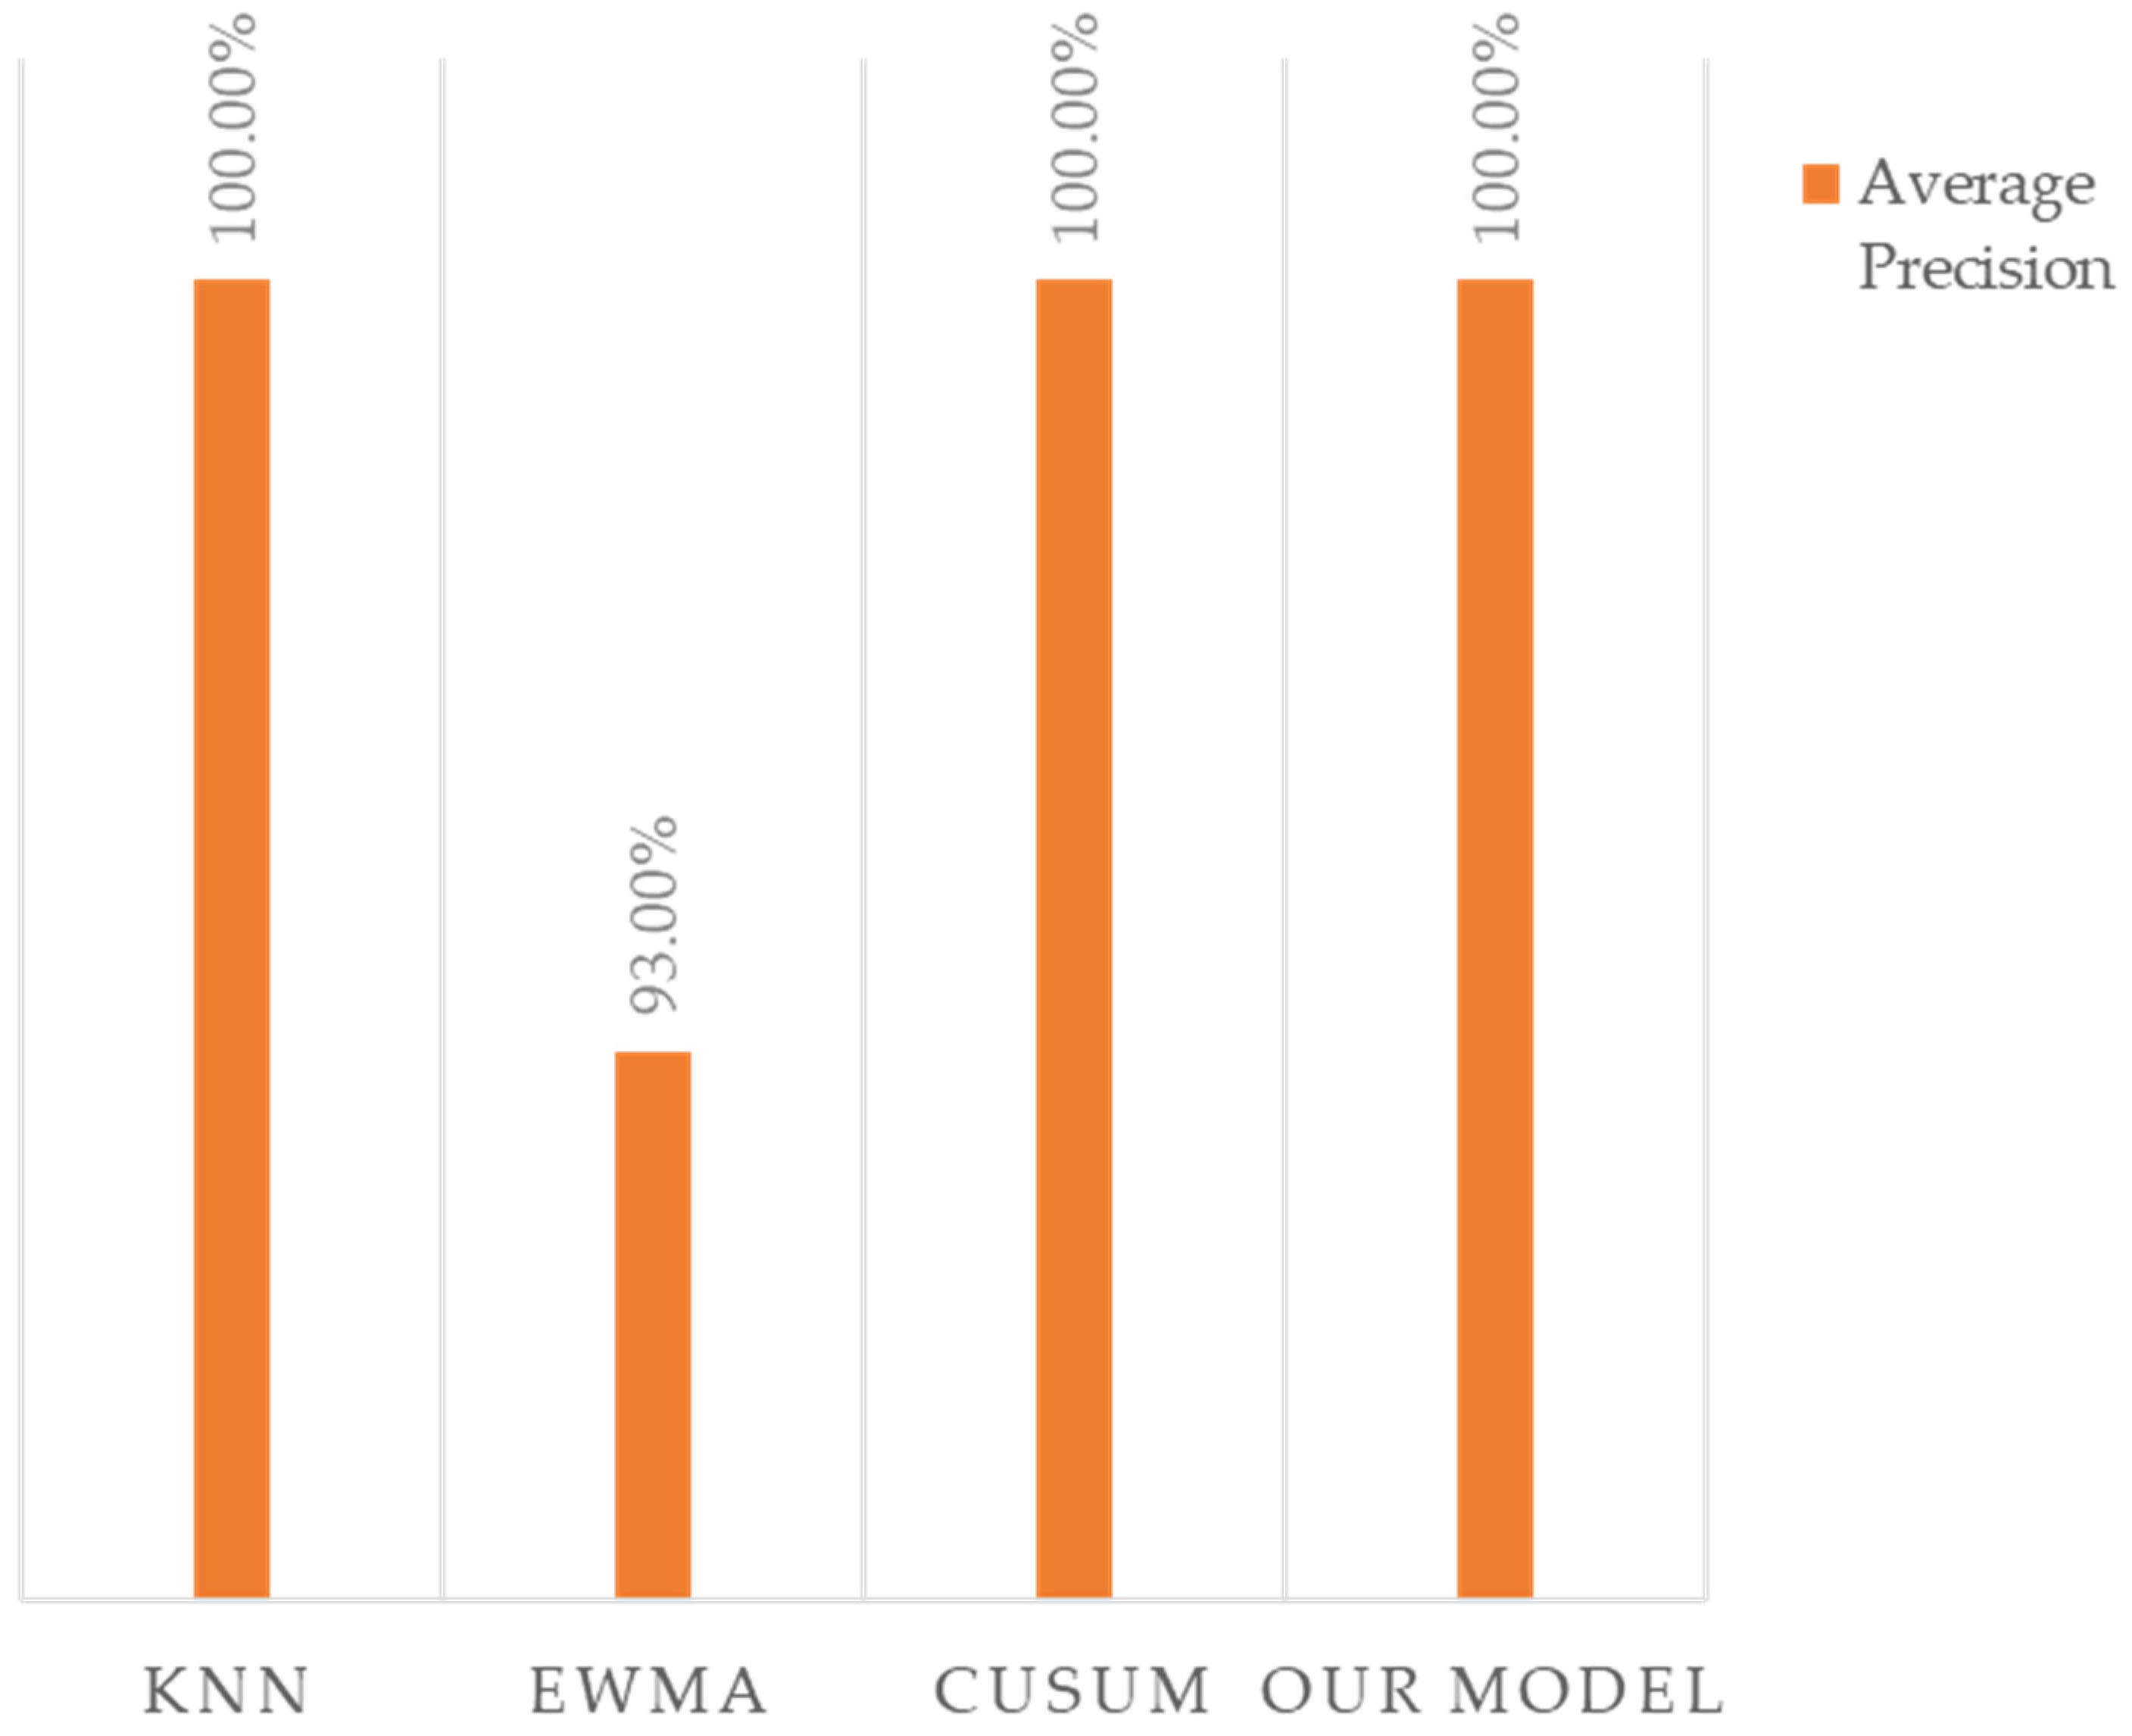
Figure 13 presents our calculation of the accuracy, recall, precision, and F1 score of the three selected algorithms (EWMA, CUSUM, and KNN).
In
Appendix A,
Figure A5 presents a comparison of the recall of EWMA, CUSUM, and KNN with our model.
Figure A6 presents a comparison of the precision of EWMA, CUSUM, and KNN with our model.
Figure A7 presents a comparison of the F1 score of EWMA, CUSUM, and KNN with our model.
Figure A8 presents a comparison of the accuracy of EWMA, CUSUM, and KNN with our model.
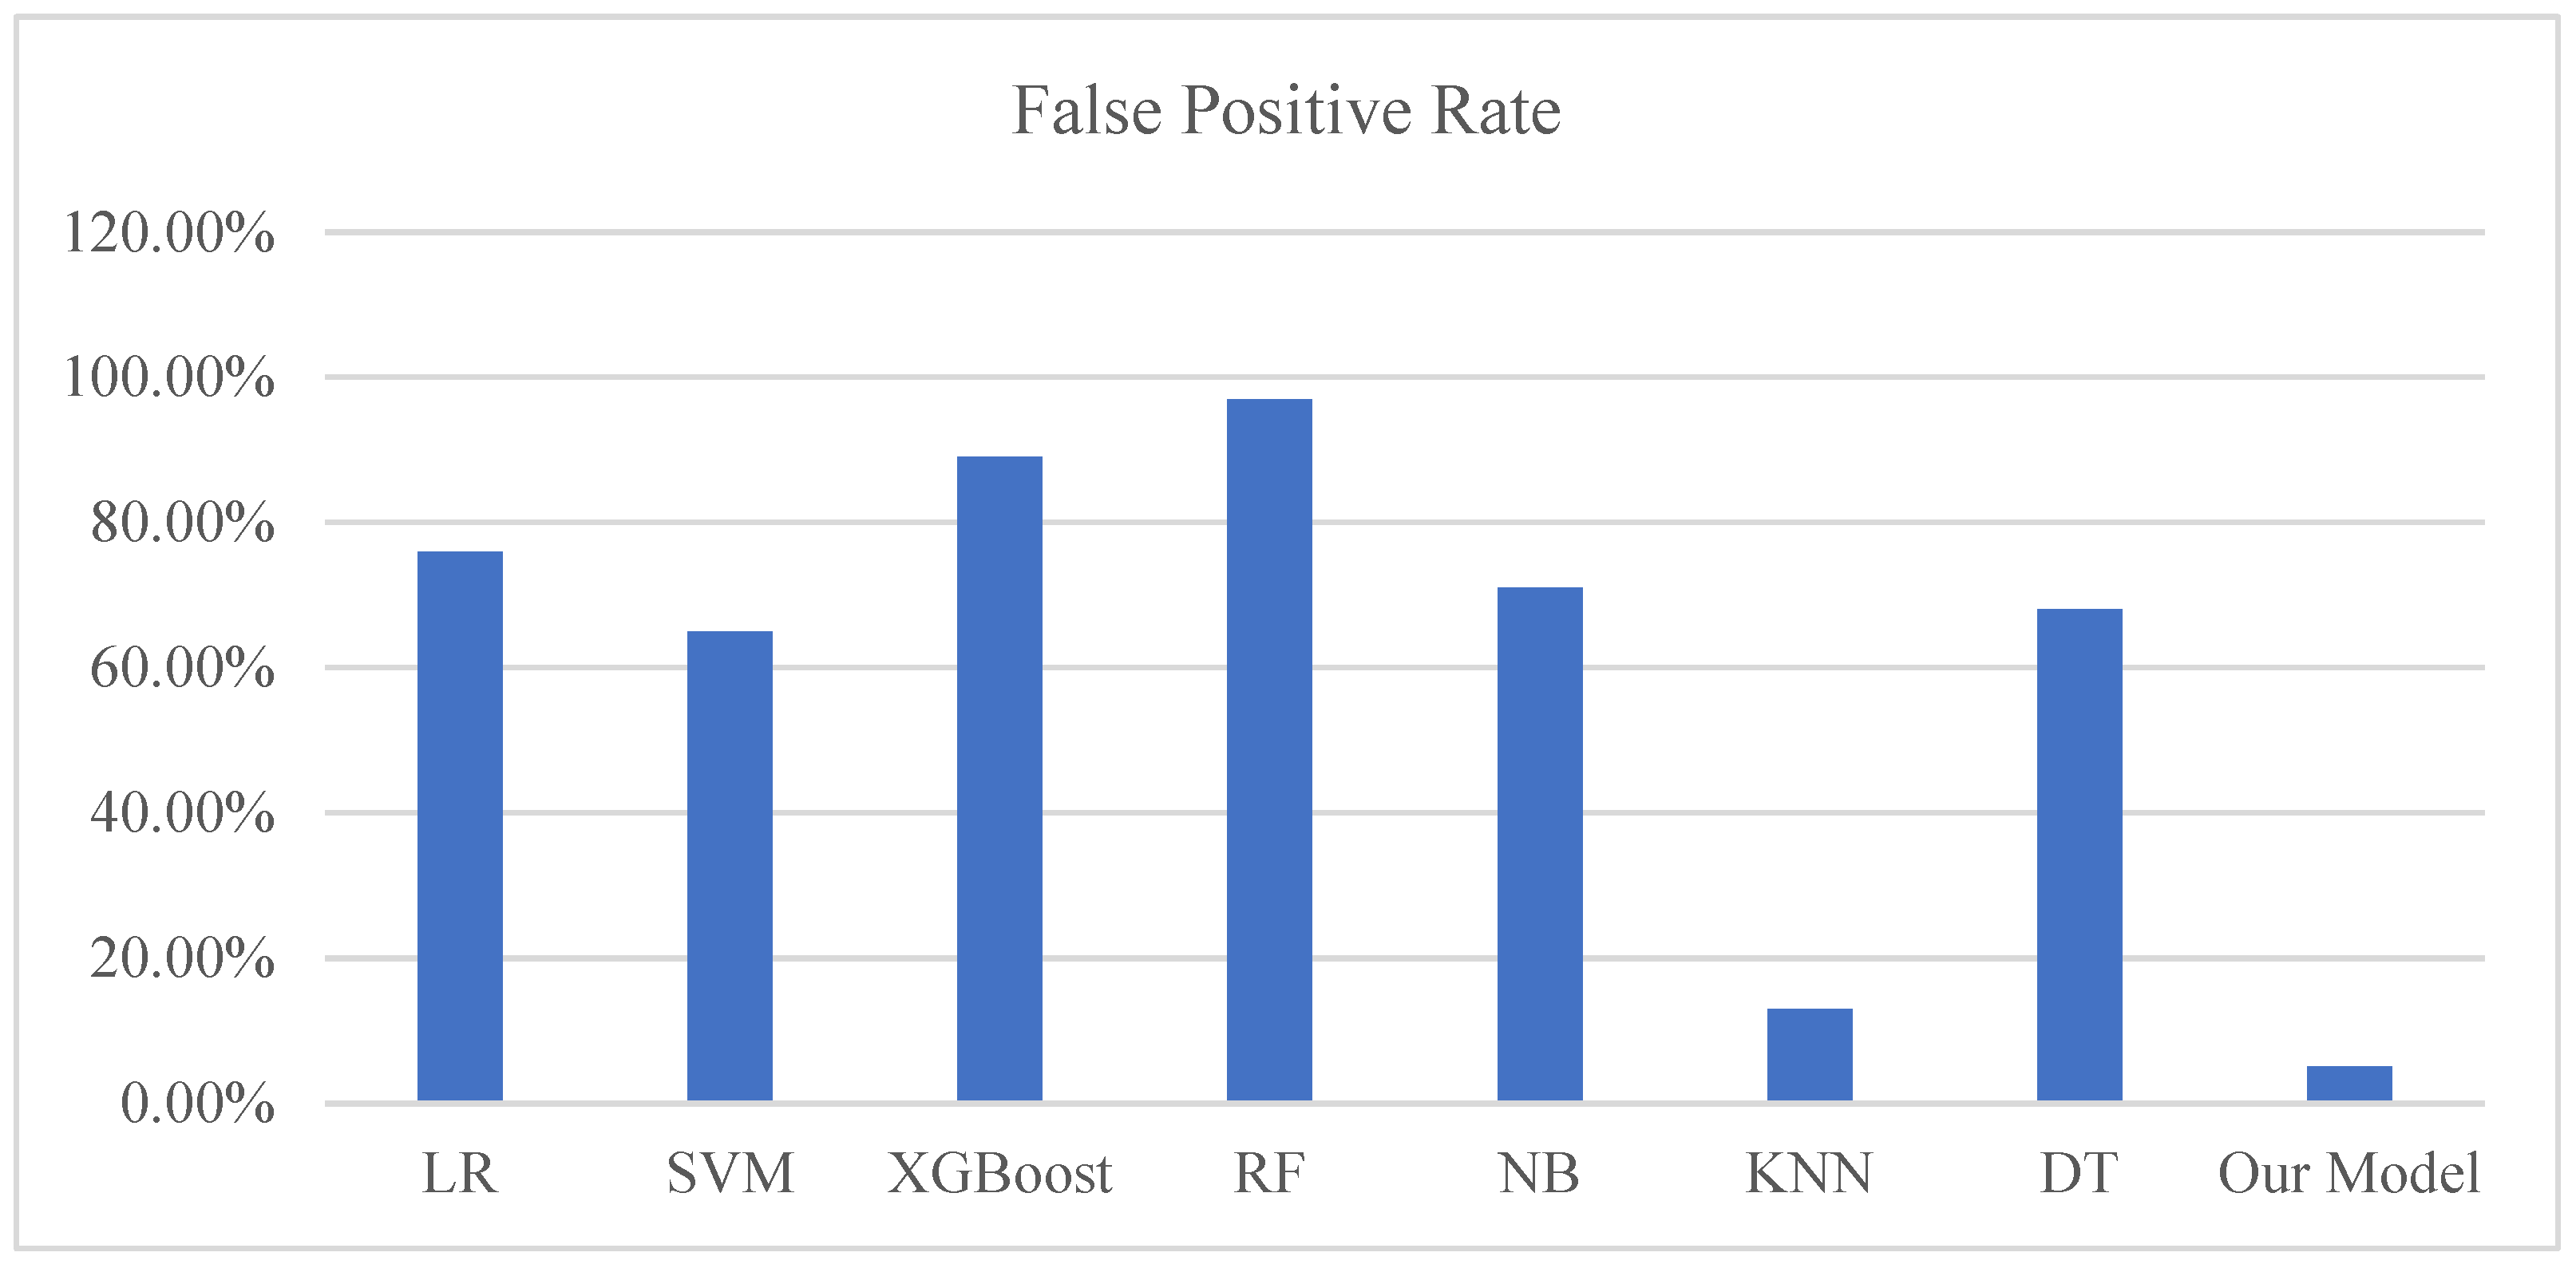
Figure 14 presents our calculation of the false positive rate (FPR) of our model compared with the FPRs of other algorithms.
In
Appendix A,
Figure A9 presents a comparison of the FPR of EWMA, CUSUM, and KNN with our model.
Figure 15 presents the network traffic expressed as an amount of packets, and the period is expressed in seconds.
Figure 16 presents how the KNN algorithm detects malicious traffic.
Figure 17 shows how the exponentially weighted moving average algorithm detects malicious traffic.
Figure 18 presents how the cumulative sum algorithm detects malicious traffic.
Figure 19 shows how the three algorithms (EWMA, CUSUM, and KNN) that we have used in our model detect malicious traffic.
EWMA, KNN, and CUSUM have been tested to determine all the benefits of the proposed implementation. First, the data are marked to ensure that the algorithms can be contrasted to several benchmark principles. For example, in
Figure 15, the traffic of the network is represented by the number of packages, and time is represented in seconds.
When one is identifying malicious traffic, different metrics are used for measuring accuracy, precision, F1, and DR for EWMA, KNN, and CUSUM, and one should examine and compare them. In our model, we have combined three algorithms to obtain the maximum advantages of these three algorithms at once.
Figure 16,
Figure 17 and
Figure 18 depicts how the KNN, EWMA, and CUSUM algorithms individually identify malicious attack traffic, respectively. However,
Figure 19 shows how the three algorithms detect malicious traffic when they are combined, as in our model.
Overall, our model was the one that achieved the most robust results when we were measuring all the metrics used in this thesis, such as precision, accuracy, F1, and recall, by combining the three algorithms, rather than using any of the three algorithms individually.
4.5. Comparison with Other Approaches
We compared the performance of our model with other studies as shown in (
Table 2) and found that our model is more effective in detecting attacks in an early stage with a high rate of accuracy and a low FPR.


