1. Introduction
Critical civil infrastructure needs to cope with serious demands, related to both internal and external factors. All components of the infrastructure deteriorate due to natural processes such as aging and the normal wear and tear that comes with utilization. Structures may experience unexpected and accelerated damage because of sudden environmental events, such as earthquakes and hurricanes. Furthermore, human-related events may also cause damages, such as variability in service loads or unanticipated overloading. In order to determine whether a structure has experienced damage, engineers use mechatronic sensors, which provide additional information concerning the precise damage location and severity. For damage detection to be accurate, sensors need to provide automatic, high quality data. Moreover, the data must be readily available to inspectors working outside the field where it is collected. Although most wireless sensors provide the necessary quantitative information and allow engineers to collect data in the field, it is often necessary to perform subsequent data processing in the office or at the decision-making headquarters [
1,
2,
3]. Such an approach to data collection and analysis delays decision making. In general, the industry relies on inspectors’ analyses for critical decision-making. If wireless sensors could provide direct information to inspectors, the industry decisions would be improved by the data obtained.
This paper shows that the communication and the data transfer between wireless sensor networks (WSN) and databases can be significantly improved through the application of Augmented Reality (AR). AR is a tool which overlays the known attributes of an object with the corresponding position on the computer screen. Once AR captures input from the mechatronic devices, the AR application recognizes the target, processes the images, and augments it with audiovisual data, creating an illusion that helps the user to analyze the real-world situations in more detail. In this way, AR allows integration of reality with virtual representations provided by a computer in real time. These additional synthetic overlays supply data that may be unavailable otherwise, but it may also display additional contextual information [
4]. Two other advantages of AR include the possibility of having real-time interactions and access to accurate three-dimensional (3D) representation of structures.
AR has been used to visualize structural health monitoring data for over 20 years (see [
5] for a recent overview). For example, Bleck, B.M [
6] developed a toolbox for the application of the AR headset in smart nuclear facilities, which improves their safety and productivity performance. The toolbox models a nuclear facility in the virtual domain, which is subsequently augmented on the users’ screens, providing access to operations in real time. Moreu, F. [
7] implemented AR technology to improve bridge inspection performance. The study applied AR tools to carry out documentation of structural inspections in a quantitative manner, which eventually may reduce the variability that occurs in manual inspections done by different inspection teams. Morales Garcia, J.E. [
8] used the AR headset to capture thermal imaging in smart infrastructure inspection. In this way, they showed that AR can be applied to detect heat emitted by electronic equipment, which can in addition be useful for firefighters for detecting hotspot in buildings engulfed in fire. Ballor, J.P. [
9] applied AR tools to minimize the disadvantages of visual inspection. They used the sensors of an AR headset to obtain a 3D measurement of high resolution of an infrastructure under inspection that was combined with RGB photos overlaid on the geometry. They showed that the 3D measurement could be implemented to examine the condition of structures over time as well as to keep track of the progression of the damage.
The proposed AR techniques improve the inspectors’ capacity to perform informed maintenance decisions, to efficiently evaluate on-site damage and potential risk, to determine the growth of defects that occur over time, and to provide high-resolution documentations of performed inspections, which reduces the variability found in manual inspections. However, due to the high cost of AR equipment, these solutions are rather expensive to implement. In the experiment reported in this paper, the researchers made use of a more economical data acquisition system (DAQ), which reduced the overall cost of the application.
AR can be applied to all senses, including vision, touch, and hearing, so it is normally implemented through a headset or a handset. In the experiment reported in this paper, the researchers used an augmented reality headset “HoloLens from Microsoft”. The headset is equipped with a variety of mechatronic sensors, such as microphones, RGB/depth imagers, and inertial measurement units (IMU); communication interfaces such as Bluetooth, and peripherals such as stereo sound. Interaction with AR headsets occurs via voice commands, gesture recognition, and tracking the user’s gaze. Due to these interaction possibilities, AR headsets are useful for industrial applications, as they allow leaving the hands free for performing manual work.
For the purposes concerned with reliable communication and data transfer between WSN and databases, AR permits engineers to directly interact with the real world. Furthermore, as is mentioned earlier in the paper, Wireless Sensor Networks (WSN) usually provide the necessary quantitative information to engineers. However, it is also important to be able to present the collected data to inspectors in a useful and transparent way. Sensor networks consist of many sensor nodes, coupled with wireless communication and sensing hardware. They are deployed in an area under investigation, collectively measure a phenomenon, and then process received data before transferring it to the base station. AR improves access and the analysis of the data by making it possible to visualize information coming from the mechatronic sensors in a graphic form in real time, in a reliable way, to inspectors working outside the field. In this way inspectors can observe augmented data and compare it across time and space, which leads to the prioritization of infrastructure management decisions based on accurate observations.
2. The Components of AR
AR covers a number of technical components that apply electronic devices to observe, directly or indirectly, physical environments in the real world and to combine them with virtual elements.
The components that are part of an AR system include:
A device used for capturing images (for example, a Charge-Coupled Device (CCD), a stereo, or a depth-sensing camera).
A display that is used for projecting the virtual information on the images that were obtained by the capturing device.
There are two types of display technologies:
Video-mixed display—it digitally merges and represents on a display the real and virtual data obtained with a camera. The presented images may have reduced resolutions, with limited fields of vision.
Optical see-through displays (such as projection-based systems)—in this technology, an optical projection system superimposes virtual information on the inspector’s field of view.
A processing unit that yields the virtual information that will be projected.
Activating elements triggering the virtual information display. They include GPS positions, images, sensor values from accelerometers, QR (Quick Response) markers, compasses, gyroscopes, altimeters, and thermal sensors.
The components of the AR System are shown in
Figure 1.
The AR headset is a device that permits interaction between a computer and a user in mixed-reality environments. It is a holographic computer worn on the user’s head and it consists of the following components:
A widescreen stereoscopic head-mounted display (with the resolution of 1268 × 720 pixels per eye, 60-Hz refresh rate, and aspect ratio of 16:9). The display contains colored holographic lenses.
A depth camera (1208 × 1208), with four additional cameras equipped with built-in sensors used for environment sensing and ambient light detection. The sensors obtain user input via IMU that contains a gyroscope, an accelerometer, and a magnetometer.
A set of integrated speakers and four microphones that enable two-way communication.
The AR headset is equipped with a Holographic Processing Unit, which handles one trillion calculations per second, and has two gigabytes (GB) of RAM. Moreover, it has 64 GB of internal flash storage and provides Wi-Fi support and Bluetooth. The battery life is up to two weeks of standby mode or 3 h of active usage.
The AR headset is equipped with a clicker accessory connected via Bluetooth, which enables the user to make physical commands instead of using hand gestures or voice commands.
The device is lightweight (579 g), and the holographic computer images can be observed within the user’s conventional point of view.
Advantages of the AR Application
A strong advantage of the application of the AR headset for data collection is the produced hologram effect which mixes physical and virtual objects. The hologram effect is understood as the extra information visualized through the AR device which the viewer obtains in addition to the information received from the real world. This effect allows inspectors to visualize and interact with the obtained data as well as with the real existing physical objects in the actual environment. The AR headset works with very powerful computing technologies that produce quick visualization of complex data and reliable task analysis. Moreover, the AR headset has the additional advantage of enabling a computing infrastructure, which permits inspectors to implement both data analysis and physical operations at the same physical locations without a context switch. In this way, inspectors from different locations can perform a collaborative analysis of infrastructure in an identical environment at the same time. Such an analysis can be carried out in different situations, both in disaster scenarios when visualization of critical infrastructures is necessary to ensure a quick and efficient emergency response, as well as during the monitoring of infrastructure in routine operation.
3. The Structure of the Sensing Platform
This section describes the battery-powered, cost-efficient wireless sensor strain gauge and provides a description of its components.
The sensing platform is a wireless (WS) Structural Health Monitoring (SHM) system. Wireless SHM systems have substantial advantages when compared to their conventional wired counterparts. First of all, a major advantage of WS-based SHM systems is their reliability and that they enable autonomous, efficient monitoring that takes place in real time in any location [
10,
11]. For this reason, WS-based SHM systems are used to monitor large structures that are strategic and critical public infrastructure, such as bridges, mines, pipelines, dams, oil rigs, and wind turbines [
12,
13]. A second major advantage of WS-based SHM systems is related to their economic performance: in comparison to traditional, wiring-based communication systems, wireless communication is very cost-effective due to lower labor costs [
14]. The commercial advantage of WS-based SHM systems permits an application of a denser network of wireless sensor nodes, which in consequence provides a more accurate and reliable level of SHM monitoring.
Generally, a wireless sensor node contains the following essential components: sensors, a microcontroller, a transceiver, external memory, and a power source [
15]. The role of the sensors is to obtain data from the environment and to convert it into data for postprocessing, i.e., digital data the algorithm can operate. The microcontroller then processes the raw data acquired and stores the results of the processing in an external memory. The data saved in the external memory may be later accessed by the user. The role of the transceiver is to share the data between the nodes and the base station. The power unit provides energy, and it can be a battery, a capacitor, or both. Other modules can be added to the system if required.
Figure 3 shows the basic elements of wireless sensors [
16].
3.1. Strain Gauge and Its Components
The previous section provided an overview of the main components of a wireless sensor. The current section offers recommendations of particular components that can be used for the strain gauge, taking into account their technical properties and their market availability. The components are shown in
Figure 4, and their cost is presented in
Table 1.
Table 2 shows a cost comparison between the proposed and existing architecture.
3.1.1. Microcontroller
This research uses the Arduino Uno R3. It is an ATmega328P-based microcontroller platform. It is an open-source platform that is utilized for various electronic applications and can be applied to many projects. It can be powered through a USB or connected through a barrel jack. It contains a circuit board that is programmable physically and through coding, and it features 14 digital input/output pins. These pins have two purposes: they can collect information from the sensors (measuring temperature, acceleration, strain, light), and they can control actuators. Another component of the pins includes six PWM outputs. There is an Integrated Circuit (IC) which essentially runs the Arduino board. In summary, it is a flexible and efficient microcontroller; it provides an easy to use interface and ensures a reliable connection between systems [
17]. Since it can interact with various types of equipment, it is a very useful component for this experiment.
3.1.2. Sensor
The strain gauge 3/120 CLY41-2L-0.5M has a measuring grid length of 3 mm, made of ferritic steel (10.8 ppm/K) with a nominal resistance of 120 ohms, employs two wires with a connection cable of 0.5 m, produced by HBM with headquarters in Germany.
This is a sensor that consists of a resistor (metallic grid) which measures displacement due to different types of forces. This gage converts forces that are applied and records the displacement due to that force. This gage is affixed to a metal ruler for this experiment. As load is added to the free end of the ruler, the metallic ruler bends. As the metal bends, the resistor changes its resistance value, which in turn changes the output voltage. This millivoltage is then amplified by the HX11 converter to be correlated to displacement.
3.1.3. Analog to Digital Converter
This chip is used for communication between the strain gauge and the Arduino. It can transfer data with precision. It is a 24-bit analog to digital converter (ADC).
The HX711 allows for a digital interface which is connected to the Arduino Shield. The DT (data output) and SCK (serial clock input) are connected to the Arduino along with the Ground and 5 V power (Vcc).
To the left of the HX711 ADC, there are four input connections: Ch A and Ch E, one positive and one negative for each channel.
3.1.4. Potentiometer
The circuit also consists of a 500 Ω potentiometer.
3.1.5. Resistors
The circuit also consists of two resistors, 10 kΩ ± 5% each.
3.1.6. Wireless SD Shield
The Wireless SD Shield allows the microcontroller board to (1) to communicate through the XBee transceiver module (a wireless module) [
18]; and (2) to store digital data coming from the sensor in a micro SD card socket. These two functions can be applied synchronously or independently.
3.1.7. XBee Series 1 Module
Computers, systems, and microcontrollers can be interconnected with a module referred to as the XBee Series 1 Module, providing support to point-to-point and multi-point networks, which can be converted to a mesh network point. According to the specifications included in the Digi XBee documentation [
19], XBee Series 1 has the range of 300 feet outdoors within line-of-sight and 100 feet indoors, and it is equipped with an excellent wire antenna. The setup is easy, and it is not necessary to perform any prior configuration. The XBee Series 1 can be applied as a replacement for wired serial connections used previously. The researchers chose to use the XBee module as it ensures continuous communication between the sensor platform and any computational platform. In our research, we wanted to communicate the sensor with the AR headset.
3.1.8. Power Source
The researchers used the Nanotech Battery as the power source [
20]. It is a reliable battery that can provide energy to the wireless sensor and ensure its autonomous performance. An additional advantage of the Nanotech Battery is that it is rechargeable. A solar panel can be used to charge the battery, which is particularly advantageous in field applications.
The m+p VibPilot 8-Channel has a 24-bit resolution, whereas the Arduino Uno R3 has a 10-bit resolution. The 24-bit ADC has 16,384 times the resolution of the 10-bit ADC. The dimensions of the m+p VibPilot 8-Channel are 211 mm length × 190 mm width, while the dimensions of the Arduino Uno R3 are 68.6 mm length × 53.4 mm width. The comparison indicates that the sensing platform developed by the researchers is more portable, and it is easier to install in any location.
4. AR and Database
The connection between augmented reality and sensors is displayed in
Figure 5.
4.1. Hardware
The hardware components include the server, the sensor, and the AR device. The hardware components are shown in
Figure 6.
The Server
The server is a computer which manages access to the sensor data through the AR device in a network. The server used in this experiment is a Microsoft Surface computer.
4.2. Software
To support affordability and accessibility, the researchers used open-source software. The major exception is Unity 3D, for which a license must be obtained. Although the features of Unity are free to use, they are not open source. It is possible to use Cocos 2d-x or the Godot Engine as alternatives. The software components are shown in
Figure 7.
4.2.1. The Server
The researchers installed Node.js and MySQL on the server (i), which are the necessary software to connect databases to any application. MySQL is one of the most popular open-source databases in the world because of its accessibility and efficiency. Virtually every popular programming language, including Java or PHP, provides access and enables operations with MySQL. Node.js is an open-code, which executes JavaScript codes outside the display program. Node.js represents a “JavaScript everywhere” paradigm, which allows the user to apply JavaScript for server-side scripting and to write command-line tools. Node.js is supported on macOS, Linux, Microsoft Windows 7, and Server 2008 (and later versions). It is mainly applied to develop network programs such as Web servers, but it also allows creating Web servers and networking tools that use JavaScript. MySQL is a free, open-code relational database management system (RDBMS) that follows the GNU General Public License (GNU GPL.) It is written in C and C++, and it can be used on many system platforms. MySQL can be built and manually installed from source code. When special customizations are not needed, it can also be installed from a binary package. Since the researchers work with a database, it is possible to visualize storage data from previous measurements.
4.2.2. The Sensor
The sensor (ii) programming was performed in the Arduino IDE platform. Arduino IDE is an open-code software that runs on different operative systems. The environment is written in Java and based on open-source software, including processing. This software can be used with any Arduino board, which facilitates writing the code and uploading it to the Arduino compatible boards, but also to other vendor development boards when third party cores are used, which makes it a very flexible solution.
4.2.3. The Connection between the AR and the Sensor
The AR headset (iii) was connected to the server that contains the web page connected to the Internet. In this way, it was possible to project the information from the sensors in the AR headset. The projection of the web page contained in the server in the AR headset was possible because of the Windows 10 Microsoft Edge application. Microsoft Edge is a web browser first released for Windows 10 and Xbox One in 2015, developed by Microsoft. It is built with Microsoft Edge HTML and Chakra engines. It is integrated with Microsoft’s online platforms and provides voice control, search functionality, and dynamic information search in the address bar. Edge shows superior power efficiency in comparison with most other major web browsers.
4.2.4. Sensor Data to Server
The sensor data is stored in the MySQL database. The MySQL database contains the field time, strain value, and the ID of the sensor.
4.2.5. Server Data to AR Device
The research team used PHP and HTML to graph the information contained in the database from the sensors. A web page was developed using PHP and HTML. This paper shows a first approach to a data visualization from only one sensor. However, in the future, it can easily be expanded to a mesh of sensors, which is of interest to the research and industry application domain of this new interface. In the event of a human using the AR headset with a mesh of sensors, which sensor data to visualize will need to be chosen. In order to distinguish various sensors using the AR headset, it is possible to paste a Quick Response (QR) code to each sensor. Each QR code is linked to an ID associated with each sensor. Under this scenario, the user will select one sensor and scan it with the QR code reader. Then, the AR headset will identify the ID being scanned at that moment with their corresponding sensor. With this QR-ID pairing, it will be possible to filter the data from the database and display only the data corresponding to the sensor chosen by the user.
4.3. AR and Human-Machine Interface
AR is a complex technology that involves the application of novel solutions that mix actual and virtual realities. The technology supplements actual realities with computer-generated sensory inputs, such as sound, video, and graphics. Due to the novelty of AR applications and solutions, it is not yet clear how AR may affect the human-machine interface (in particular, what new human-related challenges may emerge) and what design principles should be at work for the effective application of AR technologies (see [
21] for a discussion of human factor considerations for the application of AR in an operational railway environment).
The application of AR raises a number of issues that need to be considered. For example, AR functionality must match the user’s needs. The additional information provided by AR must be appropriate in scope for the user to be able to process it and comprehend it. In view of this, it is necessary to take into account the properties and limitations of human perception so as to avoid human errors and prevent creating confusion. The properties of human perception may impose requirements on the size of objects provided on display and the availability of interactive information. Other limitations may be related to human learnability and the amount of information that can be presented to the user at a given time.
5. Experiment
In the experiment, the researchers used the augmented reality headset the “HoloLens from Microsoft.” The AR headset was used to visualize the data coming from the strain gauge. This headset collects data via its image sensors. It also contains an IMU; four sensors; an ambient light sensor; a depth camera; a photographic video camera of 2.4-megapixels; and four microphones [
22]. The process of capturing data by the AR headset involves four light-sensitive grayscale cameras which track visual features in front as well as alongside the edge of the smart glasses. The sensors operate in conjunction with a depth camera that measures depth through infrared light by applying the time-of-flight method. This method is more accurate and effective than the ones used by standard cameras, which are more sensitive to ambient light. Moreover, when the AR headset is used in Windows Research Mode, inspectors can access an even wider spectrum of data collected by the sensors. For example, they can obtain access to computer vision algorithms, such as simultaneous localization and mapping (SLAM) for spatial mapping and motion as well as the audio and video streams. It is also possible to route the output provided by the smart glasses wirelessly to a computer or cloud environment for subsequent more intensive data processing.
5.1. Experiment Setup
This section describes the experimental setup that is applied in order to validate the developed method. The first part provides an overview of the simplified cantilever beam model that was chosen for the experiment. The second part describes the placement of the sensor as well as the instrumentation that was necessary for the method. This section develops an analysis and provides an assessment of strains that were collected from the experiments to evaluate the performance of the developed method.
As shown in
Figure 8, a cantilever ruler was utilized as the test specimen to conduct the experiment, the material and sectional properties of the ruler are presented in
Table 3, and its dimensions are displayed in
Table 4.
5.2. Theoretical Strain
This section introduces the principles of estimating strain from a strain gauge. Since strains directly relate to the structural condition of bridges, they can also be used to determine bridge serviceability. As shown in
Figure 9, the strain is calculated at a specified point where the strain gauge is attached. This value is derived utilizing the strain–stress formula and deflection due to point load. As the equation is only valid for the elastic behavior of a ruler, some discrepancy with the experimental data is expected.
Equation (1) defines the theoretical strain,
:
where,
represents the moment at
given by
P ×
L1,
E is the Young’s modulus of elasticity,
is the second moment of inertia and c is the maximum distance of compression from the elastic neutral axis.
6. Results and Evaluation
The theoretical strain was calculated on the basis of the formula obtained in Equation (1). This value is based on the load imposed (
), section property (
), material property (
), and the relative location of the sensor (
), the theoretical strain and the experimental strain are presented in
Table 5 and plotted in
Figure 10.
The observed maximum and minimum strain values for loading of 697.9 g of weight are summarized in
Table 6.
The error was calculated using the equation given in Equation (2).
Figure 11 presents a comparison of the errors obtained in the experimental measurements compared to the values of the theoretical measurements.
The experimental strain is also displayed using the AR device and is shown in
Figure 12. The researchers used PHP and HTML to graph the information contained in the database from the sensors, whereas the web page was developed using PHP and HTML. As can be seen from this video capture, the inspector can visualize real-time changes in the strain that inform structural properties. According to the structural inspection community, the application of this technology can be used to observe live load testing quantitatively in the field. The future direction of this research includes field application of this new framework.
It must be noted though that the method developed in this paper has some limitations (for a general discussion of the limitations of Augmented Reality, see [
23]). For example, there are technological challenges that need to be addressed in future work, such as the limited battery life, the insufficient data storage and processing capacity of mobile devices, and the high cost of these appliances. Furthermore, there are physiological limitations concerned with the user’s interaction with AR technology. They are related to the insufficient understanding and knowledge of natural body movements during the application of AR technology, as well as the restricted scope of vision offered to the user of AR headsets.
7. Conclusions
This paper introduced a new automatic Strain Gauge platform, which collects data with a smart low-cost sensor to measure the strain of different applications. In the experiment presented in this paper, the platform allowed real-time visualization of data coming from the strain gauge in the AR headset. In the context of the research presented in this paper, the application of the AR headset was shown to ensure automatic, effective communication from a smart, low-cost sensor strain gauge to a database in real time in a reliable way. Inspectors can use the AR headset to observe augmented data and quickly compare it across time and space, which in turn leads to the prioritization of infrastructure management decisions following accurate observations.
The opportunities afforded by Augmented Reality for industry and academia will help to visualize the design-sense-build experiment. The two main contributions of this paper in the field of sensing technology and mechatronics are the low-cost fabrication of a smart strain gauge sensor and the real-time visualization of data provided by the AR headset. By demonstrating the framework for strain gage sensing, this experiment encourages students and professional engineers to apply the sensors as a crucial component of the design. A design-sense-build framework results in a ground-breaking shift in the civil engineering, mechatronics, and construction industry. The cost comparison shows a difference in price of an order of magnitude $153.45 compared to $14,257. Finally, this paper demonstrates that building a smart low-cost sensor that can be rapidly deployable on-site may result in more efficient use of time and labor, therefore increasing overall efficiency.
Author Contributions
F.M., M.A., D.M., M.d.P.R. contributed to the conceptualization, methodology, validation, and formal analysis; M.A., D.M., and M.d.P.R. contributed to the hardware, visualization, and data curation; M.A. and D.M. contributed to the software; F.M. contributed to the resources, supervision, project administration; M.A. contributed to the original draft preparation; F.M., D.M., M.A., D.D.L.M., and M.d.P.R. contributed to the investigation and the writing—review and editing; F.M. and D.D.L.M. contributed to the funding acquisition. All authors have read and agreed to the published version of the manuscript.
Funding
This research was supported in part by the Department of Civil, Construction and Environmental Engineering of the University of New Mexico; the Transportation Consortium of South-Central States (TRANSET); US Department of Transportation (USDOT), Projects No. 17STUNM02 and 18STUNM03; New Mexico Consortium Grant Award No. A19-0260-002; the Los Alamos National Laboratory Contract No. 493274; and the Air Force Research Laboratory Contract FA9453-18-2-0022 P0002.
Acknowledgments
The authors want to thank the collaboration of the Center for Advanced Research and Computing (CARC) of the University of New Mexico.
Conflicts of Interest
The authors declare no conflict of interest. The funders had no role in the design of the study; in the collection, analyses, or interpretation of data; in the writing of the manuscript, or in the decision to publish the results.
References
- Chang, P.C.; Flatau, A.; Liu, S.C. Health Monitoring of Civil Infrastructure. Struct. Health Monit. 2003, 257–267. [Google Scholar] [CrossRef]
- Cross, E.; Worden, K.; Farrar, C. Structural health monitoring for civil infrastructure. In Health Assessment of Engineering Structures: Bridges and Other Infrastructure; World Scientific Publishing: Singapore, 2013. [Google Scholar]
- Chen, H.-P.; Ni, Y.-Q. Structural Health Monitoring of Large Civil Engineering Structures; Wiley-Blackwell: Oxford, UK, 2018. [Google Scholar]
- Schmalstieg, D.; Höllerer, T. Augmented Reality: Principles and Practice; Addison-Wesley: Boston, MA, USA, 2016. [Google Scholar]
- Napolitano, R.; Liu, Z.; Sun, C.; Glisic, B. Combination of Image-Based Documentation and Augmented Reality for Structural Health Monitoring and Building Pathology. Front. Built Environ. 2019, 5, 50. [Google Scholar] [CrossRef]
- Bleck, B.M.; Katko, B.J.; Trujillo, J.B.; Harden, T.A.; Farrar, C.R.; Wysong, A.R.; Mascarenas, D.D.L. Augmented Reality Tools for the Development of Smart Nuclear Facilities; Technical Report; Los Alamos National Lab. (LANL): Los Alamos, NM, USA, 2017. Available online: https://www.osti.gov/servlets/purl/1374269 (accessed on 1 October 2019).
- Moreu, F.; Lippitt, C.; Maharjan, D.; Aguero, M.; Yuan, X. Augmented Reality Enhancing the Inspections of Transportation Infrastructure: Research, Education, and Industry Implementation. Publications 2019, 55. Available online: https://digitalcommons.lsu.edu/transet_pubs/55 (accessed on 1 October 2019).
- Morales Garcia, J.E.; Gertsen, H.J.; Liao, A.S.N.; Mascarenas, D.D.L. Augmented Reality for Smart Infrastructure Inspection; Technical report; Los Alamos National Lab. (LANL): Los Alamos, NM, USA, 2017. [Google Scholar]
- Ballor, J.P.; McClain, O.L.; Mellor, M.A.; Cattaneo, A.; Harden, T.A.; Shelton, P.; Martinez, E.; Narushof, B.; Moreu, F.; Mascareñas, D.D.L. Augmented reality for next generation infrastructure inspections. In Model Validation and Uncertainty Quantification; Springer: Berlin, Germany, 2019; Volume 3, pp. 185–192. [Google Scholar]
- Frangopol, D.; Messervey, T. Maintenance Principles for Civil Structures. In Encyclopedia of Structural Health Monitoring; Boller, C., Chang, F.-K., Fujino, Y., Eds.; John Wiley & Sons: Chichester, UK, 2009. [Google Scholar]
- Ko, J.; Ni, Y. Technology developments in structural health monitoring of large-scale bridges. Eng. Struct. 2005, 27, 1715–1725. [Google Scholar] [CrossRef]
- Doebling, S.; Farrar, C.; Prime, M.; Shevitz, D. Damage Identification and Health Monitoring of Structural and Mechanical Systems from Changes in their Vibration Characteristics: A Literature Review; Los Alamos National Laboratory Report LA-13070-MS; Los Alamos National Laboratory: Los Alamos, NM, USA, 1996. [Google Scholar]
- Sohn, H.; Farrar, C.; Hemez, F.; Shunk, D.; Stinemates, D.; Nadler, B. A Review of Structural Health Monitoring Literature: 1996–2001; Report LA-13976-MS; Los Alamos National Laboratory: Los Alamos, NM, USA, 2004. [Google Scholar]
- Chintalapudi, K.; Fu, T.; Paek, J.; Kothari, N.; Rangwala, S.; Caffrey, J.; Govindan, R.; Johnson, E.; Masri, S. Monitoring civil structures with a wireless sensor network. IEEE Internet Comput. 2006, 10, 26–34. [Google Scholar] [CrossRef]
- Akyildiz, I.; Su, W.; Sankarasubramaniam, Y.; Cayirci, E. Wireless sensor networks: A survey. Comput. Netw. 2002, 38, 393–422. [Google Scholar] [CrossRef] [Green Version]
- Aguero, M.; Ozdagli, A.; Moreu, F. Measuring Reference-Free Total Displacements of Piles and Columns Using Low-Cost, Battery-Powered, Efficient Wireless Intelligent Sensors (LEWIS2). Sensors 2019, 19, 1549. [Google Scholar] [CrossRef] [Green Version]
- Banzi, M. Getting Started with Arduino; O’Reilly Media, Inc.: Sebastopol, CA, USA, 2011; p. 131. [Google Scholar]
- Arduino. Arduino Uno Rev3. 2018. Available online: https://store.arduino.cc/usa/arduino-uno-rev3 (accessed on 1 October 2019).
- XBee Explorer. SparkFun XBee Explorer USB. Product Information. 2018. Available online: https://www.sparkfun.com/products/11812 (accessed on 1 October 2019).
- Nanotech. Turnigy Nano-Tech 1000mah 2S 25~50C Lipo Pack. Product information. 2018. Available online: https://hobbyking.com/en_us/turnigy-nano-tech-1000mah-2s-25-50c-lipo-pack.html?___store=en_us (accessed on 1 October 2019).
- Hall, N.; Lowe, C.; Hirsch, R. Human factors considerations for the application of augmented reality in an operational railway environment. Procedia Manuf. 2015, 3, 799–806. [Google Scholar] [CrossRef] [Green Version]
- Holmdahl, T. BUILD 2015: A closer look at the Microsoft HoloLens hardware. Microsoft Devices Blog, 30 April 2015. [Google Scholar]
- Lass, W. The Future of Augmented Reality: Limitations, Possibilities and Hopes; Emerging EdTech. 7; 2015; Available online: https://www.emergingedtech.com/2015/07/future-of-augmented-reality-limitations-possibilities-hopes/ (accessed on 1 October 2019).
Figure 1.
The components of the Augmented Reality (AR) System2.1. The AR device.
Figure 1.
The components of the Augmented Reality (AR) System2.1. The AR device.
Figure 3.
Basic elements of wireless sensors and connections.
Figure 3.
Basic elements of wireless sensors and connections.
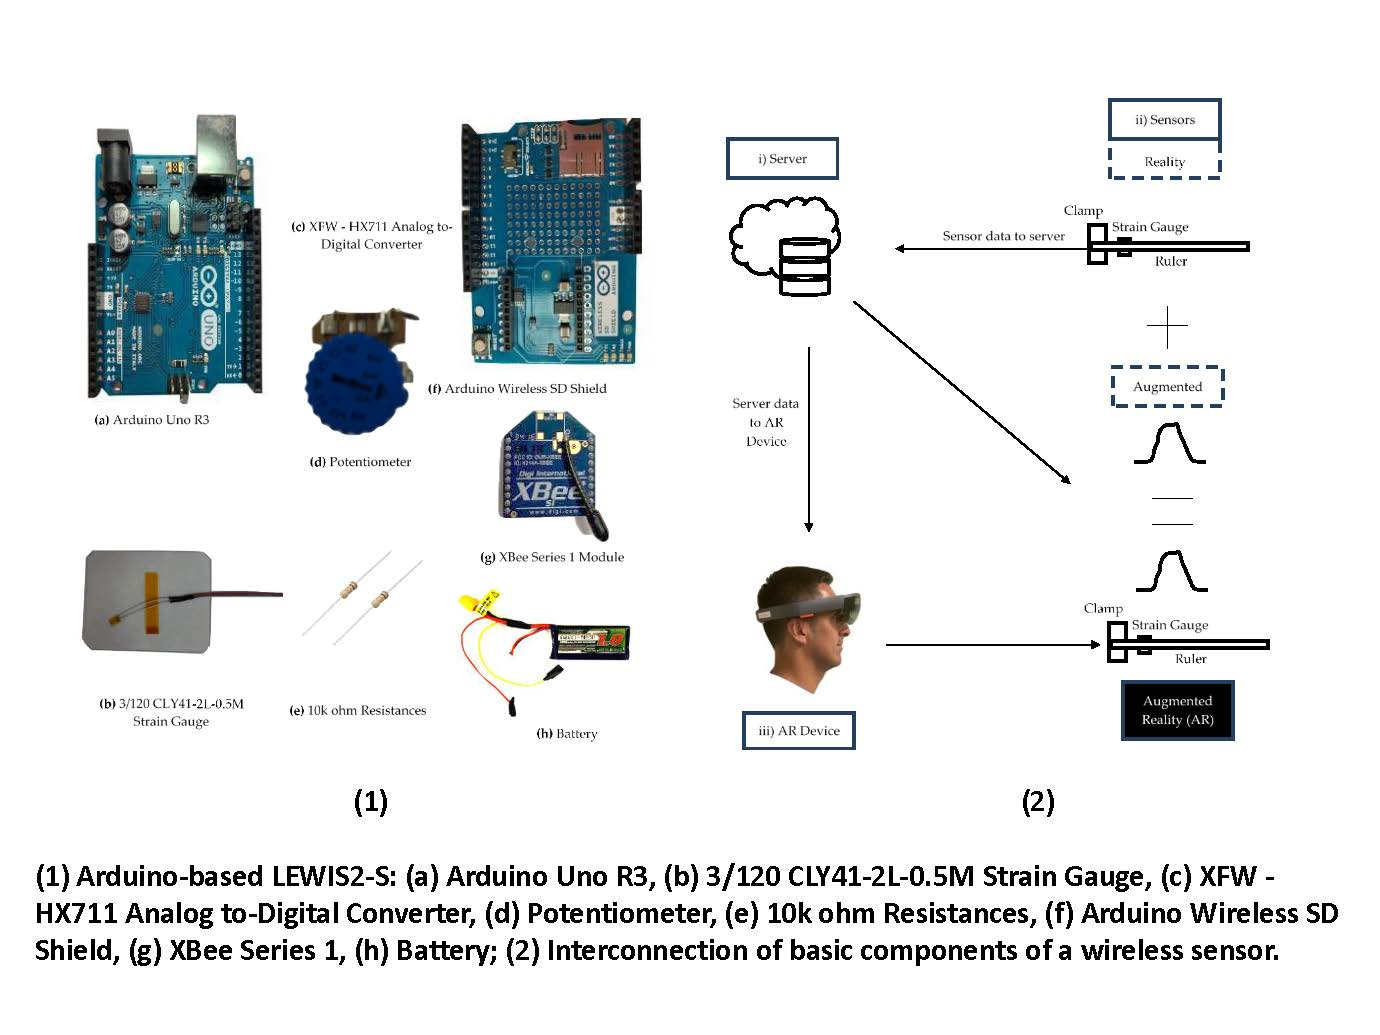
Figure 4.
Components of the Arduino-based strain gauge: (a) Arduino Uno R3, (b) 3/120 CLY41-2L-0.5M Strain Gauge, (c) XFW-HX711 analog to digital converter, (d) potentiometer, (e) 10k ohm resistances, (f) Arduino Wireless SD Shield, (g) XBee Series 1, (h) battery.
Figure 4.
Components of the Arduino-based strain gauge: (a) Arduino Uno R3, (b) 3/120 CLY41-2L-0.5M Strain Gauge, (c) XFW-HX711 analog to digital converter, (d) potentiometer, (e) 10k ohm resistances, (f) Arduino Wireless SD Shield, (g) XBee Series 1, (h) battery.
Figure 5.
Connection between Augmented Reality and sensors.
Figure 5.
Connection between Augmented Reality and sensors.
Figure 6.
Hardware components.
Figure 6.
Hardware components.
Figure 7.
Software components.
Figure 7.
Software components.
Figure 8.
Experimental set-up for loading.
Figure 8.
Experimental set-up for loading.
Figure 9.
Theoretical strain definition.
Figure 9.
Theoretical strain definition.
Figure 10.
Experimental measurements compared to the values of theoretical measurements.
Figure 10.
Experimental measurements compared to the values of theoretical measurements.
Figure 11.
Errors in the experimental measurements compared to the values of theoretical measurements.
Figure 11.
Errors in the experimental measurements compared to the values of theoretical measurements.
Figure 12.
(a) Strain visualized in the AR device, (b) graph that is seen by the viewer.
Figure 12.
(a) Strain visualized in the AR device, (b) graph that is seen by the viewer.
Table 1.
Cost of Nanotech 1.0 battery components (Nanotech, 2018).
Table 1.
Cost of Nanotech 1.0 battery components (Nanotech, 2018).
| Element | Description | Price, $ |
|---|
| Arduino Uno R3 | Microcontroller | $4.00–$25.00 |
| Arduino Wireless SD Shield | Comm. XBee S1 Module Arduino Uno R3 | $15.00 |
| XFW-HX711 | Analog to digital converter | $3.13 |
| Potentiometer | Potentiometer | $0.90 |
| Resistances | 10k ohm resistances | $0.07 |
| Strain Gauge | 3/120 CLY41-2L-0.5M | $9.99 |
| XBee Series 1 Module | Wireless transmission module | $25.00 |
| Battery | Nanotech LiPo 1000 mAh rechargeable battery | $6.33 |
| | Total | $64.42–$85.42 |
Table 2.
Cost comparison between the existing and proposed architecture.
Table 3.
The known values such as material and sectional properties of the ruler.
Table 3.
The known values such as material and sectional properties of the ruler.
| Parameters | Given Values |
|---|
| Young’s modulus of elasticity (E) | 2.03 E07 gm/mm2 |
| Length of strain gage from point load (L1) | 70 mm |
| Total length of cantilever ruler (L2) | 140 mm |
| Thickness of ruler (t) | 1.83 mm |
| Width of ruler (d) | 26 mm |
Table 4.
Cantilever dimensions.
Table 4.
Cantilever dimensions.
| Dimension | (mm) |
|---|
| L1 | 70 |
| L2 | 140 |
| Ruler thickness | 1.83 |
Table 5.
Theoretical strain using imposed loads from Equation (1) and experimental strain from the sensor.
Table 5.
Theoretical strain using imposed loads from Equation (1) and experimental strain from the sensor.
| Weight (g) | Load (N) | Theoretical Strain | Experimental Strain |
|---|
| 270.6 | 2.652 | 6.22 × 10⁻⁵ | 7.03 × 10⁻⁵ |
| 409.6 | 4.014 | 9.42 × 10⁻⁵ | 9.71 × 10⁻⁵ |
| 697.9 | 6.839 | 16.05 × 10⁻⁵ | 16.32 × 10⁻⁵ |
| 723.8 | 7.093 | 16.64 × 10⁻⁴ | 17.00 × 10⁻⁵ |
| 1129.3 | 11.067 | 25.97 × 10⁻⁴ | 26.68 × 10⁻⁵ |
Table 6.
Observed maximum and minimum values for loading of 697.9 g weight.
Table 6.
Observed maximum and minimum values for loading of 697.9 g weight.
| Observed Load Case | Loading (697.9 g) |
|---|
| Maximum | 2078 × 10−7 |
| Minimum | 446 × 10−7 |
| Difference | 1632 × 10−7 |
© 2020 by the authors. Licensee MDPI, Basel, Switzerland. This article is an open access article distributed under the terms and conditions of the Creative Commons Attribution (CC BY) license (http://creativecommons.org/licenses/by/4.0/).


