1. Introduction
Water scarcity and quality are very issues discussed often in society, because they have been affected by the degradation caused by human beings—unrestrained pollution and its misuse in the world as a whole. Still, these issues are always in evidence because, although 71% of the Earth’s surface is covered by water, only 2.5% is freshwater, as highlighted elsewhere [
1]. The use of water by mankind depends on the acquisition, treatment, and distribution. In this context, it is important to search for alternative forms of water acquisition for consumption, such as rainwater [
2]. However, the preservation of lagoons and tides has been potentially worrying as, besides compromising water quality, it also compromises underwater life—a source of livelihood for many people.
The traditional process of monitoring water quality is basically composed of two steps—a manual collection of water samples at each time interval and laboratory analysis [
3].
The National Water Agency of Brazil (NWA) operates a basic water quality network with 1340 points, nationwide, analyzing basic parameters such as pH, dissolved oxygen, and temperature. These parameters are obtained automatically by means of multiparametric probes, which are put in contact with water, avoiding collection, transport, and analysis of samples in laboratories. In addition, the monitoring of water quality in Brazil is carried out by a variety of state environmental and water resources agencies, sanitation companies, and companies in the electricity sector [
4]. Additionally, according to the National Water Quality Assessment Program (NWQP) [
4], however, there are no standardized procedures for collection, the frequency of collection, and analysis of information, which impairs the comparison of results and the sharing of experiences.
Due to this lack of standardization regarding the number of collection points, this methodology can cause a significant variability, depending on the number of collection points, between the calculated and the actual results. In order to overcome this problem, it is important to carry out the planning of the collection points that can effectively represent the lagoon, as well as implement its correct execution.
The variables, sample types, the frequency of sampling, and the location of collection stations should be carefully defined, according to the objectives [
5]. The hypothesis to solve the problem of collecting water at several points is a standalone, autonomous, mini-boat equipped with test sensors, to carry out the analysis at determined points (waypoints), with more accuracy than a manual collection. The aforementioned mini-boat is an autonomous mobile robot. An agent capable of navigating the environment without human intervention, based on its sensors [
6]. This type of robot is required when it is desired to explore static or dynamic environments in an autonomous way [
7].
The analysis generated by the boat promotes to society a form of application that will help to evaluate and make decisions on the use and rational use of water reserves, raising awareness and contributing to the sustainable development of the communities, as well as obtaining data for research. In this work, it has been described as the development, construction, and implementation of a robotic airboat to measure water quality in lakes.
Pandey et al. [
8] states that path planning and control of such a robot in unknown environments is a major challenge. To resolve this issue, this airboat is equipped with an autonomous navigation model, using the Inertial Navigation System (INS) and Global Positioning System (GPS). In this model, the Inertial Movement Unit (IMU) provides the trajectory, while the GPS updates the data, since the IMU alone has a limited measurement frequency. INS and GPS data are processed, to determine the distance of the coordinates, their own position, and path, with their corrected error estimates. Depending on the wind influence, the boat must navigate differently, and the rudder is positioned to correct the route, in real time. The aforementioned route is constructed from a geometric map, provided by an Application Programming Interface (API—the set of programming standards that allows the construction of applications and their use by interconnecting several functions in a site in a way that is transparent to the user) on Google Maps. According to Marinho et al [
9], mobile robotics works with topological maps (representing the connections between places in an environment which are usually represented by graphs) or geometric maps (representing the total space of navigation within a coordinate system).
Once the waypoints have been configured in the supervisory software, the boat must receive the route instructions and autonomously analyze the water quality, from samples collected at different points along the route.
Mohanty et al. [
10] considered pH, temperature, dissolved oxygen, and water transparency to assess and monitor water quality. Following this proposal, the basic parameters for water quality, in this work, were dissolved oxygen [
1,
11], Oxidation–Reduction Potential (ORP) [
1], pH [
1,
11,
12], water temperature [
1,
11,
12], and ambient temperature [
12]. With these data, several reports were generated to make decisions about the monitored water.
Borstel et al. [
13] emphasized that the amount of oxygen dissolved, as well as pH and temperature, must be monitored in real time so that, in case of abnormal concentrations of these parameters, corrective actions can be taken, since these parameters influence growth, reproduction, and feed efficiency.
The maintenance of water resources through water collection and laboratory analysis, is a key factor in the measurement of water quality. The main obstacles to the aforementioned actions are related to logistics, as it is a manual process, and the transport and storage of the samples requires strict procedures of hygiene and minimal human intervention. In addition to the lack of real-time information, the area of temporal and special monitoring is reduced, due to the limited number of sites sampled, high costs, and hard work [
3].
Thus, considering these difficulties, the main motivation for the realization of this project was to automate this process of collection and analysis. This work also sought to raise awareness of the use and maintenance of water, through technological resources concerning the water state, its importance for the environment, and local development. Along with the technological apparatus, the results of the analyses obtained serve as an environmental education tool.
The main contributions of this work were the mechanization equation of rudder navigation, use of open hardware, the definition of the mission (boat trajectory and data collection), through a friendly graphical interface, and generation of reports in real time, besides easy transport and operation.
4. Materials and Methods
Before the construction of the hull, some models (hydrofoils, catamaran, trimaran, and winecup) was studied, because the hull should house all components, besides presenting resistance and floatage. The chosen hull was the winecup model, because it has an internal space to house all electronic components. For this, it was designed as an aluminum base structure, 1.10 m long and 0.33 m wide at the stern, with decreasing width as it approached the bow. To cover the aluminum frame, a high-density cardboard was used for a better format design.
However, since cardboard is a hydrophilic, easily deteriorated material, a coating with epoxy resin and glass fiber was used to provide rigidity and to protect the structure from possible collisions with obstacles, during navigation (mission). The fiberglass mat was sized, according to the total hull volume of the boat. Each epoxy lamination process took approximately 15 min to work, after mixing with the catalyst. In this process, two layers of fiberglass mat was added.
After the lamination process, a layer of plastic mass was added to correct the imperfections, then its surface was sanded all over and an automotive paint was applied.
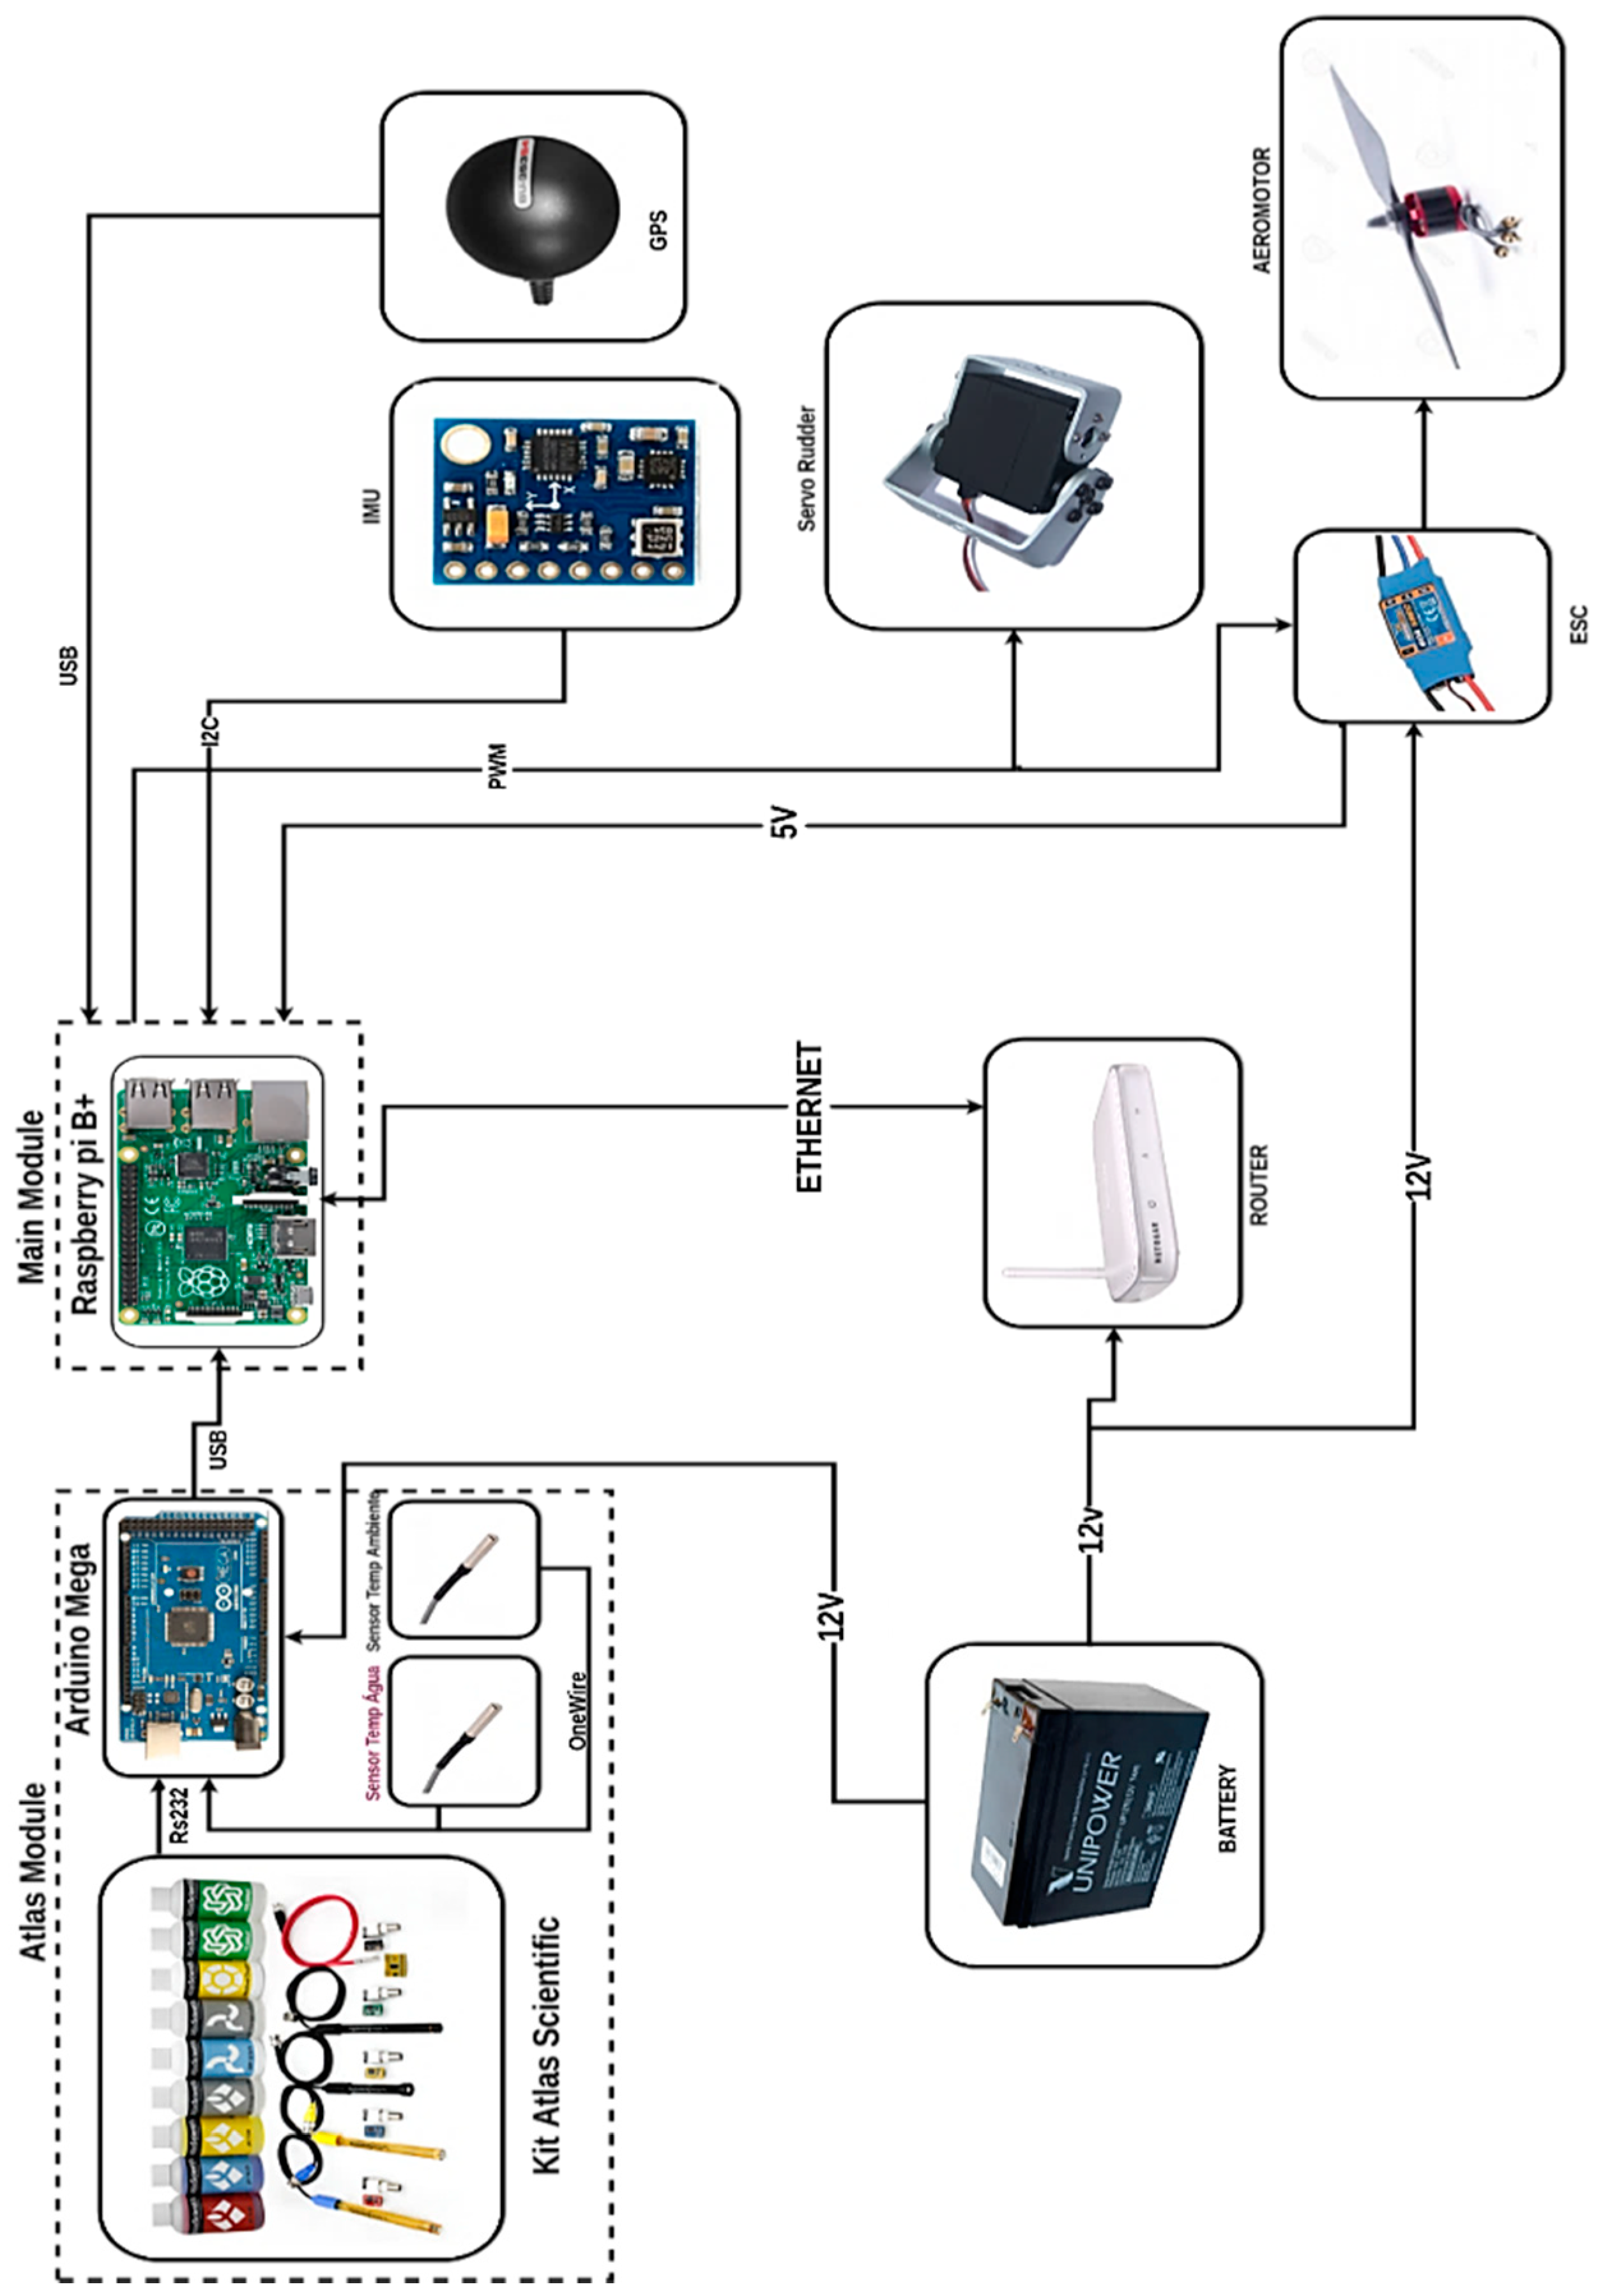
For the monitoring and collection of the physicochemical parameters of water (pH, Dissolved Oxygen, Oxidation–Reduction Potential), a sensor and probes material was acquired. They were responsible for analyzing their respective parameter, transform it into digital information, and send it to the microcontroller, in a predefined time interval. Once the data of all sensors were collected, a protocol was formatted and sent to the Raspberry Pi board, through the USB port (Universal Serial Bus). From the analyzed kits, the Atlas Scientific EZO TM Class Circuit (Atlas Scientific LLC, Long Island City, USA) was chosen, for having an affordable price, in comparison with the others and for its stability in sensor reading.
Inertial Measurement Unit (IMU) is an electronic circuit that measures the forces suffered by a body attached to it, such as angular velocity, acceleration, and the magnetic field, using a combination of accelerometers, gyroscopes, and magnetometers. They are widely used in aircraft, drones, cruise missiles, Unmanned Aerial Vehicles (UAV), and Unmanned Space Vehicles (USV). In this project, the IMU was used together with the GPS, to determine the location, displacement, and direction of the estimated autonomous navigation. Some models of IMU were researched on, such as the MPU6050 and the MPU 9150, but the GY87 (Kuongshun Electronic, Shenzhen, China) was chosen because it had some characteristics similar to the previous ones and also had a lower cost.
GPS is a satellite positioning system that provides the Latitude and Longitude, as well as other information, such as speed, date, time, and altitude, at any point on Earth. GPS is used in aviation and maritime navigation and is currently used by people who practice some extreme sports in places far away and difficult to reach, or even for urban transport [
28]. To collect these data, the BU-353S4 USB module (GlobalSat WorldCom Corporation, New Taipei, Taiwan) was used.
4.1. Vector: The Boat
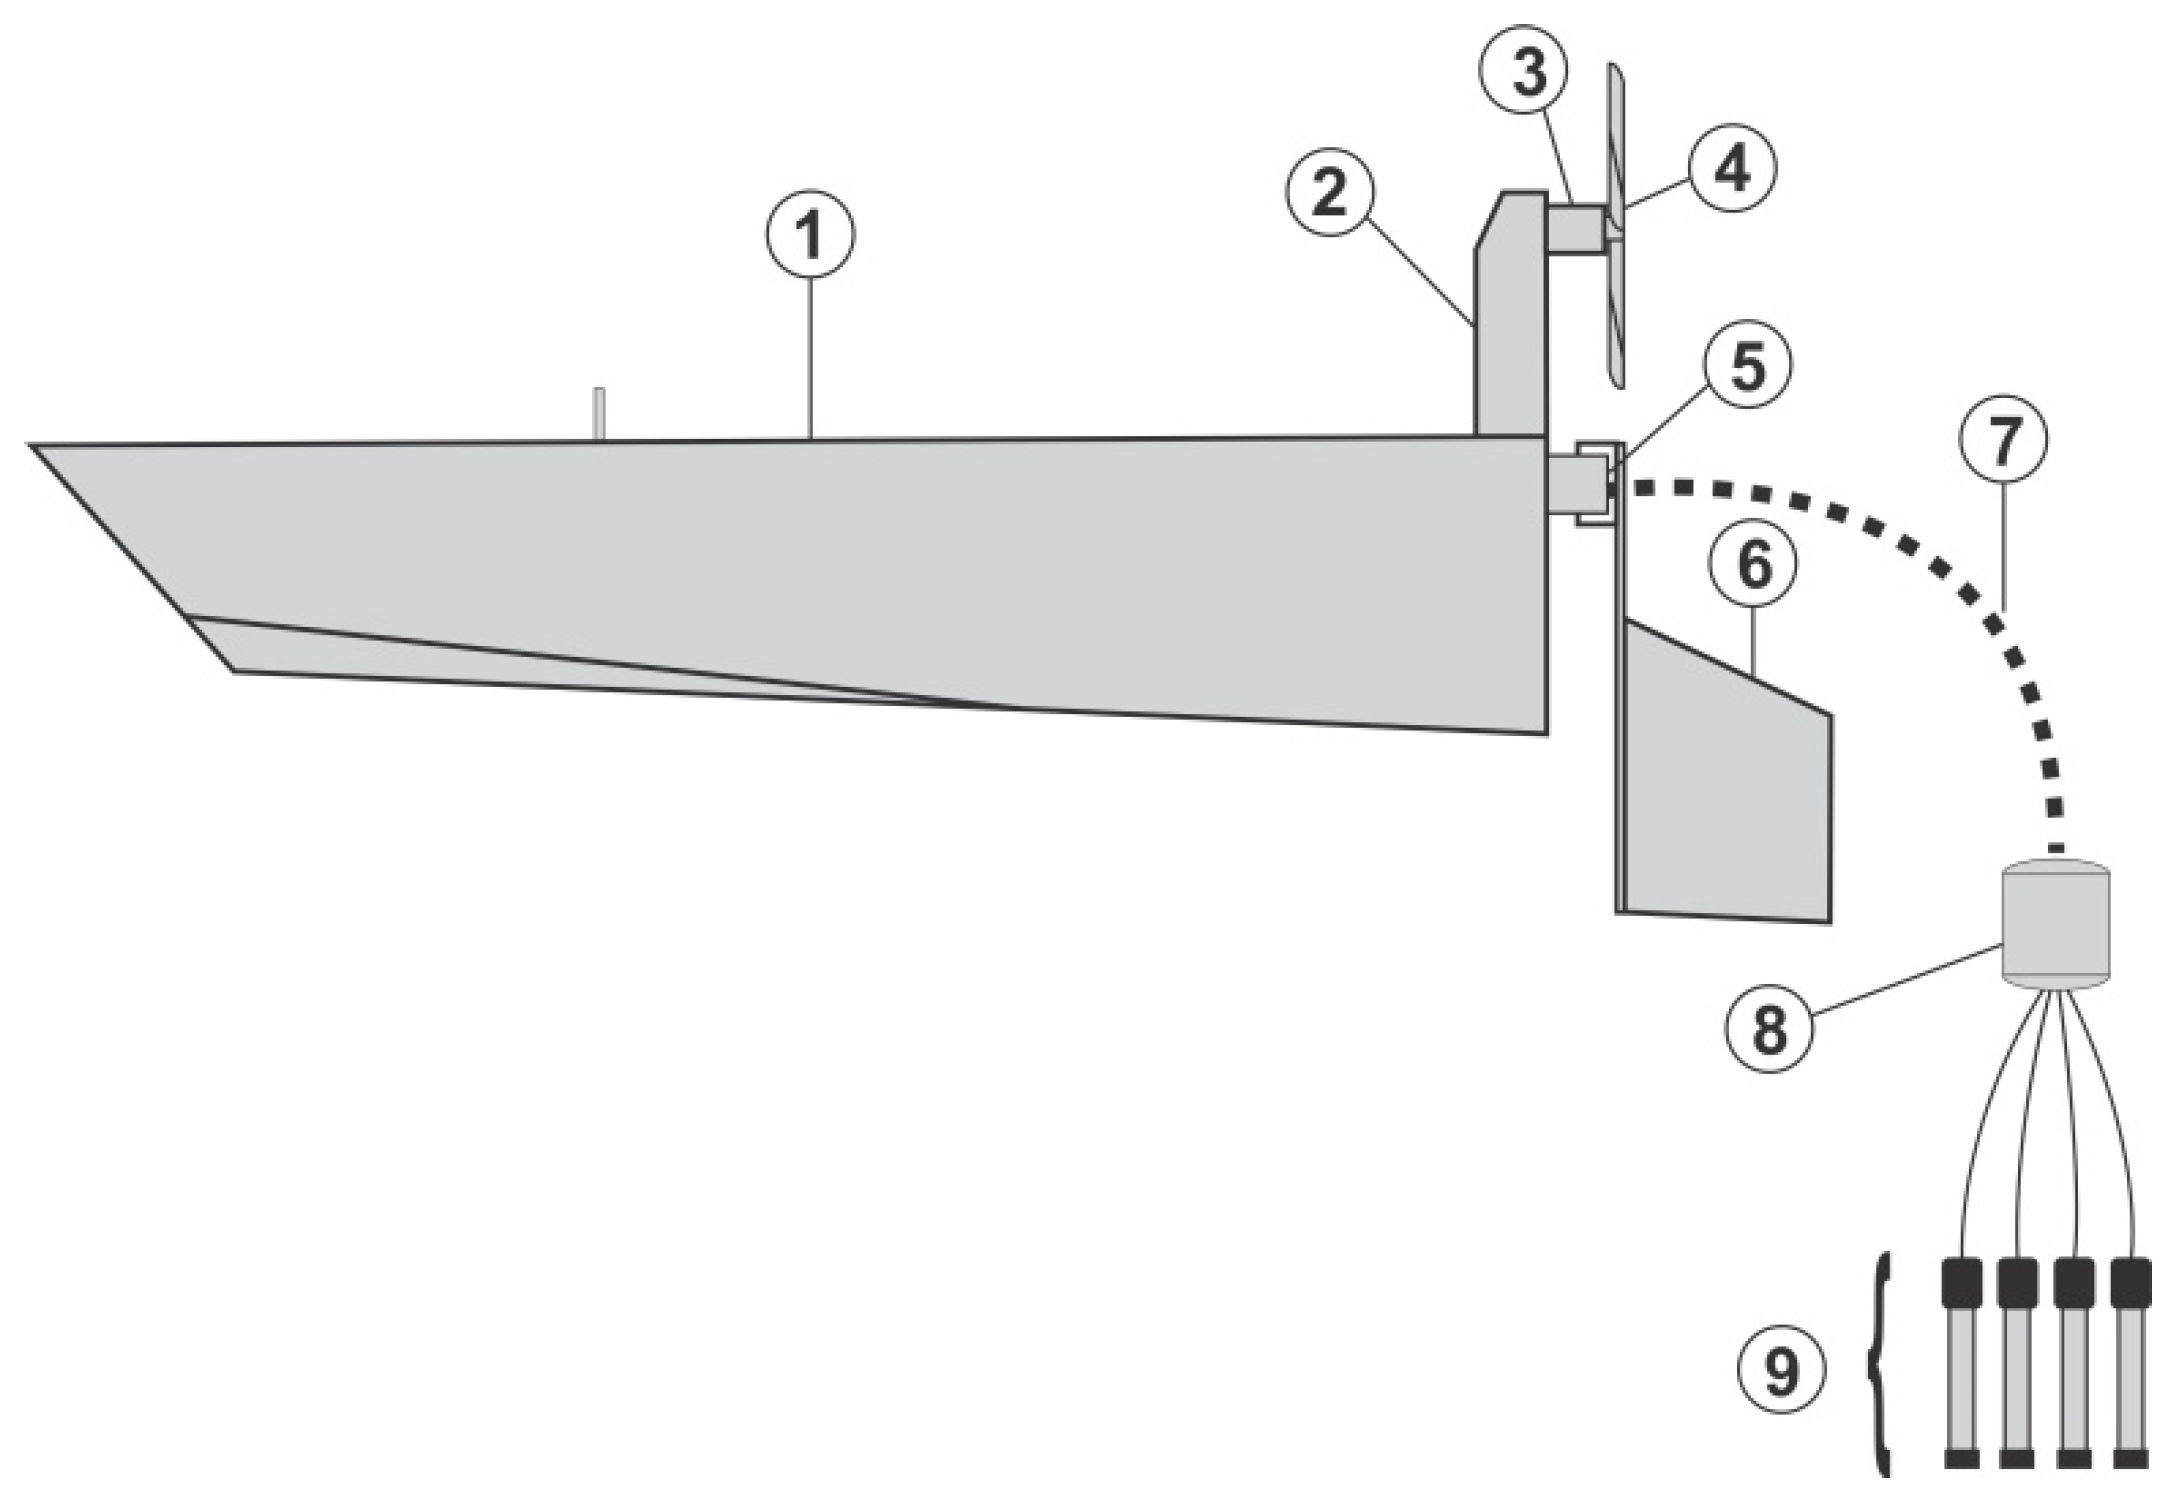
The boat developed in this work was called Vector. According to
Figure 1, the autonomous airboat for pond water quality analysis had a hull (side view), which housed the minicomputer and all electronic components (1). In (2) there was vertical support of the motor (3) and it was connected to a propeller (4). At the rear (stern), there was a servo motor (5) connected to the rudder (6). Further, from the stern comes the data cable (7) and a mini float (8), connecting the probes (9).
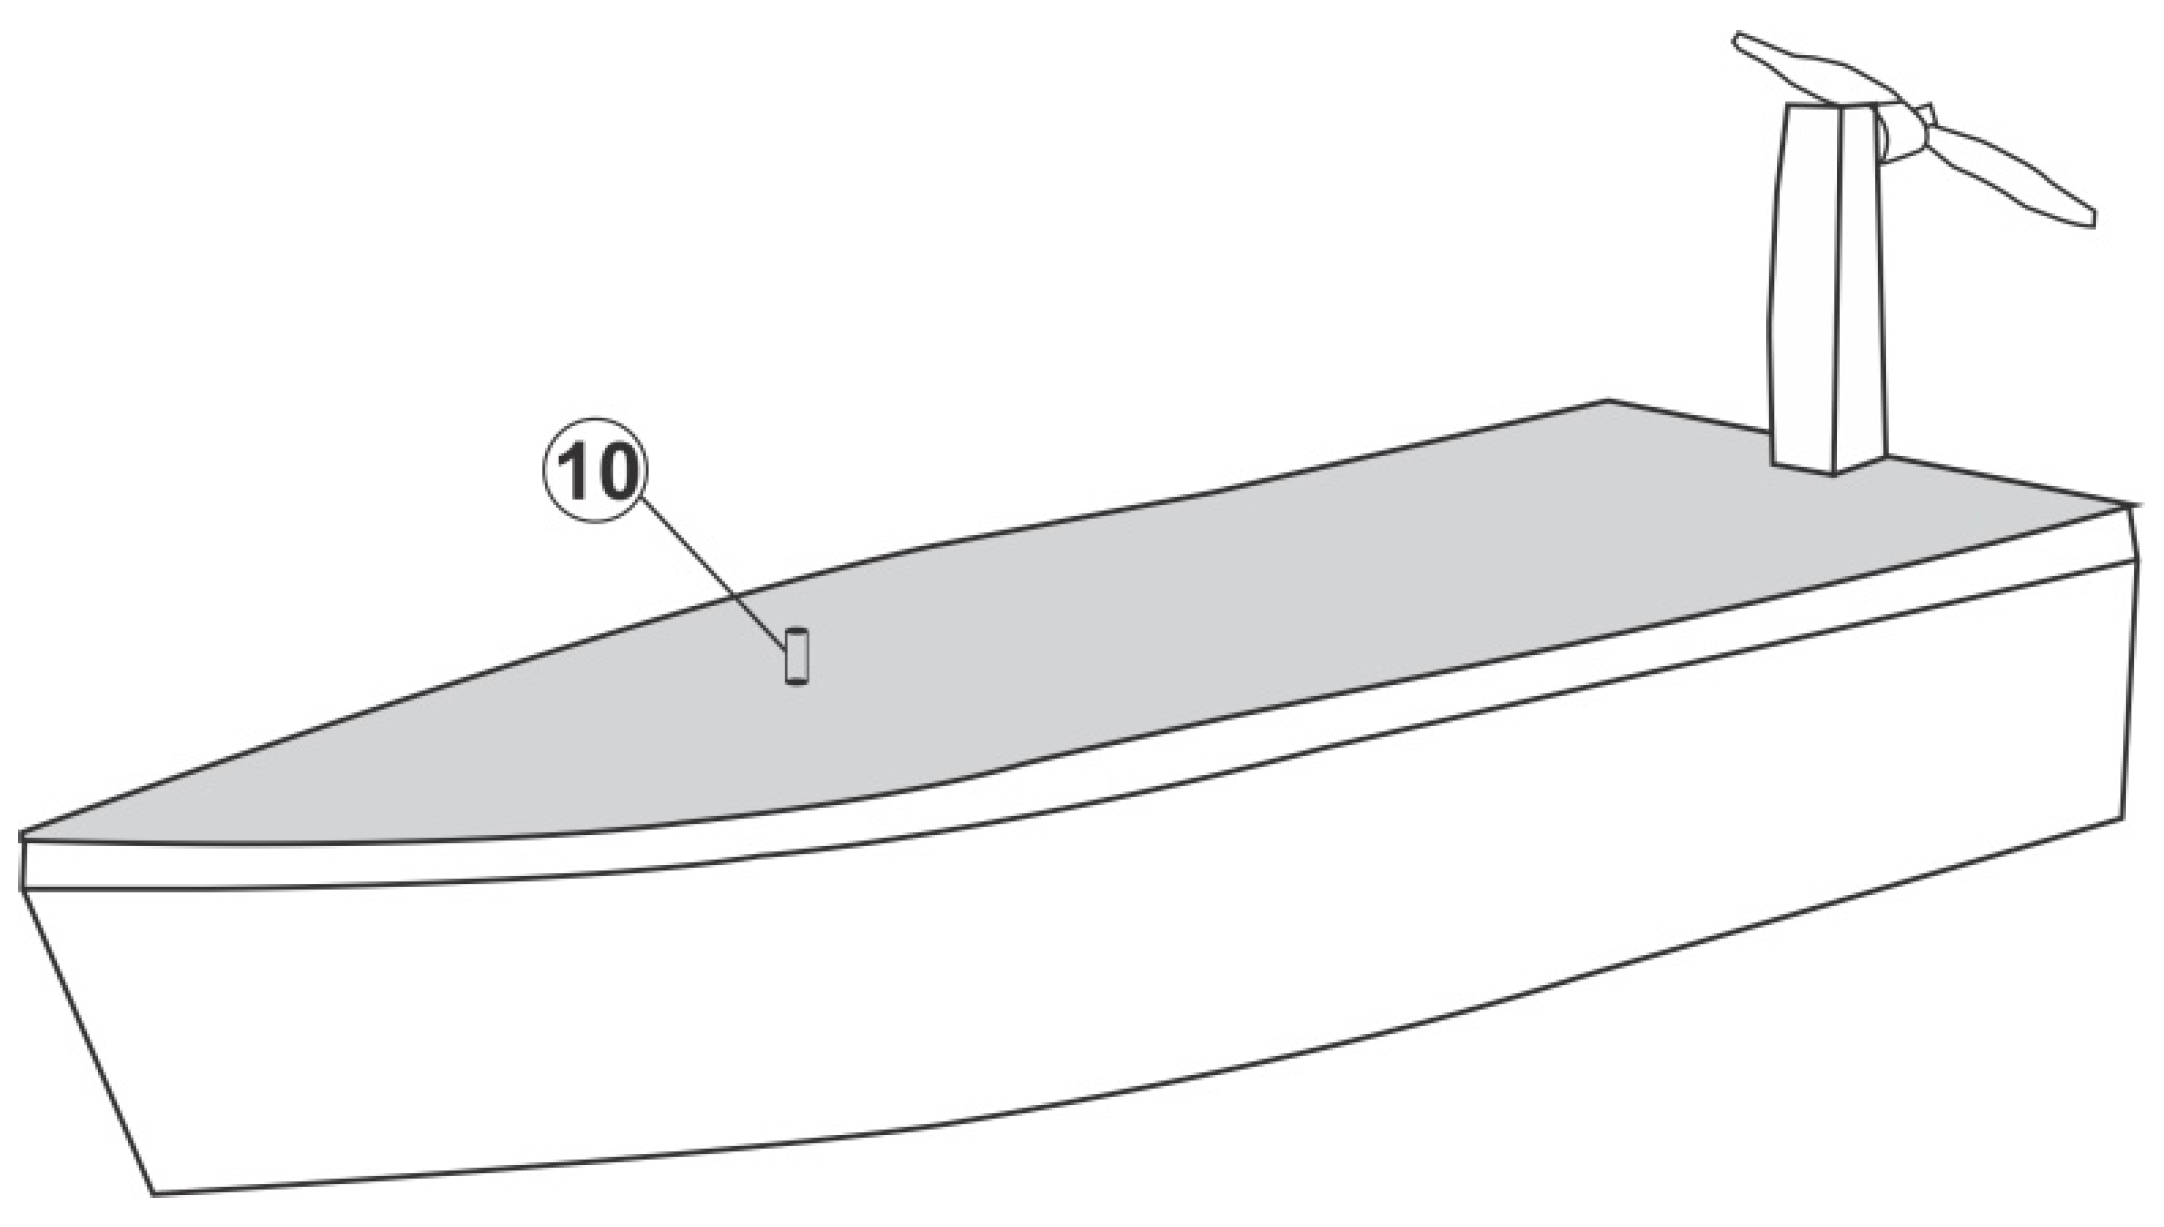
In
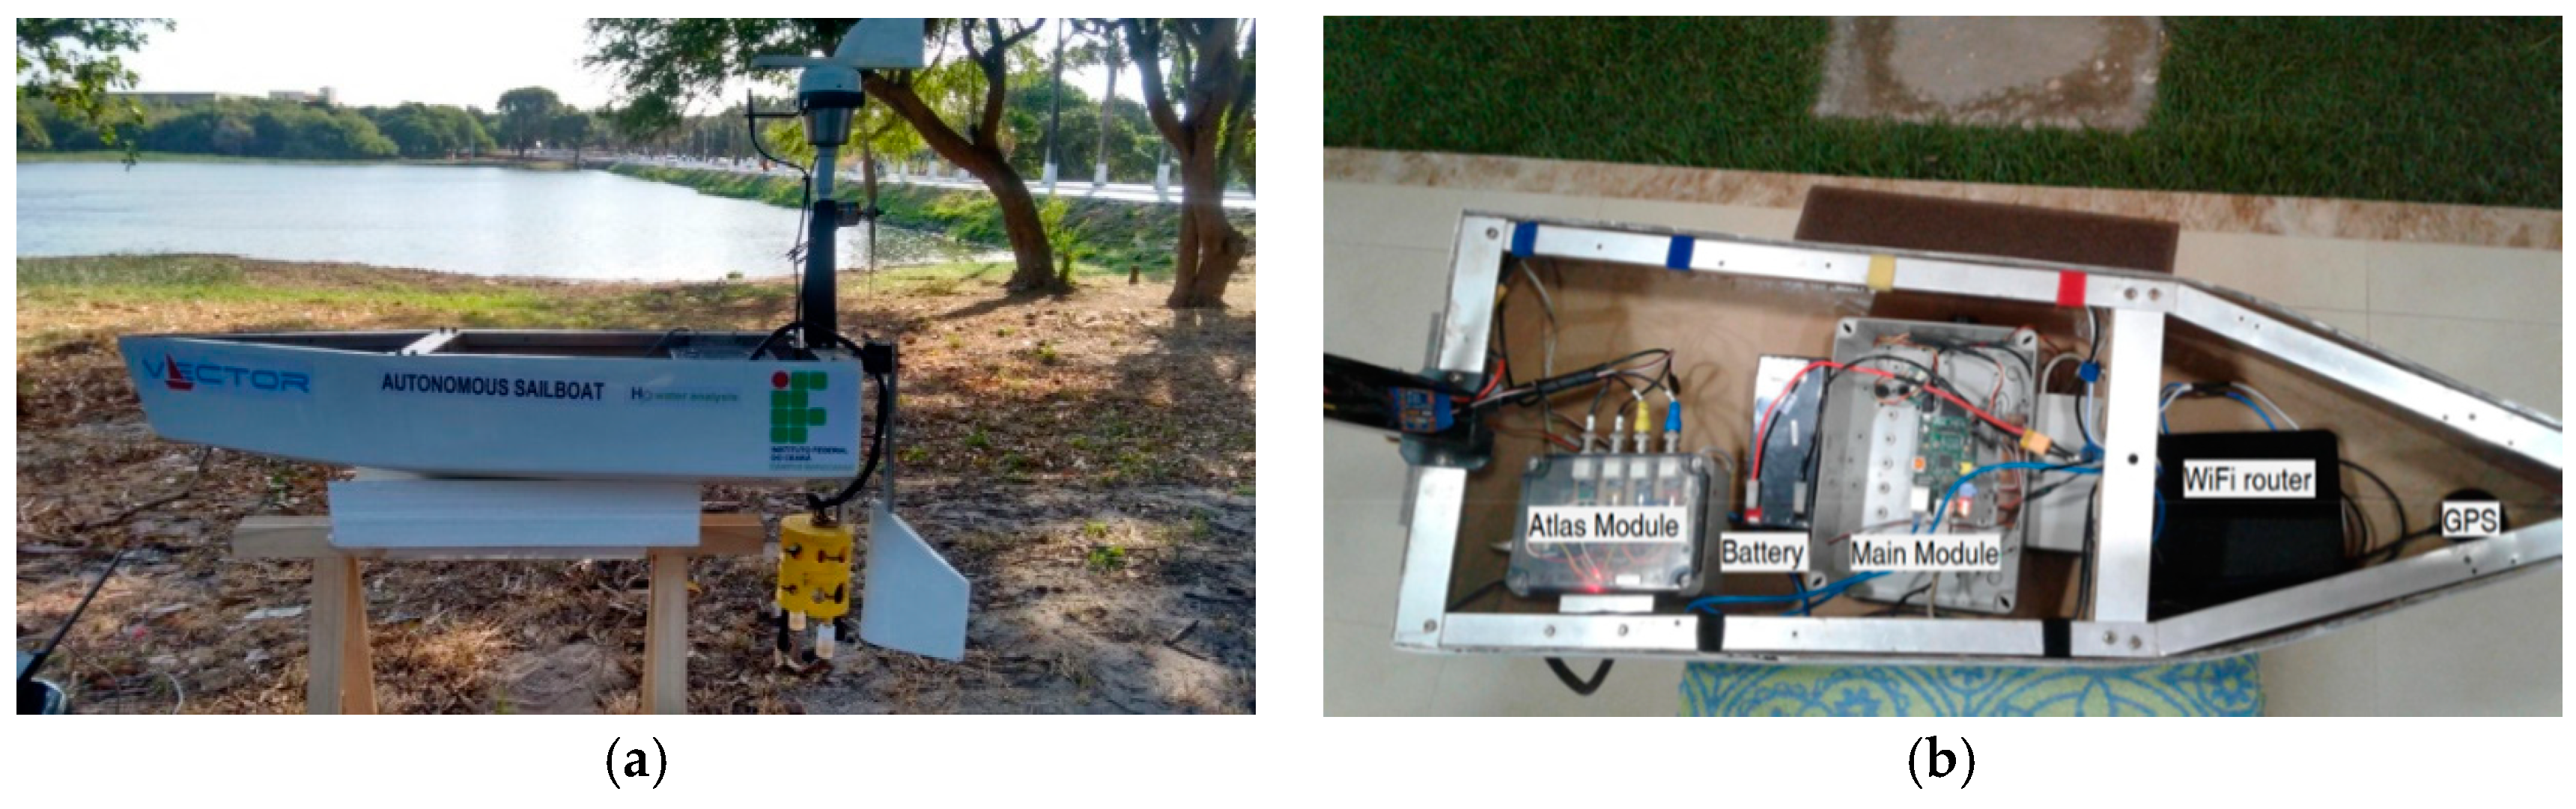
Figure 2 is a perspective view of the boat, with the external temperature sensor passing through a hole in the hull cover, for collecting the ambient temperature (10).
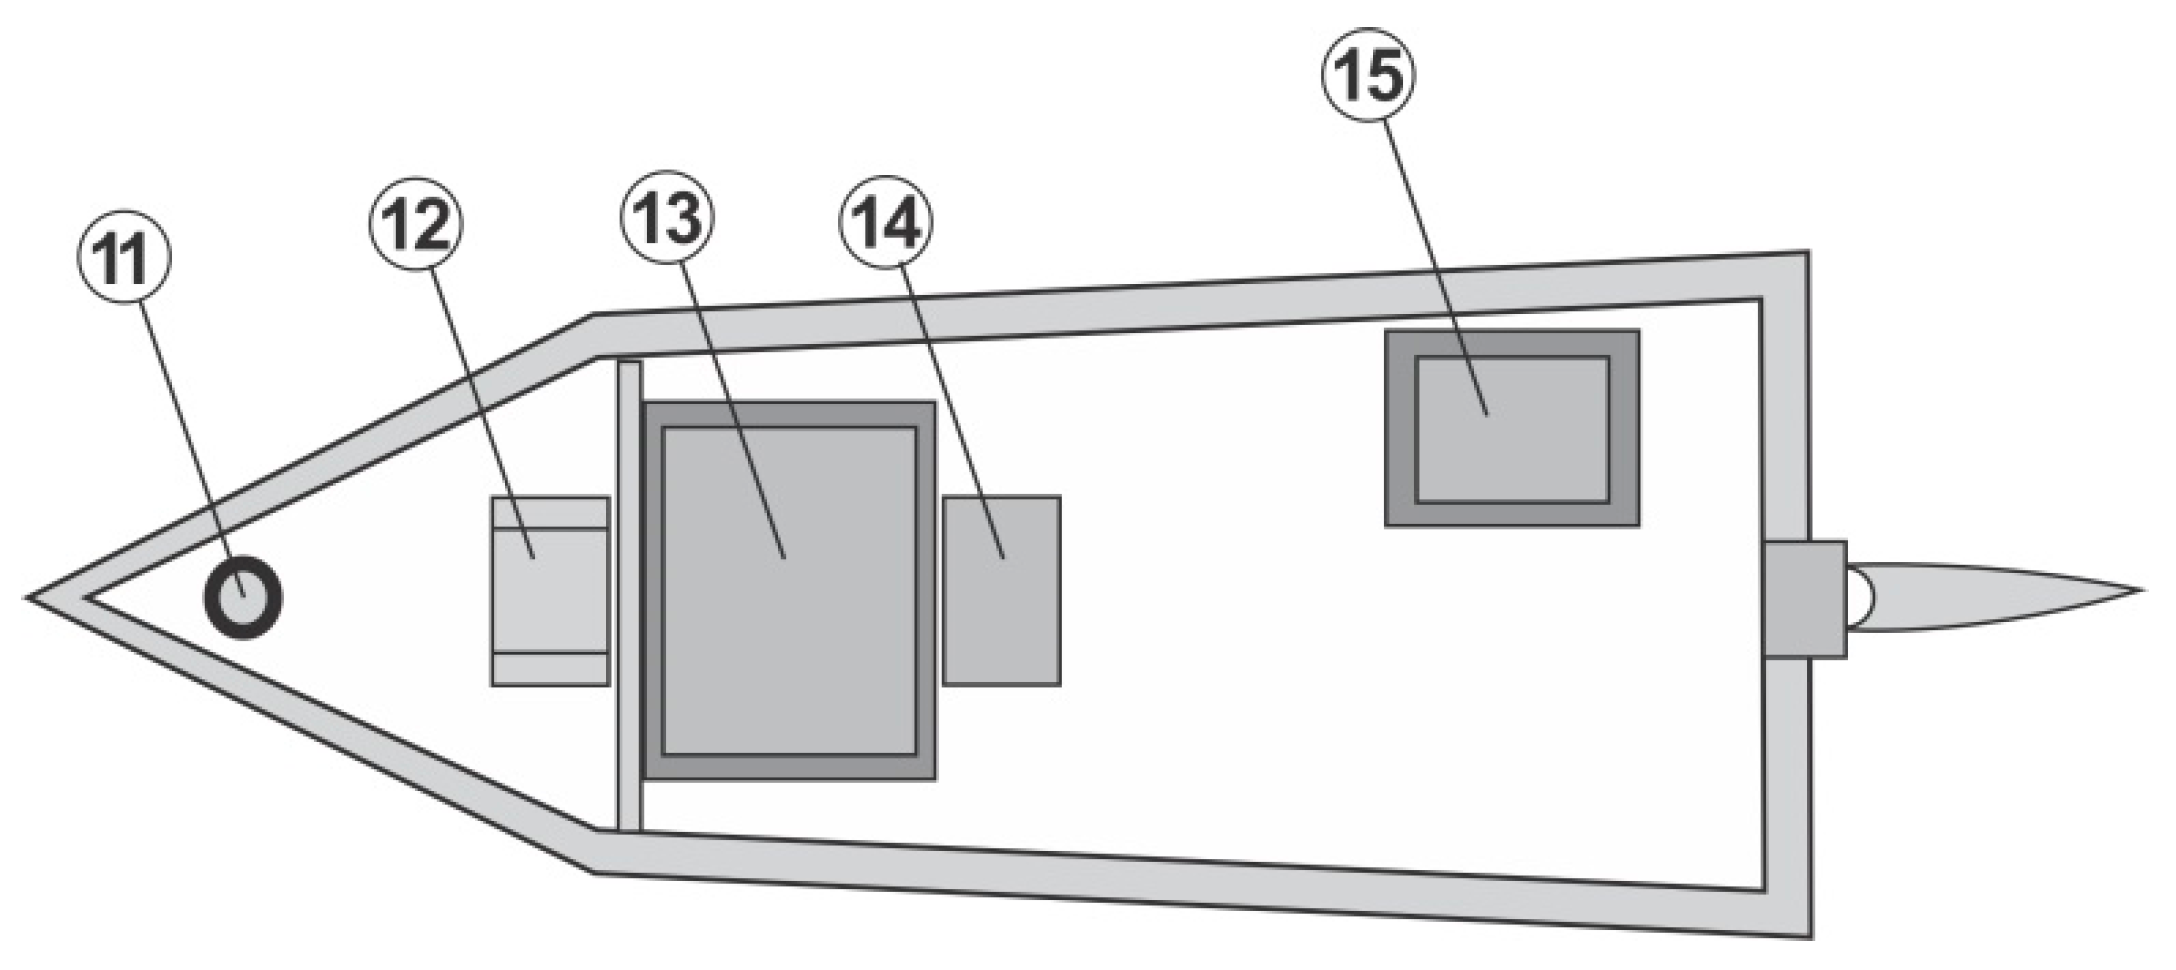
Figure 3 shows the top view of the standalone airboat, highlighting the Global Positioning Sensor—GPS (11) and the Wi-Fi Router (12). In the central part of the hull, there is the Main Module (13) where the mini-computer and the Inertial Measurement Unit (IMU) are located. In the central part, there is the battery (14). In the near part of the bow, there is the data collection and analysis module of the physicochemical sensors of the water (15).
The
Table 1 shows the features available in the Vector and compares it with the other boats discussed in this article. The electric propulsion presents an advantage in relation to wind propulsion, considering that the speed and displacement of the boat are independent of random conditions like the occurrence of winds. Communication with the boat via Wi-Fi network overcomes radio communication, mainly in terms of stability and mobility. Although Vector has fewer sensors compared to the Unmanned airboat and the USVe, several sensors and camera can be easily incorporated into the Vector. GPS and IMU are indispensable on an autonomous boat in view of the need to locate and navigate a particular route. The Vector dispenses with the use of combustibles that could cause pollution to the water body. Still, although solar energy is a renewable source, it was decided not to use it because of higher costs.
The main advantage of Vector in relation to the other boats mentioned above is in its man–machine interface, which has the latest technology, allows the user to draw the route to be traveled by marking the points in a map via mouse, and compares the desired route with the route traveled in real time. This interface allows knowing the exact location of the measurements made.
4.2. Ruder Control
The rudder is a key part of the project, as it is responsible for steering the boat. To control it electronically, a high-torque servo and metal gears are used to withstand the weight load of the boat, in port and for starboard maneuvers. Some brands such as Futaba, TowerPro, HobbyKing were tested, but they were not found to have enough torque. The model chosen was the servo RDS3115-MG (Autobotic Sdn Bhd, Kuala Lumpur, Malaysia) because, in addition to the desired characteristics, this servo had a similar cost in relation to the others.
4.3. Aerodrive and ESC
For the locomotion of the boat, an Aerodrive (motor) was used, which stayed suspended in the boat and did not have contact with the water, thus preventing the propeller from screwing with objects scattered in the water, such as plastic trash or water hyacinth, making the boat to run aground. The engine must have a thrust > 1 kg to withstand the load of the boat. The model chosen was the Turnigy D3536/5 1450KV Brushless Outrunner Motor (HobbyKing, Kwun Tong, Hong Kong), which has a thrust of 1.3 kg, enough to move the boat through the friction of the water.
In order to control the speed of the engine, safely, and allow the progressive use of available power, it was used an Electronic Speed Controller (ESC), which is very common in drones and model aircraft. This device is able to provide a speed control using dedicated integrated circuits. The model chosen for this work was the SBEC of 60 A, as it supports oversized load peaks, providing a protection for the fed circuit.
4.4. Temperature Sensor
For the calibration of the sensors, the monitoring of the temperature of the water and the environment required the acquisition of a temperature sensor that was waterproof. The DS18B20 was the chosen model as it also met the required temperature range (−55 to +125 °C), worked with OneWire Protocol (a serial protocol that uses a single line of data plus Earth reference for communication. A master initiates and controls communication with one or more slave devices on the same bus), and can connect up to 126 devices on the same bus, thus, dispensing more wires from the circuit to the monitoring point.
4.5. Arduino
Arduino is a free hardware platform designed with a single-board Atmel AVR microcontroller, with built-in input/output support and a C/C++ based language. Arduino family of boards have several models with a number of different I/O pins. In this paper, the only board that meets the requirements is the model Arduino Mega 1280 (Arduino, Turim, Italy), which is used in the module that makes the readings of water quality parameters, along with the Atlas Scientific sensors. Arduino Mega features an ATmega1280 processor with a 16 MHz clock, which incorporates an increased memory capacity and input and output data, and was built by using the Surface Mount Technology (SMT).
Mega Sensor Shield
Shields are expansion boards that can be attached in Arduino. It can contain sensors or actuators and specific functionalities. Mega Sensor Shield enables to connect various sensors to its 54 I/O ports. This board was used in the design for interfacing with the Atlas Scientific sensors.
4.6. Raspberry Pi
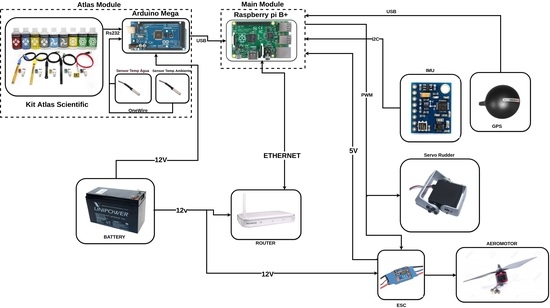
Raspberry Pi (RPI) is a small computer that presents itself as a potent solution to the problem of data processing in embedded systems, due to its high data processing power, when compared to other solutions like Arduino, NodeMCU, Atmegas microcontrollers, or PICs (Peripheral Interface Controller). RPI is distributed by the Raspberry Pi Foundation and has a platform based on a small integrated circuit of the type SOC (a chip with a system capable of containing processor, memory, and even video), which covers all the internal components necessary for the operation of a computer. The RPI model used in the project is B+, since new improvements were incorporated in relation to the previous version, such as the application of two voltage regulators (step-down) to 3.3 V and 1.8 V, allowing the integration of low-voltage sensors. The 5V voltage regulator features polarity protection and a 2 A fuse, plus a new USB/Ethernet controller. The addition of two USB ports, plus GPIO (General Purpose Input/Output) pins, provides an improvement in the use of the Micro SD memory cards, with a lower power consumption, and a better audio quality.
Figure 4 shows all the components housed inside the hull of the boat and the final architecture of the boat-mounted hardware can be seen in
Figure 5.
4.7. Methodology
First, the software embedded in the boat was loaded into some computerized device, equipped with a Wi-Fi connection, then the mission was named and the waypoints were determined by the operator. Once these configurations were made, the boat was put into the water and remotely activated to start the mission, autonomously, doing the physical-chemical analysis of water and storing it in the database associated with its Latitude and Longitude coordinates. At the end of the mission, the boat returned, automatically turned-off the aerodrive, and the operator could generate reports with the data collected.
The system used commonly purchased components, such as cardboard and fiberglass, as well as Arduino open source hardware and software, and a Raspberry Pi minicomputer, which provided easy integration and modification of the software and firmware, during the verification and validation tests. In the first step, the hull of the boat was built and checked for buoyancy.
In the second step, all the hardware material necessary for the electronic and mechanical control of the boat was listed. The acquired measurement sensors of the water parameters, carried out the calibration of the Atlas sensors, using the Arduino platform, which occurred satisfactorily, based on the values of its calibration solutions with small variations of two points. Then it conducted tests with the IMU, the GPS, the servo of the rudder, the aerodrive, and the temperature sensor in the plate Raspberry Pi. In this phase, the protocol for communication with the sensors was developed.
In the third step, the control software with access to the database was developed, which provided a greater control and monitoring of the boat’s functionality, from the configuration of the mission to the generation of reports.
For initial tests, the system was operated remotely and manually, where the route was random and determined during the mission. During the route, the boat carried out the analyses and stored them in a database. The reports were then validated, in order to generate graphs of the collected points.
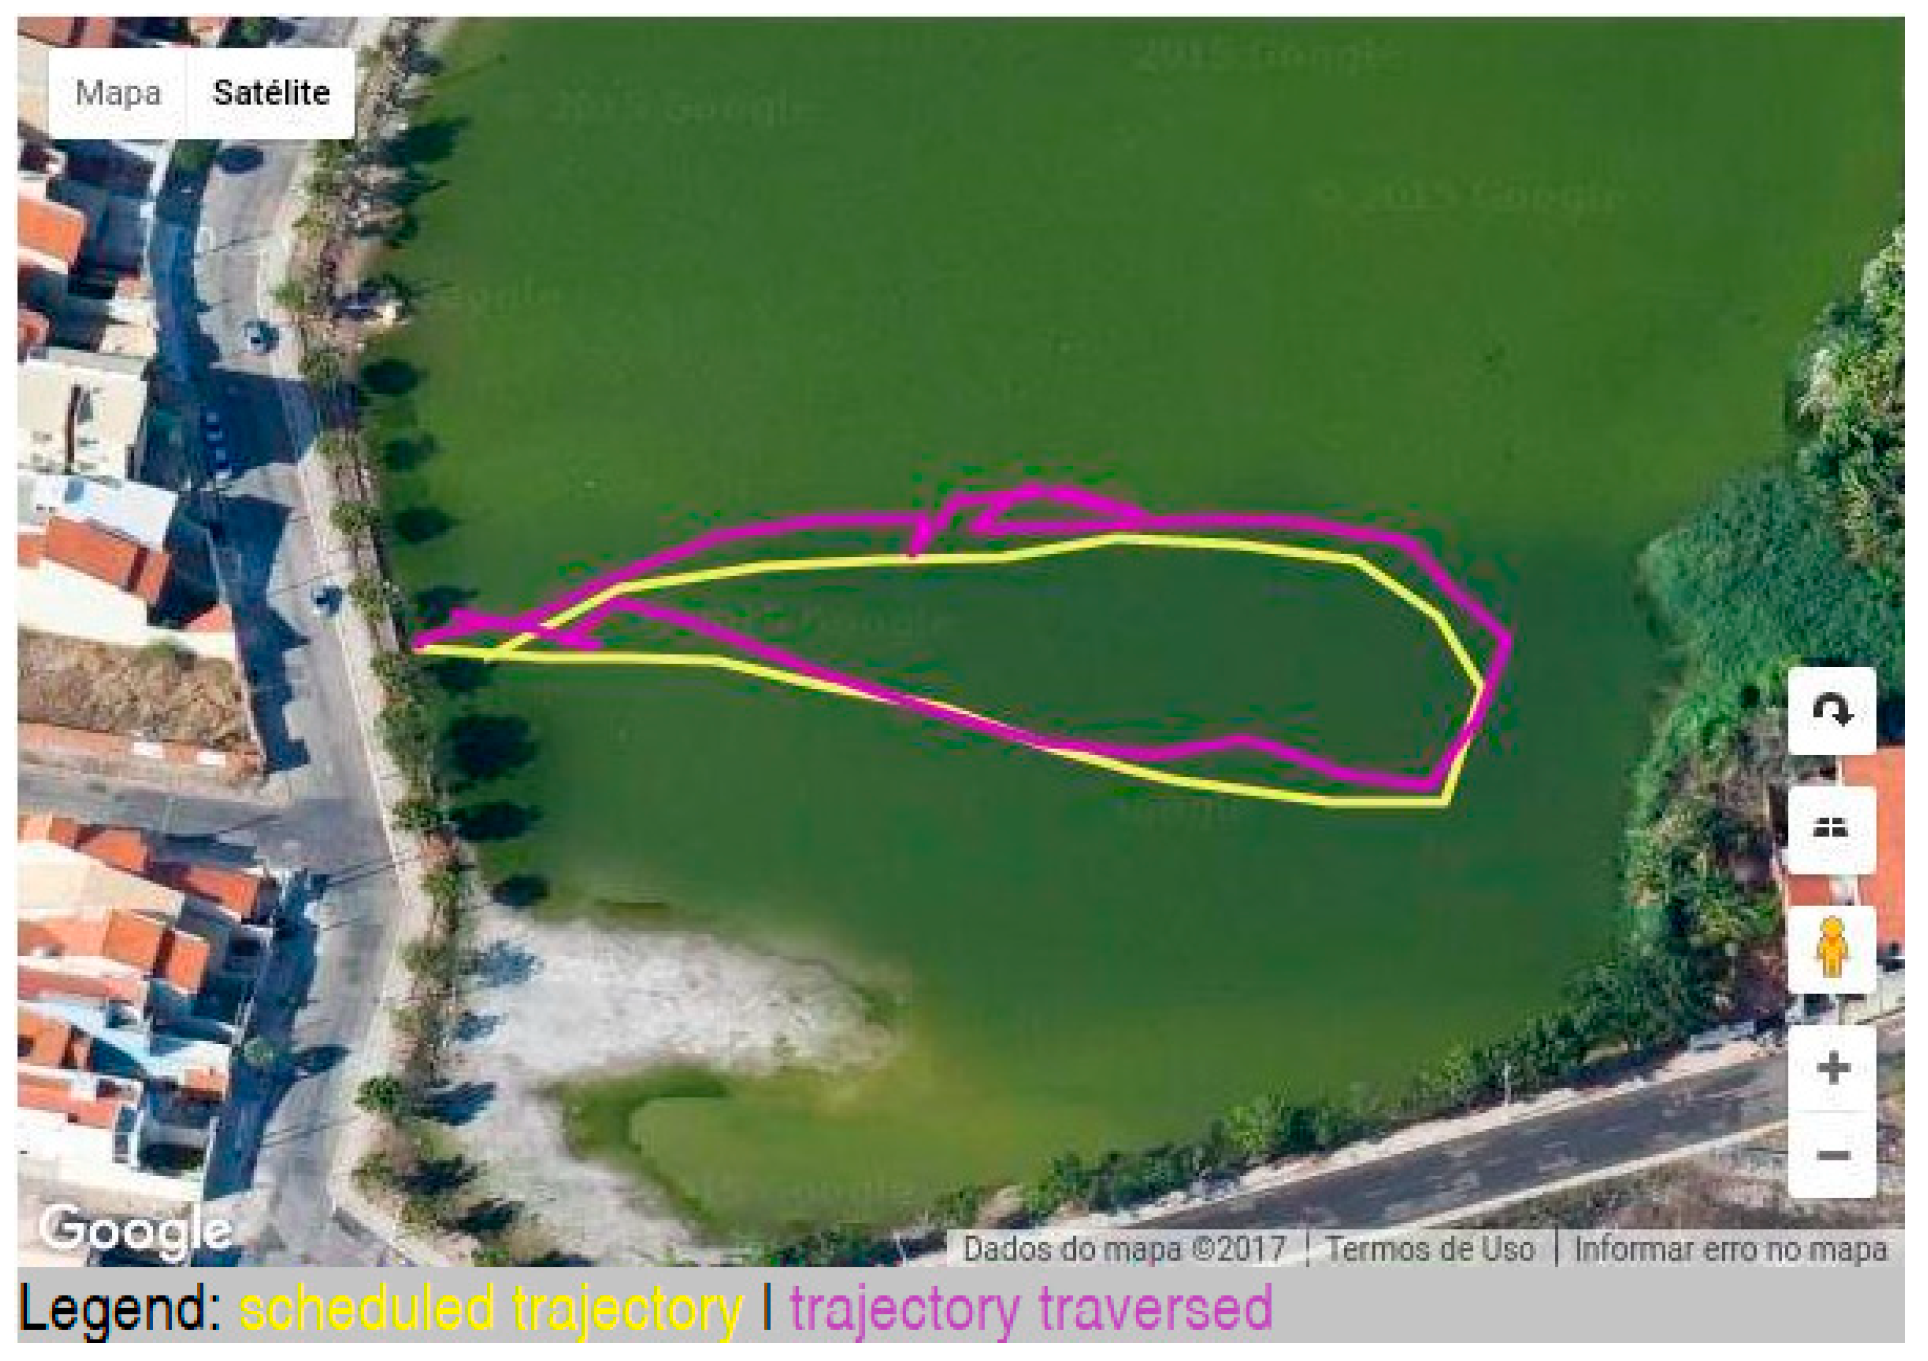
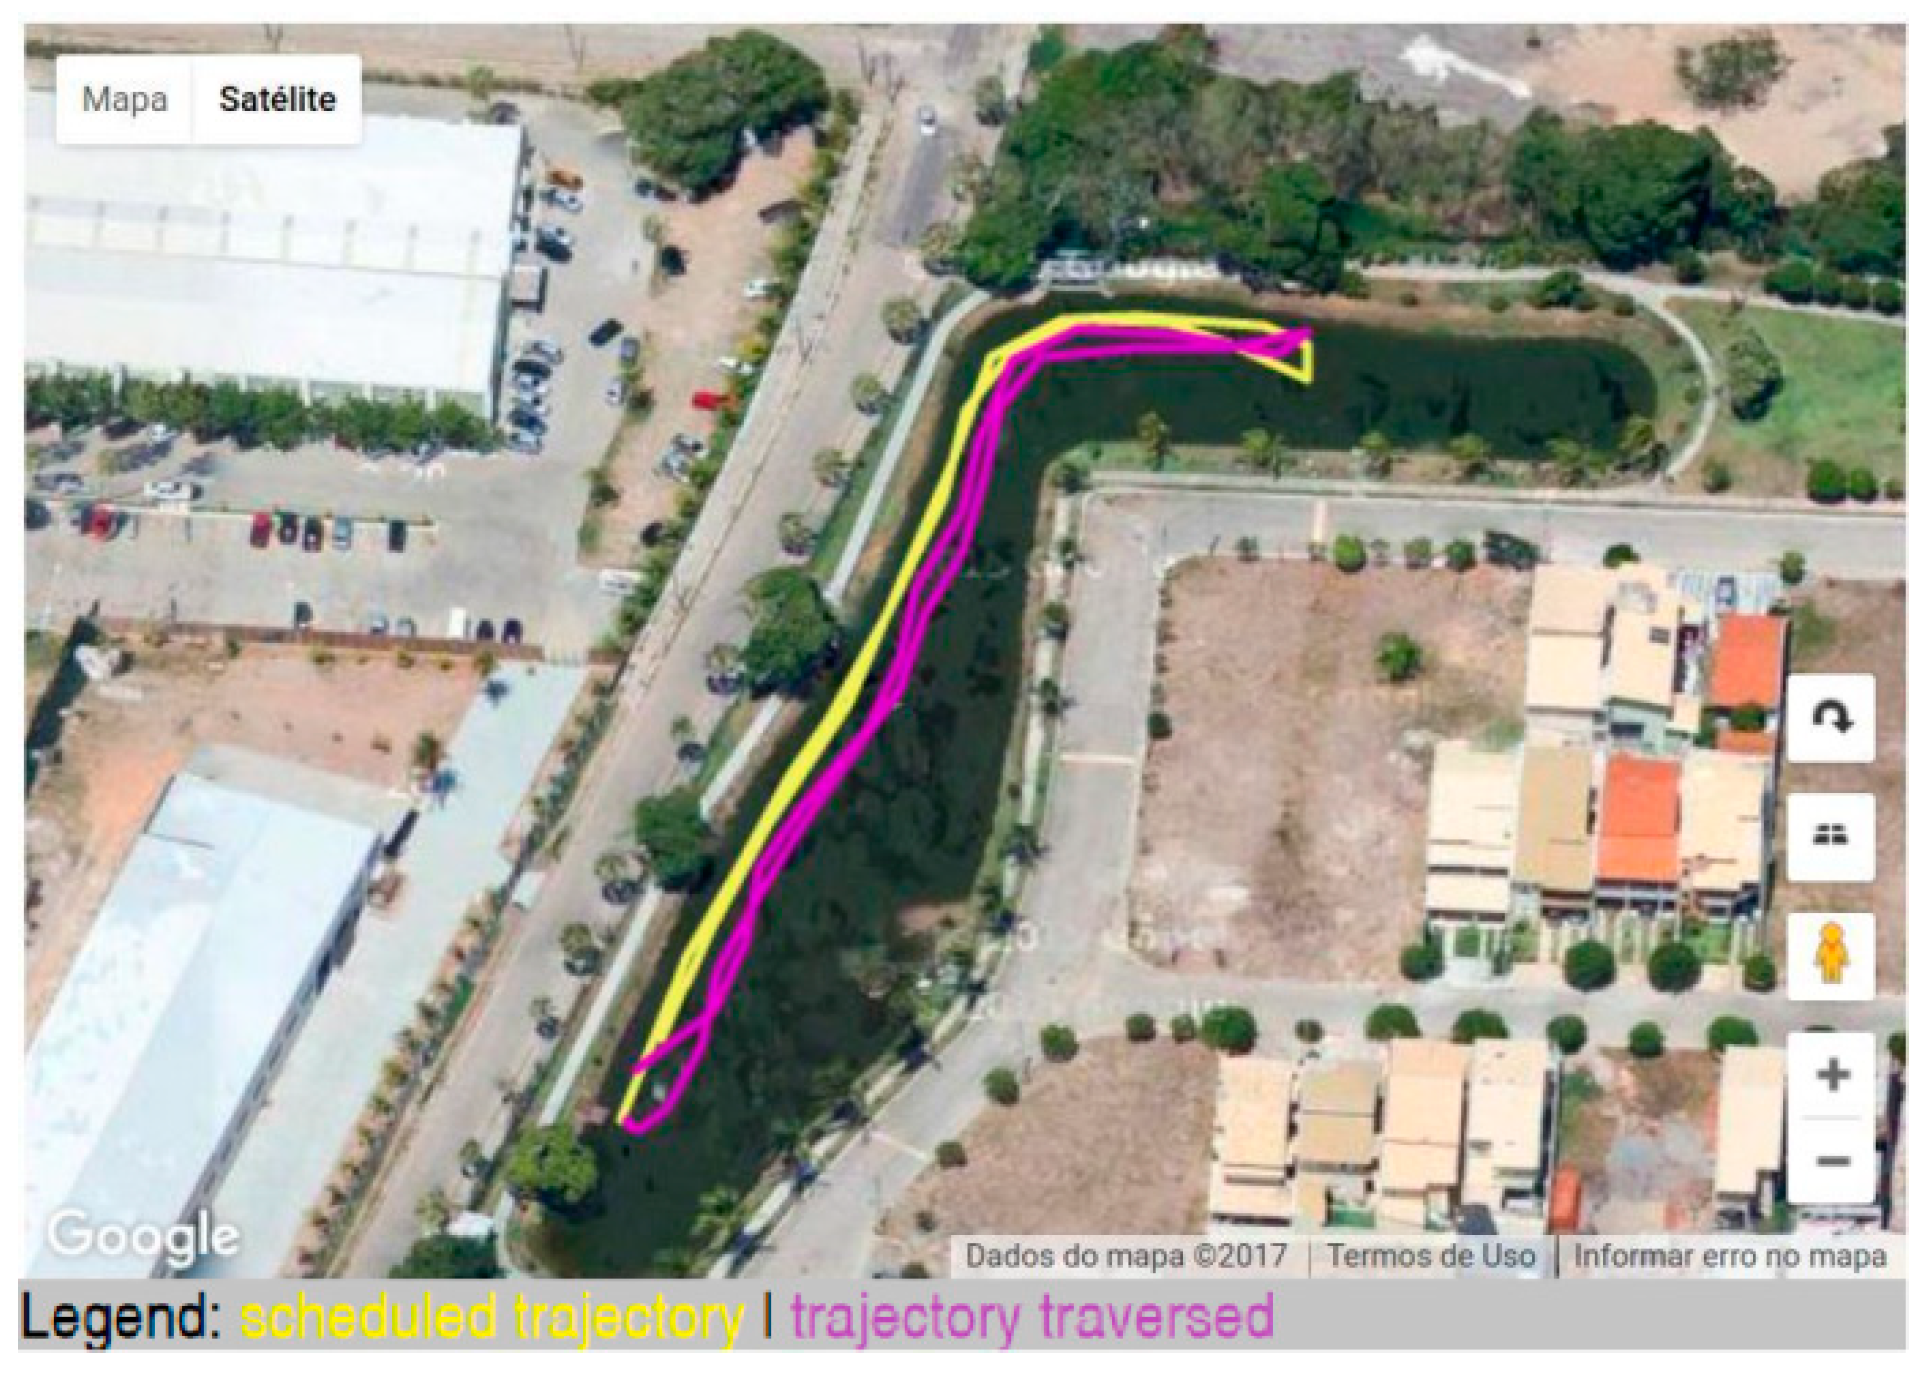
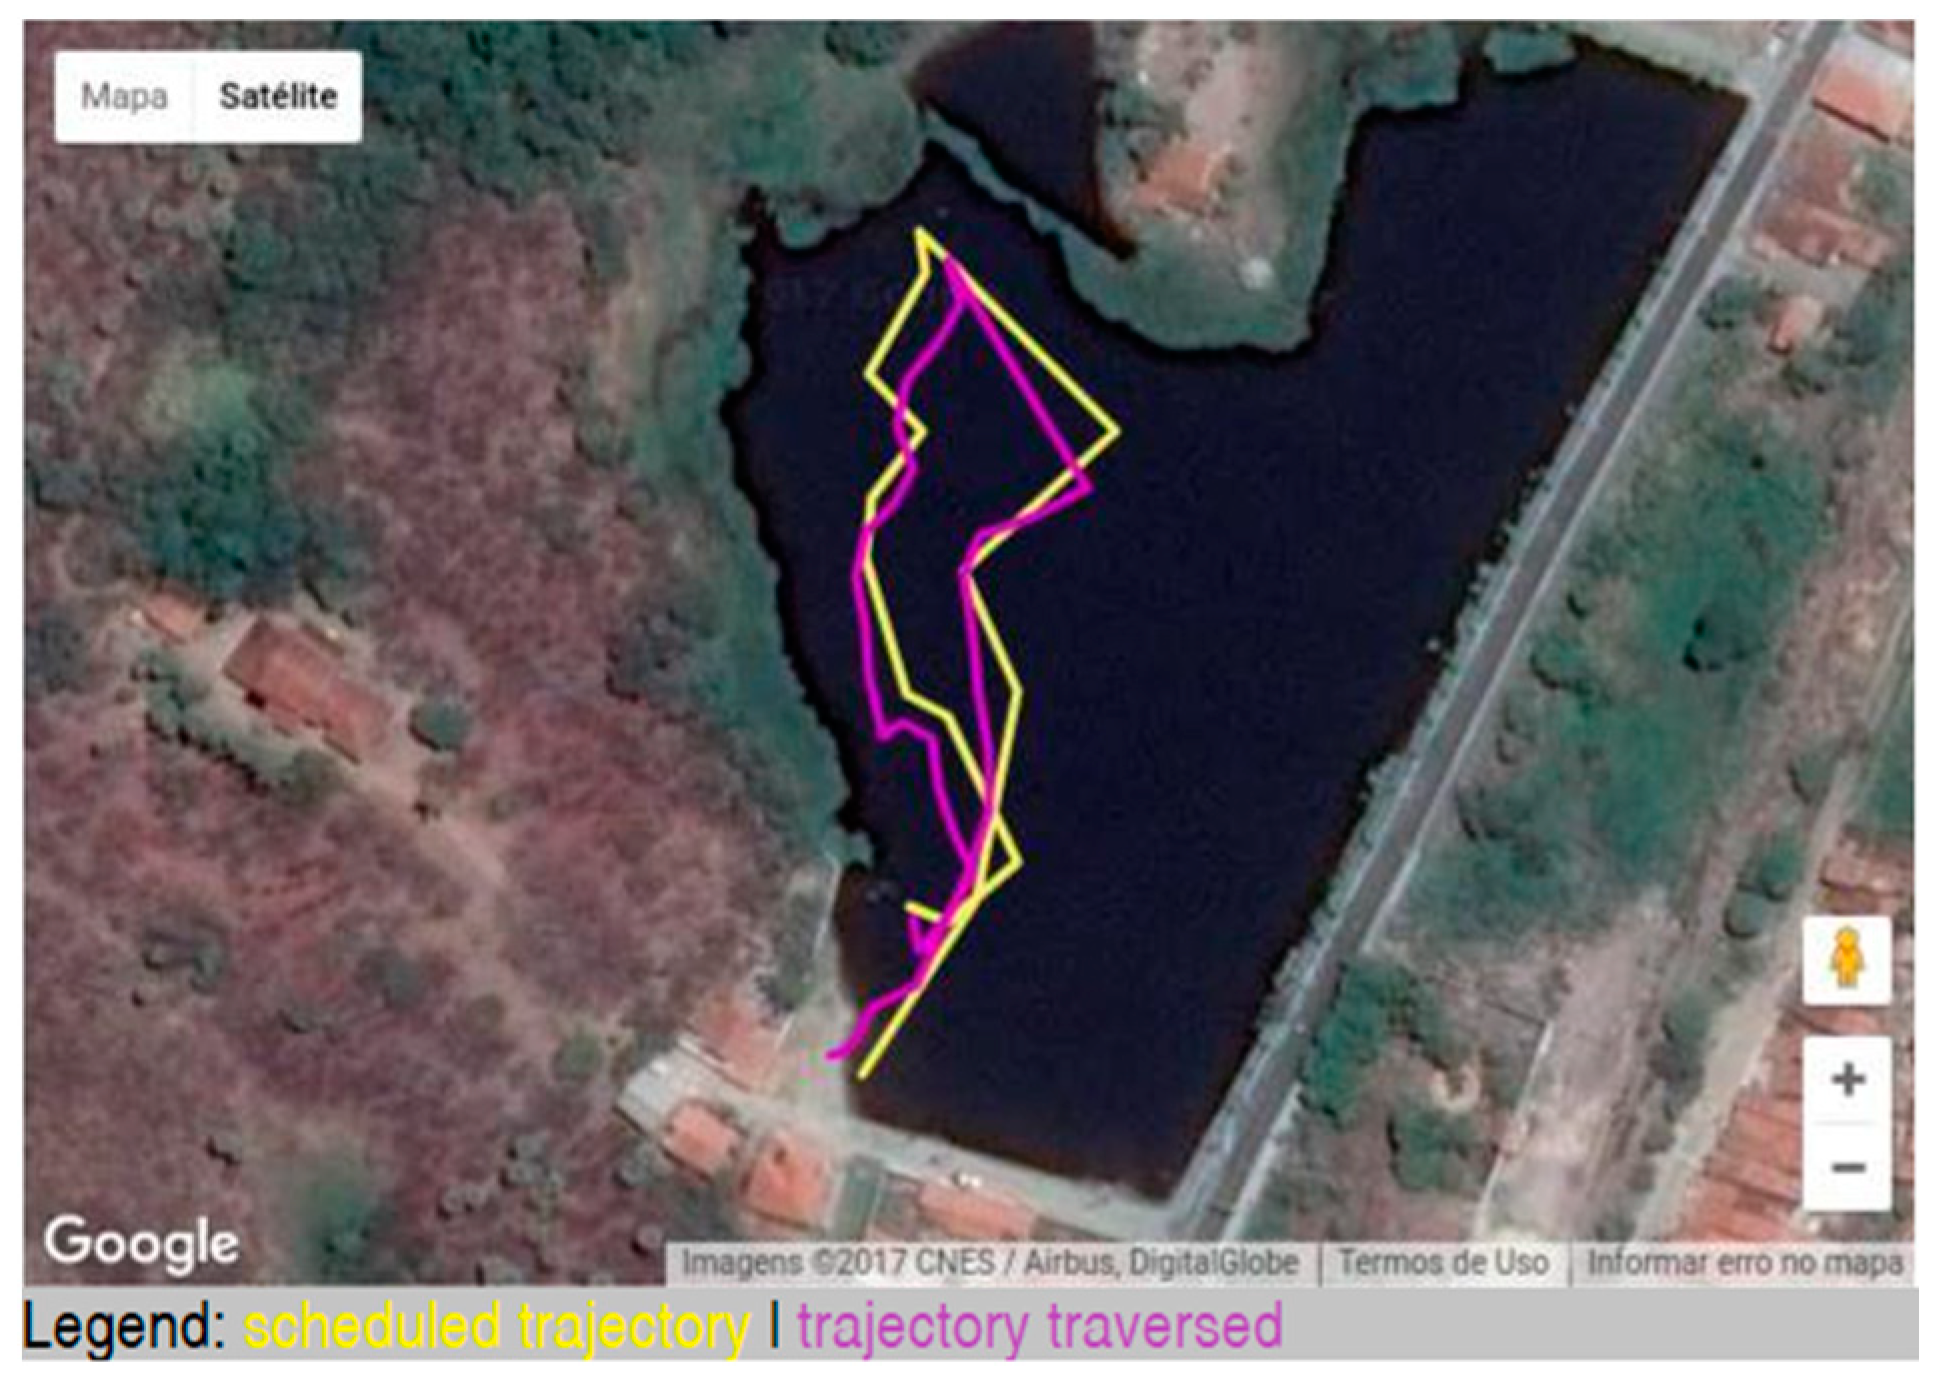
After the initial tests, the GPS navigation algorithm was developed, so the boat started to navigate, autonomously, collecting data, storing them in the database, and associating each waypoint with the GPS coordinates, thus, generating more complete reports, including the programmed trajectory versus the trajectory carried out.
5. Control Software Development
In order to manage the boat’s functions, a software with an internet interface was developed, so that the task of setting the waypoints, monitoring the mission (boat trajectory and data collection), and generating reports was as simple as possible, by using the API of Google Maps. The software was developed using standard HTML5 (HyperText Markup Language 5 has the purpose of facilitating the understanding and maintenance of the code through XML, for the creation of documents that have a hierarchy of data, such as databases and texts), and the programming language PHP (Personal Home Page), with an interface to the database MySQL (a Database Management System (DBMS) that uses the Structured Query Language (SQL) as the interface.). The software consists of a single screen with sections where other screens are loaded, according to the menu buttons, and updated in real time. On the top part of the software, besides the menus, one has information about the mission and its georeferencing as latitude, longitude, next latitude, next longitude, number of waypoints, next waypoint, altitude, date, time, and number of satellites.
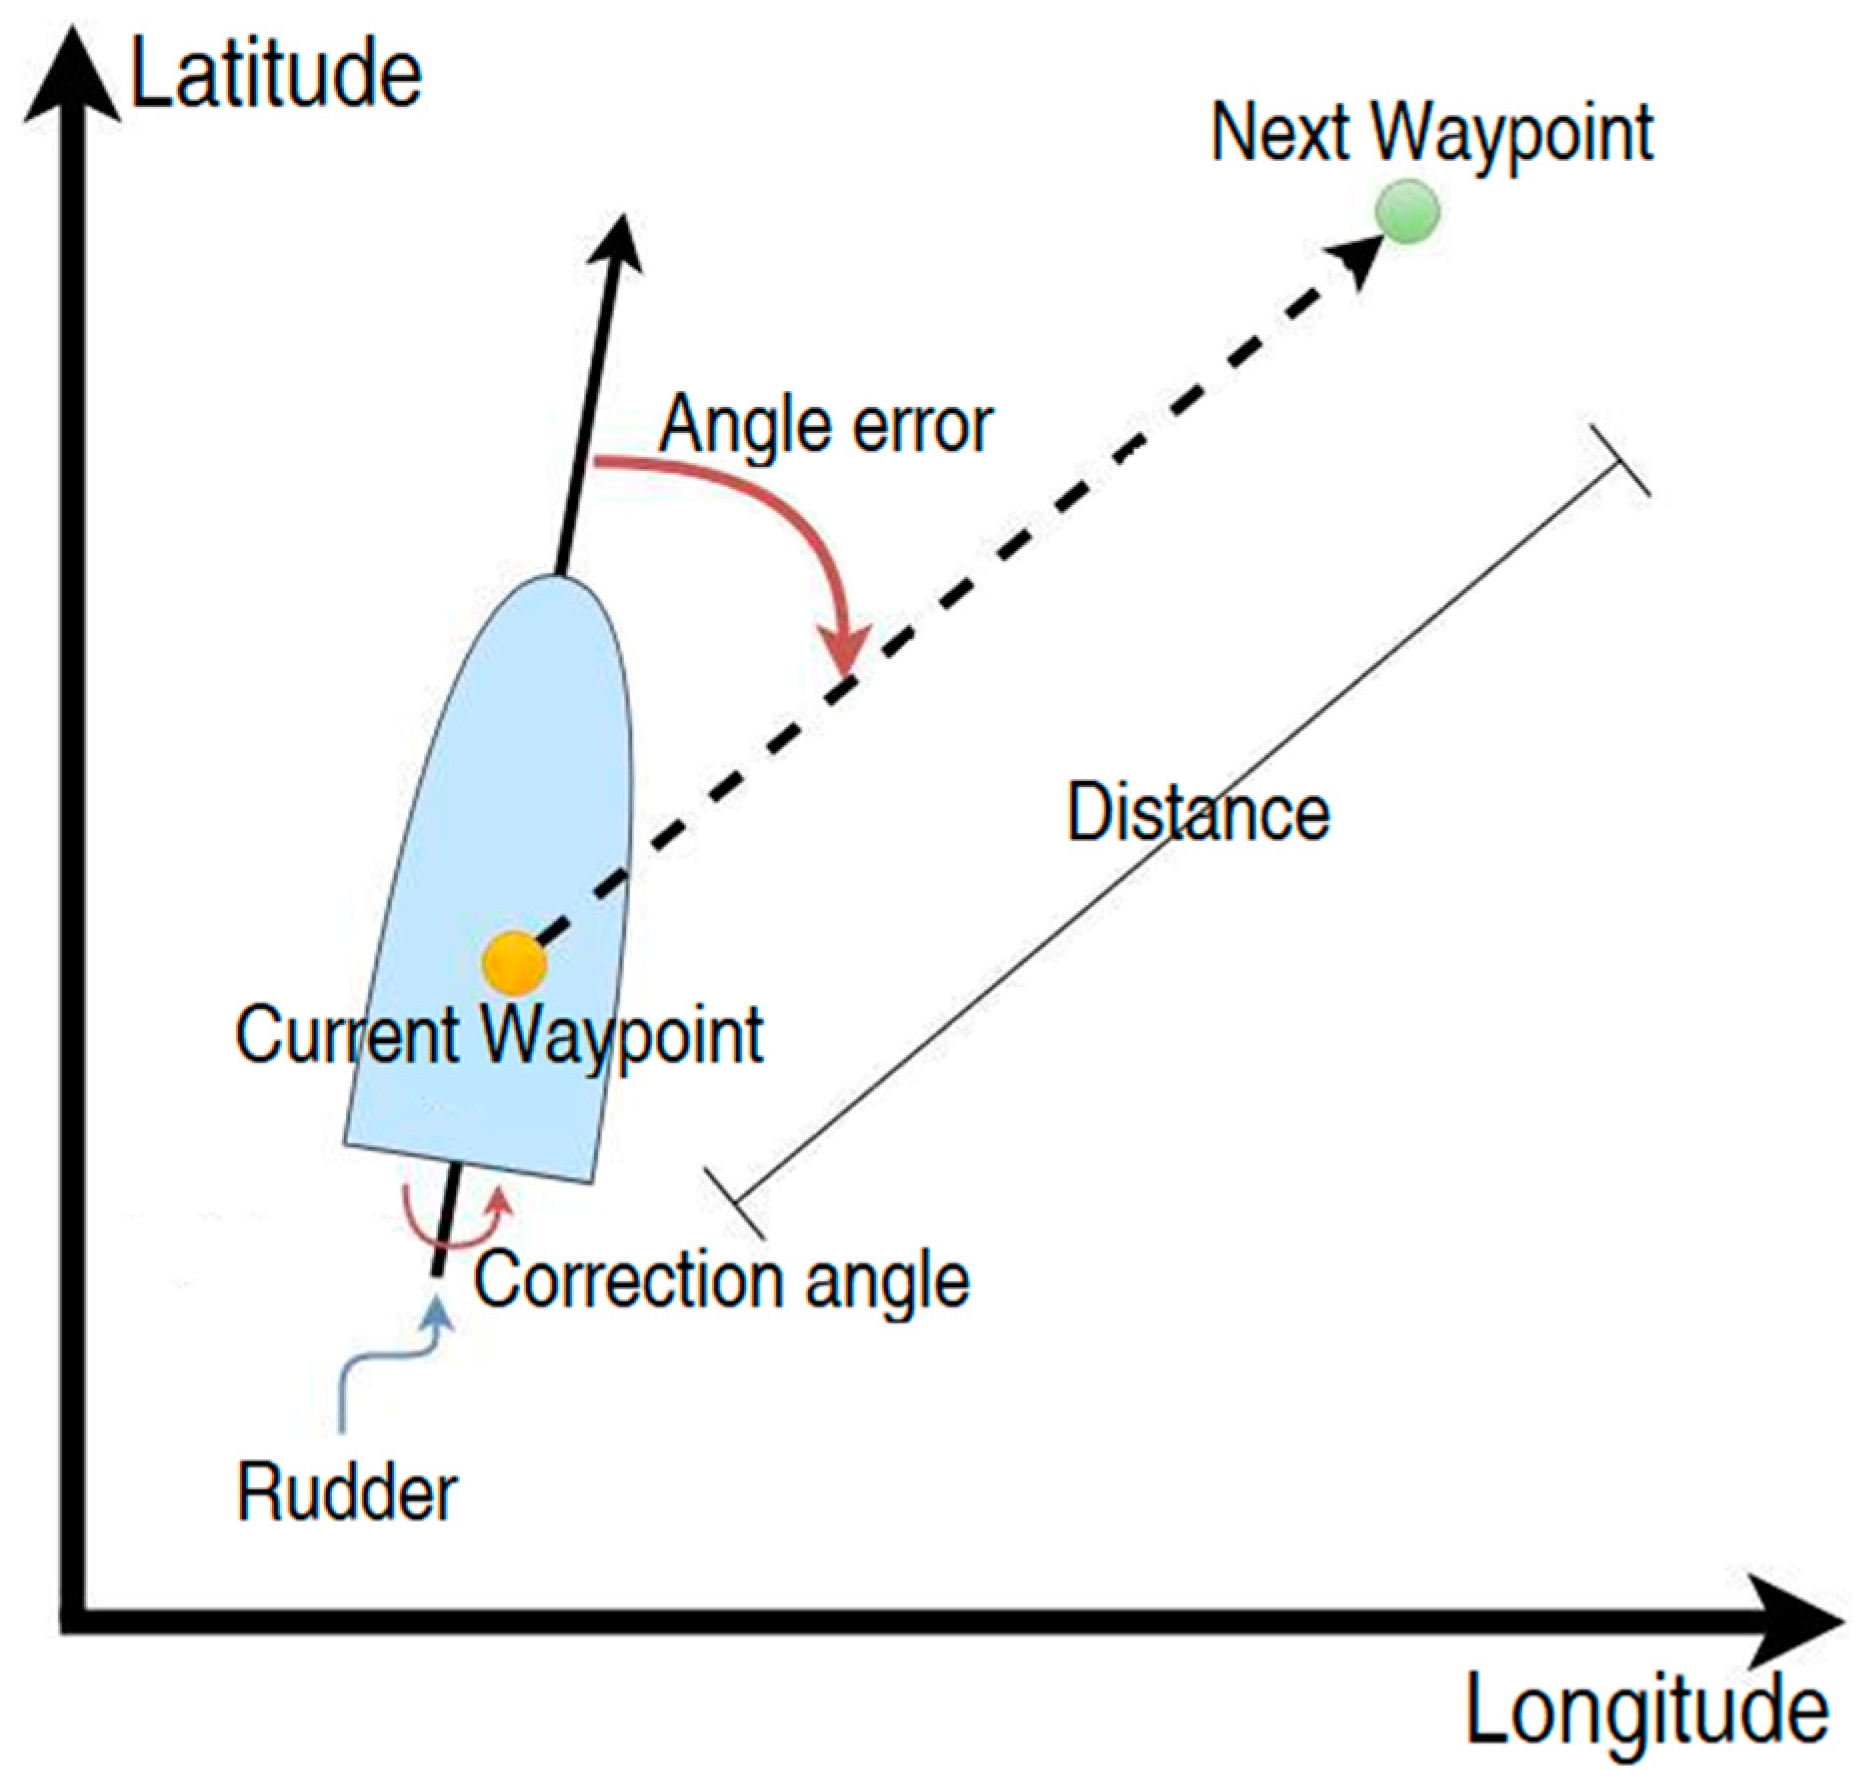
At the beginning of the mission, the aerodrive was turned on, the boat began to move and its trajectory was displayed in real time, as it navigated, highlighting the waypoints delimited by the operator. The latitude and longitude GPS coordinates were read, as well as the registration of the first waypoint stored in the database. With this data, the current boat distance to the next waypoint was calculated. If the distance was less than 5 meters, the next waypoint was loaded and the new distance was calculated again, based on the current GPS coordinates. During this period, the steering angle error (rudder direction) was calculated and corrected so that the boat moved straight, in the direction of the waypoint. This check was made every 1 second, until the boat was aligned with the target’s rolling angle. This process continued until the boat had traversed all the recorded points of the mission. To calculate the distance, the Haversine formula was used, as shown in Equations (1)–(3).
where:
is the square of half the length of the straight line connecting the two points (waypoints);
is the distance traveled on the surface of the sphere in radians;
is the distance as a function of.
The rolling angle between the waypoints was calculated as shown in Equation (4).
Once the distance
and the bearing angle
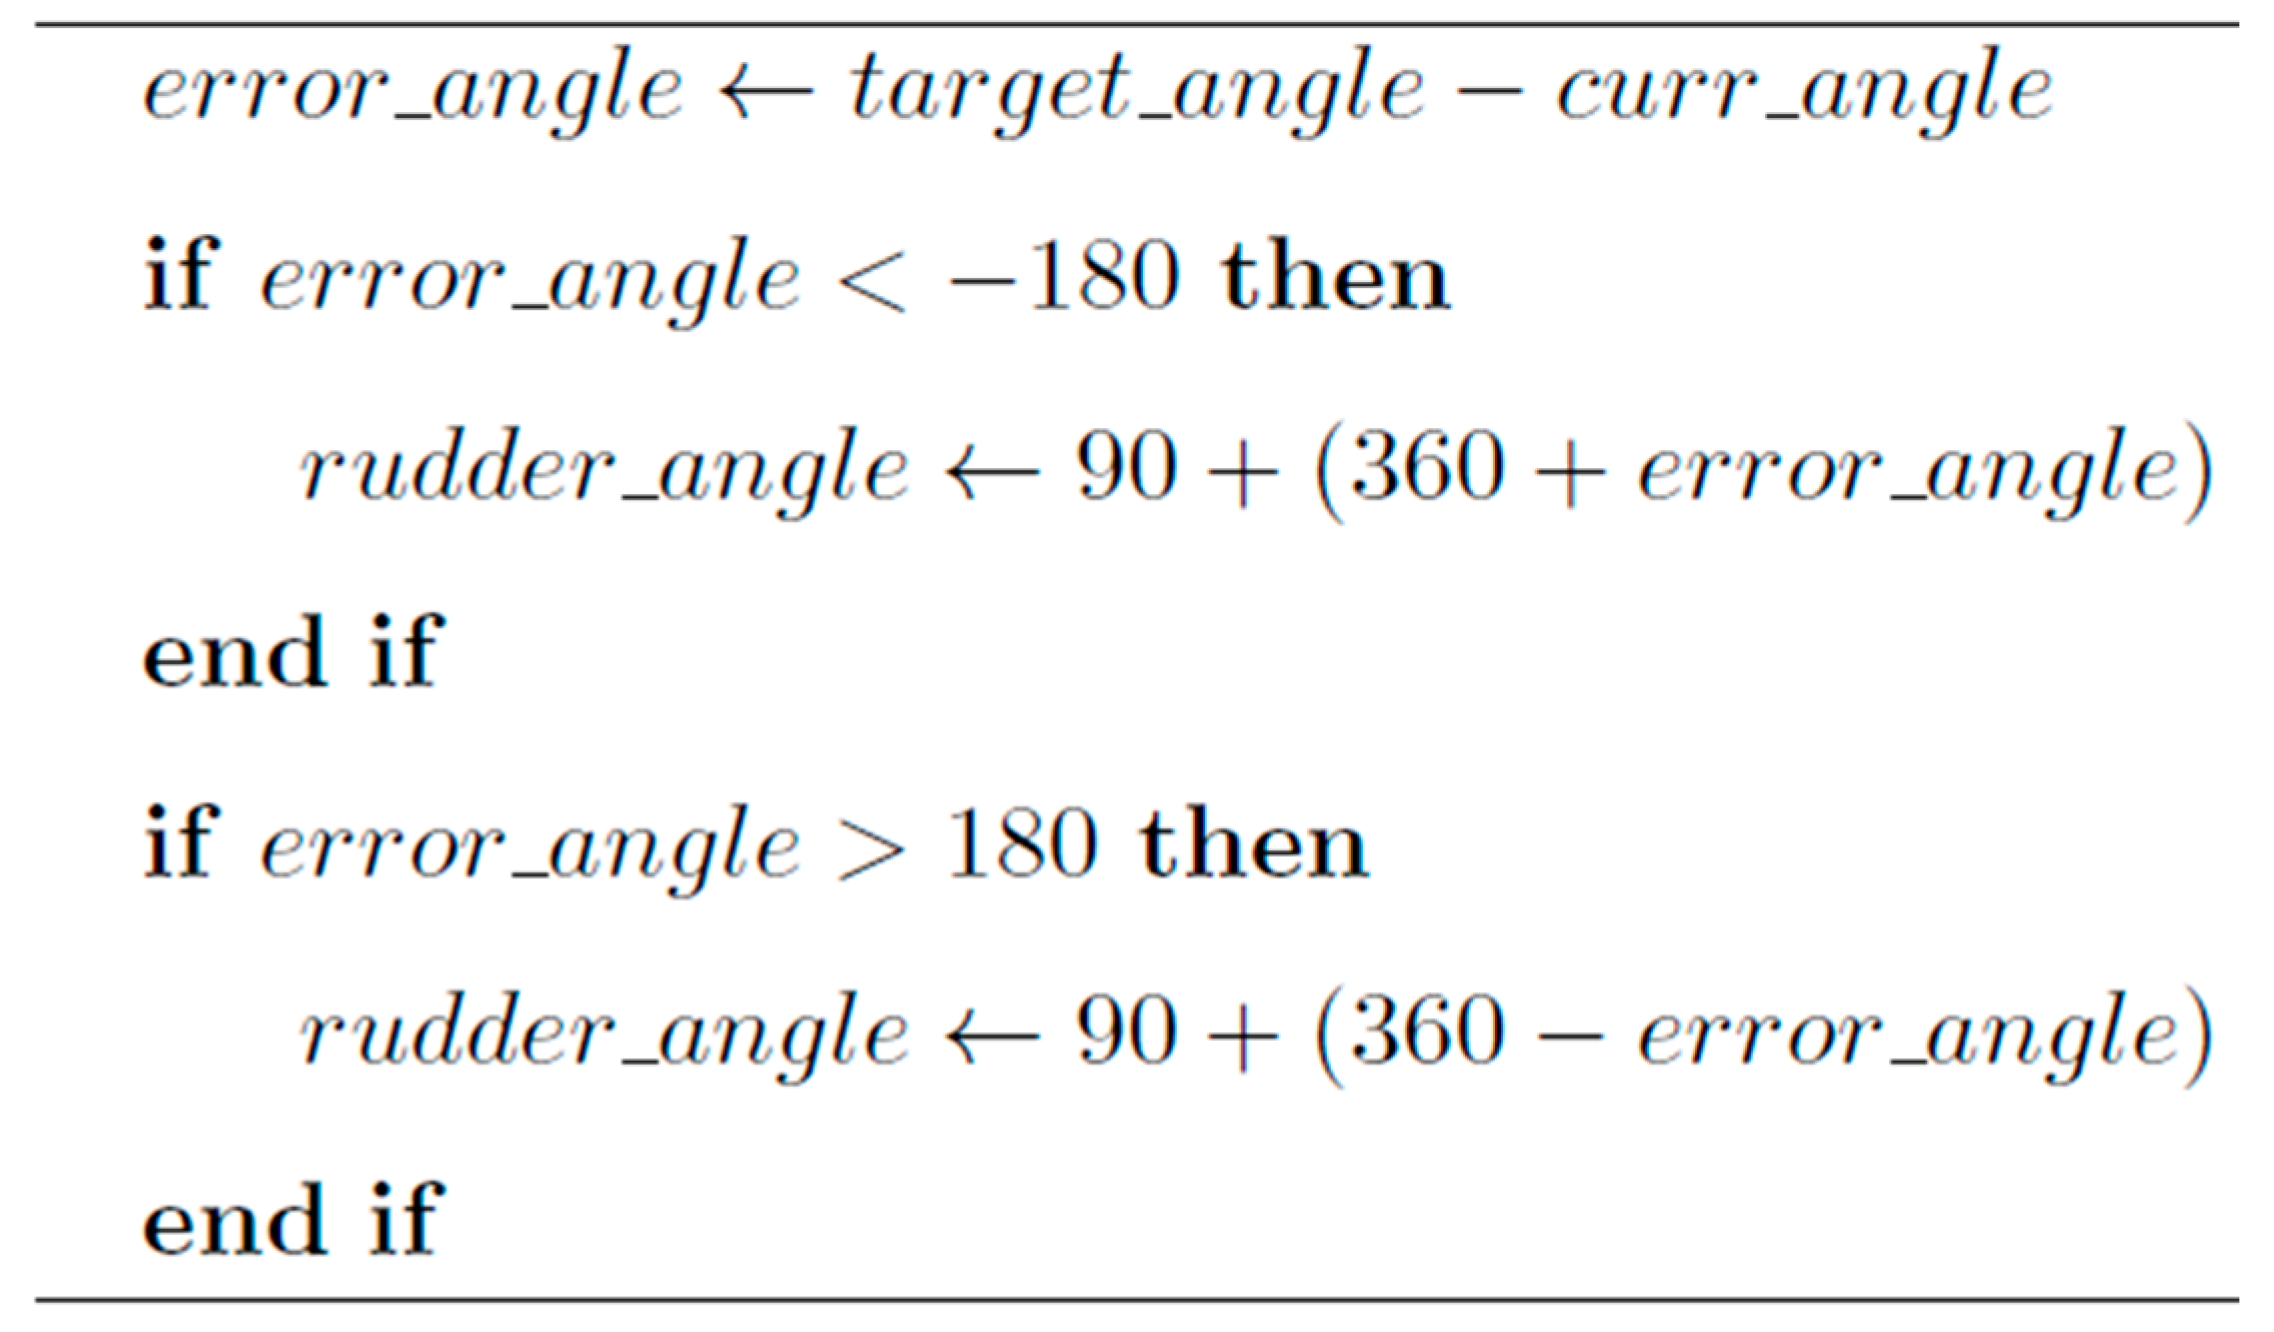
θ were calculated, the trajectory was defined by the GPS location data. The angle error was calculated by subtracting the current angle of the boat by the rolling angle of the next waypoint. The computed result was transferred to the rudder proportional control algorithm, by correcting the boat position until the error reached zero. The rudder correction angle algorithm was given by the equations shown in
Figure 6.
where:
error angle is the error of the current angle of the boat, relative to the bearing angle of the waypoint;
target angle is the bearing angle of the waypoint;
curr angle is the angle of the boat calculated with the digital compass (magnetometer);
rudder angle is the angle of correction of the rudder.
When error angle equaled 0, the rudder position would have been 90 degrees to the boat’s stern, causing the boat to move in a straight line. Through the electronic compass, the angle error in relation to the next point to be traveled was calculated and corrected, as shown in
Figure 7.
Figure 8 shows a general flowchart of the boat’s software.
7. Discussion
Analyses can be made regarding the general situation of the lakes by comparing the average of each type of data collected with the other types.
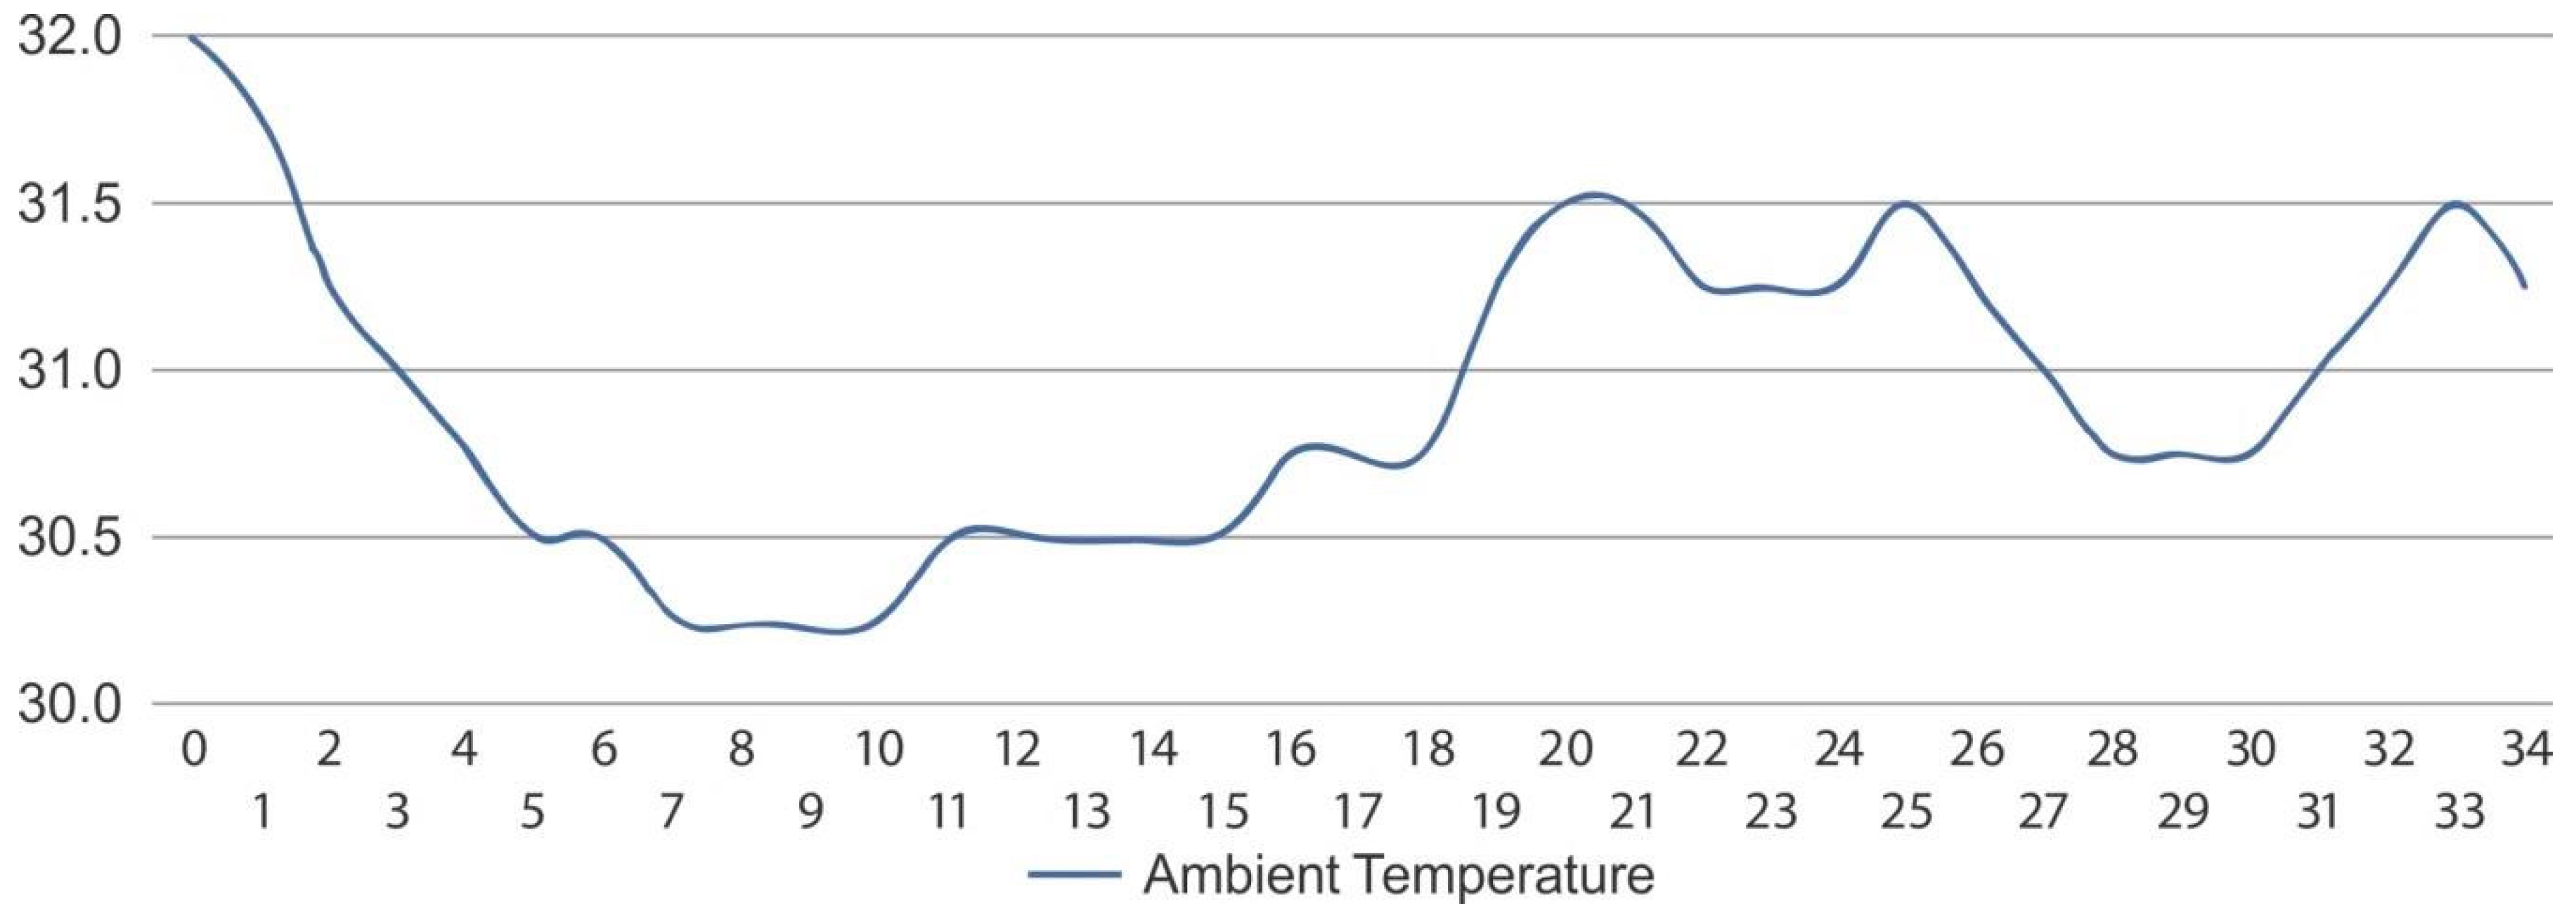
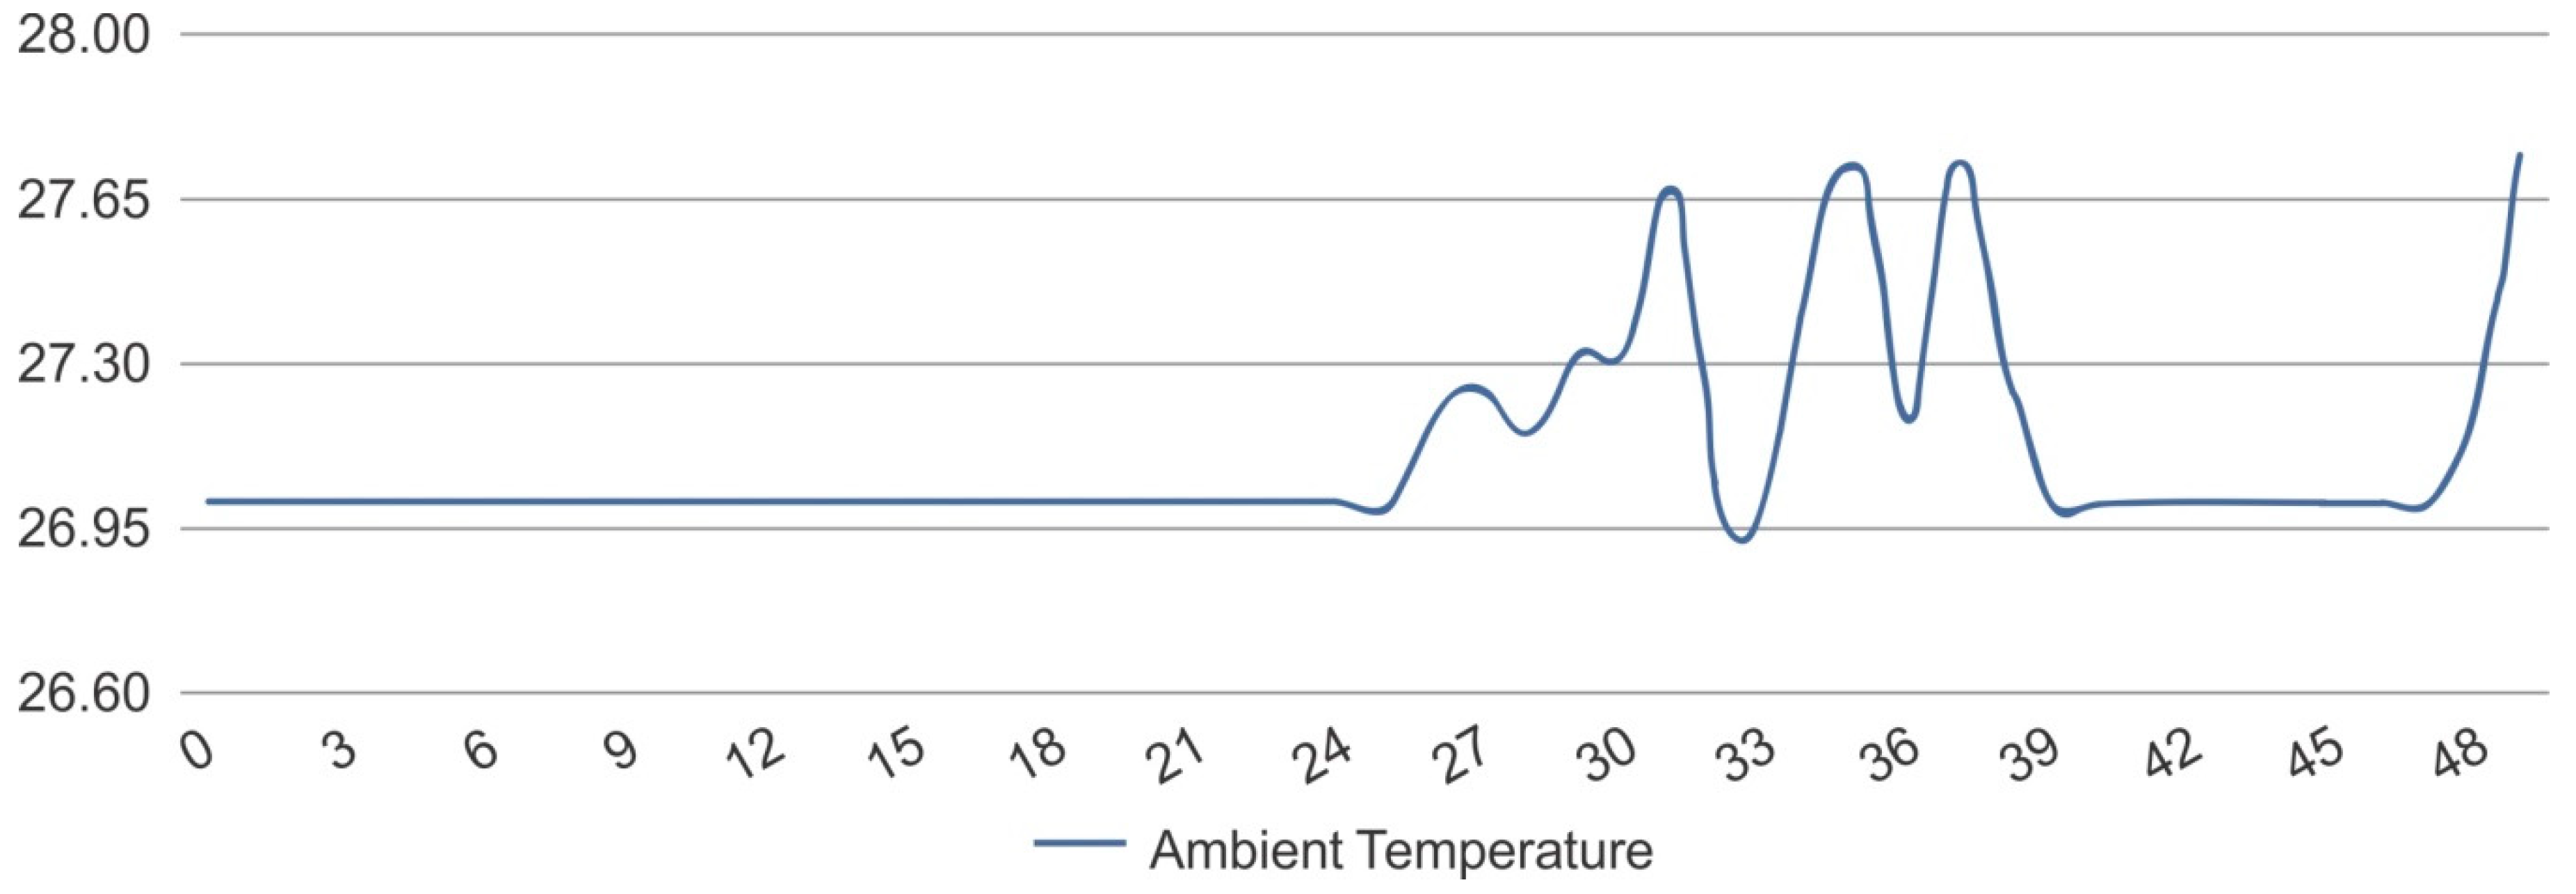
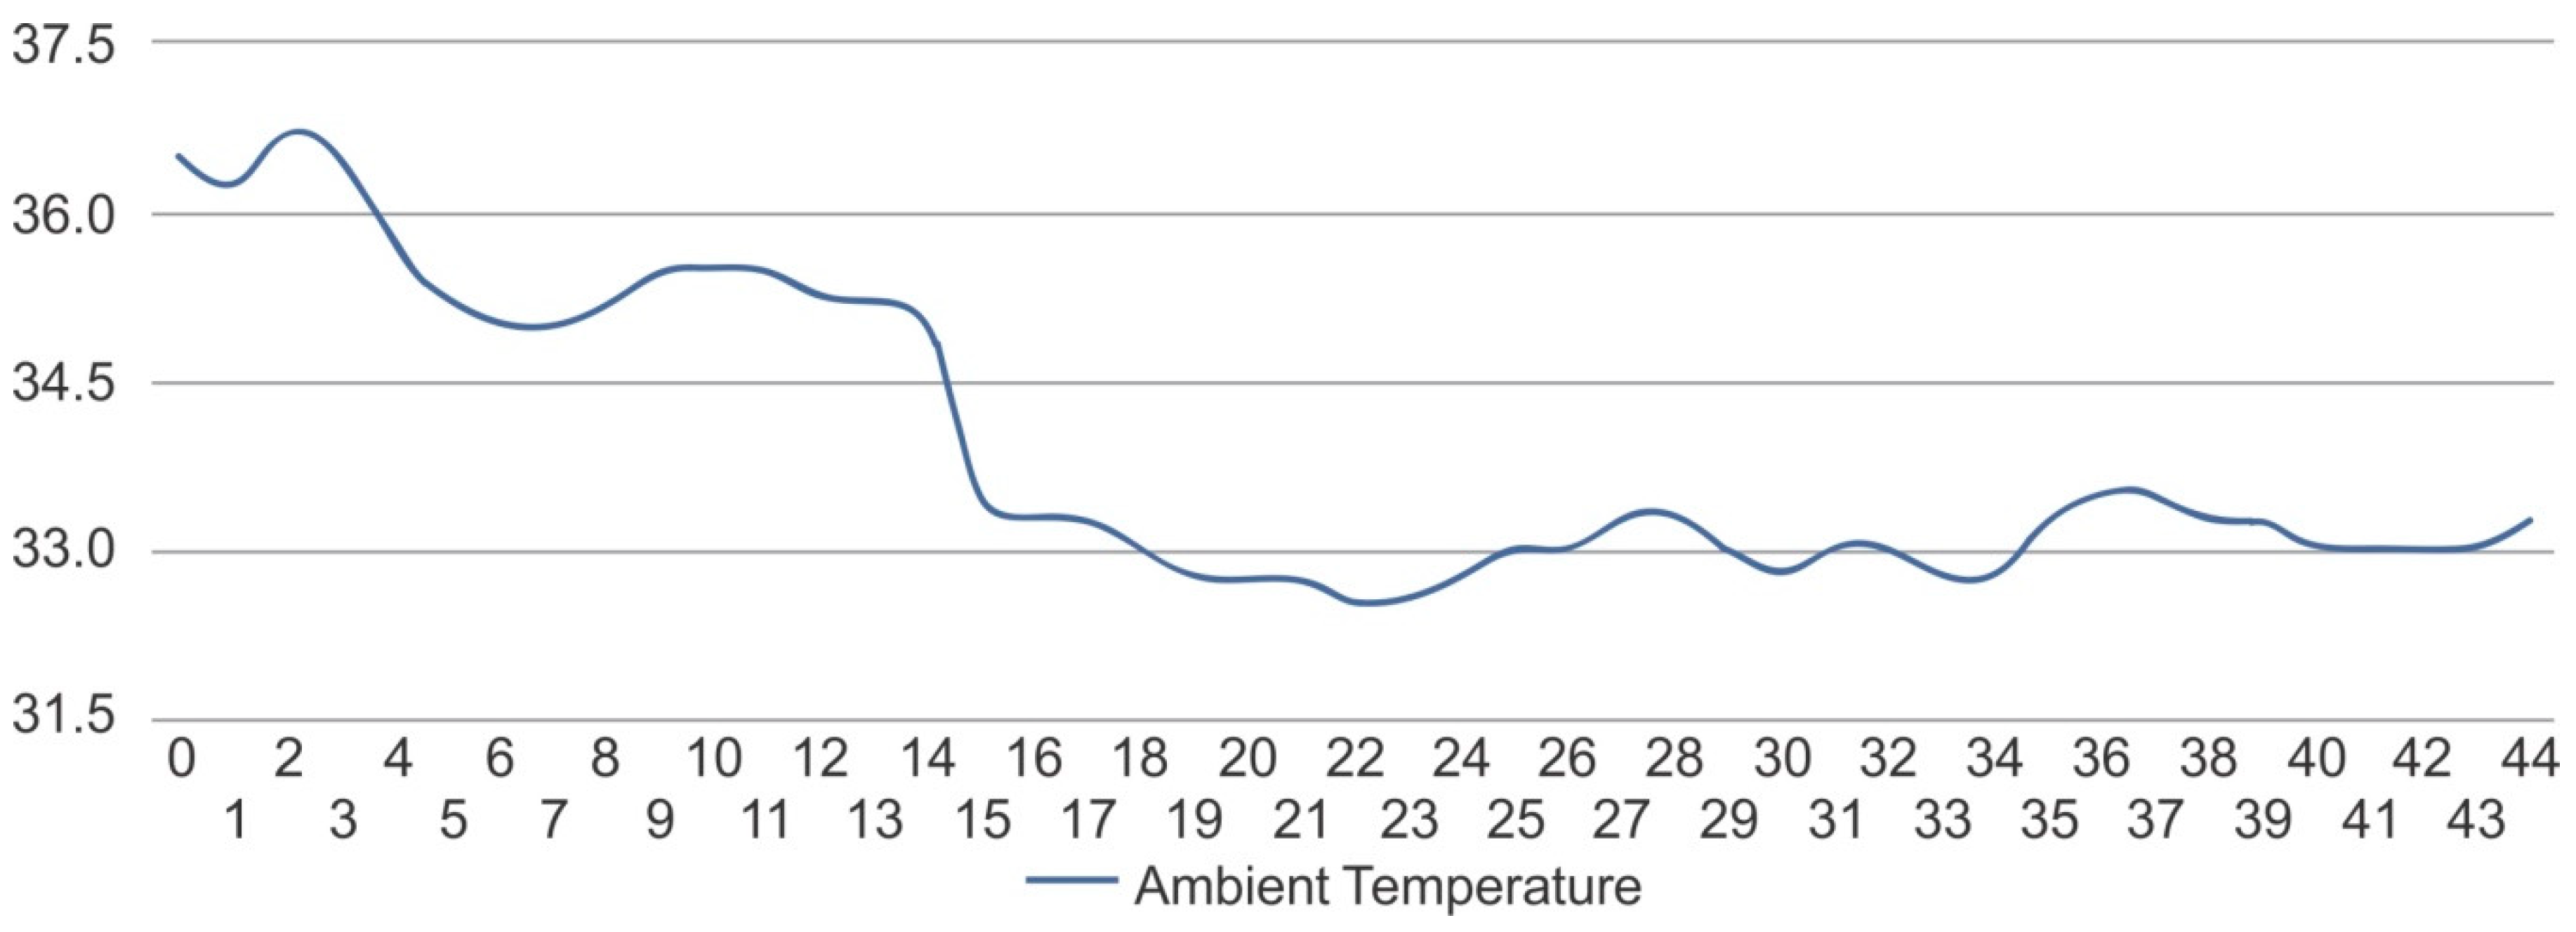
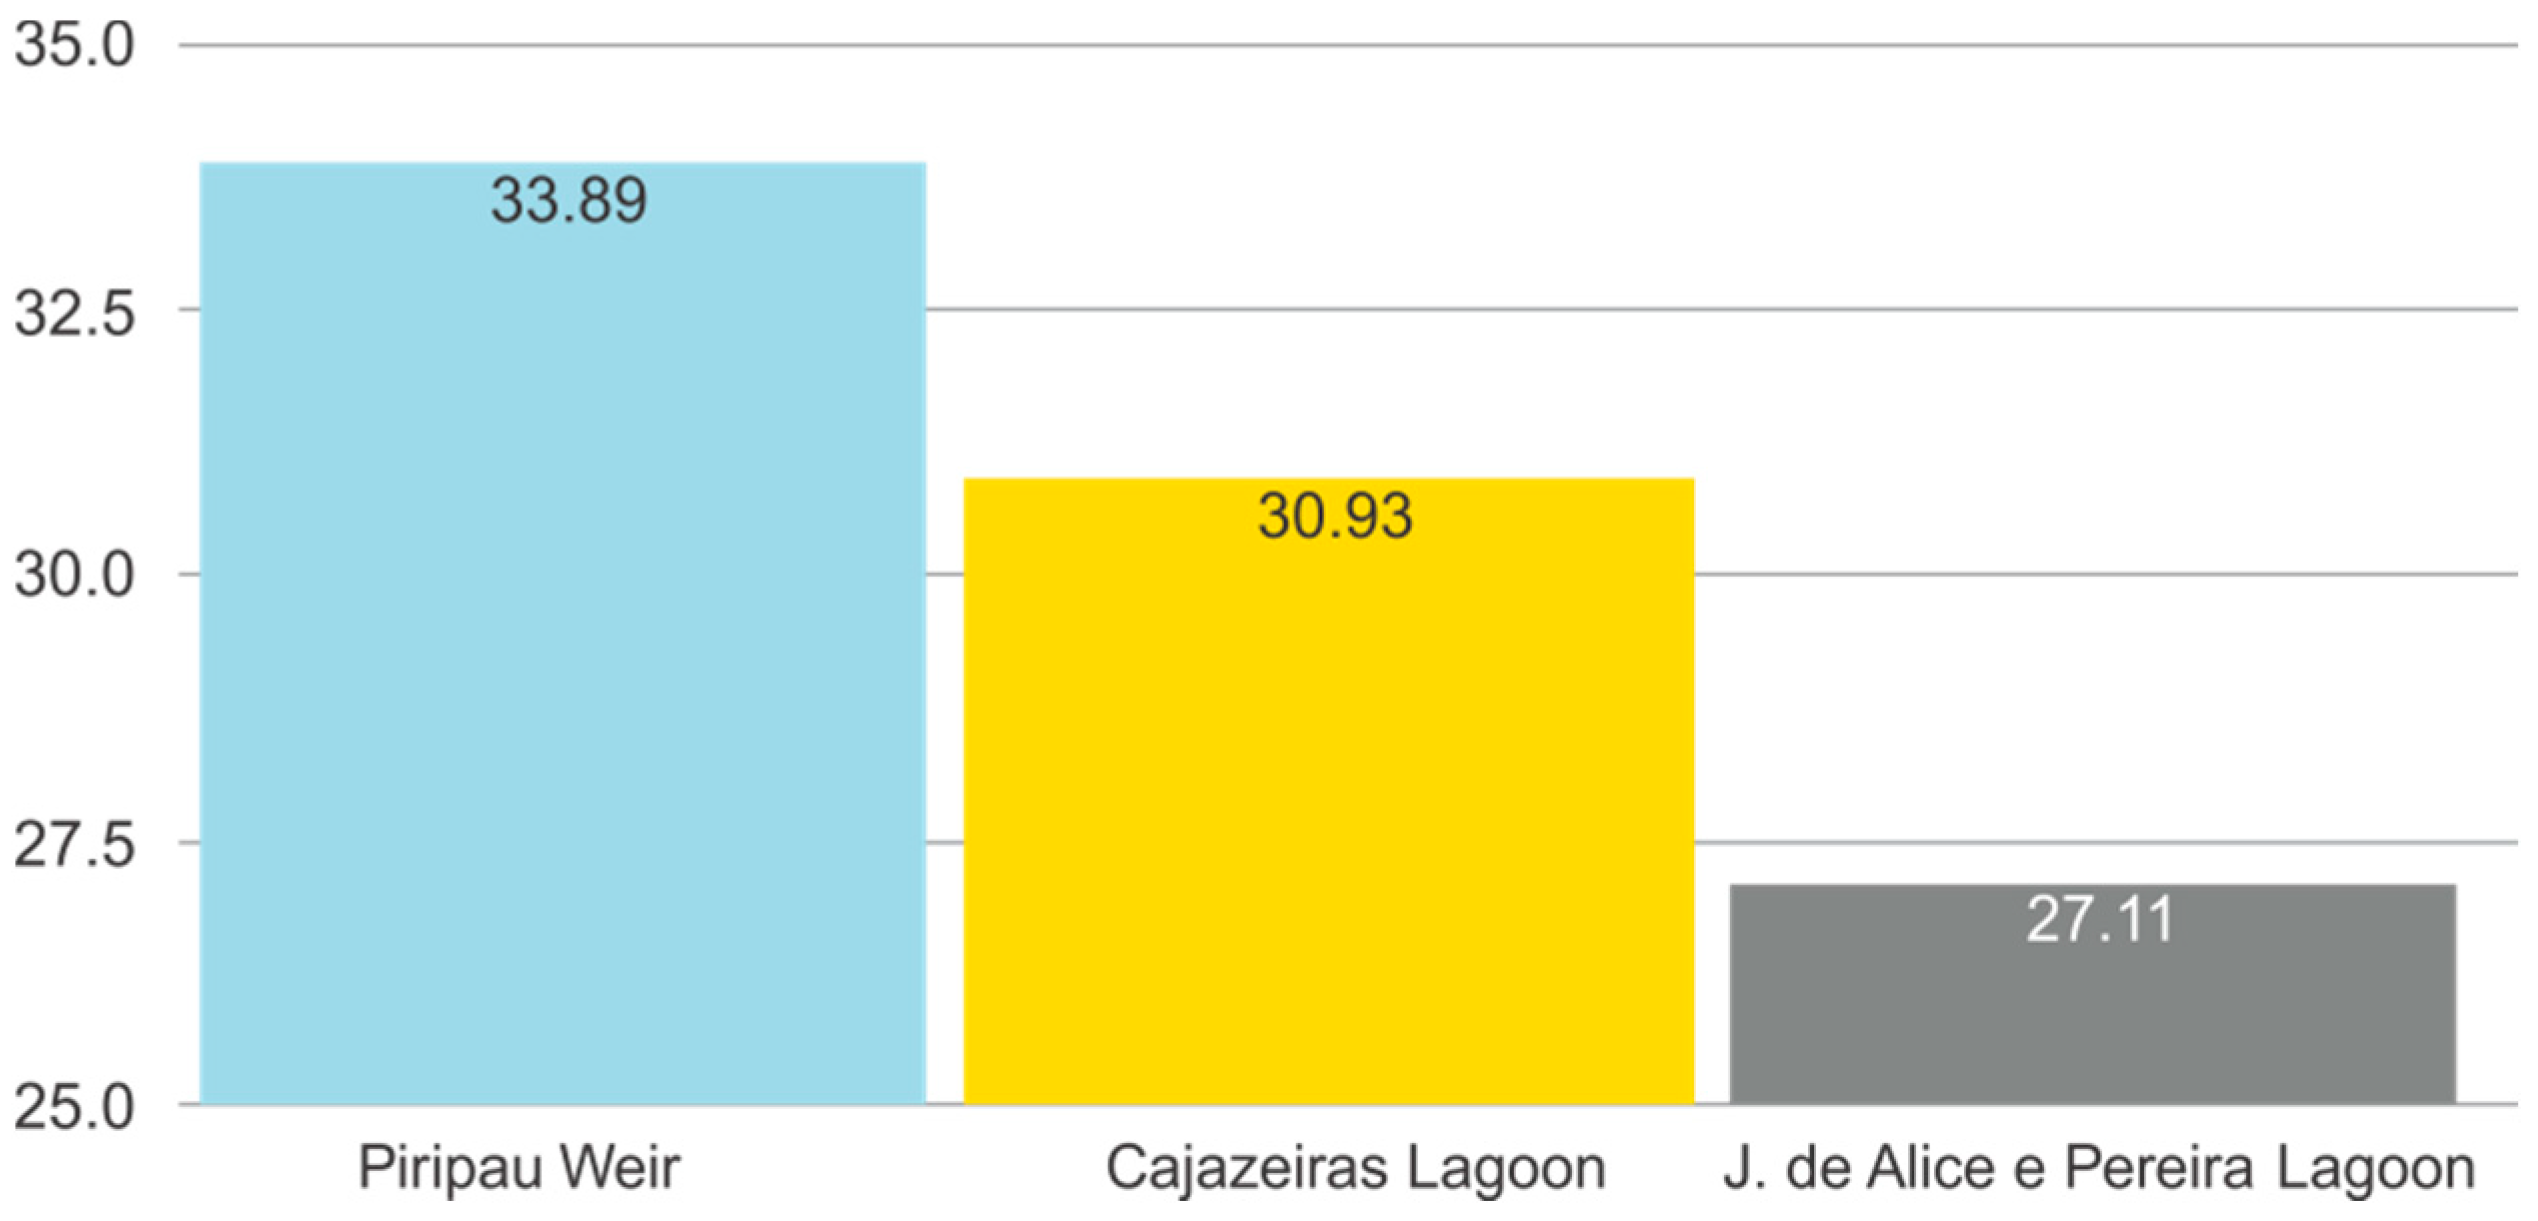
The mean temperature values of the environment varied greatly, according to the location and period of the day. The Piripau weir, on the edge of the Pacatuba Mountain, showed a higher value (33.89 °C after 1 pm), as it was located in a windward region. The lagoon of the condominium Jardins de Alice e Pereira showed a lower value, due to the collection time (27.11 °C, after 9 pm). The Cajazeiras Lagoon obtained a value of 30.93 °C, after 9:50 am.
Figure 27 shows the averages of the environmental temperature in the three lakes analyzed.
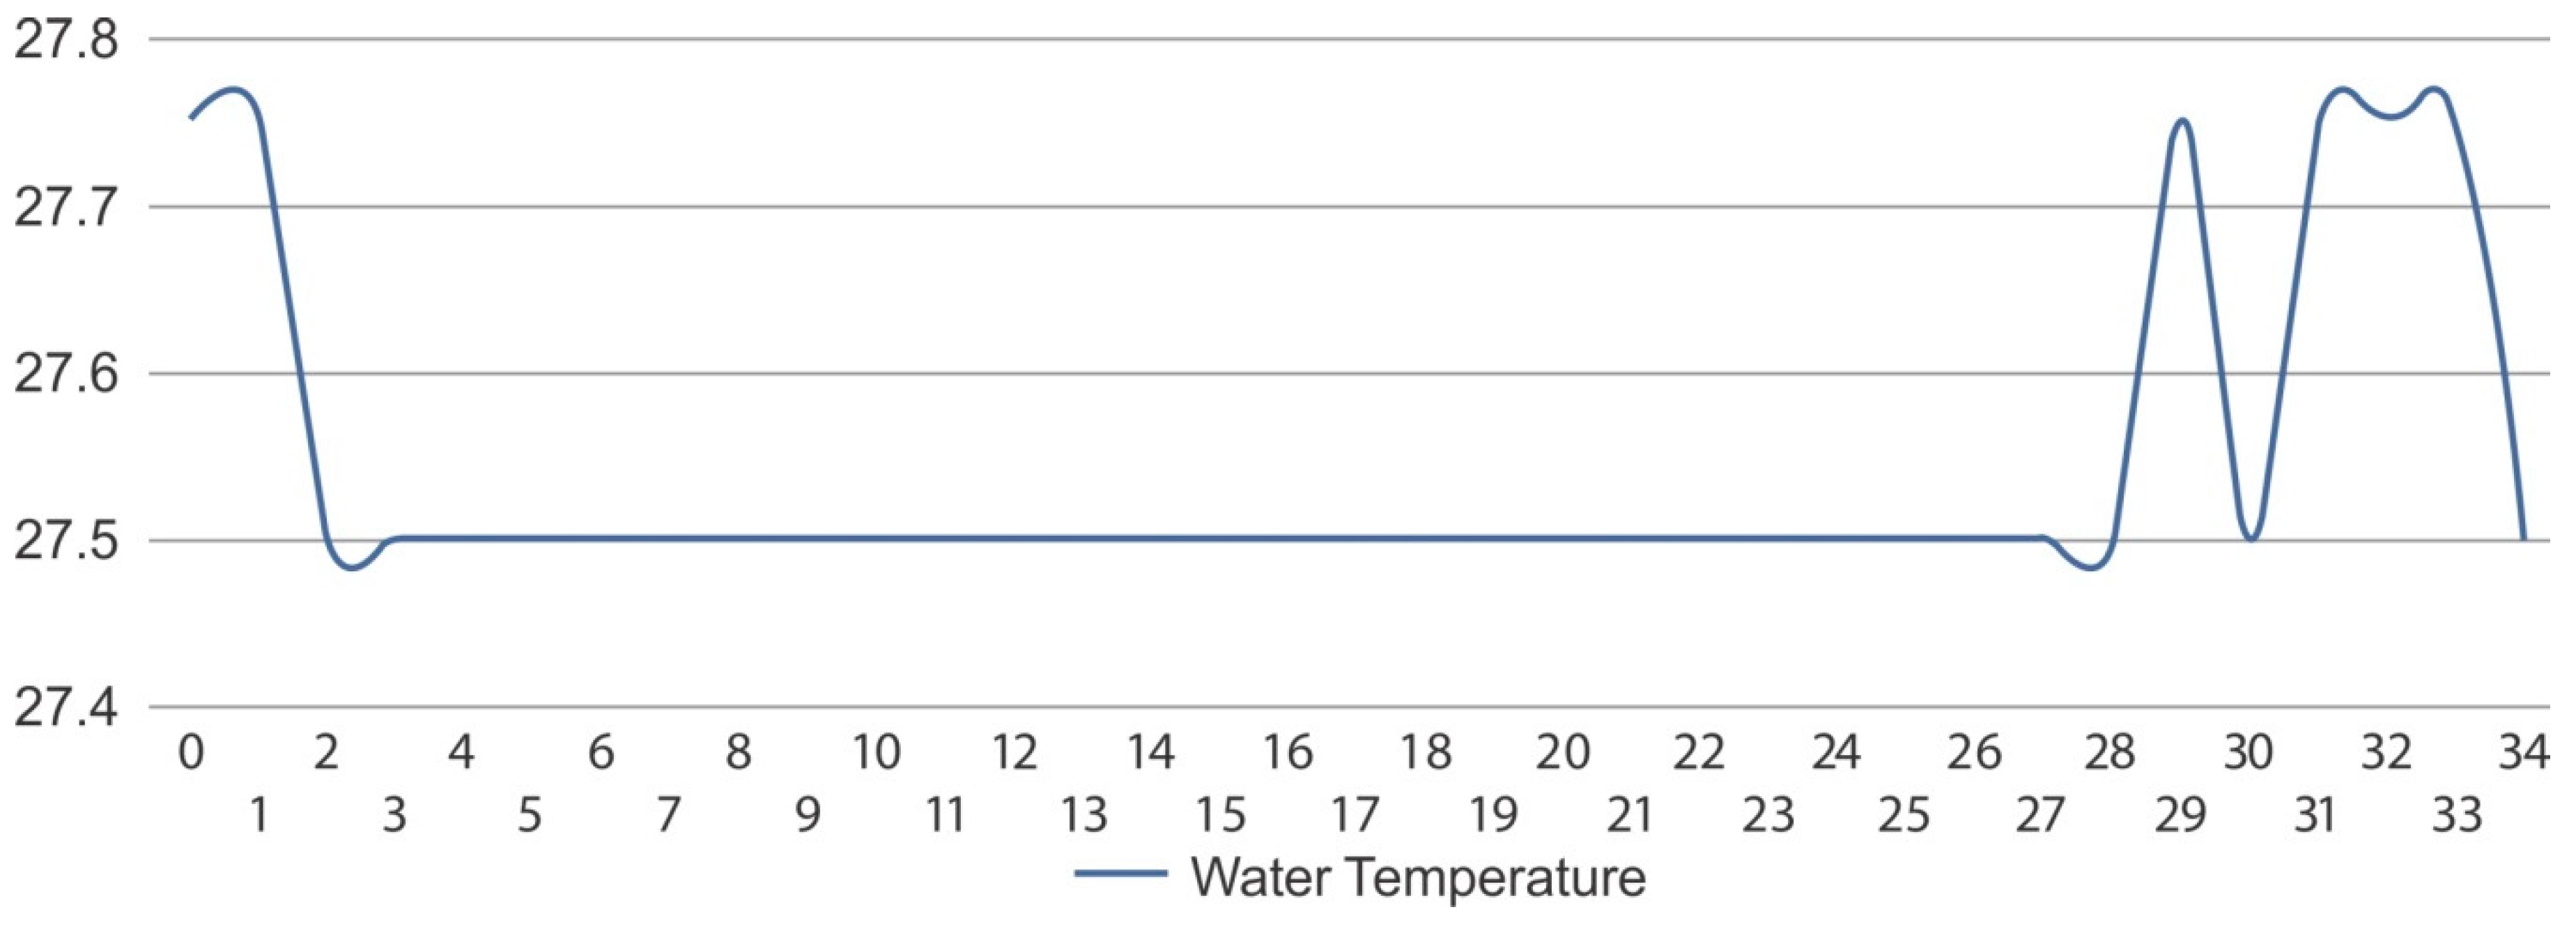
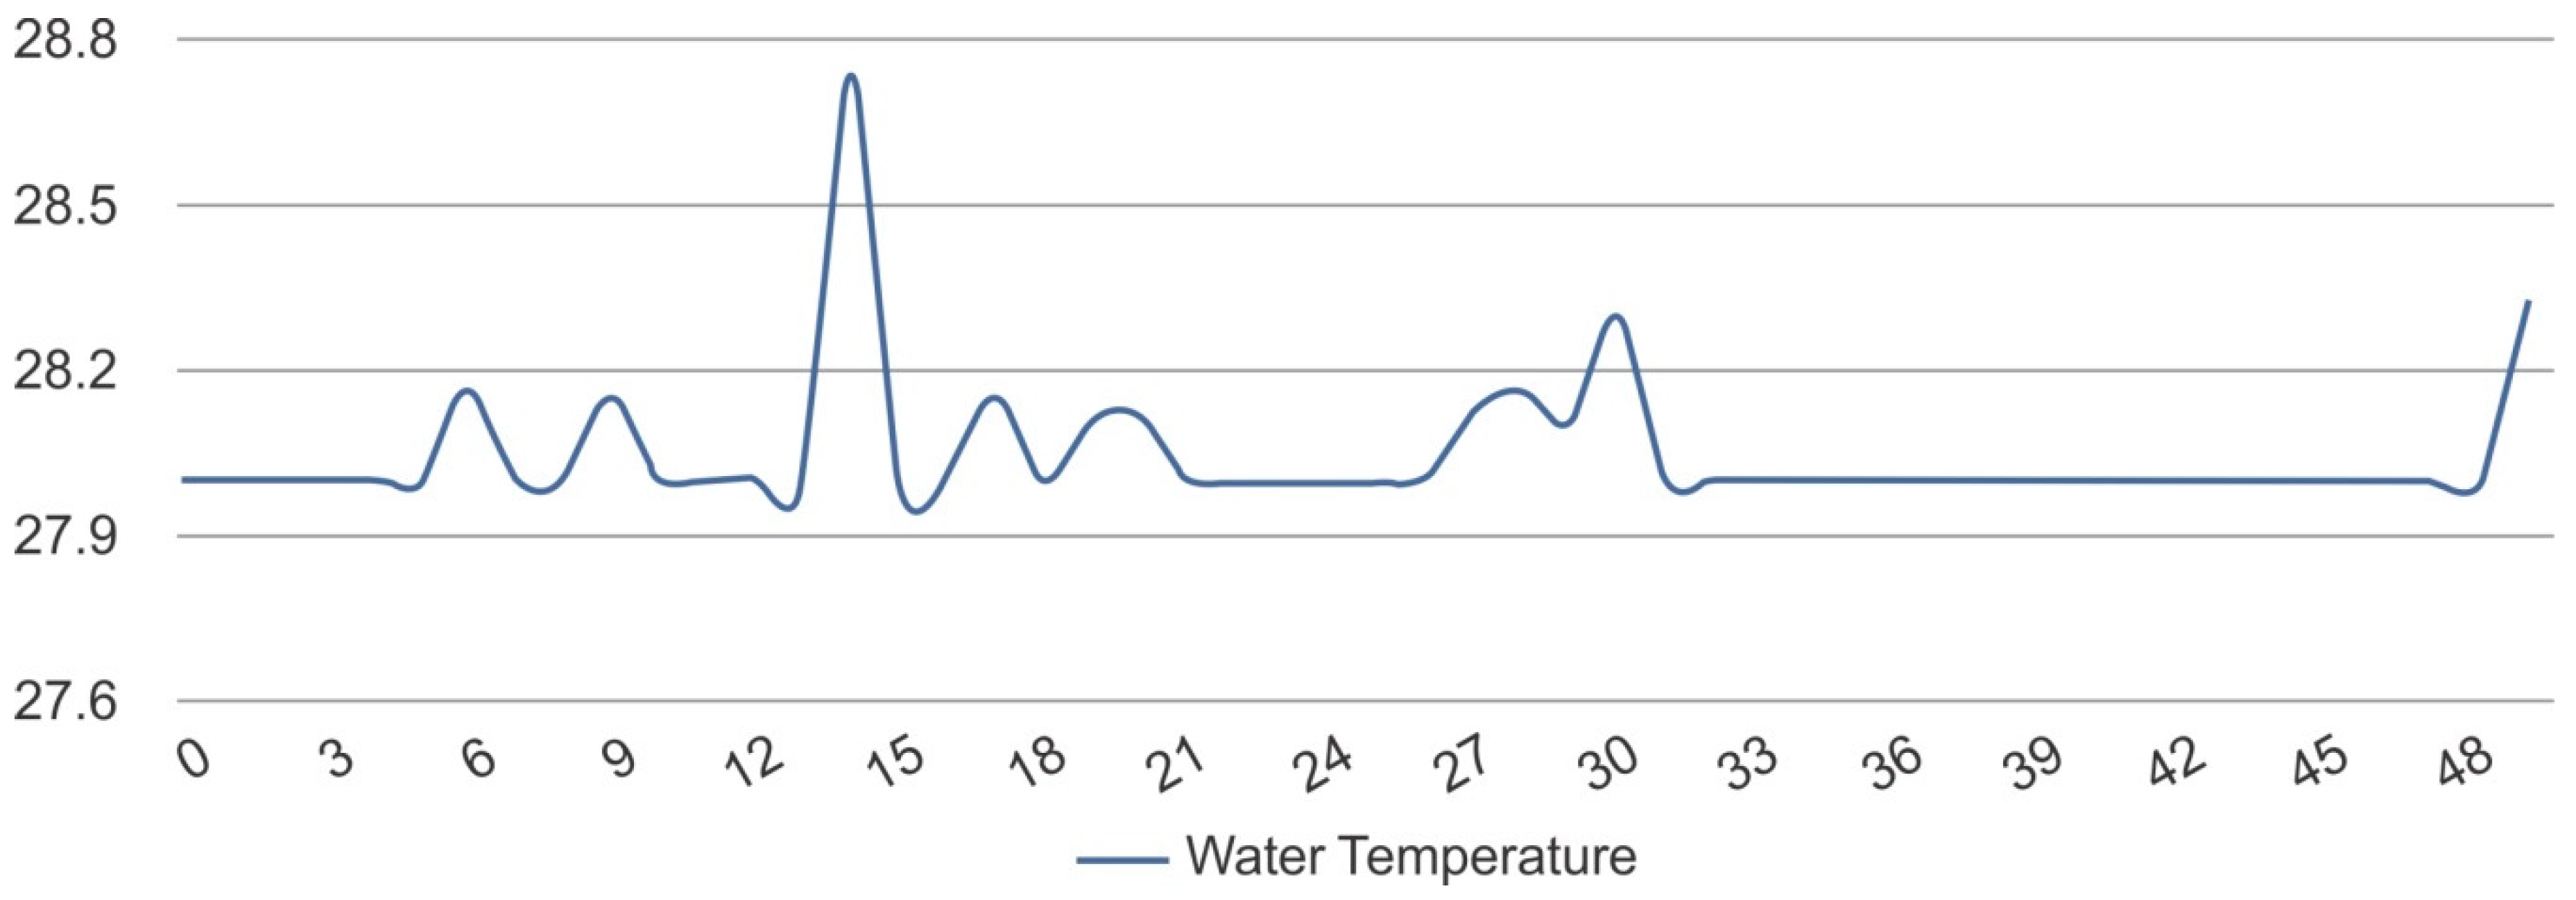
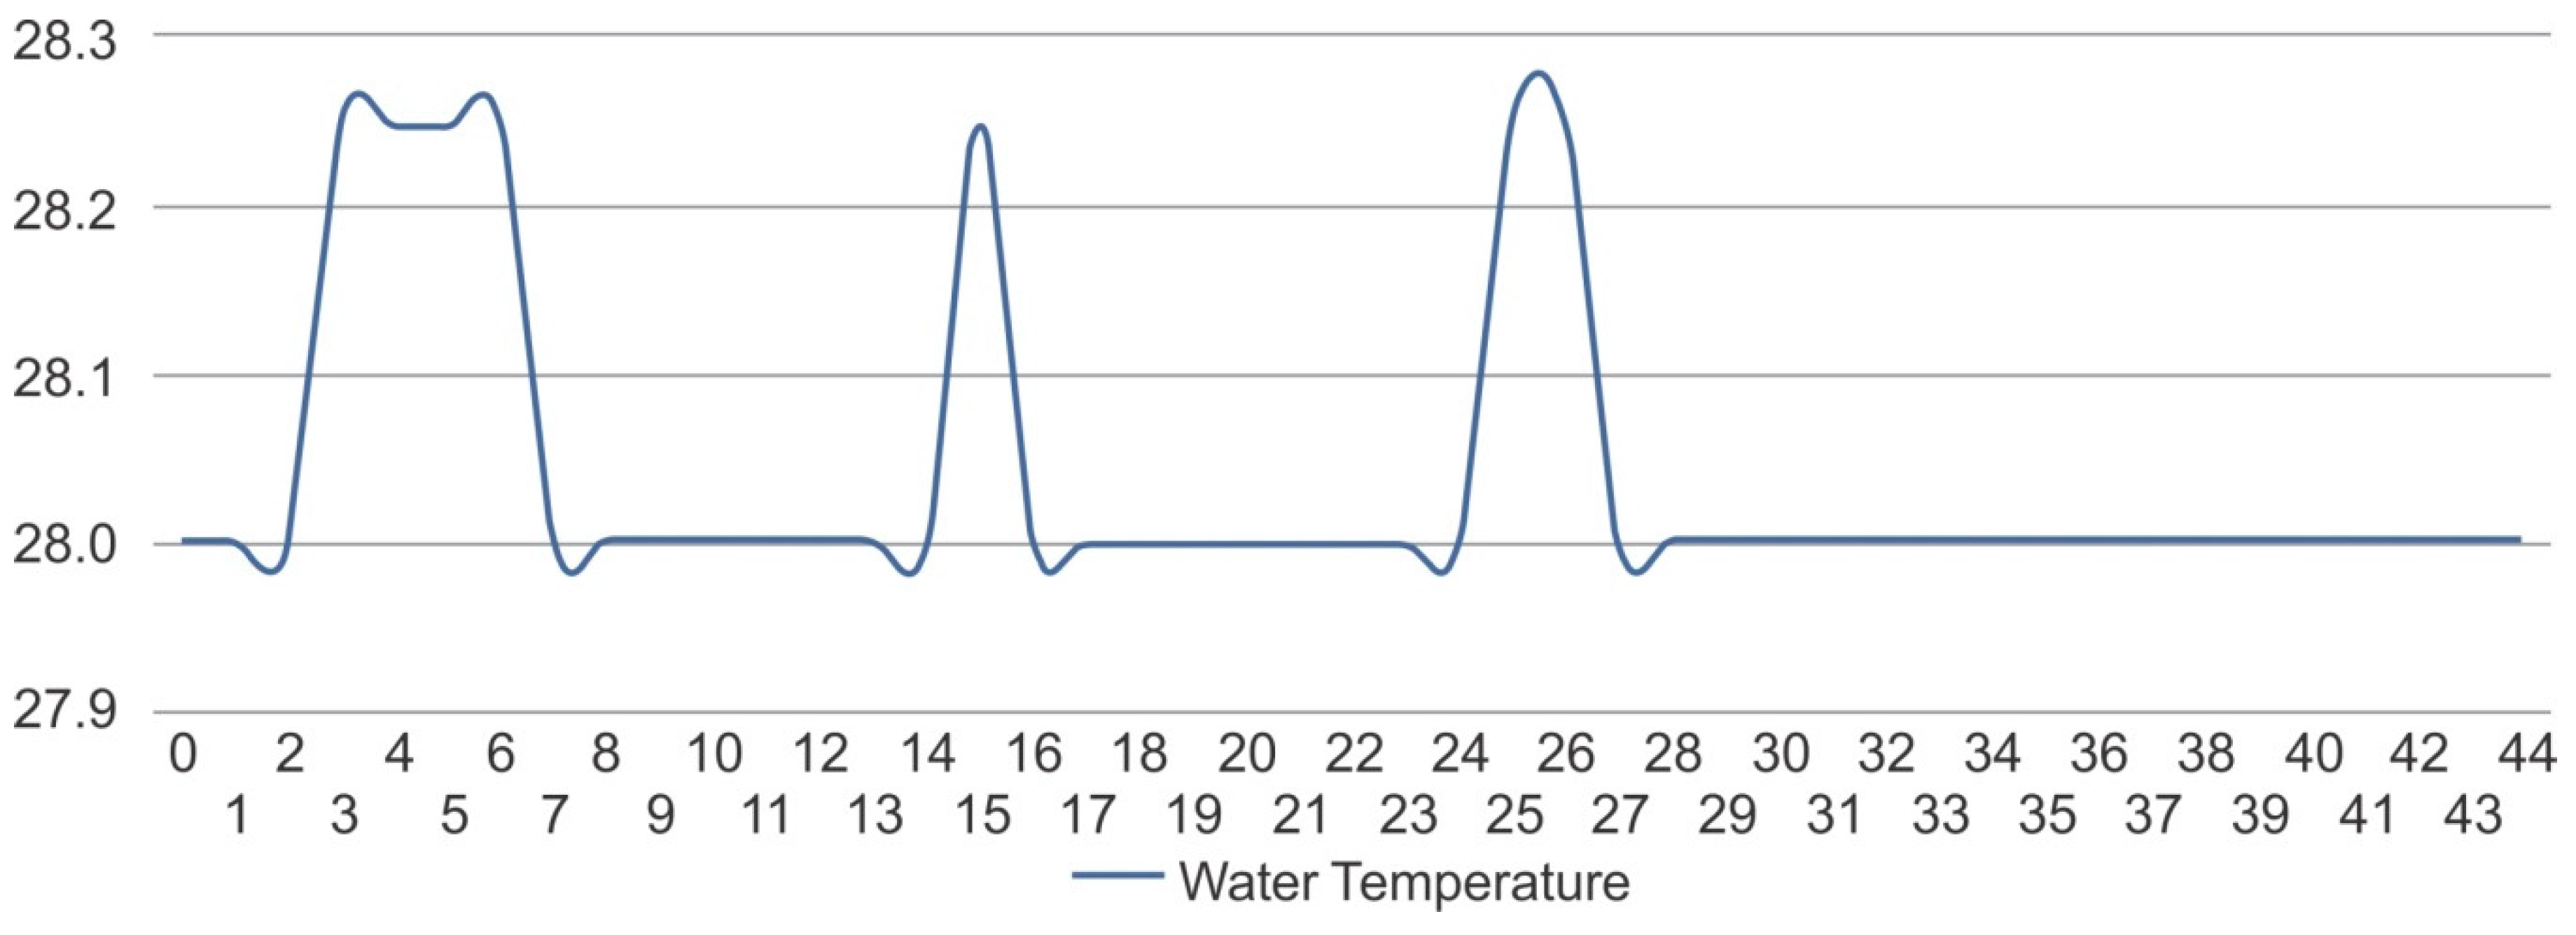
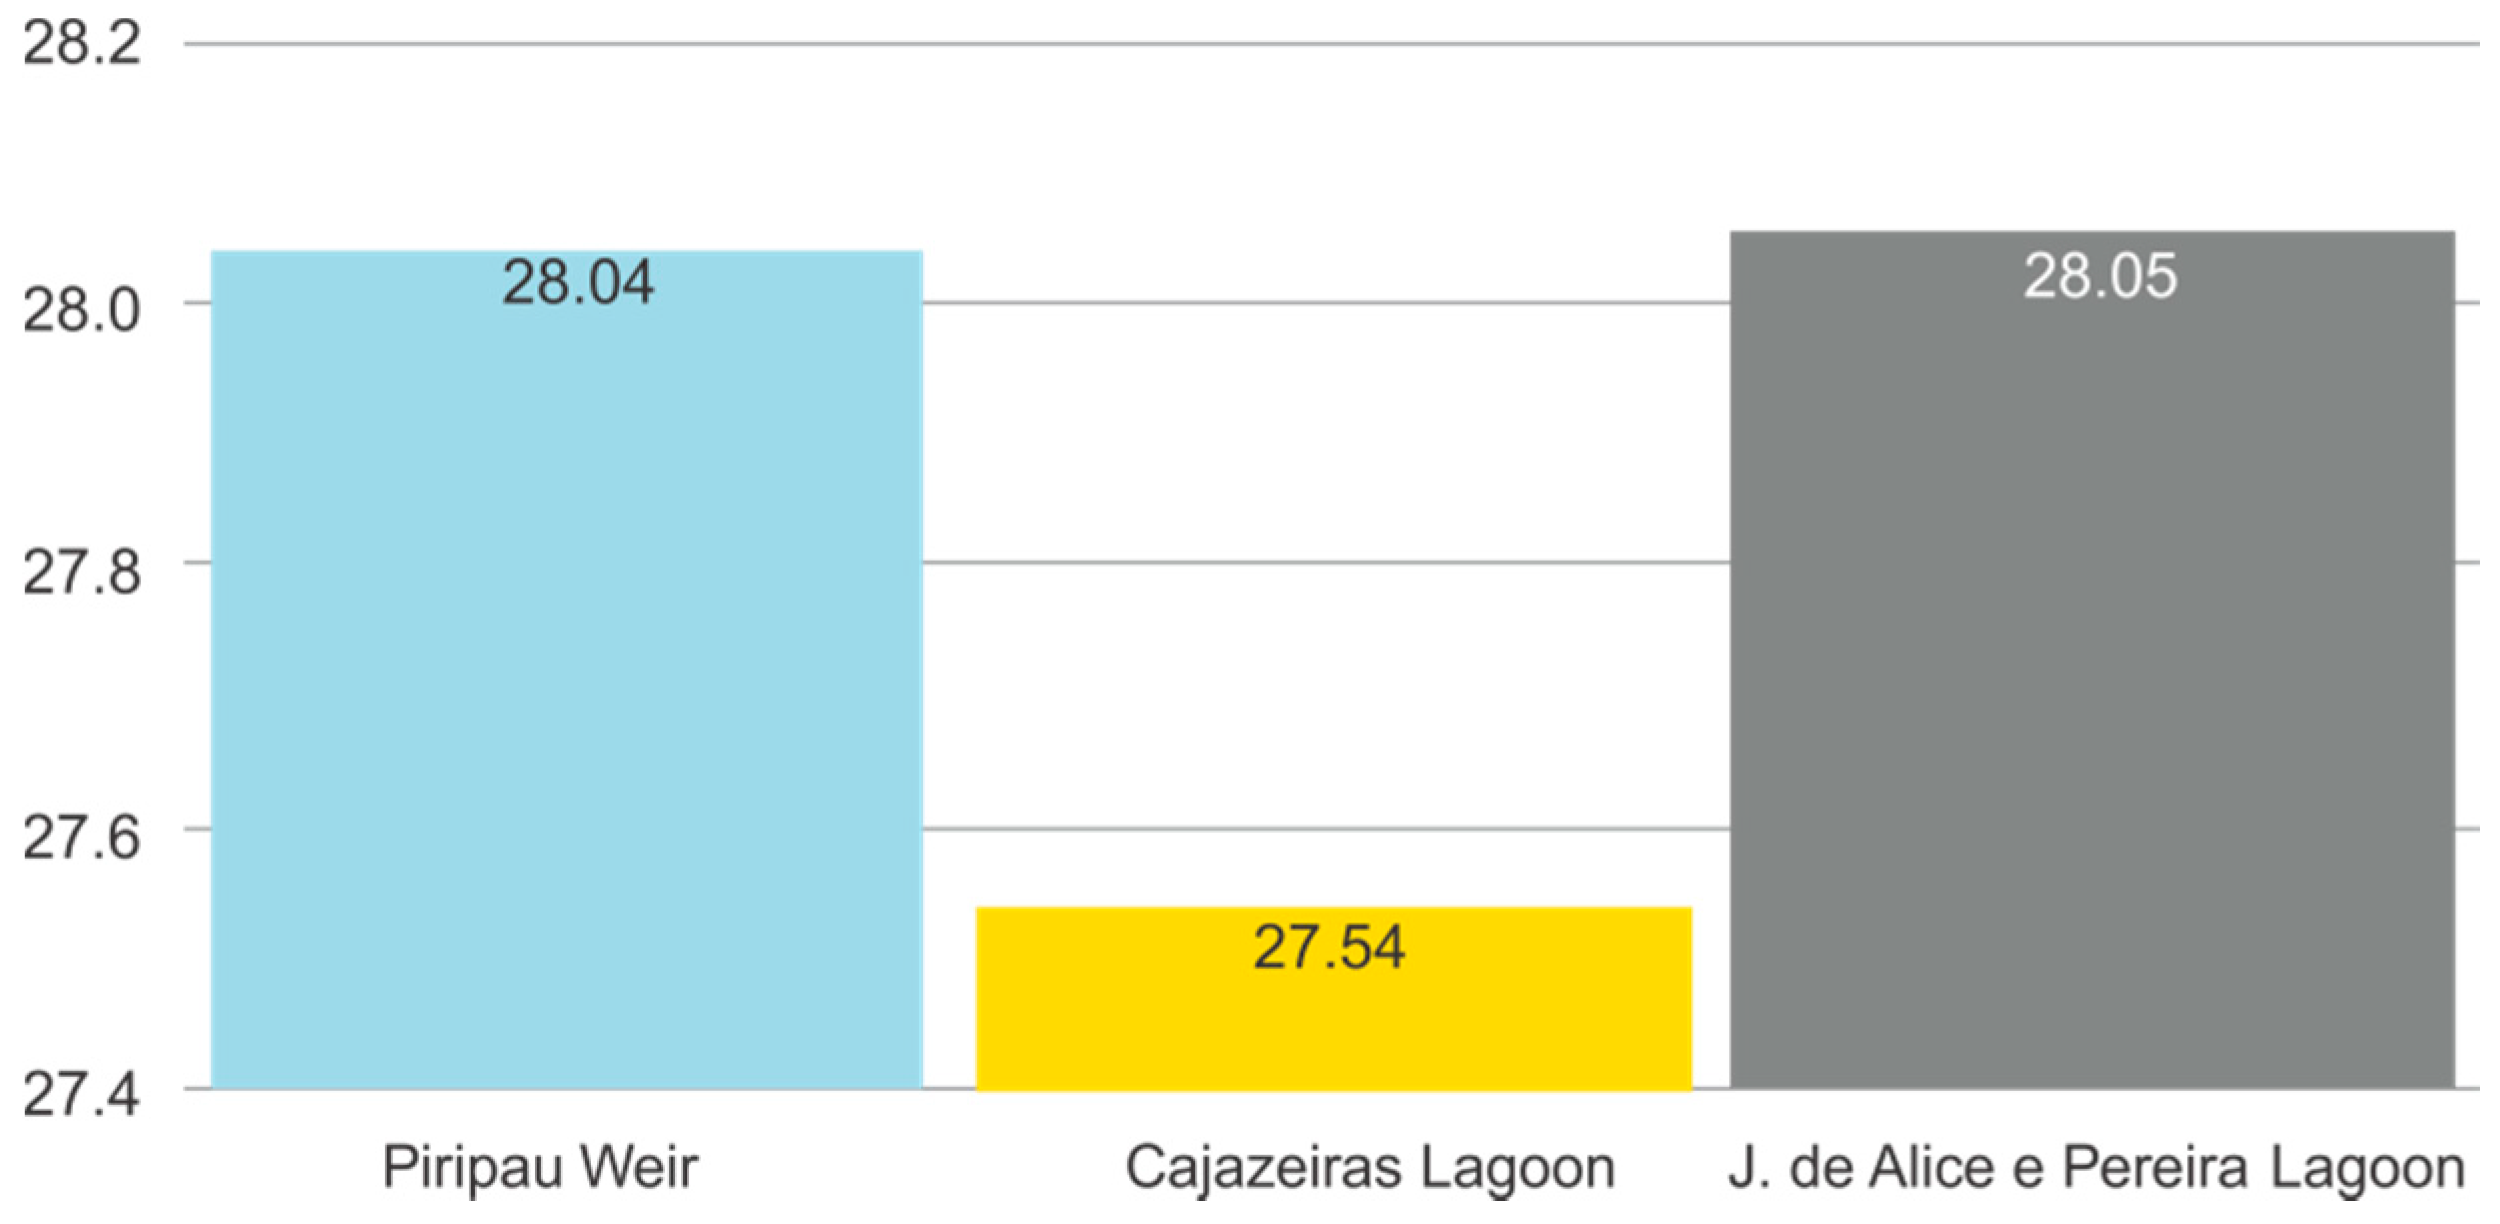
The average temperature of water obtained divergent results in two situations—in the lagoon of condominium Jardins de Alice e Pereira, its value in the evening was higher than the ambient temperature (28.05 °C), whereas in the Cajazeiras Lagoon and in the Piripau weir, the values were lower during the day, with values of 27.54 °C and 28.04 °C, respectively.
Figure 28 shows the averages of water temperature in the three lakes analyzed.
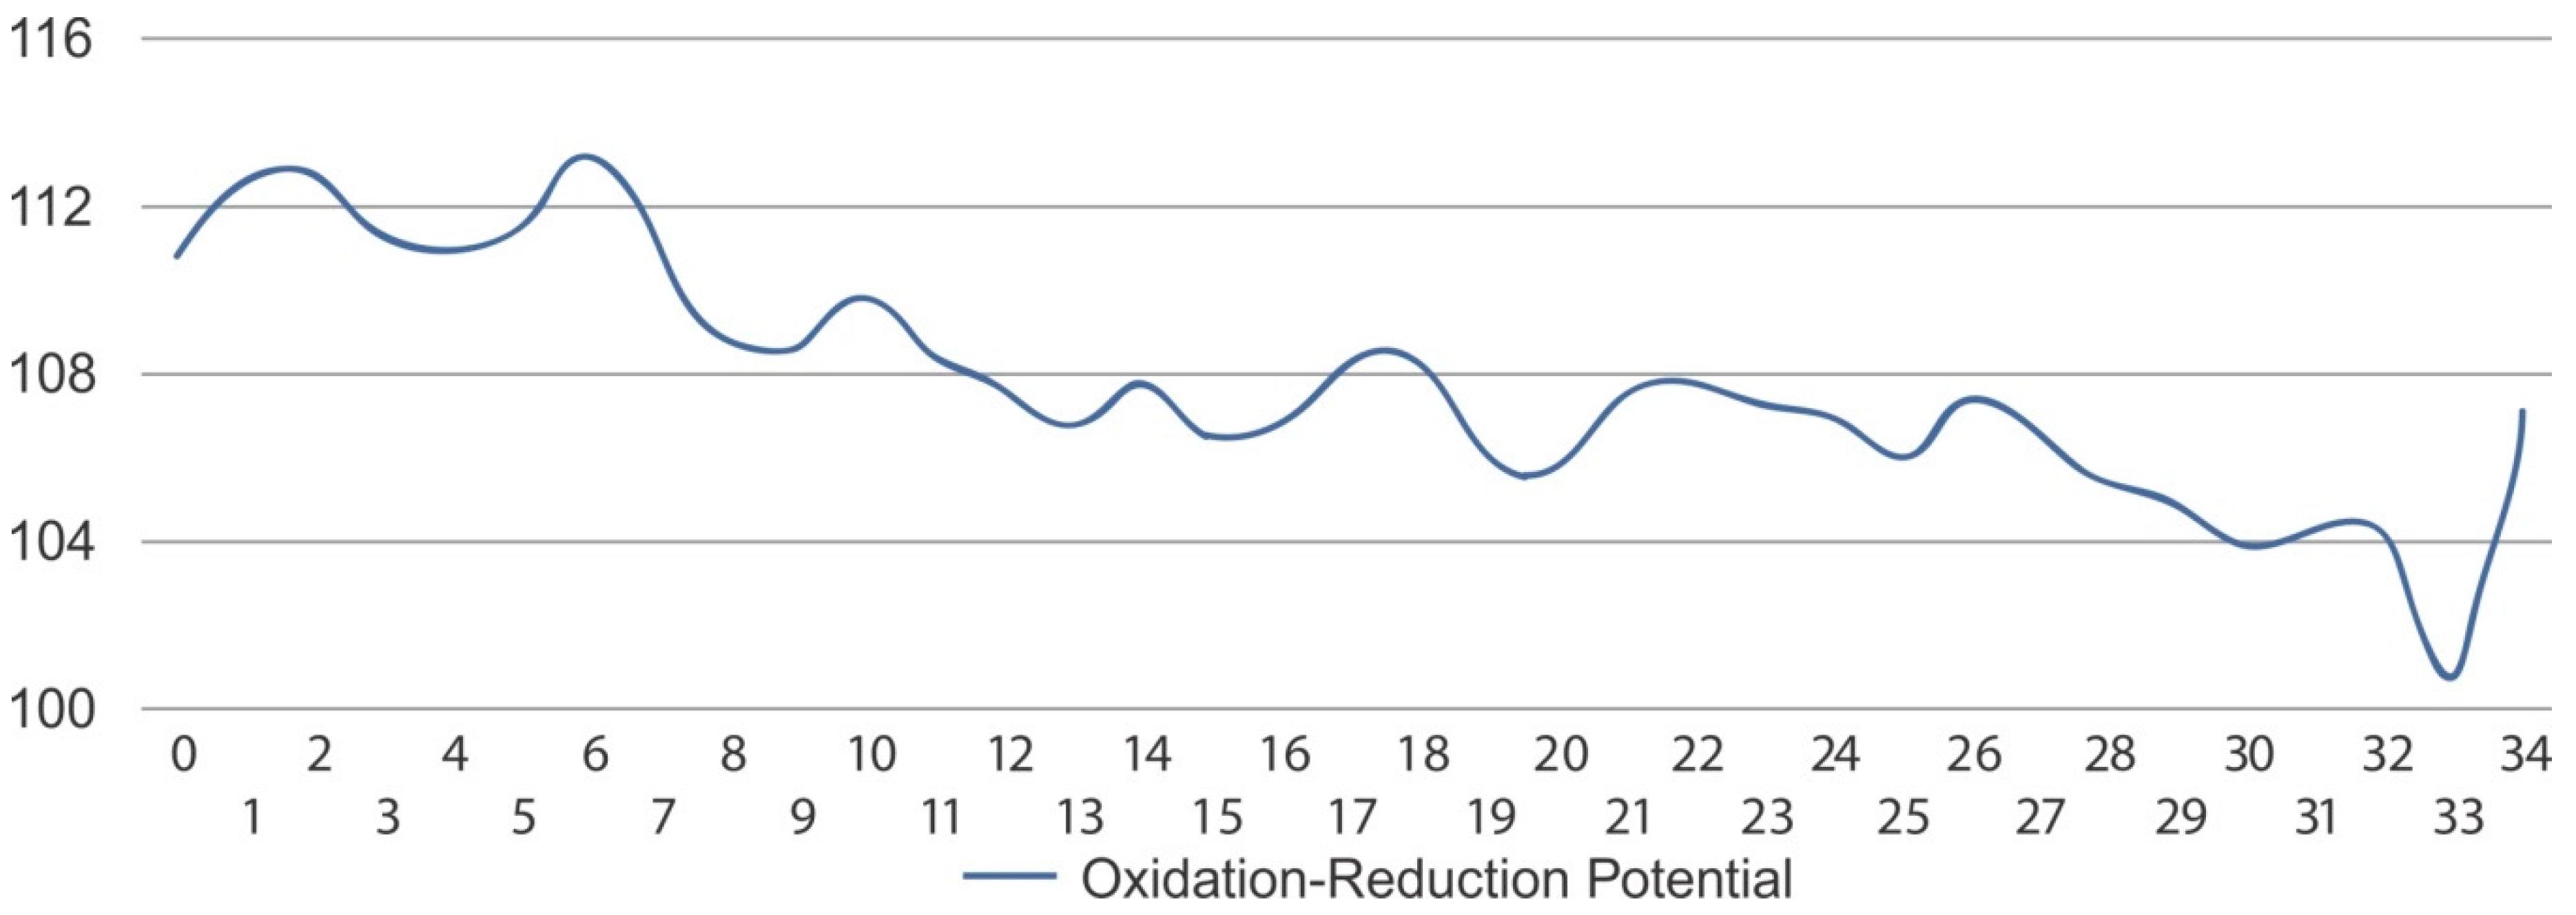
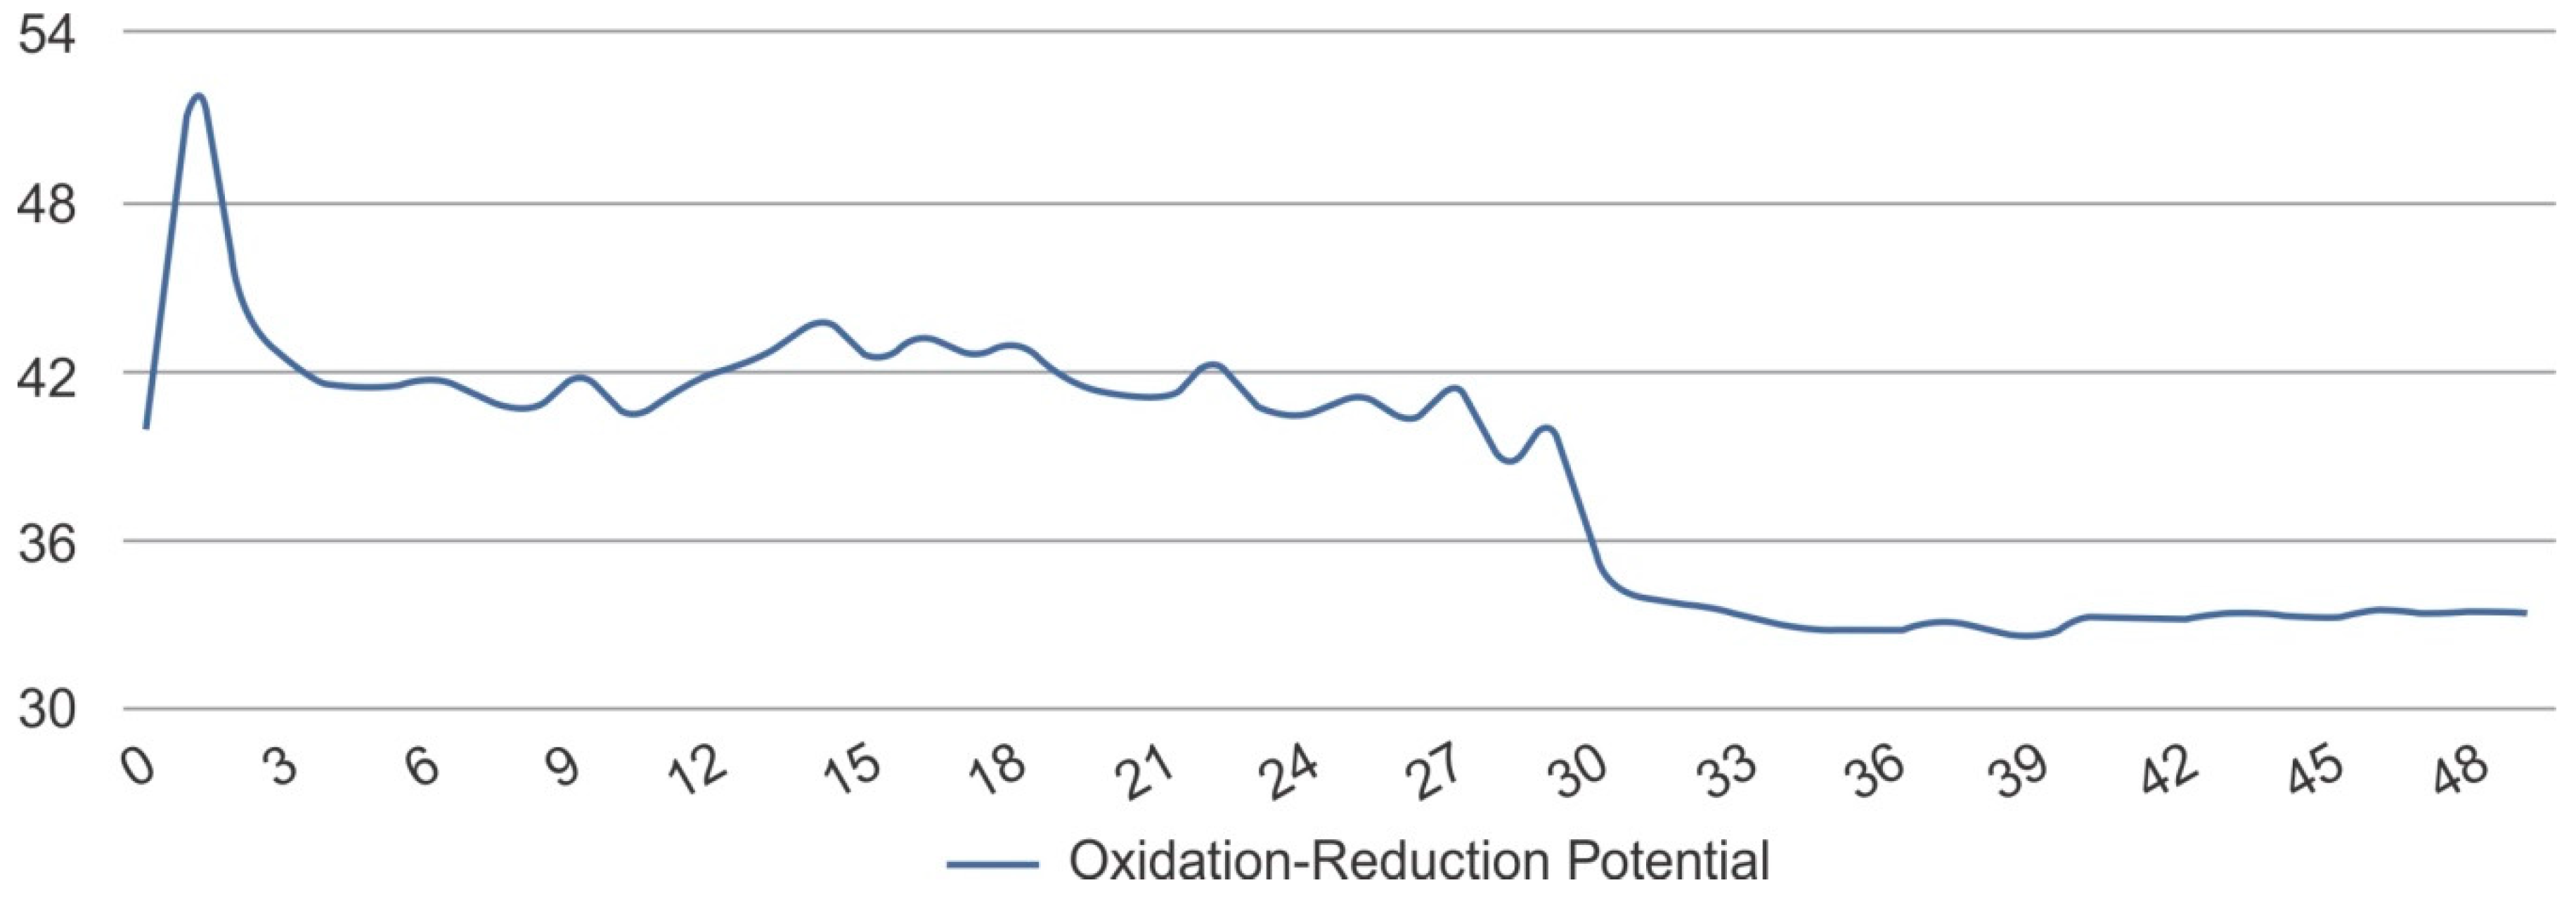
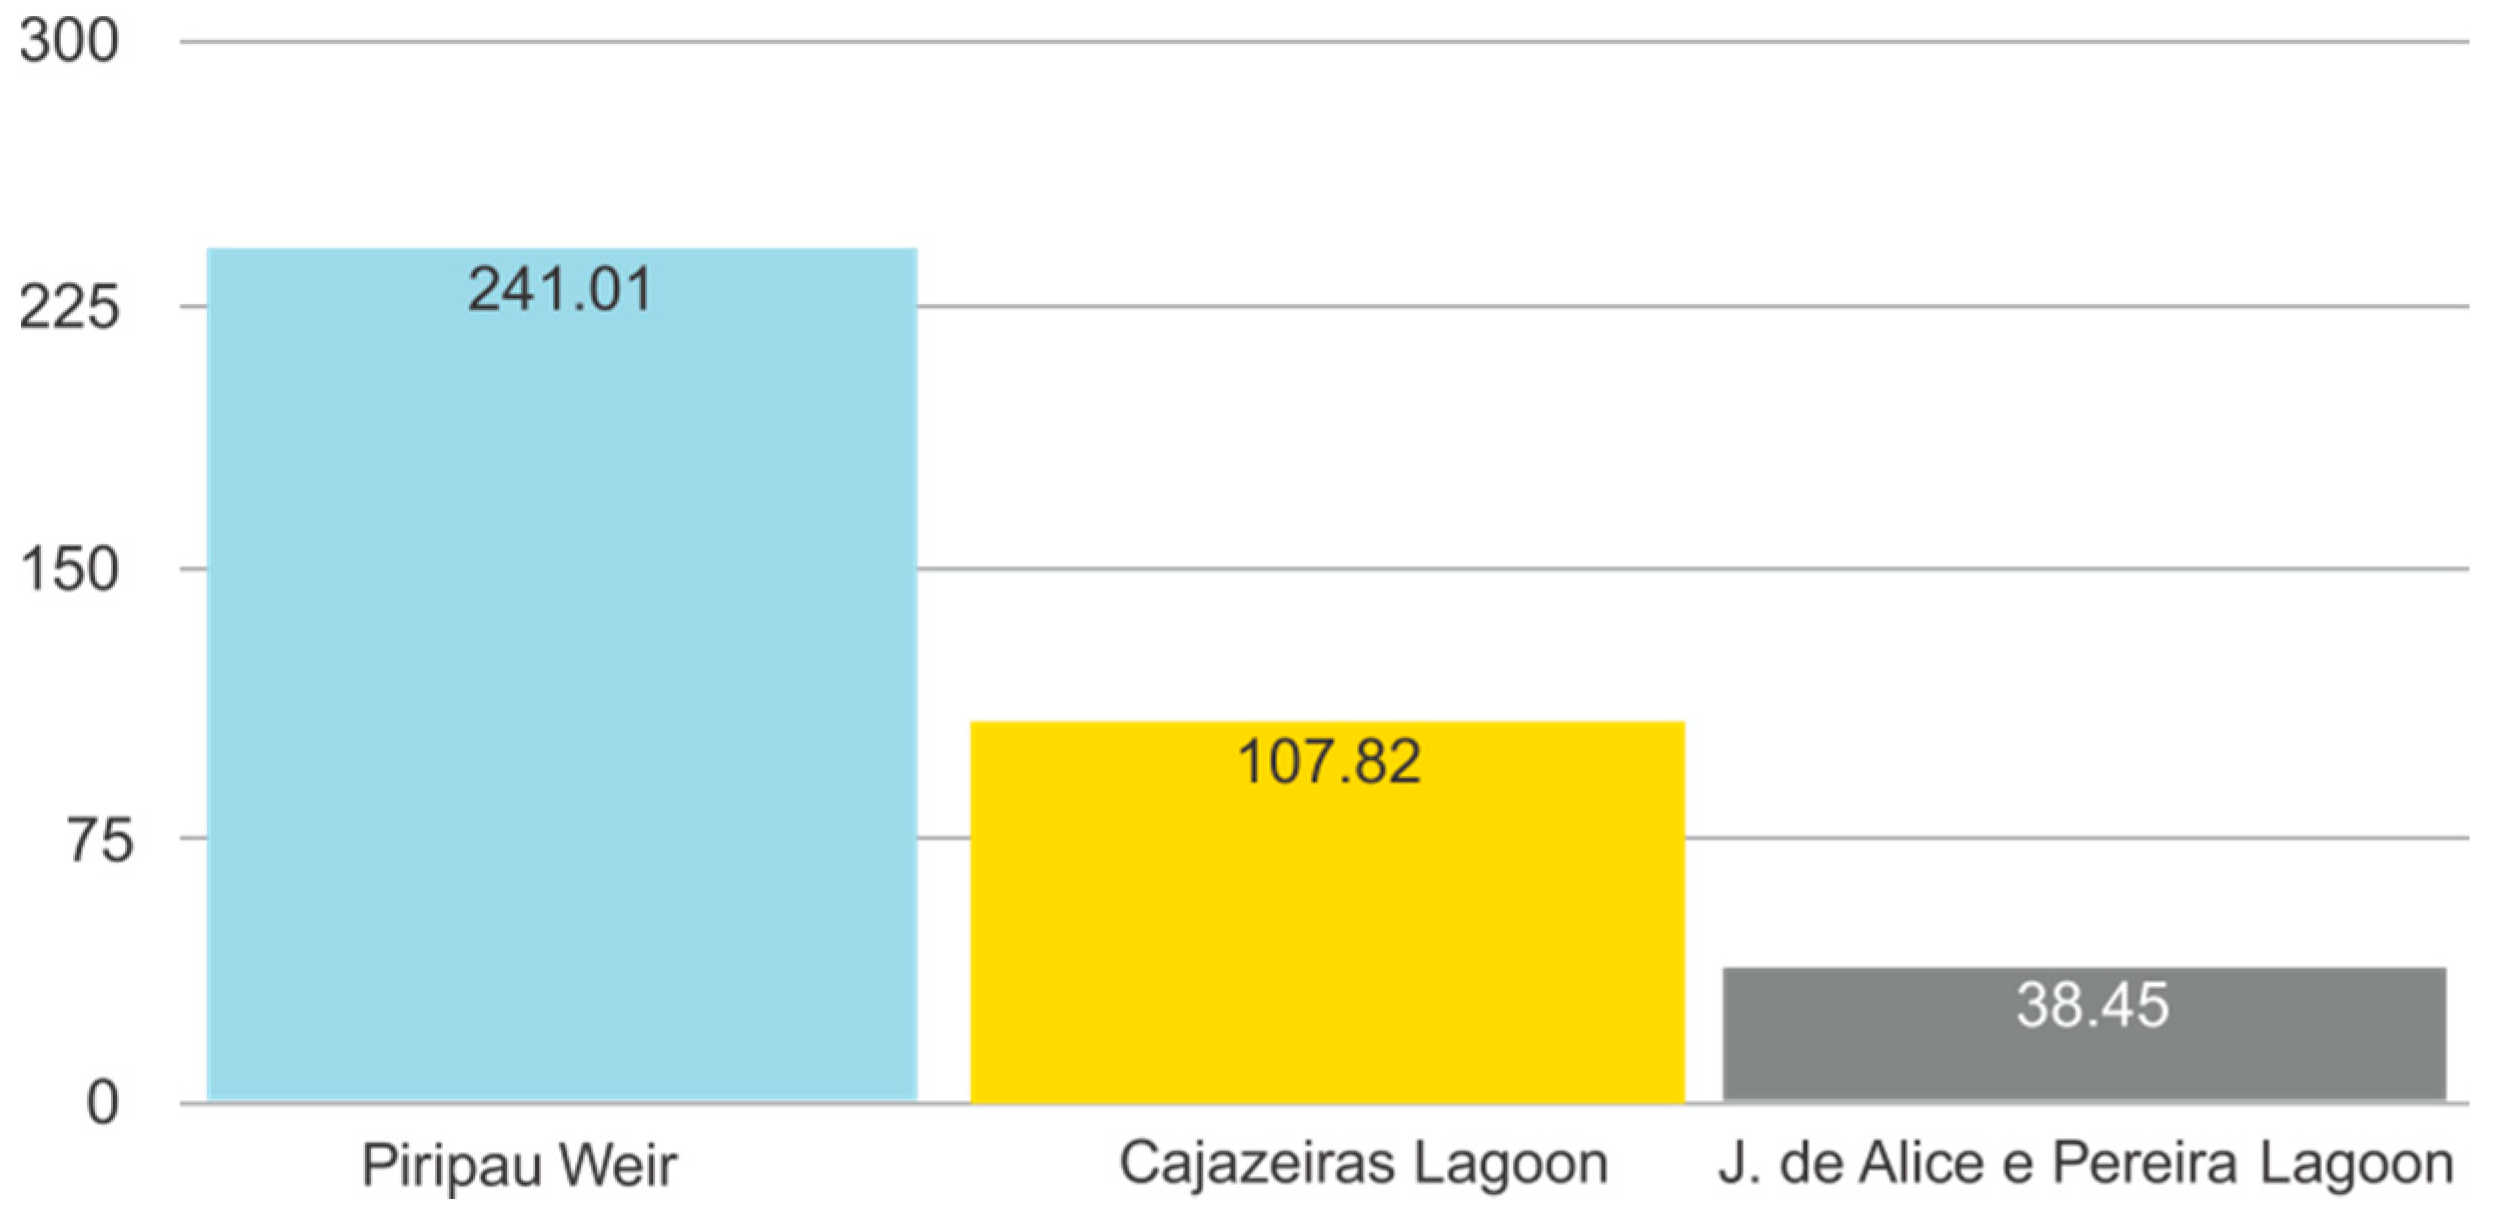
The Oxidation-Reduction Potential in the Piripau weir showed a good average, compared to the other two lagoons, reaching an average of 241.01 mV, while in the lagoon of condominium Jardins de Alice e Pereira, its value was 38.45 mV. In the Cajazeiras Lagoon, this value was 107.82 mV. This was due to the high rate of atmospheric oxygen and the availability of nutrients to aquatic communities, which was observed by the presence of in situ water hyacinths.
Figure 29 shows the mean values of the ORP in the three analyzed lakes.
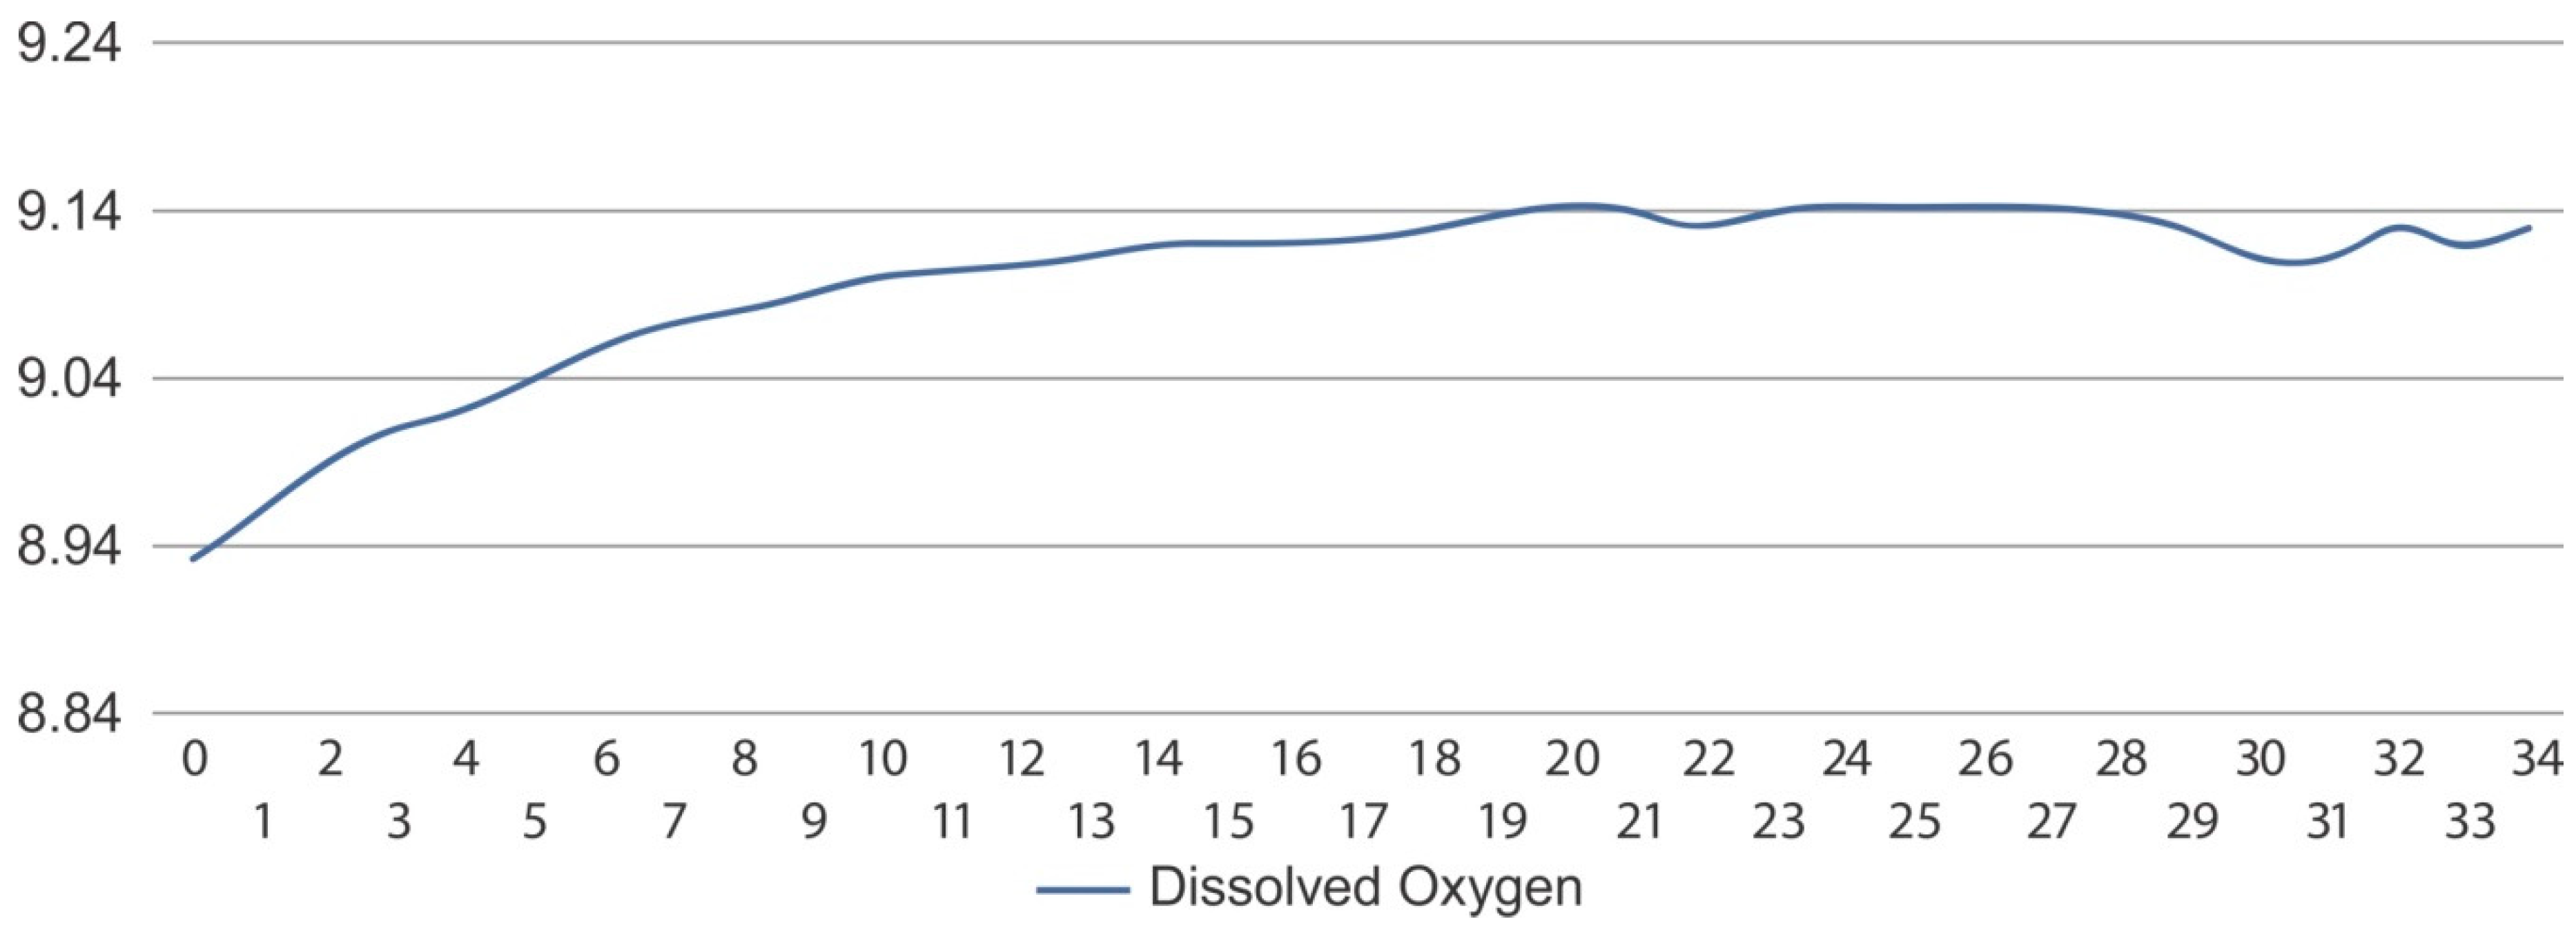
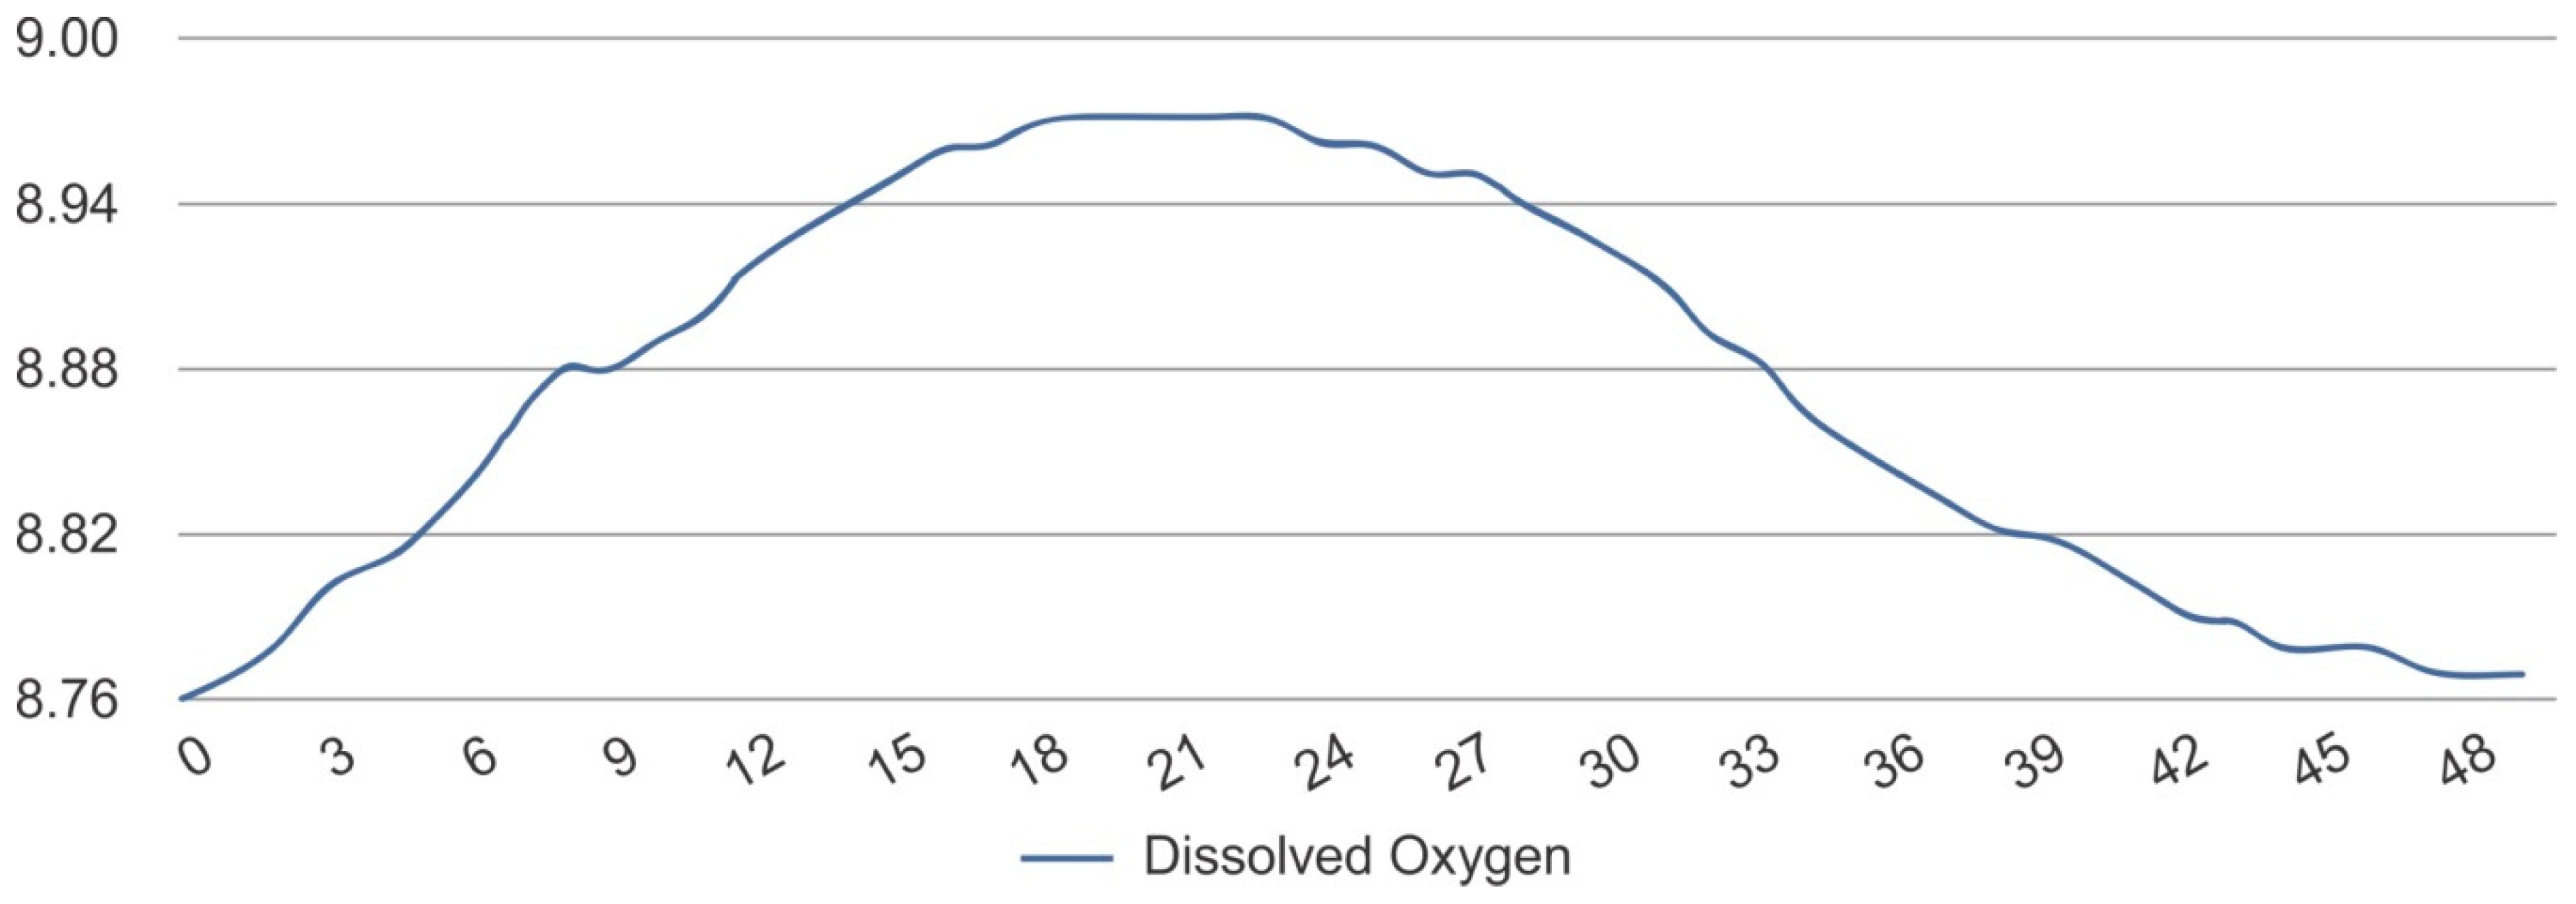
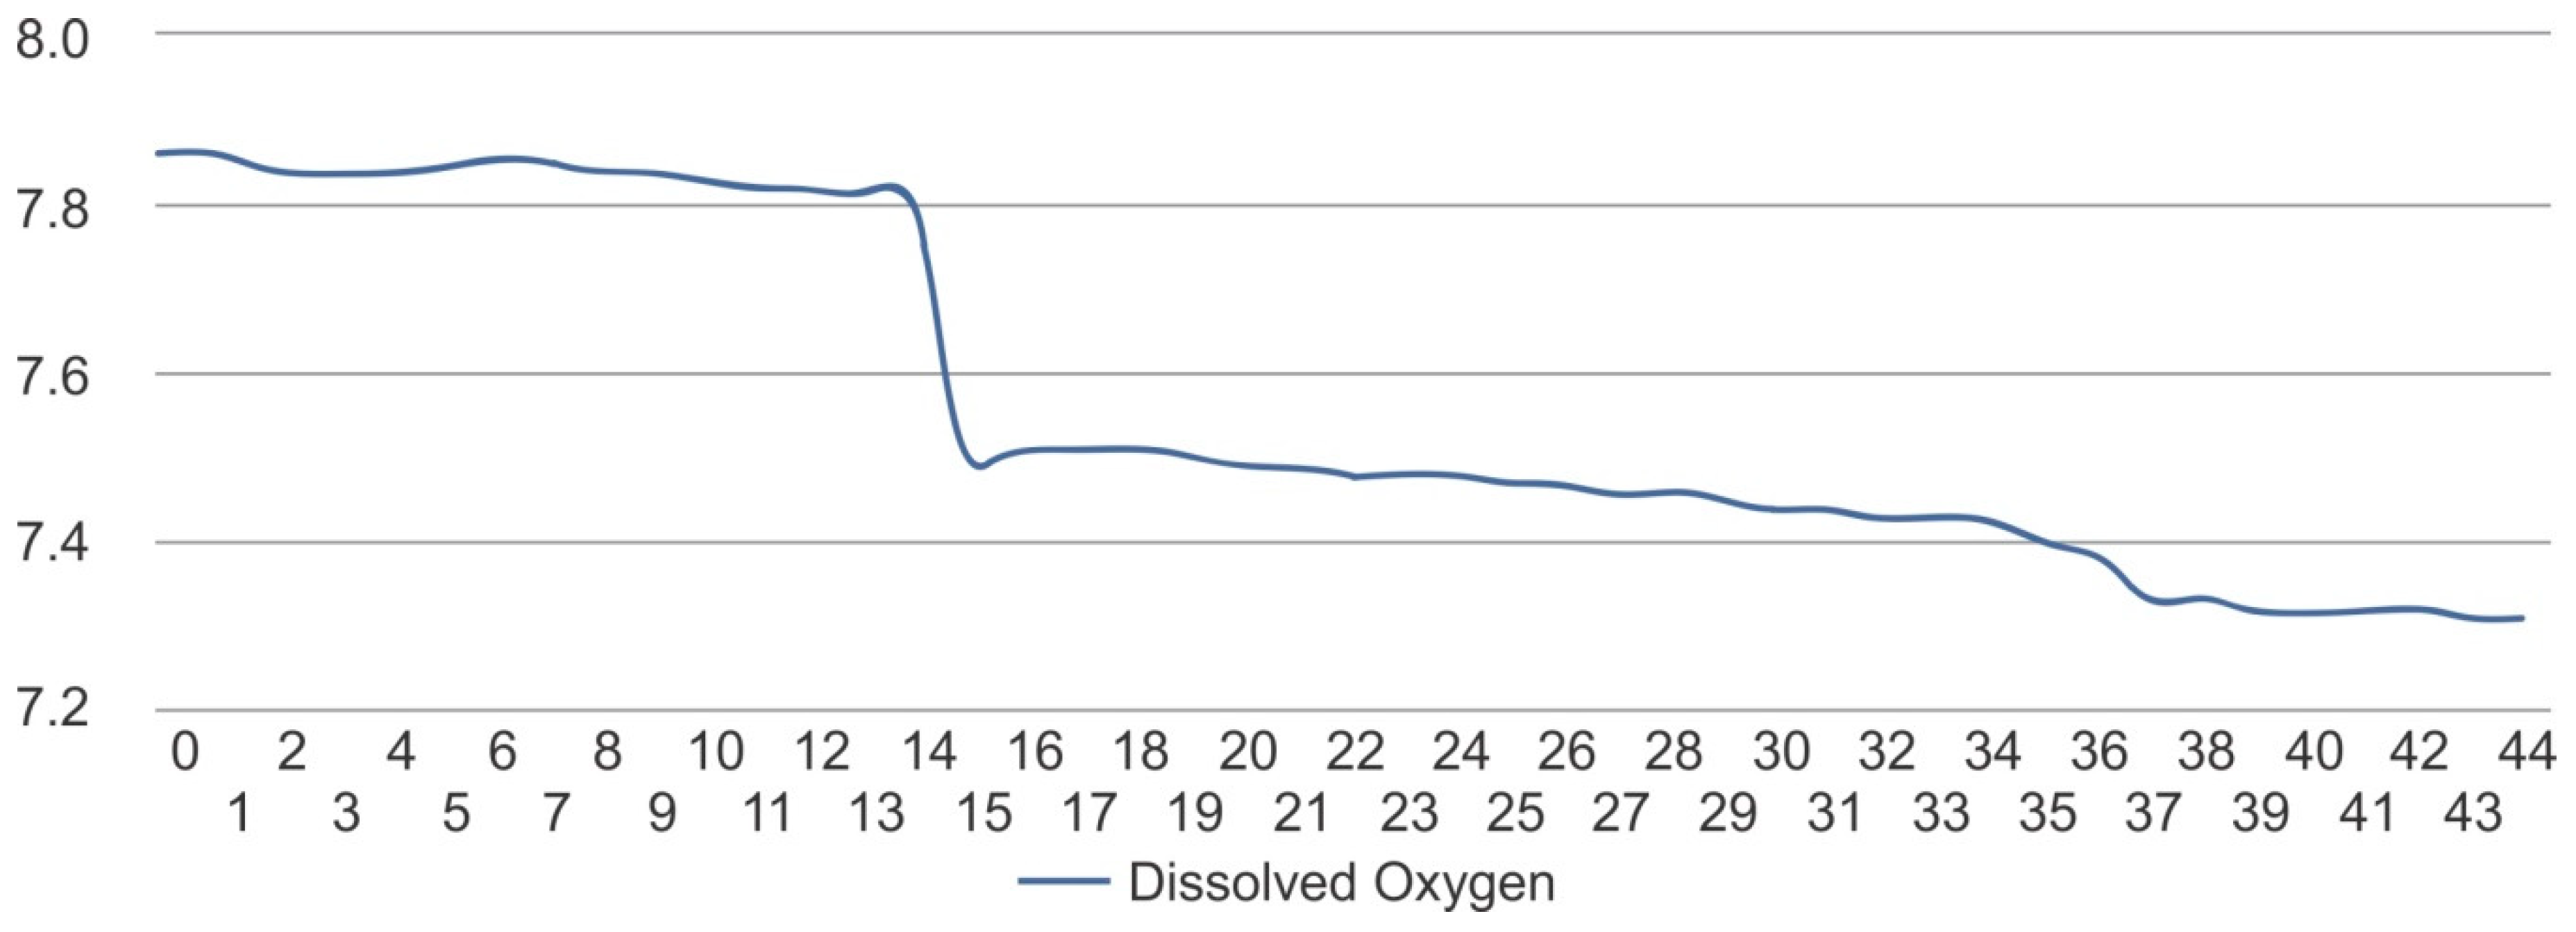
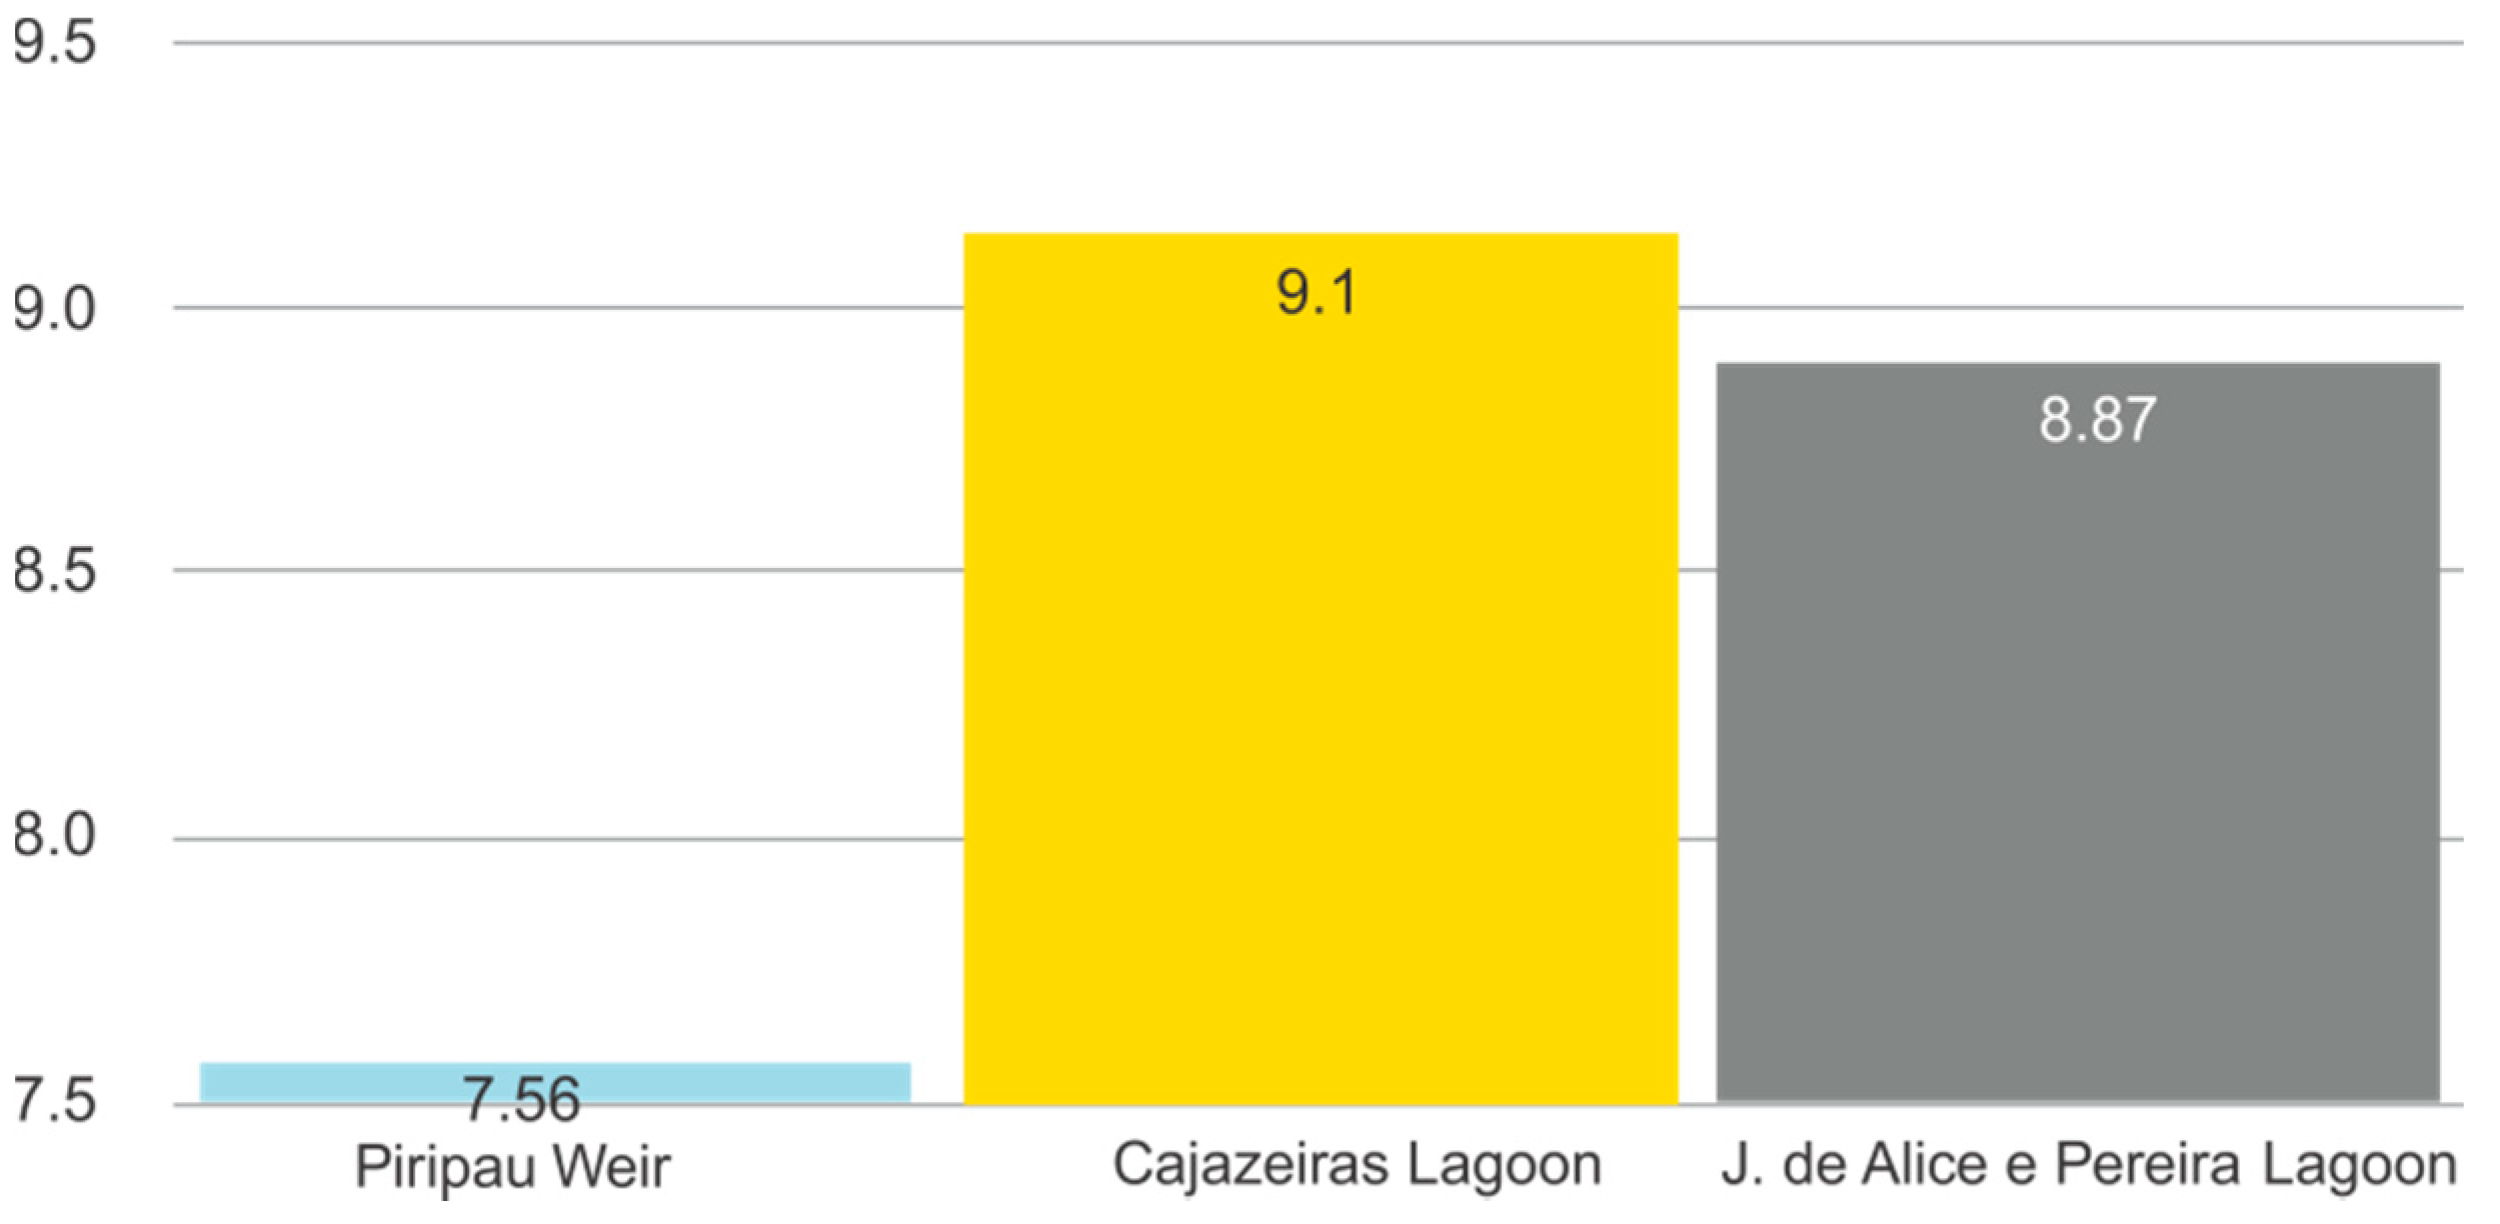
Dissolved Oxygen obtained a higher value in the Cajazeiras Lagoon, with 9.1 ppm, whereas it was 7.56 ppm in the Piripau weir and 8.87 ppm in Jardins de Alice e Pereira. The amount of dissolved oxygen present in the water bodies was directly proportional to the atmospheric pressure and inversely proportional to the temperature, as observed in the Cajazeiras Lagoon, which had a higher value, and in the Piripau weir, which had a lower value.
Figure 30 shows the mean values of OD in the three lakes analyzed.
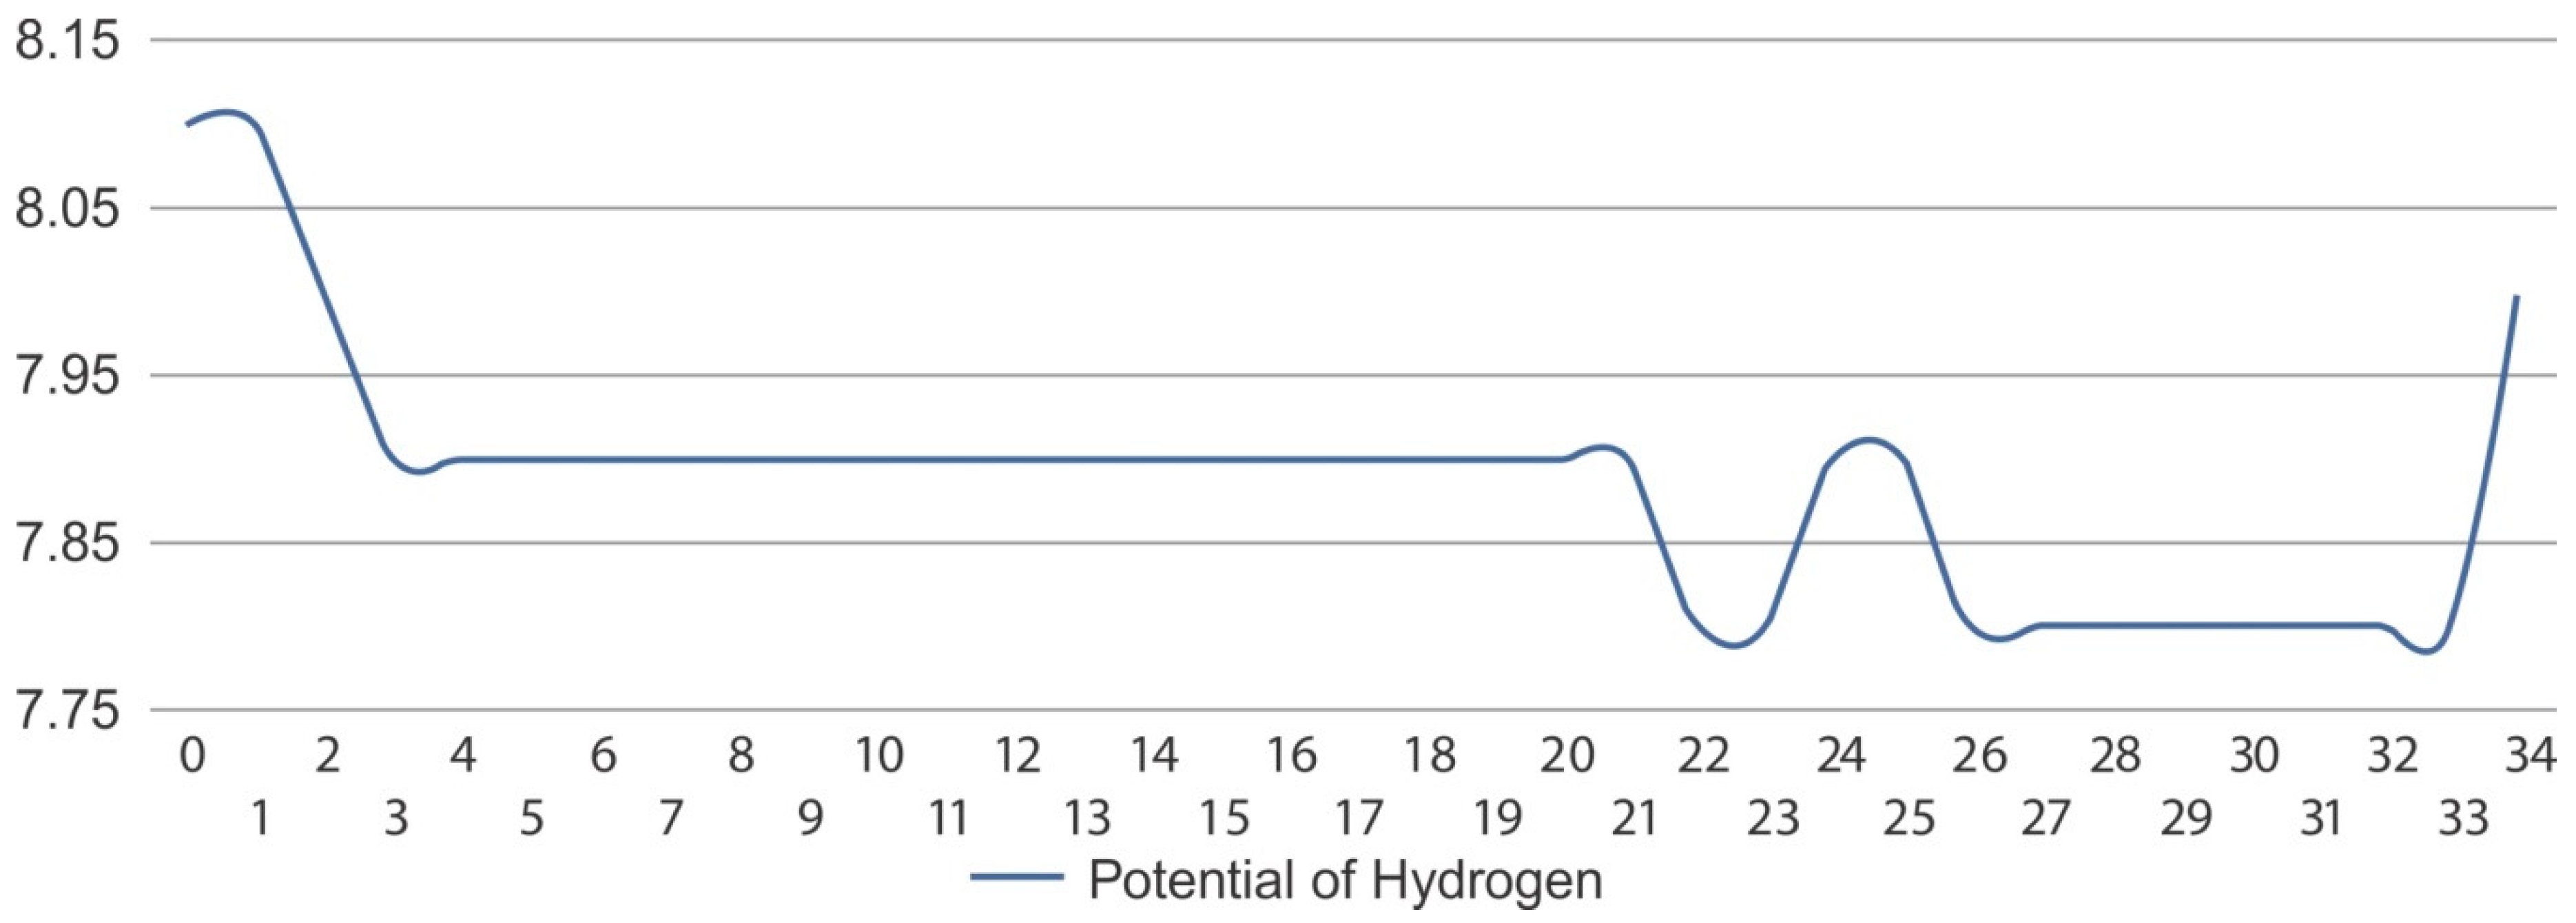
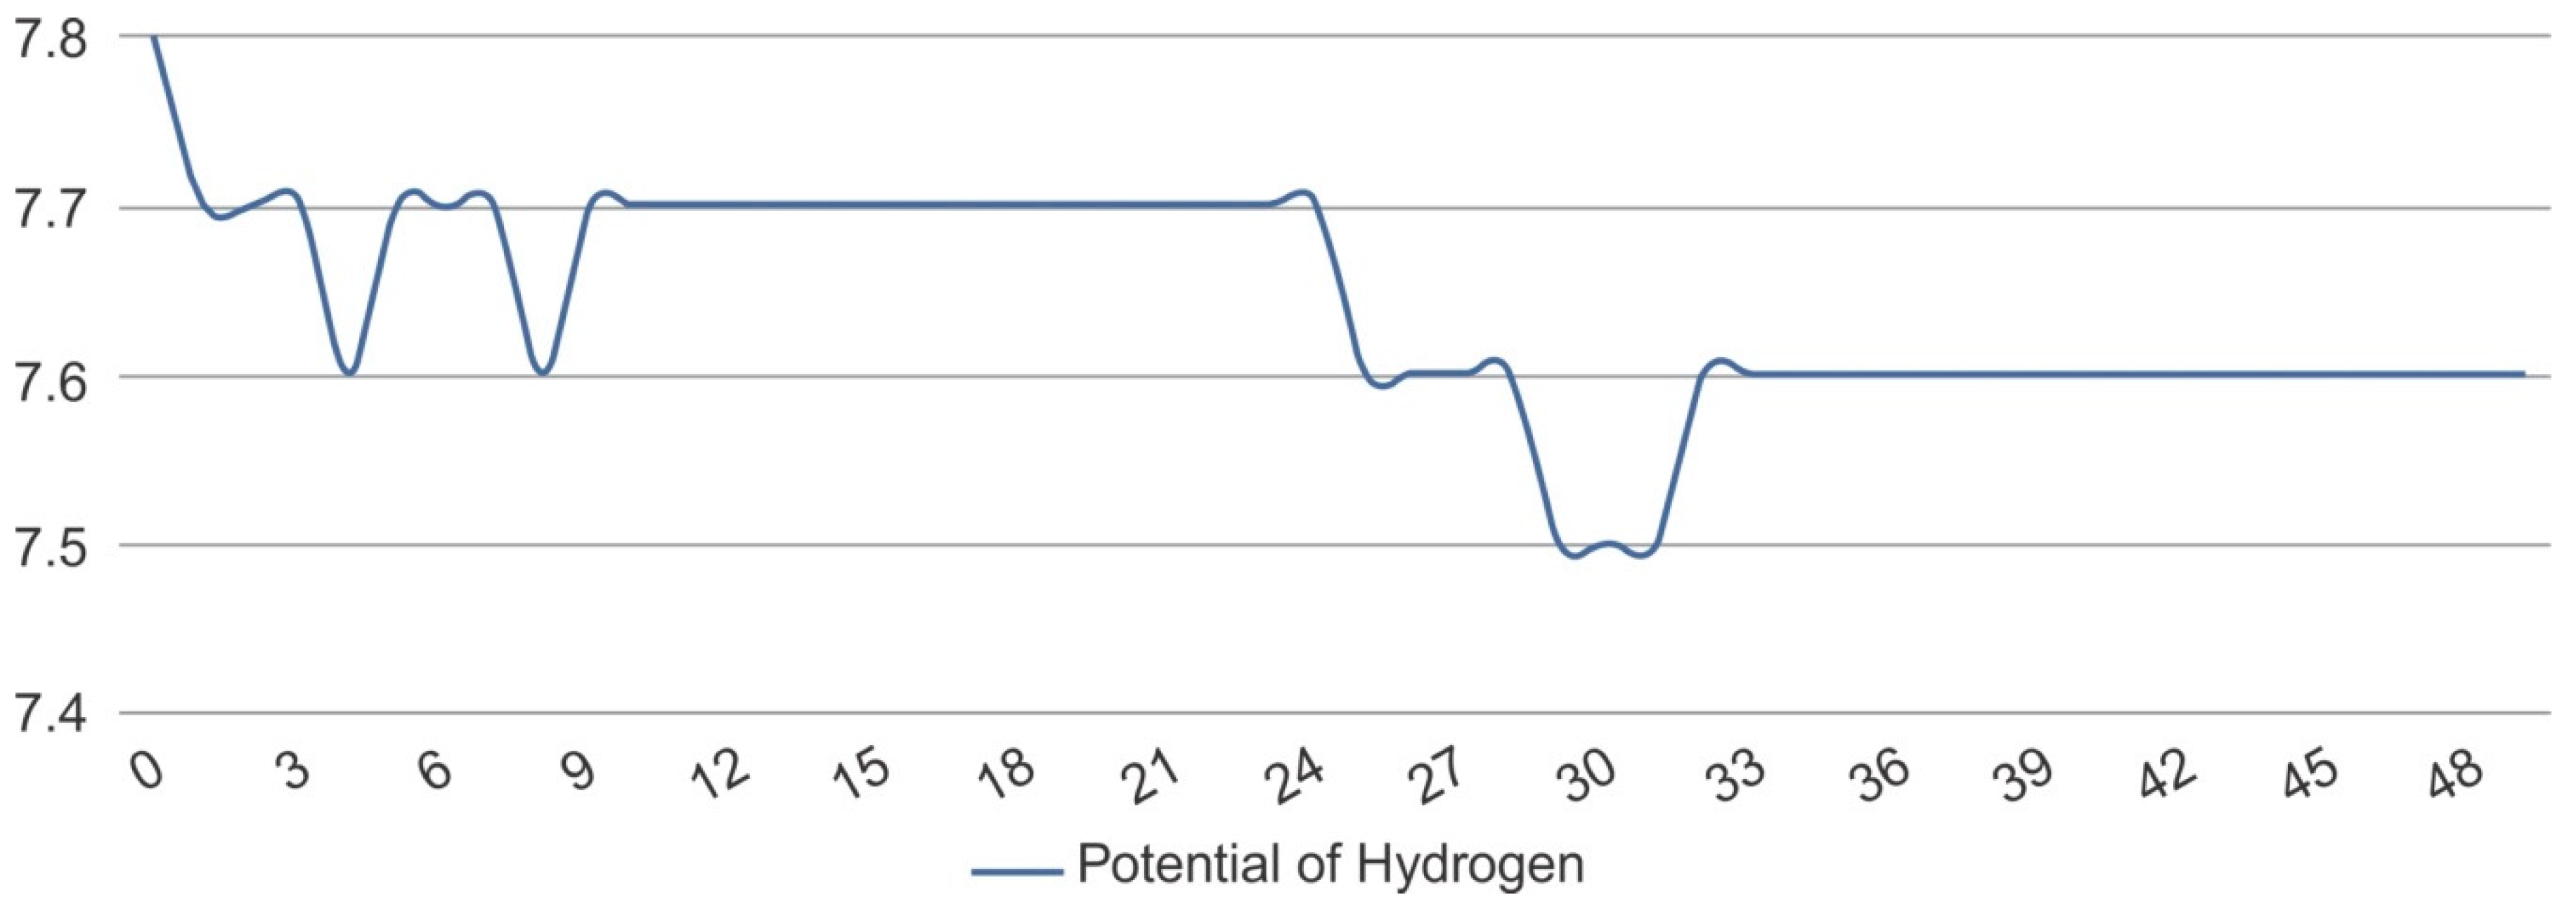
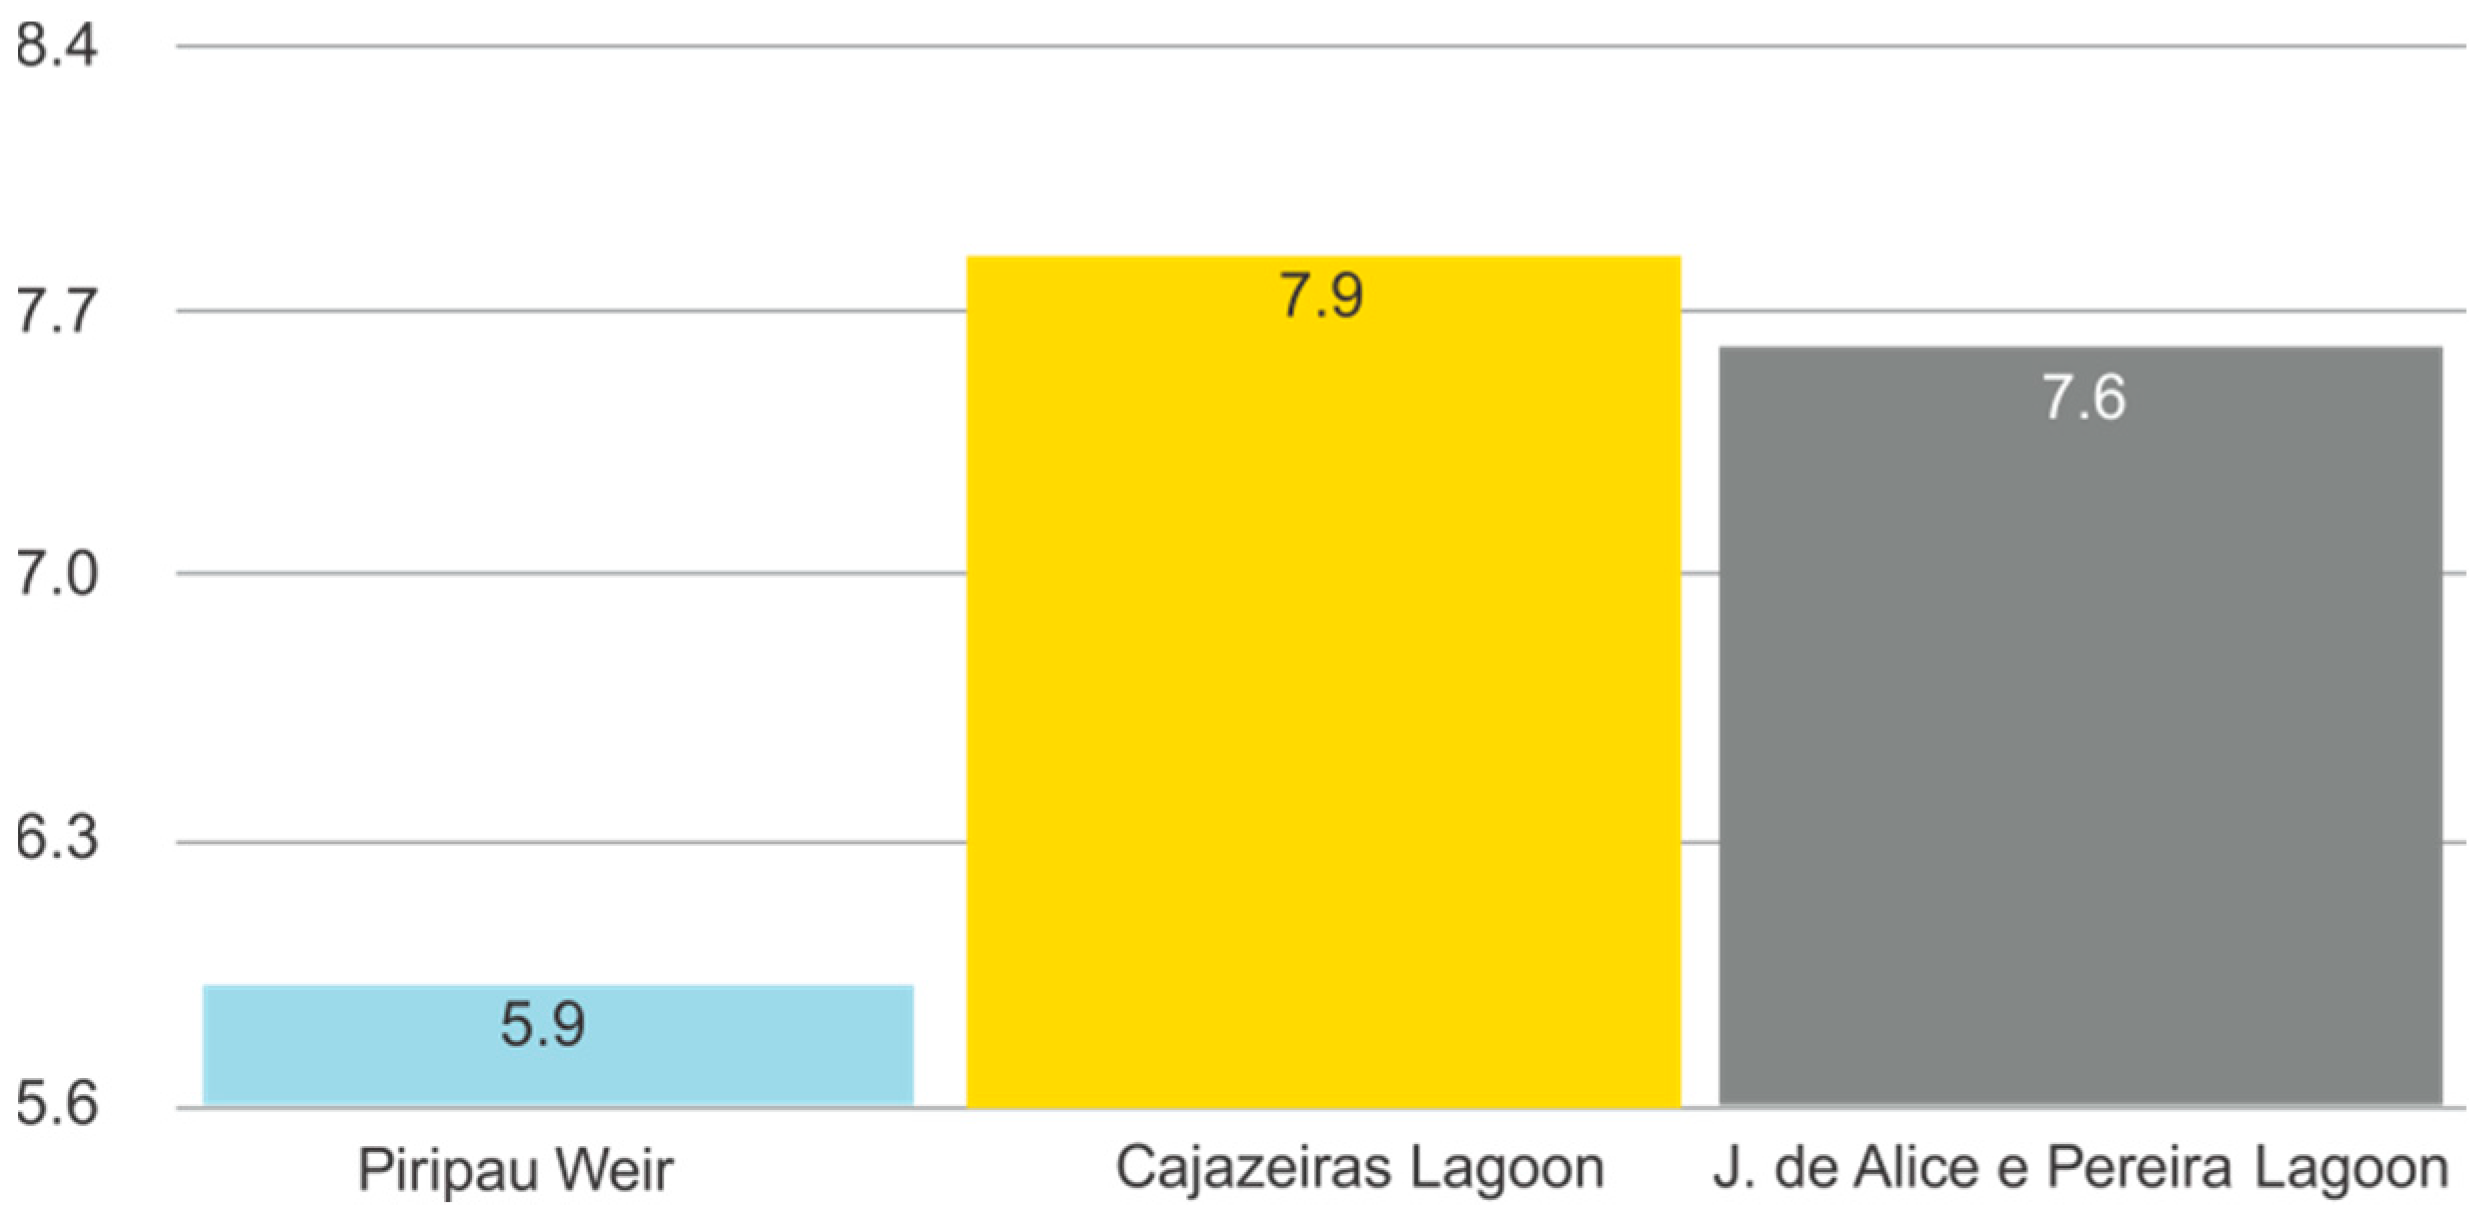
The Potential of Hydrogen (pH) obtained a value of 5.9 in the Piripau weir and 7.9 in the Cajazeiras lagoon. In the lagoon of the condominium Jardins de Alice e Pereira, its value was 7.6. This was due to the dissolution of rocks, absorption of gases from the atmosphere, oxidation of organic matter, and photosynthesis, as could be observed in the Cajazeiras Lagoon, where the value was higher, and in the Piripau weir, at the base of the mountain, where this value was lower.
Figure 31 shows the pH averages in the three lakes analyzed.
In the experiments carried out, the Airboat Vector analyzed 2 lagoons and 1 lake; 130 data collections were carried out and 15 graphs were analyzed and generated. The total time of the missions was 54 min and 25 s, in the 3 lagoons, which resulted in the following discussion parameters:
Dissolved Oxygen—Indicator parameter of eutrophication by domestic or industrial water pollution [
29]. Values below 6 mg/L are indicators of high nutrient load, such as nitrogen and phosphorus [
30], while waters with excessive growth of algae and macrophytes present values higher than 10 mg/L in the daytime period and near zero concentration, at night [
31]. Such values were not reached in any of the analyzed lakes.
Potential of Hydrogen—Concentration of ions in water indicating the intensity of acidity, neutrality or alkalinity. The Resolution 357 of the National Council of the Environment (CONAMA) has established a range of 6–9 for all freshwater [
32]. The Piripau weir showed an average of 5.93, indicating a more acidic character, in relation to the other two lagoons analyzed. The low pH of the effluent (< 7.0) might have occurred due to the organic overload and low oxygen conditions, or because of nitrification, when the alkalinity of the lake (buffer capacity) was low [
33]. According to Metcalf [
34], bacteria, for example, do not support pH above 9.5 or below 4.0, thus, the optimum pH range is between 6.5 and 7.5.
Temperature—Measurement of the heat intensity that influences the solubility of gases in water. In general, as the temperature increases from 0 to 30 °C, variables such as viscosity, surface tension, compressibility, specific heat, ionization constant, and latent heat of vaporization decrease, whereas thermal conductivity and vapor pressure increase [
31]. In the Cajazeiras Lagoon and the Piripau Weir, averages of the ambient temperature of 30.93 °C and 33.89 °C were recorded to be above 30 °C, for both. For the averages of the water temperature, these values were below 30 °C.
Oxidation–Reduction Potential—is the representation of changes in the oxidation state of ions or nutrients, related to the solubility of metals and the availability of these nutrients to the aquatic communities [
35]. It is worth noting that Resolution CONAMA 357 did not establish minimum or maximum standards for a potential redox of the waters.
8. Conclusions
This work described the development, construction, and implementation of a robotic airboat to measure water quality in lakes. In general, it can be stated that the prototype obtained good results for an automatic field analysis, to provide relevant data on lagoon conditions. Along with the explicit benefits of data collection and analyses, other important contributions of this work are—this system helps to understand the biome and the behavior of aquatic animals in relation to water pollution, in a precise way; it automates the activity of the operator, since they sometimes do not have the resources, besides the lack of care in handling the collection containers; it provides security in the logistics; avoiding the reserve of laboratory services, which must be available on the day of collection, as well as the considerable increase in the number of evaluated points, thus, providing a better evaluation of the lagoon.
In addition, the use of Wi-Fi, even with a limited range, did not cause a loss of performance to the vehicle. The boat operated entirely autonomously, through its embedded system, fulfilling the mission designed for it. The data collected was stored on board and transmitted to the station, when it was within the limit of the Wi-Fi transmission.
For future work, more sensors should be added, such as a bathymeter for studying and mapping the depth of an aquifer; a 3D map can be generated for the silting studies, as well as the inclusion of 3G or satellite communication systems, whose data can be sent to the world wide web (Cloud) network, thus, providing a remote refresh rate for water analysis, anywhere in the world (IoT). A mechanized sluice system can be incorporated into the boat, to collect water samples in small reservoirs, for later and more detailed analysis, such as fecal coliforms, which demand a more time-consuming process for cultures in laboratory and whose result is only available after a few days.


