1. Introduction
Reality capture using light detection and ranging (LiDAR) technology has emerged as a vital advancement in fields such as surveying, construction, architecture, and urban planning. In surveying and mapping, LiDAR is extensively used for land surveying and geospatial mapping to create detailed and accurate 3D point clouds of terrains and structures. In construction, 3D point clouds assist in site surveying, progress monitoring, quality control, and clash detection [
1]. In archaeology and cultural heritage preservation, it documents archaeological sites and heritage structures, capturing intricate details of historical significance [
2]. In urban planning, it contributes to generating detailed city models [
3]. In environmental monitoring, LiDAR technology with autonomous drones and underwater robots is used for mapping ecosystems, tracking changes in landscapes, and monitoring pollution. Interestingly, LiDAR point clouds have been found to be useful in the visualization and promotion of tourist attractions, as evidenced in [
4].
In this article, we focus on reality capture using 3D LiDAR technology, specifically using a terrestrial laser scanner (TLS). Despite the development of lightweight and high-speed laser scanners, manual scanning using the tripod method is still time-consuming and tedious. Point cloud preprocessing and registration for complex environments are complicated, making the manual acquisition of accurate 3D point clouds of these environments burdensome and expensive.
To speed up registration, the Riegl VZ-400i uses a micro-electromechanical system (MEMS) inertial measurement unit (IMU) for scanner pose estimation. The Leica RTC360 3D laser scanner uses photogrammetry to determine the positions of devices in 3D spaces based on visual inertial system (VIS) technology. Faro scanners use global positioning system (GPS) information for the rough placement of scans that have been taken outdoors.
To increase the mobility of scanners, Faro® designed cart systems, named Faro® Swift and NavVis® systems, which allow survey personnel to place tripods and scanners on carts to push around survey sites for faster scanning. NavVis® developed a simultaneous localization and mapping (SLAM)-based wearable mobile LiDAR mapping system, enabling survey personnel to capture 3D data flexibly and quickly by wearing the system while walking around survey site. Both the Faro® Swift and NavVis® systems significantly reduce scanning times compared to traditional TLS methods. However, the quality of the acquired point cloud data is not as high as those from TLS methods and human operation is still required to manipulate the scanning systems.
To automate the scanning process, Faro® developed a solution known as Faro® Trek 3D laser scanning integration, which enables autonomous scanning via the Boston Dynamics Spot®. Their solution initially requires survey personnel to guide the robot through a site to record the scanning path. Afterward, the system can autonomously scan the environment by following the recorded route. However, some limitations include the requirement of human guidance for the initial walk-through, inflexible scanning routes, and the low height of the scanner, which mean that it may not be suitable for scanning cluttered environments.
To address these challenges, this article introduces BIMBot, an autonomous scanning system that integrates TLS and robotics for efficient, accurate, and fully autonomous 3D point cloud creation in architectural and construction surveying. The system minimizes human intervention and scanning times without compromising on detail or completeness. BIMBot represents a significant step toward efficient autonomous reality capture in complex environments by streamlining the process and improving the quality of as-built BIM models. Our contributions include:
The remainder of this paper is organized as follows:
Section 2 introduces related works;
Section 3 describes the proposed system; experimental analyses are presented in
Section 4; a discussion of a few issues with the current approach is found in
Section 5; finally, our discussion and conclusions are presented in
Section 6.
2. Related Work
A comprehensive survey on autonomous scanning platforms can be found in [
5], which emphasizes the autonomous 3D scanning of buildings. In this brief review, we focus on automating scanning approaches for BIM model reconstruction and digital twin applications.
The first published autonomous scanning platform dates back to 1996 [
6] and comprised a 3D model reconstruction procedure involving multiple range images from a laser range finder. Their point cloud registration method was based on the high-level features of the range images, for example, edges and surfaces. Another pioneering work by [
7] also proposed an autonomous mobile robot for the 3D digitalization of indoor environments. In their implemented system, they used simultaneous matching to register multiple 3D scans. Their 2D-based NBV algorithm simulated a horizontal laser scanner and calculated the number of intersections with unseen edges to estimate information gain. The choice of next best view pose was optimized based on information gain value, distance, and angle from the current position.
In [
8], an autoscanning robot equipped with a modern 3D laser range scanner was proposed. Their work emphasized scanning position planning by proposing a two-stage approach. The first stage dealt with optimizing scanning location as an art gallery problem, solved using randomized methods with scanning constraints. The second stage involved a 3D view planner to estimate one single next best viewing position at a time, using ray tracing to count boundary unseen voxels. The limitation of this method lies in the assumption that 2D floor plans are always available. Ref. [
9] presented a system for autonomous 3D exploration and thermal mapping. The main sensor was a Riegl VZ-400 laser scanner, complemented by optical and thermal cameras. The sensor placement planning strategy alternated between 2D and 3D NBV, depending on whether the exploration was within or between rooms. Ref. [
10] introduced a method for the automatic 3D scanning of structural elements using robots to navigate and scan prominent structural elements in cluttered indoor environments. Ref. [
11] introduced an autonomous system capable of creating detailed 3D semantic models of buildings across five semantic levels using the mobile platform for autonomous digitization (MoPAD). The system performed real-time data collection within building interiors, guided by the next best scan (NBS) algorithm, which strategically selected scan locations that maximized the visibility of structural elements.
Other studies [
12,
13,
14,
15] have explored different scanning approaches and devices for evaluating point cloud quality in 3D as-built BIM model creation. These studies have suggested that point clouds generated by low-quality LiDAR devices using SLAM are often too sparse and inaccurate. As a result, they are generally unsuitable for creating as-built BIM models. In contrast, Ref. [
16] developed an advanced autoscanning system equipped with a high-quality LiDAR device, which proved more effective in generating accurate point clouds for as-built BIM model reconstructions. Ref. [
16] utilized TLS technology in conjunction with unmanned ground vehicles (UGVs) to efficiently automate indoor 3D digitization for building maintenance and construction tasks. Their approach overcame the time-intensive data acquisition and postprocessing challenges associated with traditional TLS systems by employing path planning based on 2D computer-aided design (CAD) floor plans. For point cloud pre-alignment, a combination of Harris 3D detection and the fast point feature histogram (FPFH) descriptor was used. Subsequent alignment refinement was performed using the iterative closest point (ICP) algorithm.
In summary, the evolution of autonomous scanning systems has transitioned from basic laser range finders to modern laser scanners, which incorporate advanced algorithms and robotics. This study specifically focuses on automating the creation of 3D point clouds to enhance both the accuracy and efficiency of this process for downstream applications, including the creation of as-built BIM models and the development of digital twins.
3. Materials and Methods
3.1. Materials
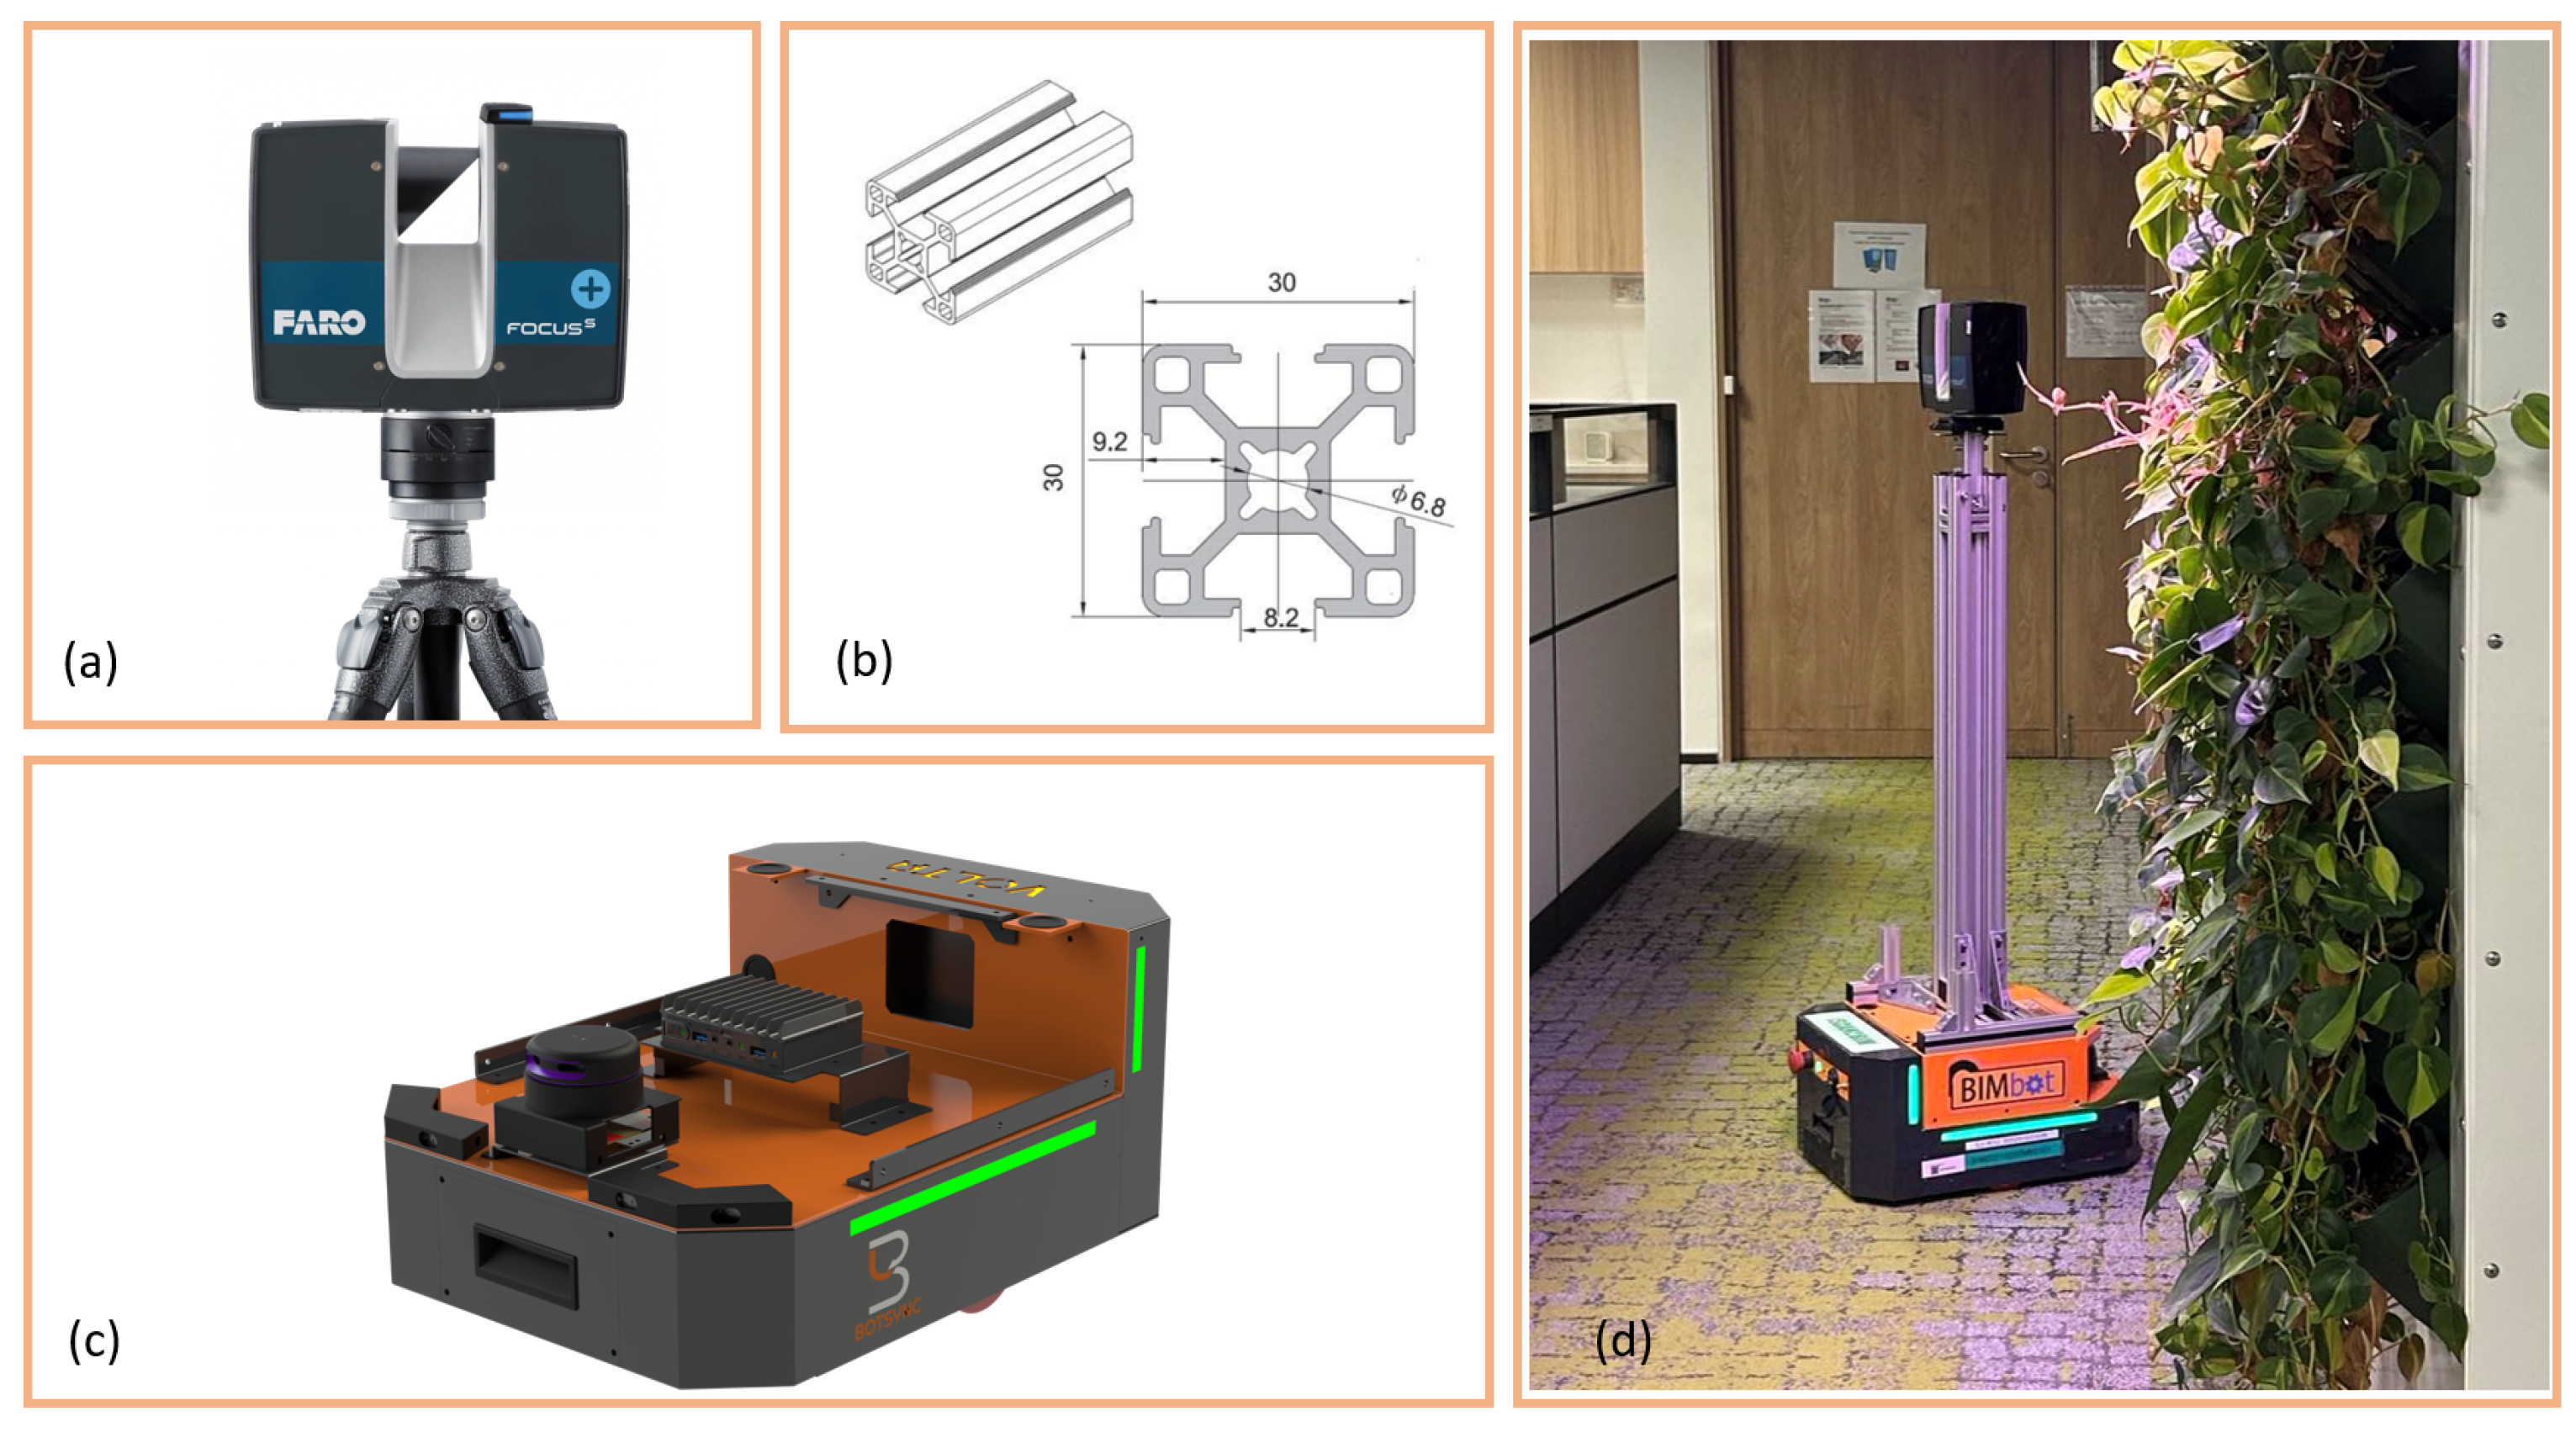
To automate the TLS-based scanning process, a system named BIMBot was developed, in which a TLS scanner was mounted on a UGV. Specifically, the FARO
® Focus s70 was used in our experiments (see
Figure 1a). This LiDAR scanner model is ideal for both outdoor and indoor applications as it is capable of performing long-range scans of up to 70 m with a ranging error of 1 mm and offers configurable resolution. The ranging error, defined as systematic measurement error, was assessed at distances of around 10 m and 25 m. For the UGV, the Volta designed by Botsync
® was chosen as the robot base. Volta is a low-profile indoor mobile platform, which operates on a differential drive with a maximum payload capacity of 30 kg and is equipped with a 2D LiDAR for obstacle avoidance. Its compact dimensions (520 × 365 × 233 mm) facilitate navigation in tight spaces, as depicted in
Figure 1c.
Given the considerable weight of the FARO
® Focus s70 scanner, a robust and durable support structure was designed to securely mount the scanner on the robot base. To navigate around furniture and potential occlusions at scanning sites, the scanner was positioned at least 1m above the ground to ensure the optimal point of view. The support structure was initially designed using CAD and then constructed using aluminum profiles, for which 30 × 30 mm aluminum extrusion T slots (shown in
Figure 1b) were selected due to their light weight, rigidity, and ease of customization and the fact that they can be cut precisely with a lathe. The final assembly of the BIMBot is illustrated in
Figure 1d.
3.2. Methods
3.2.1. Overview
An autonomous scanning pipeline for BIMBot was developed, as illustrated in
Figure 2. The implemented pipeline comprised five modules: remote scanning, preprocessing, registration, NBV, and navigation. These modules functioned in a closed-loop system, specifically designed for the progressive and consecutive digitization of as-built environments. This closed-loop system unfolded and worked in a sequence of steps, as illustrated in
Figure 3. Within this system, the NBV module was further divided into several steps, including the construction of occupancy maps, the construction of down-projected maps, the creation of connectivity maps, and the estimation of the best scan positions. Detailed explanations of these modules are provided in subsequent sections.
3.2.2. Scanning Module
The FARO software developer’s kit (SDK) was utilized for the development of the scanning module. This SDK allows us to write C++ scripts to remotely control the scanning process. Initially, the scanning module establishes a stable connection to the scanner’s wireless network. The scanning procedure is automatically triggered when the robot reaches a defined scanning position. After completing a scan, scanning data are transferred to a host computer. The SDK also provides various options for adjusting scanner settings, enabling users to select the desired resolution, quality, and scan mode, whether color or grayscale. Choosing higher resolution, better quality, and color scanning significantly increases the duration of each scan. Typically, scans without color take from 30 s at a 1/32 resolution to around 3 min at a 1/8 resolution. Adding color extends the scan time by an additional 1–2 min as the scanner needs to capture multiple color photographs for point cloud colorization.
3.2.3. Preprocessing Module
Without any pre-assumptions on the reference coordinate system, the first scan is set as the global reference scan. Before the registration of any subsequent point clouds with the reference scan, it is necessary to normalize the pose of the first point cloud by aligning it to the XYZ-axis. This step is crucial for facilitating downstream processes, such as the NBV algorithm. For example, rotating walls that are perpendicular or parallel to the X-axis yields optimal results for the NBV algorithm. Additionally, due to inherent human error, the scanner may not be perfectly leveled; thus, any small misalignments can result in significant discrepancies at large distances from the center. For example, the estimation of scanner height is affected if the point cloud is not properly leveled. Therefore, an algorithm was developed to accurately align the point clouds to the XYZ-axis.
Basically, the algorithm first performs Z-axis alignment by extracting the data points of the floor using the scanner’s height information. Then, it employs a plane fitting method to estimate the normal of the floor plane and estimate the transformation matrix to align the normal of the floor plane with the Z-axis. Next, it performs either X-axis or Y-axis alignment. For this study, X-axis alignment was chosen as we assumed that in scanning sites, there is always at least one surface that is perpendicular to the floor. To extract such candidate surfaces, the random sample consensus (RANSAC) method is used to identify planes in which variations in the Z direction exceed a predefined threshold (0.7 in this study, which reliably identified perpendicular surfaces). Once a candidate surface is identified, its normal is calculated and the transformation matrix is estimated to align its normal with the X-axis. The final pose normalization transformation is a composition of the Z-axis and X-axis alignments: .
3.2.4. Registration Module
Point cloud registration is the process wherein a transformation matrix is calculated and applied to a source point cloud, enabling its alignment with a reference point cloud in a common coordinate system. This step is crucial for various applications as it involves stitching multiple point clouds from different scanning positions to reconstruct entire indoor spaces.
In this study, a coarse-to-fine registration scheme was adopted to register current point clouds with previous point clouds. Initially, a coarse transformation matrix was obtained directly from the robot pose information. Small misalignments, typically ranging from 20 to 40 cm, were anticipated due to factors like robot wheel friction and the precision of the SLAM algorithm. These misalignments were subsequently resolved using the ICP algorithm. Specifically, an ICP-based iterative refinement process was employed, as outlined in Algorithm 1, which iteratively refined the registration results by progressively reducing the searching radius. To optimize computation time, instead of processing the entire combined point cloud, a specific volume centered at the robot’s current position was cropped out, in which an overlap occurred between the combined cloud and the current scan. This approach prevented an accumulative increase in computation time as the number of scans increased.
| Algorithm 1: ICP-based registration refinement. |
![Robotics 13 00022 i001]() |
3.2.5. Ufomap-Based Next Best View Module
Planning the next scanning position is a key aspect of automatic scanning. The NBV algorithm addresses this challenge by selecting optimal scanning positions based on the current point clouds and the robot’s current location. This approach aims to maximize exploration under certain constraints with the goal of obtaining complete 3D point clouds of built environments. The solution was designed to be environment-agnostic. In this tudy, a UFOMap-based NBV algorithm was developed, which comprised four sub-modules: occupancy map reconstruction, down-projection, connectivity map extraction, and maximum information gain estimation.
The UFOMap framework was chosen for 3D occupancy map reconstruction because it is an efficient probabilistic 3D mapping framework [
17]. Compared to OctoMap [
18], UFOMap allows for explicit queries of unknown voxels. This feature enabled us to develop an efficient method for estimating information gain. In this context, information gain is defined as the number of unknown voxels that can be resolved from a given scanning position. Details of the UFOMap-based NBV implementation are outlined in Algorithm 2.
| Algorithm 2: UFOMap-based NBV. |
![Robotics 13 00022 i002]() |
The algorithm first converts registered point clouds into 3D occupancy maps using the UFOMap framework [
17], in which spatial data are represented as cube voxels. Each voxel contains occupancy status information (such as unknown, free, and occupied). The occupancy maps are down-projected along the Z-axis, encompassing the space above the floor and below the ceiling, to create 2D down-projected maps. From the 2D down-projected maps, connectivity maps are extracted by utilizing the depth first search (DFS) algorithm across adjacent free cells, starting from the current scanning position. These connectivity maps represent all accessible cells connected to the current scanning position, with each cell being a safe candidate scanning position. This process filters out any isolated free cells and eliminates all occupied and unknown cells.
Next, the algorithm proceeds to calculate the information gain, adjusted for the distance between current and candidate scanning positions, for each cell in the connectivity maps. This is achieved by applying the castRay method to the 3D occupancy maps. This method projects multiple rays from each cell (setting the Z value as equal to the scanner height) in all directions to estimate the number of unknown voxels within the lines of sight. The algorithm selects the cell with the highest distance-adjusted information gain as the next scan position. The stopping criterion is when the number of unknown voxels falls below a predefined threshold. The strength of this solution lies in its efficiency and accuracy in estimating unknown voxels, thereby obtaining optimal scanning positions and reducing scanning times for digitizing interior spaces.
3.2.6. Cloud Integration
The entire solution comprising all of the modules mentioned above was fully integrated into the Amazon Web Services (AWS) cloud, as depicted in
Figure 4.
A user-friendly user interface (UI) was also developed, as shown in
Figure 5, to facilitate end-user interactions with the system and provide live feedback through real-time visualizations. This feature enables users to monitor the scanning process in real time and access scanning results at any time.
4. Experimental Analysis
4.1. Case Study
To validate the BIMBot system, an experiment was conducted in a campus laboratory. The space was selected for its geometrical complexity, making it a representative environment for scanning structural and MEP components. The acquisition area featured various structural elements, such as walls, columns, beams, floors, ceilings, windows, and doors, along with MEP components like ducts and pipes. Additionally, the space contained furniture, such as tables and chairs. Panoramic views of the laboratory are presented in
Figure 6. The laboratory covered an area of approximately 200 m
2.
4.2. Data Acquisition and NBV
The detailed results for each step in the scanning process, as outlined in
Figure 3, are presented in
Figure 7. For brevity, we have included detailed results only for scans #1, #2, and #16, as the results for other scans were similar and repetitive.
In the scanning process for scan #1, shown in
Figure 7a, the first column presents the raw point cloud collected by the remote scanning module. The second column displays the point cloud after the pose normalization transformation. Since we set the first point cloud as the reference in our experiment, the point cloud in the third column is identical to that in the second column. The fourth column illustrates the occupancy map constructed from the third column’s point cloud using the UFOMap framework, with unknown voxels in light orange, free voxels in green, and occupied voxels in grey - the original point cloud colour. The down-projected map, obtained by projecting the occupancy map along the z-axis, is shown in the fifth column. Inaccessible cells (unknown and occupied voxels being down-projected) are marked in red, while accessible cells (free voxels being down-projected onto the floor voxels) are in green. The sixth column shows the connectivity map extracted using the DFS method, comprising all green cells connected to the current scanning position. These cells represent candidate scanning positions for the robot. The cell with the maximum information gain, adjusted by distance, is selected as the next best scanning position and is indicated as a red cell in the sixth column.
For scan #2, the process is similar, with differences in the second and third columns. The second column shows the point cloud after pose normalization and registration transformation, while the third column combines the first and second point clouds.
For the last scan, scan #16, the process is repeated, except in the sixth column, where the NBV algorithm meets the stopping criterion, and thus no next best scanning position is output.
In the rest of this section, the results of the implemented NBV algorithm for point cloud data acquisition were evaluated. In the experiment, the occupancy map resolution was set to 0.4 m by taking the robot base size and computational cost into consideration. Each new scan was first registered with the combined cloud using Algorithm 1 and then inserted into the existing occupancy maps to update the voxel statuses, down-project maps, and connectivity maps. From the updated connectivity maps, Algorithm 2 calculated the distance-adjusted information gain to determine the next optimal scanning positions. As depicted in
Figure 8, serial scanning positions 1–8 were calculated by the proposed NBV algorithm. With each scan, additional space was recovered until the predetermined stopping criterion (i.e., fewer than 20 unknown voxels) was met at scan #8.
Upon examining the completeness of the point clouds, we found that while the structural data points were adequate for structural BIM model reconstruction, the MEP data points were insufficient, particularly in areas near the ceiling (as observed in the first picture in
Figure 9). To address this, some adjustments were made: we increased the occupancy map resolution and reduced the scope of the field of view in the vertical direction to better scan MEP elements. These adjustments were motivated by two factors: the smaller sizes of MEP elements compared to structural elements and the locations of MEP elements near the ceiling. Consequently, Algorithm 2 was amended with the following changes: (i) we added a logic to control the switch from structural to MEP scanning; (ii) we increased the occupancy map resolution to 0.1 m for MEP scanning; (iii) we adjusted the field of view to be between 30 and 90 degrees instead of the original range of between −60 and 90 degrees in the vertical direction to implement the castRay method for MEP scanning. The scanner’s field of view settings were accordingly adjusted via the Faro
® SKD API. As shown in
Figure 9, these modifications helped the robot to focus on scanning areas near the ceiling, where the MEP components were primarily located. After conducting eight additional scans, the NBV process terminated as the stopping criterion was met. As can be observed in scan #16, the point cloud coverage for the MEP components and ceiling was much more comprehensive compared to the point cloud in scan #8.
A manual scanning process of the same laboratory was also performed independently by our colleague, who is an expert in manual scanning and has more than 6 years of experience in operating different scanners. Using the manual scanning method, 32 scans were required to cover all structural and MEP elements. An experimental comparison between the manual and autonomous scanning methods is presented in
Table 1. From the table, it can be seen that BIMBot achieved a similar coverage percentage to the manual scanning method, but in fewer scans and a lower processing time.
4.3. Registration and Quantitative Analysis
To check the point cloud quality, the registration accuracy and point cloud completeness were examined visually and compared to the counterpart results from the manual scanning method. The manual scanning method refers to an operator manually positioning the scanner at different points to ensure the comprehensive coverage of the environment. The manual aspect of this method lies in physically moving and adjusting the scanner, as well as manual point cloud preprocessing and registration. For this comparison, a section of a column point cloud was chosen. By visually examining its surface data points from the top-down view, as shown in
Figure 10b, we found that the point cloud of the column was well reconstructed. Compared to the manual scanning method, as shown in
Figure 10a, the column point cloud from the autoscanning method contained fewer data points as the NBV minimized the number of scans required to cover all of the column’s surfaces.
Next, we checked the point cloud quality of the MEP elements. As shown in
Figure 11, we found that the results from the manual scanning and autoscanning methods were comparable. Parts of two small pipes were missing from the manual scanning results, as highlighted by the red box in
Figure 11a, while parts of four pipes were missing from the autoscanning results, as highlighted by the red box in
Figure 11b. The latter was due to occlusion from a square-shaped LED directly underneath the pipes, as seen in
Figure 6. Portions of the MEP point clouds, highlighted by the light green boxes in
Figure 11, were also selected to examine the quality from both the top-down view in
Figure 12 and the side view in
Figure 13. As seen in
Figure 12, the results from both the manual and autoscanning methods were comparable in terms of registration accuracy and point cloud completeness. As seen in
Figure 13, the results of the autoscanning method were slightly better than those of the manual scanning method in terms of registration accuracy with visual inspection as fewer outliers were found; thus, the contours of the pipes and ducts appeared sharper.
Additionally, in the experiment, no special assumptions were made about the reference coordinate system. Simply, the position and orientation of the first scan were selected as the global origins. However, the initial scan could be aligned with the global coordinate system using national CS, thereby generating georeferenced point clouds.
5. Discussion
The BIMBot system was specifically designed following the “stop-scan-plan-go” scanning pattern as opposed to the “scanning-while-navigating” pattern, which requires continuous planning and exploration using the SLAM algorithm. While “scanning-while-navigating” approaches like those in [
19,
20] are efficient, they rely heavily on SLAM algorithms, which produce noisy point clouds. This makes them unsuitable for architectural detail capture, unlike automated TLS-based approaches [
12,
13,
14].
A few studies have differentiated the importance of unknown voxels depending on the end-uses of completed point clouds [
10]. The rationale for introducing semantic labeling onto the voxels of occupancy maps is twofold: firstly, to prioritize objects of interest for scanning and secondly, to accommodate scanning in semi-open and open spaces. We also explored this by applying deep learning-based semantic segmentation to the combined clouds prior to applying the NBV algorithm. However, due to the lower accuracy of semantic segmentation, which led to inaccuracies in estimating the number of unknown structural and MEP voxels, we decided not to present these results in this study. The potential of incorporating semantic information into NBV calculations remains a subject for future investigation, pending improvements in semantic segmentation accuracy.
Additionally, we experimented with an adjustable scanner height, ranging from 1.4 m to 2.7 m. However, the limited range of adjustments resulted in minimal savings in scanning times.
6. Conclusions
This study introduced an autonomous mobile robot-based scanning system designed for minimal human intervention and maximum accuracy and completeness in point cloud creation for applications like BIM model reconstruction and digital twin development. A TLS-based approach was adopted due to their superior scan quality, despite longer scan times, compared to SLAM-based mobile solutions. In terms of software design, a pipeline was meticulously developed to streamline point cloud processing, which included pose normalization for point cloud–XYZ-axis alignment and iterative registration refinement to ensure accurate point cloud creation. Furthermore, the UFOmap framework was proposed for occupancy map construction, which enhanced the efficiency and accuracy of unknown voxel estimation for optimal scanning positioning. The system was validated in a laboratory environment, which was rich with structural and MEP elements. The experimental results demonstrated its potential in point cloud creation for BIM model reconstruction and digital twins applications.
Future work includes additional testing, customized robot designs for varied terrains, and collaborative multi-robot approaches to autoscanning. While this study focused on interior spaces, expanding this method to building exteriors, including facades and rooftops, would require a collaborative multi-robot approach. As technology advances, addressing challenges in scanning flexibility, efficiency, and automation will also be crucial for enhancing autonomous scanning systems.
Author Contributions
Conceptualization, N.L. and Y.C.; methodology, N.L., Y.P.A. and Y.C.; software, Y.P.A., N.L., K.Y. and X.W.; validation, N.L., Y.P.A., X.W. and Y.X.; writing—original draft preparation, N.L. and Y.P.A.; writing—review and editing, Y.X., Y.C. and N.L.; supervision, Y.C. All authors have read and agreed to the published version of the manuscript.
Funding
This research was funded by the RIE2020 Industry Alignment Fund–Industry Collaboration Projects (IAF–ICP) Funding Initiative, as well as cash-in-kind contributions from Surbana Jurong Pte Ltd., Singapore.
Data Availability Statement
The data presented in this study are available upon request from the corresponding author. The data are not publicly available due to privacy.
Acknowledgments
We would like to thank Bianyue Yang for his initial efforts in developing the cloud integration solution, Siyi Li for his diligent work on its continuous development and maintenance, and Lihui Huang for his contributions to the acquisition of manual scanning data.
Conflicts of Interest
N.L. and Y.X. received research grants from the RIE2020 Industry Alignment Fund–Industry Collaboration Project (IAF–ICP) Funding Initiative, as well as contributions from Surbana Jurong Pte Ltd. The funders had no role in the design of the study, the collection, analyses, or interpretation of the data, the writing of the manuscript, or the decision to publish the results.
Abbreviations
The following abbreviations are used in this manuscript:
| LiDAR | Light detection and ranging |
| BIM | Building information modeling |
| MEP | Mechanical, electrical, and plumbing |
| TLS | Terrestrial laser scanner |
| SLAM | Simultaneous localization and mapping |
| NBV | Next best view |
| NBS | Next best scan |
| UGV | Unmanned ground vehicle |
| CAD | Computer-aided design |
| ICP | Iterative closest point |
| SDK | Software developer’s kit |
| RANSAC | Random sample consensus |
| DFS | Depth first search |
| AWS | Amazon Web Services |
| UI | User interface |
References
- Raza, M.S.; Tayeh, B.A.; Aisheh, Y.I.A.; Maglad, A.M. Potential features of building information modeling (BIM) for application of project management knowledge areas in the construction industry. Heliyon 2023, 9, e19697. [Google Scholar] [CrossRef]
- Rocha, G.; Mateus, L.; Fernández, J.; Ferreira, V. A Scan-to-BIM Methodology Applied to Heritage Buildings. Heritage 2020, 3, 47–67. [Google Scholar] [CrossRef]
- Wang, Y.; Chen, Q.; Zhu, Q.; Liu, L.; Li, C.; Zheng, D. A Survey of Mobile Laser Scanning Applications and Key Techniques over Urban Areas. Remote Sens. 2019, 11, 1540. [Google Scholar] [CrossRef]
- Bieda, A.; Balawejder, M.; Warchoł, A.; Bydłosz, J.; Kolody, P.; Pukanska, K. Use of 3D technology in underground tourism: Example of Rzeszow (Poland) and Lviv (Ukraine). Acta Montan. Slovaca 2021, 26, 205–221. [Google Scholar] [CrossRef]
- Adán, A.; Quintana, B.; Prieto, S.A. Autonomous Mobile Scanning Systems for the Digitization of Buildings: A Review. Remote Sensing 2019, 11, 306. [Google Scholar] [CrossRef]
- Sequeira, V.; Goncalves, J.G.M.; Ribeiro, M.I. 3D reconstruction of indoor environments. In Proceedings of the 3rd IEEE International Conference on Image Processing, Lausanne, Switzerland, 19 September 1996; Volume 2, pp. 405–408. [Google Scholar] [CrossRef]
- Surmann, H.; Nüchter, A.; Hertzberg, J. An autonomous mobile robot with a 3D laser range finder for 3D exploration and digitalization of indoor environments. Robot. Auton. Syst. 2003, 45, 181–198. [Google Scholar] [CrossRef]
- Blaer, P.S.; Allen, P.K. Data acquisition and view planning for 3-D modeling tasks. In Proceedings of the 2007 IEEE/RSJ International Conference on Intelligent Robots and Systems, San Diego, CA, USA, 29 October–2 November 2007; pp. 417–422. [Google Scholar] [CrossRef]
- Borrmann, D.; Nüchter, A.; Ðakulović, M.; Maurović, I.; Petrović, I.; Osmanković, D.; Velagić, J. A mobile robot based system for fully automated thermal 3D mapping. Adv. Eng. Inform. 2014, 28, 425–440. [Google Scholar] [CrossRef]
- Prieto, S.A.; Quintana, B.; Adán, A.; Vázquez, A.S. As-is building-structure reconstruction from a probabilistic next best scan approach. Robot. Auton. Syst. 2017, 94, 186–207. [Google Scholar] [CrossRef]
- Adán, A.; Quintana, B.; Prieto, S.A.; Bosché, F. An autonomous robotic platform for automatic extraction of detailed semantic models of buildings. Autom. Constr. 2020, 109, 102963. [Google Scholar] [CrossRef]
- Matellon, A.; Maset, E.; Visintini, D.; Beinat, A. Feasibility and accuracy of as-built modelling from slam-based point clouds: Preliminary results. Int. Arch. Photogramm. Remote Sens. Spat. Inf. Sci. 2023, XLVIII-1/W1-2023, 273–278. [Google Scholar] [CrossRef]
- Maset, E.; Scalera, L.; Beinat, A.; Cazorzi, F.; Crosilla, F.; Fusiello, A.; Gasparetto, A. Preliminary Comparison Between Handheld and Mobile Robotic Mapping Systems; Springer International Publishing: Cham, Switzerland, 2022; pp. 290–298. [Google Scholar]
- Maset, E.; Scalera, L.; Beinat, A.; Visintini, D.; Gasparetto, A. Performance Investigation and Repeatability Assessment of a Mobile Robotic System for 3D Mapping. Robotics 2022, 11, 54. [Google Scholar] [CrossRef]
- Warchoł, A.; Karaś, T.; Antoń, M. Selected qualitative aspects of lidar point clouds: Geoslam zeb-revo and faro focus 3D X130. Int. Arch. Photogramm. Remote Sens. Spat. Inf. Sci. 2023, XLVIII-1/W3-2023, 205–212. [Google Scholar] [CrossRef]
- Mora, R.; Martín-Jiménez, J.A.; Lagüela, S.; González-Aguilera, D. Automatic Point-Cloud Registration for Quality Control in Building Works. Appl. Sci. 2021, 11, 1465. [Google Scholar] [CrossRef]
- Duberg, D.; Jensfelt, P. UFOMap: An Efficient Probabilistic 3D Mapping Framework That Embraces the Unknown. IEEE Robot. Autom. Lett. 2020, 5, 6411–6418. [Google Scholar] [CrossRef]
- Hornung, A.; Wurm, K.M.; Bennewitz, M.; Stachniss, C.; Burgard, W. OctoMap: An Efficient Probabilistic 3D Mapping Framework Based on Octrees. Auton. Robot. 2013, 34, 189–206. [Google Scholar] [CrossRef]
- Charrow, B.; Kahn, G.; Patil, S.; Liu, S.; Goldberg, K.; Abbeel, P.; Michael, N.; Kumar, V.R. Information-Theoretic Planning with Trajectory Optimization for Dense 3D Mapping. Robot. Sci. Syst. XI 2015. [Google Scholar] [CrossRef]
- Meng, Z.; Qin, H.; Chen, Z.; Chen, X.; Sun, H.; Lin, F.; Ang, M.H. A Two-Stage Optimized Next-View Planning Framework for 3-D Unknown Environment Exploration, and Structural Reconstruction. IEEE Robot. Autom. Lett. 2017, 2, 1680–1687. [Google Scholar] [CrossRef]
Figure 1.
Robot composition and BIMBot: (a) the FARO® Focus s70 terrestrial laser scanner (TLS); (b) aluminum extrusion T slots; (c) the Volta robot base by Botsync®; (d) the final assembly of BIMBot.
Figure 1.
Robot composition and BIMBot: (a) the FARO® Focus s70 terrestrial laser scanner (TLS); (b) aluminum extrusion T slots; (c) the Volta robot base by Botsync®; (d) the final assembly of BIMBot.
Figure 2.
Diagram of the implemented autonomous scanning pipeline. The scanning process exits the loop once the NBV algorithm determines that the stopping criteria have been met.
Figure 2.
Diagram of the implemented autonomous scanning pipeline. The scanning process exits the loop once the NBV algorithm determines that the stopping criteria have been met.
Figure 3.
A drawing of how the closed-loop autonomous scanning pipeline unfolds and functions in a sequential manner.
Figure 3.
A drawing of how the closed-loop autonomous scanning pipeline unfolds and functions in a sequential manner.
Figure 4.
A diagram of the cloud-integrated solution for BIMBot.
Figure 4.
A diagram of the cloud-integrated solution for BIMBot.
Figure 5.
The web-based user interface (UI) developed for the visualization of the scanning results.
Figure 5.
The web-based user interface (UI) developed for the visualization of the scanning results.
Figure 6.
Panorama views of the scanning site: (a) Panorama view from scan position #1; (b) Panorama view from scan position #3.
Figure 6.
Panorama views of the scanning site: (a) Panorama view from scan position #1; (b) Panorama view from scan position #3.
Figure 7.
Detailed results for each step in the scanning process for (a) scan #1; (b) scan #2; (c) scan #16. The first column represents the original point cloud collected by the remote scanning module. The second column displays the point cloud after pose normalization and registration transformation. The third column illustrates the current combined point cloud. In the fourth column, the occupancy map, constructed using the UFOMap framework, is shown with unknown voxels in light orange, free voxels in green, and occupied voxels in grey. The fifth column represents the down-projected map, marking inaccessible cells in red and accessible cells in green. Finally, the sixth column shows the connectivity map, with the next best scanning position indicated as a red cell.
Figure 8.
A sequence of scans acquired using the NBV algorithm to determine scanner positions, which are indicated by red circles and numbered accordingly. After completing the first 8 scans, the NBV process for scanning structural components terminated as the stopping criterion was met. For enhanced visualization, the ceiling point cloud has been removed.
Figure 9.
The sequence of scans acquired using the proposed NBV algorithm to complete the scanning of MEP components. Red dashed boxes highlight the new areas revealed by each scan. After 8 additional scans, the NBV process terminated as the stopping criterion was met. For enhanced visualization, the floor point cloud has been removed.
Figure 10.
Visual checks of structural point cloud quality using a top-down view of the point clouds of a column. All of the column’s surfaces were neatly registered using both the manual and autoscanning methods: (a) results from the manual scanning method; (b) results from the autoscanning method.
Figure 11.
Visual checks of MEP point cloud quality and comparisons between methods of manual scanning and autonomous scanning: the top-down view of the selected section of the MEP point cloud resulting from (a) manual scanning; (b) autoscanning. Red boxes highlight missing elements. Green boxes indicate the zoomed-in portions for further examination. For enhanced visualization, the ceiling, floor, and furniture point clouds have been removed.
Figure 12.
The top-down views of small portions of the MEP point clouds, as indicated by the light green boxes in
Figure 11: (
a) manual scanning results; (
b) autoscanning results.
Figure 12.
The top-down views of small portions of the MEP point clouds, as indicated by the light green boxes in
Figure 11: (
a) manual scanning results; (
b) autoscanning results.
Figure 13.
The side views of small portions of the MEP point clouds, as indicated by the light green boxes in
Figure 11: (
a) manual scanning results; (
b) autoscanning results.
Figure 13.
The side views of small portions of the MEP point clouds, as indicated by the light green boxes in
Figure 11: (
a) manual scanning results; (
b) autoscanning results.
Table 1.
Comparison between BIMBot and the manual scanning method.
Table 1.
Comparison between BIMBot and the manual scanning method.
| Comparison |
|---|
|
Method
|
#Scans
|
Resolution
|
#Points
|
Acquisition Time
|
Preprocessing Duration
|
Coverage 1 |
|---|
| BIMBot | 16 | 1/16 | 40,655,084 | ∼1 h | on-the-fly 2 | 82.05% |
| Manual | 32 | 1/16 | 83,050,144 | ∼2 h | ∼2 h | 86.42% |
| Disclaimer/Publisher’s Note: The statements, opinions and data contained in all publications are solely those of the individual author(s) and contributor(s) and not of MDPI and/or the editor(s). MDPI and/or the editor(s) disclaim responsibility for any injury to people or property resulting from any ideas, methods, instructions or products referred to in the content. |
© 2024 by the authors. Licensee MDPI, Basel, Switzerland. This article is an open access article distributed under the terms and conditions of the Creative Commons Attribution (CC BY) license (https://creativecommons.org/licenses/by/4.0/).


