1. Introduction
Industrial robots are a fundamental part of highly automated production systems, which can be found in the automotive or electronics industry [
1]. Since they operate in complex production cells and as a part of linear production lines, robot malfunctions lead to long downtimes for repair or replacement and, hence, to increased costs. In particular, robot gear faults are responsible for the longest downtimes because they often require the replacement of the whole robot [
2]. The condition monitoring (CM) of these gears offers the potential to resolve this issue. CM is the monitoring of an asset’s health using sensor data. The health state represents a wear reserve before a failure occurs. This health state is quantified with a health indicator (HI). A significant monitored change in this health indicator can be used as a decision-making aid in the planning of maintenance actions [
3].
1.1. State-of-the-Art
In recent years, different HIs based on vibration data for several industrial robot components, such as bearings, gears and motors, and their specific faults have been investigated. Furthermore, several approaches to cope with instationary signals in CM have been presented. The next two sections give a short overview of these topics followed by a section stating the contribution of our publication.
1.1.1. Vibration-Based Robot Condition Monitoring
A fault detection method was developed in [
4], which first uses a novel phase-based, time-domain averaging method to remove the deterministic part of the vibration signal. Subsequently, the root mean square (RMS) and power spectrum entropy of the remaining residual signal are calculated as health indicators. A vibration signal based CM system for SCARA robots was implemented in [
5], which in the first step uses statistical HIs of the time-domain signal to detect the occurrence of a defect and in the second step uses an artificial neural network to diagnose the fault type. A three-layer architecture for remote fault diagnosis of industrial robot gearboxes was proposed using vibration signals in [
6]. In the diagnosis layer, the authors present a performance evaluation approach using a support vector machine (SVM), a remaining useful life prediction by a Markov model and a fault-type diagnosis based on a Bayesian network. The degenerative behavior of an industrial robot gear was observed with vibration sensors by [
7] as well as [
8] in accelerated wear tests. After pre-processing the signals using order tracking and spectral auto-correlation, the characteristic fault frequencies were calculated and monitored by root mean square analysis, which revealed a trend correlating with increasing wear. In addition to the installation of accelerometers, other additional data sources were investigated in this context. The acoustic emission technology was used to detect robot gearbox faults based on the ball spinning and ball passing frequency of the bearings in [
9]. The changes of the RMS-HI and characteristic frequencies for functional and broken strain gears of industrial robots were investigated in [
10]. The classification and regression performance of different data-driven models based on frequency-domain data and principal component analysis for dimensionality reduction was evaluated in [
11].
1.1.2. Time–Frequency-Based Health Indicators
In addition to vibration data based CM approaches for industrial robots, there also exist several publications considering HIs from the time–frequency-domain. Here, approaches based on the Short-time Fourier transform (STFT), Wavelet transform (WT) or Hilbert Huang transform (HHT) can be divided. STFT is used to derive two HIs named Prominence and Compliance in [
12] to detect bearing faults based on their characteristic fault frequencies. A similarity measure between the STFT spectrograms based on standard deviation and correlation is combined with a simple classifier in [
13] to detect bearing faults. The same objective was pursued in [
14] by means of the marginal time integration of STFTs. Bearing fault classification by means of non-negative matrix factorization or convolutional neural networks and STFT was evaluated in [
15,
16].
In the field of WT, several approaches exist for different assets. CM of brushless DC motors is investigated based on energies for characteristic frequencies based on both STFT and WT in [
17]. A decomposition rate is used in [
18] for CM of electric drives based on WT. RMS and Kurtosis are calculated for the WT coefficients for broken bar fault detection in electric drives and combined with a neural network for fault classification in [
19]. Bearing fault classification was performed with an SVM based on WT in combination with singular value decomposition for dimensionality reduction in [
20]. The spectra of WT coefficients were the basis for the calculation of statistical HIs and frequency specific energy values for the CM of bearing faults in [
21]. The similarities of continuous WT spectra are used as an HI for bearing fault detection [
22]. The permutation entropy derived from flexible analytical wavelet transform was used as a feature for an SVM for bearing fault classification [
23]. Impulse factor, Kurtosis and RMS based on WT coefficients were used for bearing fault detection of helicopters [
24]. Statistical features and Hoelder’s exponent were derived from WT coefficients for milling tool health state monitoring. Here, the HIs were the input for an SVM and Decision Tree classifier [
25]. HIs were derived by a convolutional neural network for milling tool condition monitoring based on the wavelet decomposition in [
26]. Energies of WT coefficients were also used for detecting generator and gear faults in wind turbines [
27]. Different entropy-based and statistical features were used in [
28] for gearbox health monitoring in combination with an SVM. Energy and entropy values derived from WT for characteristic frequencies are applied for gearbox condition monitoring in [
29].
In [
30], the Shannon entropy based on HHT was used for the CM of gears. HHT was also used in [
31] to derive HIs by an autoencoder based on the Marginal Hilbert Spectrum. A component dependent frequency energy based on HHT was used as a label in [
32] for a CNN-based regression model trained on raw vibration time series data for bearing fault detection. Different statistical and entropy-based HIs were calculated from the Intrinsic mode functions (IMFs) derived by HHT in [
33].
1.2. Contribution to the State-of-the-Art
However, none of these publications assess vibration data-based HIs’ ability to detect faults in an industry-like industrial robot application setting. It is characterized by changing robot axes’ velocities, changing temperatures of the gears due to unbalanced robot utilization and unknown robot gear fault types. This is why we present a new HI for robot gear condition monitoring, which potentially copes with these characteristics. Furthermore, we propose a method to evaluate the suitability of HIs for the task of robot gear condition monitoring. We apply this method on the newly formulated HI and several HIs from the state-of-the-art.
2. Materials and Methods
This section is divided in two parts. First, the newly developed HI is presented. Afterwards, the methodologies to evaluate the HI’s performance and data sets used in this context are explained.
2.1. Time–Frequency-Domain-Based Z-Score
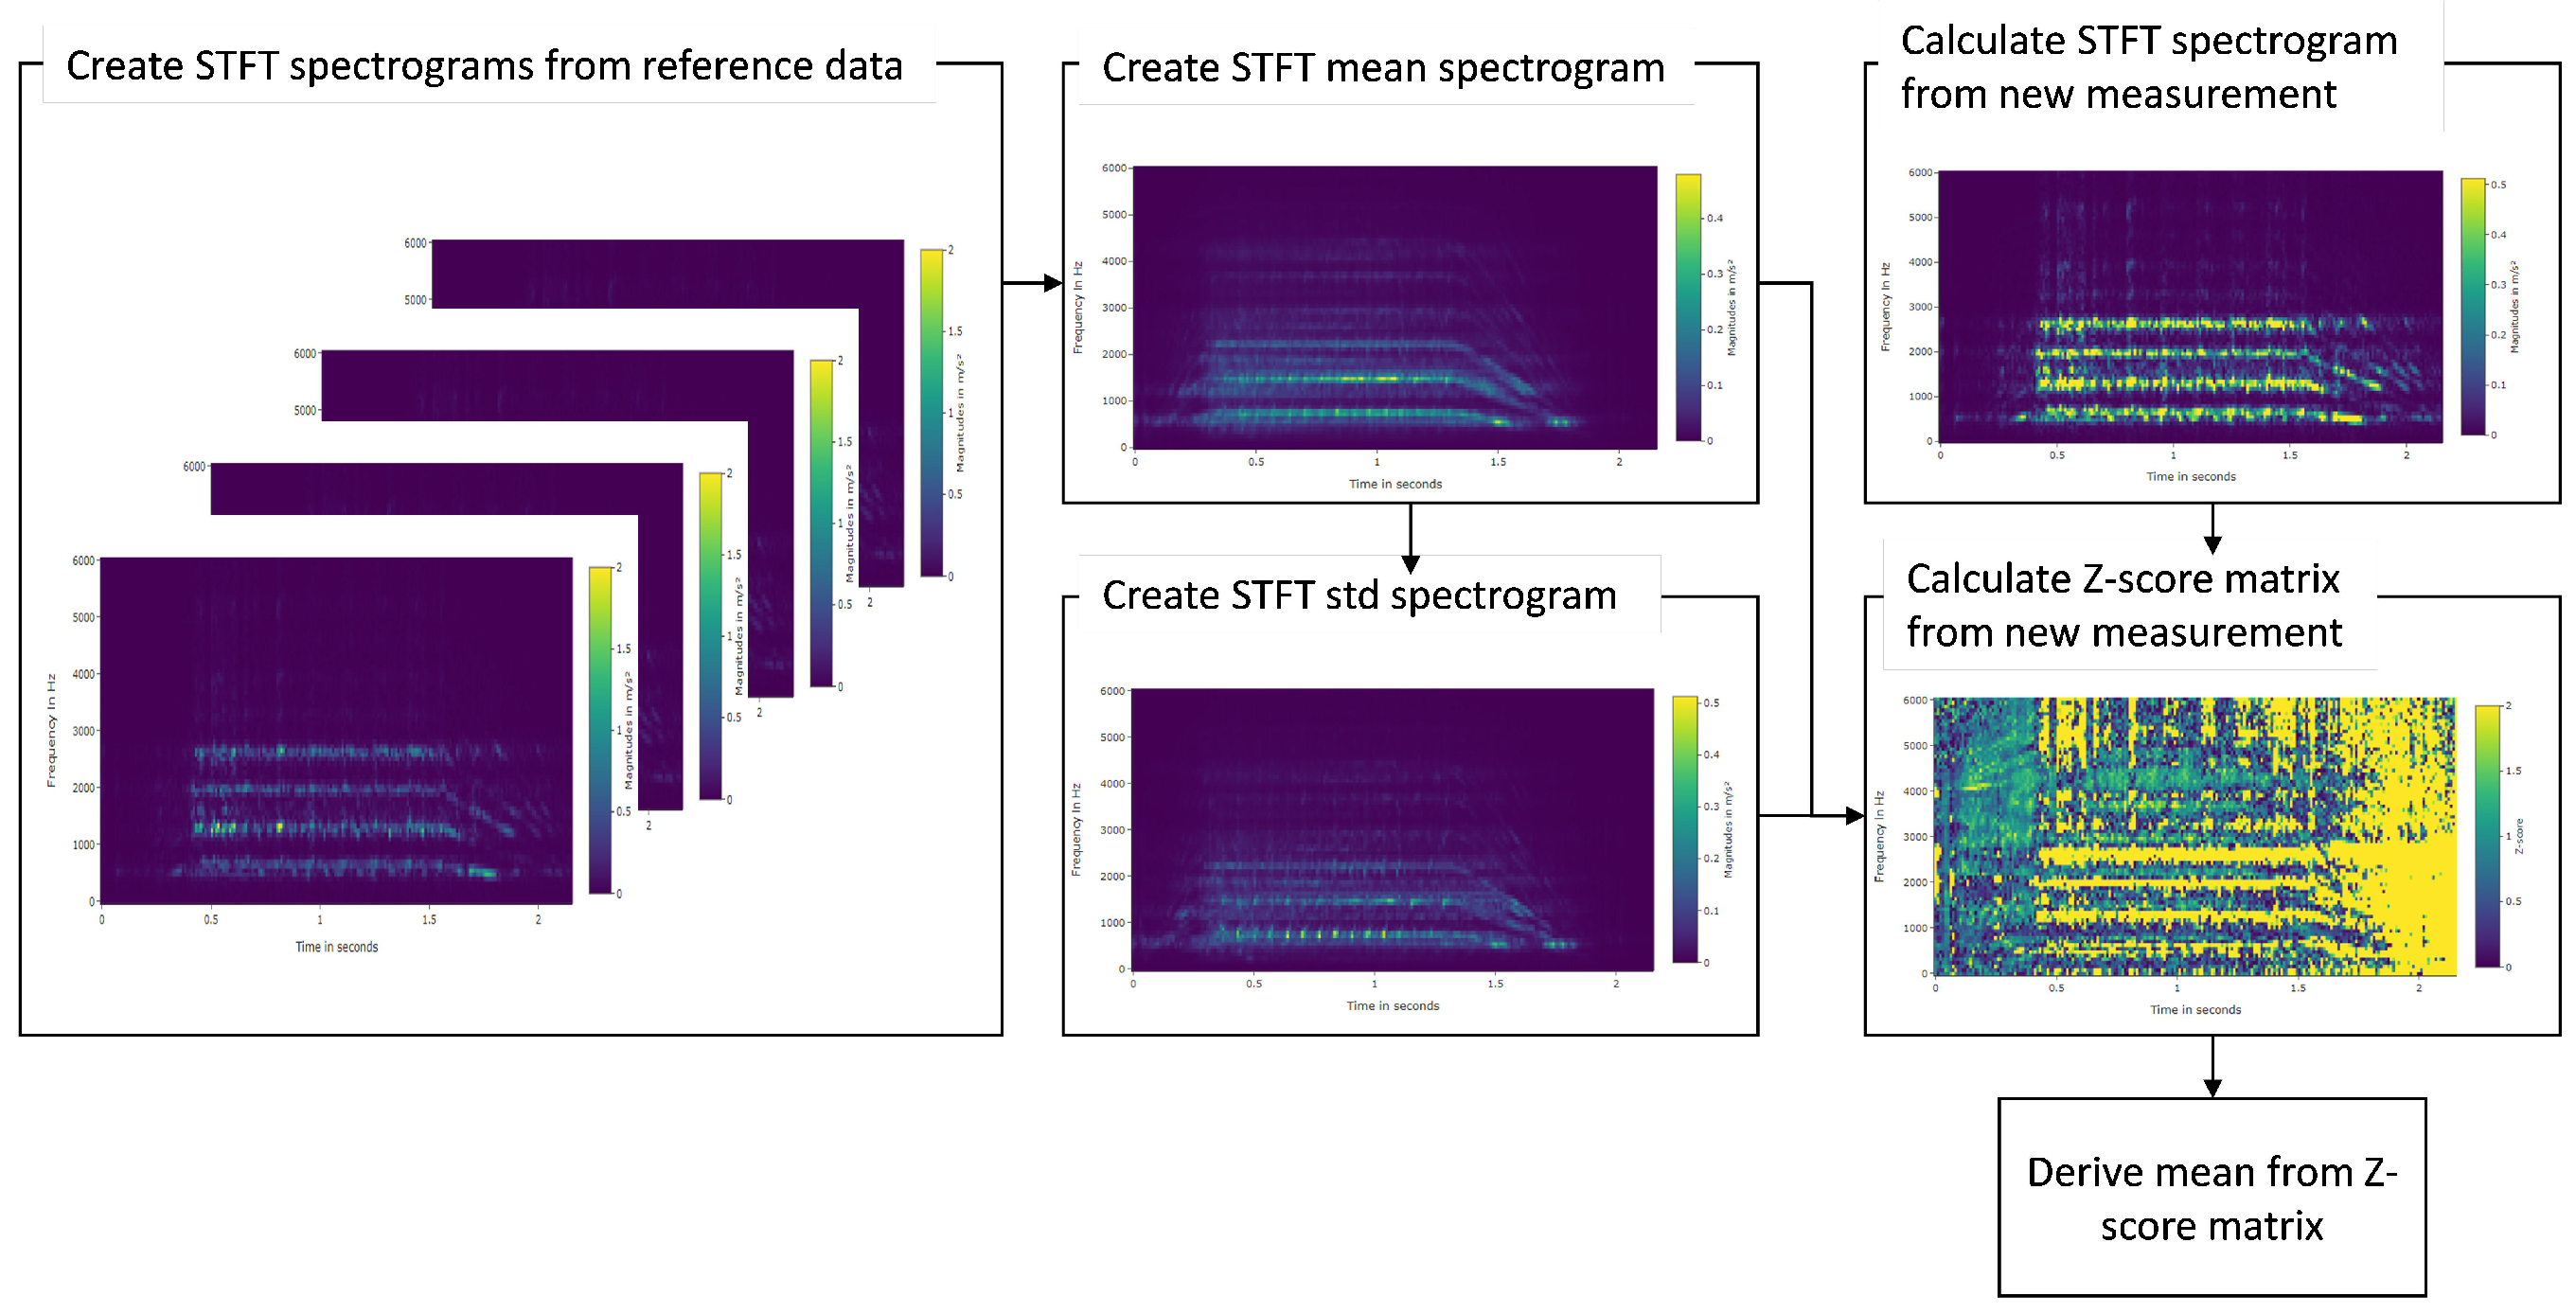
The concept of the newly designed HI is based on two cornerstones. To deal with instationary velocity regimes, which are found in robot applications due to the typical movement patterns of a robot, the HI is based on time–frequency-domain data. Simultaneously, the HI must take into account a certain variance of this data due to environmental changes such as temperature fluctuations. This is realized by the concept of Z-scores, a common similarity measure from statistics [
34]. The process to calculate the new HI is depicted in
Figure 1.
In detail, the new HI is based on high-frequency sampled acceleration sensor data. Data from one measurement are transformed to a time–frequency-spectrogram by usage of the STFT, which is calculated according to Equation (
1). Here,
and
are time and frequency indices,
is the time series signal of the vibration signal at timestep
n and
w is a windowing function with the length
R.
To set up the HI, a certain number of vibration signal spectrograms must be collected for the robot to capture its signal signature in a healthy state with its stochastic variations. This takes place in an initialization phase. For this, initially, two measurements must be collected. In this context, a measurement is defined as the collection of vibration data over one single movement. Based on this data, the two spectrograms are calculated. To determine whether this reference quantity of two spectrograms captures the stochastic variation of the signal, the overall mean (Equation (
2)) and standard deviation (Equation (
3)) of the spectrograms are calculated.
In these formulas,
k describes the number of measurements in the reference quantity.
T is the time length of each measurement,
F is the sampling frequency and
is the average value of
over measurements 0 to
k. Afterwards, one measurement is added to the reference quantity at a time, and again
and
are calculated. Plotting these standard deviations over the number of measurements in the reference quantity usually first shows an increase in
and then a saturation as can be seen in
Figure 2. If this saturation is reached, the reference quantity can sufficiently represent the stochastic behavior of the signal signature. In the shown example, this saturation is reached after 5 measurements.
After the initialization, an HI can be determined based on a newly collected measurement. For this, the measurement’s spectrogram overall Z-score is determined according to Equation (
4).
In this context,
and
are the mean value and the standard deviation of
for all measurements in the reference quantity. In
Figure 3, the STFT and Z-score spectrograms of exemplary vibration measurements from a healthy and a faulty robot gear are depicted. The Z-score-based spectrogram of the faulty measurement shows more prominent changes compared to the STFT-based spectrogram.
2.2. Hi Evaluation Method
To compare the ability of the newly designed HI to cope with industrial robot application characteristics, we followed a three step approach. First of all, we investigated how well the designed HI can detect different kinds of faults in comparison to HIs from the state-of-the-art. Second, we investigated the temperature sensitivity of HIs from the state-of-the-art meeting this criterion and our HI. Third, we investigated the trend behavior of HIs showing a low temperature sensitivity on data from two accelerated wear tests. These three steps are now described more precisely. The overall process of our investigations is also described in
Figure 4.
2.2.1. Varying Fault Detection Analysis
We used the FEMTO data set, which is described in detail in [
35], to select HIs capable of detecting different faults. The data set is available in [
36]. This data set provides run to failure vibration data from 16 identical bearings and for different faults and working conditions defined by the applied load and the rotational speed. The acceleration sensor sampled data with 25.6 kHz, one measurement has a length of 0.1 s and measurements were taken in equidistant timesteps of 10 s for all bearings. The test run for one bearing ended when the signal from the acceleration sensor exceeded 20 g. Therefore, different numbers of measurements are available per bearing ranging from 230 to 2803. We calculated the HIs summarized in
Table 1 for all measurements of one sensor. These HIs were derived from several review papers regarding gearbox and bearing CM [
37,
38,
39,
40] and the publications mentioned in
Section 1. Therefore, the HI calculation was based either on the raw acceleration signal, an enveloped signal as described in [
41] or the residual signal as suggested by [
4]. Additionally, the newly designed HI presented in
Section 2 was calculated for the measurements based on the raw signals.
To detect whether these HIs are sensitive to multiple faults, different techniques can be applied. In addition to filter techniques, ensemble, wrapper and embedded methods exist [
42]. However, the latter three techniques combine classification or regression models with HIs for their evaluation. Hence, this evaluation is always dependent on the used models. Thus, we chose to use filter methods for the evaluation. Here, different figures of merit for regression and classification tasks can be applied, such as trendability, robustness, monotony or discriminance [
42]. To combine these different performance indicators, we fitted different basic functions on the HIs calculated for the last 20 percent of measurements per bearing. These functions were first and second degree polynoms, exponential and sigmoid functions. For each of the fits, we calculated the R
2 value. This means that we received four R
2 values per HI and bearing. High R
2 values of these fits correlate with a high trendability, monotony, robustness and discriminance, which are desirable for HIs. To evaluate whether an HI can detect several damages, we considered only the best R
2 value per HI and bearing. We plotted the statistics of these 16 remaining R
2 values per HI as a boxplot. Suitable HIs should show high R
2 values with low variance.
2.2.2. Temperature Sensitivity Analysis
HIs showing this behavior were analyzed regarding their temperature sensitivity. For this purpose, we acquired vibration data from an industrial robot test rig. This test rig consists of a KUKA KR510 industrial robot with an attached load of 365 kg. We attached acceleration sensors close to the gearboxes as shown in
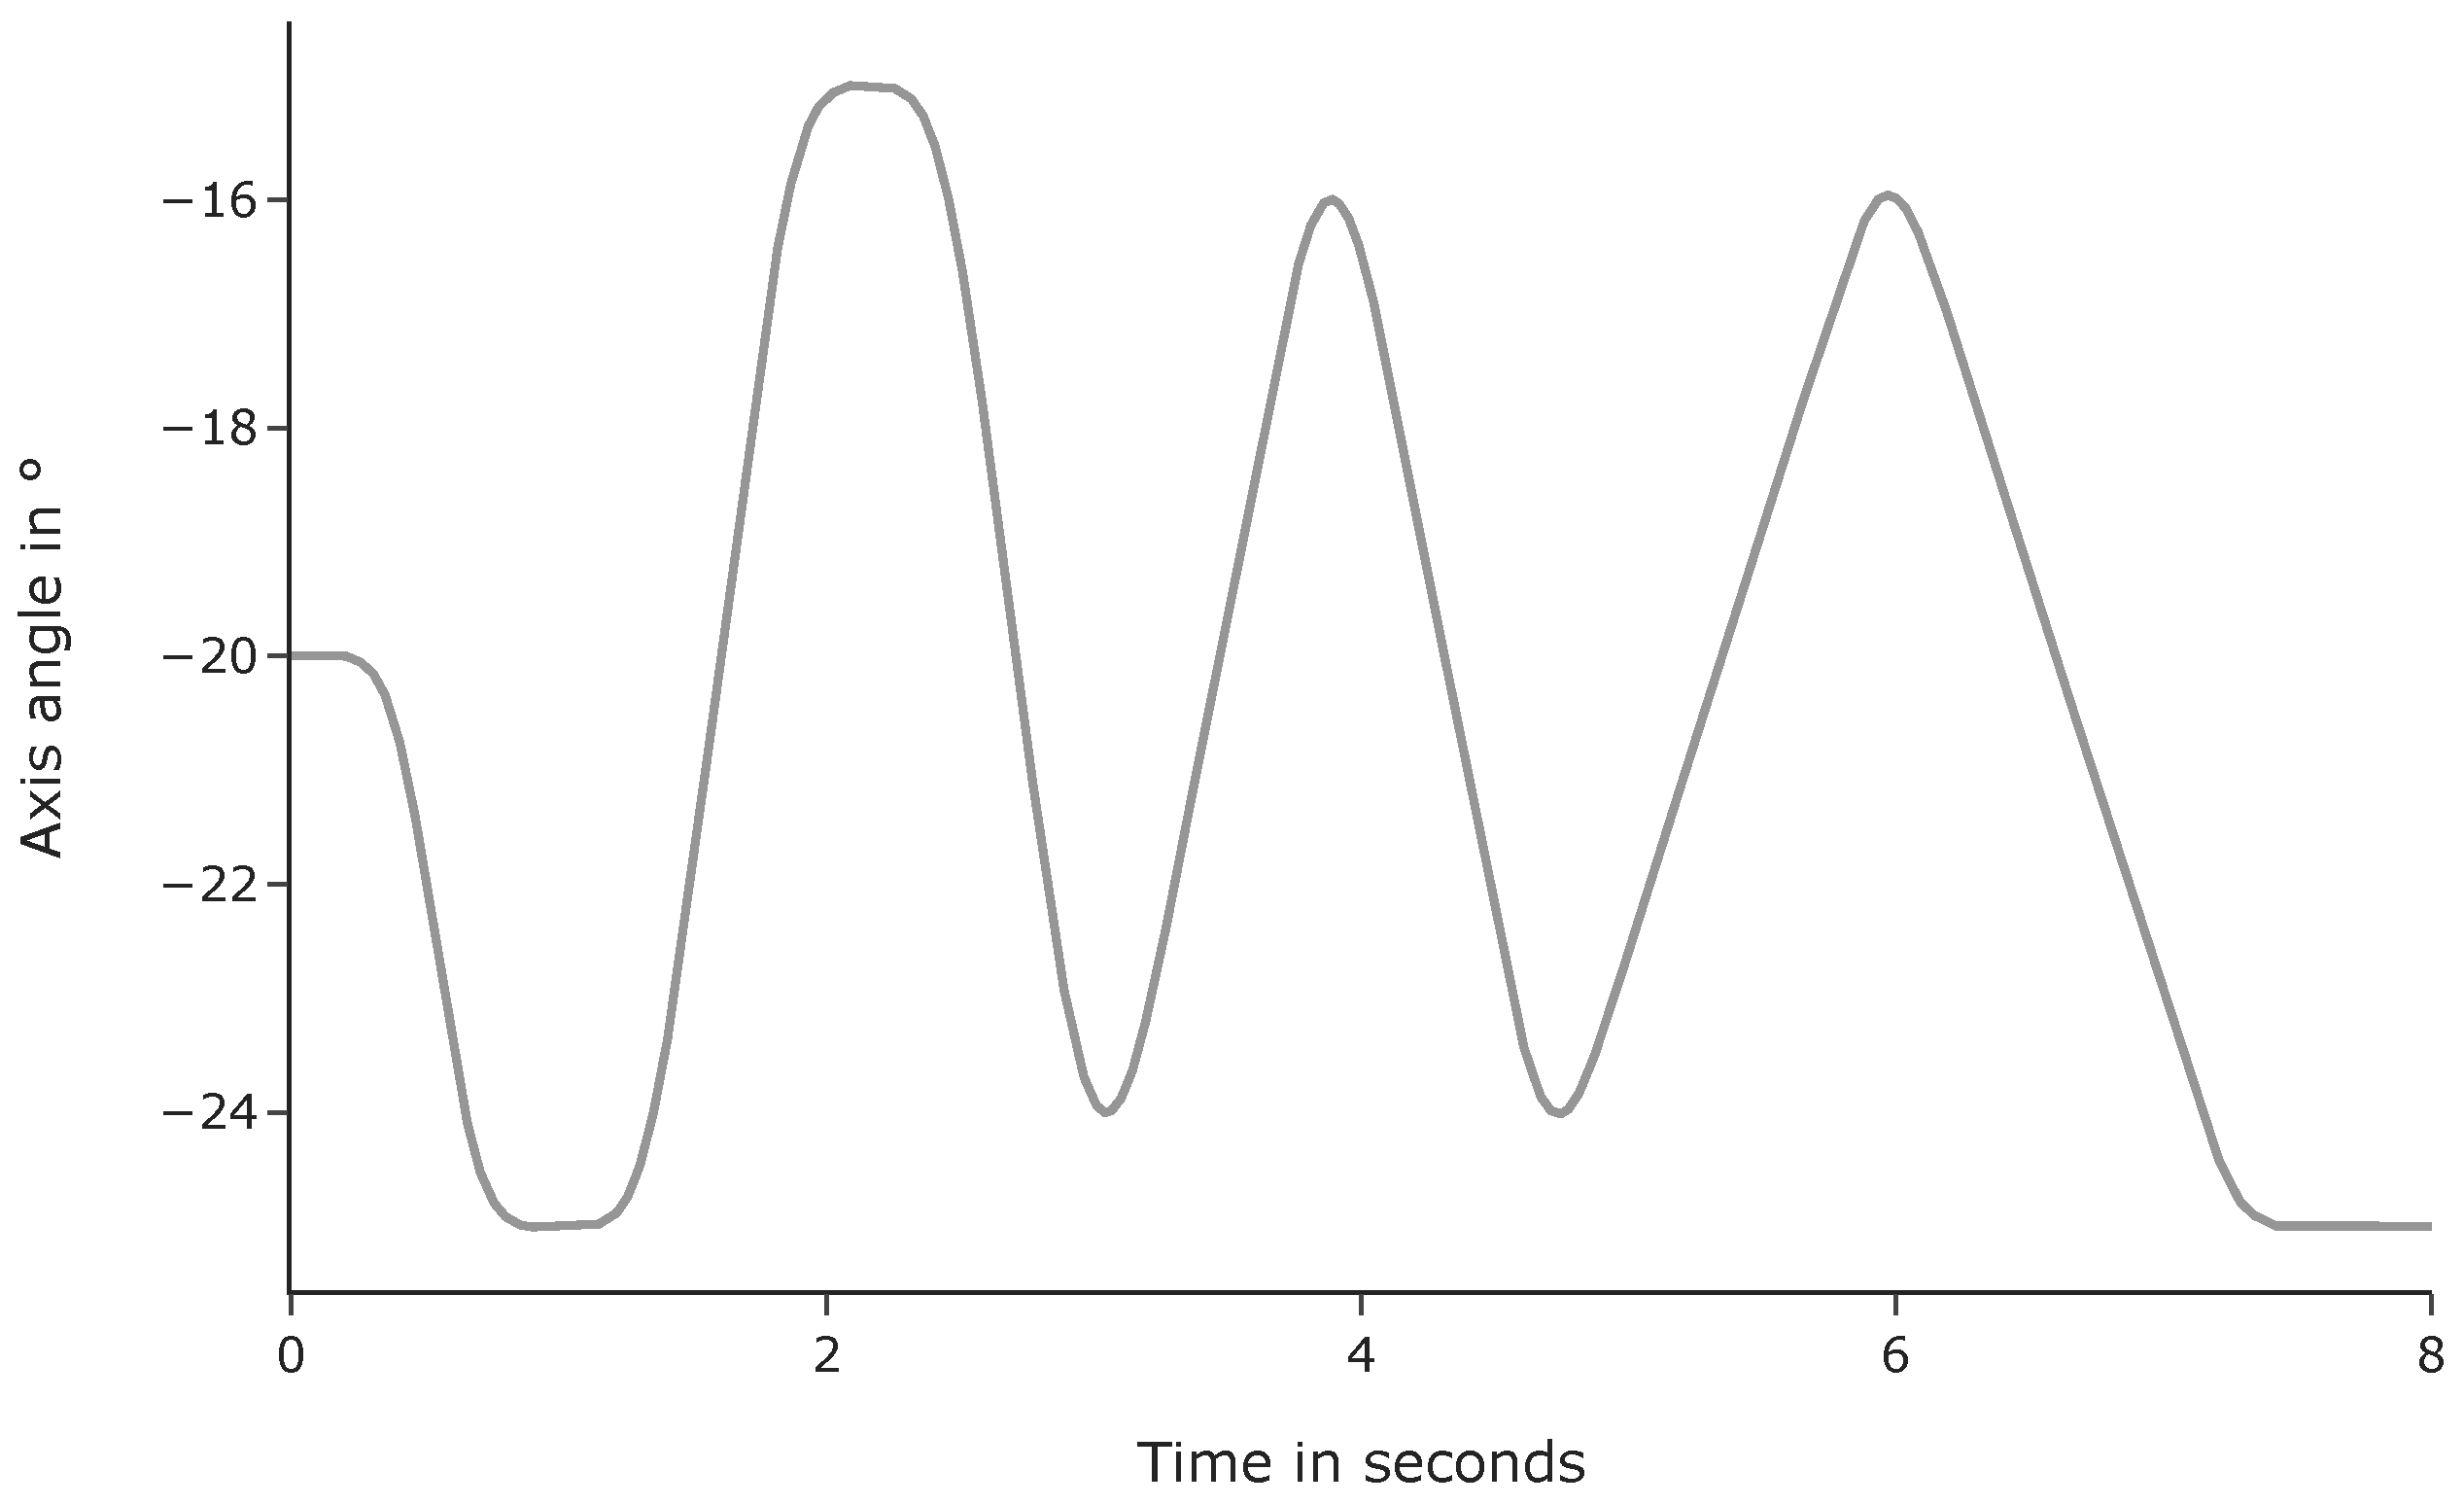
Figure 5 on the right side. These sensors have a sampling rate of 26 kHz. The acceleration direction of the sensors was orthogonal to their contact area. For data acquisition, the robot performed a trajectory where each joint was moved individually at different speeds in an angle area of 10°, as described in
Figure 6, and for different gear temperatures in the range of 25 °C and 60 °C and 5 °C steps. One measurement per axis lasted 8 s. The gear temperature was measured at the gearbox cap with an infrared thermometer. For each temperature step, four measurements were made. For each measurement at each temperature step, the remaining HIs were calculated. To determine the temperature sensitivity, we divided the average HI values calculated from measurements at the highest gear temperatures by the values calculated from measurements at the lowest temperature. HIs with a high sensitivity were eliminated for the last step.
2.2.3. Accelerated Wear Test Analysis
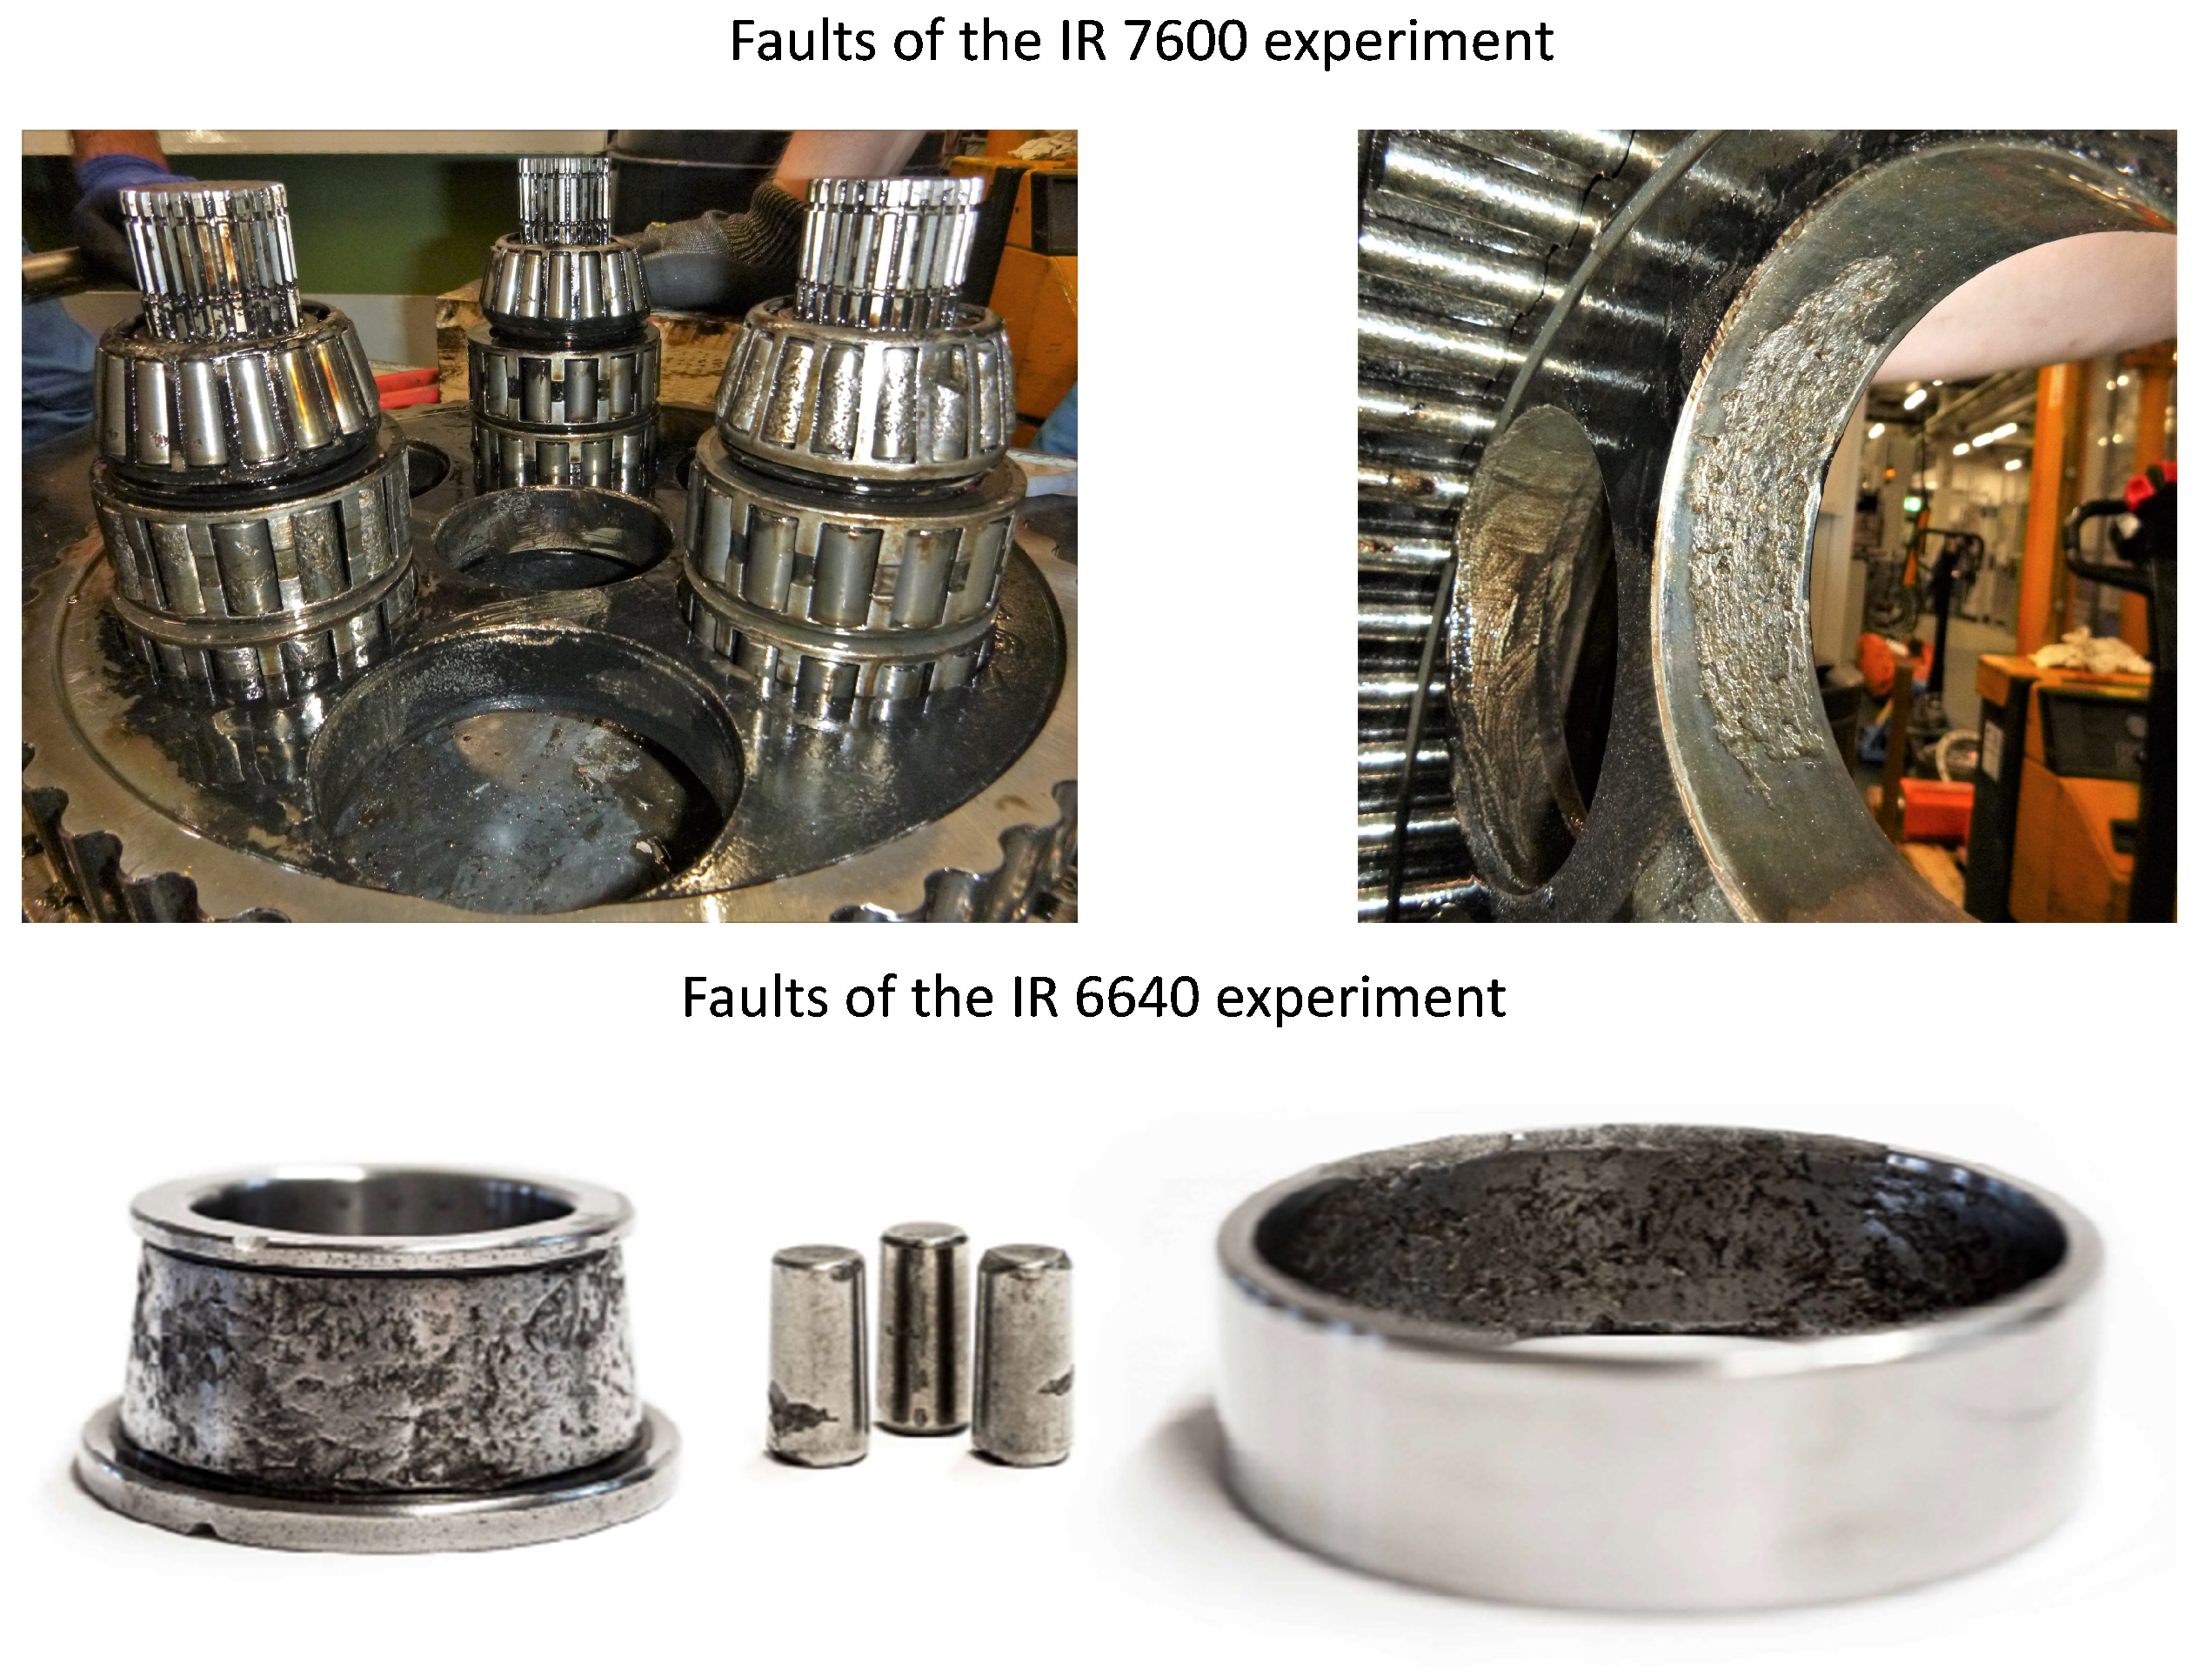
Here, we calculated the remaining HIs for measurements from two data sets from accelerated robot wear tests to see how these HIs perform in a more industry like setting and how they cope with instationary velocity behavior. The first data set was collected during a time range of approximately one year with an ABB robot of type RB 6600-255/2.55. During the data acquisition, the robot performed an isolated movement of the second axis in an angle area of 150° for each measurement. Vibration data were only acquired with a sensor attached axially at the robot axis 2 gearbox. At the end of the experiment, the gearbox was dismantled and faults on the bearings and the shafts of the gear were found. A total of 2290 measurements, equally distributed over time, were taken for our analysis from this data set. One measurement lasted 1.6 s and the sampling rate was 10 kHz. More detailed information about this experiment can be found in [
7,
8]. The second data set was derived from another experiment. Here, the second axis of an ABB IRB 7600-340/2.8 was moved in an angle area of 80° continuously over the time frame of three months. The vibration sensor attached to the gearbox cap of axis 2 sampled with 20 kHz and one measurement lasted 2.15 s. The measurement setup is presented on the left side in
Figure 5. The experiment ended after a roller element of a bearing had cracked and had blocked the gear. In this time range, 920 vibration measurements were taken in total in equidistant time steps. The faults, which occurred in both experiments, can be seen in
Figure 7. In both experiments, environmental conditions such as load and trajectory were kept constant. Fluctuations of the temperature were kept at a minimum due to the constant movements of the robots. In this way, signal changes are likely to be correlated to increasing wear.
3. Results
This section is divided in three parts. First, the results from the varying fault detection experiments are shown. Secondly, the results from the temperature sensitivity analysis are presented. Finally, the application of the HIs on the two accelerated wear tests is described.
3.1. Varying Fault Detection Analysis
From the 16 bearing experiments, the HIs presented in
Table 1 were calculated. We used the first 100 measurements per bearing as the reference quantity for the Z-score-HI and set
R to 128.
Figure 8 shows the R
2 values for a selection of different HIs as a box plot. The R
2 statistics for all HIs can be found in
Appendix A. The abbreviations of the HIs are explained in
Table 1. The PtP-, Peak-, RMS-, Std- and Z-score-HI show the highest R
2 values on average. They also show the lowest variance between the different bearings. This means that these HIs detect different faults most reliably. Other HIs show also high trend values but only for some of the bearings. HIs derived from the frequency-domain (DomF, SpC, SpE, SpF, SpRO) perform worse compared to HIs from the time-domain. The preprocessing steps of enveloping the signal or calculating the residual signal do not affect the HI trend behavior significantly, which can be seen in
Table A1,
Table A2 and
Table A3. The TDI-, and DWTRMS-HI for specific frequency bands also show high average values with changing variance (see
Table A4). If these HIs would be used for robot gear condition monitoring, the progress of all frequency band specific HIs would have to be tracked as different faults stimulate changes in different frequency bands.
3.2. Temperature Sensitivity Analysis
Based on this result, we conducted the temperature sensitivity analysis for the PtP-, Peak-, RMS-, Std-, TDI-, DWTRMS- and Z-score-HI. Here, we used one measurement per temperature step as the reference quantity for the Z-score-HI and set
R to 128.
Figure 9 shows the change of the HIs per axis in percent for the PtP-, Peak-, RMS-, Std- and Z-score-HI. The RMS- and Z-score-HI show the lowest temperature sensitivity overall.
Figure 10 shows the results for the DWTRMS-HIs. Here, high sensitivities for different detail coefficient DWTRMS-HIs exist.
Figure A1 shows the temperature sensitivity of the TDI-HIs of different frequency bands. Here, a similar result can be seen compared to the DWTRMS-HIs. The data of
Figure 10 and
Figure A1 can also be found in
Table A5 and
Table A6. In general, the data from axis 4 show the highest temperature sensitivity for all HIs. The comparably higher sensitivity of the HI values derived from data at axis 4 can be related to the robot trajectory. During the trajectory, the robot arm was stretched out, which leads to greater elasticity at the position of the sensor at axis 4. This can cause increased vibrations, which are magnified under changing temperature influences. Given the results of the temperature sensitivity analysis, we analyzed the data sets from the accelerated wear tests with only the RMS- and the Z-score-HI. The other HIs were excluded due to their high temperature sensitivity. Even though some frequency band specific DWTRMS-HIs and TDI-HIs show low sensitivity, they were excluded as robot gear faults do not have to stimulate these frequency bands with low sensitivity.
3.3. Accelerated Wear Tests Analysis
In this analysis, we used the first 100 measurements as the reference quantity for the Z-score-HI and set
R to 256. For smoothing, we applied a rolling average with a window length of 15 on both HI series. The progress of the HIs in the accelerated wear test of the ABB IRB 7600 is shown in
Figure 11. Both HIs show a plateau with increased values at the end of the experiment. It can be assumed that, at this point in time, faults have already been present. Here, the increased HI values over a longer time period could have been used as a decision criterion for maintenance actions.
The measurements at the very end show decreased values again. We assume that this decrease is correlated to a part of the bearing roller. In the end of the experiment, one of the roller elements showed a large pit. During the measurements showing the higher HI values this detached part of the roller element could have been still slightly fixed at the roller element and thus could have caused high vibration. After full detachment, this noise level decreased again. For the measurements before the plateau, the RMS-HI shows higher fluctuations compared to the Z-score-HI. For instance, the RMS-HI shows a first high peak around measurement 100. Such peaks could lead to false alarms in a condition monitoring scenario and should be avoided.
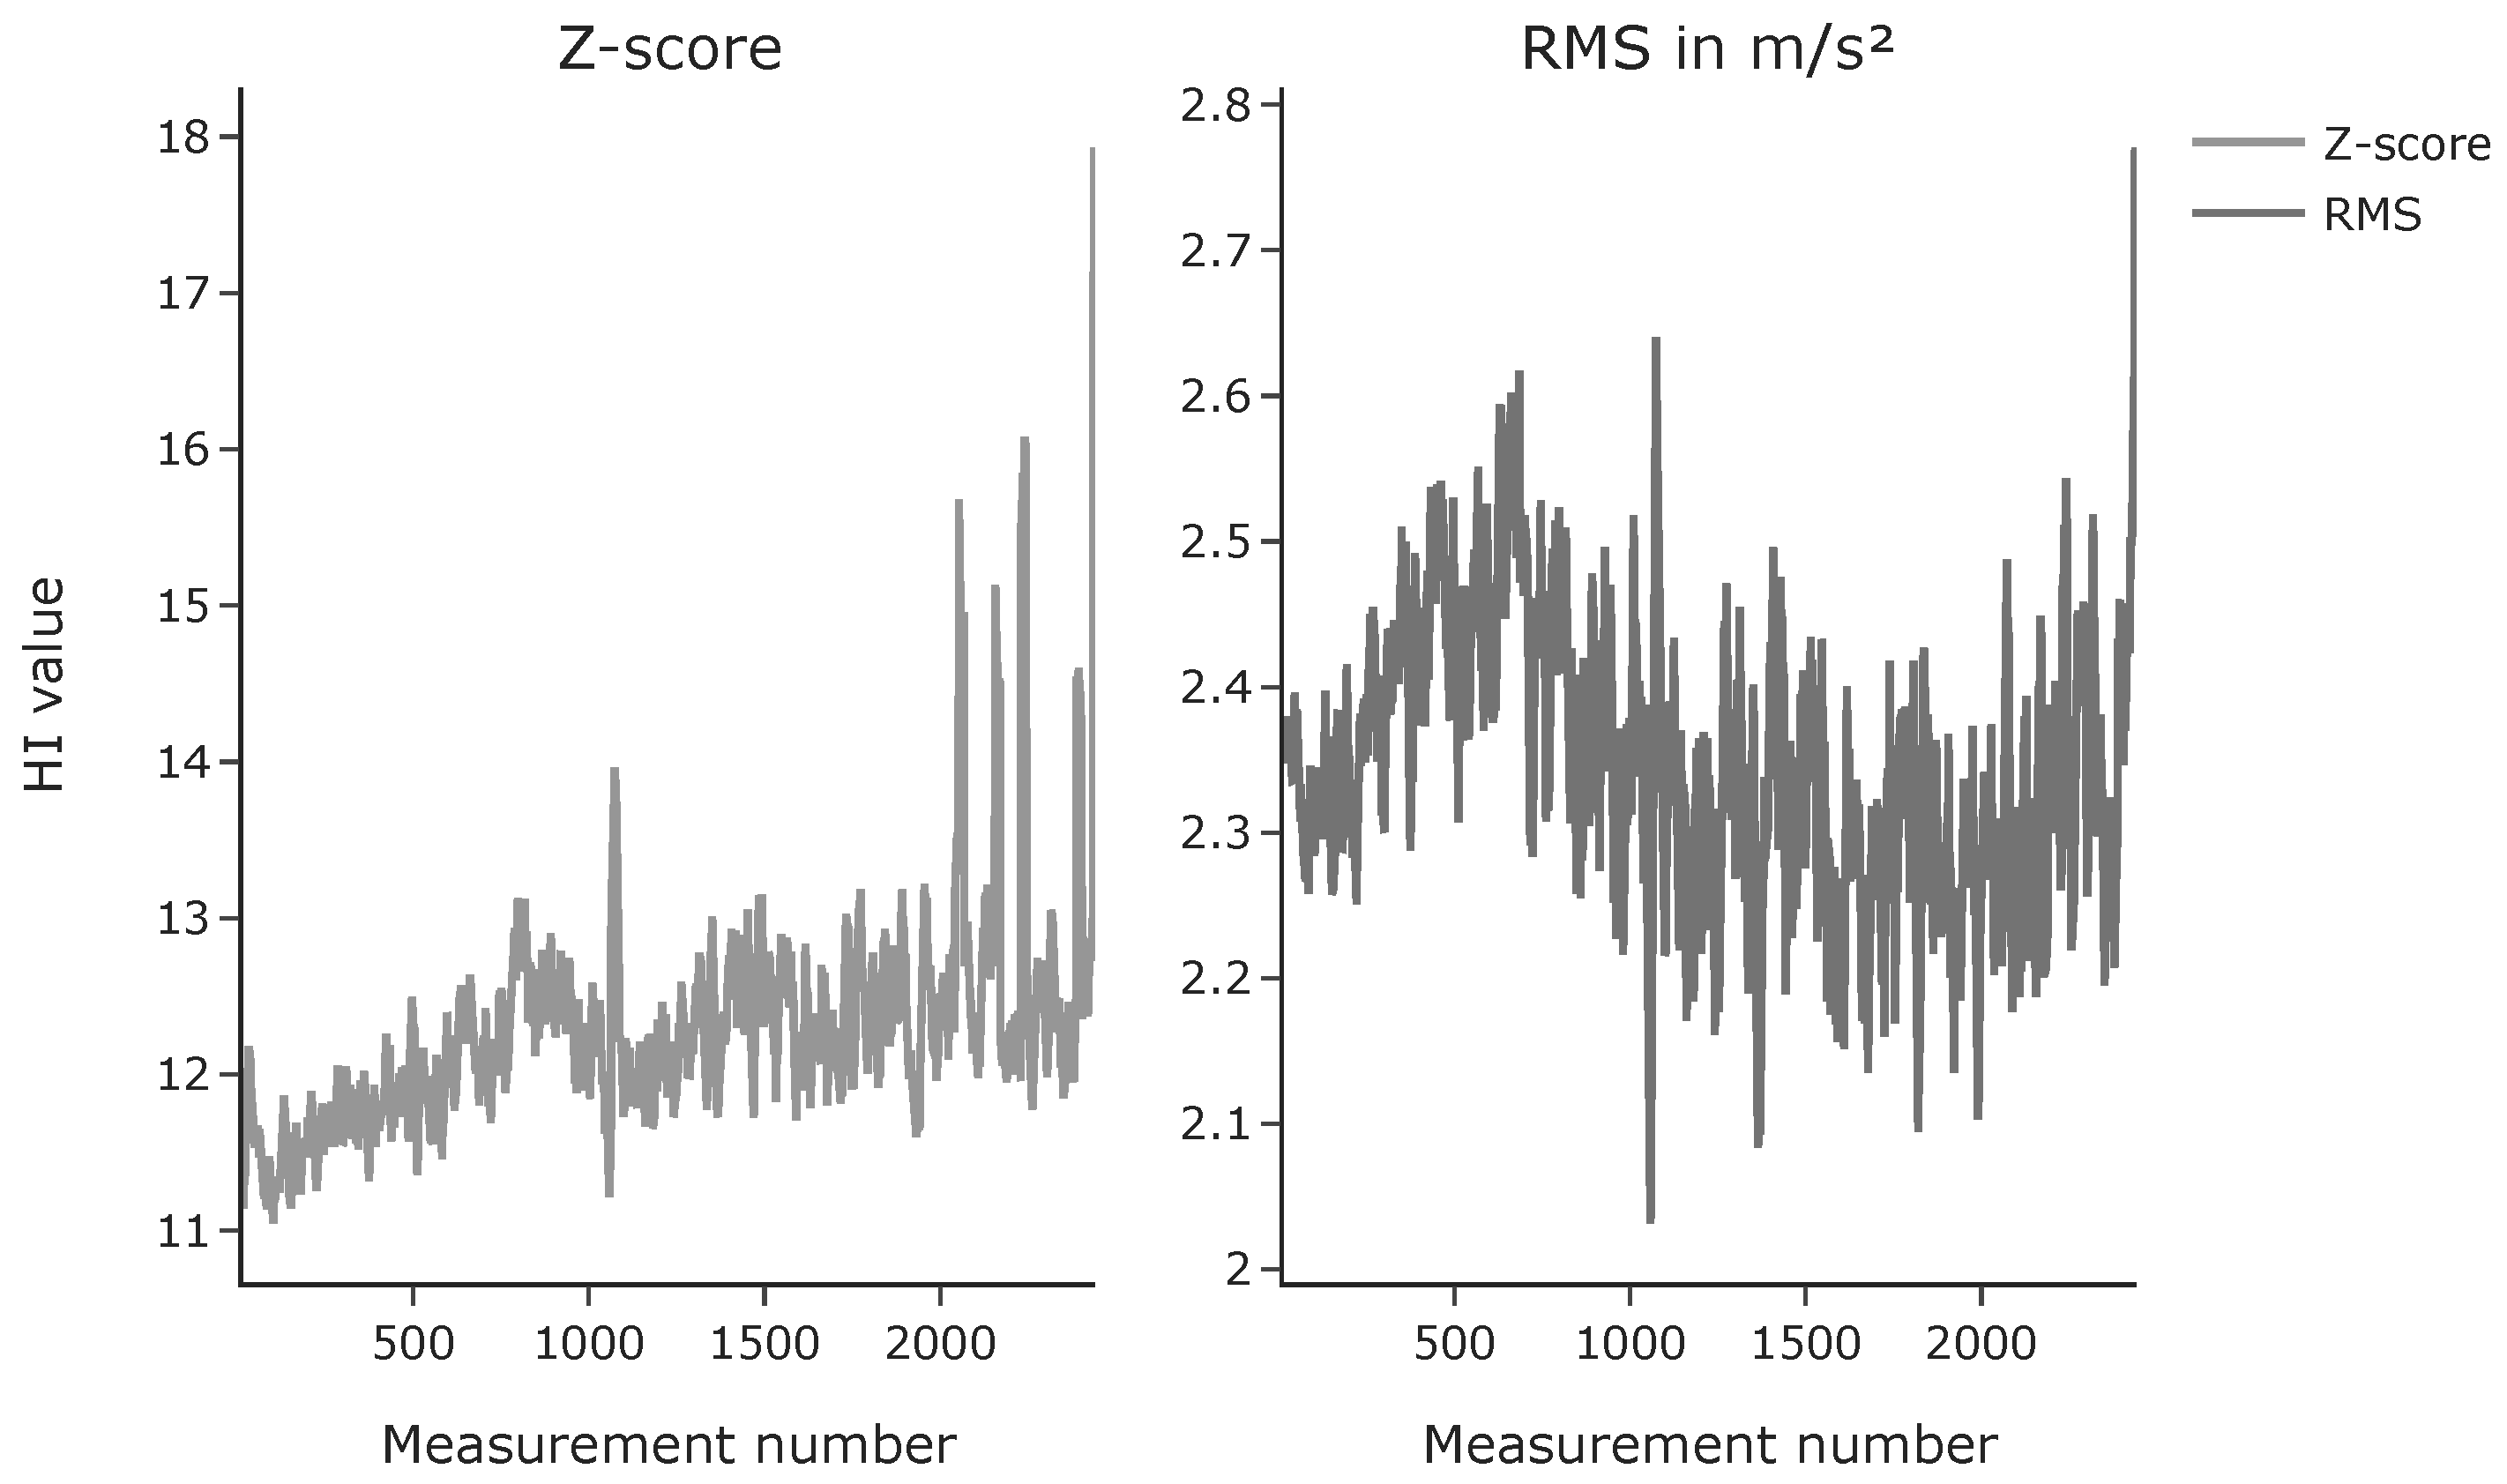
The progress of the HIs in the other accelerated wear test performed with the ABB IRB 6600 is shown in
Figure 12. Here, the Z-score-HI shows a trending behavior and the RMS shows a stationary progress. Both HIs show a high increase during the last measurements. In this experiment, the trending behavior of the Z-score could have been a criterion to execute maintenance actions. This information is not present in the RMS-progress. Based on the fact that the Z-score showed a better trend behavior in the ABB IRB 6600 experiment and less noisy behavior in the ABB IRB 7600 experiment, we suggest the use of the Z-score-HI for the condition monitoring of robot gears.
4. Discussion
The discussion is divided in four parts. First, some remarks regarding our designed HI are given. Afterwards, three parts make up the Results subsections.
To derive the spectrograms required for the Z-score-HI, the length of the window function must be defined. High values for R result in a high frequency resolution and low values in a high time resolution. For the individual experiments, we chose window lengths that lead to a good compromise between time and frequency resolution by inspecting spectrograms created with different window lengths. We chose window lengths that lead to spectrograms appearing the least noisy in a visual inspection. In an industrial setting, an automated approach should be developed for this dependent on the robot’s trajectory and the used sensor.
The motivation to use the FEMTO data set to investigate HI performance was to assess HIs’ capability to detect multiple faults. Within a robot gearbox, which are mostly RV reducers, not only bearings but also the gear teeth can have faults. Such faults are not taken into account by our analysis explicitly. However, the bearing faults present in the FEMTO data set, e.g., pitting, are similar to typical gear teeth or shaft damage from a signal analysis point of view. Damage from all components modulate the acceleration signals at a specific frequency and its sidebands. Exactly this capability to track such changes in the signal was investigated in our analysis. There also exist HIs that track energy changes at the specific component fault frequencies. Such HIs were excluded from our analysis because expert knowledge about the geometric characteristics of the gears, e.g., the bearing diameters or the number of roller elements, is required to calculate these HIs. This expert knowledge is usually not available to industrial robot users. We also excluded HIs that could be derived automatically from machine learning models, such as autoencoders, as the physical interpretation of these HIs is difficult and hence a transferability between different robot systems is questionable from our point of view.
Regarding the results of the temperature sensitivity analysis, it must be pointed out that the results are valid only for the chosen robot trajectory. As the dynamic behavior of the robot changes within its working space, this analysis should be performed individually for trajectories and robot systems. However, from a theoretical point of view, the Z-score-HI possesses the ability to cope with these temperature fluctuations independently of the trajectory. Temperature variations lead to variance in the STFT spectrograms. This variance is taken into account in the
and
during the initialization phase. Hence, Z-score-HIs derived from measurements from functional robot gears and different temperatures will show only little differences in the Z-score-HI value. This becomes more clear considering
Figure 13. Here, the STFT and Z-score spectrograms from two vibration measurements of the temperature sensitivity experiment are shown. On the left side, the spectrograms from a cold gear measurement are depicted. On the right side, the spectrograms from a warm gear measurement are shown. Differences are visible in the STFT spectrograms around seconds 1 and 2. No differences are visible in the Z-score spectrograms. The scales of the STFT spectrograms reach from −5 to 0 and the scales of the Z-score spectrograms from 0 to 1.5. Hence, the relative changes of the STFT spectrograms are bigger compared to the Z-score spectrograms. In this example, the total relative change in energy in the STFT spectrogram is 9.15 percent, whereas the total relative change in the Z-score spectrogram is just 1.63 percent.
Finally, the results from the accelerated wear tests show noisy progress over time. This hinders a simple or automated detection of faults in a condition monitoring behavior. To establish an automated CM system, a suitable trend detection in combination with an outlier detection system must be set up. A trend detection system could identify HI progress shown as in
Figure 12, whereas an outlier detection system could detect progress as depicted in
Figure 11. The development of such a system also marks the outlook of our future work.
5. Conclusions
Condition monitoring of robot gears has the potential to decrease production system downtimes. The state-of-the-art provides many health indicators to track the health state of gears. We analyzed these health indicators regarding specific requirements rising from typical industrial robot applications. These requirements are the ability to detect different faults, low temperature sensitivity and the capability to deal with instationary velocity behavior. Additionally, we suggested a new health indicator based on STFT spectrograms and Z-scores that can cope with these requirements. Our analysis showed that the RMS health indicator and our suggested health indicator meet the defined requirements the best. Data from accelerated wear tests show that for an automatic condition monitoring system a combination of a trend detection and an outlier detection system that can deal with a noisy signal is required.
Author Contributions
Conceptualization, C.N. and G.R.; methodology, C.N.; software, C.N.; validation, C.N.; formal analysis, C.N.; investigation, C.N.; resources, G.R.; data curation, C.N.; writing—original draft preparation, C.N.; writing—review and editing, G.R.; visualization, C.N.; supervision, G.R.; project administration, C.N.; funding acquisition, G.R. All authors have read and agreed to the published version of the manuscript.
Funding
We express our gratitude to the Bavarian Ministry of Economic Affairs, Regional Development, and Energy for the funding of our research. The formulated outlook will be investigated as part of the research project “KIVI” (grant number IUK-1809-0008 IUK597/003) and will be further developed and implemented.
Institutional Review Board Statement
Not applicable.
Informed Consent Statement
Not applicable.
Data Availability Statement
The data presented in this study are available on request from the corresponding author. The data are not publicly available due to confidentiality reasons.
Conflicts of Interest
The authors declare no conflict of interest. The funders had no role in the design of the study; in the collection, analyses, or interpretation of data; in the writing of the manuscript, or in the decision to publish the results.
Appendix A
Table A1.
R2 statistics for HIs derived from the normal signal.
Table A1.
R2 statistics for HIs derived from the normal signal.
| | CrF | DomF | ImpF | Kurt | MarF | Mean | Med | MedF | Peak | PtP | RMS | Skew | SpC | SpE | SpF | SpRO | Std | Z-Score |
|---|
| Mean | 0.231 | 0.354 | 0.287 | 0.336 | 0.296 | 0.034 | 0.063 | 0.467 | 0.822 | 0.844 | 0.887 | 0.242 | 0.599 | 0.488 | 0.514 | 0.491 | 0.887 | 0.934 |
| Std | 0.246 | 0.351 | 0.289 | 0.334 | 0.298 | 0.076 | 0.147 | 0.311 | 0.173 | 0.145 | 0.215 | 0.289 | 0.298 | 0.281 | 0.225 | 0.322 | 0.215 | 0.080 |
| Min | 0.005 | 0.013 | 0.007 | 0.004 | 0.006 | 0.003 | 0.007 | 0.024 | 0.259 | 0.397 | 0.082 | 0.004 | 0.025 | 0.067 | 0.135 | 0.035 | 0.082 | 0.644 |
| Max | 0.706 | 0.998 | 0.764 | 0.869 | 0.773 | 0.323 | 0.618 | 0.941 | 0.987 | 0.985 | 0.990 | 0.888 | 0.944 | 0.971 | 0.900 | 0.984 | 0.990 | 0.983 |
Table A2.
R2 statistics for HIs derived from the enveloped signal.
Table A2.
R2 statistics for HIs derived from the enveloped signal.
| | CrF | DomF | ImpF | Kurt | MarF | Mean | Med | MedF | Peak | PtP | RMS | Skew | SpC | SpE | SpF | SpRO | Std |
|---|
| Mean | 0.215 | 0.139 | 0.284 | 0.299 | 0.296 | 0.776 | 0.819 | 0.496 | 0.816 | 0.816 | 0.872 | 0.275 | 0.605 | 0.464 | 0.462 | 0.514 | 0.898 |
| Std | 0.229 | 0.248 | 0.283 | 0.328 | 0.291 | 0.296 | 0.248 | 0.318 | 0.178 | 0.178 | 0.227 | 0.303 | 0.286 | 0.298 | 0.276 | 0.309 | 0.131 |
| Min | 0.005 | 0.001 | 0.006 | 0.001 | 0.005 | 0.010 | 0.014 | 0.023 | 0.246 | 0.246 | 0.074 | 0.008 | 0.046 | 0.013 | 0.012 | 0.007 | 0.427 |
| Max | 0.635 | 0.997 | 0.741 | 0.919 | 0.766 | 0.977 | 0.983 | 0.981 | 0.988 | 0.988 | 0.989 | 0.905 | 0.939 | 0.978 | 0.901 | 0.987 | 0.987 |
Table A3.
R
2 statistics for HIs derived from the residual signal as suggestet by [
4].
Table A3.
R
2 statistics for HIs derived from the residual signal as suggestet by [
4].
| | CrF | DomF | ImpF | Kurt | MarF | Mean | Med | MedF | Peak | PtP | RMS | Skew | SpC | SpF | SpRO | Std | SpE |
|---|
| Mean | 0.329 | 0.423 | 0.348 | 0.365 | 0.355 | 0.032 | 0.088 | 0.608 | 0.847 | 0.859 | 0.884 | 0.237 | 0.701 | 0.609 | 0.605 | 0.884 | 0.534 |
| Std | 0.270 | 0.348 | 0.303 | 0.337 | 0.312 | 0.089 | 0.187 | 0.292 | 0.178 | 0.153 | 0.221 | 0.319 | 0.196 | 0.202 | 0.213 | 0.221 | 0.316 |
| Min | 0.010 | 0.021 | 0.003 | 0.007 | 0.018 | 0.001 | 0.001 | 0.016 | 0.211 | 0.328 | 0.082 | 0.003 | 0.425 | 0.147 | 0.132 | 0.083 | 0.023 |
| Max | 0.802 | 0.992 | 0.828 | 0.858 | 0.830 | 0.374 | 0.671 | 0.988 | 0.987 | 0.987 | 0.990 | 0.943 | 0.959 | 0.930 | 0.977 | 0.990 | 0.969 |
Table A4.
R2 statistics for HIs derived from the time–frequency-domain. DWT-, IMF-, and TDI-based HIs were calculated for different frequency bands. The frequency bands are encoded in the abbreviation of the HI name. Large numbers correspond to high frequency bands for TDI-HIs and low frequency bands for DWT- and IMF-HIs.
| | Mean | Std | Min | Max |
|---|
| DWTRMS5 | 0.891 | 0.207 | 0.099 | 0.990 |
| DWTRMS4 | 0.889 | 0.223 | 0.032 | 0.988 |
| TDI33 | 0.882 | 0.087 | 0.583 | 0.965 |
| DWTRMS6 | 0.882 | 0.216 | 0.117 | 0.991 |
| TDI43 | 0.871 | 0.156 | 0.296 | 0.983 |
| IMFRMS2 | 0.869 | 0.227 | 0.014 | 0.991 |
| TDI36 | 0.867 | 0.203 | 0.095 | 0.976 |
| TDI14 | 0.865 | 0.154 | 0.327 | 0.970 |
| TDI35 | 0.864 | 0.202 | 0.096 | 0.981 |
| TDI22 | 0.862 | 0.196 | 0.135 | 0.963 |
| TDI34 | 0.861 | 0.197 | 0.114 | 0.974 |
| TDI23 | 0.860 | 0.181 | 0.200 | 0.961 |
| TDI21 | 0.859 | 0.197 | 0.147 | 0.971 |
| DWTRMS3 | 0.859 | 0.245 | 0.019 | 0.998 |
| TDI37 | 0.857 | 0.208 | 0.072 | 0.969 |
| TDI39 | 0.853 | 0.221 | 0.017 | 0.975 |
| TDI15 | 0.847 | 0.218 | 0.035 | 0.982 |
| IMFRMS1 | 0.845 | 0.210 | 0.091 | 0.978 |
| TDI44 | 0.844 | 0.223 | 0.004 | 0.984 |
| TDI13 | 0.842 | 0.224 | 0.015 | 0.975 |
| TDI12 | 0.841 | 0.218 | 0.022 | 0.969 |
| TDI40 | 0.840 | 0.215 | 0.072 | 0.969 |
| TDI24 | 0.837 | 0.223 | 0.027 | 0.954 |
| TDI41 | 0.836 | 0.221 | 0.061 | 0.970 |
| TDI16 | 0.833 | 0.228 | 0.022 | 0.969 |
| TDI42 | 0.830 | 0.221 | 0.072 | 0.964 |
| TDI18 | 0.830 | 0.237 | 0.044 | 0.976 |
| TDI10 | 0.830 | 0.214 | 0.025 | 0.966 |
| TDI5 | 0.827 | 0.273 | 0.032 | 0.995 |
| TDI6 | 0.825 | 0.263 | 0.015 | 0.983 |
| TDI8 | 0.825 | 0.206 | 0.051 | 0.948 |
| TDI9 | 0.824 | 0.209 | 0.047 | 0.954 |
| TDI4 | 0.823 | 0.273 | 0.151 | 0.995 |
| TDI45 | 0.820 | 0.220 | 0.013 | 0.986 |
| TDI20 | 0.818 | 0.277 | 0.066 | 0.963 |
| TDI38 | 0.816 | 0.259 | 0.038 | 0.972 |
| TDI32 | 0.815 | 0.272 | 0.090 | 0.968 |
| TDI46 | 0.813 | 0.218 | 0.023 | 0.987 |
| TDI7 | 0.813 | 0.264 | 0.008 | 0.973 |
| TDI47 | 0.812 | 0.217 | 0.013 | 0.988 |
| TDI11 | 0.812 | 0.251 | 0.017 | 0.966 |
| TDI17 | 0.808 | 0.293 | 0.005 | 0.967 |
| DWTRMS2 | 0.804 | 0.297 | 0.101 | 0.981 |
| IMFRMS3 | 0.803 | 0.243 | 0.025 | 0.961 |
| TDI3 | 0.803 | 0.290 | 0.148 | 0.987 |
| TDI49 | 0.792 | 0.215 | 0.018 | 0.990 |
| TDI19 | 0.782 | 0.304 | 0.026 | 0.959 |
| TDI28 | 0.782 | 0.270 | 0.014 | 0.960 |
| TDI50 | 0.780 | 0.216 | 0.026 | 0.989 |
| TDI52 | 0.770 | 0.216 | 0.025 | 0.989 |
| TDI30 | 0.769 | 0.293 | 0.049 | 0.964 |
| TDI25 | 0.769 | 0.290 | 0.025 | 0.966 |
| TDI53 | 0.767 | 0.215 | 0.025 | 0.989 |
| TDI54 | 0.766 | 0.215 | 0.025 | 0.990 |
| TDI48 | 0.765 | 0.252 | 0.024 | 0.988 |
| TDI55 | 0.765 | 0.215 | 0.028 | 0.989 |
| TDI58 | 0.762 | 0.215 | 0.026 | 0.990 |
| TDI57 | 0.761 | 0.216 | 0.028 | 0.989 |
| TDI60 | 0.756 | 0.222 | 0.028 | 0.989 |
| TDI31 | 0.747 | 0.312 | 0.073 | 0.971 |
| TDI51 | 0.747 | 0.253 | 0.022 | 0.989 |
| TDI29 | 0.744 | 0.297 | 0.032 | 0.961 |
| TDI2 | 0.744 | 0.319 | 0.069 | 0.977 |
| DWTRMS1 | 0.740 | 0.306 | 0.026 | 0.978 |
| TDI27 | 0.739 | 0.292 | 0.027 | 0.954 |
| TDI63 | 0.736 | 0.253 | 0.028 | 0.989 |
| TDI62 | 0.736 | 0.254 | 0.026 | 0.990 |
| TDI59 | 0.735 | 0.254 | 0.024 | 0.990 |
| TDI56 | 0.735 | 0.254 | 0.023 | 0.989 |
| TDI61 | 0.734 | 0.254 | 0.024 | 0.989 |
| TDI64 | 0.732 | 0.254 | 0.024 | 0.989 |
| TDI26 | 0.712 | 0.342 | 0.043 | 0.964 |
| IMFRMS4 | 0.665 | 0.335 | 0.035 | 0.985 |
| HHTentr | 0.646 | 0.317 | 0.021 | 0.982 |
| TDI1 | 0.588 | 0.313 | 0.011 | 0.937 |
| IMFRMS5 | 0.567 | 0.313 | 0.016 | 0.934 |
| IMFRMS6 | 0.460 | 0.223 | 0.110 | 0.829 |
| DecompRate | 0.458 | 0.292 | 0.075 | 0.974 |
| DWTKurt5 | 0.383 | 0.296 | 0.014 | 0.821 |
| DWTKurt2 | 0.381 | 0.318 | 0.007 | 0.815 |
| DWTEntr6 | 0.380 | 0.319 | 0.017 | 0.991 |
| DWTImpF2 | 0.377 | 0.308 | 0.005 | 0.806 |
| DWTKurt4 | 0.361 | 0.315 | 0.007 | 0.851 |
| DWTKurt6 | 0.353 | 0.330 | 0.003 | 0.860 |
| DWTImpF6 | 0.327 | 0.280 | 0.001 | 0.796 |
| DWTImpF5 | 0.326 | 0.274 | 0.001 | 0.766 |
| IMFRMS7 | 0.326 | 0.271 | 0.026 | 0.863 |
| TDI0 | 0.325 | 0.246 | 0.037 | 0.906 |
| DWTImpF3 | 0.325 | 0.260 | 0.017 | 0.701 |
| IMFKurt1 | 0.320 | 0.314 | 0.009 | 0.816 |
| DWTKurt3 | 0.319 | 0.296 | 0.007 | 0.827 |
| DWTImpF4 | 0.302 | 0.273 | 0.004 | 0.748 |
| IMFImpF1 | 0.288 | 0.280 | 0.009 | 0.838 |
| IMFKurt3 | 0.287 | 0.288 | 0.017 | 0.843 |
| IMFKurt4 | 0.286 | 0.222 | 0.024 | 0.677 |
| DWTKurt1 | 0.282 | 0.217 | 0.012 | 0.722 |
| IMFImpF4 | 0.277 | 0.202 | 0.014 | 0.601 |
| IMFKurt2 | 0.263 | 0.274 | 0.010 | 0.689 |
| IMFEntr2 | 0.254 | 0.265 | 0.012 | 0.867 |
| DWTEntr5 | 0.254 | 0.291 | 0.001 | 0.989 |
| DWTImpF1 | 0.251 | 0.213 | 0.006 | 0.660 |
| IMFImpF3 | 0.242 | 0.253 | 0.016 | 0.761 |
| IMFEntr1 | 0.232 | 0.280 | 0.009 | 0.944 |
| IMFImpF2 | 0.224 | 0.185 | 0.011 | 0.602 |
| IMFEntr3 | 0.207 | 0.269 | 0.013 | 0.888 |
| IMFKurt5 | 0.184 | 0.215 | 0.007 | 0.822 |
| IMFRMS8 | 0.181 | 0.238 | 0.000 | 0.682 |
| IMFImpF5 | 0.164 | 0.187 | 0.007 | 0.693 |
| IMFEntr4 | 0.153 | 0.138 | 0.005 | 0.524 |
| DWTEntr4 | 0.136 | 0.235 | 0.005 | 0.969 |
| IMFImpF6 | 0.121 | 0.118 | 0.010 | 0.377 |
| IMFKurt6 | 0.121 | 0.125 | 0.010 | 0.428 |
| IMFEntr6 | 0.105 | 0.102 | 0.009 | 0.393 |
| DWTEntr3 | 0.101 | 0.187 | 0.003 | 0.783 |
| IMFEntr5 | 0.095 | 0.095 | 0.002 | 0.367 |
| IMFEntr7 | 0.089 | 0.092 | 0.003 | 0.276 |
| DWTEntr2 | 0.062 | 0.111 | 0.001 | 0.417 |
| IMFImpF7 | 0.048 | 0.039 | 0.002 | 0.134 |
| IMFKurt7 | 0.042 | 0.033 | 0.002 | 0.106 |
| IMFEntr8 | 0.032 | 0.111 | 0.000 | 0.461 |
| DWTEntr1 | 0.031 | 0.034 | 0.003 | 0.141 |
| IMFImpF8 | 0.026 | 0.028 | 0.000 | 0.078 |
| IMFKurt8 | 0.021 | 0.031 | 0.000 | 0.114 |
| IMFRMS9 | 0.000 | 0.000 | 0.000 | 0.000 |
| IMFKurt9 | 0.000 | 0.000 | 0.000 | 0.000 |
| IMFImpF9 | 0.000 | 0.000 | 0.000 | 0.000 |
| IMFEntr9 | 0.000 | 0.000 | 0.000 | 0.000 |
| IMFRMS10 | 0.000 | 0.000 | 0.000 | 0.000 |
| IMFImpF10 | 0.000 | 0.000 | 0.000 | 0.000 |
| IMFKurt10 | 0.000 | 0.000 | 0.000 | 0.000 |
| IMFEntr10 | 0.000 | 0.000 | 0.000 | 0.000 |
| IMFRMS11 | 0.000 | NaN | 0.000 | 0.000 |
| IMFImpF11 | 0.000 | NaN | 0.000 | 0.000 |
| IMFKurt11 | 0.000 | NaN | 0.000 | 0.000 |
| IMFEntr11 | 0.000 | NaN | 0.000 | 0.000 |
Table A5.
Temperature sensitivity of the different DWTRMS-HIs.
Table A5.
Temperature sensitivity of the different DWTRMS-HIs.
| | 1 | 2 | 3 | 4 |
|---|
| DWTRMS1 | 4.944734 | 41.833250 | 13.225817 | 27.640727 |
| DWTRMS2 | 9.431779 | 61.784386 | 20.966405 | 52.444752 |
| DWTRMS3 | 11.100870 | 67.906341 | 17.372290 | 64.555873 |
| DWTRMS4 | 16.176322 | 88.064015 | 19.294715 | 82.614996 |
| DWTRMS5 | 13.631686 | 87.439763 | 17.451681 | 90.271799 |
| DWTRMS6 | 10.015797 | 70.887870 | 19.141733 | 93.391435 |
Table A6.
Temperature sensitivity of the different TDI-HIs.
Table A6.
Temperature sensitivity of the different TDI-HIs.
| | Axis 1 | Axis 2 | Axis 3 | Axis 4 |
|---|
| TDI0 | 7.887680 | 3.623626 | 4.032428 | 9.856386 |
| TDI1 | 7.345230 | 13.780192 | 1.419329 | 15.104011 |
| TDI2 | 5.702217 | 46.387687 | 23.876372 | 24.639909 |
| TDI3 | 6.721355 | 47.590460 | 22.691756 | 42.390072 |
| TDI4 | 10.873829 | 59.621503 | 24.158641 | 38.671919 |
| TDI5 | 13.127752 | 74.783219 | 17.398075 | 54.988992 |
| TDI6 | 14.670516 | 59.576255 | 12.953424 | 75.739203 |
| TDI7 | 18.161779 | 57.596831 | 17.545132 | 65.254182 |
| TDI8 | 15.090433 | 70.501830 | 11.004508 | 68.946535 |
| TDI9 | 19.130819 | 94.756567 | 10.267873 | 63.083458 |
| TDI10 | 19.817337 | 140.434648 | 22.212611 | 48.494003 |
| TDI11 | 31.037879 | 152.473705 | 28.134321 | 75.366125 |
| TDI12 | 33.675873 | 93.057559 | 18.953184 | 98.385403 |
| TDI13 | 26.250892 | 79.866002 | 17.152706 | 92.669107 |
| TDI14 | 11.635896 | 58.286933 | 24.510069 | 86.809206 |
| TDI15 | 23.377379 | 46.907903 | 16.496553 | 72.502066 |
| TDI16 | 30.064213 | 55.243855 | 11.119799 | 59.119520 |
| TDI17 | 21.268743 | 64.332588 | 7.938803 | 79.776374 |
| TDI18 | 9.808639 | 52.933143 | 4.197856 | 87.106639 |
| TDI19 | 3.420408 | 57.102301 | 3.507140 | 94.175140 |
| TDI20 | 0.062629 | 58.697728 | 5.538016 | 107.584154 |
| TDI21 | 17.433815 | 60.093605 | 12.872000 | 112.916761 |
| TDI22 | 23.980438 | 65.038102 | 9.486835 | 164.461250 |
| TDI23 | 23.749318 | 91.055389 | 11.379480 | 152.353906 |
| TDI24 | 11.483126 | 109.842746 | 21.619409 | 121.442989 |
| TDI25 | 6.596706 | 85.653753 | 23.250270 | 111.067700 |
| TDI26 | 16.057350 | 68.794132 | 20.724566 | 88.922105 |
| TDI27 | 16.557670 | 68.373539 | 18.973086 | 114.047417 |
| TDI28 | 19.372075 | 65.937430 | 13.256130 | 140.639806 |
| TDI29 | 22.613427 | 68.081118 | 27.002980 | 129.175849 |
| TDI30 | 15.441241 | 68.255349 | 31.219217 | 111.829705 |
| TDI31 | 4.729546 | 68.353458 | 28.824115 | 116.071704 |
| TDI32 | 1.112630 | 69.440683 | 18.666493 | 104.393062 |
| TDI33 | 3.010018 | 66.107354 | 13.594603 | 104.544706 |
| TDI34 | 6.223136 | 49.771212 | 14.597765 | 135.411471 |
| TDI35 | 10.119042 | 33.536590 | 4.257545 | 167.094574 |
| TDI36 | 0.777079 | 33.963467 | 0.393118 | 158.518025 |
| TDI37 | 0.893584 | 47.211867 | 18.367647 | 110.996278 |
| TDI38 | 8.789406 | 39.550853 | 33.938136 | 55.254421 |
| TDI39 | 18.286551 | 4.903817 | 23.615781 | 35.301715 |
| TDI40 | 28.767525 | 34.224059 | 6.485524 | 47.061077 |
| TDI41 | 21.670495 | 39.728416 | 9.696093 | 33.227046 |
| TDI42 | 4.437817 | 59.765908 | 18.549288 | 79.919517 |
| TDI43 | 0.147523 | 52.939389 | 19.848252 | 83.294446 |
| TDI44 | 0.446057 | 53.539446 | 19.351326 | 79.595920 |
| TDI45 | 0.657082 | 52.356513 | 19.032092 | 77.824663 |
| TDI46 | 0.199947 | 55.873800 | 19.528656 | 75.827413 |
| TDI47 | 1.388775 | 57.010168 | 19.014225 | 76.394986 |
| TDI48 | 2.097117 | 57.774286 | 18.889822 | 76.077127 |
| TDI49 | 3.164926 | 58.959065 | 18.696796 | 75.814731 |
| TDI50 | 3.851514 | 59.592621 | 18.410404 | 75.719379 |
| TDI51 | 4.577587 | 60.339446 | 18.308180 | 75.543086 |
| TDI52 | 5.160258 | 60.877095 | 18.211340 | 75.458546 |
| TDI53 | 5.659315 | 61.365144 | 18.069126 | 75.348426 |
| TDI54 | 6.077128 | 61.761218 | 17.976632 | 75.218693 |
| TDI55 | 6.436426 | 62.077612 | 17.945549 | 75.121278 |
| TDI56 | 6.763257 | 62.361230 | 17.851473 | 75.050770 |
| TDI57 | 7.080730 | 62.591447 | 17.781367 | 74.975471 |
| TDI58 | 7.369667 | 62.781646 | 17.783673 | 74.880725 |
| TDI59 | 7.622924 | 62.946830 | 17.710259 | 74.853578 |
| TDI60 | 7.828532 | 63.078384 | 17.670637 | 74.815067 |
| TDI61 | 7.974544 | 63.177746 | 17.693925 | 74.733074 |
| TDI62 | 8.072173 | 63.259698 | 17.636933 | 74.758740 |
| TDI63 | 8.128858 | 63.308959 | 17.623715 | 74.750804 |
| TDI64 | 8.147158 | 63.322210 | 17.664456 | 74.689287 |
Figure A1.
Temperature sensitivity for the different TDI-HIs and robot axes.
Figure A1.
Temperature sensitivity for the different TDI-HIs and robot axes.
References
- Krockenberger, O. Industrial Robots for the Automotive Industry. Sae Tech. Pap. Ser. 1996. [Google Scholar] [CrossRef]
- Lee, J.; Wu, F.; Zhao, W.; Ghaffari, M.; Liao, L.; Siegel, D. Prognostics and health management design for rotary machinery systems—Reviews, methodology and applications. Mech. Syst. Signal Process. 2014, 42, 314–334. [Google Scholar] [CrossRef]
- ISO. DIN ISO 17359:2018-05, Zustandsüberwachung und -Diagnostik von Maschinen—Allgemeine Anleitungen (ISO_17359:2018); Beuth Verlag GmbH: Berlin, Germany, 2018. [Google Scholar] [CrossRef]
- Kim, Y.; Park, J.; Na, K.; Yuan, H.; Youn, B.D.; Kang, C.S. Phase-based time domain averaging (PTDA) for fault detection of a gearbox in an industrial robot using vibration signals. Mech. Syst. Signal Process. 2020, 138, 106544. [Google Scholar] [CrossRef]
- Jaber, A.A. Design of an Intelligent Embedded System for Condition Monitoring of an Industrial Robot; Springer Theses, Recognizing Outstanding Ph.D. Research; Springer International Publishing: Cham, Switzerland, 2017. [Google Scholar] [CrossRef]
- Zhi, H.; Shang, Y. Remote performance evaluation, life prediction and fault diagnosis of RV reducer for industrial robot. J. Phys. Conf. Ser. 2020, 1676, 012212. [Google Scholar] [CrossRef]
- Hugo, D.; Benjamin, S. Robot Condition Monitoring: A first Step in Condition Monitoring for Robotic Applications. Master’s Thesis, Lulea University of Technology, Lulea, Sweden, 2017. [Google Scholar]
- Karlsson, M.; Hörnqvist, F. Robot Condition Monitoring and Production Simulation. Master’s Thesis, Lulea University of Technology, Lulea, Sweden, 2018. [Google Scholar]
- Liu, X.; Wu, X.; Liu, C.; Liu, T. Research on condition monitoring of speed reducer of industrial robot with acoustic emission. Trans. Can. Soc. Mech. Eng. 2016, 40, 1041–1049. [Google Scholar] [CrossRef]
- Sun, H.; Zhang, J. Health Monitoring of Strain Wave Gear on Industrial Robots. In Proceedings of the 2019 IEEE 8th Data Driven Control and Learning Systems Conference (DDCLS), Dali, China, 24–27 May 2019. [Google Scholar]
- Nentwich, C.; Junker, S.; Reinhart, G. Data-driven Models for Fault Classification and Prediction of Industrial Robots. Procedia CIRP 2020, 93, 1055–1060. [Google Scholar] [CrossRef]
- Jahagirdar, A.C.; Gupta, K.K. Cumulative Distribution Sharpness Profiling Based Bearing Fault Diagnosis Framework Under Variable Speed Conditions. IEEE Sens. J. 2021. [Google Scholar] [CrossRef]
- Attoui, I.; Boutasseta, N.; Fergani, N. Novel Machinery Monitoring Strategy Based on Time–Frequency Domain Similarity Measurement With Limited Labeled Data. IEEE Trans. Instrum. Meas. 2021, 70, 1–8. [Google Scholar] [CrossRef]
- Cocconcelli, M.; Zimroz, R.; Rubini, R.; Bartelmus, W. STFT Based Approach for Ball Bearing Fault Detection in a Varying Speed Motor. In Condition Monitoring of Machinery in Non-Stationary Operations; Fakhfakh, T., Bartelmus, W., Chaari, F., Zimroz, R., Haddar, M., Eds.; Springer: Berlin/Heidelberg, Germany, 2012; Volume 34, pp. 41–50. [Google Scholar] [CrossRef]
- Gao, H.; Liang, L.; Chen, X.; Xu, G. Feature extraction and recognition for rolling element bearing fault utilizing short-time Fourier transform and non-negative matrix factorization. Chin. J. Mech. Eng. 2015, 28, 96–105. [Google Scholar] [CrossRef]
- Jian, B.L.; Su, X.Y.; Yau, H.T. Bearing Fault Diagnosis Based on Chaotic Dynamic Errors in Key Components. IEEE Access 2021, 9, 53509–53517. [Google Scholar] [CrossRef]
- Vippala, S.R.; Bhat, S.; Reddy, A.A. Condition Monitoring of BLDC Motor Using Short Time Fourier Transform. In Proceedings of the 2021 IEEE Second International Conference on Control, Measurement and Instrumentation (CMI), Kolkata, India, 8–10 January 2021; pp. 110–115. [Google Scholar] [CrossRef]
- Veerendra, A.S.; Mohamed, M.R.; Punya Sekhar, C. A novel fault—Detection methodology of proposed reduced switch MLI fed induction motor drive using discrete wavelet transforms. Int. Trans. Electr. Energy Syst. 2021, 31. [Google Scholar] [CrossRef]
- Defdaf, M.; Berrabah, F.; Chebabhi, A.; Cherif, B.D.E. A new transform discrete wavelet technique based on artificial neural network for induction motor broken rotor bar faults diagnosis. Int. Trans. Electr. Energy Syst. 2021, 31. [Google Scholar] [CrossRef]
- Zhu, H.; He, Z.; Wei, J.; Wang, J.; Zhou, H. Bearing Fault Feature Extraction and Fault Diagnosis Method Based on Feature Fusion. Sensors 2021, 21, 2524. [Google Scholar] [CrossRef]
- Kotsanidis, K.; Benardos, P. Rolling element bearings fault classification based on feature extraction from acceleration data and artificial neural networks. Iop Conf. Ser. Mater. Sci. Eng. 2021, 1037, 012008. [Google Scholar] [CrossRef]
- Skariah, A.; Pradeep, R.; Rejith, R.; Bijudas, C.R. Health monitoring of rolling element bearings using improved wavelet cross spectrum technique and support vector machines. Tribol. Int. 2021, 154, 106650. [Google Scholar] [CrossRef]
- Sharma, S.; Tiwari, S.K.; Singh, S. Integrated approach based on flexible analytical wavelet transform and permutation entropy for fault detection in rotary machines. Measurement 2021, 169, 108389. [Google Scholar] [CrossRef]
- Elasha, F.; Li, X.; Mba, D.; Ogundare, A.; Ojolo, S. A Novel Condition Indicator for Bearing Fault Detection Within Helicopter Transmission. J. Vib. Eng. Technol. 2021, 9, 215–224. [Google Scholar] [CrossRef]
- Mohanraj, T.; Yerchuru, J.; Krishnan, H.; Nithin Aravind, R.S.; Yameni, R. Development of tool condition monitoring system in end milling process using wavelet features and Hoelder’s exponent with machine learning algorithms. Measurement 2021, 173, 108671. [Google Scholar] [CrossRef]
- Duan, J.; Duan, J.; Zhou, H.; Zhan, X.; Li, T.; Shi, T. Multi-frequency-band deep CNN model for tool wear prediction. Meas. Sci. Technol. 2021, 32, 065009. [Google Scholar] [CrossRef]
- Gómez, M.J.; Marklund, P.; Strombergsson, D.; Castejón, C.; García-Prada, J.C. Analysis of Vibration Signals of Drivetrain Failures in Wind Turbines for Condition Monitoring. Exp. Tech. 2021, 45, 1–12. [Google Scholar] [CrossRef]
- Suresh, S.; Naidu, V.P.S. Gearbox Health Condition Monitoring Using DWT Features. In Proceedings of the 6th National Symposium on Rotor Dynamics, Bangalore, India, 2–3 July 2019; Rao, J.S., Arun Kumar, V., Jana, S., Eds.; Springer: Singapore, 2021; Volume 329, pp. 361–374. [Google Scholar]
- de Sena, A.P.C.; de Freitas, I.S.; Filho, A.C.L.; Sobrinho, C.A.N. Fuzzy diagnostics for gearbox failures based on induction motor current and wavelet entropy. J. Braz. Soc. Mech. Sci. Eng. 2021, 43. [Google Scholar] [CrossRef]
- Yu, D.; Yang, Y.; Cheng, J. Application of time—Frequency entropy method based on Hilbert-Huang transform to gear fault diagnosis. Measurement 2007, 40, 823–830. [Google Scholar] [CrossRef]
- Mao, W.; He, J.; Zuo, M.J. Predicting Remaining Useful Life of Rolling Bearings Based on Deep Feature Representation and Transfer Learning. IEEE Trans. Instrum. Meas. 2020, 69, 1594–1608. [Google Scholar] [CrossRef]
- Cheng, C.; Ma, G.; Zhang, Y.; Sun, M.; Teng, F.; Ding, H.; Yuan, Y. A Deep Learning-Based Remaining Useful Life Prediction Approach for Bearings. IEEE/ASME Trans. Mechatron. 2020, 25, 1243–1254. [Google Scholar] [CrossRef] [Green Version]
- Thakker, H.T.; Dave, V.; Vakharia, V.; Singh, S. Fault Diagnosis of Ball Bearing Using Hilbert Huang Transform and LASSO Feature Ranking Technique. Iop Conf. Ser. Mater. Sci. Eng. 2020, 841, 012006. [Google Scholar] [CrossRef]
- Larsen, R.J.; Marx, M.L. An Introduction to Mathematical Statistics and Its Applications, 3rd ed.; Prentice Hall: Upper Saddle River, NJ, USA, 2001. [Google Scholar]
- Nectoux, P.; Gouriveau, R.; Medjaher, K.; Ramasso, E.; Chebel-Morello, B.; Zerhouni, N.; Varnier, C. PRONOSTIA: An experimental platform for bearings accelerated degradation tests. In Proceedings of the IEEE International Conference on Prognostics and Health Management, PHM’12, Denver, CO, USA, 23–27 September 2012. [Google Scholar]
- Nectoux, P.; Gouriveau, R.; Medjaher, K.; Ramasso, E.; Chebel-Morello, B.; Zerhouni, N.; Varnier, C. PHM IEEE 2012 Data Challenge Data Set. Available online: https://github.com/wkzs111/phm-ieee-2012-data-challenge-dataset (accessed on 19 May 2021).
- Arun, P.; Lincon, S.A.; Prabhakaran, N. Detection and Characterization of Bearing Faults from the Frequency Domain Features of Vibration. IETE J. Res. 2018, 64, 634–647. [Google Scholar] [CrossRef]
- Caesarendra, W.; Tjahjowidodo, T. A Review of Feature Extraction Methods in Vibration-Based Condition Monitoring and Its Application for Degradation Trend Estimation of Low-Speed Slew Bearing. Machines 2017, 5, 21. [Google Scholar] [CrossRef]
- Vecer, P.; Kreidl, M.; Smid, R. Condition Indicators for Gearbox Condition Monitoring Systems. Acta Polytech. 2005, 45, 35–42. [Google Scholar] [CrossRef]
- Zhu, J.; Nostrand, T.; Spiegel, C.; Morton, B. Survey of condition indicators for condition monitoring systems. In Proceedings of the Annual Conference of the Prognostics and Health Management Society 2014, Fort Worth, TX, USA, 27 September–3 October 2014. [Google Scholar]
- Geropp, B. Envelope Analysis—A Signal Analysis Technique for Early Detection and Isolation of Machine Faults. IFAC Proc. Vol. 1997, 30, 977–981. [Google Scholar] [CrossRef]
- Lei, Y.; Li, N.; Guo, L.; Li, N.; Yan, T.; Lin, J. Machinery health prognostics: A systematic review from data acquisition to RUL prediction. Mech. Syst. Signal Process. 2018, 104, 799–834. [Google Scholar] [CrossRef]
| Publisher’s Note: MDPI stays neutral with regard to jurisdictional claims in published maps and institutional affiliations. |
© 2021 by the authors. Licensee MDPI, Basel, Switzerland. This article is an open access article distributed under the terms and conditions of the Creative Commons Attribution (CC BY) license (https://creativecommons.org/licenses/by/4.0/).


