

Self-Assembly of Lipid Molecules under Shear Flows: A Dissipative Particle Dynamics Simulation Study


Abstract
:1. Introduction
2. Models and Methods
2.1. Simulation Method
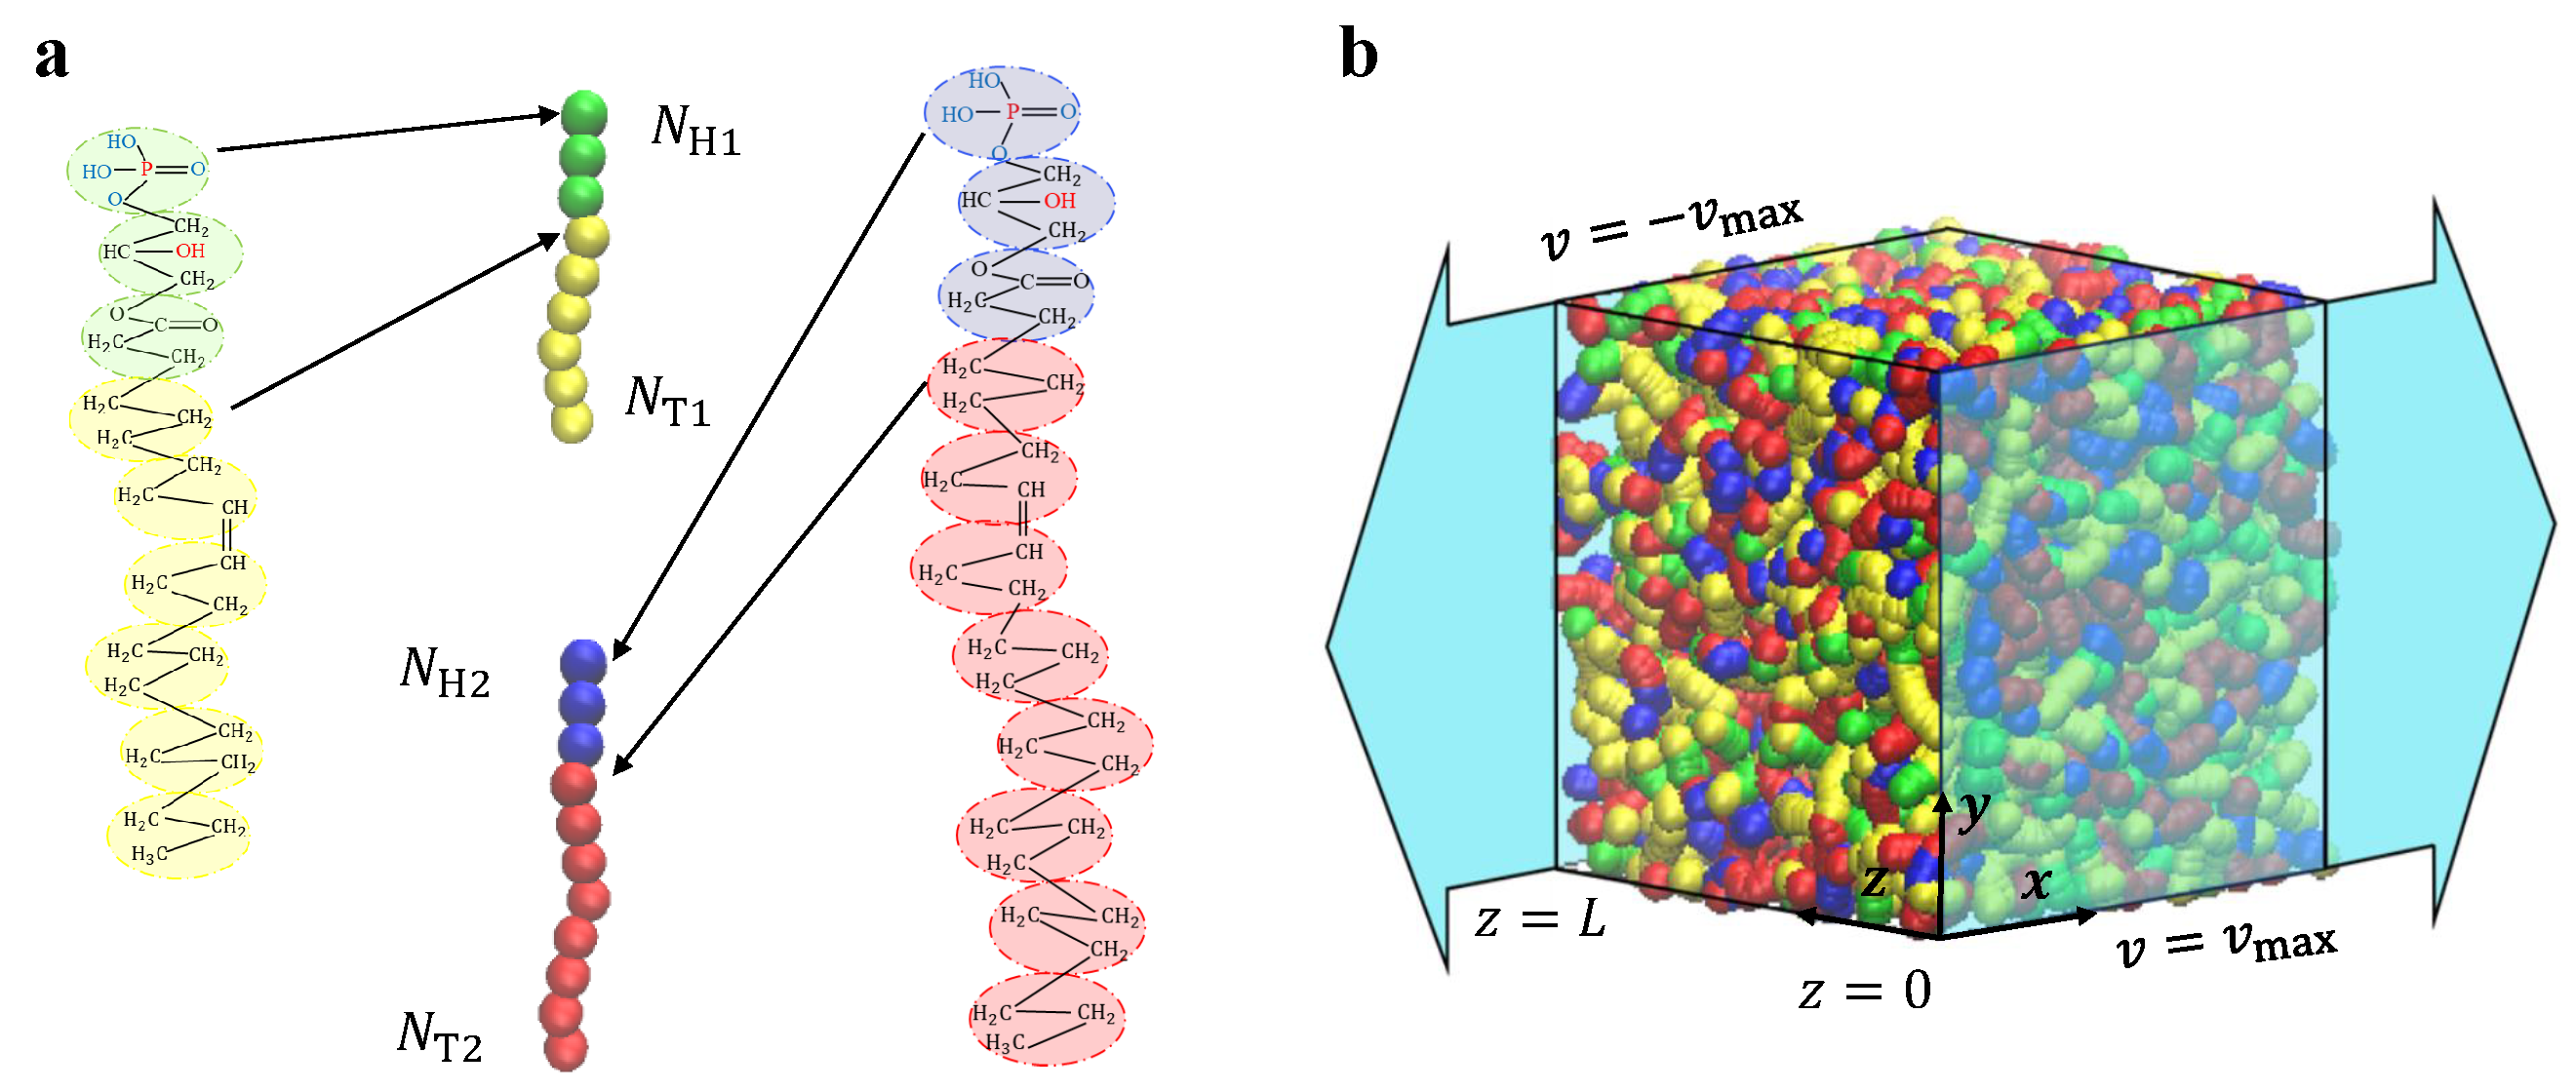
2.2. Lipid Molecule Model
2.3. Shear Flow Model
2.4. Simulation Parameters
3. Results and Discussion
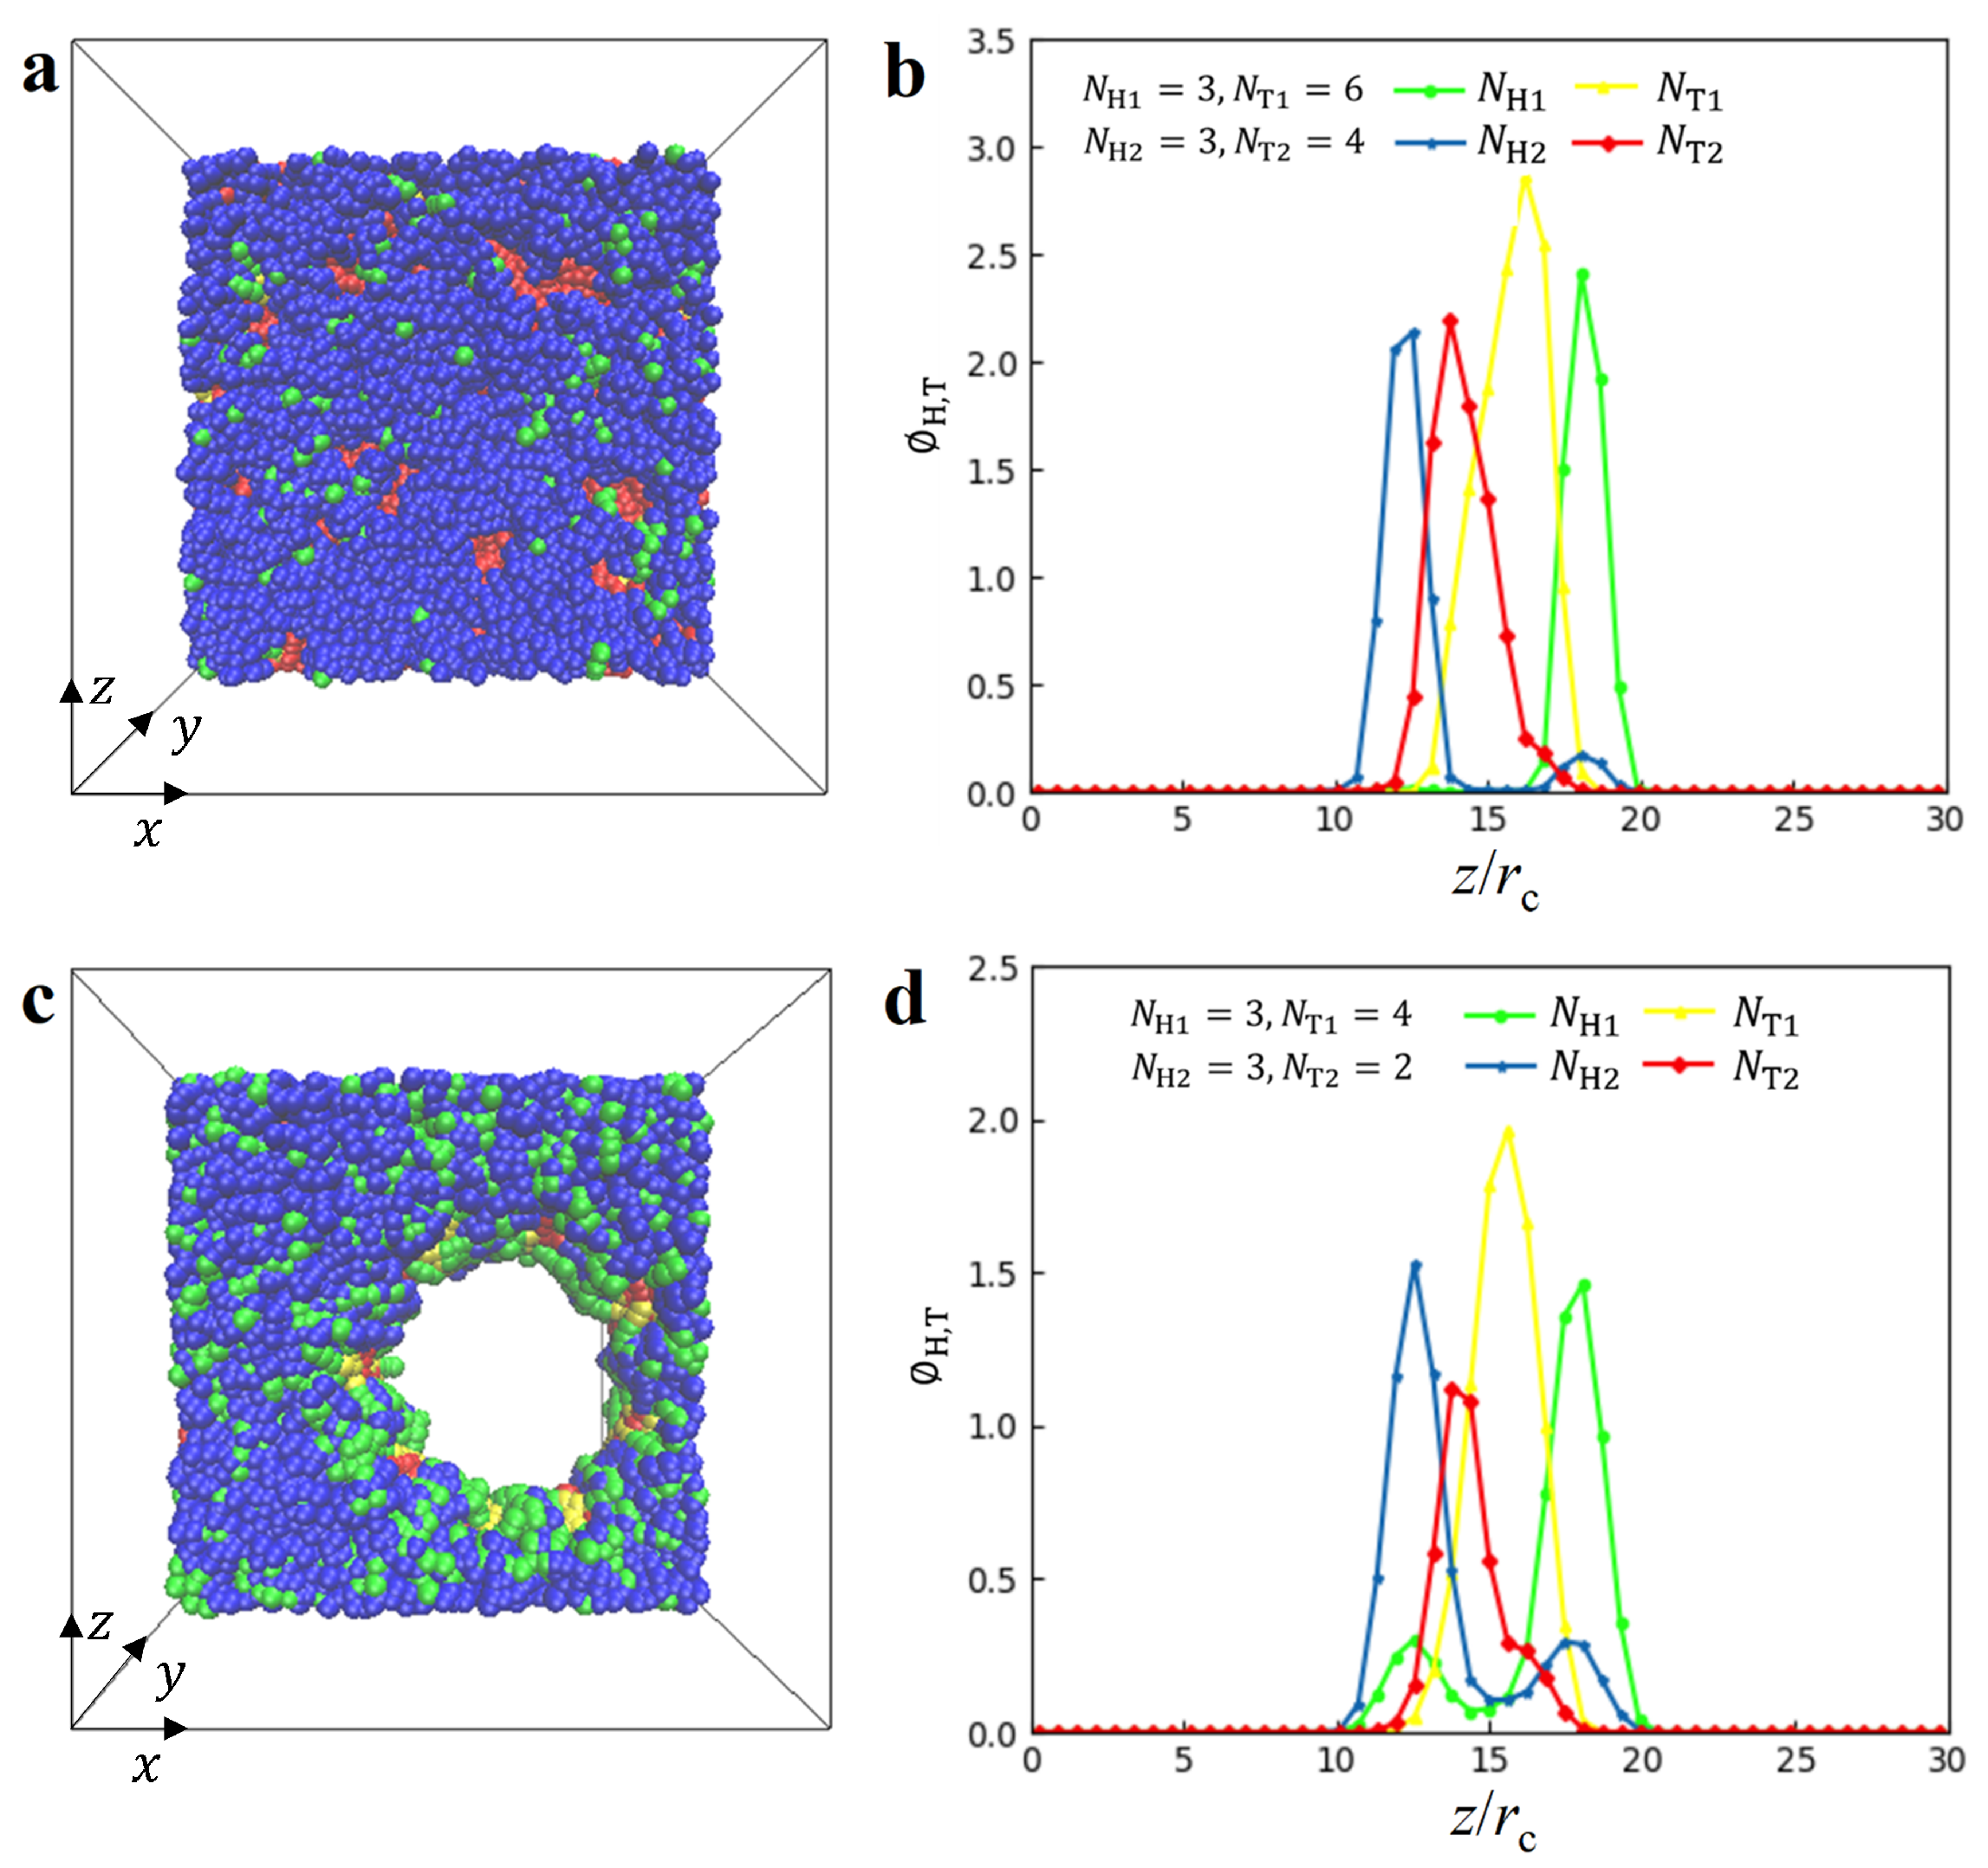
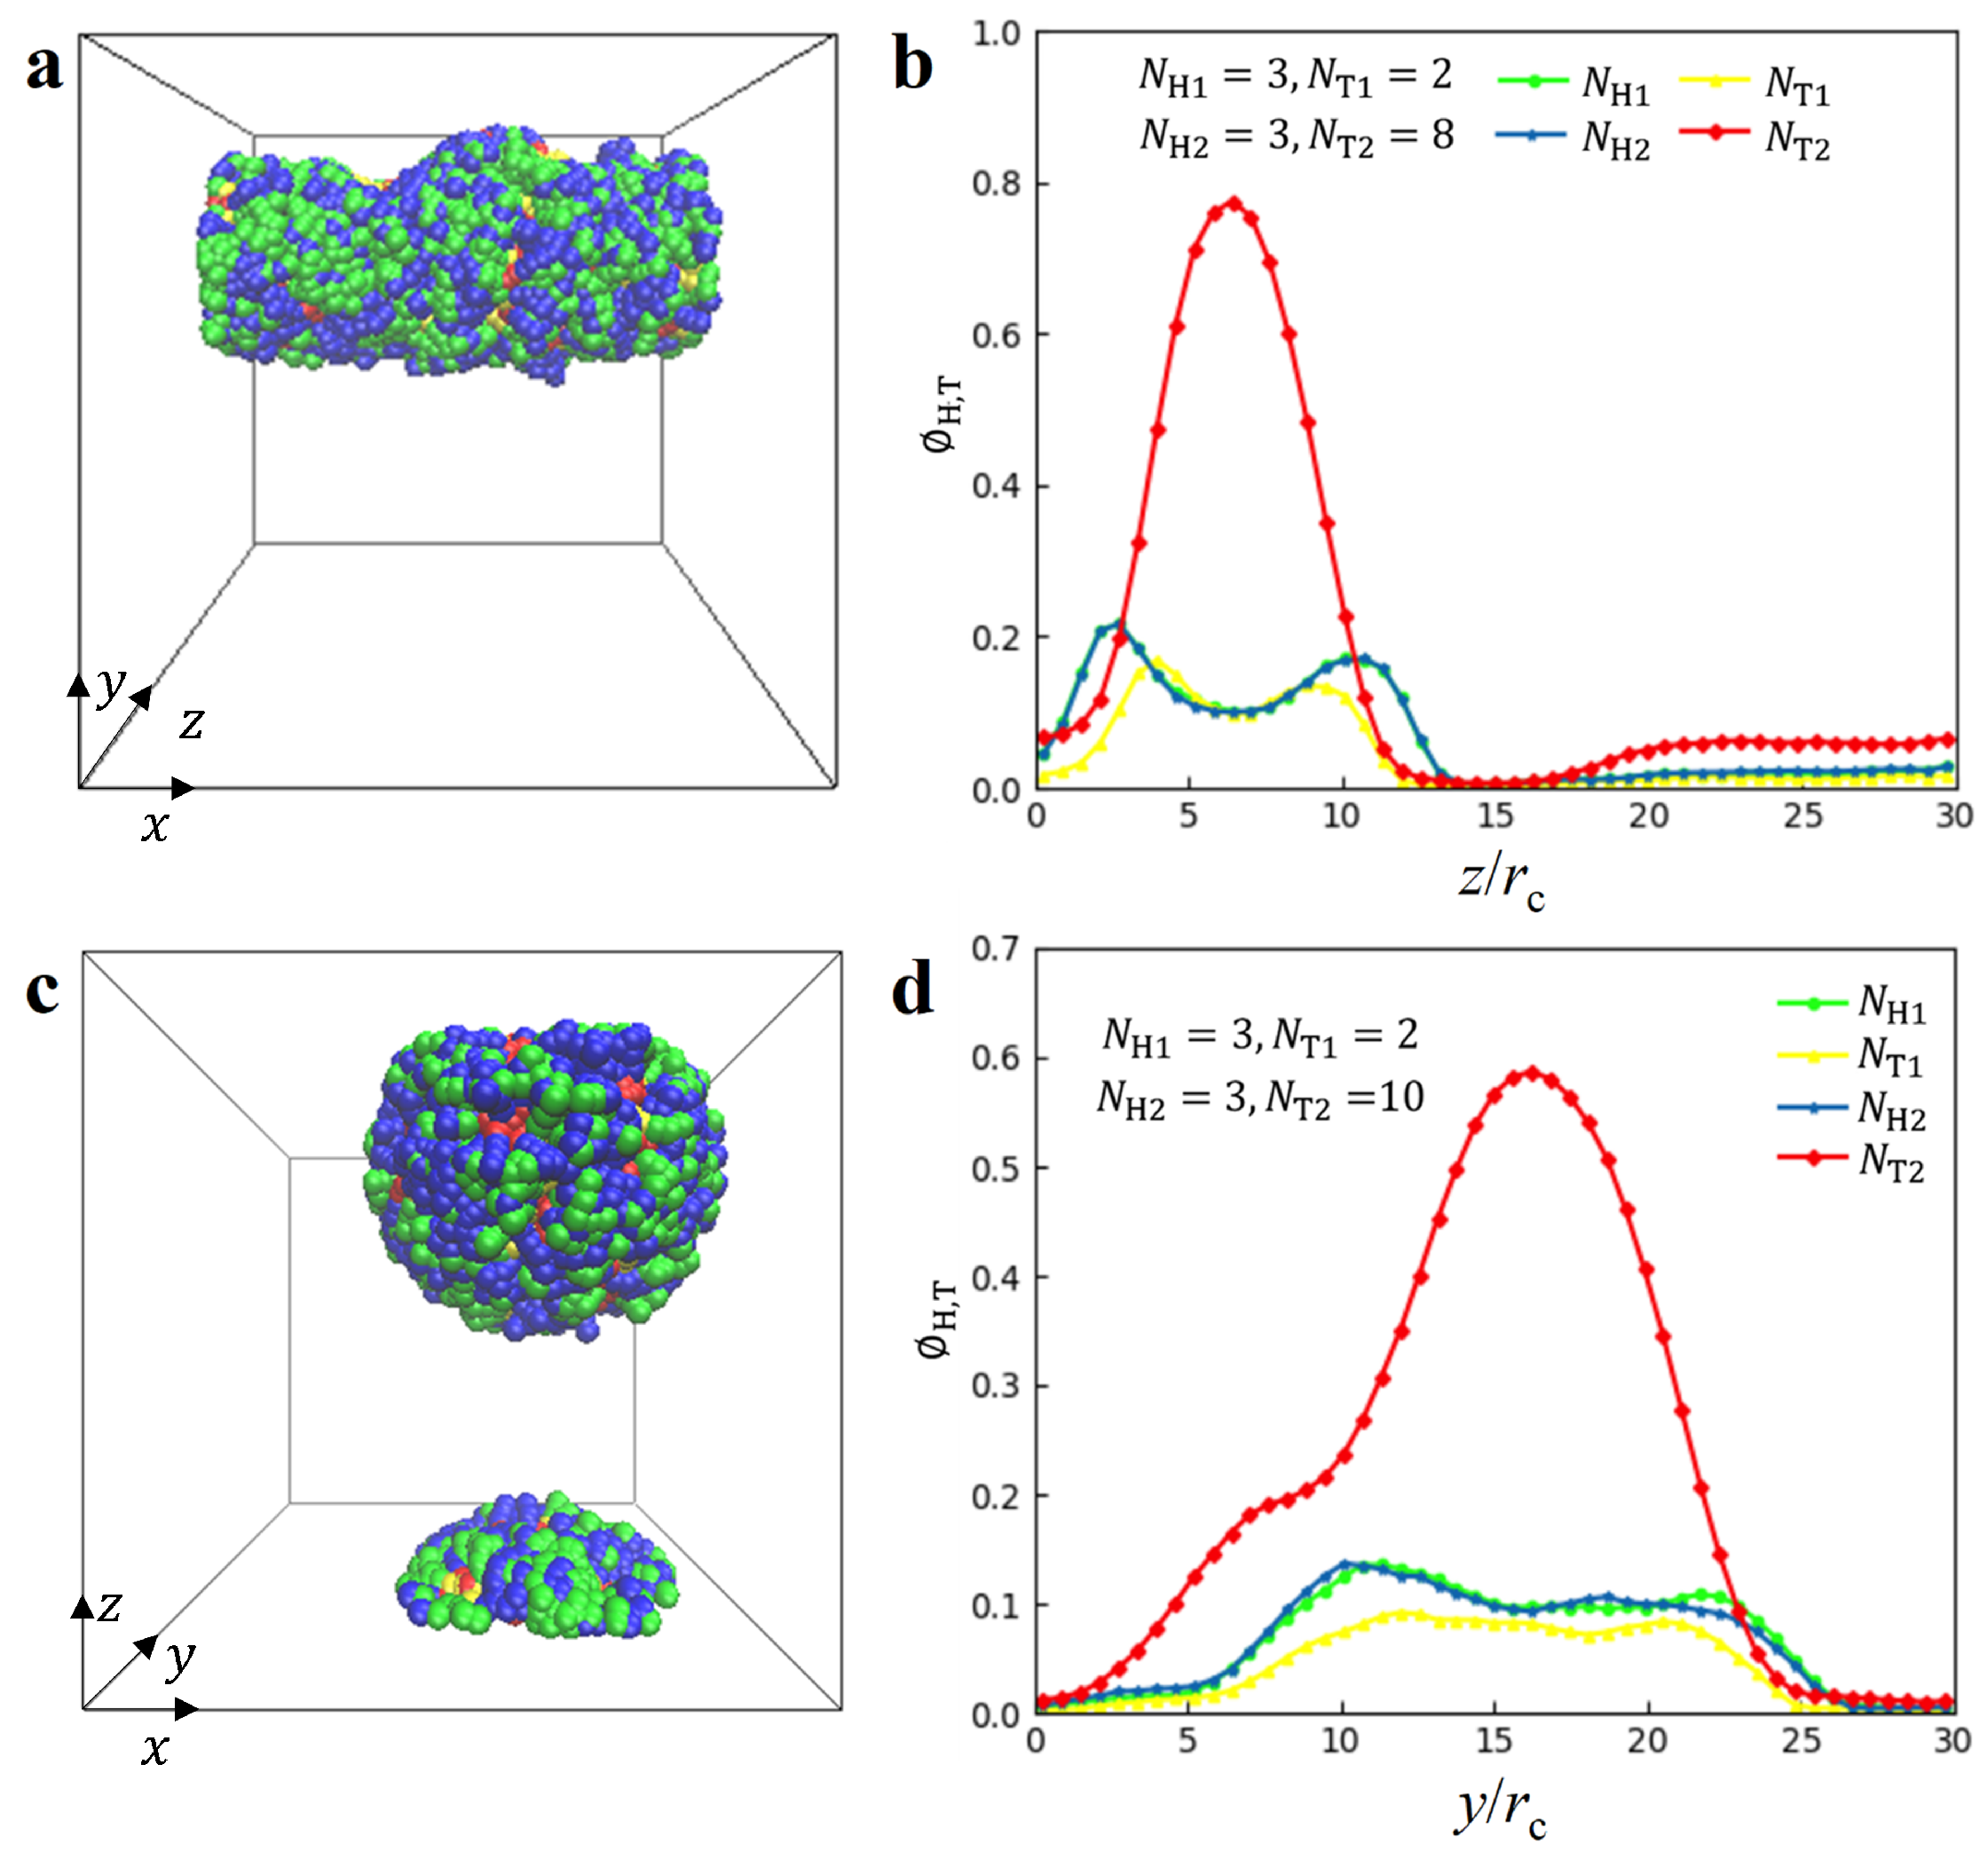
3.1. Nanostructures


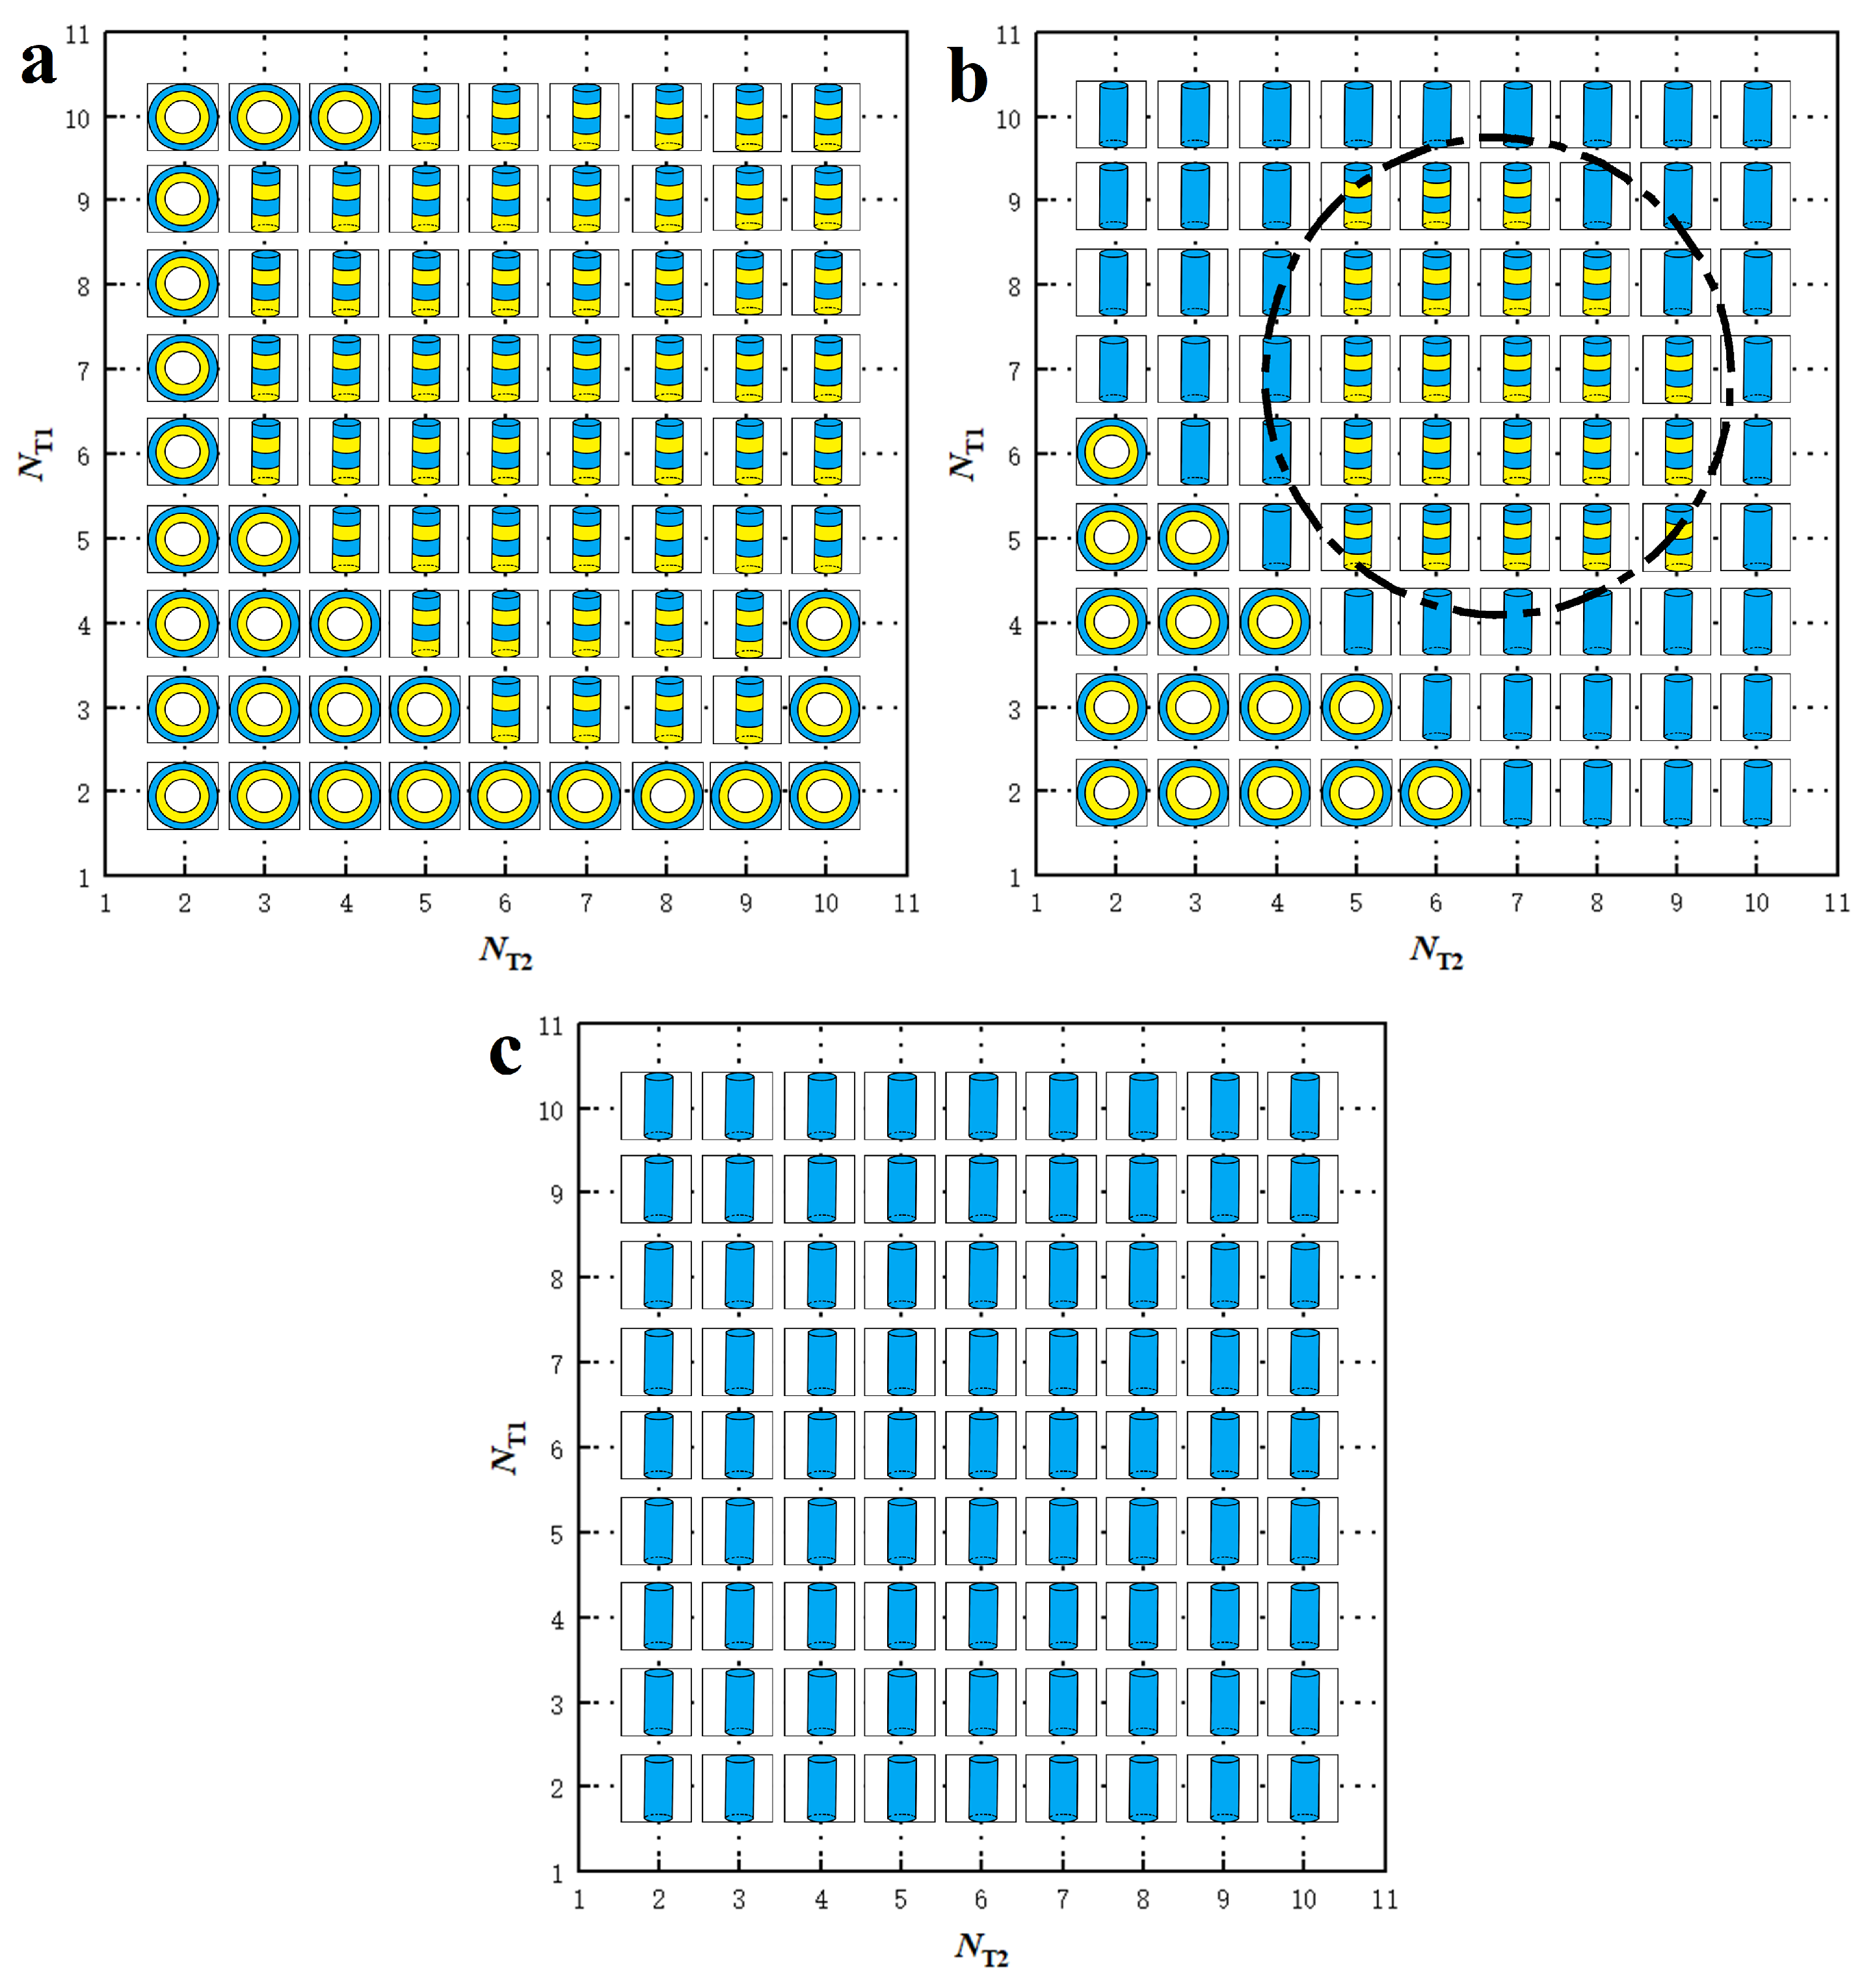
3.2. Phase Diagrams
 represent , micelle and vesicle nanostructures, respectively.
represent , micelle and vesicle nanostructures, respectively.
represent , micelle and vesicle nanostructures, respectively.
 represent DL, PDL and micelle nanostructures, respectively.
represent DL, PDL and micelle nanostructures, respectively.
represent DL, PDL and micelle nanostructures, respectively.
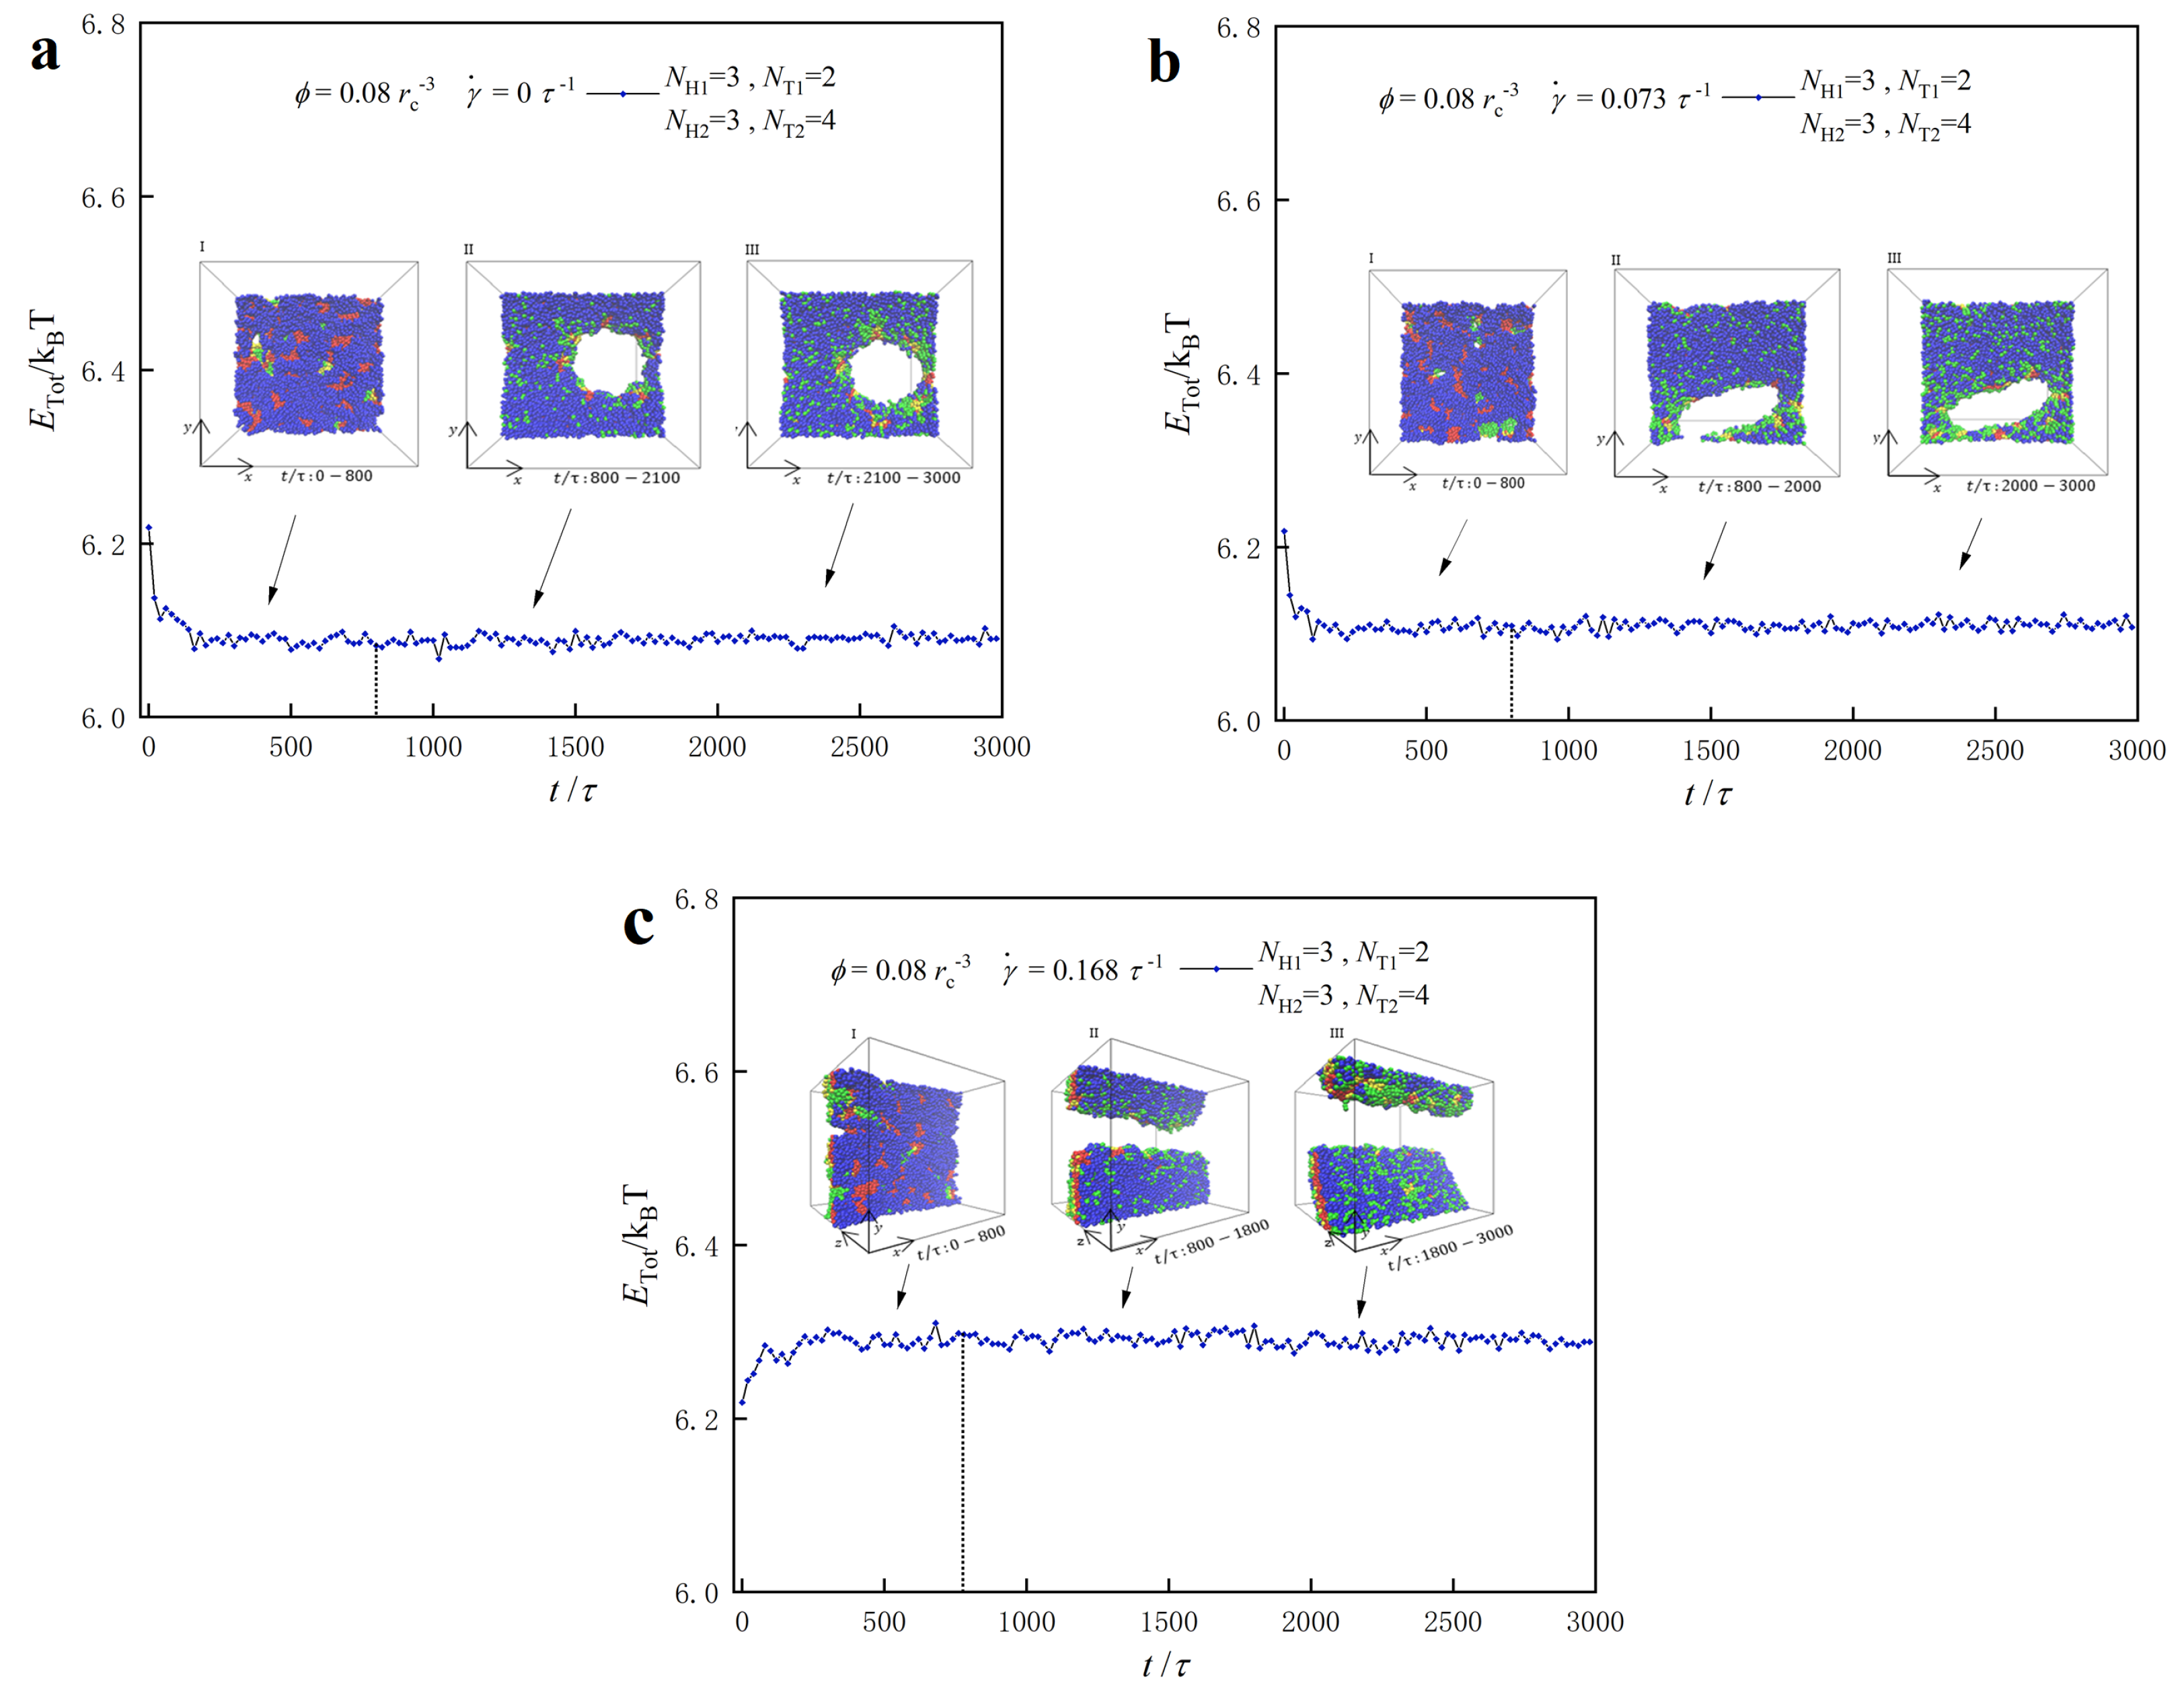
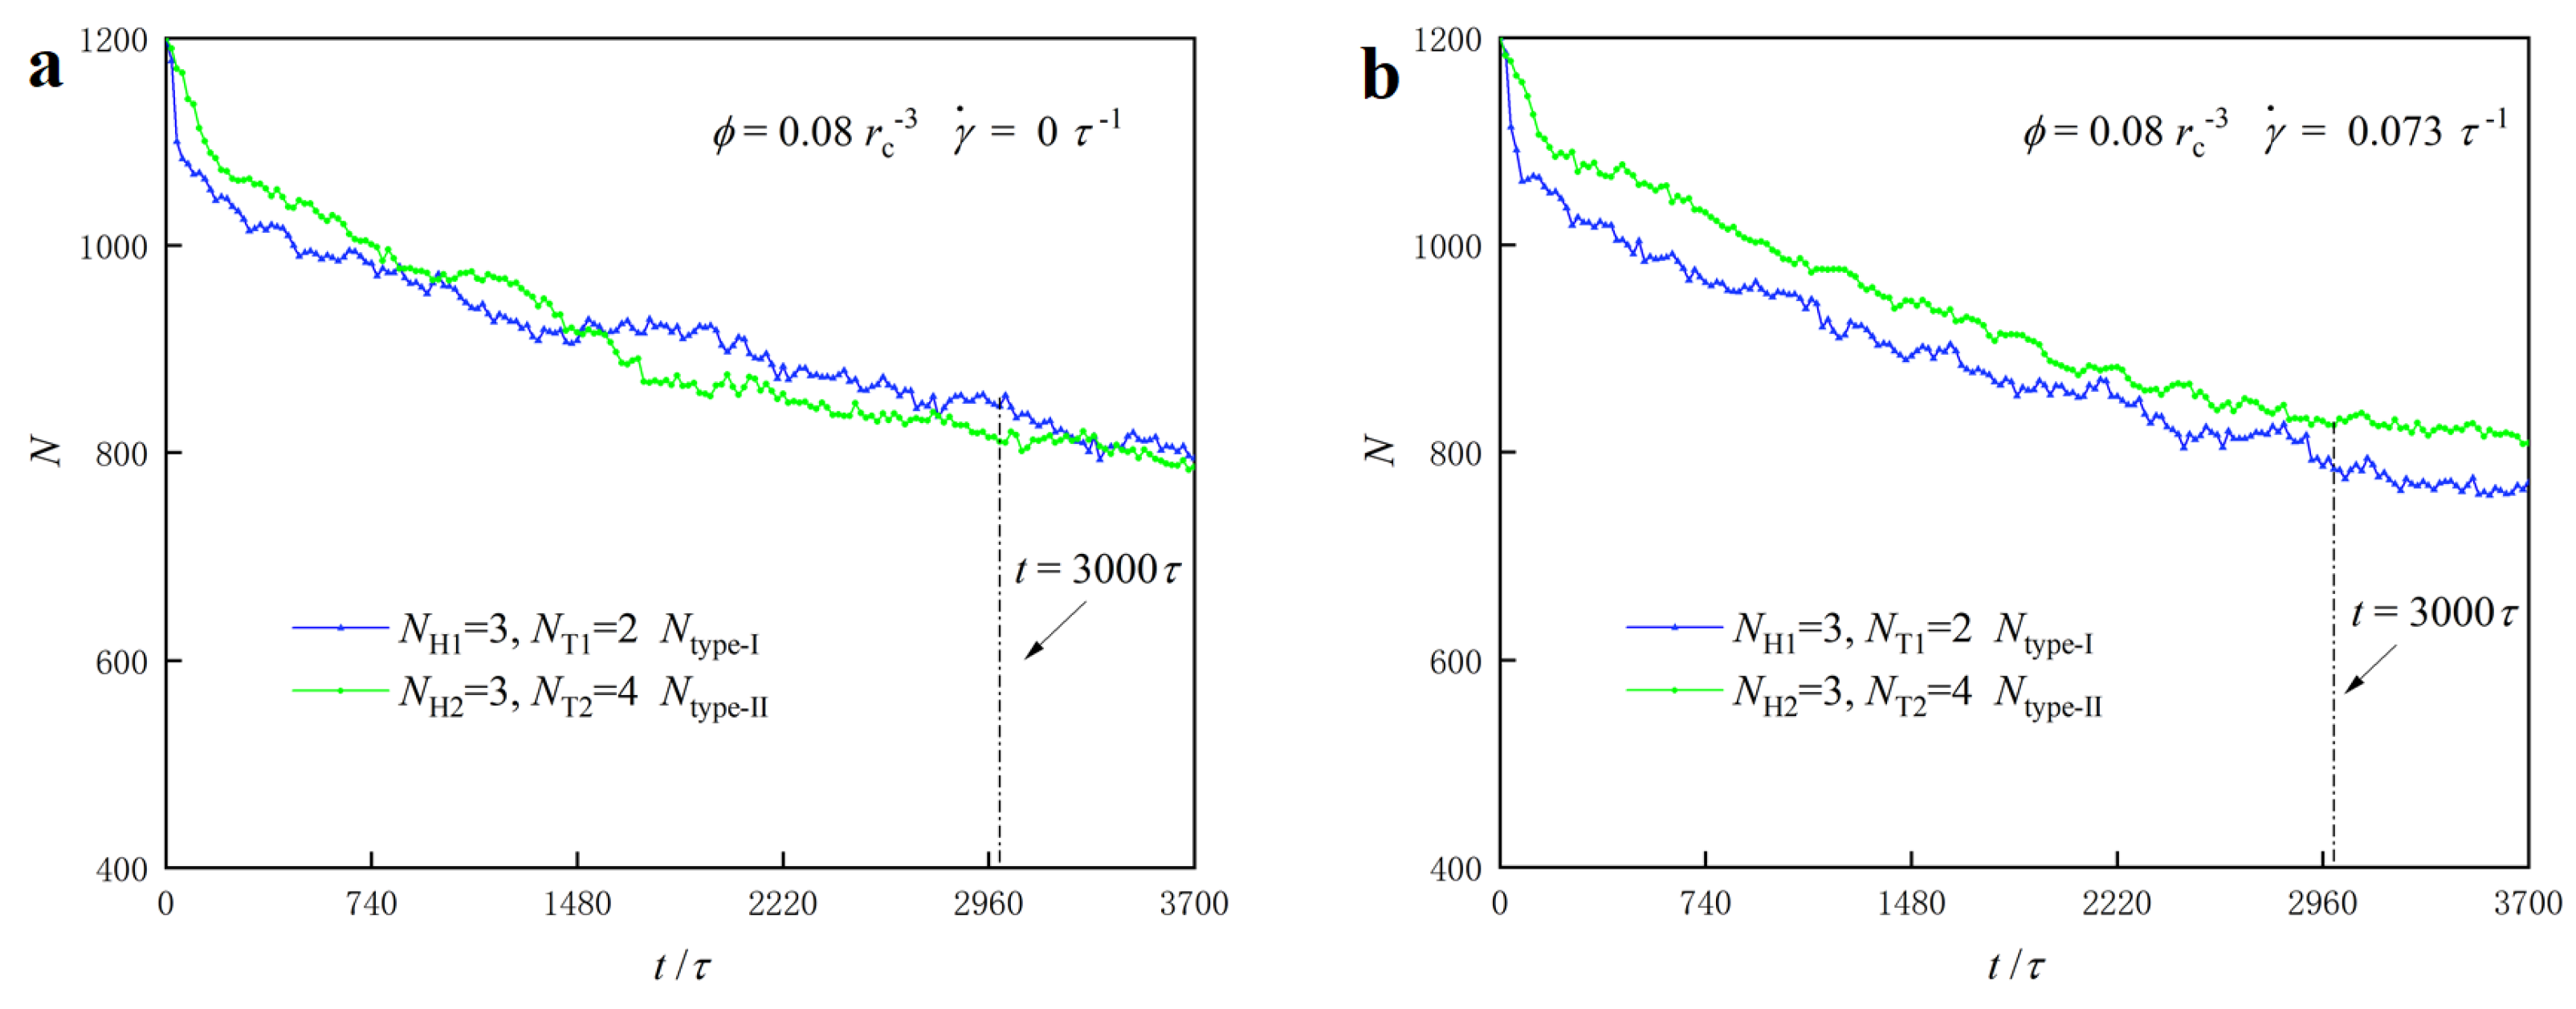
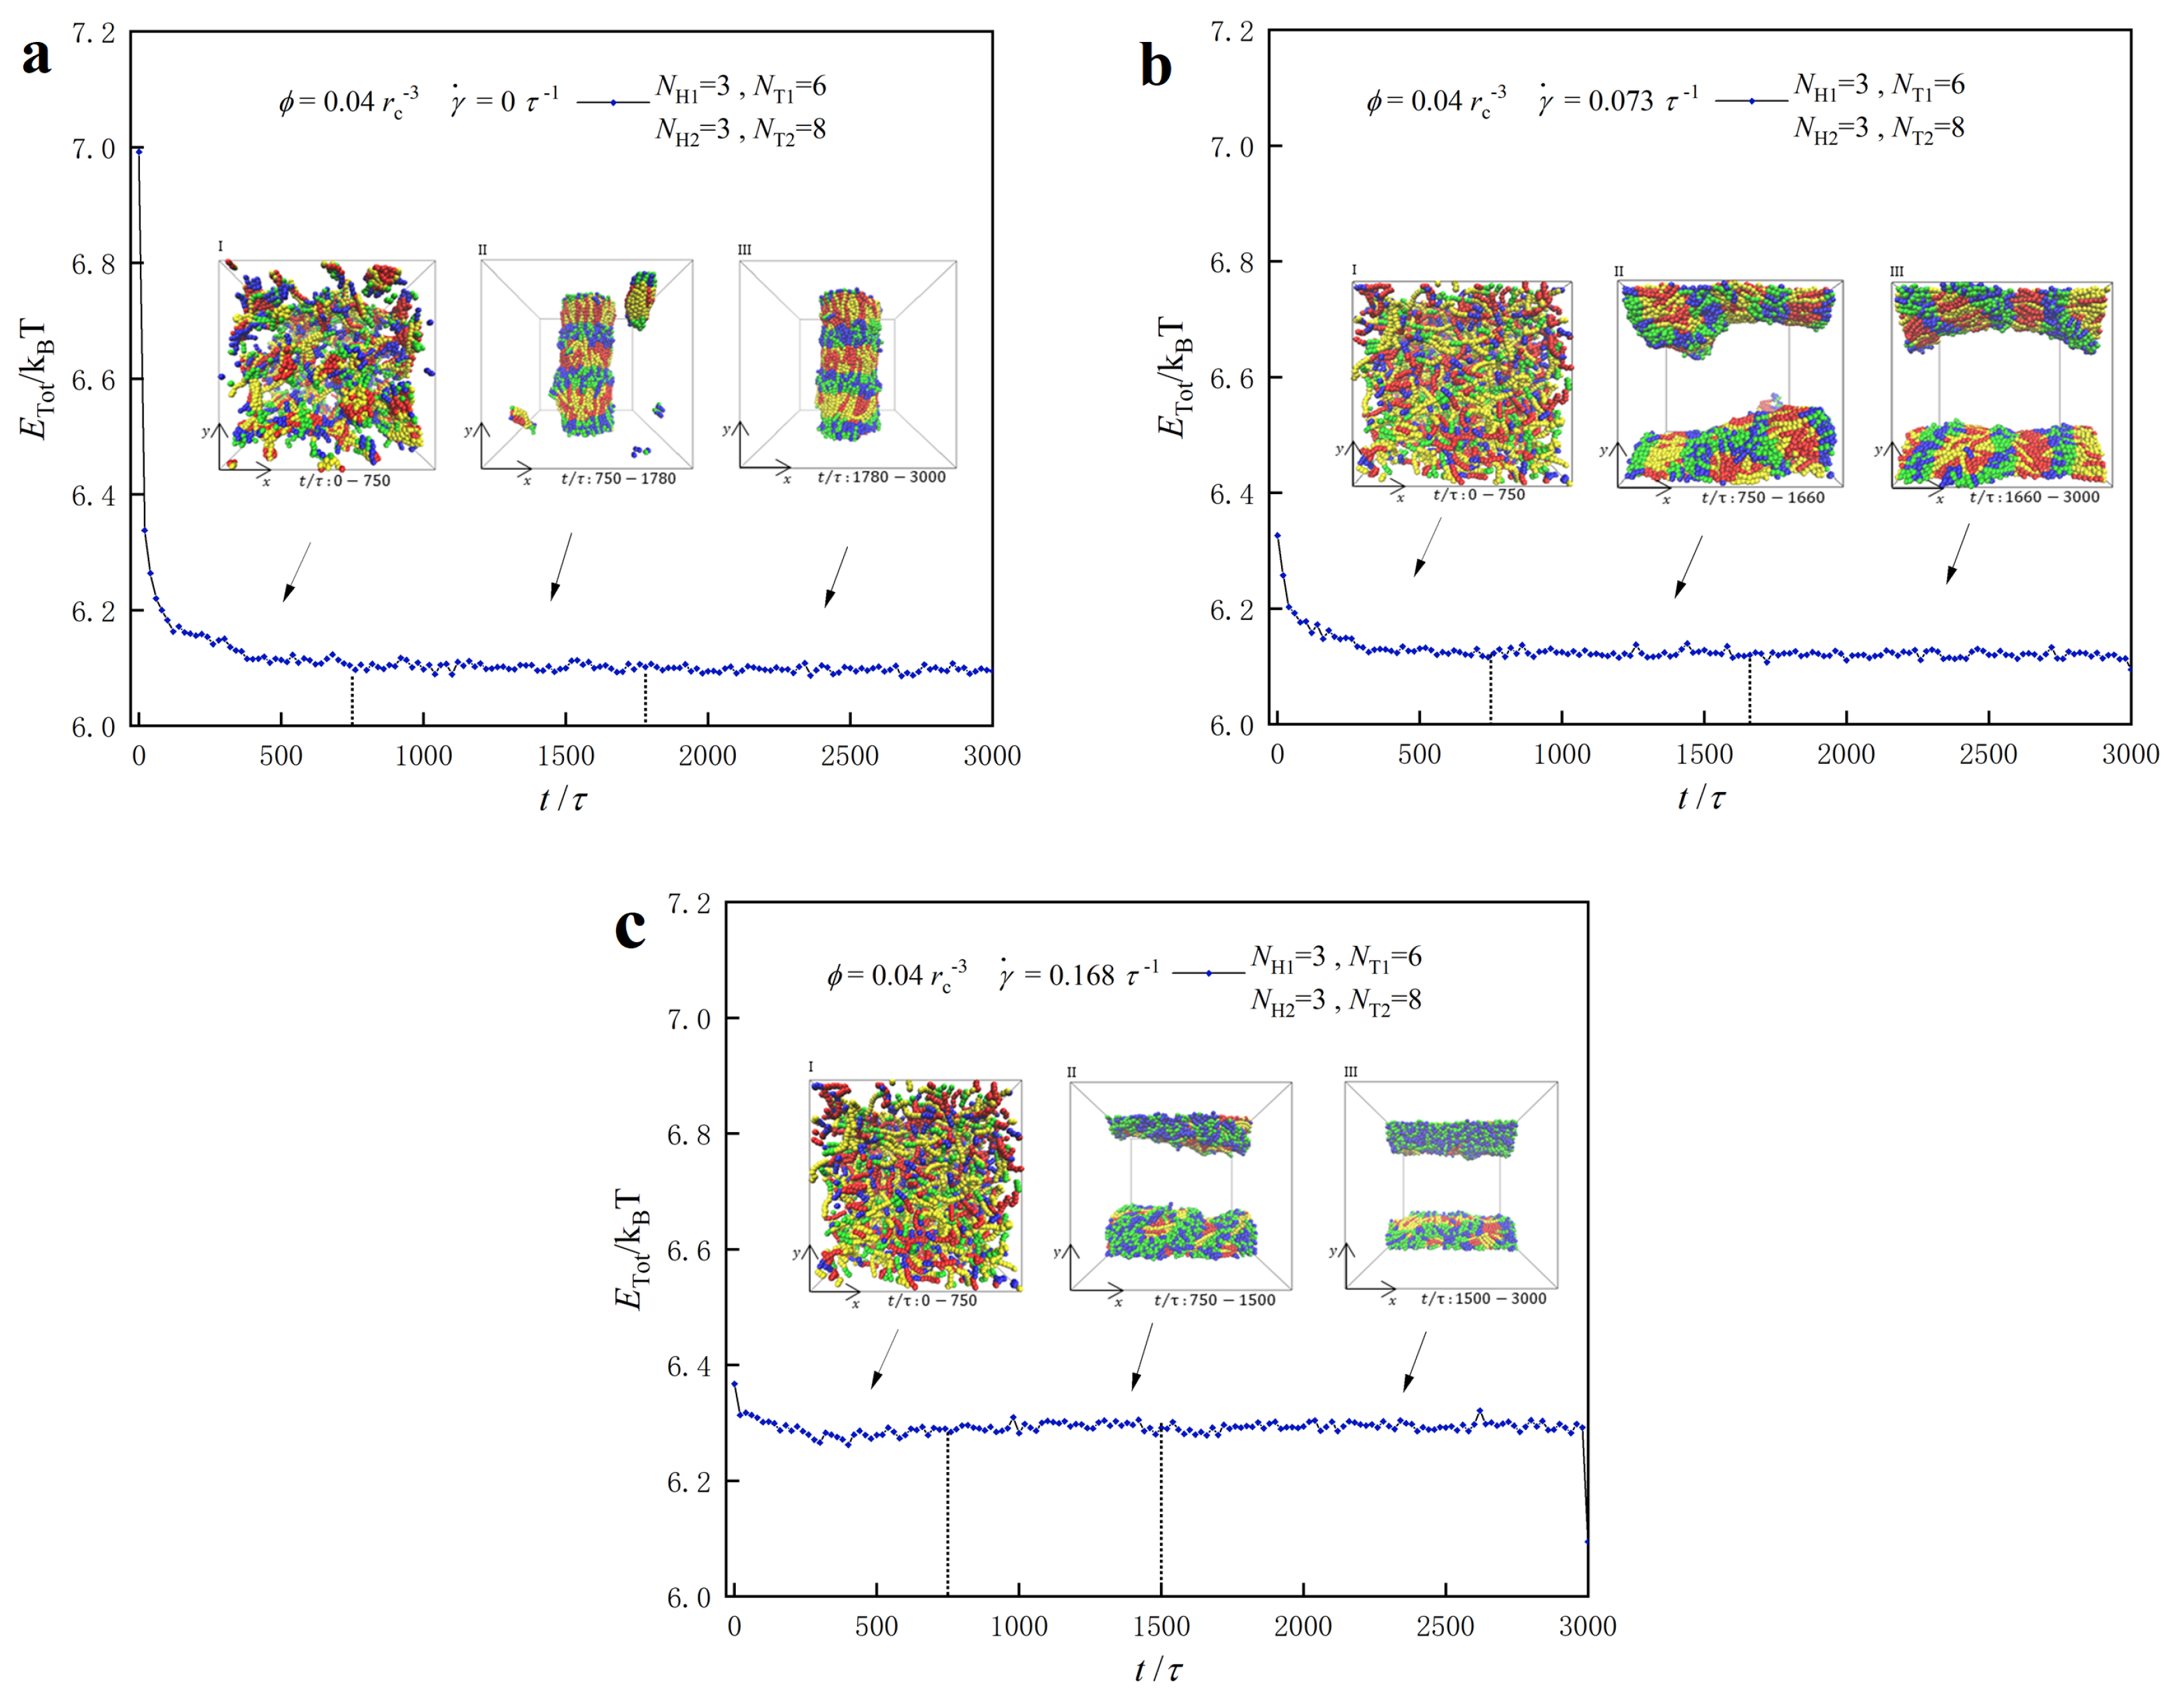
3.3. Dynamic Processes


4. Summary
Author Contributions
Funding
Institutional Review Board Statement
Informed Consent Statement
Data Availability Statement
Conflicts of Interest
References
- Kulkarni, C.V. Lipid crystallization: From self-assembly to hierarchical and biological ordering. Nanoscale 2012, 4, 5779–5791. [Google Scholar] [CrossRef] [PubMed]
- Shi, A.; Claridge, S.A. Lipids: An atomic toolkit for the endless frontier. ACS Nano 2021, 15, 15429–15445. [Google Scholar] [CrossRef]
- Zhai, J.; Sarkar, S.; Conn, C.E.; Drummond, C.J. Molecular engineering of super-swollen inverse bicontinuous cubic and sponge lipid phases for biomedical applications. Mol. Syst. Des. Eng. 2020, 5, 1354–1375. [Google Scholar] [CrossRef]
- Seeger, H.; Marino, G.; Alessandrini, A.; Facci, P. Effect of physical parameters on the main phase transition of supported lipid bilayers. Biophys. J. 2009, 97, 1067–1076. [Google Scholar] [CrossRef]
- Ingólfsson, H.I.; Melo, M.N.; Van Eerden, F.J.; Arnarez, C.; Lopez, C.A.; Wassenaar, T.A.; Periole, X.; De Vries, A.H.; Tieleman, D.P.; Marrink, S.J. Lipid organization of the plasma membrane. J. Am. Chem. Soc. 2014, 136, 14554–14559. [Google Scholar] [CrossRef]
- Barauskas, J.; Christerson, L.; Wadsäter, M.; Lindström, F.; Lindqvist, A.K.; Tiberg, F. Bioadhesive lipid compositions: Self-assembly structures, functionality, and medical applications. Mol. Pharm. 2014, 11, 895–903. [Google Scholar] [CrossRef] [PubMed]
- Hishida, M.; Tanaka, K.; Yamamura, Y.; Saito, K. Cooperativity between water and lipids in lamellar to inverted-hexagonal phase transition. J. Phys. Soc. Jpn. 2014, 83, 044801. [Google Scholar] [CrossRef]
- Sharma, S.; Kim, B.N.; Stansfeld, P.J.; Sansom, M.S.; Lindau, M. A coarse grained model for a lipid membrane with physiological composition and leaflet asymmetry. PLoS ONE 2015, 10, e0144814. [Google Scholar] [CrossRef]
- Skjevik, Å.A.; Madej, B.D.; Dickson, C.J.; Teigen, K.; Walker, R.C.; Gould, I.R. All-atom lipid bilayer self-assembly with the AMBER and CHARMM lipid force fields. Chem. Commun. 2015, 51, 4402–4405. [Google Scholar] [CrossRef]
- Lee, J.; Cheng, X.; Jo, S.; MacKerell, A.D.; Klauda, J.B.; Im, W. CHARMM-GUI input generator for NAMD, GROMACS, AMBER, OpenMM, and CHARMM/OpenMM simulations using the CHARMM36 additive force field. Biophys. J. 2016, 110, 641a. [Google Scholar] [CrossRef]
- Gupta, R.; Dwadasi, B.S.; Rai, B. Molecular dynamics simulation of skin lipids: Effect of ceramide chain lengths on bilayer properties. J. Phys. Chem. B 2016, 120, 12536–12546. [Google Scholar] [CrossRef] [PubMed]
- Chen, P.; Huang, Z.; Liang, J.; Cui, T.; Zhang, X.; Miao, B.; Yan, L.T. Diffusion and directionality of charged nanoparticles on lipid bilayer membrane. ACS Nano 2016, 10, 11541–11547. [Google Scholar] [CrossRef] [PubMed]
- Yang, Y.L.; Sheng, Y.J.; Tsao, H.K. Branching pattern effect and co-assembly with lipids of amphiphilic Janus dendrimersomes. Phys. Chem. Chem. Phys. 2018, 20, 27305–27313. [Google Scholar] [CrossRef] [PubMed]
- Shan, Y.; Wang, X.; Ji, Y.; He, L.; Li, S. Self-assembly of phospholipid molecules in solutions under shear flows: Microstructures and phase diagrams. J. Chem. Phys. 2018, 149, 244901. [Google Scholar] [CrossRef] [PubMed]
- Gu, R.X.; Baoukina, S.; Tieleman, D.P. Phase separation in atomistic simulations of model membranes. J. Am. Chem. Soc. 2020, 142, 2844–2856. [Google Scholar] [CrossRef]
- den Otter, W.K.; Shkulipa, S. Intermonolayer friction and surface shear viscosity of lipid bilayer membranes. Biophys. J. 2007, 93, 423–433. [Google Scholar] [CrossRef]
- Engstler, M.; Pfohl, T.; Herminghaus, S.; Boshart, M.; Wiegertjes, G.; Heddergott, N.; Overath, P. Hydrodynamic flow-mediated protein sorting on the cell surface of trypanosomes. Cell 2007, 131, 505–515. [Google Scholar] [CrossRef]
- Deschamps, J.; Kantsler, V.; Steinberg, V. Phase diagram of single vesicle dynamical states in shear flow. Phys. Rev. Lett. 2009, 102, 118105. [Google Scholar] [CrossRef]
- Hanasaki, I.; Walther, J.H.; Kawano, S.; Koumoutsakos, P. Coarse-grained molecular dynamics simulations of shear-induced instabilities of lipid bilayer membranes in water. Phys. Rev. E 2010, 82, 051602. [Google Scholar] [CrossRef]
- Palmer, B.M.; Tanner, B.C.; Toth, M.J.; Miller, M.S. An inverse power-law distribution of molecular bond lifetimes predicts fractional derivative viscoelasticity in biological tissue. Biophys. J. 2013, 104, 2540–2552. [Google Scholar] [CrossRef]
- Falk, K.; Fillot, N.; Sfarghiu, A.M.; Berthier, Y.; Loison, C. Interleaflet sliding in lipidic bilayers under shear flow: Comparison of the gel and fluid phases using reversed non-equilibrium molecular dynamics simulations. Phys. Chem. Chem. Phys. 2014, 16, 2154–2166. [Google Scholar] [CrossRef] [PubMed]
- Jonsson, P.; Jonsson, B. Hydrodynamic forces on macromolecules protruding from lipid bilayers due to external liquid flows. Langmuir 2015, 31, 12708–12718. [Google Scholar] [CrossRef] [PubMed]
- Yazdani, A.; Li, X.; Karniadakis, G.E. Dynamic and rheological properties of soft biological cell suspensions. Rheol. Acta 2016, 55, 433–449. [Google Scholar] [CrossRef] [PubMed]
- Macias-Rodriguez, B.A.; Marangoni, A.A. Linear and nonlinear rheological behavior of fat crystal networks. Crit. Rev. Food Sci. Nutr. 2018, 58, 2398–2415. [Google Scholar] [CrossRef]
- Gera, P.; Salac, D.; Spagnolie, S.E. Swinging and tumbling of multicomponent vesicles in flow. J. Fluid Mech. 2022, 935, A39. [Google Scholar] [CrossRef]
- Färber, N.; Reitler, J.; Kamenac, A.; Westerhausen, C. Shear stress induced lipid order and permeability changes of giant unilamellar vesicles. Biochim. Biophys. Acta (BBA)-Gen. Subj. 2022, 1866, 130199. [Google Scholar] [CrossRef]
- Jonsson, P.; Beech, J.P.; Tegenfeldt, J.O.; Hook, F. Mechanical behavior of a supported lipid bilayer under external shear forces. Langmuir 2009, 25, 6279–6286. [Google Scholar] [CrossRef]
- Qiu, H.; Caffrey, M. The phase diagram of the monoolein/water system: Metastability and equilibrium aspects. Biomaterials 2000, 21, 223–234. [Google Scholar] [CrossRef]
- Kulkarni, C.V.; Tang, T.Y.; Seddon, A.M.; Seddon, J.M.; Ces, O.; Templer, R.H. Engineering bicontinuous cubic structures at the nanoscale—The role of chain splay. Soft Matter 2010, 6, 3191–3194. [Google Scholar] [CrossRef]
- Kulkarni, C.V. Nanostructural studies on monoelaidin–water systems at low temperatures. Langmuir 2011, 27, 11790–11800. [Google Scholar] [CrossRef]
- Barriga, H.; Tyler, A.; McCarthy, N.; Parsons, E.; Ces, O.; Law, R.; Seddon, J.; Brooks, N. Temperature and pressure tuneable swollen bicontinuous cubic phases approaching nature’s length scales. Soft Matter 2015, 11, 600–607. [Google Scholar] [CrossRef] [PubMed]
- Oka, T. Transformation between inverse bicontinuous cubic phases of a lipid from diamond to primitive. Langmuir 2015, 31, 3180–3185. [Google Scholar] [CrossRef] [PubMed]
- Oka, T.; Saiki, T.; Alam, J.M.; Yamazaki, M. Activation energy of the low-pH-induced lamellar to bicontinuous cubic phase transition in dioleoylphosphatidylserine/monoolein. Langmuir 2016, 32, 1327–1337. [Google Scholar] [CrossRef] [PubMed]
- Gao, H.L.; Zhang, A.H.; Yu, J.B.; Sun, H.; Kong, L.; Wang, X.Q.; Yan, G.l.; Liu, L.; Wang, X.J. High-throughput lipidomics characterize key lipid molecules as potential therapeutic targets of kaixinsan protects against Alzheimer’s disease in APP/PS1 transgenic mice. J. Chromatogr. B 2018, 1092, 286–295. [Google Scholar] [CrossRef] [PubMed]
- Zhai, J.; Fong, C.; Tran, N.; Drummond, C.J. Non-lamellar lyotropic liquid crystalline lipid nanoparticles for the next generation of nanomedicine. ACS Nano 2019, 13, 6178–6206. [Google Scholar] [CrossRef]
- Ridolfi, A.; Humphreys, B.; Caselli, L.; Montis, C.; Nylander, T.; Berti, D.; Brucale, M.; Valle, F. Nanoscale structural and mechanical characterization of thin bicontinuous cubic phase lipid films. Colloids Surf. B 2022, 210, 112231. [Google Scholar] [CrossRef]
- Yao, Y.; Catalini, S.; Kutus, B.; Hunger, J.; Foggi, P.; Mezzenga, R. Probing water state during lipidic mesophases phase transitions. Angew. Chem. 2021, 133, 25478–25484. [Google Scholar] [CrossRef]
- den Otter, W.K. Free energies of stable and metastable pores in lipid membranes under tension. J. Chem. Phys. 2009, 131, 205101. [Google Scholar] [CrossRef]
- Petelska, A. Interfacial tension of bilayer lipid membranes. Open Chem. 2012, 10, 16–26. [Google Scholar] [CrossRef]
- Levadny, V.; Tsuboi, T.A.; Belaya, M.; Yamazaki, M. Rate constant of tension-induced pore formation in lipid membranes. Langmuir 2013, 29, 3848–3852. [Google Scholar] [CrossRef]
- Takei, T.; Yaguchi, T.; Fujii, T.; Nomoto, T.; Toyota, T.; Fujinami, M. Measurement of membrane tension of free standing lipid bilayers via laser-induced surface deformation spectroscopy. Soft Matter 2015, 11, 8641–8647. [Google Scholar] [CrossRef] [PubMed]
- Karal, M.A.S.; Yamazaki, M. Communication: Activation energy of tension-induced pore formation in lipid membranes. J. Chem. Phys. 2015, 143, 081103. [Google Scholar] [CrossRef]
- Elani, Y.; Purushothaman, S.; Booth, P.J.; Seddon, J.M.; Brooks, N.J.; Law, R.V.; Ces, O. Measurements of the effect of membrane asymmetry on the mechanical properties of lipid bilayers. Chem. Commun. 2015, 51, 6976–6979. [Google Scholar] [CrossRef] [PubMed]
- Sun, L.; Pan, F.; Li, S. Self-assembly of lipid mixtures in solutions: Structures, dynamics processes and mechanical properties. Membranes 2022, 12, 730. [Google Scholar] [CrossRef] [PubMed]
- Shkulipa, S.; den Otter, W.K.; Briels, W.J. Surface viscosity, diffusion, and intermonolayer friction: Simulating sheared amphiphilic bilayers. Biophys. J. 2005, 89, 823–829. [Google Scholar] [CrossRef]
- Mistry, S.; Fuhrmann, P.L.; de Vries, A.; Karshafian, R.; Rousseau, D. Structure-rheology relationship in monoolein liquid crystals. J. Colloid Interface Sci. 2023, 630, 878–887. [Google Scholar] [CrossRef]
- Todd, B.; Daivis, P.J. Homogeneous non-equilibrium molecular dynamics simulations of viscous flow: Techniques and applications. Mol. Simul. 2007, 33, 189–229. [Google Scholar] [CrossRef]
- Sevink, G.; Fraaije, J. Efficient solvent-free dissipative particle dynamics for lipid bilayers. Soft Matter 2014, 10, 5129–5146. [Google Scholar] [CrossRef]
- Espanol, P.; Warren, P.B. Perspective: Dissipative particle dynamics. J. Chem. Phys. 2017, 146, 150901. [Google Scholar] [CrossRef]
- Qiang, X.; Wang, X.; Ji, Y.; Li, S.; He, L. Liquid-crystal self-assembly of lipid membranes on solutions: A dissipative particle dynamic simulation study. Polymer 2017, 115, 1–11. [Google Scholar] [CrossRef]
- Hoogerbrugge, P.; Koelman, J. Simulating microscopic hydrodynamic phenomena with dissipative particle dynamics. EPL 1992, 19, 155. [Google Scholar] [CrossRef]
- Basan, M.; Prost, J.; Joanny, J.F.; Elgeti, J. Dissipative particle dynamics simulations for biological tissues: Rheology and competition. Phys. Biol. 2011, 8, 026014. [Google Scholar] [CrossRef]
- Ortiz, V.; Nielsen, S.O.; Discher, D.E.; Klein, M.L.; Lipowsky, R.; Shillcock, J. Dissipative particle dynamics simulations of polymersomes. J. Phys. Chem. B 2005, 109, 17708–17714. [Google Scholar] [CrossRef] [PubMed]
- Santo, K.P.; Neimark, A.V. Dissipative particle dynamics simulations in colloid and Interface science: A review. Adv. Colloid Interface Sci. 2021, 298, 102545. [Google Scholar] [CrossRef] [PubMed]
- Wang, J.; Han, Y.; Xu, Z.; Yang, X.; Ramakrishna, S.; Liu, Y. Dissipative particle dynamics simulation: A review on investigating mesoscale properties of polymer systems. Macromol. Mater. Eng. 2021, 306, 2000724. [Google Scholar] [CrossRef]
- Shan, Y.; Ji, Y.; Wang, X.; He, L.; Li, S. Predicting asymmetric phospholipid microstructures in solutions. RSC Adv. 2020, 10, 24521–24532. [Google Scholar] [CrossRef]
- Tran, N.; Hawley, A.M.; Zhai, J.; Muir, B.W.; Fong, C.; Drummond, C.J.; Mulet, X. High-throughput screening of saturated fatty acid influence on nanostructure of lyotropic liquid crystalline lipid nanoparticles. Langmuir 2016, 32, 4509–4520. [Google Scholar] [CrossRef]
- Venturoli, M.; Smit, B.; Sperotto, M.M. Simulation studies of protein-induced bilayer deformations, and lipid-induced protein tilting, on a mesoscopic model for lipid bilayers with embedded proteins. Biophys. J. 2005, 88, 1778–1798. [Google Scholar] [CrossRef]
- Zhang, L.; Becton, M.; Wang, X. Designing nanoparticle translocation through cell membranes by varying amphiphilic polymer coatings. J. Phys. Chem. B 2015, 119, 3786–3794. [Google Scholar] [CrossRef]
- Groot, R.D.; Rabone, K. Mesoscopic simulation of cell membrane damage, morphology change and rupture by nonionic surfactants. Biophys. J. 2001, 81, 725–736. [Google Scholar] [CrossRef]
- Chen, Y.; Wang, Z.; Ji, Y.; He, L.; Wang, X.; Li, S. Asymmetric lipid membranes under shear flows: A dissipative particle dynamics study. Membranes 2021, 11, 655. [Google Scholar] [CrossRef]
- Benazieb, O.; Loison, C.; Thalmann, F. Rheology of sliding leaflets in coarse-grained DSPC lipid bilayers. Phys. Rev. E 2021, 104, 054802. [Google Scholar] [CrossRef] [PubMed]
- Brandt, E.G. Fluctuating hydrodynamics simulations of coarse-grained lipid membranes under steady-state conditions and in shear flow. Phys. Rev. E 2013, 88, 012714. [Google Scholar] [CrossRef] [PubMed]
- Fan, J.; Liu, S.; Gao, C.; Song, F. Molecular dynamic simulation on the transport properties of alcohols. Case Stud. Therm. Eng. 2022, 32, 101888. [Google Scholar] [CrossRef]
- Chen, X.; Carbone, P.; Cavalcanti, W.L.; Milano, G.; Müller-Plathe, F. Viscosity and structural alteration of a coarse-grained model of polystyrene under steady shear flow studied by reverse nonequilibrium molecular dynamics. Macromolecules 2007, 40, 8087–8095. [Google Scholar] [CrossRef]
- Eslami, H.; Muller-Plathe, F. Viscosity of nanoconfined polyamide-6, 6 oligomers: Atomistic reverse nonequilibrium molecular dynamics simulation. J. Phys. Chem. B 2010, 114, 387–395. [Google Scholar] [CrossRef]
- Müller, T.J.; Müller-Plathe, F. Determining the Local Shear Viscosity of a Lipid Bilayer System by Reverse Non-Equilibrium Molecular Dynamics Simulations. Chemphyschem 2009, 10, 2305–2315. [Google Scholar] [CrossRef]
- Müller-Plathe, F. Reversing the perturbation in nonequilibrium molecular dynamics: An easy way to calculate the shear viscosity of fluids. Phys. Rev. E 1999, 59, 4894. [Google Scholar] [CrossRef]
- Cao, B.Y.; Dong, R.Y. Nonequilibrium molecular dynamics simulation of shear viscosity by a uniform momentum source-and-sink scheme. J. Comput. Phys. 2012, 231, 5306–5316. [Google Scholar] [CrossRef]
- Cavalcanti, W.; Chen, X.; Müller-Plathe, F. Shear viscosity calculations through a reverse nonequilibrium method. Phys. Status Solidi A 2007, 204, 935–939. [Google Scholar] [CrossRef]
- Yang, H.; Zhang, J.; Mueller-Plathe, F.; Yang, Y. A reverse nonequilibrium molecular dynamics method for calculating the mutual diffusion coefficient for binary fluids. Chem. Eng. Sci. 2015, 130, 1–7. [Google Scholar] [CrossRef]
- Li, X.; Liu, Y.; Wang, L.; Deng, M.; Liang, H. Fusion and fission pathways of vesicles from amphiphilic triblock copolymers: A dissipative particle dynamics simulation study. Phys. Chem. Chem. Phys. 2009, 11, 4051–4059. [Google Scholar] [CrossRef] [PubMed]
- Procházka, K.; Limpouchová, Z.; Štěpánek, M.; Šindelka, K.; Lísal, M. DPD modelling of the self-and co-assembly of polymers and polyelectrolytes in aqueous media: Impact on polymer science. Polymers 2022, 14, 404. [Google Scholar] [CrossRef]
- Groot, R.D.; Madden, T.J. Dynamic simulation of diblock copolymer microphase separation. J. Chem. Phys. 1998, 108, 8713–8724. [Google Scholar] [CrossRef]
- Ding, H.m.; Ma, Y.q. Interactions between janus particles and membranes. Nanoscale 2012, 4, 1116–1122. [Google Scholar] [CrossRef]
- Kliesch, T.T.; Dietz, J.; Turco, L.; Halder, P.; Polo, E.; Tarantola, M.; Jahn, R.; Janshoff, A. Membrane tension increases fusion efficiency of model membranes in the presence of SNAREs. Sci. Rep. 2017, 7, 12070. [Google Scholar] [CrossRef]
- Maiti, A.; McGrother, S. Bead–bead interaction parameters in dissipative particle dynamics: Relation to bead-size, solubility parameter, and surface tension. J. Chem. Phys. 2004, 120, 1594–1601. [Google Scholar] [CrossRef]
- Salvati Manni, L.; Zabara, A.; Osornio, Y.M.; Schöppe, J.; Batyuk, A.; Plückthun, A.; Siegel, J.S.; Mezzenga, R.; Landau, E.M. Phase behavior of a designed cyclopropyl analogue of monoolein: Implications for low-temperature membrane protein crystallization. Angew. Chem. Int. Ed. 2015, 54, 1027–1031. [Google Scholar] [CrossRef]
- Plimpton, S. Fast parallel algorithms for short-range molecular dynamics. J. Comput. Phys. 1995, 117, 1–19. [Google Scholar] [CrossRef]
- Alexeev, A.; Uspal, W.E.; Balazs, A.C. Harnessing janus nanoparticles to create controllable pores in membranes. ACS Nano 2008, 2, 1117–1122. [Google Scholar] [CrossRef]
- Lin, J.; Alexander-Katz, A. Cell membranes open “doors” for cationic nanoparticles/biomolecules: Insights into uptake kinetics. ACS Nano 2013, 7, 10799–10808. [Google Scholar] [CrossRef] [PubMed]
- Canton, I.; Battaglia, G. Endocytosis at the nanoscale. Chem. Soc. Rev. 2012, 41, 2718–2739. [Google Scholar] [CrossRef] [PubMed]
- Chen, P.; Liang, H. Cylinder-forming triblock terpolymer in nanopores: A monte carlo simulation study. J. Phys. Chem. B 2008, 112, 1918–1925. [Google Scholar] [CrossRef] [PubMed]
- Xu, Y.; Li, W.; Qiu, F.; Yang, Y.; Shi, A.C. Self-assembly of ABC star triblock copolymers under a cylindrical confinement. J. Phys. Chem. B 2009, 113, 11153–11159. [Google Scholar] [CrossRef] [PubMed]
- Yu, B.; Sun, P.; Chen, T.; Jin, Q.; Ding, D.; Li, B.; Shi, A.C. Confinement-induced novel morphologies of block copolymers. Phys. Rev. Lett. 2006, 96, 138306. [Google Scholar] [CrossRef] [PubMed]
- Li, W.; Xu, Y.; Zhang, G.; Qiu, F.; Yang, Y.; Shi, A.C. Real-space self-consistent mean-field theory study of ABC star triblock copolymers. J. Chem. Phys. 2010, 133, 064904. [Google Scholar] [CrossRef]
- Wang, C.; Ma, S.; Hu, Y.; Wang, R. Hierarchical colloidal polymeric structure from surfactant-like amphiphiles in selective solvents. Langmuir 2017, 33, 3427–3433. [Google Scholar] [CrossRef]
- Mandal, T.; Larson, R.G. Prediction of striped cylindrical micelles (SCMs) formed by dodecyl-β-d-maltoside (DDM) surfactants. Soft Matter 2018, 14, 2694–2700. [Google Scholar] [CrossRef]
- Grason, G.M.; DiDonna, B.; Kamien, R.D. Geometric theory of diblock copolymer phases. Phys. Rev. Lett. 2003, 91, 058304. [Google Scholar] [CrossRef]
- Li, S.; Chen, P.; Zhang, L.; Liang, H. Geometric frustration phases of diblock copolymers in nanoparticles. Langmuir 2011, 27, 5081–5089. [Google Scholar] [CrossRef]
- Wu, J.; Wang, X.; Ji, Y.; He, L.; Li, S. Phase diagrams of diblock copolymers in electric fields: A self-consistent field theory study. Phys. Chem. Chem. Phys. 2016, 18, 10309–10319. [Google Scholar] [CrossRef] [PubMed]
- Xu, T.; Zvelindovsky, A.; Sevink, G.; Gang, O.; Ocko, B.; Zhu, Y.; Gido, S.P.; Russell, T.P. Electric field induced sphere-to-cylinder transition in diblock copolymer thin films. Macromolecules 2004, 37, 6980–6984. [Google Scholar] [CrossRef]
- Azman, N.; Bekale, L.; Nguyen, T.X.; Kah, J.C.Y. Polyelectrolyte stiffness on gold nanorods mediates cell membrane damage. Nanoscale 2020, 12, 14021–14036. [Google Scholar] [CrossRef]
- Zifferer, G.; Preusser, W. Monte Carlo simulation studies of the size and shape of ring polymers. Macromol. Theory Simul. 2001, 10, 397–407. [Google Scholar] [CrossRef]
- Nardai, M.M.; Zifferer, G. Concentration dependence of size, shape, and orientation of copolymers, 1–linear diblock and 4-arm hetero star polymers. Macromol. Theory Simul. 2011, 20, 675–689. [Google Scholar] [CrossRef]


| The unit mass | m | The unit energy | |
| The unit time | Particle number density | = 3 | |
| A DPD particle volume | Weak shear flows | ||
| The unit length | Strong shear flows |
| Box size = 30 · 30 · 30 | |||||||
| DPD parameters = 3.0 = 4.5 | |||||||
| Beads | |||||||
| Beads | |||||||
| 25 | |||||||
| 100 | 25 | ||||||
| W | 40 | 100 | 25 | ||||
| 25 | 100 | 40 | 25 | ||||
| 100 | 100 | 100 | 100 | 25 | |||
Disclaimer/Publisher’s Note: The statements, opinions and data contained in all publications are solely those of the individual author(s) and contributor(s) and not of MDPI and/or the editor(s). MDPI and/or the editor(s) disclaim responsibility for any injury to people or property resulting from any ideas, methods, instructions or products referred to in the content. |
© 2023 by the authors. Licensee MDPI, Basel, Switzerland. This article is an open access article distributed under the terms and conditions of the Creative Commons Attribution (CC BY) license (https://creativecommons.org/licenses/by/4.0/).
Share and Cite
Zhang, H.; Pan, F.; Li, S. Self-Assembly of Lipid Molecules under Shear Flows: A Dissipative Particle Dynamics Simulation Study. Biomolecules 2023, 13, 1359. https://doi.org/10.3390/biom13091359
Zhang H, Pan F, Li S. Self-Assembly of Lipid Molecules under Shear Flows: A Dissipative Particle Dynamics Simulation Study. Biomolecules. 2023; 13(9):1359. https://doi.org/10.3390/biom13091359
Chicago/Turabian StyleZhang, Huan, Fan Pan, and Shiben Li. 2023. "Self-Assembly of Lipid Molecules under Shear Flows: A Dissipative Particle Dynamics Simulation Study" Biomolecules 13, no. 9: 1359. https://doi.org/10.3390/biom13091359