
An Integrated Glycosylation Signature of Rheumatoid Arthritis
 ,
,  , and
, and 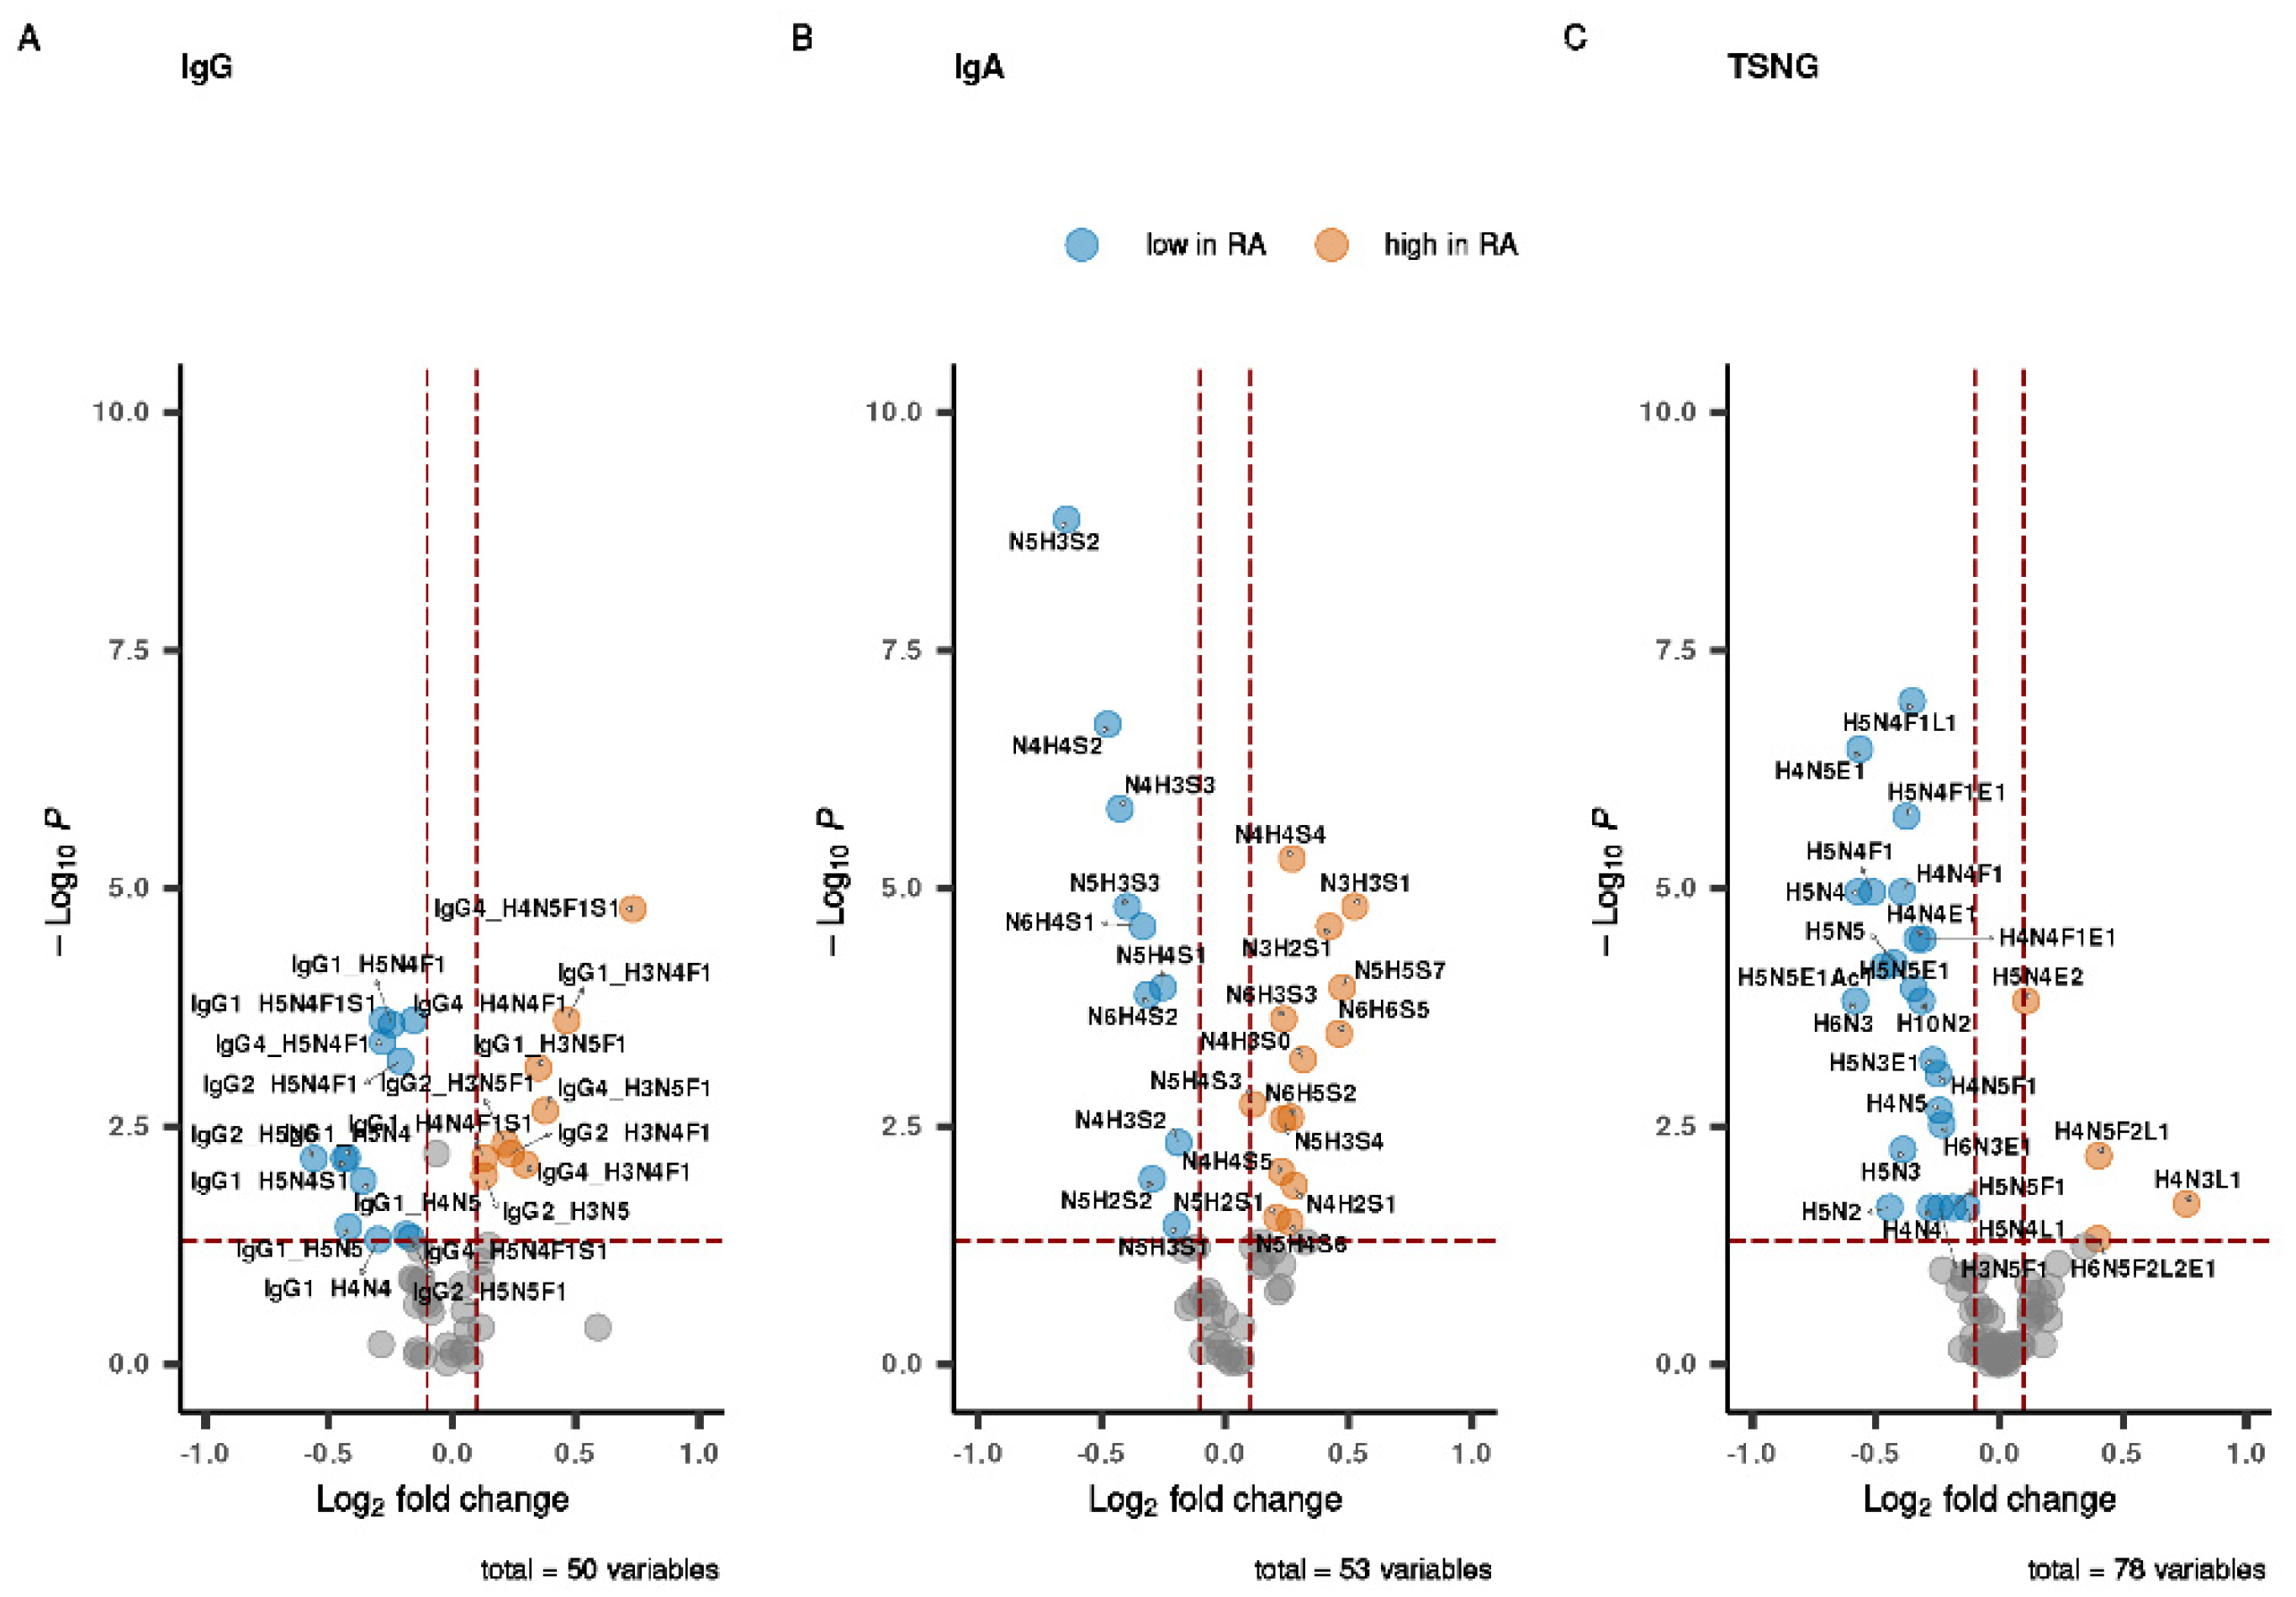
Abstract
:1. Introduction
2. Materials and Methods
3. Results
3.1. Data Set Overview
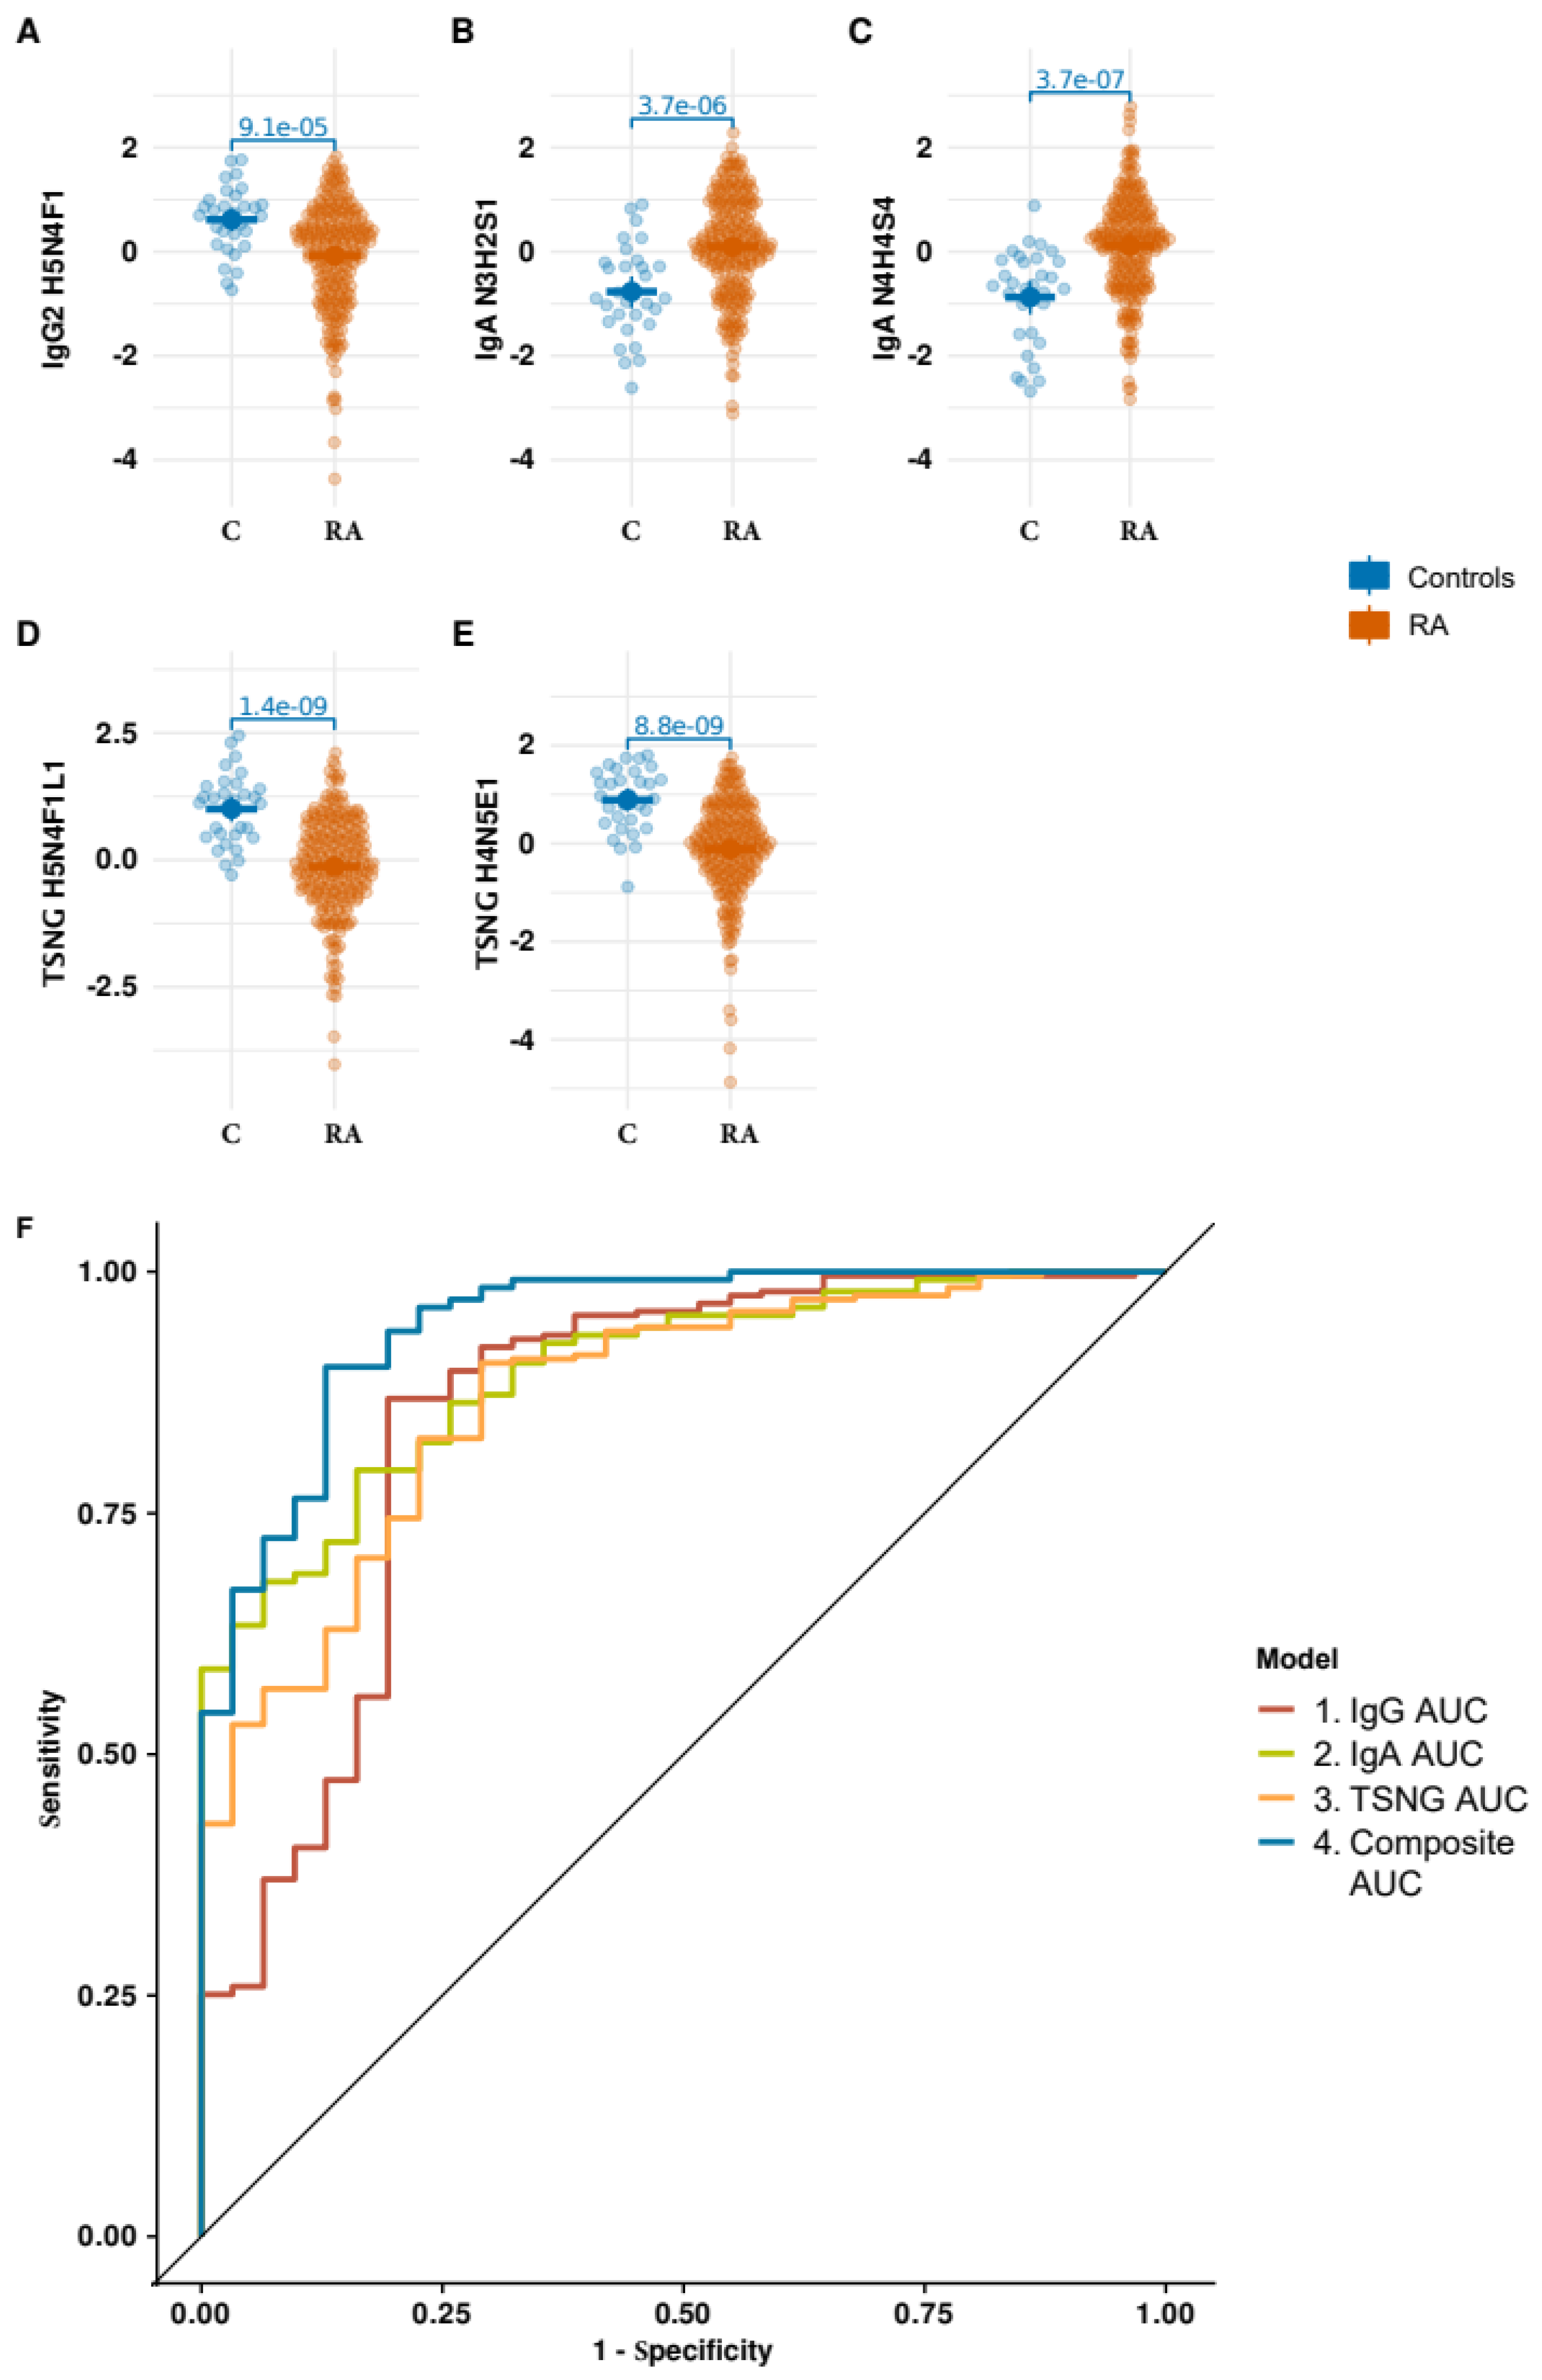
3.2. Univariate Analysis of the Individual Datasets
3.3. Integrative Analysis of the Glycomic Datasets
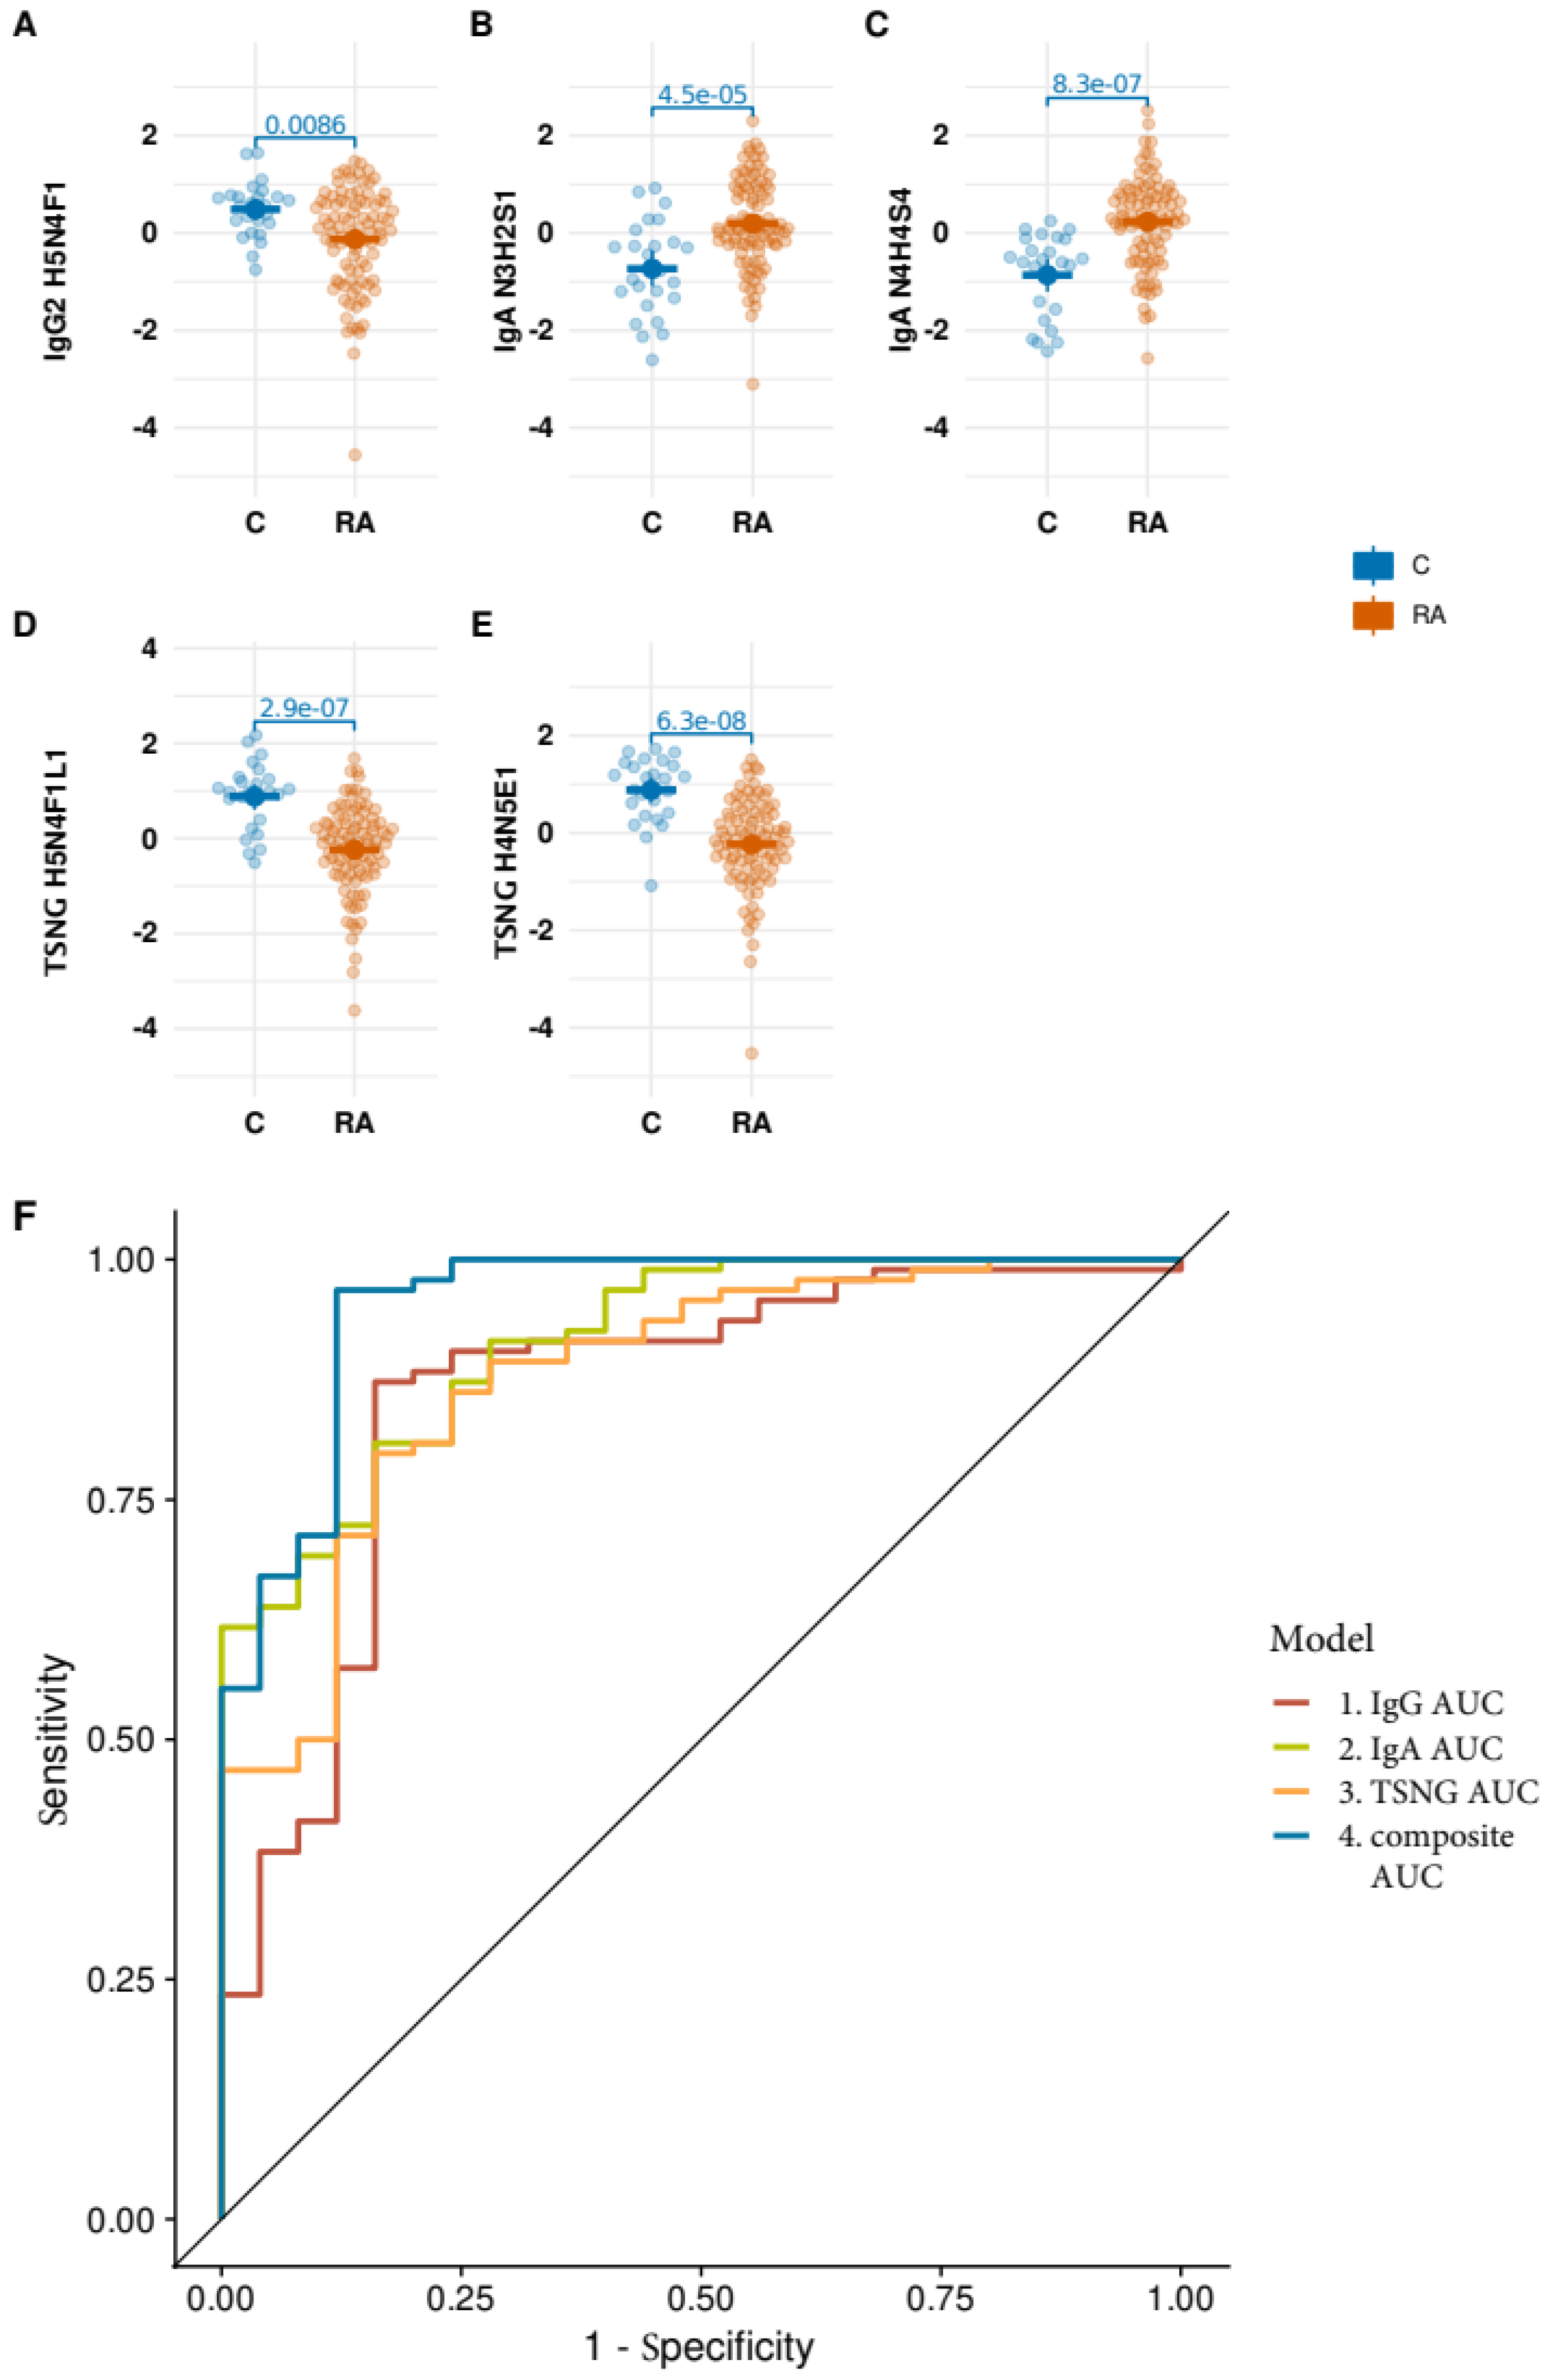
3.4. Performance of the Optimized Signature on ACPA Negative Strata of the Data
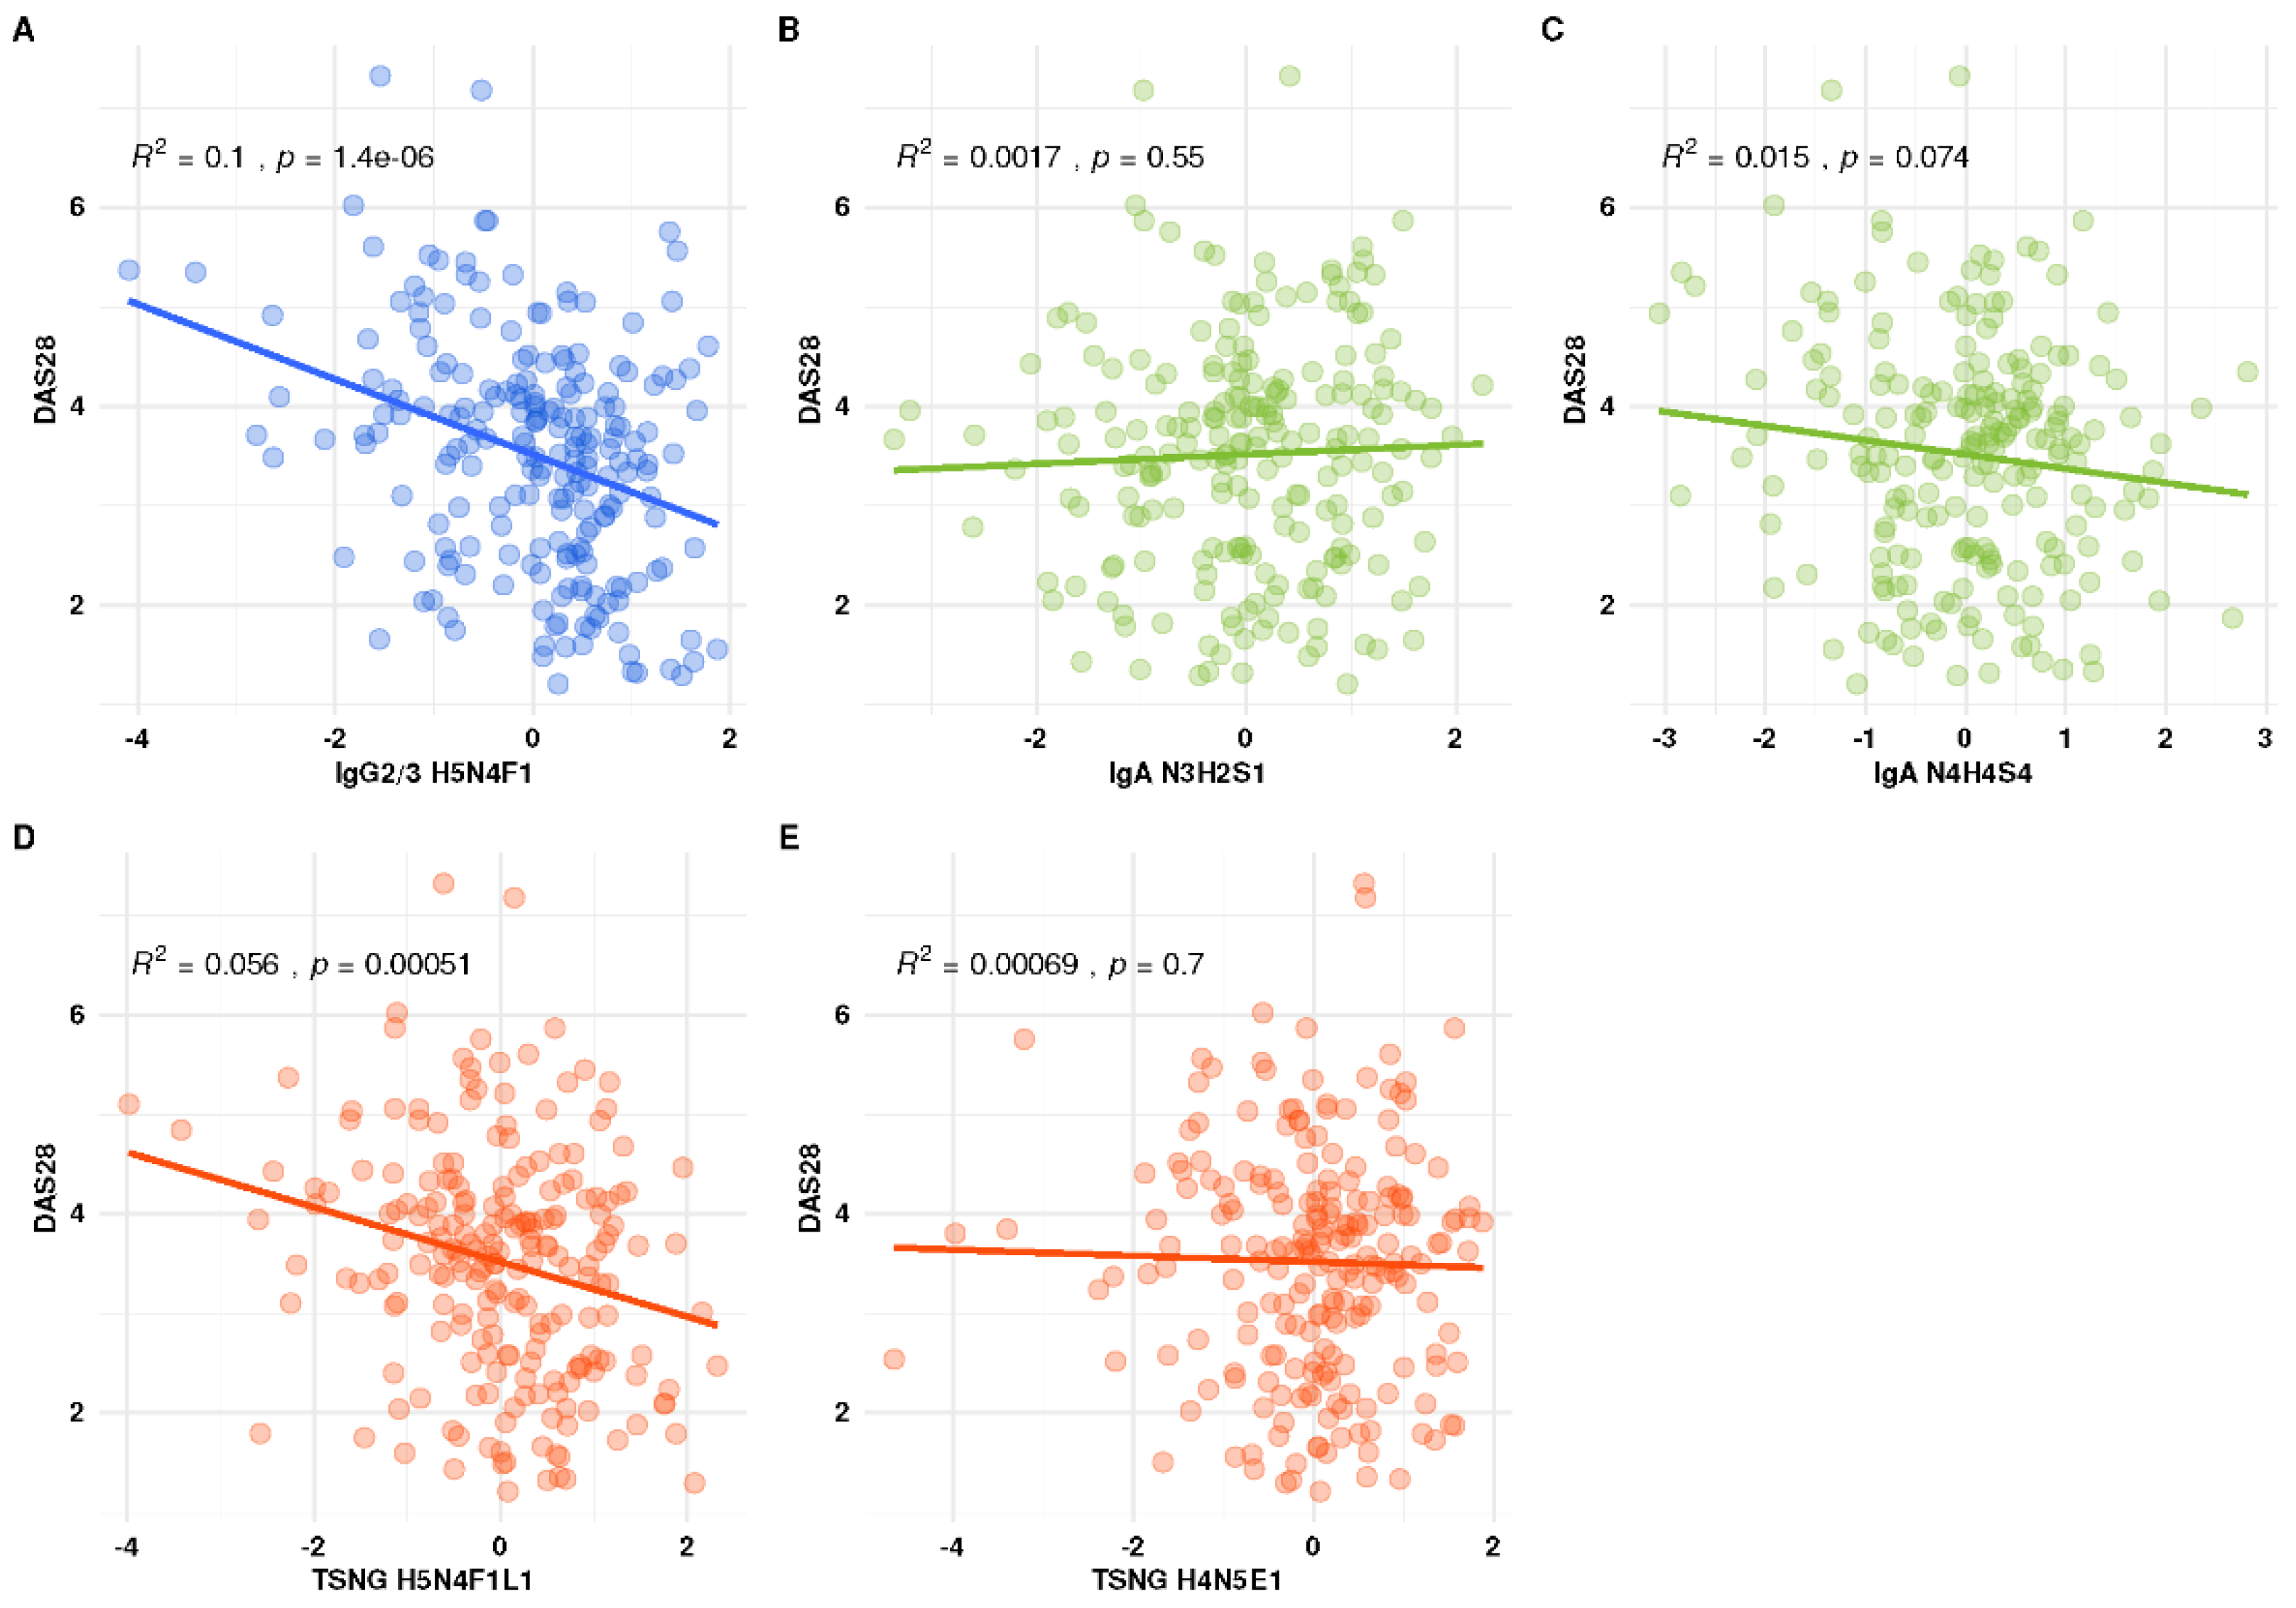
3.5. Association of the Individual Glyco-Traits with DAS28
4. Discussion
Supplementary Materials
Author Contributions
Funding
Informed Consent Statement
Data Availability Statement
Acknowledgments
Conflicts of Interest
References
- Alamanos, Y.; Drosos, A.A. Epidemiology of adult rheumatoid arthritis. Autoimmun. Rev. 2005, 4, 130–136. [Google Scholar] [CrossRef]
- Colafrancesco, S.; Agmon-Levin, N.; Perricone, C.; Shoenfeld, Y. Unraveling the soul of autoimmune diseases: Pathogenesis, diagnosis and treatment adding dowels to the puzzle. Immunol. Res. 2013, 56, 200–205. [Google Scholar] [CrossRef] [Green Version]
- Scherer, H.U.; Huizinga, T.W.J.; Kronke, G.; Schett, G.; Toes, R.E.M. The B cell response to citrullinated antigens in the development of rheumatoid arthritis. Nat. Rev. Rheumatol. 2018, 14, 157–169. [Google Scholar] [CrossRef]
- Raffin, C.; Vo, L.T.; Bluestone, J.A. T-reg cell-based therapies: Challenges and perspectives. Nat. Rev. Immunol. 2020, 20, 158–172. [Google Scholar] [CrossRef]
- Perol, L.; Lindner, J.M.; Caudana, P.; Nunez, N.G.; Baeyens, A.; Valle, A.; Sedlik, C.; Loirat, D.; Boyer, O.; Creange, A.; et al. Loss of immune tolerance to IL-2 in type 1 diabetes. Nat. Commun. 2016, 7, 13027. [Google Scholar] [CrossRef]
- Rudd, P.M.; Elliott, T.; Cresswell, P.; Wilson, I.A.; Dwek, R.A. Glycosylation and the immune system. Science 2001, 291, 2370–2376. [Google Scholar] [CrossRef]
- Parekh, R.B.; Dwek, R.A.; Sutton, B.J.; Fernandes, D.L.; Leung, A.; Stanworth, D.; Rademacher, T.W.; Mizuochi, T.; Taniguchi, T.; Matsuta, K.; et al. Association of Rheumatoid-Arthritis and Primary Osteo-Arthritis with Changes in the Glycosylation Pattern of Total Serum Igg. Nature 1985, 316, 452–457. [Google Scholar] [CrossRef] [PubMed]
- Kissel, T.; Toes, R.E.M.; Huizinga, T.W.J.; Wuhrer, M. Glycobiology of rheumatic diseases. Nat. Rev. Rheumatol. 2023, 19, 28–43. [Google Scholar] [CrossRef]
- Zhou, X.; Motta, F.; Selmi, C.; Ridgway, W.M.; Gershwin, M.E.; Zhang, W. Antibody glycosylation in autoimmune diseases. Autoimmun. Rev. 2021, 20, 102804. [Google Scholar] [CrossRef] [PubMed]
- Matsumoto, A.; Shikata, K.; Takeuchi, F.; Kojima, N.; Mizuochi, T. Autoantibody activity of IgG rheumatoid factor increases with decreasing levels of galactosylation and sialylation. J. Biochem. Tokyo 2000, 128, 621–628. [Google Scholar] [CrossRef]
- Troelsen, L.N.; Jacobsen, S.; Abrahams, J.L.; Royle, L.; Rudd, P.M.; Narvestad, E.; Heegaard, N.H.; Garred, P. IgG Glycosylation Changes and MBL2 Polymorphisms: Associations with Markers of Systemic Inflammation and Joint Destruction in Rheumatoid Arthritis. J. Rheumatol. 2012, 39, 463–469. [Google Scholar] [CrossRef]
- Rombouts, Y.; Ewing, E.; van de Stadt, L.A.; Selman, M.H.J.; Trouw, L.A.; Deelder, A.M.; Huizinga, T.W.J.; Wuhrer, M.; van Schaardenburg, D.; Toes, R.E.M.; et al. Anti-citrullinated protein antibodies acquire a pro-inflammatory Fc glycosylation phenotype prior to the onset of rheumatoid arthritis. Ann. Rheum. Dis. 2015, 74, 234–241. [Google Scholar] [CrossRef] [PubMed]
- Vletter, E.M.; Koning, M.T.; Scherer, H.U.; Veelken, H.; Toes, R.E.M. A Comparison of Immunoglobulin Variable Region N-Linked Glycosylation in Healthy Donors, Autoimmune Disease and Lymphoma. Front. Immunol. 2020, 11, 241. [Google Scholar] [CrossRef] [Green Version]
- Steffen, U.; Koeleman, C.A.; Sokolova, M.V.; Bang, H.; Kleyer, A.; Rech, J.; Unterweger, H.; Schicht, M.; Garreis, F.; Hahn, J.; et al. IgA subclasses have different effector functions associated with distinct glycosylation profiles. Nat. Commun. 2020, 11, 120. [Google Scholar] [CrossRef] [Green Version]
- Mackiewicz, A.; Khan, M.A.; Reynolds, T.L.; van der Linden, S.; Kushner, I. Serum IgA, acute phase proteins, and glycosylation of alpha 1-acid glycoprotein in ankylosing spondylitis. Ann. Rheum. Dis. 1989, 48, 99–103. [Google Scholar] [CrossRef] [PubMed]
- Arnold, J.N.; Wormald, M.R.; Sim, R.B.; Rudd, P.M.; Dwek, R.A. The impact of glycosylation on the biological function and structure of human immunoglobulins. Annu. Rev. Immunol. 2007, 25, 21–50. [Google Scholar] [CrossRef]
- Ding, L.; Chen, X.Q.; Cheng, H.W.; Zhang, T.T.; Li, Z. Advances in IgA glycosylation and its correlation with diseases. Front. Chem. 2022, 10, 974854. [Google Scholar] [CrossRef]
- Reiding, K.R.; Vreeker, G.C.M.; Bondt, A.; Bladergroen, M.R.; Hazes, J.M.W.; van der Burgt, Y.E.M.; Wuhrer, M.; Dolhain, R.J.E.M. Serum Protein N-Glycosylation Changes with Rheumatoid Arthritis Disease Activity during and after Pregnancy. Front. Med. Lausanne 2018, 4, 241. [Google Scholar] [CrossRef] [PubMed]
- Bondt, A.; Nicolardi, S.; Jansen, B.C.; Kuijper, T.M.; Hazes, J.M.W.; van der Burgt, Y.E.M.; Wuhrer, M.; Dolhain, R.J.E.M. IgA N- and O-gycosylation profiling reveals no association with the pregnancy-related improvement in rheumatoid arthritis. Arthritis Res. Ther. 2017, 19, 160. [Google Scholar] [CrossRef] [Green Version]
- Bondt, A.; Selman, M.H.J.; Deelder, A.M.; Hazes, J.M.W.; Willemsen, S.P.; Wuhrer, M.; Dolhain, R.J.E.M. Association between Galactosylation of Immunoglobulin G and Improvement of Rheumatoid Arthritis during Pregnancy Is Independent of Sialylation. J. Proteome Res. 2013, 12, 4522–4531. [Google Scholar] [CrossRef]
- Rohart, F.; Gautier, B.; Singh, A.; Le Cao, K.A. mixOmics: An R package for ‘omics feature selection and multiple data integration. PLoS Comput. Biol. 2017, 13, e1005752. [Google Scholar] [CrossRef] [Green Version]
- Cui, Y.H. Multivariate data integration using R: Methods and applications with the mixOmics package. Biometrics 2022, 78, 1272–1273. [Google Scholar] [CrossRef]
- de Man, Y.A.; Bakker-Jonges, L.E.; Dufour-van den Goorbergh, C.M.; Tillemans, S.P.R.; Hooijkaas, H.; Hazes, J.M.W.; Dolhain, R.J.E.M. Women with rheumatoid arthritis negative for anti-cyclic citrullinated peptide and rheumatoid factor are more likely to improve during pregnancy, whereas in autoantibody-positive women autoantibody levels are not influenced by pregnancy. Ann. Rheum. Dis. 2010, 69, 420–423. [Google Scholar] [CrossRef]
- Zhang, J.; Chen, L. Clustering-based undersampling with random over sampling examples and support vector machine for imbalanced classification of breast cancer diagnosis. Comput. Assist. Surg. 2019, 24, 62–72. [Google Scholar] [CrossRef] [Green Version]
- Curis, E.; Nicolis, I.; Moinard, C.; Osowska, S.; Zerrouk, N.; Benazeth, S.; Cynober, L. Almost all about citrulline in mammals. Amino Acids 2005, 29, 177–205. [Google Scholar] [CrossRef] [PubMed]
- Li, K.T.; Wang, M.; Zhao, L.D.; Liu, Y.D.; Zhang, X. ACPA-negative rheumatoid arthritis: From immune mechanisms to clinical translation. Ebiomedicine 2022, 83, 104233. [Google Scholar] [CrossRef]
- Daha, N.A.; Toes, R.E. Are ACPA-positive and ACPA-negative RA the same disease? Nat. Rev. Rheumatol. 2011, 7, 202–203. [Google Scholar] [CrossRef]
- Dotz, V.; Wuhrer, M. N-glycome signatures in human plasma: Associations with physiology and major diseases. FEBS Lett. 2019, 593, 2966–2976. [Google Scholar] [CrossRef] [Green Version]
- Pinho, S.S.; Reis, C.A. Glycosylation in cancer: Mechanisms and clinical implications. Nat. Rev. Cancer 2015, 15, 540–555. [Google Scholar] [CrossRef]
- Reiding, K.R.; Bondt, A.; Hennig, R.; Gardner, R.A.; O’Flaherty, R.; Trbojevic-Akmacic, I.; Shubhakar, A.; Hazes, J.M.W.; Reichl, U.; Fernandes, D.L.; et al. High-throughput Serum N-Glycomics: Method Comparison and Application to Study Rheumatoid Arthritis and Pregnancy-associated Changes. Mol. Cell. Proteom. 2019, 18, 3–15. [Google Scholar] [CrossRef] [Green Version]


Disclaimer/Publisher’s Note: The statements, opinions and data contained in all publications are solely those of the individual author(s) and contributor(s) and not of MDPI and/or the editor(s). MDPI and/or the editor(s) disclaim responsibility for any injury to people or property resulting from any ideas, methods, instructions or products referred to in the content. |
© 2023 by the authors. Licensee MDPI, Basel, Switzerland. This article is an open access article distributed under the terms and conditions of the Creative Commons Attribution (CC BY) license (https://creativecommons.org/licenses/by/4.0/).
Share and Cite
Mayboroda, O.A.; Lageveen-Kammeijer, G.S.M.; Wuhrer, M.; Dolhain, R.J.E.M. An Integrated Glycosylation Signature of Rheumatoid Arthritis. Biomolecules 2023, 13, 1106. https://doi.org/10.3390/biom13071106
Mayboroda OA, Lageveen-Kammeijer GSM, Wuhrer M, Dolhain RJEM. An Integrated Glycosylation Signature of Rheumatoid Arthritis. Biomolecules. 2023; 13(7):1106. https://doi.org/10.3390/biom13071106
Chicago/Turabian StyleMayboroda, Oleg A., Guinevere S. M. Lageveen-Kammeijer, Manfred Wuhrer, and Radboud J. E. M. Dolhain. 2023. "An Integrated Glycosylation Signature of Rheumatoid Arthritis" Biomolecules 13, no. 7: 1106. https://doi.org/10.3390/biom13071106